Statistical studies of energy in Iran vs world
16
IJESR Volume 3, Issue 2 ISSN: 2347-6532 __________________________________________________________ A Monthly Double-Blind Peer Reviewed Refereed Open Access International e-Journal - Included in the International Serial Directories Indexed & Listed at: Ulrich's Periodicals Directory ©, U.S.A., Open J-Gage as well as in Cabell’s Directories of Publishing Opportunities, U.S.A. International Journal of Engineering & Scientific Research http://www.ijmra.us 55 February 2015 Statistical studies of energy in Iran vs world Seyed Samsamoddin Naghavi Chaleshtori * Reza Hashemi ** ABSTRACT: Iran is increasing domestic demand for electricity has created supply shortfalls during times of peak energy demand. Iran recently increased electricity prices, which is a component of its energy subsidy reform, in hopes to limit demand growth.Iran holds the world's fourth-largest proved crude oil reserves and the world's first-largest natural gas reserves. Despite the country's abundant reserves, Iran's oil production has substantially declined over the past few years, and natural gas production growth has slowed. International sanctions have profoundly affected Iran's energy sector. Sanctions have prompted a number of cancellations or delays of upstream projects, resulting in declining oil production capacity.The aim of the present study is to identify capacity of various source of energy in Iran compared with world and potential of Iran to become top 10 energy producing countries in the world. Keywords:Energy scenario; Primary energy consumption; Non-conventional energy; Million Tonnes oil equivalent (MTOE); * M.Tech of Energy Studies, School of Energy Studies, University of Pune ** Ph.D. Petroleum, Department of Petroleum Engineering, MIT, Pune
Transcript of Statistical studies of energy in Iran vs world
IJESR Volume 3, Issue 2 ISSN: 2347-6532 __________________________________________________________
A Monthly Double-Blind Peer Reviewed Refereed Open Access International e-Journal - Included in the International Serial Directories Indexed & Listed at: Ulrich's Periodicals Directory ©, U.S.A., Open J-Gage as well as in Cabell’s Directories of Publishing Opportunities, U.S.A.
International Journal of Engineering & Scientific Research
http://www.ijmra.us
55
February 2015
Statistical studies of energy in Iran vs
world
Seyed Samsamoddin Naghavi Chaleshtori*
Reza Hashemi**
ABSTRACT:
Iran is increasing domestic demand for electricity has created supply shortfalls during times of
peak energy demand. Iran recently increased electricity prices, which is a component of its
energy subsidy reform, in hopes to limit demand growth.Iran holds the world's fourth-largest
proved crude oil reserves and the world's first-largest natural gas reserves. Despite the country's
abundant reserves, Iran's oil production has substantially declined over the past few years, and
natural gas production growth has slowed. International sanctions have profoundly affected
Iran's energy sector. Sanctions have prompted a number of cancellations or delays of upstream
projects, resulting in declining oil production capacity.The aim of the present study is to identify
capacity of various source of energy in Iran compared with world and potential of Iran to become
top 10 energy producing countries in the world.
Keywords:Energy scenario; Primary energy consumption; Non-conventional energy; Million
Tonnes oil equivalent (MTOE);
* M.Tech of Energy Studies, School of Energy Studies, University of Pune
** Ph.D. Petroleum, Department of Petroleum Engineering, MIT, Pune
IJESR Volume 3, Issue 2 ISSN: 2347-6532 __________________________________________________________
A Monthly Double-Blind Peer Reviewed Refereed Open Access International e-Journal - Included in the International Serial Directories Indexed & Listed at: Ulrich's Periodicals Directory ©, U.S.A., Open J-Gage as well as in Cabell’s Directories of Publishing Opportunities, U.S.A.
International Journal of Engineering & Scientific Research
http://www.ijmra.us
56
February 2015
Introduction:
Any physical activity in the world whether by human beings or by nature is caused due to flow
of energy in one form to other. Energy is required to do any kind of work the work output
depends on the energy input. The capability to do work depends on the amount of energy one can
control and utilize. We cannot see energy, only its effects, we cannot make it, only use it; and we
cannot destroy it, only waste it through inefficient use. The energy is most basic infrastructure
input required for economic growth and development of a country. A systematic study of various
forms of energy and energy transformation, including human experience and observations is
called ‘Energy Science’. The applied part of energy science useful to human society, nation and
individual is called ‘Energy Technology’.
1.1:Energy:Its definition
To discuss energy in a useful way, it is necessary to arrive at a definition of energy and ascribe to
it physical units, so that the concept of energy can be discussed quantitatively and quantitative
calculations can be performed. In physics, energy is defined as „capacity for doing work’. The
word work is used with many different associations, but in physics, it has a very definite
meaning: Work = Force x Displacement along the direction of force. To perform this work,
energy must be available. In case of a person pushing a thing, the energy may be in the form of
food calories. In another case, in which the force is exerted by an electrical device, the electrical
energy used may be from electrical energy generating sources.
1.2:Various form of energy
In a sense, energy is simply the capacity for doing work. Energy may be transformed from one
type to another and hence, much of the discussion of energy is related to the transformation of
energy from one form to another so that it can do useful work. There is an important principle
stating that the total amount of energy in a closed system remains constant. Energy may change
from one form to another, but the total amount in any closed system remains constant. This
principle, known as „Conservation of Energy’ is extremely important for understanding a variety
of phenomena. Energy can still be changed from some useful form to some other form that for all
practical purposes is useless, even though, formally energy is conserved in the process. The

IJESR Volume 3, Issue 2 ISSN: 2347-6532 __________________________________________________________
A Monthly Double-Blind Peer Reviewed Refereed Open Access International e-Journal - Included in the International Serial Directories Indexed & Listed at: Ulrich's Periodicals Directory ©, U.S.A., Open J-Gage as well as in Cabell’s Directories of Publishing Opportunities, U.S.A.
International Journal of Engineering & Scientific Research
http://www.ijmra.us
57
February 2015
various forms of energy and transformations of energy from one form to another are listed
below.
a) Kinetic energy: Energy of motion is called kinetic energy. If an object has a mass, m and
velocity v. then its kinetic energy is, KE = 1/2 mv2.
b) Potential energy: The energy that an object possesses as a result of its elevation in a
gravitational field is called potential energy and is expressed as, PE= mgh, where m is mass,
g is the gravitational acceleration, h is the height.
c) Chemical energy: Chemical energy arises out from the atoms in the form of heat as they
combine or separate. When certain chemicals combine, energy is released usually in the form
of heat. It is the chemical energy in coal, natural gas, oil, wood etc. use to generate
electricity. Also it is the chemical energy in the food we eat that provides the energy we need
for daily life.
d) Electrical energy:Electrical energy arises out due to moving electrons in the form of heat,
electro-magnetic radiation and magnetic field. If wires are connected to the battery and are
connected to a light bulb or resistor, the energy contained in the battery is transferred through
the wires and dissipated as heat in the resistor. There are number of sources of electrical
energy besides batteries.
e) Heat energy: Heat energy is the kinetic energy of molecules. In daily life, we frequently
refer to the heat content of bodies. It is also called the thermal energy.
f) Radiant energy: Radiant energy is the energy in transit through space. It is emitted by
electrons as they change orbit and by atomic nuclei during fission and fusion. Such energy
appears ultimately as heat. Only radiant heat can exist alone; all other forms require the
presence of matter.
g) Nuclear (Mass) energy:Nuclear energy arises out of the elimination of all or part of the
mass of atomic particles. As a consequence of special theory of relativity, it can be shown
that when the mass of some system is reduced by an amount Δm, as in nuclear reaction, then
the amount of energy released is, En = Δmc2.
1.3: Classification of various sources:
Energy sources can be classified in the following ways.
1) Based on usability of energy:
IJESR Volume 3, Issue 2 ISSN: 2347-6532 __________________________________________________________
A Monthly Double-Blind Peer Reviewed Refereed Open Access International e-Journal - Included in the International Serial Directories Indexed & Listed at: Ulrich's Periodicals Directory ©, U.S.A., Open J-Gage as well as in Cabell’s Directories of Publishing Opportunities, U.S.A.
International Journal of Engineering & Scientific Research
http://www.ijmra.us
58
February 2015
a) Primary sources: Energy sources available in nature in raw form are called primary
energy resources (fossil fuels, uranium, and hydrogen). This form of energy cannot be
used as such. These are converted to a form as required by the consumer.
b) Intermediate sources: Energy sources which are obtained from primary energy
sources by one or more steps of transformation are intermediate resources.
c) Secondary sources: The form of energy, which is finally supplied to the consumer for
utilization, is known as secondary or usable energy (electric energy, thermal energy,
chemical energy).
2) Based on long-term availability:
a) Non-renewable sources: Energy sources which are finite and do not get refill after
their consumption, are called non-renewable (fossil fuels, uranium).
b) Renewable sources: Energy sources which are renewed by nature again and again
and their supply is not affected by the rate of their consumption are called renewable
(solar, wind, biomass, ocean, geothermal, hydro).
Outlet is called non-commercial resource, e.g. wood, animal dung cake, crop residue, etc.
3) Based on origin:The different types of energy based on their origin are as follows:
a) Fossil fuels energy b) Nuclear energy
c)Hydro energy d)Solar energy
e) Wind energy f)Biomass energy
g) Geothermal energy h) Tidal energy
i) Ocean thermal energy j) Ocean wave energy and many more……
1.4: Energy scenario ofworld (at end of 2013)
1.4.1 (A): Primary energy sources
1) Coal: The proven global coal reserve was estimated to be 891,531 million tonnes (MT) by
end of 2013. The USA had the largest share of the global reserve (237,295 MT, 26.6 %)
followed by Russian Federation (157,010 MT, 17.6 %) and China (114,500 MT, 12.8 %). Middle
East is negligible with 0.1 %, 1122 MT of coal reservoir. (Iran less than 0.05 %)
With the current reserve-to-production ratio coal reserves will last for 113 years.
2) Oil: Total global proven oil reserve was estimated to be 1687.9 thousand billion barrels
(TMB) (One Barrel = 158.98 Lit.). Venezuela has largest share (17.7 %, 298.3 TMB) of oil
IJESR Volume 3, Issue 2 ISSN: 2347-6532 __________________________________________________________
A Monthly Double-Blind Peer Reviewed Refereed Open Access International e-Journal - Included in the International Serial Directories Indexed & Listed at: Ulrich's Periodicals Directory ©, U.S.A., Open J-Gage as well as in Cabell’s Directories of Publishing Opportunities, U.S.A.
International Journal of Engineering & Scientific Research
http://www.ijmra.us
59
February 2015
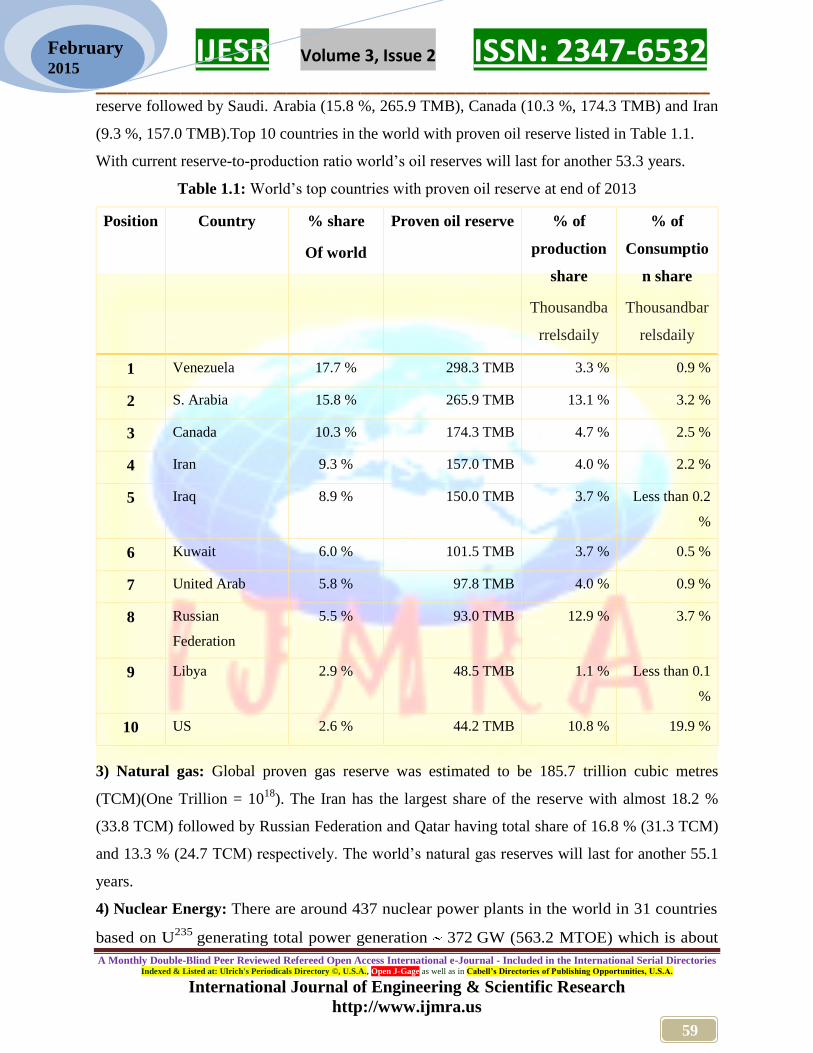
reserve followed by Saudi. Arabia (15.8 %, 265.9 TMB), Canada (10.3 %, 174.3 TMB) and Iran
(9.3 %, 157.0 TMB).Top 10 countries in the world with proven oil reserve listed in Table 1.1.
With current reserve-to-production ratio world‟s oil reserves will last for another 53.3 years.
Table 1.1: World‟s top countries with proven oil reserve at end of 2013
Position Country % share
Of world
Proven oil reserve % of
production
share
Thousandba
rrelsdaily
% of
Consumptio
n share
Thousandbar
relsdaily
1 Venezuela 17.7 % 298.3 TMB 3.3 % 0.9 %
2 S. Arabia 15.8 % 265.9 TMB 13.1 % 3.2 %
3 Canada 10.3 % 174.3 TMB 4.7 % 2.5 %
4 Iran 9.3 % 157.0 TMB 4.0 % 2.2 %
5 Iraq 8.9 % 150.0 TMB 3.7 % Less than 0.2
%
6 Kuwait 6.0 % 101.5 TMB 3.7 % 0.5 %
7 United Arab 5.8 % 97.8 TMB 4.0 % 0.9 %
8 Russian
Federation
5.5 % 93.0 TMB 12.9 % 3.7 %
9 Libya 2.9 % 48.5 TMB 1.1 % Less than 0.1
%
10 US 2.6 % 44.2 TMB 10.8 % 19.9 %
3) Natural gas: Global proven gas reserve was estimated to be 185.7 trillion cubic metres
(TCM)(One Trillion = 1018
). The Iran has the largest share of the reserve with almost 18.2 %
(33.8 TCM) followed by Russian Federation and Qatar having total share of 16.8 % (31.3 TCM)
and 13.3 % (24.7 TCM) respectively. The world‟s natural gas reserves will last for another 55.1
years.
4) Nuclear Energy: There are around 437 nuclear power plants in the world in 31 countries
based on U235
generating total power generation 372 GW (563.2 MTOE) which is about
IJESR Volume 3, Issue 2 ISSN: 2347-6532 __________________________________________________________
A Monthly Double-Blind Peer Reviewed Refereed Open Access International e-Journal - Included in the International Serial Directories Indexed & Listed at: Ulrich's Periodicals Directory ©, U.S.A., Open J-Gage as well as in Cabell’s Directories of Publishing Opportunities, U.S.A.
International Journal of Engineering & Scientific Research
http://www.ijmra.us
60
February 2015
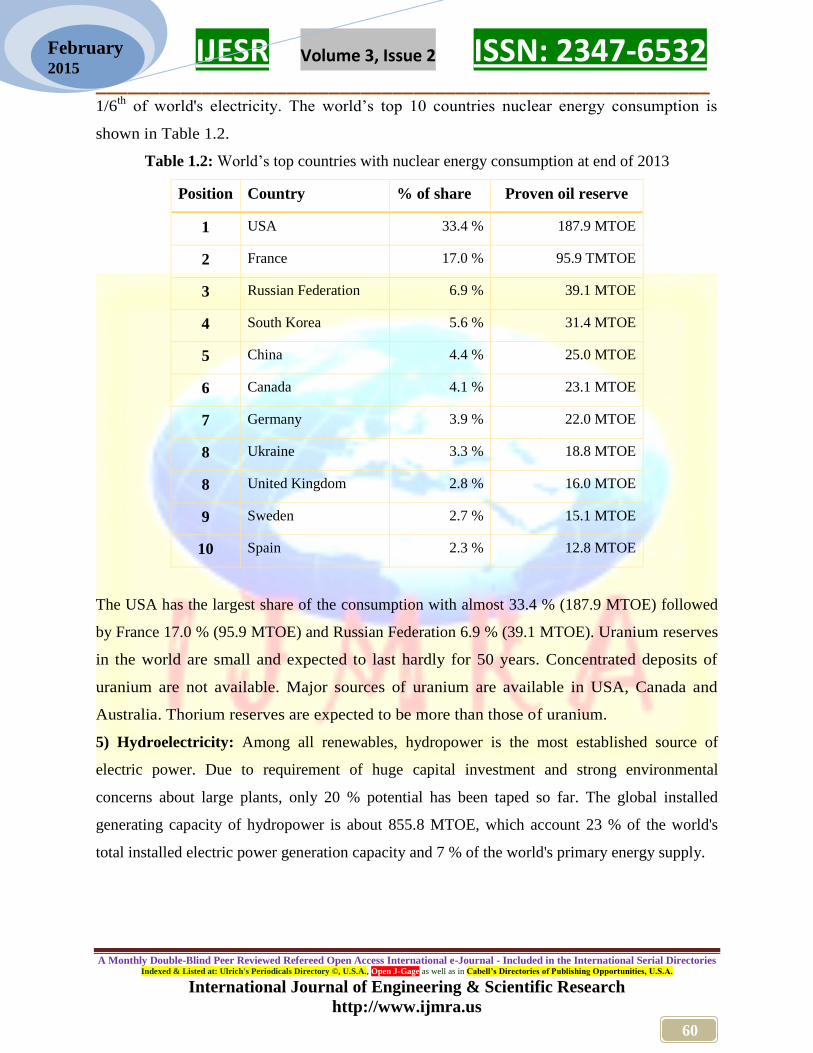
1/6th
of world's electricity. The world‟s top 10 countries nuclear energy consumption is
shown in Table 1.2.
Table 1.2: World‟s top countries with nuclear energy consumption at end of 2013
Position Country % of share Proven oil reserve
1 USA 33.4 % 187.9 MTOE
2 France 17.0 % 95.9 TMTOE
3 Russian Federation 6.9 % 39.1 MTOE
4 South Korea 5.6 % 31.4 MTOE
5 China 4.4 % 25.0 MTOE
6 Canada 4.1 % 23.1 MTOE
7 Germany 3.9 % 22.0 MTOE
8 Ukraine 3.3 % 18.8 MTOE
8 United Kingdom 2.8 % 16.0 MTOE
9 Sweden 2.7 % 15.1 MTOE
10 Spain 2.3 % 12.8 MTOE
The USA has the largest share of the consumption with almost 33.4 % (187.9 MTOE) followed
by France 17.0 % (95.9 MTOE) and Russian Federation 6.9 % (39.1 MTOE). Uranium reserves
in the world are small and expected to last hardly for 50 years. Concentrated deposits of
uranium are not available. Major sources of uranium are available in USA, Canada and
Australia. Thorium reserves are expected to be more than those of uranium.
5) Hydroelectricity: Among all renewables, hydropower is the most established source of
electric power. Due to requirement of huge capital investment and strong environmental
concerns about large plants, only 20 % potential has been taped so far. The global installed
generating capacity of hydropower is about 855.8 MTOE, which account 23 % of the world's
total installed electric power generation capacity and 7 % of the world's primary energy supply.

IJESR Volume 3, Issue 2 ISSN: 2347-6532 __________________________________________________________
A Monthly Double-Blind Peer Reviewed Refereed Open Access International e-Journal - Included in the International Serial Directories Indexed & Listed at: Ulrich's Periodicals Directory ©, U.S.A., Open J-Gage as well as in Cabell’s Directories of Publishing Opportunities, U.S.A.
International Journal of Engineering & Scientific Research
http://www.ijmra.us
61
February 2015
Table 1.3: World‟s top countries with hydro-electric energy consumption
Position Country % of share Proven oil reserve
1 China 24.1 % 206.3 MTOE
2 Canada 10.4 % 88.6 MTOE
3 Brazil 10.2 % 87.2 MTOE
4 USA 7.2 % 61.5 MTOE
5 Russian Federation 4.8 % 41.0 MTOE
6 India 3.5 % 29.8 MTOE
7 Norway 3.4 % 29.2 MTOE
8 Venezuela 2.2 % 19.0 MTOE
9 Japan 2.2 % 18.6 MTOE
10 France 1.8 % 15.5 MTOE
Biggest hydroelectric power station is located in China, at in Hubei. Its capacity is 22,500 MW.
The dam is 1045 km^2.The world‟s top 10 countries hydro-electric energy consumption is
shown in Table 1.3.As seen in the figure, the China is the biggest hydro-electric consumer in
the world with 206.3 MTOE which is 24.1 % of globe‟s hydro-electric consumption. This is
followed by Canada with 88.6 MTOE (10.4 %) and Brazil with 87.2MTOE (10.2 %)
respectively.
It is interesting to note that the about 87 % of world's energy supply comes mainly from
fossil fuels i. e. from oil, natural gas and coal whereas the remaining 13 % of the world's
energy supply comes mainly from nuclear and hydro-electric energy.

IJESR Volume 3, Issue 2 ISSN: 2347-6532 __________________________________________________________
A Monthly Double-Blind Peer Reviewed Refereed Open Access International e-Journal - Included in the International Serial Directories Indexed & Listed at: Ulrich's Periodicals Directory ©, U.S.A., Open J-Gage as well as in Cabell’s Directories of Publishing Opportunities, U.S.A.
International Journal of Engineering & Scientific Research
http://www.ijmra.us
62
February 2015
1.4.1(B): Global Primary Energy Consumption
The global primary energy consumption at the end of 2013 was equivalent to 12730.4MTOE.
The primary energy consumption for few countries is shown in Table 1.4.
Table 1.4: Primary Energy Consumption by Fuel, 2013
Country Oil Gas Coal Nuclear Hydro Renewables Total
(MTOE)
China 507.4 145.5 1925.3 25.0 206.3 42.5 2265.8
USA 831.0 671.0 455.7 187.9 61.5 58.6 2265.8
Russian Federation 153.1 372.1 93.5 39.1 41.0 0.1 699.0
India 175.2 46.3 324.3 7.5 29.8 11.7 595.0
Japan 208.9 105.2 128.6 3.3 18.6 9.4 474.0
Canada 103.5 93.1 20.3 23.1 88.6 4.3 332.9
Germany 112.1 75.3 81.3 22.0 4.6 29.7 325.0
Brazil 132.7 33.9 13.7 3.3 87.2 13.2 284.0
South Korea 108.4 47.3 81.9 31.4 1.3 1.0 271.3
France 80.3 38.6 12.2 95.9 15.5 5.9 248.4
Iran 92.9 146.0 0.7 0.9 3.4 0.1 243.9
TOTAL WORLD 4185.1 3020.4 3826.7 563.2 855.8 279.3 12730.4
The China is largest primary energy consumer in the world followed by USA and Russian
federation. Iran is 11th
largest primary energy consumer in the world.
1.4.1(C): Energy distribution between developed and developing countries
33%
24%
30%
4%
7%
1% 0% 0.75%0%
Global energy consumption 2013
Oil
Gas
Coal
Nuclear
Hydro
Wind
Solar
Geothermal

IJESR Volume 3, Issue 2 ISSN: 2347-6532 __________________________________________________________
A Monthly Double-Blind Peer Reviewed Refereed Open Access International e-Journal - Included in the International Serial Directories Indexed & Listed at: Ulrich's Periodicals Directory ©, U.S.A., Open J-Gage as well as in Cabell’s Directories of Publishing Opportunities, U.S.A.
International Journal of Engineering & Scientific Research
http://www.ijmra.us
63
February 2015
Although 80 % of the world‟s population resides in the developing countries, their energy
consumption amounts to only 40 % of the world total energy consumption (See figure 1.2).
Figure 1.2: Energy distribution between developed and developing countries
The high standards of living in the developed countries are attributable to high-energy
consumption levels. Also, the rapid population growth in the developing countries has kept the
per capita energy consumption low compared with highly industrialized developed countries.
The world average energy consumption per person is equivalent to 2.2 Tonnes of coal. In
industrialized countries, a person uses 4-5 times more than the world average and 9 times more
than the average for the developing countries. An American uses 2.2 times more energy than an
Iranian.
1.4.2: Non-conventional energy sources
Non-conventional technologies are under growth stage and their share is very small.
1) Solar energy: Solar photovoltaic (PV) is a method of generating electrical power by
converting solar radiation into electricity On an average earth receives solar power of
22,25,04,000 TW, which is about 13,000 times the current world's energy consumption. World‟s
total installed PV power is 136GW(as of the 2013).The International Energy Agency (IEA)
estimates the total global solar power capacity will grow from 98 GW in 2012 to 308 GW in
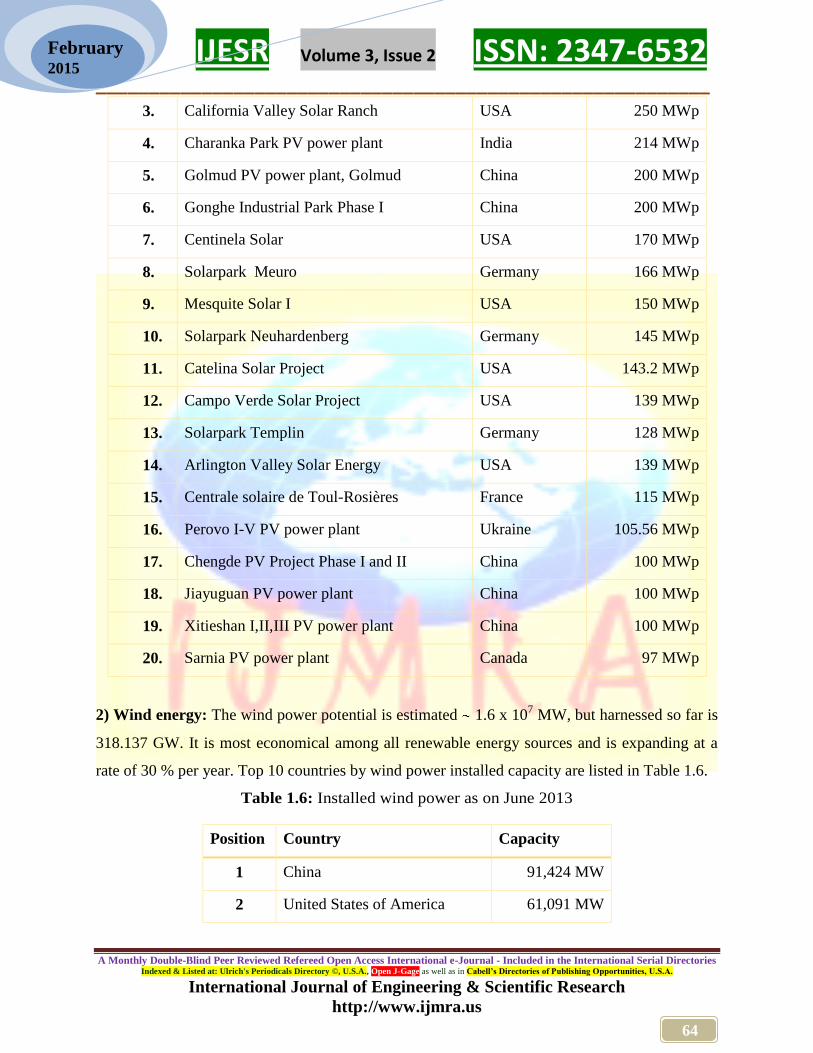
2018.Large-scale photovoltaic power plants in the world are listed in Table 1.5.
Table 1.5: Large-scale photovoltaic power plants in the world
Position PV Power Station Country Capacity
1. Longyangxia Hydro-solar PV Station China 320 MWp
2. Agua Caliente Solar Project USA 250 MWp
World Population
World Energy Consumption
IJESR Volume 3, Issue 2 ISSN: 2347-6532 __________________________________________________________
A Monthly Double-Blind Peer Reviewed Refereed Open Access International e-Journal - Included in the International Serial Directories Indexed & Listed at: Ulrich's Periodicals Directory ©, U.S.A., Open J-Gage as well as in Cabell’s Directories of Publishing Opportunities, U.S.A.
International Journal of Engineering & Scientific Research
http://www.ijmra.us
64
February 2015
3. California Valley Solar Ranch USA 250 MWp
4. Charanka Park PV power plant India 214 MWp
5. Golmud PV power plant, Golmud China 200 MWp
6. Gonghe Industrial Park Phase I China 200 MWp
7. Centinela Solar USA 170 MWp
8. Solarpark Meuro Germany 166 MWp
9. Mesquite Solar I USA 150 MWp
10. Solarpark Neuhardenberg Germany 145 MWp
11. Catelina Solar Project USA 143.2 MWp
12. Campo Verde Solar Project USA 139 MWp
13. Solarpark Templin Germany 128 MWp
14. Arlington Valley Solar Energy USA 139 MWp
15. Centrale solaire de Toul-Rosières France 115 MWp
16. Perovo I-V PV power plant Ukraine 105.56 MWp
17. Chengde PV Project Phase I and II China 100 MWp
18. Jiayuguan PV power plant China 100 MWp
19. Xitieshan I,II,III PV power plant China 100 MWp
20. Sarnia PV power plant Canada 97 MWp
2) Wind energy: The wind power potential is estimated 1.6 x 10⁷ MW, but harnessed so far is
318.137 GW. It is most economical among all renewable energy sources and is expanding at a
rate of 30 % per year. Top 10 countries by wind power installed capacity are listed in Table 1.6.
Table 1.6: Installed wind power as on June 2013
Position Country Capacity
1 China 91,424 MW
2 United States of America 61,091 MW
IJESR Volume 3, Issue 2 ISSN: 2347-6532 __________________________________________________________
A Monthly Double-Blind Peer Reviewed Refereed Open Access International e-Journal - Included in the International Serial Directories Indexed & Listed at: Ulrich's Periodicals Directory ©, U.S.A., Open J-Gage as well as in Cabell’s Directories of Publishing Opportunities, U.S.A.
International Journal of Engineering & Scientific Research
http://www.ijmra.us
65
February 2015
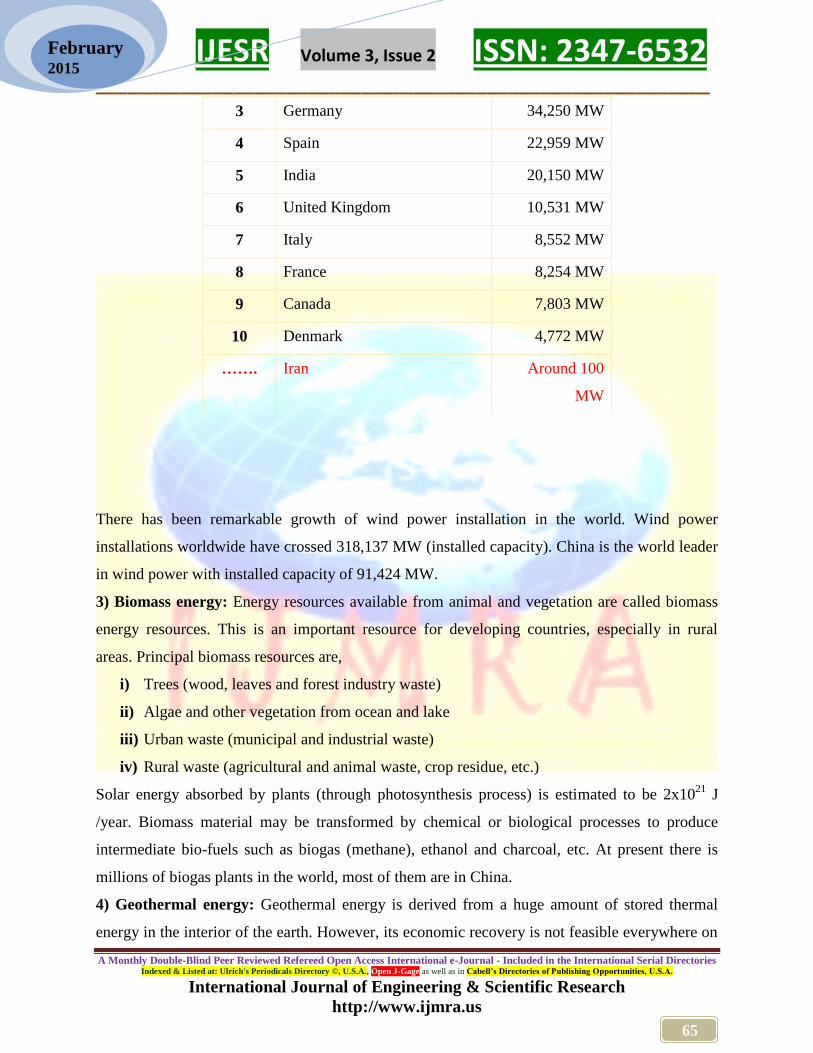
There has been remarkable growth of wind power installation in the world. Wind power
installations worldwide have crossed 318,137 MW (installed capacity). China is the world leader
in wind power with installed capacity of 91,424 MW.
3) Biomass energy: Energy resources available from animal and vegetation are called biomass
energy resources. This is an important resource for developing countries, especially in rural
areas. Principal biomass resources are,
i) Trees (wood, leaves and forest industry waste)
ii) Algae and other vegetation from ocean and lake
iii) Urban waste (municipal and industrial waste)
iv) Rural waste (agricultural and animal waste, crop residue, etc.)
Solar energy absorbed by plants (through photosynthesis process) is estimated to be 2x10²¹
J
/year. Biomass material may be transformed by chemical or biological processes to produce
intermediate bio-fuels such as biogas (methane), ethanol and charcoal, etc. At present there is
millions of biogas plants in the world, most of them are in China.
4) Geothermal energy: Geothermal energy is derived from a huge amount of stored thermal
energy in the interior of the earth. However, its economic recovery is not feasible everywhere on
3 Germany 34,250 MW
4 Spain 22,959 MW
5 India 20,150 MW
6 United Kingdom 10,531 MW
7 Italy 8,552 MW
8 France 8,254 MW
9 Canada 7,803 MW
10 Denmark 4,772 MW
……. Iran Around 100
MW
IJESR Volume 3, Issue 2 ISSN: 2347-6532 __________________________________________________________
A Monthly Double-Blind Peer Reviewed Refereed Open Access International e-Journal - Included in the International Serial Directories Indexed & Listed at: Ulrich's Periodicals Directory ©, U.S.A., Open J-Gage as well as in Cabell’s Directories of Publishing Opportunities, U.S.A.
International Journal of Engineering & Scientific Research
http://www.ijmra.us
66
February 2015
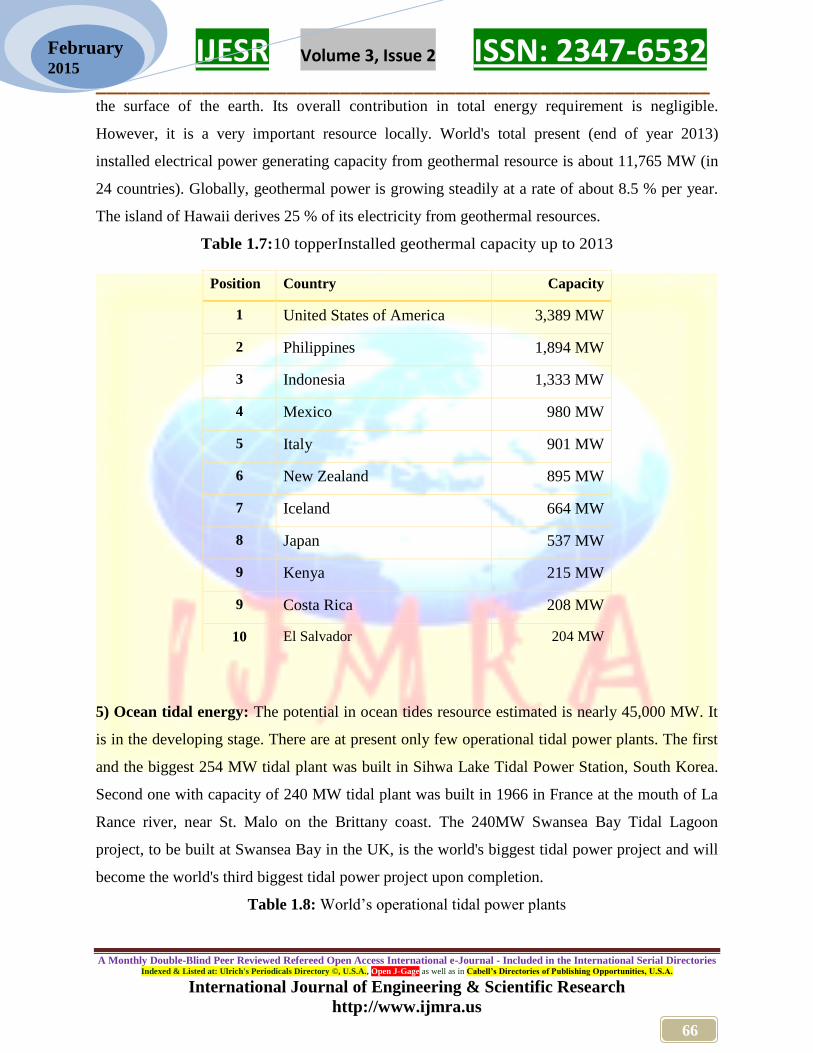
the surface of the earth. Its overall contribution in total energy requirement is negligible.
However, it is a very important resource locally. World's total present (end of year 2013)
installed electrical power generating capacity from geothermal resource is about 11,765 MW (in
24 countries). Globally, geothermal power is growing steadily at a rate of about 8.5 % per year.
The island of Hawaii derives 25 % of its electricity from geothermal resources.
Table 1.7:10 topperInstalled geothermal capacity up to 2013
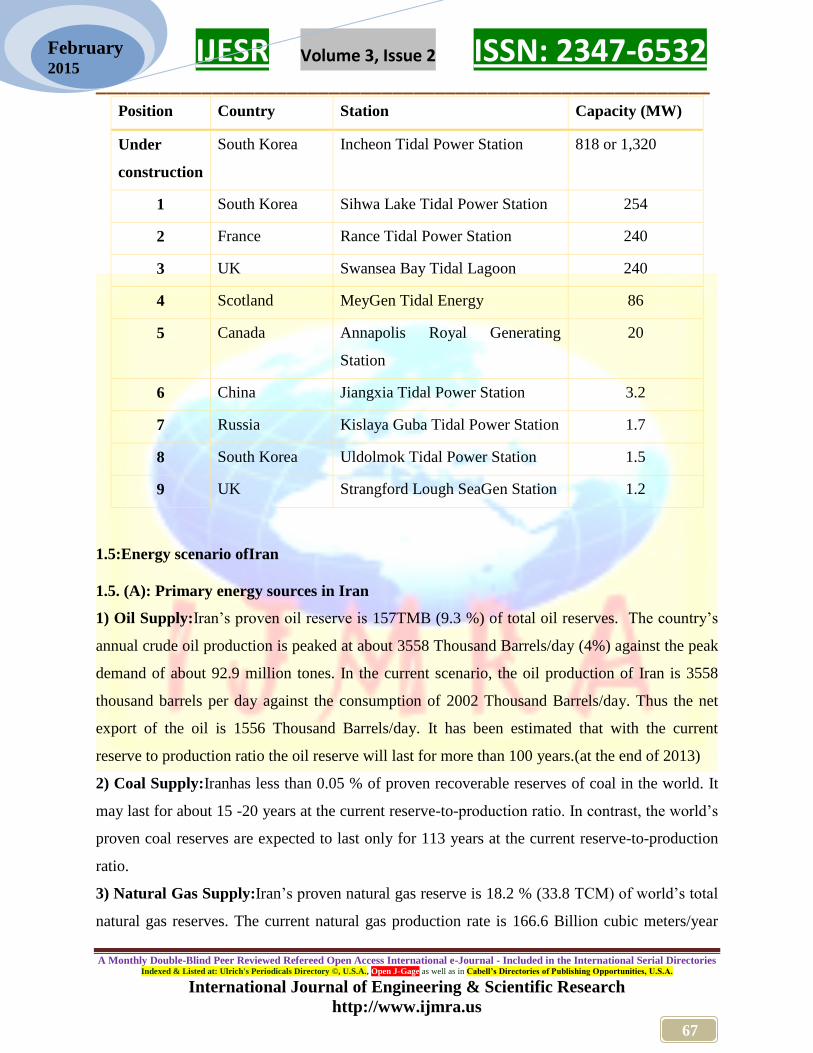
5) Ocean tidal energy: The potential in ocean tides resource estimated is nearly 45,000 MW. It
is in the developing stage. There are at present only few operational tidal power plants. The first
and the biggest 254 MW tidal plant was built in Sihwa Lake Tidal Power Station, South Korea.
Second one with capacity of 240 MW tidal plant was built in 1966 in France at the mouth of La
Rance river, near St. Malo on the Brittany coast. The 240MW Swansea Bay Tidal Lagoon
project, to be built at Swansea Bay in the UK, is the world's biggest tidal power project and will
become the world's third biggest tidal power project upon completion.
Table 1.8: World‟s operational tidal power plants
Position Country Capacity
1 United States of America 3,389 MW
2 Philippines 1,894 MW
3 Indonesia 1,333 MW
4 Mexico 980 MW
5 Italy 901 MW
6 New Zealand 895 MW
7 Iceland 664 MW
8 Japan 537 MW
9 Kenya 215 MW
9 Costa Rica 208 MW
10 El Salvador 204 MW
IJESR Volume 3, Issue 2 ISSN: 2347-6532 __________________________________________________________
A Monthly Double-Blind Peer Reviewed Refereed Open Access International e-Journal - Included in the International Serial Directories Indexed & Listed at: Ulrich's Periodicals Directory ©, U.S.A., Open J-Gage as well as in Cabell’s Directories of Publishing Opportunities, U.S.A.
International Journal of Engineering & Scientific Research
http://www.ijmra.us
67
February 2015
Position Country Station Capacity (MW)
Under
construction
South Korea Incheon Tidal Power Station 818 or 1,320
1 South Korea Sihwa Lake Tidal Power Station 254
2 France Rance Tidal Power Station 240
3 UK Swansea Bay Tidal Lagoon 240
4 Scotland MeyGen Tidal Energy 86
5 Canada Annapolis Royal Generating
Station
20
6 China Jiangxia Tidal Power Station 3.2
7 Russia Kislaya Guba Tidal Power Station 1.7
8 South Korea Uldolmok Tidal Power Station 1.5
9 UK Strangford Lough SeaGen Station 1.2
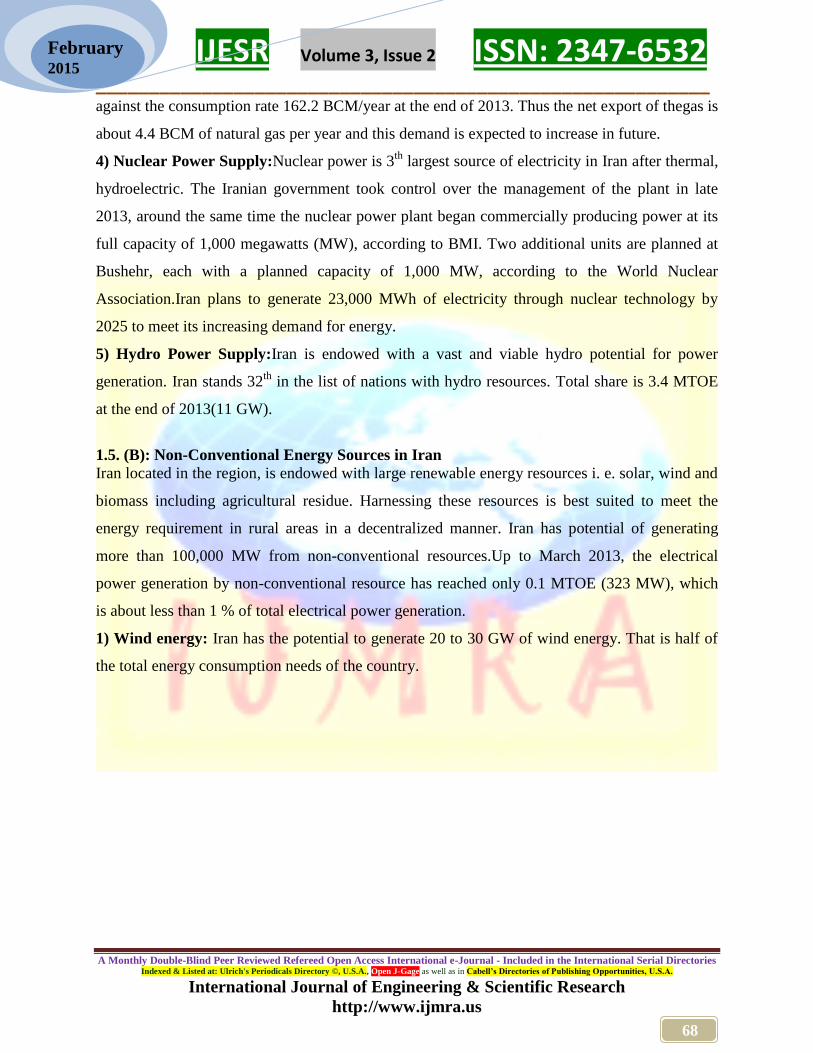
1.5:Energy scenario ofIran
1.5. (A): Primary energy sources in Iran
1) Oil Supply:Iran‟s proven oil reserve is 157TMB (9.3 %) of total oil reserves. The country‟s
annual crude oil production is peaked at about 3558 Thousand Barrels/day (4%) against the peak
demand of about 92.9 million tones. In the current scenario, the oil production of Iran is 3558
thousand barrels per day against the consumption of 2002 Thousand Barrels/day. Thus the net
export of the oil is 1556 Thousand Barrels/day. It has been estimated that with the current
reserve to production ratio the oil reserve will last for more than 100 years.(at the end of 2013)
2) Coal Supply:Iranhas less than 0.05 % of proven recoverable reserves of coal in the world. It
may last for about 15 -20 years at the current reserve-to-production ratio. In contrast, the world‟s
proven coal reserves are expected to last only for 113 years at the current reserve-to-production
ratio.
3) Natural Gas Supply:Iran‟s proven natural gas reserve is 18.2 % (33.8 TCM) of world‟s total
natural gas reserves. The current natural gas production rate is 166.6 Billion cubic meters/year
IJESR Volume 3, Issue 2 ISSN: 2347-6532 __________________________________________________________
A Monthly Double-Blind Peer Reviewed Refereed Open Access International e-Journal - Included in the International Serial Directories Indexed & Listed at: Ulrich's Periodicals Directory ©, U.S.A., Open J-Gage as well as in Cabell’s Directories of Publishing Opportunities, U.S.A.
International Journal of Engineering & Scientific Research
http://www.ijmra.us
68
February 2015
against the consumption rate 162.2 BCM/year at the end of 2013. Thus the net export of thegas is
about 4.4 BCM of natural gas per year and this demand is expected to increase in future.
4) Nuclear Power Supply:Nuclear power is 3th
largest source of electricity in Iran after thermal,
hydroelectric. The Iranian government took control over the management of the plant in late
2013, around the same time the nuclear power plant began commercially producing power at its
full capacity of 1,000 megawatts (MW), according to BMI. Two additional units are planned at
Bushehr, each with a planned capacity of 1,000 MW, according to the World Nuclear
Association.Iran plans to generate 23,000 MWh of electricity through nuclear technology by
2025 to meet its increasing demand for energy.
5) Hydro Power Supply:Iran is endowed with a vast and viable hydro potential for power
generation. Iran stands 32th
in the list of nations with hydro resources. Total share is 3.4 MTOE
at the end of 2013(11 GW).
1.5. (B): Non-Conventional Energy Sources in Iran
Iran located in the region, is endowed with large renewable energy resources i. e. solar, wind and
biomass including agricultural residue. Harnessing these resources is best suited to meet the
energy requirement in rural areas in a decentralized manner. Iran has potential of generating
more than 100,000 MW from non-conventional resources.Up to March 2013, the electrical
power generation by non-conventional resource has reached only 0.1 MTOE (323 MW), which
is about less than 1 % of total electrical power generation.
1) Wind energy: Iran has the potential to generate 20 to 30 GW of wind energy. That is half of
the total energy consumption needs of the country.

IJESR Volume 3, Issue 2 ISSN: 2347-6532 __________________________________________________________
A Monthly Double-Blind Peer Reviewed Refereed Open Access International e-Journal - Included in the International Serial Directories Indexed & Listed at: Ulrich's Periodicals Directory ©, U.S.A., Open J-Gage as well as in Cabell’s Directories of Publishing Opportunities, U.S.A.
International Journal of Engineering & Scientific Research
http://www.ijmra.us
69
February 2015
2) Solar photovoltaic energy: Iran's unique geographical position means 90% of the country has
enough sun to generate solar power 300 days a year. According to PressTV Iran has 520 watts
per hour per square meter of solar radiation every day.
3) Biomass energy:A large quantity of biomass is available in Iran(20 Million Tonnes per year)
in the form of dry waste like agro residues, fuel wood, etc. and wet wastes like cattle dung,
sugarcane bagasse, banana stem etc. Biomass power generation in Iran has a potential ranges
from 5000 MW to 10000 MW.
4) Geothermal energy:Iran has the potential to become the 9th largest geothermal energy
producer. The first geothermal electricity generation station in Meshkinshahr, Ardebil with
capacity of 250 MW installed in 2010.
5) Ocean wave and tidal energy:The global tidal range energy potential is estimated to be about
200 TWh/y, about 1 TW being available at comparable shallow waters. Within the European
Union, France and the UK have sufficiently high tidal ranges of over 10 meters. Beyond the EU,
Canada, the CIS, Argentina, Western Australia and Korea have potentially interesting sites.
Additionally for Iran, there is a wide range of potentially interesting sites for tidal ranges.
Conclusions:
Currently, Iran is the 11th
largest energy consumer in the world and the country's energy
consumption is expected to increase in the near future. In the past, Iran has derived most of its
energy from gas and oil but recently the country has been making efforts to extract energy from
other sources. However, fossil fuels still remain the largest energy source.Iran has become self-
0
20
40
60
80
100
120ca
pac
ity(
MW
)
Year
I R A N W I N D P O W E R P L A N T I N S T A L L A T I O N U P T O E N D O F 2 0 1 3
IJESR Volume 3, Issue 2 ISSN: 2347-6532 __________________________________________________________
A Monthly Double-Blind Peer Reviewed Refereed Open Access International e-Journal - Included in the International Serial Directories Indexed & Listed at: Ulrich's Periodicals Directory ©, U.S.A., Open J-Gage as well as in Cabell’s Directories of Publishing Opportunities, U.S.A.
International Journal of Engineering & Scientific Research
http://www.ijmra.us
70
February 2015
sufficient in designing, building and operating dams and power plants and it has won a good
number of international bids in competition with foreign firms, so our target should be promotion
of renewable energy with support of investorsby legislation of correct energy policy against
world.
References:
[1] BP Statistical Review of World Energy June 2014, www.bp.com
[2] Ministry of Energy of Iran
[3] F. Zabihian, A.S. Fung, Review of marine renewable energies: Case study of
Iran,Renewableand Sustainable Energy Reviews 2011, 15, p.2461–2474.
[4] Global wind energy council, Rue d‟Arlon 801040 Brussels, Belgium
[5] International Energy Agency (iea)
[6]Iran - US Energy Information Administration
[7]Ministry of New and Renewable Energy, India
[8]Prof. (Dr.) Sandesh R. Jadkar, School of Energy Studies, Uop
[9]Onacha, Stephen. 2011. “Rwanda Geothermal Resources Development Country Update.”
Nairobi: proceedings, Kenya Geothermal Conference 2011. Accessed July 23rd, 2013.
[10]http://www.power-technology.com/features/featuretidal-giants---the-worlds-five-biggest-
tidal-power-plants-4211218/
[11]http://www.renewableenergyworld.com
[12]"Study and calculation of extractable tidal power in south coastal zones of Iran".
Civilica.com. Retrieved 2012-02-05.
[13]Tidal Energy and Main Resources In the Persian Gulf,Mofid Gorji-Bandpy,Mohammadreza
Azimi,M. Jouya, Vol. 28, No. 2 2013
[14]World Energy Council, www.worldenergy.org