STATISTICAL AND GEOSTATISTICAL MODELLING OF PRELIMINARILY ADJUSTED DEFOLIATION ON AN EUROPEAN SCALE
25
Environmental Monitoring and Assessment (2005) 101: 223–247 c Springer 2005 STATISTICAL AND GEOSTATISTICAL MODELLINGOF PRELIMINARILY ADJUSTED DEFOLIATION ON AN EUROPEAN SCALE WALTER SEIDLING 1,∗ and VOLKER MUES 2 1 Federal Research Centre for Forestry and Forest Products, Institute for Forest Ecology and Inventory, Alfred-M¨ oller-Straße 1, Eberswalde, Germany; 2 Federal Research Centre for Forestry and Forest Products, Institute for World Forestry, Leuschnerstraße 91, Hamburg, Germany ( ∗ author for correspondence, e-mail: [email protected]) (Received 7 February 2003; accepted 30 January 2004) Abstract. Since 1987 tree crown condition is surveyed annually in large parts of Europe mainly in terms of defoliation. The plot-wise means of defoliation from 1994 to 2000 were evaluated by General Linear Models (GLM) in order to describe country-specific levels of defoliation and age- trends. Additional runs with estimates for influences of insects and fungi were performed. The amount of variance of defoliation explained by country, age and its interaction was between 35% and 59% for the main tree species, except for Quercus ilex. Additionally, up to 10% could be explained by the inclusion of estimates for infestations by insects and fungi. Residuals of the GLMs were taken as a measure of forest condition not biased by country or age effects and interpreted as ‘prelim- inarily adjusted defoliation’ (PAD). PAD values were analysed using geostatistical methods. The modelled spatial autocorrelations were used for kriging. The resulting maps give an overview on regions with elevated defoliation, which may pinpoint regional causes of defoliation. The elimination of methodologically caused variance is a precondition of any cause–effect oriented analyses. The combination of explorative modelling and geostatistics will promote the choice of further promising predictors. Seit 1987 wird der Kronenzustand von Waldb¨ aumen j¨ ahrlich in großen Teilen Europas haupts¨ achlich als Nadel-/Blattverlust erfasst. Um die l¨ anderspezifischen Niveaus und Alterstrends zu quantifizieren, werden artbezogen die auf die Stichprobenpunkte bezogenen mehrj¨ ahrigen Mittel des Nadel-/Blattverlustes ¨ uber den Zeitraum von 1994 bis 2000 mittels Generalisierter Linear Modelle zu den Gr ¨ oßen Land und Bestandesalter in Beziehung gesetzt. In zus¨ atzlichen Berechnungen werden Sch¨ atzgr¨ oßen f ¨ ur den Insekten- und Pilzbefall in die Modelle mit einbezogen. Der durch Land und Be- standesalter und deren Wechselwirkung erkl¨ arbare Anteil der Varianz des Nadel-/Blattverlustes betr¨ agt f¨ ur die Hauptbaumarten mit Ausnahme von Quercus ilex zwischen 35 und 59%. Zus¨ atzlich k¨ onnen bis zu 10% der entsprechenden Varianzen durch die zus¨ atzliche Aufnahme von Sch¨ atzwerten f ¨ ur den mittleren Insekten- und Pilzbefall erkl¨ art werden. Die Residuen aus den linearen Modellen wurden als von Land und Alter unbeeinflusste’ vorl¨ aufig angepasste Nadel-/Blattverluste’ (‘preliminarily adjusted defoliation’, PAD) zur weiteren Beurteilung des Waldzustandes verwendet. Diese PAD-Werte wurden einer geostatistischen Analyse unterzogen. Die Parameter der r¨ aumlichen Autokorrelation wurden f¨ ur Kriging-Interpolationen verwendet. Die so berechneten fl¨ achenhaften Informationen zeigen auf europaweiten Karten ¨ uberblicksartig Gebiete mit erh ¨ ohtem Nadel-/Blattverlust, was als Hinweis auf bereits bekannte oder noch unbekannte Ursachen f ¨ ur erh ¨ ohte Nadel-/Blattverluste interpretiert werden kann. Die Ber¨ ucksichtigung methodischer und altersbedingter Varianz beim Nadel-/Blattverlust ist eine Vorraussetzung f¨ ur jede statische Ursache-Wirkungsforschung. Die Kombination aus
-
Upload
independent -
Category
Documents
-
view
5 -
download
0
Transcript of STATISTICAL AND GEOSTATISTICAL MODELLING OF PRELIMINARILY ADJUSTED DEFOLIATION ON AN EUROPEAN SCALE

Environmental Monitoring and Assessment (2005) 101: 223–247 c© Springer 2005
STATISTICAL AND GEOSTATISTICAL MODELLING OFPRELIMINARILY ADJUSTED DEFOLIATION ON
AN EUROPEAN SCALE
WALTER SEIDLING1,∗ and VOLKER MUES2
1Federal Research Centre for Forestry and Forest Products, Institute for Forest Ecology andInventory, Alfred-Moller-Straße 1, Eberswalde, Germany; 2Federal Research Centre for
Forestry and Forest Products, Institute for World Forestry, Leuschnerstraße 91,Hamburg, Germany
(∗author for correspondence, e-mail: [email protected])
(Received 7 February 2003; accepted 30 January 2004)
Abstract. Since 1987 tree crown condition is surveyed annually in large parts of Europe mainlyin terms of defoliation. The plot-wise means of defoliation from 1994 to 2000 were evaluated byGeneral Linear Models (GLM) in order to describe country-specific levels of defoliation and age-trends. Additional runs with estimates for influences of insects and fungi were performed. The amountof variance of defoliation explained by country, age and its interaction was between 35% and 59%for the main tree species, except for Quercus ilex. Additionally, up to 10% could be explained bythe inclusion of estimates for infestations by insects and fungi. Residuals of the GLMs were takenas a measure of forest condition not biased by country or age effects and interpreted as ‘prelim-inarily adjusted defoliation’ (PAD). PAD values were analysed using geostatistical methods. Themodelled spatial autocorrelations were used for kriging. The resulting maps give an overview onregions with elevated defoliation, which may pinpoint regional causes of defoliation. The eliminationof methodologically caused variance is a precondition of any cause–effect oriented analyses. Thecombination of explorative modelling and geostatistics will promote the choice of further promisingpredictors.
Seit 1987 wird der Kronenzustand von Waldbaumen jahrlich in großen Teilen Europashauptsachlich als Nadel-/Blattverlust erfasst. Um die landerspezifischen Niveaus und Alterstrendszu quantifizieren, werden artbezogen die auf die Stichprobenpunkte bezogenen mehrjahrigen Mitteldes Nadel-/Blattverlustes uber den Zeitraum von 1994 bis 2000 mittels Generalisierter Linear Modellezu den Großen Land und Bestandesalter in Beziehung gesetzt. In zusatzlichen Berechnungen werdenSchatzgroßen fur den Insekten- und Pilzbefall in die Modelle mit einbezogen. Der durch Land und Be-standesalter und deren Wechselwirkung erklarbare Anteil der Varianz des Nadel-/Blattverlustes betragtfur die Hauptbaumarten mit Ausnahme von Quercus ilex zwischen 35 und 59%. Zusatzlich konnenbis zu 10% der entsprechenden Varianzen durch die zusatzliche Aufnahme von Schatzwerten fur denmittleren Insekten- und Pilzbefall erklart werden. Die Residuen aus den linearen Modellen wurden alsvon Land und Alter unbeeinflusste’ vorlaufig angepasste Nadel-/Blattverluste’ (‘preliminarily adjusteddefoliation’, PAD) zur weiteren Beurteilung des Waldzustandes verwendet. Diese PAD-Werte wurdeneiner geostatistischen Analyse unterzogen. Die Parameter der raumlichen Autokorrelation wurdenfur Kriging-Interpolationen verwendet. Die so berechneten flachenhaften Informationen zeigen aufeuropaweiten Karten uberblicksartig Gebiete mit erhohtem Nadel-/Blattverlust, was als Hinweis aufbereits bekannte oder noch unbekannte Ursachen fur erhohte Nadel-/Blattverluste interpretiert werdenkann. Die Berucksichtigung methodischer und altersbedingter Varianz beim Nadel-/Blattverlustist eine Vorraussetzung fur jede statische Ursache-Wirkungsforschung. Die Kombination aus
224 W. SEIDLING AND V. MUES
explorativer Statistik einerseits und geostatistischem Ansatz andererseits sollte die Auswahl weit-erer relevanter Einflussfaktoren unterstutzen.
Keywords: age, country bias, crown condition, defoliation, geostatistics, kriging, linear modelling
1. Introduction
The Level I transnational large-scale survey of crown condition is part of the Inter-national Co-operative Programme on Assessment and Monitoring of Air PollutionEffects on Forests (ICP Forests), which was established in 1986 under the ‘Con-vention on Long-range Transboundary Air Pollution’ (CLRTAP) of the UnitedNations Economic Commission for Europe (UNECE) in co-operation with theEuropean Union’s ‘Scheme on the Protection of Forests against Atmospheric Pol-lution’ (Lorenz, 1993). The survey aims to assess the spatial and temporal variationof forest condition in relation to natural and anthropogenic factors, particularly airpollution. The core parameter for the description of tree crown condition is defolia-tion. This parameter is kept as easily assessable, however, rather unspecific for anyparticular natural or anthropogenic cause, which may range from direct or indirectimpacts of air pollution, water stress to infestations by insects or fungi.
To get defoliation estimates with minimal influences from interfering factorssuch as stand age and country-specific estimation practices, an iterative processof integrative data analysis was started. Both, stand age and methodological dif-ferences between countries had already been found to be crucial statistical pre-dictors for defoliation (e.g. Klap et al., 1997, 2000). Independently, internationalcross-calibration courses also revealed distinct differences between the estimationbehaviour of survey crews from different countries (Mues and Seidling, 2003).
The modelled defoliation estimates (Preliminarily Adjusted Defoliation, PAD),minimally biased by country and stand age effects, may not only serve as a basisfor the production of thematic maps by kriging of the model residuals, but alsofor the development of more sophisticated approaches, which may include furtherenvironmental factors.
2. Material and Methods
2.1. DATA
Data on crown condition are collected annually according to the ‘Manual onmethods and criteria for harmonised sampling, assessment, monitoring and analysisof the effects of air pollution on forests’ (UNECE, 1998) and the CommissionRegulation (EEC) No. 1696/87 and its amendments (Anonymus, 1987). The corevariable of these assessments is defoliation, which describes the percentage ofleaves or needles missing on a particular tree in comparison to a fully leaved

MODELLING OF PRELIMINARILY ADJUSTED DEFOLIATION 225
reference tree in 5% steps. The participating countries perform the surveys (in 2000on a total of 6.040 plots; Lorenz et al., 2001), prepare the data and submit them to theProgramme Co-ordination Centre (PCC) of ICP Forests. Respective reports at thenational level are provided by national ministries or focal centres (e.g. Anonymus,2001; Bussotti et al., 2001), while reports at the European scale are prepared byPCC (e.g. Lorenz et al., 2001).
As dependent variable the medium-term mean defoliation, averaged overall plotswith annual plot means from 1994 to 2000, is used. It should be less affected byshort-term fluctuations caused, e.g. by annual weather conditions. Bussotti et al.(2003) have shown that plot related means are a reliable measure of defoliation atstand level. Only those plots were taken into consideration, which were annuallyassessed from 1994 to 2000 and contain on average more than two monitored treesof a particular species. Due to this precondition, in total 3775 plots could be keptas valid cases. Higher limits of tree numbers per plot would lead to less valid casesand larger distributional gaps of the plots especially in Scandinavian countries andrun contrary to our mapping intentions.
Species, abundant enough to allow reasonable analyses, are Pinus sylvestris,Picea abies, Fagus sylvatica, Quercus robur et petraea, Pinus pinaster and Quercusilex. A separate treatment of Quercus robur and Q. petraea would lead to a markedreduction of cases, even for the more abundant Q. robur. Therefore, these two oakspecies are evaluated together, which can be rectified by their broad genetic andecological overlap (Aas, 1998).
Stand age classes (width = 20 yr) given in the Level I data base were transformedinto class means. To avoid further loss of cases, uneven aged stands (class 8) were,according to results of a respective evaluation, set to an age of 110 yr (class 6).As an example for the inclusion of further covariates, estimates of the mean-terminfestation rates by insects or fungi are tentatively used in additional runs. Sinceannual variations are not in the focus of this approach, short-term fluctuations ofboth predictors, similar to defoliation, have also been levelled off: Both parameterswere calculated per plot as the averages over time of the annual shares of treesof the particular species, which were observed to be infested by insects or fungi,respectively.
2.2. STATISTICAL MODEL
The spatial variance of defoliation may contain systematic and stochastic parts.When possible, the first should be explained in the sense of cause–effect relation-ships. Differences between the participating countries have been identified withinthe Level I dataset (e.g. Innes et al., 1993; Klap et al. 1997; Seidling, 2001) andwere independently corroborated within field comparisons of teams from differentcountries (Mues and Seidling, 2003). Their consideration is, therefore, a prerequi-site not only for more advanced analyses but also for presentations of assessment

226 W. SEIDLING AND V. MUES
results. Species-specific dependencies of defoliation from age are well-known too(see Seidling, 2000 for an overview). General Linear Models (SAS, 1990: procedureGLM) is used to explore these relationships (1) for each tree species separately:
yi j = ß0 + C1 j + ß1 • X1i + (X1 ∗ C1) j • X1i + ri (1)
The mean crown condition ‘y’ of the plot ‘i’ and county ‘j’ can be explained by themodel with the residuum ‘ri ’. These residuals will be termed ‘preliminarily adjusteddefoliation’ (PAD, cf. Klap et al., 2000: Figure 1a) further on. PAD contains allthe variation of defoliation (including an unknown amount of noise), which cannotbe explained by the following two predictors and their interaction: Country ‘C1 j ’,a categorical variable (predictor), describes the differences of the target variablefor each country ‘j’. Age ‘X1’ is introduced as a continuous variable, because anumber of evaluations indicate a monotonous increase of defoliation with age. Theintercept ‘ß0’ gives the value of the target variable at the value 0 of the metricpredictor (age) and the regression coefficient (slope) ‘ß1’ accomplishes this partof the model. Finally, the model considers the interaction term (X1 ∗ C1). Thispart of the model should respond to heterogeneous behaviour of assessment teamsfrom different countries with respect to stand age. It is tested for each countryif the slope was significantly different from zero by t-tests. This model can beadequately complemented by the inclusion of further numeric parameters such asthe indices for the occurrence of insects or fungi (X2, X3) and their interaction termswith country. These interaction terms are introduced, because there were hints thatcountry specific peculiarities within the assessment of biotic causes of defoliationmay exist (Seidling, 2001).
2.3. GEOSTATISTICS
The fundamental assumption of geostatistics is that a regionalised variable, herethe PAD, may consist of a deterministic, a correlative and a random component(Ripley, 1981). The deterministic component, the drift, can be described, e.g. byregression or covariance models. The correlative component means that pointslocated close together are expected to show smaller differences concerning theregionalised variable than points with a large spatial distance (spatial autocorrelationof PAD).
The autocorrelation of the regionalised variable can be described by an empiricalsemivariogram. To this a theoretical semivariogram is visually adapted. The latter isused for calculating interpolation weights for kriging. Additionally to the geostatis-tical key parameters nugget, sill and range, the ratio nugget/(nugget + sill) is usedto examine the spatial autocorrelative properties of PAD. General introductions toapplied geostatistics are given by Ripley (1981) or Cressie (1991).
For the sake of representativity only for those grid-cells a kriging value is esti-mated, for which at least at 12 plots with PAD values are available within a radius

MODELLING OF PRELIMINARILY ADJUSTED DEFOLIATION 227
of 400 km, and at least 4 within a radius of 100 km. The latter precondition isinvented in order to reduce the area of extrapolation beyond the sampled area. Forthe calculation of the kriging values, all plots within a 400 km radius are used.
One of the benefits of semi-variography and kriging is the detection of plots andregions with exceptionally high PADs. They can be identified by means of variogramclouds (Pannatier, 1996, not shown here). Extremely high residuals are in particularprone to detect further explanatory variables as respective environmental or bioticfactors might be extraordinary high (or low) at these plots.
3. Results
3.1. THE OVERALL MODEL
Results from GLMs with medium-term mean defoliation of tree crowns as targetvariable and country, age, insects and fungi as predictors are summarised in Table I.The mean defoliation estimates of the different tree species are influenced to variousextents by effects related to country. With 47% of the explained variance Pinussylvestris shows the highest influence, whereas for Quercus ilex no respective effectswere detected.
If age is used as the only predictor in a regression model, only in Norway spruce,a highly significant relationship with defoliation was found. In the other tree species,country alone was a better predictor. Models, which include both country and ageand their interaction term, denote Picea abies and Pinus sylvestris as the speciesfor which defoliation is explained best in terms of explained variance. For Piceaabies, the additional effect from age is almost 33%, which is somewhat higher than
TABLE I
Relationships in terms of explained variance (non-adjusted r2 in %) evaluated by linear regressionand General Linear Models for mean defoliation as response variable and different combinations ofpredictors for six important tree species in Europe
Piceaabies
Pinussylvestris
Pinuspinaster
Fagussylvatica
Qu. robur etpetraea
Quercusilex
n of plots 1099 1376 148 518 487 156
Age 31.9 6.2 0.7 6.6 3.1 0.0
Country 26.4 46.8 33.9 23.4 29.4 0.7
Country, age∗ 59.1 58.4 39.7 35.1 39.3 5.3
Country, age∗, insect∗ 60.5 59.6 46.7 40.7 45.2 6.4
Country, age∗, fungi∗ 59.9 61.0 48.0 39.8 44.2 5.7
Country, age∗, insect∗,fungi∗
61.1 62.2 50.1 44.4 49.5 6.5
∗Additionally interaction with country included.

228 W. SEIDLING AND V. MUES
for age alone. For the deciduous tree species, the increase in explained variancedue to the inclusion of age amounts circa 10%. For Pinus pinaster, the increaseis comparatively poor and for Quercus ilex it is 5.3%, which is, almost negligible.As the low mean ages indicate (cf. Table VI and VII) both Mediterranean treespecies have, however, limited age distributions, reducing the explaining power ofthis variable.
If indices for the infestations of insect and fungi are added to the models for Pinuspinaster, Fagus sylvatica and Quercus robur et petraea, the explained varianceincreases additionally by about 10%. For Pinus sylvestris and Picea abies, theintegration of insect and fungi including their interactions with country improvesthe statistical models to minor degrees and for Quercus ilex there is almost no effect.
3.2. COUNTRY-SPECIFIC RESULTS
Tables II to VII give the country-specific uncorrected medium-term mean defolia-tion together with basic model results. Large differences in mean defoliation valuesamong the countries become obvious, ranging for Pinus sylvestris from 6% (TheNetherlands) to 36% (Czech Republic). In Quercus robur et petraea generally highdefoliation values are found with averages well above 20% or even 30% (Table V),while in Fagus sylvatica means are always below 30% (Table IV). In Quercus ilex(Table VII), as country does not explain any substantial amount of the total variance(see Table I), mean defoliation differs only slightly between the four countries.
As expected from previous studies, there are a number of countries with signif-icant positive age trends for certain species. Significant trends in Pinus sylvestris(Table II) vary between an increase of 0.6% defoliation per 10 yr in Sweden and1.6% in Norway. An exception is Italy with a significant negative age trend. InPicea abies (Table III), significant increases of defoliation per 10 yr vary between1.3% (Romania) and 3.2% (Norway). For Quercus robur et petraea (Table V) andFagus sylvatica (Table IV) only for four and two countries respectively significantage trends are found. For both Mediterranean species (Pinus pinaster, Quercusilex, Tables VI and VII) only for the French plots significant positive age trends arerevealed.
Coefficients around null for countries with a remarkable number of plots perspecies might be based on an adequate consideration of age effects during thefield surveys (e.g. Quercus ilex in Spain). Large negative trends are normally notsignificant and coincide with low numbers of plots per country or with very narrowlydistributed stand ages (not shown in tables) as for Fagus sylvatica in Belgium (TableIV). In both cases the results are not very evidential.
Model values of defoliation, for comparison reasons calculated for an age of 90yr, also differ considerably between the countries. In most species, there are onlyminor differences between the plain country means and the model values at the ageof 90 yr. In countries with very few plots per species, neither the unprocessed northe model results (age trends, model 90 values) reveal much meaning. For example,

MODELLING OF PRELIMINARILY ADJUSTED DEFOLIATION 229
TABLE II
Country-wise mean age, number of observations, mean defoliation and model results/prediction forPinus sylvestris, listed according to increasing country specific mean defoliation
Medium-termmean defoliation GLM
Mean age Mean Age-trend Model 90(years) n (%) (%/a) (%)
The Netherlands 70 6 6 0.020 7
Austria 92 11 10 −0.006 10
Finland 67 234 10 0.128∗ 13
Portugal 10 1 12 0.020 13
Greece 70 1 13 0.020 13
Sweden 80 151 14 0.063∗ 14
Norway 99 142 16 0.163∗ 14
Denmark 63 3 16 0.008 16
France 62 52 16 0.131∗ 20
Hungary 49 14 17 −0.075 14
United Kingdom 55 8 17 −0.008 17
Spain 55 62 17 0.023 18
Germany 73 161 17 0.109∗ 19
Estonia 65 68 18 0.027 18
Switzerland 110 2 18 −0.062 20
Belgium 77 9 21 −0.029 20
Lithuania 63 38 21 −0.009 21
Italy 60 10 21 −0.178∗ 16
Latvia 68 52 23 0.020 23
Slovenia 90 4 26 −0.331 26
Poland 77 298 27 0.021 27
Romania 40 2 28 −0.510 2
Slovak Republic 75 16 29 −0.104 27
Bulgaria 29 21 33 −0.011 32
Luxembourg 90 1 34 0.020 34
Czech Republic 99 9 36 0.002 36
Sum 1376
∗Age-trend significantly (p < 0.05) different from 0.If only one plot per country or if all stands have the same age, the overall trend is given.
in Picea abies the highest mean defoliation is observed for Croatia, or for Quercusrobur et petraea the lowest value is found in Austria. In both cases, only one plotis surveyed and the respective result can not be considered as representative for thewhole country.

230 W. SEIDLING AND V. MUES
TABLE III
Country-wise mean age, number of observations, mean defoliation and model results/predictionfor Picea abies, listed according to increasing country specific mean defoliation
Medium-termmean defoliation GLM
Mean age Mean Age-trend Model 90(years) n (%) (%/a) (%)
France 55 37 5 0.146∗ 10
Spain 10 1 6 0.053 10
Austria 89 66 8 0.059 8
Denmark 33 8 13 0.030 14
Bulgaria 97 3 13 −0.037 13
Estonia 55 31 14 0.205∗ 21
Italy 82 15 16 0.009 16
United Kingdom 65 11 16 0.087 19
Sweden 75 162 19 0.179∗ 21
Ireland 37 3 19 −0.110 13
Latvia 62 38 19 0.053 21
Finland 76 148 20 0.291∗ 24
Germany 79 180 20 0.230∗ 23
Belgium 73 7 21 −0.036 21
Lithuania 60 24 22 0.168∗ 27
Norway 86 130 22 0.320∗ 23
Romania 69 33 22 0.133∗ 25
Switzerland 116 25 23 0.082 20
Slovenia 84 21 23 0.052 23
Luxembourg 100 2 26 −0.887 35
Slovak Republic 82 44 32 0.079 32
Poland 86 26 32 0.055 32
Czech Republic 91 83 32 0.032 32
Croatia 110 1 41 0.053 40
Sum 1099
∗Age-trend significantly (p < 0.05) different from 0.If only one plot per country or if all stands have the same age, the overall trend is given.
3.3. RESULTS OF SEMI-VARIOGRAPHY
Based on PAD values, calculated as plot-wise residuals from the total model with‘country,’ age and their interaction term, empirical variograms were constructed.For all evaluated species spherical variograms could be fitted (Figure 1). The key

MODELLING OF PRELIMINARILY ADJUSTED DEFOLIATION 231
TABLE IV
Country-wise mean age, number of observations, mean defoliation and model results/predictionfor Fagus sylvatica, listed according to increasing country specific mean defoliation
Medium-termmean defoliation GLM
Mean age Mean Age-trend Model 90(years) n (%) (%/a) (%)
Hungary 86 5 5 −0.020 4
Austria 93 12 6 0.085 6
Greece 102 5 7 −0.005 7
Croatia 73 22 10 0.083 12
France 79 83 14 0.079∗ 15
Belgium 115 8 16 0.573 2
United Kingdom 93 12 16 0.026 16
Slovenia 90 18 16 0.060 16
Romania 74 88 19 0.050 19
Spain 60 8 19 0.045 20
Slovak Republic 81 51 19 −0.003 19
Italy 51 36 20 0.033 21
Sweden 110 7 21 0.168 17
Switzerland 104 13 21 0.060 20
Germany 88 115 22 0.169∗ 23
Denmark 117 6 25 0.145 21
Bulgaria 52 11 26 −0.015 25
Poland 88 17 27 0.073 27
Luxembourg 110 1 27 −0.015 27
Sum 518
∗Age trend significantly (p < 0.05) different from 0.If only one plot per country or if all stands have the same age, the overall trend is given.
parameters such as nugget, sill, range and the nugget/(nugget + sill) ratio differconsiderably. Picea abies shows the largest nugget variance with 47.0 and thenugget/(nugget + sill) ratio is 0.85 which is also the largest. In Fagus sylvaticaboth parameters with 25.5 and 0.45, respectively, are the smallest. This indicates acomparatively small amount of random variance and a high correlative componentin common beech and vice versa in Norway spruce. The nugget/(nugget + sill)ratios are 0.72, 0.61 and 0.50 for Quercus robur et petraea, Pinus sylvestris andPinus pinaster, respectively.
The analysis of variogramme clouds shows that the comparatively high semi-variance in Norway spruce, especially for pairs with distances |h| > 400 km, is

232 W. SEIDLING AND V. MUES
TABLE V
Country-wise mean age, number of observations, mean defoliation and model results/predictionfor Quercus robur et petraea listed according to increasing country specific mean defoliation
Medium-termmean defoliation GLM
Mean age Mean Age-trend Model 90(years) n (%) (%/a) (%)
Austria 50 1 2 −0.234 −8
Portugal 90 1 14 −0.234 14
Belgium 105 11 15 0.084 14
The Netherlands 70 4 15 −0.154 12
Spain 61 15 17 −0.072 15
France 74 180 20 0.097∗ 22
United Kingdom 118 15 20 0.012 20
Lithuania 83 3 21 0.169 22
Hungary 64 18 22 0.312∗ 30
Slovenia 96 7 22 −0.170 23
Sweden 88 11 22 −0.070 22
Croatia 76 22 25 0.114 27
Switzerland 120 2 27 −0.246 34
Germany 91 56 27 0.110∗ 27
Italy 49 16 27 0.092 31
Greece 48 13 28 −0.044 26
Slovak Republic 74 21 30 0.159∗ 32
Romania 60 36 31 −0.016 31
Poland 80 35 32 0.092 32
Luxembourg 77 3 32 −0.172 30
Moldova 57 6 33 0.029 34
Bulgaria 53 7 34 −0.234 25
Denmark 105 4 34 0.065 33
Sum 487
∗Age trend significantly (p < 0.05) different from 0.If only one plot per country or if all stands have the same age, the overall trend is given.
mainly based on outstandingly high defoliation values respectively PADs of severalplots in the middle of Norway and a plot in Germany. High variogram values atdistances of c. 350 km for beech can be mainly traced back to four plots withhigh residuals located in Germany, Romania and France. For these plots, the meandefoliation values are underestimated by the country-age model by more than 30%.Mostly, these extreme values can be explained by reported infestations of insects.
MODELLING OF PRELIMINARILY ADJUSTED DEFOLIATION 233
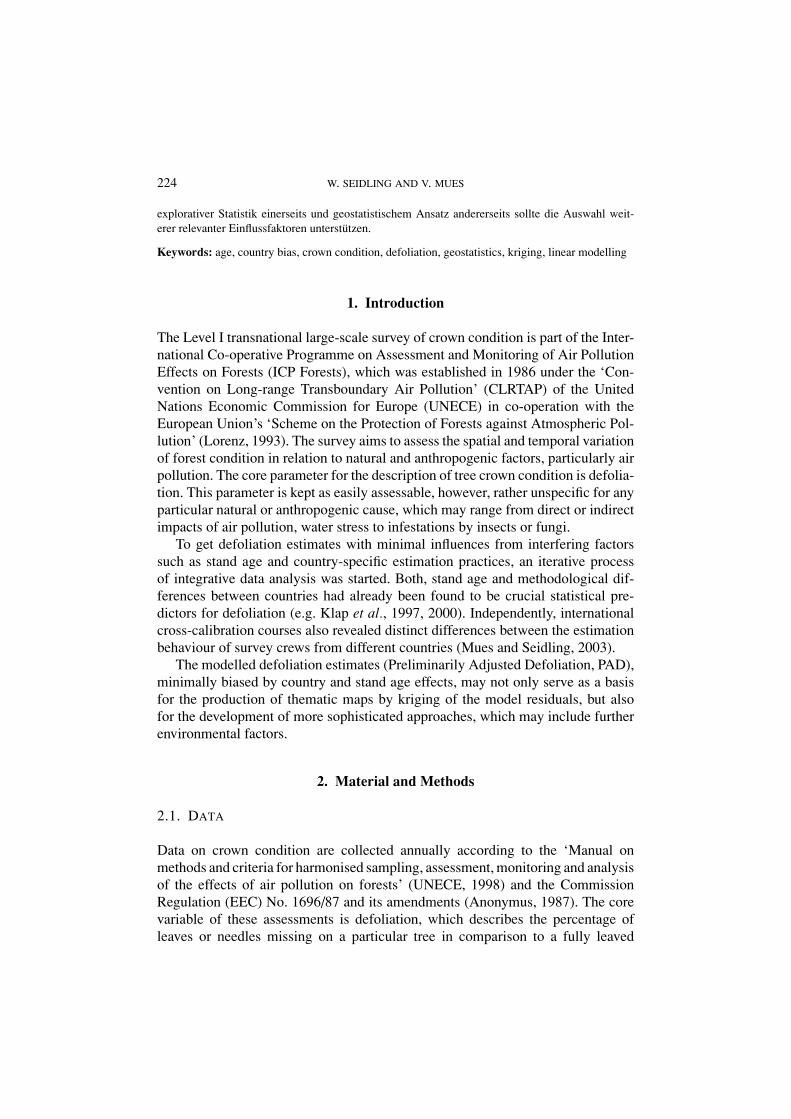
TABLE VI
Country-wise mean age, number of observations, mean defoliation and model results/predictionfor Pinus pinaster, listed according to increasing country specific mean defoliation
Medium-termmean defoliation GLM
Mean age Mean Age-trend Model 90(years) n (%) (%/a) (%)
France 37 45 13 0.180∗ 23
Portugal 30 51 13 −0.003 13
Spain 41 48 19 −0.044 17
Italy 30 4 48 −0.044 45
Sum 148
∗Age-trend significantly (p < 0.05) different from 0.If only one plot per country or if all stands have the same age, the overall trend is given.
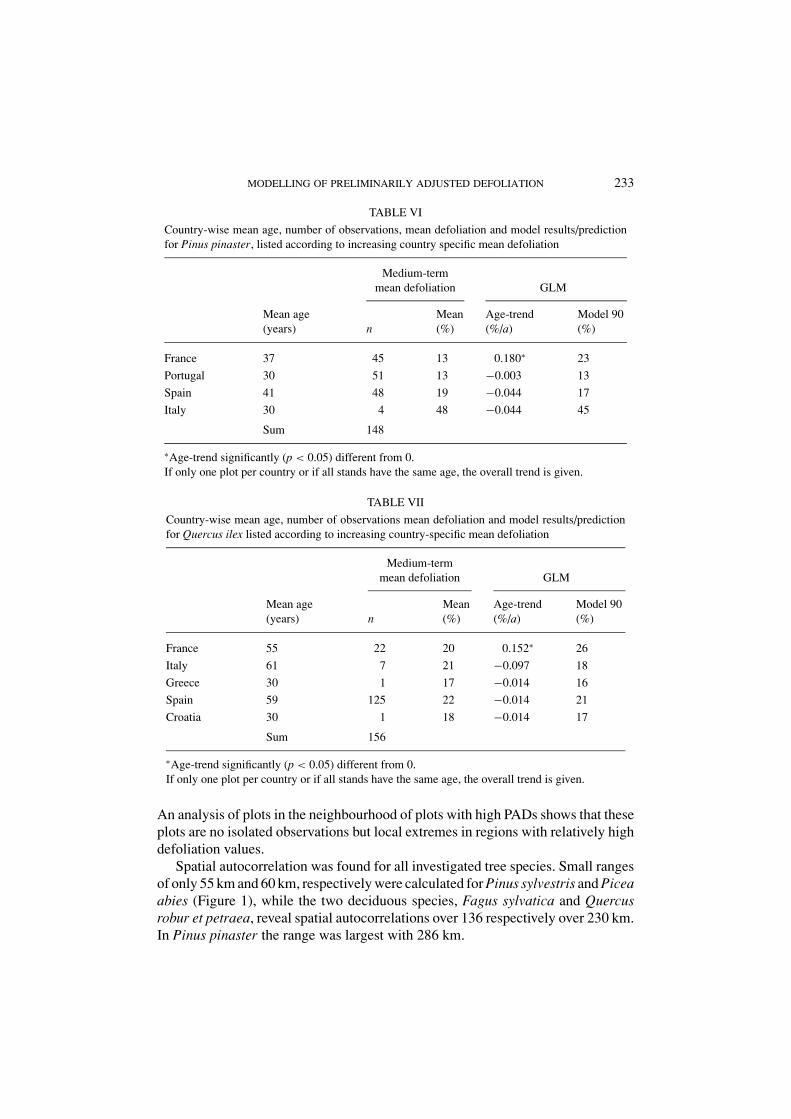
TABLE VII
Country-wise mean age, number of observations mean defoliation and model results/predictionfor Quercus ilex listed according to increasing country-specific mean defoliation
Medium-termmean defoliation GLM
Mean age Mean Age-trend Model 90(years) n (%) (%/a) (%)
France 55 22 20 0.152∗ 26
Italy 61 7 21 −0.097 18
Greece 30 1 17 −0.014 16
Spain 59 125 22 −0.014 21
Croatia 30 1 18 −0.014 17
Sum 156
∗Age-trend significantly (p < 0.05) different from 0.If only one plot per country or if all stands have the same age, the overall trend is given.
An analysis of plots in the neighbourhood of plots with high PADs shows that theseplots are no isolated observations but local extremes in regions with relatively highdefoliation values.
Spatial autocorrelation was found for all investigated tree species. Small rangesof only 55 km and 60 km, respectively were calculated for Pinus sylvestris and Piceaabies (Figure 1), while the two deciduous species, Fagus sylvatica and Quercusrobur et petraea, reveal spatial autocorrelations over 136 respectively over 230 km.In Pinus pinaster the range was largest with 286 km.

234 W. SEIDLING AND V. MUES
Figure 1. Empirical variograms (dots) and modelled spherical variograms (lines) of PAD (residualsof linear models with mean defoliation as response and age, country and their interaction term aspredictor variables); |h|: distance between pairs of observations in km, γ (|h|): semivariance.
3.4. KRIGED PAD MAPS
The maps (Figures 2 to 6) show ‘hot spots’ (densely vertically hatched) of highdefoliation. These spots and their counterparts have to be interpreted as devia-tions from the country-specific mean defoliation under additional consideration ofage.
A total of 1376 plots with Pinus sylvestris are distributed over large parts ofEurope from northern Portugal to northern Finland (Figure 2). For some areas,distinct spatial patterns of the kriged PAD can be observed. The coherent low

MODELLING OF PRELIMINARILY ADJUSTED DEFOLIATION 235
Figure 2. Map of deviations from the defoliation expected from country and age for Pinus sylvestris(kriged PAD).
PAD values in northern and north-western Poland indicate better crown condition,while the PAD is relatively high in southern Poland. Further, coherent patterns ofhigher defoliation can be found in Estonia and in the south-east of France. In Spain,Norway, Germany or Finland only smaller spots of higher residuals or even isolatedplots with high PADs occur.

236 W. SEIDLING AND V. MUES
Figure 3. Map of deviations from the defoliation expected from country and age for Picea abies(kriged PAD).
In Picea abies 1099 plots are available. The high variance of defoliation inNorway fades over the largest part of the variance found within other countries(Figure 3). Nevertheless, regions of elevated PAD occur in other countries too.
The 518 plots of Fagus sylvatica are situated mainly in central Europe and inmountainous parts of the northern Mediterranean region and south-eastern Europe

MODELLING OF PRELIMINARILY ADJUSTED DEFOLIATION 237
Figure 4. Map of deviations from the defoliation expected from country and age for Fagus sylvatica(kriged PAD).
(Figure 4). Generally, the PAD shows a strong medium-scale variation throughoutEurope. Some areas in central and southern Germany and southern Romania showhigh positive PAD values.
In total 487 plots with Quercus robur and Q. petraea can be found spread overlarge parts of Europe from the belt of nemoral woodlands in north-western Spain to

238 W. SEIDLING AND V. MUES
Figure 5. Map of deviations from the defoliation expected from country and age for Quercus roburet petraea (kriged PAD).
eastern Bulgaria and Moldova (Figure 5). The mapped PAD shows a rich regionalstructure, which reminds partly to those of Fagus sylvatica. An explanation of thispattern is not at hand. Only the spatial pattern in Poland could be explained byindustrial pollution and/or by disturbances of the ground water level (Wawrzoniak,2001, personal communication).

MODELLING OF PRELIMINARILY ADJUSTED DEFOLIATION 239
Figure 6. Map of deviations from the defoliation expected from country and age for Pinus pinaster(kriged PAD).
Pinus pinaster is mainly restricted to the southern Atlantic and the westernMediterranean region (Figure 6). Interestingly, on the Iberian peninsula coherentpatterns of PAD can be observed, which are obviously undisturbed by the borderbetween Portugal and Spain.

240 W. SEIDLING AND V. MUES
4. Discussion
Until today the recognition of any straight relationships between mere defoliationvalues and anthropogeneous impacts in the sense of Koch’s postulate (Schopferand Hradezky, 1984) has been prevented for different reasons. In phytopathologi-cal terms, defoliation is an unspecific symptom of tree condition. It is directly orindirectly influenced by many environmental factors. Climatic droughts and grada-tions of phytophageous insects are among the most prominent natural stress factors,while direct or indirect effects of air pollution are suspected to cause large scale de-terioration of crown condition (e.g. Ulrich et al., 1980; Schutt and Cowling, 1985;De Vries et al., 2000; for controversial discussions see Kandler and Innes, 1995;Ellenberg, 1996). Description and mapping of large-scale tree or crown conditionminimally biased by additional effects is, therefore, a precondition for any objectiveevaluation.
Short-term fluctuations of defoliation may obscure long-term relationships. Themedium-term averages of defoliation used in this approach should preferably re-spond to medium- and long-term stresses from adverse soil-based processes relatedto acidification, nutrient imbalances or to continuous direct impacts of air pollutants.Influences from extreme weather conditions, insect calamities or strong floweringor fruiting of trees (Innes, 1994) within single years should at least partly be levelledoff.
4.1. MODEL RESULTS WITH RESPECT TO COUNTRIES
Defoliation as an ocular field estimate is generally prone to comparativelyhigh assessment errors (e.g. Innes, 1988; Landmann and Bouhot-Delduc, 1995;Dobbertin et al., 1997), being highest around the middle of the whole range (Innes,1988). Intensive training can improve the quality and comparability of field es-timates of individual teams (Innes, 1988). The assessment errors should be ran-dom (Strand, 1996). However, independent evaluations of identical plots by teamsfrom France, the United Kingdom and Baden-Wurttemberg/Germany showed thatsystematic differences between these teams occurred (Innes et al., 1993). Thesedifferences were species-specific, with the worst agreement for Quercus species,medium for Pinus sylvestris, and the best for Abies alba. Evaluations on the basisof Europe-wide or otherwise trans-boundary Level I data also revealed substantialdifferences of defoliation estimates between countries (Klap et al., 1997, 2000;Seidling, 2001), which was recently confirmed by the evaluation of several inter-national cross-calibration courses (Mues and Seidling, 2003). Apart from Quercusilex, the variance of the medium-term mean defoliation is explained with 23 to 47%by country, which is in the same order as earlier findings by Klap et al. (2000) andSeidling (2001) with 40 and 37%, respectively.
There are, however, no simple statistical means to differentiate between method-ological and real differences of crown condition estimates between countries. Parts

MODELLING OF PRELIMINARILY ADJUSTED DEFOLIATION 241
of the variance explained by ‘country’ might be accounted for by factors such asdifferences in forest management practices. Moreover, variability of natural siteand/or stand conditions can influence crown condition, which might not be coveredby the reference tree and handled differently between countries. Those handicapshave already been described by De Vries et al. (2000), but up to now have notbeen solved satisfactorily. Independent datasets, which could permit a quantifica-tion of the methodological part of the differences, are widely lacking. For a moreobjective consideration of methodologically caused differences between countries,correction factors should be worked out at hand of independent datasets, accordingto proposals made by Innes et al. (1993) or Ferretti (1998). Possibly, combinedstatistical and geostatistical approaches (Klap, in preperation) may also lead tofurther improvements. Regression analyses have shown that temporal trends of de-foliation may also be biased by country (Strand, 1996; Klap et al., 1997; Seidling,2001), which is especially important in the context of retrospective evaluations ofcrown condition data. Data and relationships from alternative methods to the oc-ular assessment of tree crown condition should also be taken into consideration.Data from litter sampling (e.g. Poikolainen and Kubin, 1997; Bille-Hansen andHansen, 2001), needle counts (Innes and Boswell, 1990; Becher, 1999), needletrace recordings (Jalkanen et al., 1994; Sander and Eckstein, 1994; Pouttu andDobbertin, 2000) or indirect measurements of the leaf area index (e.g. Gower andNorman, 1991; Dufrene and Breda, 1995) could reveal substantial relationships be-tween crown condition in terms of defoliation and foliage density or biomass. Thosemethods are often excluded for practical reasons, high costs or the disadvantage ofbeing destructive. An underpinning of the ocular assessments by digital analysisof crown photographs (Mizoue, 1999; Dobbertin and Mizoue, 2000) may not havereached full applicability, especially not in dense stands with frequent overlaps oftree crowns. However, at plots of the intensive Level II monitoring (e.g. De Vrieset al., 1999) such investigations should be envisaged in order to get independentdatasets for the calibration of large-scale Level I defoliation estimates.
All mentioned parameters of these complementary methods are directly relatedto the amount (density) of foliage in a crown or crown transparency, respectively. Asdefoliation denotes the difference between the actual amount of foliage and a theo-retical reference, straight-forward relationships between this measured parametersand estimated defoliation cannot be expected. Therefore, respective relationshipshave to be modelled anyway. The same is true for relationships with morphologicaland other properties of tree crowns (e.g. Hornvedt, 1997; Roloff, 1989).
4.2. MODEL RESULTS WITH RESPECT TO AGE, INSECTS AND FUNGI
Stand age was repeatedly recognised as one of the factors influencing crown con-dition in national or regional studies (e.g. Innes and Boswell, 1988; Hendrikset al., 1994; see Seidling, 2000, for an overview) or international studies (Klap et al.,2000; Seidling, 2001). This relationship was independently corroborated with the

242 W. SEIDLING AND V. MUES
needle-trace method by Pouttu and Dobbertin (2000). Even if they could not segre-gate between natural and possible anthropogenic causes for the observed increase ofdefoliation with age, it seems that this relationship is not simply methodologicallycaused. Responsible for this relationship might be age-dependent endogenous pro-cesses as well as effects from environmental stresses accumulating in older stands.
In our model, age turned out to be, in most cases, a second order predictorwith different responses in different countries (respective homogeneity-of-slopescould not be corroborated). For the sake of simplicity, linearity of the underlyingage dependent processes has been assumed, which seemed to be sufficient for thisstudy. For species like Scots pine, where defoliation of older trees is less sensitivetowards increasing age (comp. Figure 4.1-1 in Lorenz et al., 2001), this relationshipcould be refined in future approaches.
Homogeneity-of-slopes of the country-wise age-defoliation relationships couldnot be corroborated revealing country-specific differences. Besides random devi-ations for countries with small numbers of plots, this might primarily be causedby different respective field assessment strategies. Some countries may regard dif-ferent appearances of tree crowns with increasing age as natural and may, there-fore, include it into their reference system (no significant deviation of age trend inTables II–VII from 0), while others may use one reference for all age classes only.
Biotic factors such as activities of phytophageous insects have rarely been in-cluded in integrated approaches. Seidling (2001) found a positive relationship be-tween the occurrences of insects and defoliation in Scots pine in the lowlandsstretching from Flanders to Germany. Kallweit (1999) got a similar result forBrandenburg (north-eastern Germany). This study backs models with infestationsof insects or fungi as additional predictors and their interaction terms with country.They reveal immediate or indirect biotic influences onto crown condition in mostspecies, even if the quality of both estimates have to be considered rather critically.
Possible sources of uncertainty and inaccuracies are different threshold levelsto denote infestations during the assessment, different and unpredictable time-lagsbetween field surveys and feeding activities of insects or the visibility of symptomsfrom fungi infestations. All or some of these reasons may contribute to country-wisesolutions as indicated by significant influences of respective interaction terms withcountry. Nevertheless, due to plot-wise and temporal averaging rough estimatesmight be gained, which reflect at least some of the activities of these biotic agentsonto crown condition. Since both defoliation as well as infestations by insects orfungi are collected at the level of individual trees, a nested approach modellingbiotic infestations already at this lowest level appears to be a reasonable option forfuture approaches.
4.3. GEOSTATISTICAL MODELS AND REGIONALISED PAD
The variograms express the increase in dissimilarity of defoliation with increasingspatial distance caused by all those factors that are not regarded by the linear

MODELLING OF PRELIMINARILY ADJUSTED DEFOLIATION 243
models with age and all country-specific peculiarities as predictors. Therefore, thegeostatistical models do not describe the effect of any single factor onto the observedrealisation of defoliation.
The nugget variances embrace all variability of defoliation at least below theminimum spatial resolution of 16 by 16 km which includes methodologically causedvariability at the plot level as well (Atkinson, 1997). In spite of the systematicsampling scheme, this minimum resolution is often not realized. This leads to avarying sampling intensity and to large areas with low densities of points of support(Atkinson, 1997). Geostatistical approaches over smaller geographical regions mayminimise nugget effects, however, lose its overview character at the European scale.
In Norway spruce the largest nugget effect is observed, which is close to to-tal spatial independence. Pinus sylvestris, the species with the largest geographicdistribution, shows a stronger autocorrelation, however, the range where spatial au-tocorrelation is effective is with 55 km, even smaller than in spruce. For both speciesthe ranges suggest a rather small-scale variation of defoliation possibly based onregionally acting forces such as geological, climatic or biotic factors. Both call forthe inclusion of such parameters in further approaches, when available. The spatialvariability of defoliation in Fagus sylvatica, the species with the smallest nuggeteffect, and in Quercus robur et petraea are 2.5 to 4 times as wide. Crown conditionof both deciduous species is obviously governed by factors acting at a considerablylarger scale. The reason for the even wider range of Pinus pinaster is up to nowunclear.
Variogram analyses with defoliation data have been only sporadically published.In the United Kingdom, Innes and Boswell (1989) got empirical variograms withmostly pure nugget effects or pure overall trends. Ghosh et al. (1997) performeda spatial analysis with yearly plot averages and trends at the European level. Theyfound spatial autocorrelation over distances of c. 50 km for all species mergedtogether, which is almost equal to the results for Pinus sylvestris in this study.Because they did not adjust for country-specific differences, the resulting mapshows distinct border effects. Nevertheless, some regions with elevated defoliationlike the Trøndelag region in Norway, Upper Silesia in Poland or parts of southernRomania are in accordance with our findings.
In spite of all limitations discussed above, maps of PAD give – on a continentalscale – a more objective picture, not or at least less biased by methodologicaldifferences between the participating countries (cf. Landmann and Bouhot-Delduc,1995) and/or age effects than maps with unprocessed plot-wise mean defoliationvalues.
PAD maps for Fagus sylvatica and Quercus robur et petraea (Figures 4, 5)are generally patchy at a medium scale from 150 to 250 km corresponding to thehigher ranges of the respective variograms (Figure 1). A substantial interpretationof these patterns is not possible up to now, but might be related to different causesat respective scales. In contrast, the PAD maps for Picea abies and Pinus sylvestrisshow over large areas rather similar levels of PAD and isolated ‘hot spots’ in certain

244 W. SEIDLING AND V. MUES
regions (e.g. for Picea abies in the middle of Norway). The PAD map of Pinuspinaster consists of comparatively scattered regions with distinct within patterns.Because of the discontinuous distribution over large distances any interpretation torespective scales should be done with great care.
Specific observations attract attention. In the medium-altitude mountain rangesof central Germany a ‘hot spot’ for all investigated tree species is observed, probablyindicating phenomena at the regional level such as repeated strong fructificationin beech (e.g. Mather et al., 1995; Gottlein and Pruscha, 1996) or flowering inScots pine (e.g. Innes, 1994), possibly unregistered insect gradations or even sub-national team effects (Ferretti, 1998; Mues and Seidling, 2003). For Quercus roburet petraea as well as for Fagus sylvatica and more restricted for Picea abies, PADshows high values in the south and low values in the north of Romania. For Quercusrobur et petraea and Pinus sylvestris distinct ‘hot spots’ are observed in Poland.For oak, this is supposed to be a reaction to groundwater level disturbances andfor Scots pine a reaction towards high levels of industrial immissions in the UpperSilesian region (Wawrzoniak, personal communication). As in our study, Ewaldet al. (2000) revealed a greater frequency of high defoliation values for Fagussylvatica at the northern fringe of the Alps. Besides influences from insects, theysuppose dry shallow, calcareous but nutrient-poor soils as main cause.
High variogram values for Picea abies at lags greater than 400 km (Figure 1) canmainly be assigned to high PADs in Germany and in the middle of Norway. Whilethe German plot reveals high indices of infestations by insect and fungi as well,the Level I database contains no such notations for the respective plots in Norway.However, Solberg (1999) reports of needle and root affecting fungi (Chrysomyxaabietis, Heterobasidion annosum) being quite common in the respective Trøndelagregion. This calls not only for the inclusion of further meaningful parameters in thebasic statistical model, but also for consultations of experts at the national level.As many other countries attaining the Level I monitoring underline the importanceof biotic agents for crown condition (cf. national reports in Lorenz et al., 2001), itsadequate parametrisation and consideration should be one of the proximate steps.
The findings emphasise the usefulness of the PAD but underline its preliminarystatus. The iterative inclusion of further relationships should successively depictthose regions with high unexplained defoliation. Discussions with national expertsshould improve the statistical models by denominating new explanatory variables.This runs out to a fruitful combination of explorative statistical modelling andapplied geostatistics.
Acknowledgements
We thank Mathias Dobbertin, and both WSL Birmensdorf, Wolf-Ulrich Kriebitzschand Martin Lorenz, BFH Hamburg for fruitful comments on earlier versions of thispaper as well as two anonymous referees.

MODELLING OF PRELIMINARILY ADJUSTED DEFOLIATION 245
References
Aas, G.: 1998, ‘Morphologische und okologische Variation mitteleuropaischer Quercus-Arten: EinBeitrag zum Verstandnis der Biodiversitat’, IHW-Verlag, Eching, 221 S.
Anonymus: 1987, ‘Council Regulation (EEC) No. 1696/87 laying down certain detailed rules forthe implementation of Council Regulation (EEC) No. 3528/86 (inventories, network, reports)’,Official Journal of the European Communities L161/1 of 22 June 1987, 22 p.
Anonymus: 2001, ‘ Bericht uber den Zustand des Waldes 2000’, BMVEL (Bundesministerium furVerbraucherschutz, Ernahrung und Landwirtschaft) , Bonn, 79 p.
Atkinson, P. M.: 1997, ‘Scale and Spatial Dependence’, in P. R. van Gardingen, G. M. Foody and P.J. Curran (eds), Scaling-up – from Cell to Landscape, Cambridge University Press, Cambridge,35–60.
Becher, G.: 1999, Waldzustandsanalyse mit multivariaten Verfahren , Springer, Berlin, Heidelberg,312 p.
Bille-Hansen, J. and Hansen, K.: 2001, ‘Relation between defoliation and litterfall in some DanishPicea abies and Fagus sylvatica stands’, Scand. J. For. Res. 16, 127–137.
Bussotti, F., Gerosa, G., Cenni, E., Cozzi, A., Ferretti, M., Bettini, D. and Nibbi, R.: 2001, ‘Le con-dizioni delle chiome nei boschi italiani: risultati 1997–2000 (Crown condition in Italian forests.Results 1997–2000)’, Materiali di lavoro della sezione di botanica forestale e ambientale, Di-partimento di Biologia Vegetale dell Universita di Firenze, Edizioni Tipografia Coppini, 16 p.
Bussotti, F., Gerosa, G., Cenni, E., Cozzi, A., Ferretti, M., Bettini, D. and Nibbi, R.: 2003, ‘Crowncondition surveys in Italian forests: Issues in reporting findings’, Environ. Monit. Assess. 85,221–238.
Cressie, N.: 1991, Statistics for Spatial Data , Wiley, New York.De Vries, W., Reinds, G. J., Deelstra, H. D., Klap, J. M. and Vel, E. M.: 1999, ‘Intensive Monitoring
of Forest Ecosystems in Europe. Technical Report 1999’, United Nations Economic Commissionfor Europe, European Commission, Geneva, Brussels, 173 p.
De Vries, W., Klap, J. and Erisman, J. W.: 2000, ‘Effects of environmental stress on forest crowncondition in Europe. Part I: Hypotheses and approach to the study’, Water, Air, Soil Pollut 119,317–333.
Dobbertin, M., Landmann, G., Pierrat, J. C. and Muller-Edzards, C.: 1997, ‘Quality of Crown Condi-tion Data’, in C. Muller-Edzards, W. de Vries and J. W. Erisman (eds), Ten Years of MonitoringForest Condition in Europe, United Nations Economic Commission for Europe, European Com-mission, Geneva, Brussels, pp. 7–22.
Dobbertin, M. and Mizoue, N.: 2000, ‘Mit dem Computerprogramm CROCO die Kronenverlichtungerfassen’, Eidgenossische Forschungsanstalt WSL. Informationsblatt Forschungsbereich Wald2/2000, 5–6.
Dufrene, E. and Breda, N.: 1995, ‘Estimation of deciduous forests leaf area index using direct andindirect methods’, Oecologia 104, 156–162.
Ellenberg, H.: 1996, ‘Botanical aspects of landscape ecology with outlooks on forest dieback’, Progr.Botany 57, 1–16.
Ewald, J., Reuther, M., Nechwatal, J. and Lang, K.: 2000, ‘Monitoring von Schadenin Waldokosystemen des bayerischen Alpenraumes’, Bayerisches Staatsministerium furLandesentwicklung und Umweltfragen, Materialien 155, 235 p.
Ferretti, M.: 1998, ‘Potential and limitations of visual indices of tree condition’, Chemosphere 36,1031–1036.
Ghosh, S., Landmann, G., Pierrat, J. C. and Muller-Edzards, C.: 1997, ‘Spatio-temporal Variation inDefoliation’, in C. Muller-Edzards, W. de Vries and J. W. Erisman (eds), Ten Years of Monitor-ing Forest Condition in Europe, United Nations Economic Commission for Europe, EuropeanCommission, Brussels, Geneva, pp. 35–50.

246 W. SEIDLING AND V. MUES
Gottlein, A. and Pruscha, H.: 1996, ‘Der Einfluß von Bestandeskenngroßen, Topographie, Standortund Witterung auf die Entwicklung des Kronenzustandes im Bereich des Forstamtes Rothenbuch’,Forstw. Cbl. 115, 146–162.
Gower, S. T. and Norman, J. M.: 1991, ‘Rapid estimation of leaf area index in conifer and broad-leafedplantations’, Ecology 72, 1896–1900.
Hendriks, C. M. A., de Vries, W. and van den Burg, J.: 1994, ‘Effects of acid deposition on 150 foreststands in the Netherlands’, DLO Winand Staring Centre for Integrated Land, Soil and WaterResearch, Wageningen, Report 69(2), 55 p.
Hornvedt, R.: 1997, ‘Relationship between visually assessed crown density and measured foliagedensity, and between visually assessed crown colour and measured chlorophyll content in matureNorway spruce’, Aktuelt fra Skogforsk (Ås) 10/97, 23–25.
Innes, J. L.: 1988, ‘Forest health surveys: Problems in assessing observer objectivity’, Can. J. For.Res. 18, 560–565.
Innes, J. L. and Boswell, R. C.: 1988, ‘Forest health surveys 1987. Part 2: analysis and interpretation’,For. Comm. Bull. London 79, 52.
Innes, J. L. and Boswell, R. C.: 1989, ‘Monitoring of forest condition in the United Kingdom 1988’,For. Comm. Bull. London 88, 70.
Innes, J. L. and Boswell, R. C.: 1990, ‘Reliability, presentation and relationships amongst data frominventories of forest condition’, Can. J. For. Res. 20, 790–799.
Innes, J. L., Landmann, G. and Mettendorf, B.: 1993, “Consistency of observations of forest treedefoliation in three European countries’, Environ. Monit. Assess. 25, 29–40.
Innes, J. L.: 1994, ‘The occurrence of flowering and fruiting on individual trees over 3 years and theireffects on subsequent crown condition’, Trees 8, 139–150.
Jalkanen, R. E., Aalto, T. O., Innes, L. J., Kurkela, T. T. and Townsend, I. K. 1994, ‘Needle retentionand needle loss of Scots pine in recent decades at Thetford and Alice Holt, England’, Can. J. For.Res. 24, 863–867.
Kallweit, R. E.: 1999, ‘Monitoring des Waldzustandes in Brandenburg. Das Level 2-Programm alsBestandteil der forstlichen Umweltkontrolle’, Beitr. Forstwirtsch. u. Landsch.okol. 33, 97–102.
Kandler, O. and Innes, J. L.: 1995, ‘Air pollution and forest decline in central Europe’, Environ.Pollut. 90, 171–180.
Klap, J., Voshaar, J. O., de Vries, W. and Erisman, J. W.: 1997, ‘Relationships between CrownCondition and Stress Factors’, in C. Muller-Edzards, W. de Vries, J. W. Erisman (eds), Ten Yearsof Monitoring Forest Conditions in Europe, United Nations Economic Commission for Europe,European Commission, Brussels, Geneva, pp. 277–307.
Klap, J. M., Voshaar, J. O. H., de Vries, W. and Erisman, J. W.: 2000, ‘Effects of environmental stresson forest crown condition in Europe. Part IV: Statistical analysis of relationships’, Water, Air, SoilPollut. 119, 387–420.
Landmann, G. and Bouhot-Delduc, L.: 1995, ‘Ground Monitoring of Crown Condition of ForestTrees in the French Mountains’, in: G. Landmann and M. Bonneau (eds), Forest Decline andAtmospheric Deposition Effects in the French Mountains, Springer, Berlin, Heidelberg, pp. 3–40.
Lorenz, M.: 1993, ‘Die Europaische Waldzustandserfassung’, Z. Okologie u. Naturschutz 2, 245–251.Lorenz, M., Seidling, W., Mues, V., Becher, G. and Fischer, R.: 2001, Forest Condition in Europe:
Results of the 2000 Large-Scale Survey, United Nations Economic Commission for Europe,European Commission, Geneva, Brussels, 103 p. + Annexes.
Mather, R., Freer-Smith, P. and Savill, P.: 1995, ‘Analysis of the changes in forest condition in Britain1989 to 1992’, For. Comm. Bull. 116, HMSO, London.
Mizoue, N.: 1999, ‘Development of Image Analysis Systems for Crown Condition Assessment inForest Health Monitoring’, Dissertation, CROCO, Kyushu University, 89 p.
Mues, V. and Seidling, W.: 2003, Evaluations of the International Cross-Calibration Courses 2001and 2002, United Nations Economic Commission for Europe, Geneva, 78 p.
MODELLING OF PRELIMINARILY ADJUSTED DEFOLIATION 247
Pannatier, Y.: 1996, VARIOWIN, Software for Spatial Data Analysis in 2D, Springer, New York,91 p.
Poikolainen, J. and Kubin, E.: 1997, ‘On the correlation between needle litterfall and defoliation in aScots pine stand and in a Norway spruce stand’, Aktuelt fra Skogforsk (Ås) 10/97, 30–33.
Pouttu, A. and Dobbertin, M.: 2000, ‘Needle-retention and density patterns in Pinus sylvestris in theRhone Valley of Switzerland: Comparing results of the needle-trace method with visual defoliationassessments’, Can. J. For. Res. 30, 1973–1982.
Ripley, B. D.: 1981, Spatial Statistics, Wiley and Sons, New York.Roloff, A.: 1989, ‘Kronenentwicklung und Vitalitatsbeurteilung ausgewahlter Baumarten der
gemaßigten Breiten’, Schriften aus der Forstlichen Fakultat der Univ. Gottingen und derNiedersachsischen Forstlichen Versuchsanstalt 89, 258 p.
Sander, C. and Eckstein, D.: 1994, ‘Reconstruction of the foliation of Picea abies by means of needletraces’, Scand. J. For. Res. 9 , 311–315.
SAS Institute Inc.: 1990, SAS/STAT User’s Guide, 4th ed., SAS Institute Inc., Cary (USA) 1668 p.Schopfer, W. and Hradetzky, J.: 1984, ‘Der Indizienbeweis: Luftverschmutzung maßgebliche Ursache
der Walderkrankung’, Forstw. Cbl. 103, 231–248.Schutt, P. and Cowling, E. B.: 1985, ‘Waldsterben, a general decline of forests in central Europe:
symptoms, development, and possible causes’, Plant Dis. 69, 548–558.Seidling, W.: 2000, Multivariate Statistics within Integrated Studies in Tree Crown Condition in
Europe – An Overview, United Nations Economic Commission for Europe, European Commis-sion, Geneva, Brussels, 56 p. + Annexes.
Seidling, W.: 2001, Integrative Studies on Forest Ecosystem Conditions: Multivariate Evaluations onTree Crown condition for Two Areas with Distinct Deposition Gradients, United Nations EconomicCommission for Europe, European Commission, Flemish Community, Geneva, Brussels, Ghent,88 p.
Solberg, S.: 1999, ‘Crown density changes of Norway spruce and the influence form increased ageon permanent plots in Norway during 1988–97’, Eur. J. For. Path 29, 219–230.
Strand, G. H.: 1996, ‘Detection of observer bias in ongoing forest health monitoring programmes’,Can. J. For. Res. 26, 1692–1696.
Ulrich, B., Mayer, R. and Khanna, P. K.: 1980, ‘Chemical changes due to acid precipitation in aloess-derived soil in central Europe’, Soil Sci. 130, 193–199.
UNECE (United Nations Economic Commission for Europe) 1998, Manual on Methodologies andCriteria for Harmonized Sampling, Assessment, Monitoring and Analysis of the Effects of AirPollution on Forests, UNECE, Hamburg, Geneva.


![[2021] 45 IAC 3.1 Adjusted Gross Income Tax - IN.gov](https://static.fdokumen.com/doc/165x107/631ecbe61aedb9cd850feba1/2021-45-iac-31-adjusted-gross-income-tax-ingov.jpg)