Integration of geostatistical realizations in data assimilation ...
475
A GEOSTATISTICAL APPROACH TO
COAL RESERVE CLASSIFICATIO
by
KEITH D. WIDTCHURCH,1 A.D. STEWART GILLIES 2 A D GEOFFREY D. J T J
ABSTRACT
There is an increasing need for reliable and comparable coalresource data and it is necessary to standardize the traditionalclassification procedures by quantifying the three basic evaluationcriteria of economic feasibility, geologic assurance and recovery.For well documented deposits, geostatistical methods can considerably improve classification quality.
A geostatistically based algorithm for classifiying coalresources within the current Queensland and New South Walescodes has been developed. Application of the method in classifyingresources from a number of seams exhibiting different structuralcharacteristics is assessed. The method is found to giveclassification results which closely reflect the error associated withan estimate of resource quantities based on current sampling densities. It requires a careful geostatistical analysis with emphasis ongeological awareness. Resource category restrictions must be arbitrarily assigned and remain constant for all deposits being compared.Engineering judgement is needed and interpretation may be requiredwith isolated and peripheral blocks.
INTRODUCTION
The economic incentive to assess and classify mineable coalresources so as to enable the calculation of reserve tonnage andgrade has increased significantly with present commodity marketingconditions. Improvements to classification concepts and definitionsare needed as it is recognized that no current practices produceresults which are free of some degree of subjectivity and thereforereadily reproducable. Quantification of geological assurance is amajor difficulty in most classification codes. The magnitude of theerror associated with an estimate of the quantity and quality of aresource needs to be understood. Geostatistics allow calculation ofthe variance of errors associated with an estimate and is a potentially valuable tool for classifying resources on the basis of geological assurance.
A geostatistically based algorithm for classifying coalresources within the framework of the current Queensland and NewSouth Wales codes has been developed. The method is describedand its application in classifying resources from a number of seamsexhibiting different structural characteristics is assessed.
QUEE SLAND AND NEW SOUTH WALESCOAL CLASSIFICATION CODES
A major requirement for any new classification procedure isthat relevant statutory requirements for establishing resource classesneeds to be recognized. Galligan and Mengel (1986) describe thecurrent Queensland and New South Wales codes. Features of thesewhich are relevant to a geostatistical approach include the following:
'Tutorial Fellow in Mining Engineering
2Senior Lecturer in Mining Engineering
'Reader in Mining Engineering,Unive~ity of Queensland, SI. Lucia, Qld. 4067.
(1) Points of Observation.
A point of Observation is an intersection at a known location,of coal bearing strata, which provides information about thestrata by one or more of the following methods:
• Observation, measurement and testing of surface or underground exposures.
• Observation, measurement and testing of borecore.
• Observation and testing of cuttings, and use of downholegeophysical logs of non-cored boreholes.
A point of observation for coal quantity may not be usednecessarily for coal quality. The most reliable quality information is provided by testing of surface or underground exposures or by testing of borecore.
Geophysical techniques such as seismic surveys are not directpoints of observation.
(2) Coal Resources.
Coal Resources are all of the potentially usable coal in adefined area, and are based on points of observation and extrapolations from those points.
(3) Categories of Resources.
(a) Measured Resources.
The points of observation generally should not be more than 1km apart. Where geological conditions are favourable it maybe possible to extrapolate known trends a maximum distanceof 0.5 km from points of observation.
(b) Indicated Resources.
Points of Observation generally should be not more than 2 kmapart Where geological conditions are favourable, it may bepossible to extrapolate known trends a maximum distance of 1km from points of observation.
(c) Inferred Class I Resources.
Points of Observation generally should be not more than 4 kmapart. Extrapolations of trends should extend not more than 2km from points of observation.
THE GEOSTATISTICAL APPROACHTO CLASSIFICATION
SCOPE AND APPUCABll..ITY OF GEOSTATISTICS
The use of geostatistics requires quantitative data and certainminimum restrictions with respect to the number and positions of
~.,.~"'..,- ....
~',
""".'~Il"'I. ....$
PACIfiC RIM CONGRESS 87lWE(j(OLOO'fS'T1'UJC1UlllE.~flOl<O QOU)CC\IJIIT~
olHOfCCINOhIlCSOIFT1oIEPIlQFlC'" ,.....~1.' ~-_ .._--
IDENTIFIED UNDISCOVERED
476
10leo
a: W0°a:~
ffi~ soUJZ"'0~oZ¥l 40UJIt'l0",
15 ....0.<
- 20
PERCENTAGE OF RANGE
(1)
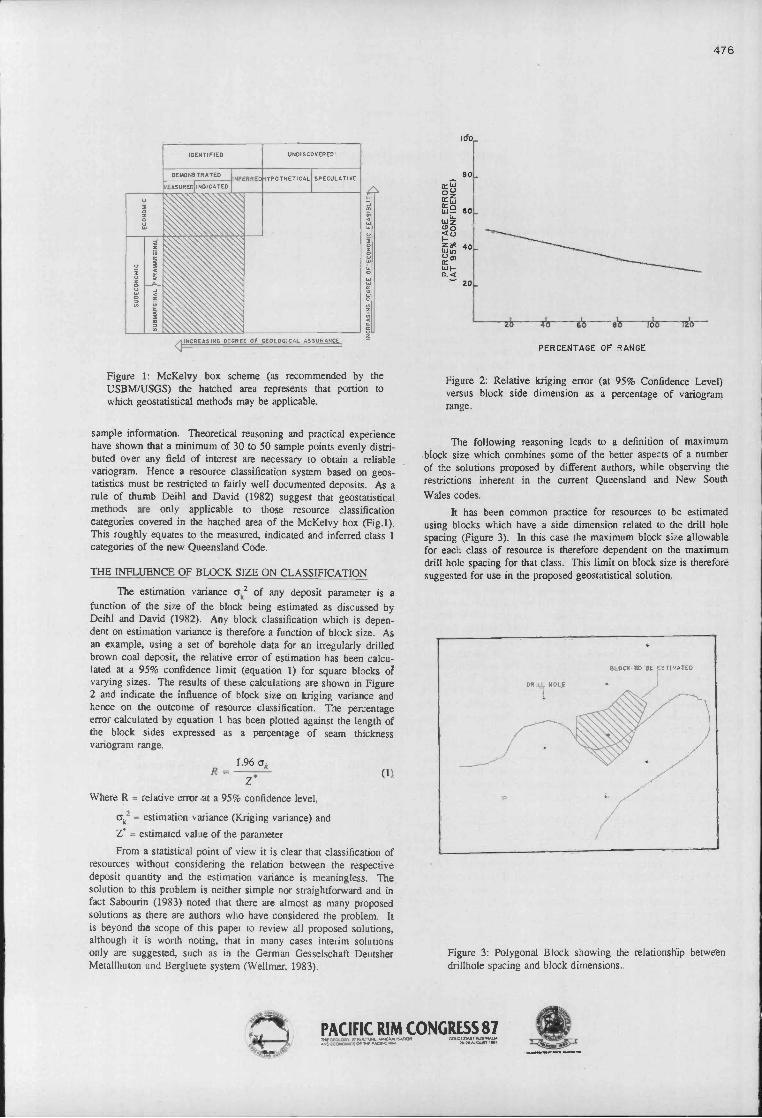
Figure 1: McKelvy box scheme (as recommended by theUSBMlUSGS) the hatched area represents that portion towhich geostatisticaI methods may be applicable.
sample information. Theoretical reasoning and practical experiencehave shown that a minimum of 30 to 50 sample points evenly distributed over any field of interest are necessary to obtain a reliablevariogram. Hence a resource classification system based on geostatistics must be restricted to fairly well documented deposits. As arule of thumb Deihl and David (1982) suggest that geostatisticalmethods are only applicable to those resource classificationcategories covered in the hatched area of the McKelvy box (Fig. 1).This rougWy equates to the measured, indicated and inferred class 1categories of the new Queensland Code.
l1IE INFLUENCE OF BLOCK SIZE ON CLASSlFICATION
The estimation variance crk2 of any deposit parameter is a
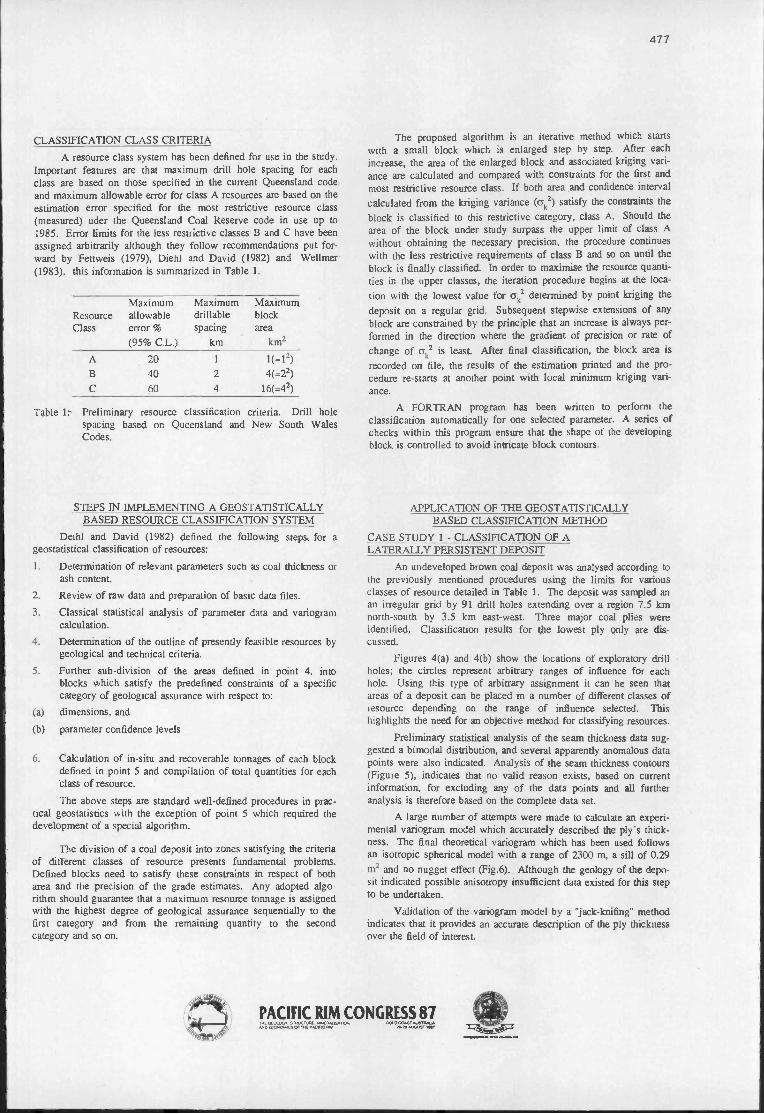
function of the size of the block being estimated as discussed byDeihl and David (1982). Any block classification which is dependent on estimation variance is therefore a function of block size. Asan example, using a set of borehole data for an irregularly drilledbrown coal deposit, the relative error of estimation has been calculated at a 95% confidence limit (equation 1) for square blocks ofvarying sizes. The results of these calculations are shown in Figure2 and indicate the influence of block size on kriging variance andhence on the outcome of resource classification. The percentageerror calculated by equation 1 has been plotted against the length ofthe block sides expressed as a percentage of seam thicknessvariogram range.
1.96 cr.R=--
Z·
Where R = relative error at a 95% confidence level,
crk2
= estimation variance (Kriging variance) and
Z' = estimated value of the parameter
From a statistical point of view it is clear that classification ofresources without considering the relation between the respectivedeposit quantity and the estimation variance is meaningless. Thesolution to this problem is neither simple nor straightforward and infact Sabourin (1983) noted that there are almost as many proposedolutions as there are authors who have considered the problem. It
is beyond the scope of this paper to review all proposed solutions.although it is worth noting, that in many cases interim solutionsonly are suggested, such as in the German Gesselschaft DeutsherMetatlhuton und Bergluete system (Wellmer, 1983).
Figure 2: Relative kriging error (at 95% Confidence Level)versus block side dimension as a percentage of variogramrange.
The following reasoning leads to a definition of maxinnumblock size which combines some of the better aspects of a numberof the solutions proposed by different authors, while observing therestrictions inherent in the current Queensland and New South
Wales codes.
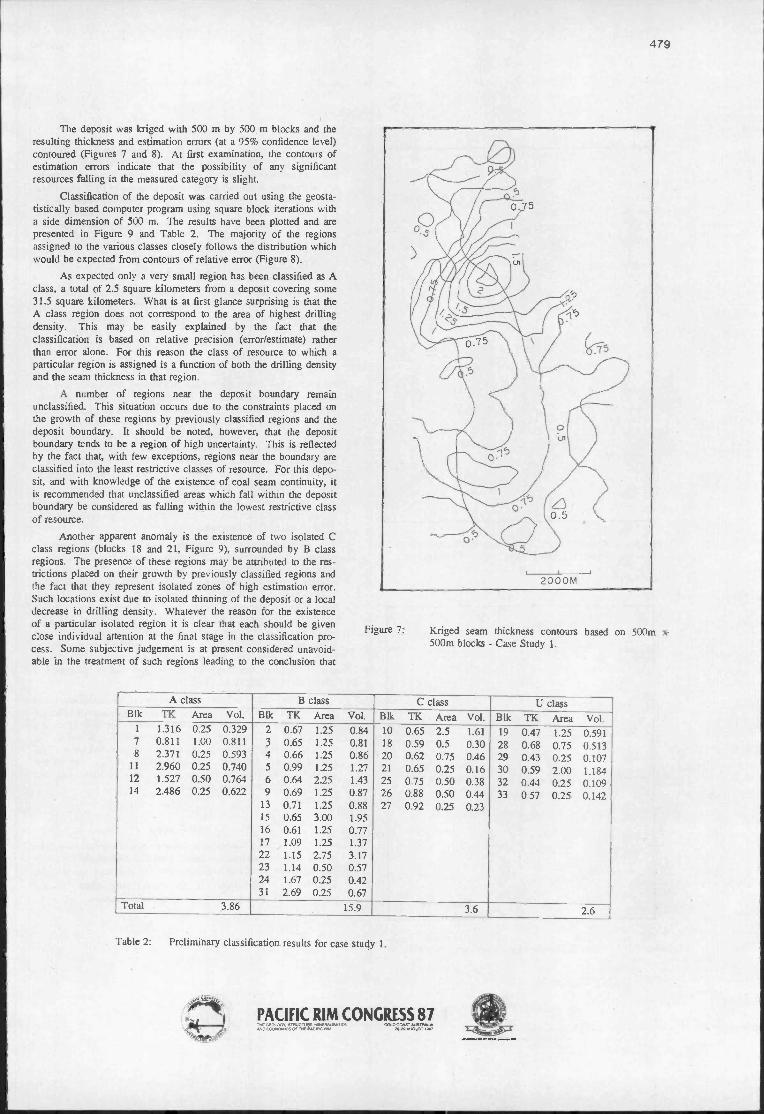
It has been common practice for resources to be estimatedusing blocks which have a side dimension related to the drill holespacing (Figure 3). In this case the maximum block size allowablefor each class of resource is therefore dependent on the maxinnumdrill hole spacing for that class. This limit on block size is thereforesuggested for use in the proposed geostatistical solution.
DRILl HOLE
Figure 3: Polygonal Block showing the relationship betweendriUhole spacing and block dimensions.
g",.!W."'.
h
o......., ..;~ .;:-.l ••~ 0"
PACIfiC RIM CONGRISS 87""GU:Il.OGv~~~ (lOU)COo\ST~NiOfCClNC»olCSorn-:pAQnC'" -.21l1UllfAfl.r ~-----
CLASSIFICATION CLASS CRITERIA
A resource class system has been defined for use in the study.ImJXlnant features are that maximum drill hole spacing for eachclass are based on those specified in the current Queensland codeand maximum allowable error for class A resources are based on theestimation error specified for the most restrictive resource class(measured) uder the Queensland Coal Reserve code in use up to1985. Error limits for the less restrictive classes B and C have beenassigned arbitrarily although they follow recommendations put forward by Fettweis (1979), Diehl and David (1982) and Wellmer(1983). this information is summarized in Table 1.
ResourceClass
A
B
C
Maximumallowableerror %
(95% C.L.)
20
40
60
Maximumdrillablespacing
km
12
4
Maximumblockarea
km2
1(=12)
4(=22)
16(=42)
477
The proposed algorithm is an iterative method which startswith a small block which is enlarged step by step. After eachincrease, the area of the enlarged block and associated kriging variance are calculated and compared with constrajnts for the first andmost restrictive resource class. If both area and confidence interval
calculated from the kriging variance (ak2
) satisfy the constraffits the
block is classified to this restrictive category, class A. Should thearea of the block under study surpass the upper liJnjt of class Awithout obtajning the necessary precision, the procedure continueswith the less restrictive requirements of class B and so on until theblock is finally classified. In order to maximhe the resource quantities in the upper classes, the iteration procedure begins at the loca
tion with the lowest value for a k2 determined by JXlint kriging the
deposit on a regular grid. Subsequent stepwise extensions of anyblock are constrajned by the principle that an increase is always performed in the direction where the gradient of precision or rate of
change of ak
2 is least After final classification, the block area is
recorded on file, the results of the estimation printed and the procedure re-starts at another JXlint with local minimum kriging variance.
Table 1: Preliminary resource classification criteria. Drill holespacing based on Queensland and New South WalesCodes.
STEPS IN IMPLEMENTING A GEOSTATISTICALLYBASED RESOURCE CLASSIFICATION SYSTEM
Deihl and David (1982) defined the following steps for ageostatistical classification of resources:
1. Determination of relevant parameters such as coal thickness orash content
2. Review of raw data and preparation of basic data files.
3. Classical statistical analysis of parameter data and variogramcalculation.
4. Determination of the outline of presently feasible resources bygeological and technical cri teria.
5. Further sub-division of the areas defined in point 4. intoblocks which satisfy the predefined constrajnts of a specificcategory of geological assurance with respect to:
(a) dimensions, and
(b) parameter confidence levels
6. Calculation of in-situ and recoverable tonnages of each blockdefined in point 5 and compilation of total quantities for eachclass of resource.
The above steps are standard well-defined procedures in practical geostatistics with the exception of JXlint 5 which required thedevelopment of a special algorithm.
The division of a coal deposit into zones satisfying the criteriaof different classes of resource presents fundamental problems.Defined blocks need to satisfy these constraints in respect of botharea and the precision of the grade estimates. Any adopted algorithm should guarantee that a maximum resource tonnage is assignedwith the highest degree of geological assurance sequentially to thefirst category and from the remajnmg quantity to the secondcategory and so on.
~.. "
f ....: I,·1,,.. ~II ....
A FORTRAN program has been written to perform theclassification automatically for one selected parameter. A series ofchecks within this program ensure that the shape of the developingblock is controlled to avoid intricate block contours.
An undeveloped brown coal deposit was analysed according tothe previously mentioned procedures using the limits for variousclasses of resource detailed in Table 1. The deposit was sampled anan irregular grid by 91 drill holes extending over a region 7.5 kmnorth-south by 3.5 km east-west. Three major coal plies wereidentified. Classification results for the lowest ply only are discussed.
Figures 4(a) and 4(b) show the locations of exploratory drillholes; the circles represent arbitrary ranges of influence for eachhole. Using this type of arbitrary assignment it can be seen thatareas of a deposit can be placed in a number of different classes ofresource depending on the range of influence selected. Thishighlights the need for an objective method for classifying resources.
Preliminary statistical analysis of the seam thickness data suggested a bimodal distribution, and several apparently anomalous datapoints were also indicated. Analysis of the seam thickness contours(Figure 5), indicates that no valid reason exists, based on currentinformation, for excluding any of the data JXlints and all furtheranalysis is therefore based on the complete data set
A large number of attempts were made to calculate an experimental variogram model which accurately described the ply's thickness. The final theoretical variogram which has been used followsan isotropic spherical model with a range of 2300 m, a sill of 0.29
m2 and no nugget effect (Fig.6). Although the geology of the deposit indicated possible anisotropy insufficient data exhted for thjs stepto be undertaken.
Validation of the variogram model by a "jack-knifing" methodindicates that it provides an accurate description of the ply thicknessover the field of interest.
~-----

478
o
Figure 4(a): Exploratory driUhole locations for Case Study 1showing 500m ranges of influence.
Figure 5: Seam thickness contours - Case Study 1.
,\
'oo
NUGGET 0SILL 0.29RANGE 2300
"I ', ', \I \, \, ,
,f' r "I I / ~I
,/ \ / \/ \ / ",}!2.J.. '.,1 " ,l,' ,f,', " \, ' ' \V ,,~, '10\ j"
I I I ,I \\ I \' \If: R_..",' 1".,
I,,,.. ,, -.."'i
O. )3o
o ''''''
Figure 4(b): Exploratory drillhole locations for Case Study 1showing 250m ranges of influence.
Figure 6: Average variogram for seam thickness - Case Study 1.
PACIFIC RIM CONGRESS 87TlifOlOLOGY S'f'Il,.CTUI'lI~~ QOU)COloIT~
AHOfCQfoIOMlCS~THl"""ClRC"" a.,.N.Jl:JIAT11!17~
The deposit was kriged with 500 m by 500 m blocks and theresulting thickness and estimation errors (at a 95% confidence level)contoured (Figures 7 and 8). At first examination, the contours ofestimation errors indicate that the possibility of any significantresources falling in the measured category is slight.
Classification of the deposit was carried out using the geostatistically based computer program using square block iterations witha side dimension of 500 m. The results have been plotted and arepresented in Figure 9 and Table 2. The majority of the regionsassigned to the various classes closely follows the distribution whichwould be expected from contours of relative error (Figure 8).
As expected only a very small region has been classified as Aclass, a total of 2.5 square kilometers from a deposit covering some31.5 square kilometers. What is at first glance surprising is that theA class region does not correspond to the area of highest drillingdensity. This may be easily explained by the fact that theclassification is based on relative precision (error/estimate) ratherthan error alone. For this reason the class of resource to which aparticular region is assigned is a function of both the drilling densityand the seam thickness in that region.
A number of regions near the deposit boundary remainunclassified. This situation occurs due to the constraints placed onthe growth of these regions by previously classified regions and thedeposit boundary. It should be noted, however, that the depositboundary tends to be a region of high uncertainty. This is reflectedby the fact that, with few exceptions, regions near the boundary areclassified into the least restrictive classes of resource. For this deposit, and with knowledge of the existence of coal seam continuity, itis recommended that unclassified areas which fall within the depositboundary be considered as falling within the lowest restrictive classof resource.
Another apparent anomaly is the existence of two isolated Cclass regions (blocks 18 and 21, Figure 9), surrounded by B classregions. The presence of these regions may be attributed to the restrictions placed on their growth by previously classified regions andthe fact that they represent isolated zones of high estimation error.Such locations exist due to isolated thinning of the deposit or a localdecrease in drilling density. Whatever the reason for the existenceof a particular isolated region it is clear that each should be givenclose individual attention at the final stage in the classification process. Some subjective judgement is at present considered unavoidable in the treatment of such regions leading to the conclusion that
Figure 7:
479
I\0'5
2000M
Kriged seam thickness contours based on 500m x500m blocks - Case Study 1.
A class B class C class U classBlk TK Area Vol. Blk TK Area Vol. Blk TK Area Vol. Blk TK Area Vol.
1 1.316 0.25 0.329 2 0.67 1.25 0.84 10 0.65 2.5 1.61 19 0.47 1.25 0.5917 0.811 1.00 0.811 3 0.65 1.25 0.81 18 0.59 0.5 0.30 28 0.68 0.75 0.5138 2.371 0.25 0.593 4 0.66 1.25 0.86 20 0.62 0.75 0.46 29 0.43 0.25 0.107
11 2.960 0.25 0.740 5 0.99 1.25 1.27 21 0.65 0.25 0.16 30 0.59 2.00 1.18412 1.527 0.50 0.764 6 0.64 2.25 1.43 25 0.75 0.50 0.38 32 0.44 0.25 0.10914 2.486 0.25 0.622 9 0.69 1.25 0.87 26 0.88 0.50 0.44 33 0.57 0.25 0.142
13 0.71 1.25 0.88 27 0.92 0.25 0.2315 0.65 3.00 1.9516 0.61 1.25 0.7717 1.09 1.25 1.3722 1.15 2.75 3.1723 1.14 0.50 0.5724 1.67 0.25 0.4231 2.69 0.25 0.67
Total 3.86 15.9 3.6 2.6
Table 2: Preliminary classification results for case study 1.
g.,.~"'.... ,~
h
"}".,,~ ..~, ....;;.
PACIFIC RIM CONGRESS 87fioIEGfOLOO".~r.llN£.l'AUSAT1CII\I OOl.DCQo$IIlIUS~.v«llCONOf.«:SO"fIo4(~AClfICIIItol 2$-2't""l..lGlAT'.'
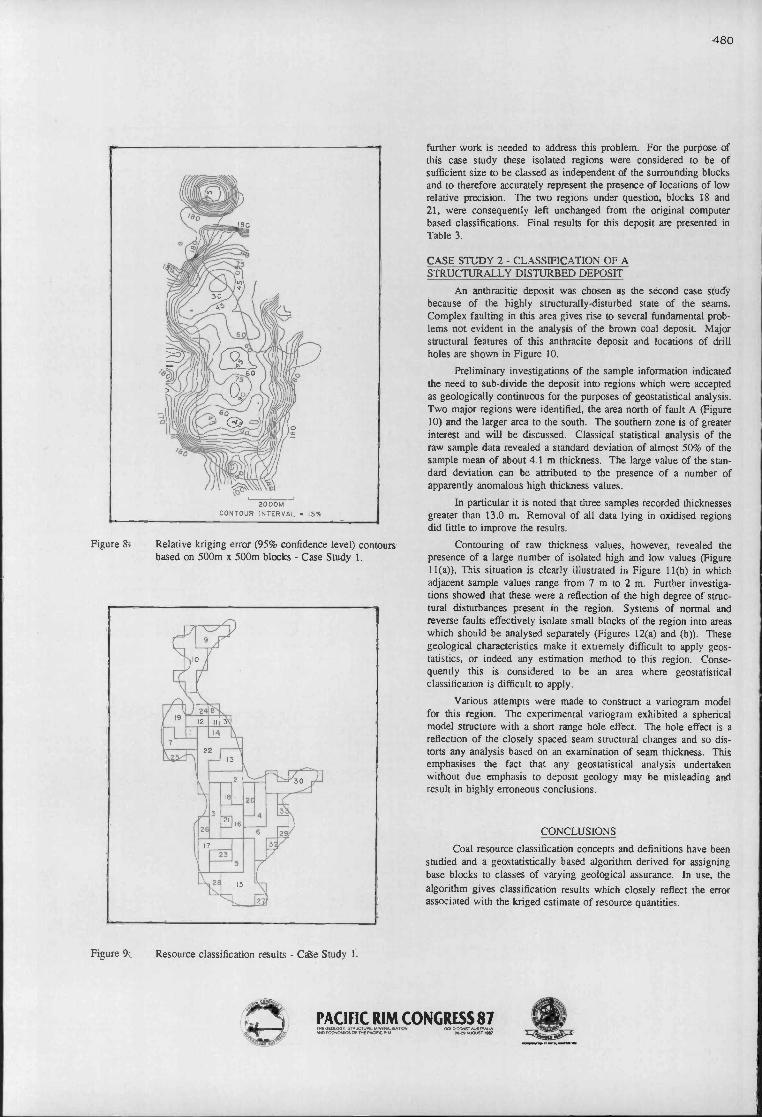
Figure 8:
Figure 9:
2000>.1CONTOUR INTERVAL = 15%
Relative kriging error (95% confidence level) contoursbased on 500m x 500m blocks - Case Study 1.
Resource classification results - Case Study 1.
480
further work is needed to address this problem. For the purpose ofthis case study these isolated regions were considered to be ofsufficient size to be classed as independent of the surrounding blocksand to therefore accurately represent the presence of locations of lowrelative precision. The two regions under question, blocks 18 and21, were consequently left unchanged from the original computerbased classifications. Final results for this deposit are presented inTable 3.
CASE STUDY 2 - CLASSIFICATION OF ASTRUCTURALLY DISTIJRBED DEPOSIT
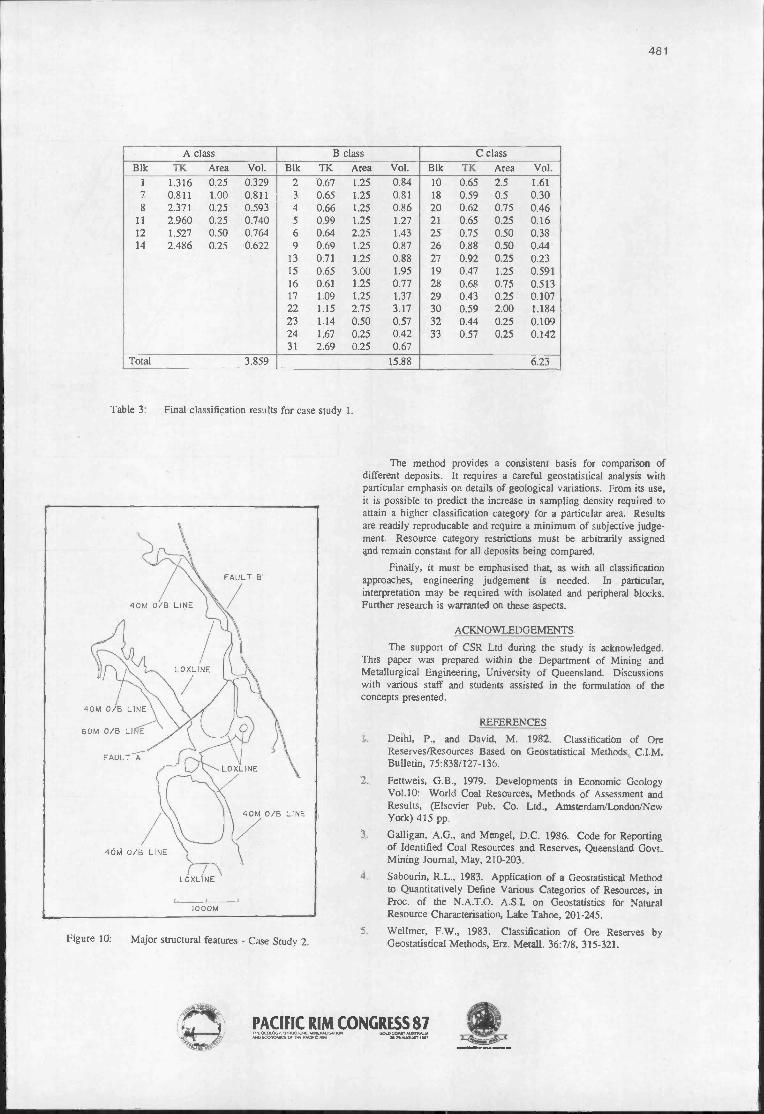
An anthracitic deposit was chosen as the second case studybecause of the highly structurally-disturbed state of the seams.Complex faulting in this area gives rise to several fundamental problems not evident in the analysis of the brown coal deposit Majorstructural features of this anthracite deposit and locations of drillholes are shown in Figure 10.
Preliminary investigations of the sample information indicatedthe need to sub-divide the deposit into regions which were acceptedas geologically continuous for the purposes of geostatistical analysis.Two major regions were identified, the area north of fault A (Figure10) and the larger area to the south. The southern zone is of greaterinterest and will be discussed. Classical statistical analysis of theraw sample data revealed a standard deviation of almost 50% of thesample mean of about 4.1 m thickness. The large value of the standard deviation can be attributed to the presence of a number ofapparently anomalous high thickness values.
In particular it is noted that three samples recorded thicknessesgreater than 13.0 m. Removal of all data lying in oxidised regionsdid little to improve the results.
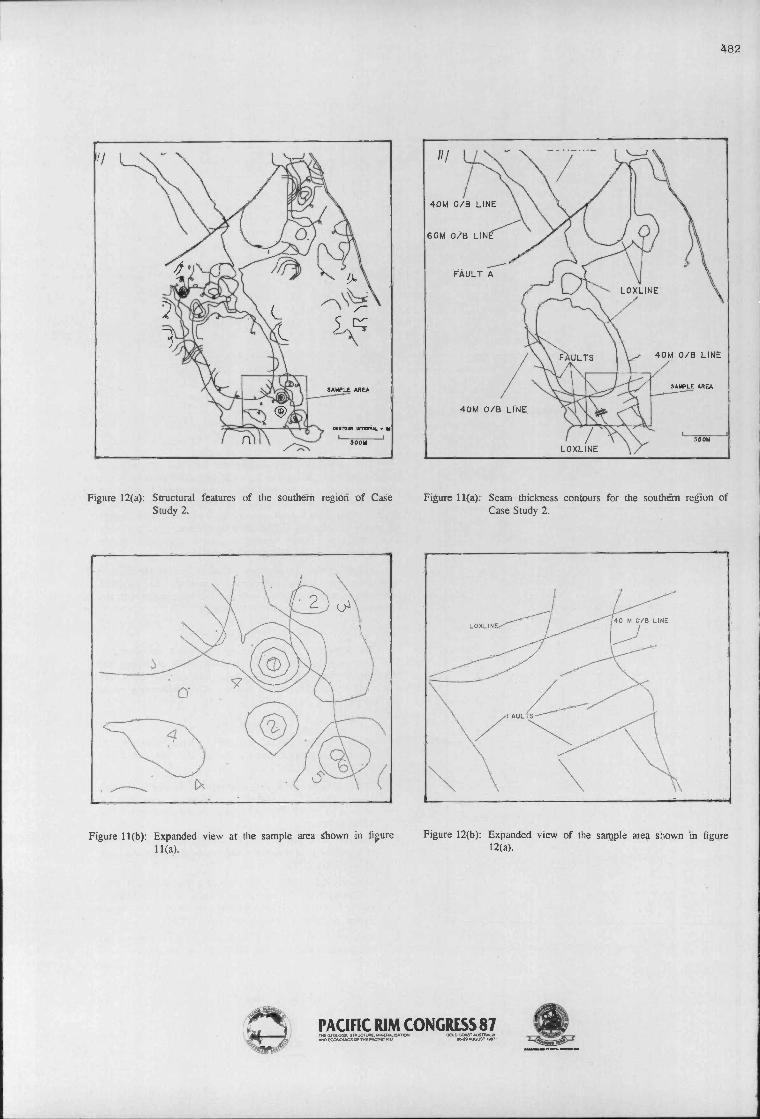
Contouring of raw thickness values, however, revealed thepresence of a large number of isolated high and low values (Figure11(a», This situation is clearly illustrated in Figure l1(b) in whichadjacent sample values range from 7 m to 2 m. Further investigations showed that these were a reflection of the high degree of structural disturbances present in the region. Systems of normal andreverse faults effectively isolate small blocks of the region into areaswhich should be analysed separately (Figures 12(a) and (b». Thesegeological characteristics make it extremely difficult to apply geostatistics, or indeed any estimation method to this region. Consequently this is considered to be an area where geostatisticalclassification is difficult to apply.
Various attempts were made to construct a variogram modelfor this region. The experimental variogram exhibited a sphericalmodel structure with a short range hole effect. The hole effect is areflection of the closely spaced seam structural changes and so distorts any analysis based on an examination of seam thickness. Thisemphasises the fact that any geostatistical analysis undertakenwithout due emphasis to deposit geology may be misleading andresult in highly erroneous conclusions.
CONCLUSIONS
Coal resource classification concepts and definitions have beenstudied and a ge9statistically based algorithm derived for assigningbase blocks to classes of varying geological assurance. In use, the
algorithm gives classification results which closely reflect the errorassociated with the kriged estimate of resource quantities.
PACIFIC RIM CONGRESS 87~~-.~~'""'. 1 ,..;:9~~.
,..G£OlOOV ST"UCt..... ~TJOfoIANO~o-,",,",tQflCtW.I """'''''''''--..,.zt<lll.lOlAT1111
~-_.._--
481
A class B class C class
Blk TK Area Vol. Blk TK Area Vol. Blk TK Area Vol.
1 1.316 0.25 0.329 2 0.67 1.25 0.84 10 0.65 2.5 1.617 0.811 1.00 0.811 3 0.65 1.25 0.81 18 0.59 0.5 0.308 2.371 0.25 0.593 4 0.66 1.25 0.86 20 0.62 0.75 0.46
11 2.960 0.25 0.740 5 0.99 1.25 1.27 21 0.65 0.25 0.1612 1.527 0.50 0.764 6 0.64 2.25 1.43 25 0.75 0.50 0.3814 2.486 0.25 0.622 9 0.69 1.25 0.87 26 0.88 0.50 0.44
13 0.71 1.25 0.88 27 0.92 0.25 0.2315 0.65 3.00 1.95 19 0.47 1.25 0.59116 0.61 1.25 0.77 28 0.68 0.75 0.51317 1.09 1.25 1.37 29 0.43 0.25 0.10722 1.15 2.75 3.17 30 0.59 2.00 1.18423 1.14 0.50 0.57 32 0.44 0.25 0.10924 1.67 0.25 0.42 33 0.57 0.25 0.14231 2.69 0.25 0.67
Total 3.859 15.88 6.23
Table 3: Final classification results for case study 1.
40M 0/8 LINE
REFERENCES
1. Deihl, P., and David, M. 1982. Classification of OreReservesfResources Based on Geostatistica1 Methods, C.I.M.Bulletin,75:838/127-136.
ACKNOWLEDGEMENTS
The support of CSR Ltd during the study is acknowledged.This paper was prepared within the Department of Mining andMetallurgical Engineering, University of Queensland. Discussionswith various staff and students assisted in the formulation of theconcepts presented.
Fettweis, G.B., 1979. Developments in Economic GeologyVol.lO: World Coal Resources, Methods of Assessment andResults, (Elsevier Pub. Co. Ltd., ArnsterdamlLondonlNewYork) 415 pp.
Galligan, A.G., and Mengel, D.C. 1986. Code for Reportingof Identified Coal Resources and Reserves, Queensland Govt.Mining Journal, May, 210-203.
Sabourin, R.L., 1983. Application of a Geostatistical Methodto Quantitatively Define Various Categories of Resources, inProc. of the N.A.T.O. A.S.l. on Geostatistics for NaturalResource Characterisation, Lake Tahoe, 201-245.
Wellmer, F.W., 1983. Classification of Ore Reserves byGeostatistical Methods, En. Metall. 36:7/8, 315-321.
The method provides a consistent basis for comparison ofdifferent deposits. It requires a careful geostatistical analysis withparticular emphasis on details of geological variations. From its use,it is possible to predict the increase in sampling density required toattain a higher classification category for a particular area. Resultsare readily reproducable and require a minimum of subjective judgement Resource category restrictions must be arbitrarily assignedand remain constant for all deposits being compared.
Finally, it must be emphasised that, as with al1 classificationapproaches, engineering judgement is needed. In particular,interpretation may be required with isolated and peripheral blocks.Further research is warranted on these aspects.
5.
4.
2.
3.
40M 0/8 LINE
/
1000M
Major structural features - Case Study 2.Figure 10:
'.PACIFIC RIM CONGRESS 87'HfOf:0l.0GV5TJ'UCl\.I'IE.~1'lON CJOUle:a-.5f.lll.lll'l'JWJ4Ii#iO~OI'TNEflACJAC_ -.a~1.7
~-_.._--
482
1/
!J.\b"'\r
~~
,u.wu: Aft[A
..-n", WTW't'M. ••
500..
11/
40M 0/8 LINE
40"1 0/8 LINE
SA"t[ AREA
'0011
Figure 12(a): Structural features of the southern region of CaseStudy 2.
Figure l1(a): Seam thickness contours for the southern region ofCase Study 2.
~FAULT~
/ ~
\
e:;
.J
~f><-, ..------......
Figure 11(b): Expanded view at the sample area shown in fi~ure
11(a).Figure 12(b): Expanded view of the sample area shown in figure
12(a).
g,.'.".....h.. ......
f>~....
CI'~ • l. • ..!f·
PACIFIC RIM CONGRESS 87fl4fOla..oov_STMJCTUIlE.~~ OOlOC';Il)l$1'~
,.,.,EO:lNC)t,IICSOI"ntl'P'AQAClWol -.a~1"1 ~
Copyright © 2022 FDOKUMEN