Below-ground competitiveness of adult beech and spruce trees
Upload
independentCategory
view
0download
0
Stand age-related effects on soil respiration in a firstrotation Sitka spruce chronosequence in central Ireland
G U S T AV O S A I Z *, K E N N E T H A . B Y R N E w , K L A U S B U T T E R B A C H - B A H L z,R A L F K I E S E z, V I O R E L B L U J D E A § and E D WA R D P. FA R R E L L *
*Forest Ecosystem Research Group, Department of Environmental Resource Management, Faculty of Agriculture, University
College Dublin, Dublin, Ireland, wCentre for Hydrology, Micrometeorology and Climate Change, Department of Civil and
Environmental Engineering, University College Cork, Cork, Ireland, zAtmospheric and Environmental Research Institute for
Meteorology and Climate Research, Karlsruhe, Garmisch-Partenkirchen, Germany, §Forest Research and Management Institute,
Bucharest, Romania
Abstract
The effect of stand age on soil respiration and its components was studied in a first
rotation Sitka spruce chronosequence composed of 10-, 15-, 31-, and 47-year-old stands
established on wet mineral gley in central Ireland. For each stand age, three forest stands
with similar characteristics of soil type and site preparation were used. There were no
significant differences in total soil respiration among sites of the same age, except for the
case of a 15-year-old stand that had lower soil respiration rates due to its higher
productivity. Soil respiration initially decreased with stand age, but levelled out in the
older stands. The youngest stands had significantly higher respiration rates than more
mature sites. Annual soil respiration rates were modelled by means of temperature-
derived functions. The average Q10 value obtained treating all the stands together was
3.8. Annual soil respiration rates were 991, 686, 556, and 564 g C m�2 for the 10-, 15-, 31-,
and 47-year-old stands, respectively. We used the trenching approach to separate soil
respiration components. Heterotrophic respiration paralleled soil organic carbon dy-
namics over the chronosequence, decreasing with stand age to slightly increase in the
oldest stand as a result of accumulated aboveground litter and root inputs. Root
respiration showed a decreasing trend with stand age, which was explained by a decrease
in fine root biomass over the chronosequence, but not by nitrogen concentration of fine
roots. The decrease in the relative contribution of autotrophic respiration to total soil CO2
efflux from 59.3% in the youngest stand to 49.7% in the oldest stand was explained by the
higher activity of the root system in younger stands. Our results show that stand age
should be considered if simple temperature-based models to predict annual soil
respiration in afforestation sites are to be used.
Keywords: afforestation, autotrophic respiration, gley soil, heterotrophic respiration, Q10, root biomass,
sitka spruce, soil respiration, stand age
Received 2 May 2005; revised version received 26 July 2005; accepted 3 October 2005
Introduction
Forest ecosystems can act as a sink or as a source of
atmospheric CO2 on the basis of the difference between
the two fluxes of photosynthesis and respiration. The
impact of afforestation of former arable land on ecosys-
tem carbon (C) dynamics needs to be better understood
in order to maximize sequestration of atmospheric C.
In forests, total ecosystem respiration tends to be domi-
nated by soil respiration (Valentini et al., 2000). Soil
respiration is the primary path by which CO2 fixed
by land plants returns to the atmosphere (Raich &
Schlesinger, 1992; Janssens et al., 2001).
There is considerable interest in the effects of forest
management on soil C balance and storage, specifically
on the impact of stand age on soil CO2 efflux (Irvine &
Law, 2002). The influence of stand age on soil respira-
tion varies among studies. Ewel et al. (1986a) suggested
that soil respiration decreased with stand age inCorrespondence: Gustavo Saiz, tel. 1 353 1716 7716,
fax: 1 353 1716 1102, e-mail: [email protected]
Global Change Biology (2006) 12, 1007–1020, doi: 10.1111/j.1365-2486.2006.01145.x
r 2006 The AuthorsJournal compilation r 2006 Blackwell Publishing Ltd 1007

temperate forests, while it increased in tropical and
subtropical forests. Soil respiration within a given stand
is dependent upon both the amount of fine roots and
quality of soil C pools. Therefore, soil respiration will
differ according to the structure and age of the stand
(Klopatek, 2002).
The production of CO2 in the soil is primarily the
result of the autotrophic respiration by live roots and
their associated mycorrhizae, and heterotrophic respira-
tion by microbes oxidizing plant detritus, root exudates
and humified organic matter (Boone et al., 1998; Buch-
mann, 2000; Hanson et al., 2000). Temperature, together
with soil moisture, are the main factors controlling soil
respiration (Raich & Schlesinger, 1992; Kirschbaum,
1995; Davidson et al., 1998). Low or high soil water
contents may limit soil respiration by either drought
stress to microbial communities and root activities or by
limiting oxygen availability due to reduced air diffusion
for decomposition and root maintenance and growth
(Rey et al., 2002). Soil respiration has also been de-
scribed to be influenced by site fertility (Haynes &
Gower, 1995; Maier & Kress, 2000; Butnor et al., 2003).
The factors that control heterotrophic and autotrophic
respiration will determine the contribution of each
component to the total flux. Root respiration has been
reported to be more temperature sensitive than hetero-
trophic respiration (Kirschbaum, 1995; Boone et al.,
1998). In addition to temperature and moisture, root
respiration is strongly influenced by plant photosyn-
thetic activity (Hogberg et al., 2001; Kuzyakov & Cheng,
2001; Bhupinderpal-Singh et al., 2003). The wide range
of values reported (10–90%) on the relative contribution
of the different soil components to the total soil efflux
may be due to the type of ecosystem studied but also to
the various methodologies used (Hanson et al., 2000).
The aim of the present work was to advance in
the understanding of soil C dynamics in forests, in
particular the effect that stand age poses on soil respira-
tion. The specific objectives of our study were as fol-
lows: (1) to determine whether soil respiration varied
with stand age and (2) to separate soil respiration
components using the trenching methodology. In order
to achieve the first objective, we conducted a study on a
first rotation Sitka spruce (Picea sitchensis (Bong.) Carr.)
replicated chronosequence comprising four age classes.
The separation of soil respiration components was
carried out over unreplicated age classes.
Materials and methods
Site characteristics
The forest stands in which the work was conducted are
located in County Laois (521570 N, 71150W), in central
Ireland, at an elevation of 260 m. All the stands were
within a 5 km radius. Average annual precipitation and
air temperature for the region are 804 mm and 9.3 1C,
respectively (30 years average, Met Eireann, Irish Me-
teorological Service). During 2003, the year in which the
study was carried out, the amount of rainfall was
772 mm and the average annual temperature 9.5 1C.
The study sites were pure Sitka spruce first genera-
tion plantations established on former agricultural land.
All stands had reached canopy closure and were char-
acterized by an almost total absence of understory or
herbaceous vegetation. Together, they made up a chron-
osequence ranging from 10 to 47 years of age (Table 1),
with the oldest stand being ready for harvest. Twelve
forest stands were used for this study, three replicates
per stand age. The four stands (1 per age class) over
which total and heterotrophic respiration measure-
ments took place are referred, hereafter, as core sites
and all other sites as reference or replicate sites. These
two additional sites per stand age had the same
Table 1 Characteristics of the Sitka spruce stands over which measurement of total and heterotrophic soil respiration took place
(core sites)
Site
Age
(years)
LAI
(m2 m�2)
Stem density
(trees ha�1)
Basal area
(m2 ha�1)
Yield
class
Litter-humus
layer thickness
(cm)
Soil organic
carbon (%)
Nitrogen
(%)
Phosphorous
(mg L�1
available)
Soil
pH
Dooary 1 10 ND 2300 5.3 16–20 3.5 � 0.2 6.96 � 0.5a 0.627 11.2 4.5
Dooary 2 15 10.5 2366 34.4 20–24 4.1 � 0.2 4.66 � 0.4b 0.418 11.4 4.8
Dooary 3 31 7.2 1083 54.0 16–20 3.2 � 0.2 7.10 � 0.6a 0.599 9.4 4.1
Cullenagh 47 6.5 730 57.0 16–20 2.3 � 0.1 6.86 � 0.8a ND 8.8 3.6
LAI denotes leaf area index. Yield Class represents a potential maximum mean annual aboveground increment in m3 ha�1. Soil
organic carbon (Mean values � SE), Nitrogen, Phosphorous, and pH (pooled samples) measured for A1 soil horizon 8–10 cm
thickness (n 5 15). Different letters between the stands denote significantly different SOC rates (Po0.05). Soil organic carbon content
was analysed by LOI. For more details see (Green et al., submitted). Soil nitrogen content was analysed using the Dumas method.
Phosphorus was determined by the Olsen method, and soil pH was analysed in a 1 : 2 soil–water slurry with an automated system.
1008 G . S A I Z et al.
r 2006 The AuthorsJournal compilation r 2006 Blackwell Publishing Ltd, Global Change Biology, 12, 1007–1020

characteristics for forest management, tree age, soil
type, tree establishment, and yield class as their core
site (with the exception of the 15-year-old core site,
which had a higher yield class than the others). Neither
fertilisation nor drainage works had been carried out
since tree establishment in any of the stands (Coillte
Teoranta, the Irish Forestry Board, pers. comm.). Since
the 10- or 15-year-old stands had not yet reached
thinning stage, stem density was greater than in the
older stands (Table 1). The thickness of litter-humus
layers varied over the sites as it is shown in Table 1.
The soil was classified as low humic (mineral) gleys
in the 10-, 15-, and 31-year-old stands, and as a gleyic
brown earth in the 47-year-old stand. Analyses of their
chemical properties are presented in Table 1.
The two youngest stands had been established along
ripped lines 1 m deep with a separation of 2 m between
them. This technique consists on a ripper mounted on
the tool bar of a tractor that is pulled through the
ground in order to shatter heavy soils and/or break
subsurface pans to improve drainage and tree root
penetration. Surface drains were also created every
50 m across the ripped lines. The older stands were
ploughed at 1.7 m intervals, following the contour lines
of the slope. At the plot level, this created a series of
topographical variations in the form of ridges, furrows,
and undisturbed grounds.
Experimental design
Soil respiration measurements were carried out in three
stands of each age class. Within 30 m� 30 m plots, a
series of 30 PVC circular collars (16 cm diameter) per
stand were inserted into the soil to an average depth of
1.5 cm for measurements of total soil CO2 fluxes. Collars
set at this depth were stable and caused minimal dis-
turbance to shallow fine roots. A stratified random
sampling design for the measurement of soil CO2 fluxes
was put in place on the basis of the degree of distur-
bance made to the soil when trees were established.
Collars were proportionally distributed to the area
occupied by furrows, ridges and undisturbed grounds
to account for morphologically driven differences in soil
respiration since preliminary studies showed that CO2
emissions were higher from furrows (data not shown).
For investigation of heterotrophic respiration, at one of
the 10-, 15-, 31- and 47-year-old stands and next to the
PVC collars, the same number of stainless steel pipes
(16 cm diameter) were driven 30 cm into the soil in
order to exclude tree roots. The first measurements
were not taken until eight months after the collars had
been installed. Subsequently, a correction was made to
account for the overestimation in heterotrophic respira-
tion produced by the decomposition of trenched roots.
Root density within the collars was assumed to be the
same as the average calculated for each stand. To
calculate the flux resulting from roots left within the
pipes, a decay constant of 0.2 year�1 was applied based
on Silver and Miya (2001). However, and as a result of
using such constant for decomposition of trenched
roots, there may be a bias on the seasonal contribution
of heterotrophic and autotrophic respiration. At the
end of the experiment, root exclusion collars were re-
trieved and examined. No root regrowth was observed
underneath these structures.
Soil CO2 flux measurements
Soil respiration measurements were carried out during
2003 on a monthly basis at all core sites and bimonthly
at the replicate sites. At the core sites, soil respiration
measurements were carried out for total and hetero-
trophic respiration at each of the paired sampling points
using two portable infrared gas analysers connected to
soil respiration chambers having a headspace volume of
2250 cm3 (EGM-4 and enlarged SRC-1; PP Systems,
Hitchin, UK). They were fitted with a rubber-foamed
ring cemented to a modified lip of the chamber to
ensure a tight seal with the soil collars. Measurements
of total (RTOT) and heterotrophic (RH) respiration were
carried out simultaneously. The measuring principle is
a closed system which determines the increase in CO2
concentration within the chamber over time. The sys-
tem was calibrated before each sampling day against
CO2 with a nominal concentration of 409 mmol mol�1.
In order to minimize the diel variation in soil respira-
tion, measurements were made between 10:00 and 16:00
hours. On two occasions, 24 h measurements were
carried out. The average values obtained for the 10:00
and 16:00 hours did not differ significantly from the
other 18 h period in both days where the 24 h measure-
ments were taken. Furthermore, an automated soil
respiration system installed at the end of this study
did not show any significant diurnal variations in soil
respiration either (data not shown).
Soil temperature and moisture measurements
Soil temperature at different depths was measured
adjacent to each collar (220 K temperature meter, Jen-
way, Essex, UK). The probe was sequentially inserted
into soil depths of 2, 6, and 10 cm. In addition, soil
temperature was continuously monitored in the 15-year-
old stand using soil temperature probes set up at ground
level, 5, 10, and 30 cm depth (T107 Campbell Scientific
Ltd, Loughborough, UK). The system was set up to
record 30 min average temperatures. Site-specific tem-
peratures were achieved by means of linear regressions
S T A N D A G E - R E L AT E D E F F E C T S O N S O I L R E S P I R A T I O N 1009
r 2006 The AuthorsJournal Compilation r 2006 Blackwell Publishing Ltd, Global Change Biology, 12, 1007–1020

performed between the temperature taken at the time
of measurements in the different stands and the
ones simultaneously recorded by the automatic system.
Giving the physical proximity among all the stands,
regressions were highly correlated (data not shown).
Soil water content within every collar was deter-
mined using a moisture probe (ThetaProbe ML2x,
Delta-T Devices, Cambridge, UK).
Relationships between soil temperature, soil moisture, andsoil respiration
A two parametric exponential function was used to
describe the relationships between soil CO2 fluxes and
soil temperature. The formula is as follows:
y ¼ aebT;
where y is the measured soil CO2 efflux rate, T the
measured soil temperature, being a and b the fitted
parameters obtained using least squares nonlinear
regressions with SigmaPlot V.8.02.
The Q10 values were calculated as follows:
Q10 ¼ e10b;
Standard error for Q10 was calculated as: SE (Q10) 5
Q10 � 10� SE (b).
The response of RTOT to soil water content was
modelled using a polynomial function of the form
RTOT 5y0 1 ax 1 bx2, where RTOT is total CO2 efflux,
x is soil water content in the top 6 cm, and a and b
are fitted parameters.
We developed an equation combining soil tempera-
ture and soil water content to explain the flux. The best
fits were obtained using an equation of the form:
RTOT 5 (a� eb� y)� (cz 1 dz2), where RTOT is total CO2
efflux, y is soil temperature, and z is soil water content
in the top 6 cm; a, b, c, and d are fitted parameters.
Root biomass
In May 2003, between 7 and 15 soil cores per stand age
were retrieved to a depth of 30 cm at the four core sites
with the aid of a root auger (4 cm radius). Beyond this
depth only occasional thick structural roots with a small
number of fine roots were found. Soil samples were
immediately stored at 4 1C and processed within 4 days
of their collection. For this, the different soil horizons
were separated and fine roots were washed and sieved
– using whole sampling material – to detach them from
soil mineral particles. Roots were sorted into three
diameter classes (o1 mm, 1–2 mm and 2–5 mm). Finally,
washed roots were weighed after being oven-dried at
70 1C for 48 h to determine fine root biomass. The C and
nitrogen (N) concentration of roots o1 mm were deter-
mined in a Vario El-III C/N analyzer (Elementar Amer-
icas, Inc. Mt. Laurel, NJ, USA).
The entire root system of six trees per stand age was
excavated to determine coarse root biomass (45 mm
diameter). Subsequently, root subsamples were taken
to determine dry weight.
Statistical analysis
Data sets were tested for normal distribution by the
Kolmogorov–Smirnov test. Correlation analyses were
used to examine relationships between soil respiration
rates and soil temperature and soil moisture. A one-way
repeated-measures ANOVA was performed to compare
soil respiration rates between stands for each stand age.
Post hoc comparisons using Tukey HSD test were con-
ducted to find out which of the sites differed. The same
statistical procedure was used to compare soil respira-
tion rates as well as root biomass between different
stand ages. SPSS 12.0 (SPSS Inc. Chicago, IL, USA) was
used for all statistical analyses.
Results
Annual variation of soil temperature and soil watercontent
No significant differences in mean annual soil tempera-
ture, taken at a depth of 2 cm, were found among stands
or treatments (P40.05). The mean annual soil tempera-
ture at 2 cm depth ranged from 9.1 1C (31-year-old
stand) to 10.1 1C (47-year-old stand). Consistently for
all stand ages, maximum soil temperatures coincided
with minimum soil water contents during the summer
(Fig. 1). In contrast, minimum soil temperatures were
normally accompanied by the highest soil water con-
tents occurring in the year. Volumetric water contents
determined in the first 6 cm of the soil profiles averaged
about 36%, and showed no significant differences
among three of the four stands over the course of the
year (P40.05). However, the 31-year-old stand had 22%
mean soil water content that was significantly lower in
comparison with the rest of the stands. Neither soil
temperature nor soil volumetric water content differed
significantly in stands of the same age (P40.05), nor
there were significant differences in soil temperatures
or soil water contents between total soil respiration and
heterotrophic soil respiration treatments.
Relationships between total soil respiration and stand age
Soil respiration rates measured at the core sites were
compared with the ones obtained at their reference sites
by means one-way repeated-measures ANOVA (Table 2).
1010 G . S A I Z et al.
r 2006 The AuthorsJournal compilation r 2006 Blackwell Publishing Ltd, Global Change Biology, 12, 1007–1020

There were no significant differences (P40.05) among
core sites and their correspondent references in the 10-,
31-, and 47-year-old stands. In the 15-year-old stands,
the core site had significantly lower soil respiration
rates than one of the reference sites (Table 2).
To test for differences in total soil respiration with
stand age, stands of the same age that showed no
significant differences between them were pooled.
The statistical analyses carried out over the different
age classes consistently showed that 10-year-old
sites had significantly higher respiration rates than
31- and 47-year-old sites (Table 2). The significance
of the results did not change with the exclusion or
inclusion of any of the 15-year-old stands. Older stands
did not show significant differences between them
(Table 2).
Total soil respiration (RTOT)
In all core sites, RTOT showed a pronounced seasonal
variation which followed that of soil temperature
(Fig. 1). RTOT values were at their lowest during winter
time. By contrast, values of soil respiration peaked in
late July or early August in all the stands. Subsequently,
soil respiration rates showed a steady decline towards
the end of the year, with the exception of sites where
low soil water content during late summer acted as a
limiting factor for soil CO2 efflux (Fig. 1).
There was a decrease in RTOT with stand age (Table 3).
An analyses of the monthly values obtained at the core
sites showed that only the youngest stand (10-year-old)
was significantly higher (Po0.05) than the 15-, 31-, and
47-year-old stands, whose mean soil respiration rates
were not significantly different from each other
(P40.05) (Table 3).
For each core site, an exponential model was fitted
with soil respiration rates and soil temperatures at
depths of 2, 6, and 10 cm. The temperature depth used
in the regressions was 2 cm (Fig. 2) because it produced
the best fit for the models among all depths. All
relationships were highly significant (Po0.0001). Mod-
els fitted for the core sites explained more of the annual
variation in those stands less limited by soil water
content with r2 values of 0.77, 0.66, 0.56, and 0.79 for
Fig. 1 Seasonal variation of soil CO2 flux, soil temperature and soil water content in the different stand ages. Each measured value
for temperature, water content and soil CO2 flux is the mean of 30 measurements. Error bars are standard errors of the means.
The continuous line represents the modelled flux based on the exponential functions fitted for each stand that are shown in Table 4.
S T A N D A G E - R E L AT E D E F F E C T S O N S O I L R E S P I R A T I O N 1011
r 2006 The AuthorsJournal Compilation r 2006 Blackwell Publishing Ltd, Global Change Biology, 12, 1007–1020

the 10-, 15-, 31-, and 47-year-old stands, respectively
(Table 4).
The polynomial function was found to provide the
best fit for the relationship between total soil CO2 efflux
and soil water content in this study. The resultant fits
were low, with r2 ranging from 0.18 to 0.41. However,
none of the relationships was significant (P40.2 in all
cases). The combined use of soil temperature and soil
water content functions did not improve our capability
to better explain soil CO2 efflux compared with regres-
sions based on temperature only, and are not reported
here.
Daily mean soil temperatures were used to simulate
daily soil CO2 efflux. The mean modelled daily values
were then added up to obtain the annual estimate for
soil CO2 efflux in each stand. Those values were 991,
686, 556, and 564 g C m�2 yr�1 for the 10-, 15-, 31-, and
47-year-old stands, respectively (Table 4). A further
Fig. 1 Continued
Table 2 Mean soil respiration rates (mg CO2-C m�2 h�1) and standard errors for core and reference sites in each stand age
Stand Age
Sites
Core (A) (n 5 6) Reference B (n 5 6) Reference C (n 5 6) Pooled sites (n 5 18)
10-year old 132.4 � 22.4a 124.2 � 26.6a 124.1 � 28.2a 126.9 � 24.7A
15-year old 80.8 � 18.1a 109.8 � 17.8ab 136.2 � 39.9b 123.0 � 24.9AB*
31-year old 59.9 � 17.8a 81.0 � 24.5a 69.8 � 21.7a 71.1 � 16.7B
47-year old 60.1 � 14.5a 65.5 � 12.3a 54.9 � 17.7a 60.7 � 14.0B
*In this case n 5 12 since the 15-year-old core site was significantly different and was not pooled.
Different superscripts in small letters denote significant differences in soil respiration rates between reference and core sites
(Po0.05). Different superscripts in capital letters indicate significant differences between age classes (Po0.05). Data was pooled
from stands of the same age to allow for comparisons between different stand ages.
1012 G . S A I Z et al.
r 2006 The AuthorsJournal compilation r 2006 Blackwell Publishing Ltd, Global Change Biology, 12, 1007–1020

estimate of annual RTOT at each stand age was calcu-
lated by interpolating measured soil respiration be-
tween sampling dates for every day of the year and
then computing the sum to obtain the annual value
(Table 4).
Calculated Q10 values ranged from 3.5 (15-year-old)
to 4.6 (10-year-old). The average Q10 value, calculated
by pooling the core stands, was 3.8. Q10 values calcu-
lated for 6 and 10 cm depth were slightly higher (data
not shown).
Heterotrophic soil respiration (RH)
The youngest stand (10-year-old) had significantly
higher rates of RH (Po0.05) than any of the other age
classes, which showed no significant differences be-
tween them (P40.05) (Table 3). Temperature-based
regressions had the lowest fit in the cooler and appar-
ently more water-limited 31-year-old stand (r2 5 0.27).
Models in other stands explained better the annual
variation with r2 around 0.72 (Table 4). The resultant
Q10 values for this treatment ranged from 2.4 to 3.3.
Likewise, values very close to the ones calculated by
interpolation were obtained by applying models to
estimate annual RH. Estimates of the decomposition
of roots killed by trenching were made as previously
described for each core site (Table 4).
Autotrophic respiration (RA)
Root or autotrophic respiration (RA) was calculated as
the difference in daily mean respiration rates between
total and heterotrophic plots. Our reference to auto-
trophic respiration includes that of live roots, mycor-
rhizae and rhizosphere microbial respiration. Soil
temperatures used for this treatment are the means of
total and heterotrophic plots. In all the stands, RA rates
peaked around mid summer, and reached minimum
values during winter.
Over the year, measured mean RA rate in the young-
est stand was significantly higher (Po0.05) than RA
rates obtained in the older stands. Thus, there was a
decrease in RA with stand age (Table 3). However, RA
rates in the older stands were not statistically different
from each other (P40.05).
Following the same procedure as for the other treat-
ments, exponential functions were fitted for each age
class in the chronosequence. Temperature-based mod-
els could in general explain the annual variation of RA
quite well (Table 4). The contribution RA to RTOT varied
throughout the year as shown in Fig. 3. According to the
variation in the modelled components of soil respira-
tion, the biggest RA contribution to total CO2 fluxes
occurred during the growing season, reaching up to a
contribution of 64% in the 10-year-old stand in late July.
However, during winter time the contribution by RH
and RA were about the same. The contribution of RA to
RTOT for the whole year was calculated by means of
comparing the modelled annual estimates for total
and heterotrophic respiration. Annual contributions of
RA to RTOT ranged from 59.3% for the youngest stand to
49.7% calculated for the oldest stand (Table 4).
Root biomass and N concentration
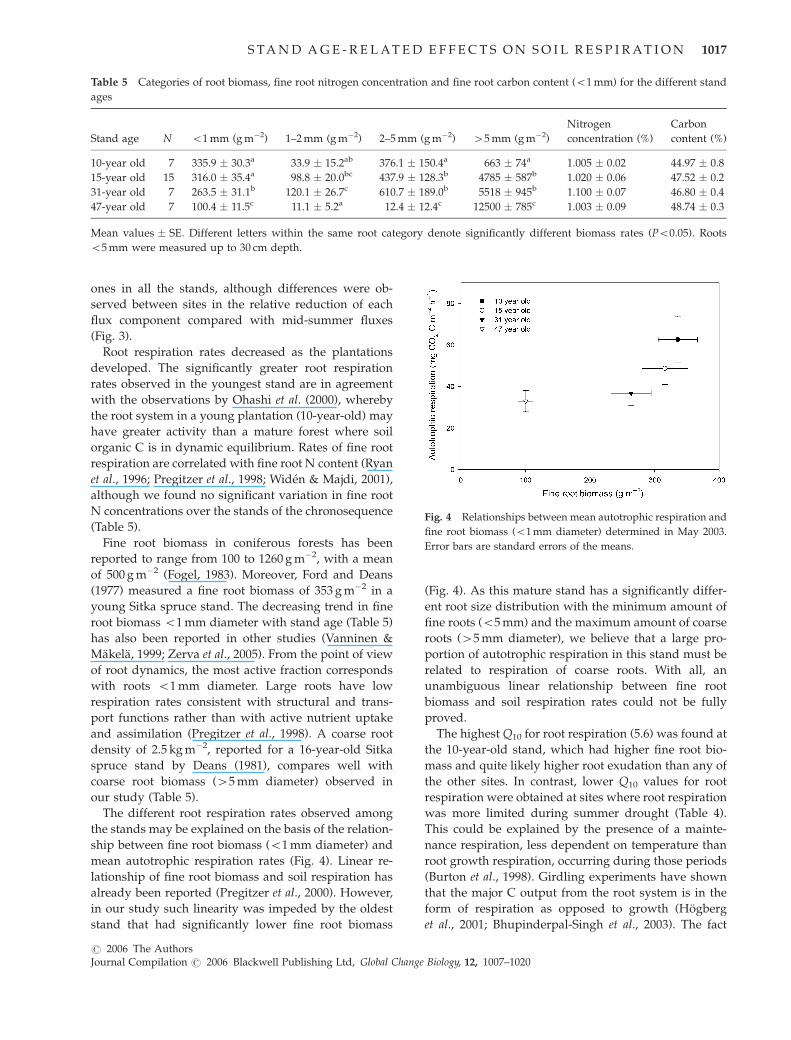
There was a decreasing trend in root biomass o1 mm
diameter over the chronosequence (Table 5). The oldest
Table 3 Mean soil respiration rates (mg CO2–C m�2 h�1) and standard errors for each treatment in the four core sites of the
chronosequence
Treatment n 10-year old 15-year old 31-year old 47-year old
Total 11 111.1 � 16.4a 83.3 � 13.2b 68.7 � 10.3b 68.8 � 11.1b
Heterotrophic 11 48.5 � 5.3a 36.6 � 3.5b 30.1 � 5.5b 35.1 � 5.2b
Autotrophic 11 62.6 � 11.2a 46.7 � 7.8b 38.6 � 6.0b 33.7 � 5.1b
Means and standard errors for the different stand ages are based on n 5 11 sampling dates in which an average of 30 points per
treatment were sampled. Different letters within the same treatment denote significantly different soil respiration rates (Po0.05).
Fig. 2 Relationships between total soil CO2 fluxes and soil
temperature measured at 2 cm for the core Sitka spruce stands.
Each point is the mean of 30 sampling points made per sampling
day. The exponential functions are shown in Table 4.
S T A N D A G E - R E L AT E D E F F E C T S O N S O I L R E S P I R A T I O N 1013
r 2006 The AuthorsJournal Compilation r 2006 Blackwell Publishing Ltd, Global Change Biology, 12, 1007–1020

site had significantly lower values of fine root biomass
in all categories o5 mm, but showed the highest bio-
mass of roots 45 mm. Fine roots were concentrated
close to surface horizons, especially in the litter-humus
layer. N concentration in roots o1 mm showed no
significant differences among all stand ages (Table 5).
Discussion
Relationships between soil respiration and stand age
The analysis of the different stands showed a decrease
of total soil respiration with stand age, which was
significant between the youngest stands (10-year-old)
and the 31- and 47-year-old stands (Table 2). Soil
respiration rates levelled out in the older stands. The
observed decreasing trend in soil respiration with stand
age has also been reported in a Douglas fir plantation,
where a 20-year-old stand had significantly higher soil
respiration rates than a 40-year-old site, although the
latter was not significantly different from an old-growth
stand (Klopatek, 2002). Furthermore, consistently high-
er soil respiration rates were observed in younger
stands than in old ones in a ponderosa pine ecosystem
in Oregon (Law et al., 1999). By contrast, soil respiration
has been reported to increase with stand maturation in
a loblolly pine chronosequence ranging from 1- to 25-
year-old (Wiseman & Seiler, 2004). In a study by Irvine
and Law (2002), contrasting soil respiration patterns
between forest stands hindered attempts to explain the
influence of stand age on soil CO2 efflux. Moreover,
the same fact prevented the use of a simplified single
model to account for seasonal soil respiration at these
sites. For the present study, before direct intercompar-
isons among stands of different ages were made, care
was taken to assure that all the study sites had similar
seasonal respiration patterns.
Stands of the same age showed no significant differ-
ences in total soil respiration among them, except for
the case of 15-year-old sites (Table 2). An analysis of the
inequality observed in the 15-year-old stands shows
that compared with the reference sites, the core site
had lower soil respiration rates than expected for this
forest age. This particular stand had greater productiv-
ity than all the sites under investigation (Table 1).
Moreover, this stand had the highest soil phosphorous
concentration, though C : N ratios were in a range
comparable with those observed at the other sites (Table
1). While on a global scale it is widely accepted that
there is a strong positive correlation between plant
productivity and soil respiration (Janssens et al., 2001;
Davidson et al., 2002), within a given ecosystem, below-
ground C allocation is inversely related to aboveground
productivity and nutrient availability (Haynes &
Gower, 1995). There are several studies reporting that
closed canopy forests have lower soil CO2 emissions on
sites with high fertility than on sites with more re-
stricted nutrient availability (Haynes & Gower, 1995;
Table 4 Relationships between soil respiration rates (mg CO2–C m�2 h�1) and soil temperature ( 1C) measured at 2 cm depth based
on n 5 11 sampling dates in which an average of 30 points per treatment were sampled
Treatment
10-year old 15-year old 31-year old 47-year old
r2 a b r2 a b r2 a b r2 a b
Total 0.77 20.84 0.1537 0.66 21.96 0.1262 0.56 17.11 0.1362 0.79 13.85 0.1442
Heterotrophic 0.72 13.69 0.1197 0.71 14.03 0.0998 0.27 11.04 0.1065 0.70 9.37 0.1200
Autotrophic 0.77 9.41 0.1729 0.67 12.74 0.1242 0.66 8.80 0.1391 0.70 5.46 0.1628
Treatment Q10 Interp Modelled Q10 Interp Modelled Q10 Interp Modelled Q10 Interp Modelled
Total 4.6 � 1.5 1013 991 3.5 � 1.1 692 686 3.9 � 1.9 559 556 4.2 � 1.4 577 564
Heterotrophic 3.3 � 0.9 439 403 (434) 2.7 � 0.5 328 297 (329) 2.9 � 1.9 263 240 (267) 3.3 � 1.1 296 284 (294)
Autotrophic 5.6 � 2.1 574 588 (557) 3.5 � 1.6 364 389 (357) 4.0 � 1.8 296 316 (289) 5.1 � 2.7 281 280 (270)
Autotrophic
contribution
— — 59.3% — — 56.7% — — 56.8% — — 49.7%
For all r2 values, Po0.0001. A two parametric exponential function of the form y 5 ae b T, was used to describe the relationships
between soil CO2 fluxes and soil temperature; a and b parameters are shown. Q10 values calculated from the exponential equation
(Q10 5 e 10b). For calculation of Q10’s standard errors see text. Interpolated and modelled annual fluxes (g C m�2) calculated for each
treatment over the different stand ages. In brackets are the annual estimates before being corrected for decomposition of trenched
roots. Autotrophic contribution is calculated from the difference between annual estimates of total soil respiration and heterotrophic
respiration after correcting for the decomposition of trenched roots.
1014 G . S A I Z et al.
r 2006 The AuthorsJournal compilation r 2006 Blackwell Publishing Ltd, Global Change Biology, 12, 1007–1020

Maier & Kress, 2000; Butnor et al., 2003). For the
differences between the 15-year-old stands in our study,
we hypothesize that higher productivity is the most
likely cause for the apparent low soil CO2 efflux at this
particular site. Additionally, other research work car-
ried out over this chronosequence showed that the
biomass and allocation pattern of this highly productive
site (yield class 20–24) was similar to that of a less
productive stand (yield class 18–20) which was five
years older (Black et al., 2004). In other words, soil
respiration in this core site would be equivalent to that
of an older but less productive stand. This is in agree-
ment with the observed decreasing trend in soil respira-
tion and highlights the confounding effect that site
productivity may exert on the influence of stand age
on soil respiration. Furthermore, it supports the idea
that with increasing soil fertility, soil respiration will be
reduced and the productivity of the growing stock
increased. Reduced soil fertility has been reported to
limit C sequestration (Butnor et al., 2003) and fertilisa-
tion of nutrient poor sites has been reported to decrease
the time for a young plantation to change from a C
source to a C sink (Maier & Kress, 2000).
Total soil respiration
An important fraction of the annual variation in soil
respiration was explained by soil temperature (Table 4).
Soil respiration was strongly influenced by soil moist-
ure when soil water content approached or dropped
below 20% (day of year 235–280) (Fig. 1). The limiting
effect that drought exerts on soil respiration is a feature
well documented in forest ecosystems (Davidson et al.,
1998; Rey et al., 2002). There was generally a good
agreement between measured respiration rates ob-
tained over the different sampling dates and the fitted
exponential equations used with mean daily soil tem-
peratures (Fig. 1). Regression fitness invariably in-
creased if drought related measurements were
discarded from the analysis. Measurements carried
Fig. 3 Seasonal variation of heterotrophic and autotrophic soil CO2 flux measured in the different stand ages. Each measured
heterotrophic CO2 flux is the mean of 30 measurements per sampling date. Error bars are standard errors of the means. The lines
represent the modelled fluxes based on the exponential functions fitted for each stand and treatment that are shown in Table 4.
S T A N D A G E - R E L AT E D E F F E C T S O N S O I L R E S P I R A T I O N 1015
r 2006 The AuthorsJournal Compilation r 2006 Blackwell Publishing Ltd, Global Change Biology, 12, 1007–1020

out during this period were too sparse to infer a model
based on significant limiting soil water content.
The observed decreasing trend in soil respiration
with stand age was well captured by the nonlinear
regressions (Fig. 2). Q10 values in this study ranged
from 3.5 to 4.6, and they are well within the range (2.0–
6.3) reported for other temperate forest ecosystems
(Kirschbaum, 1995; Davidson et al., 1998). A mean Q10
value of 2.72 was reported for four Norway spruce
stands in Germany (Buchmann, 2000). However, this
study was carried out during the growing season only,
and a comparison of Q10’s obtained at different time
scales may be biased.
Annual Q10 of soil respiration is a measure of tem-
perature sensitivity that may mask a combination of
several factors such as plant phenological patterns,
moisture conditions, and perhaps other unknown vari-
ables (Curiel Yuste et al., 2004). However, seasonal
changes in Q10 do not significantly alter the accuracy
of an annual simulated flux (Janssens & Pilegaard,
2003). Annual parameterized models cannot be applied
with confidence over shorter periods because other
factors may be the main drivers of soil CO2 efflux
during such periods (Davidson et al., 1998; Janssens &
Pilegaard, 2003). Temperature-derived functions calcu-
lated in the core sites provided reasonably good annual
estimates of soil respiration compared with interpolated
measurements (Table 4). Our annual estimates fall well
within the summarized values for temperate forest
ecosystems, which range from 250 to 1255 g C m�2
(Raich & Schlesinger, 1992). By contrast, in a recent
study carried out in Sitka spruce in N. England (Zerva
et al., 2005), values reported were generally much lower
than the ones obtained in our research because of the
wet, far less productive sites.
Heterotrophic respiration
Soil CO2 efflux measured at the trenched (unreplicated)
plots had consistently lower rates than the observed
total measurements but showed the same, though less
marked, seasonal pattern, indicating the importance of
temperature on microbial activities (Fig. 3). Microbial
activity was probably limited by the restriction of
soluble organic substrates during summer drought,
which is a feature that has been widely reported (Fahey
et al., 1988; Epron et al., 1999a; Rey et al., 2002).
Calculated Q10 functions (Table 4) agreed well with
the Q10 value of 3.1 at 10 1C obtained in an incubation
experiment using soil from a Sitka spruce plantation
(Fang & Moncrieff, 2001). In common with other stu-
dies, calculated Q10 values for heterotrophic respiration
were consistently lower than the Q10’s obtained for total
respiration which may indicate a lower sensitivity of
microbial respiration to temperature (Kirschbaum,
1995; Boone et al., 1998). However, the use of different
temperature sensitivities for the different soil respira-
tion components has been challenged by recent findings
that attribute this observed difference in field-based
studies to plant photosynthetic activity (Bhupinderpal-
Singh et al., 2003; Baath & Wallander, 2003).
The youngest site had significantly greater decom-
position rates than the other stand ages. This site
together with the 15-year-old stand showed the highest
pH values (Table 1), which is a factor that may have
enhanced microbial decomposition (Dilly & Munch,
1996). Furthermore, these sites presented the thickest
litter-humus layers of all stands studied. These thick
layers contain a large pool of easily decomposable
organic matter. Additionally, annual litter inputs over
the chronosequence showed a decreasing trend with
stand age, while microbial biomass determined by the
fumigation–extraction procedure appeared to be higher
in the youngest stand (B. Reidy, unpublished data). This
latest fact together with the greater availability of or-
ganic C in the topsoil of the 10-year-old stand (Table 1)
may explain its significantly higher microbial respira-
tion as compared with the rest of stands (Table 3). The
relative increase in heterotrophic respiration observed
at the 47-year-old site is probably due to the accumula-
tion of organic matter inputs over the years, mostly in
the litter-humus layer and upper soil horizons. The
decomposition trend observed in this chronosequence
perfectly matches the initial loss and subsequent recov-
ery of soil organic C following afforestation reported in
several studies (Vesterdal et al., 2002; Zerva et al., 2005).
Moreover, a study on soil C stocks carried out in this
chronosequence confirms the same trend as described
above (Green et al., submitted).
Autotrophic respiration
The difference between total and heterotrophic respira-
tion was used to estimate root or autotrophic respira-
tion. Rates of root respiration varied seasonally as a
result of fine root activity. Earlier studies on Sitka
spruce stands in Great Britain indicated that fine root
growth increased with increasing temperatures and that
this relationship could be altered by soil moisture
effects (Deans, 1979). Effectively, the highest rates of
root respiration obtained in our study were consistently
observed at a time of high temperature when soil
moisture was at its highest. In contrast, root respiration
rates declined due to soil water deficits during a period
of relatively high summer temperatures. The effect of
drought on root respiration has been documented (Bur-
ton et al., 1998). During the drought period, autotrophic
respiration rates remained higher than heterotrophic
1016 G . S A I Z et al.
r 2006 The AuthorsJournal compilation r 2006 Blackwell Publishing Ltd, Global Change Biology, 12, 1007–1020
ones in all the stands, although differences were ob-
served between sites in the relative reduction of each
flux component compared with mid-summer fluxes
(Fig. 3).
Root respiration rates decreased as the plantations
developed. The significantly greater root respiration
rates observed in the youngest stand are in agreement
with the observations by Ohashi et al. (2000), whereby
the root system in a young plantation (10-year-old) may
have greater activity than a mature forest where soil
organic C is in dynamic equilibrium. Rates of fine root
respiration are correlated with fine root N content (Ryan
et al., 1996; Pregitzer et al., 1998; Widen & Majdi, 2001),
although we found no significant variation in fine root
N concentrations over the stands of the chronosequence
(Table 5).
Fine root biomass in coniferous forests has been
reported to range from 100 to 1260 g m�2, with a mean
of 500 g m�2 (Fogel, 1983). Moreover, Ford and Deans
(1977) measured a fine root biomass of 353 g m�2 in a
young Sitka spruce stand. The decreasing trend in fine
root biomass o1 mm diameter with stand age (Table 5)
has also been reported in other studies (Vanninen &
Makela, 1999; Zerva et al., 2005). From the point of view
of root dynamics, the most active fraction corresponds
with roots o1 mm diameter. Large roots have low
respiration rates consistent with structural and trans-
port functions rather than with active nutrient uptake
and assimilation (Pregitzer et al., 1998). A coarse root
density of 2.5 kg m�2, reported for a 16-year-old Sitka
spruce stand by Deans (1981), compares well with
coarse root biomass (45 mm diameter) observed in
our study (Table 5).
The different root respiration rates observed among
the stands may be explained on the basis of the relation-
ship between fine root biomass (o1 mm diameter) and
mean autotrophic respiration rates (Fig. 4). Linear re-
lationship of fine root biomass and soil respiration has
already been reported (Pregitzer et al., 2000). However,
in our study such linearity was impeded by the oldest
stand that had significantly lower fine root biomass
(Fig. 4). As this mature stand has a significantly differ-
ent root size distribution with the minimum amount of
fine roots (o5 mm) and the maximum amount of coarse
roots (45 mm diameter), we believe that a large pro-
portion of autotrophic respiration in this stand must be
related to respiration of coarse roots. With all, an
unambiguous linear relationship between fine root
biomass and soil respiration rates could not be fully
proved.
The highest Q10 for root respiration (5.6) was found at
the 10-year-old stand, which had higher fine root bio-
mass and quite likely higher root exudation than any of
the other sites. In contrast, lower Q10 values for root
respiration were obtained at sites where root respiration
was more limited during summer drought (Table 4).
This could be explained by the presence of a mainte-
nance respiration, less dependent on temperature than
root growth respiration, occurring during those periods
(Burton et al., 1998). Girdling experiments have shown
that the major C output from the root system is in the
form of respiration as opposed to growth (Hogberg
et al., 2001; Bhupinderpal-Singh et al., 2003). The fact
Table 5 Categories of root biomass, fine root nitrogen concentration and fine root carbon content (o1 mm) for the different stand
ages
Stand age N o1 mm (g m�2) 1–2 mm (g m�2) 2–5 mm (g m�2) 45 mm (g m�2)
Nitrogen
concentration (%)
Carbon
content (%)
10-year old 7 335.9 � 30.3a 33.9 � 15.2ab 376.1 � 150.4a 663 � 74a 1.005 � 0.02 44.97 � 0.8
15-year old 15 316.0 � 35.4a 98.8 � 20.0bc 437.9 � 128.3b 4785 � 587b 1.020 � 0.06 47.52 � 0.2
31-year old 7 263.5 � 31.1b 120.1 � 26.7c 610.7 � 189.0b 5518 � 945b 1.100 � 0.07 46.80 � 0.4
47-year old 7 100.4 � 11.5c 11.1 � 5.2a 12.4 � 12.4c 12500 � 785c 1.003 � 0.09 48.74 � 0.3
Mean values � SE. Different letters within the same root category denote significantly different biomass rates (Po0.05). Roots
o5 mm were measured up to 30 cm depth.
Fig. 4 Relationships between mean autotrophic respiration and
fine root biomass (o1 mm diameter) determined in May 2003.
Error bars are standard errors of the means.
S T A N D A G E - R E L AT E D E F F E C T S O N S O I L R E S P I R A T I O N 1017
r 2006 The AuthorsJournal Compilation r 2006 Blackwell Publishing Ltd, Global Change Biology, 12, 1007–1020

that photosynthesis co-varies with temperature ex-
plains the high Q10’s for root respiration obtained in
this and in other field-based studies (Baath & Wallan-
der, 2003; Bhupinderpal-Singh et al., 2003).
Contribution of autotrophic and heterotrophic respirationto total CO2 efflux
In all stand ages, the relative contribution of hetero-
trophic and autotrophic respiration to total soil CO2
efflux varied over the year. The largest contribution of
root respiration to total soil flux was during the sum-
mer, up to 64% of total flux in the 10-year-old stand, and
reducing during the early and later part of the year
(Fig. 3). The relative contribution of root respiration to
the total soil efflux was 60% in a beech forest in France
(Epron et al., 1999b). A value of 62% was reported for a
29-year-old Florida slash plantation (Ewel et al., 1986b).
An apparent low value, 23%, has been reported by Rey
et al. (2002), attributing the small contribution of roots to
the coppicing performed the year previous to the ex-
periment. A recent experiment in which the soil was not
disturbed, showed that root respiration was about 50%
of the total respiration and it accounted for up to 65%
during the summer (Bhupinderpal-Singh et al., 2003). A
similar value (51%) was reported in a 80-year-old forest
(Nakane et al., 1983). Additionally, the same author
concluded that when soil organic C is in dynamic
equilibrium in the forest ecosystem, the relative con-
tribution of root respiration to soil respiration may
converge at approximately 50%, which is almost the
value we obtained in the oldest stand that had reached
such equilibrium in soil organic C.
Our results show that there is an age-related effect on
the relative contribution of heterotrophic and auto-
trophic respiration over the chronosequence. Compar-
ison of annual estimates calculated for the different
components of the flux revealed a decreasing trend in
the contribution of autotrophic respiration to total soil
CO2 efflux, ranging from 56.6% in the youngest stand to
as low as 47.9% in the oldest site (Table 4). Similarly, in
an experiment conducted over a boreal black spruce fire
chronosequence, where root trenching was also used to
partition soil respiration components, the highest auto-
trophic contribution was observed in 12–20-year-old
stands, with lower contributions being reported in older
stands (Bond-Lamberty et al., 2004).
Interestingly, the models showed that calculated root
respiration exceeded heterotrophic respiration later in
the year with increasing stand age (Fig. 3). These
differences are likely due to the differential age-related
effects on heterotrophic and autotrophic respiration.
However, due to our inability to account for seasonal
changes on the decomposition of roots left within the
pipes, the seasonal contribution of heterotrophic and
autotrophic respiration may be biased.
Conclusions
Our results show that afforestation of Sitka spruce on
former agricultural land leads to an initial large soil
CO2 efflux that decreases as the stand matures, showing
little change in the later stages prior to felling. Soil
respiration rates were significantly higher in the
younger stands as a result of both the larger availability
of soil organic matter, and the greater activity of their root
system as compared with more mature stands. Auto-
trophic respiration decreased with stand age. Soil C
dynamics throughout the chronosequence levelled out
with stand maturation, as evidenced by the similar
respiration rates in the 31- and 47-year-old stands. The
smaller root respiration observed in the oldest stand
was compensated for by a higher microbial decomposi-
tion activity due to accumulated organic inputs. The
relative contribution of root respiration to total CO2
efflux decreased with stand age.
Temperature-based models used to predict annual
mean soil respiration in afforestation sites should con-
sider the age of the stand. Within a given ecosystem, site
productivity may confound the effects of stand age on
soil respiration. Further research over longer periods
and on different ecosystems is required to validate and
assess the importance of stand age on afforestation sites.
Acknowledgements
We thank Mr. Javier Cubillo and Mr. Ray Byrne for their help insetting-up the sites, Mr. Brian Tobin and Ms. Carly Green forproviding coarse root data and nutrient analyses, and Dr. KevinBlack for provision of climatic data. We gratefully acknowledge(COFORD) the Irish Council for Forestry Research and Devel-opment for provision of funds, and Coillte Teoranta, the IrishForestry Board, for allowing the use of its sites.
References
Baath E, Wallander H (2003) Soil and rhizosphere microorgan-
isms have the same Q10 for respiration in a model system.
Global Change Biology, 9, 1788–1791.
Bhupinderpal-Singh NA, Ottosson LM, Hogberg MN et al. (2003)
Tree root and soil heterotrophic respiration as revealed by
girdling of boreal Scots pine forest: extending observations
beyond the first year. Plant Cell and Environment, 26, 1287–1296.
Black K, Tobin B, Saiz G et al. (2004) Improved estimates of
biomass expansion factors for Sitka spruce. Irish Forestry, 61,
50–65.
Bond-Lamberty B, Wang C, Gower ST (2004) Contribution of root
respiration to soil surface CO2 flux in a boreal black spruce
chronosequence. Tree Physiology, 24, 1387–1395.
1018 G . S A I Z et al.
r 2006 The AuthorsJournal compilation r 2006 Blackwell Publishing Ltd, Global Change Biology, 12, 1007–1020

Boone RD, Nadelhoffer KJ, Canary JD et al. (1998) Roots exert
a strong influence on the temperature sensitivity of soil res-
piration. Nature, 396, 570–572.
Buchmann N (2000) Biotic and abiotic factors controlling soil
respiration rates in Picea abies stands. Soil Biology Biochemistry,
32, 1625–1635.
Burton AJ, Pregitzer KS, Zogg GP et al. (1998) Drought reduces
root respiration in sugar maple forests. Ecological Applications,
8, 771–778.
Butnor JR, Johnsen KH, Oren R et al. (2003) Reduction of forest
floor respiration by fertilization on both carbon dioxide-
enriched and reference 17-year-old loblolly pine stands. Global
Change Biology, 9, 849–861.
Curiel Yuste J, Janssens IA, Carrara A et al. (2004) Annual Q10
of soil respiration reflects plant phenological patterns as
well as temperature sensitivity. Global Change Biology, 10,
161–169.
Davidson EA, Belk E, Boone RD (1998) Soil water content and
temperature as independent or confounded factors controlling
soil respiration in a temperate mixed hardwood forest. Global
Change Biology, 4, 217–227.
Davidson EA, Savage K, Bolstad P et al. (2002) Belowground
carbon allocation in forests estimated from litterfall and IRGA-
based soil respiration measurements. Agricultural and Forest
Meteorology, 113, 39–51.
Deans JD (1979) Fluctuations of the soil environment and fine
root growth in a young Sitka spruce plantation. Plant and Soil,
52, 195–208.
Deans JD (1981) Dynamics of coarse root production in a young
plantation of Picea sitchensis. Forestry, 54, 139–155.
Dilly O, Munch J-C (1996) Microbial biomass content, basal
respiration and enzyme activities during the course of
decomposition of leaf litter in a black alder (Alnus gluti-
nosa (L.) Gaertn.) forest. Soil Biology Biochemistsry, 8,
1073–1081.
Epron D, Farque L, Lucot E et al. (1999a) Soil CO2 efflux in a
beech forest: dependence on soil temperature and soil water
content. Annals of Forest Science, 56, 221–226.
Epron D, Farque L, Lucot E et al. (1999b) Soil CO2 efflux in a
beech forest: the contribution of root respiration. Annals of
Forest Science, 56, 289–295.
Ewel KC, Cropper WP, Gholz HL (1986a) Soil CO2 evolution in
Florida slash pine plantations. I. Changes through time. Cana-
dian Journal of Forest Research, 17, 325–329.
Ewel KC, Cropper WP, Gholz HL (1986b) Soil CO2 evolution in
Florida slash pine plantations. II. Importance of root respira-
tion. Canadian Journal of Forest Research, 17, 330–333.
Fahey TJ, Hughes JW, Pu M et al. (1988) Root decomposition and
nutrient flux following whole-tree harvest of northern hard-
wood forest. Forest Science, 34, 744–768.
Fang C, Moncrieff JB (2001) The dependence of soil CO2 efflux on
temperature. Soil Biology Biochemistry, 33, 155–165.
Fogel R (1983) Root turnover and productivity of coniferous
forests. Plant and Soil, 71, 75–85.
Ford ED, Deans JD (1977) Growth of a Sitka spruce plantation:
spatial distribution and seasonal fluctuations of lengths,
weights and carbohydrate concentrations of fine roots. Plant
and Soil, 47, 463–485.
Green C, Saiz G, Avitabile V et al. Soil and forest floor organic
carbon stocks in a chronosequence of Sitka spruce. Forest
Ecology and Management. submitted.
Hanson PJ, Edwards NT, Garten CT et al. (2000) Separating root
and soil microbial contributions to soil respiration: a review of
methods and observations. Biogeochemistry, 48, 115–146.
Haynes BE, Gower ST (1995) Belowground carbon allocation in
unfertilized and fertilized red pine plantations in northern
Wisconsin. Tree Physiology, 15, 317–325.
Hogberg P, Nordgren A, Buchmann N (2001) Large-scale forest
girdling shows that current photosynthesis drives soil respira-
tion. Nature, 411, 789–792.
Irvine J, Law BE (2002) Contrasting soil respiration in young and
old-growth ponderosa pine forests. Global Change Biology, 8,
1183–1194.
Janssens IA, Lankreijer H, Matteucci G et al. (2001) Productivity
overshadows temperature in determining soil and ecosystem
respiration across European forests. Global Change Biology, 7,
269–278.
Janssens IA, Pilegaard K (2003) Large seasonal changes in Q10 of soil
respiration in a beech forest. Global Change Biology, 9, 911–918.
Kirschbaum MUF (1995) The temperature dependence of soil
organic matter decomposition, and the effect of global warming
on soil organic C storage. Soil Biology Biochemistry, 27, 753–760.
Klopatek JM (2002) Belowground carbon pools and processes in
different age stands of Douglas-fir. Tree Physiology, 22, 197–204.
Kuzyakov Y, Cheng W (2001) Photosynthesis controls of rhizo-
sphere respiration and organic matter decomposition. Soil
Biology Biochemistry, 33, 1915–1925.
Law BE, Ryan MG, Anthoni PM (1999) Seasonal and annual
respiration of a ponderosa pine ecosystem. Global Change
Biology, 5, 169–182.
Maier CA, Kress LW (2000) Soil CO2 evolution and root respira-
tion in 11 year old loblolly pine (Pinus taeda) plantations as
affected by moisture and nutrient availability. Canadian Journal
of Forest Research, 30, 347–359.
Nakane K, Yamamoto M, Tsubota H (1983) Estimation of root
respiration rate in a mature forest ecosystem. Japanese Journal of
Ecology, 33, 397–408.
Ohashi M, Gyokusen K, Sato A (2000) Contribution of root
respiration to total soil respiration in a Japanese cedar (Cryp-
tomeria japonica D. Don) artificial forest. Ecological Research, 15,
323–333.
Pregitzer KS, Laskowski MJ, Burton AJ et al. (1998) Variation in
sugar maple root respiration with root diameter and soil
depth. Tree Physiology, 18, 665–670.
Pregitzer KS, Zak DR, Maziasz J et al. (2000) Interactive effects
of atmospheric CO2, and soil-N availability on fine roots of
Populus tremuloides. Ecological Applications, 10, 18–33.
Raich JW, Schlesinger WH (1992) The global carbon dioxide flux
in soil respiration and its relationship to vegetation and
climate. Tellus, 44B, 81–89.
Rey A, Pegoraro E, Tedeschi V (2002) Annual variation in soil
respiration and its components in a coppice oak forest in
Central Italy. Global Change Biology, 8, 851–866.
Ryan MG, Hubbard RM, Pongracic S et al. (1996) Foliage, fine-
root, woody tissue and stand respiration in Pinus radiata in
relation to nitrogen status. Tree Physiology, 16, 333–343.
S T A N D A G E - R E L AT E D E F F E C T S O N S O I L R E S P I R A T I O N 1019
r 2006 The AuthorsJournal Compilation r 2006 Blackwell Publishing Ltd, Global Change Biology, 12, 1007–1020

Silver WL, Miya RK (2001) Global patterns in root decomposi-
tion: comparisons of climate and litter quality effects. Oecolo-
gia, 129, 407–419.
Valentini R, Matteucci G, Dolman AJ et al. (2000) Respiration as
the main determinant of carbon balance in European forests.
Nature, 404, 861–864.
Vanninen P, Makela A (1999) Fine root biomass of Scots pine
stands differing in age and soil fertility in southern Finland.
Tree Physiology, 19, 823–830.
Vesterdal L, Ritter E, Gundersen P (2002) Change in soil organic
carbon following afforestation of former arable land. Forest
Ecology and Management, 169, 137–147.
Widen B, Majdi H (2001) Soil CO2 efflux and root respiration
at three sites in a mixed pine and spruce forest: seasonal and
diurnal variation. Canadian Journal of Forest Research, 31,
786–796.
Wiseman PE, Seiler JR (2004) Soil CO2 efflux across four age
classes of plantation loblolly pine (Pinus taeda L.) on the
Virginia Piedmont. Forest Ecology and Management, 192,
297–311.
Zerva A, Ball T, Smith KA et al. (2005) Soil carbon dynamics
in a Sitka spruce (Picea sitchensis (Bong.) Carr.) chrono-
sequence on a peaty gley. Forest Ecology and Management, 205,
227–240.
1020 G . S A I Z et al.
r 2006 The AuthorsJournal compilation r 2006 Blackwell Publishing Ltd, Global Change Biology, 12, 1007–1020

Copyright © 2022 FDOKUMEN


![genetic variation of norway spruce (picea abies [l.] karst ...](https://static.fdokumen.com/doc/165x107/633d6582b988f9753c06267d/genetic-variation-of-norway-spruce-picea-abies-l-karst-.jpg)