Soil carbon and nitrogen stocks under chronosequence of farm and traditional agroforestry land uses...
11
ORIGINAL ARTICLE Soil carbon and nitrogen stocks under chronosequence of farm and traditional agroforestry land uses in Gambo District, Southern Ethiopia Ambachew Demessie • Bal Ram Singh • Rattan Lal Received: 5 December 2012 / Accepted: 1 July 2013 / Published online: 10 July 2013 Ó Springer Science+Business Media Dordrecht 2013 Abstract Conversion of forests to farm lands with- out trees and farm lands with scattered trees (tradi- tional agroforestry systems) may lead to decline of soil organic carbon (SOC) and N stocks provided that they have similar original status. This study was conducted on soils with the age chronosequences of 12, 20, 30, 40, 50 years of farm (F), traditional agroforestry (AF) and the adjacent natural forest (NF) lands. We studied the changes in the concentration and stocks of SOC, total N and their distribution in the soil profile of an Andic Paleustalfs in Gambo District, Southern Ethi- opia. Soil samples were collected at 10, 20, 40, 60, 100 cm depth interval from pits of 1 m depth in all land use types and they were analyzed for their SOC and N stock. The results showed that the greater proportion of SOC and N was concentrated in 0–20 cm depth and that their concentration in AF and F land uses was significantly lower than that under the NF. Soils in traditional agroforestry land use showed a trend of higher SOC stocks in all chronosequences than those under the corresponding farm lands. The SOC stock under the chronosequence of 12–50 years of AF and F land uses varied from 28.2 to 98.9 Mg ha -1 or 12 to 43 % of the stock under the NF. The SOC was less by 6.2 Mg ha -1 year -1 for AF 12 and 0.9 Mg ha -1 year -1 for AF 50 compared with NF. The corresponding values for farm lands were 6.6 and 1.3 Mg ha -1 year -1 . The N values of all land uses were also less than that of the NF. The SOC and N stocks tended to be less in farm lands than in the traditional agroforestry. However, the SOC stocks were not significantly higher with AF compared with F suggesting that the parkland systems as practiced is not sufficient to overcome other effects of cultivation. Keywords Agroforestry Carbon stocks Farm land Natural forest Soil nitrogen Soil organic carbon Introduction Global warming caused by the emission of greenhouse gases (GHGs) including carbon dioxide (CO 2 ), meth- ane (CH 4 ) and nitrous oxide (N 2 O), is a major concern. The conversion of natural forests and peat land ecosystems to farm and other land uses contributes to GHGs emission (Kirby and Potvin 2007). A. Demessie School of Plant and Horticultural Sciences, College of Agriculture, Hawassa University, P.Box 5, Hawassa, Ethiopia B. R. Singh (&) Department of Plant and Environmental Sciences, Norwegian University of Life Sciences (UMB), P.Box 5003, 1432 A ˚ s, Norway e-mail: [email protected] R. Lal Carbon Management and Sequestration Center, Ohio State University, 2021 Coffey Road, Columbus, OH 43210, USA 123 Nutr Cycl Agroecosyst (2013) 95:365–375 DOI 10.1007/s10705-013-9570-0
-
Upload
independent -
Category
Documents
-
view
1 -
download
0
Transcript of Soil carbon and nitrogen stocks under chronosequence of farm and traditional agroforestry land uses...

ORIGINAL ARTICLE
Soil carbon and nitrogen stocks under chronosequenceof farm and traditional agroforestry land uses in GamboDistrict, Southern Ethiopia
Ambachew Demessie • Bal Ram Singh •
Rattan Lal
Received: 5 December 2012 / Accepted: 1 July 2013 / Published online: 10 July 2013
� Springer Science+Business Media Dordrecht 2013
Abstract Conversion of forests to farm lands with-
out trees and farm lands with scattered trees (tradi-
tional agroforestry systems) may lead to decline of soil
organic carbon (SOC) and N stocks provided that they
have similar original status. This study was conducted
on soils with the age chronosequences of 12, 20, 30,
40, 50 years of farm (F), traditional agroforestry (AF)
and the adjacent natural forest (NF) lands. We studied
the changes in the concentration and stocks of SOC,
total N and their distribution in the soil profile of an
Andic Paleustalfs in Gambo District, Southern Ethi-
opia. Soil samples were collected at 10, 20, 40, 60,
100 cm depth interval from pits of 1 m depth in all
land use types and they were analyzed for their SOC
and N stock. The results showed that the greater
proportion of SOC and N was concentrated in
0–20 cm depth and that their concentration in AF and
F land uses was significantly lower than that under the
NF. Soils in traditional agroforestry land use showed a
trend of higher SOC stocks in all chronosequences
than those under the corresponding farm lands. The
SOC stock under the chronosequence of 12–50 years
of AF and F land uses varied from 28.2 to
98.9 Mg ha-1 or 12 to 43 % of the stock under the
NF. The SOC was less by 6.2 Mg ha-1 year-1 for
AF12 and 0.9 Mg ha-1 year-1 for AF50 compared
with NF. The corresponding values for farm lands
were 6.6 and 1.3 Mg ha-1 year-1. The N values of all
land uses were also less than that of the NF. The SOC
and N stocks tended to be less in farm lands than in the
traditional agroforestry. However, the SOC stocks
were not significantly higher with AF compared with F
suggesting that the parkland systems as practiced is
not sufficient to overcome other effects of cultivation.
Keywords Agroforestry �Carbon stocks � Farm land �Natural forest � Soil nitrogen � Soil organic carbon
Introduction
Global warming caused by the emission of greenhouse
gases (GHGs) including carbon dioxide (CO2), meth-
ane (CH4) and nitrous oxide (N2O), is a major concern.
The conversion of natural forests and peat land
ecosystems to farm and other land uses contributes
to GHGs emission (Kirby and Potvin 2007).
A. Demessie
School of Plant and Horticultural Sciences, College of
Agriculture, Hawassa University, P.Box 5, Hawassa,
Ethiopia
B. R. Singh (&)
Department of Plant and Environmental Sciences,
Norwegian University of Life Sciences (UMB),
P.Box 5003, 1432 As, Norway
e-mail: [email protected]
R. Lal
Carbon Management and Sequestration Center, Ohio
State University, 2021 Coffey Road, Columbus,
OH 43210, USA
123
Nutr Cycl Agroecosyst (2013) 95:365–375
DOI 10.1007/s10705-013-9570-0

In agricultural landscapes, agroforestry systems can
be economically and environmentally sound. The C
sequestration potential of agroforestry systems is
estimated to be between 12 and 228 Mg C ha-1 over
the life of the system (Albrecht and Kandji 2003;
Dixon 1995).
This potential of soil carbon sequestration in
agroforestry systems depends on the prevailing envi-
ronmental condition, the species used and the man-
agement practices involved. For instance the biomass
C stock varied from 0.7 to 54.0 Mg C ha-1 and total C
stock (biomass C ? soil C, to 1 m depth) varied from
28.7 to 87.3 Mg C ha-1 under traditional parkland
agroforestry systems with Faidherbia albida and
Vitellaria paradoxa, improved agroforestry systems
(live fence, fodder banks) and an abandoned previ-
ously cultivated land in the West African Sahel,
(Takimoto et al. 2008). The traditional parkland
agroforestry systems had relatively larger C stock
than the other systems for this particular study. Using
the 13C isotopic ratio as an indicator of relative
contribution of trees (C3 plants) and crops (C4 plants)
to soil C, more tree-origin C was found in larger
particle size and surface soil and indicated that long-
term tree presence promoted storage of protected C in
deeper soil (Takimoto et al. 2009).
Sequestering C in soils, not only removes excess
CO2 from the air per-se, but also improving soil
organic matter (SOM) and nutrient supply (Janzen
2006). Agricultural soils have a significant CO2 sink
capacity provided that judicious management of farm
land is practiced (Paustian et al. 1997). The input of
crop residues is essential to increase SOC concentra-
tion (Duiker and Lal 2000; Loveland and Webb 2003).
In Gambo district, Southern Ethiopia, extensive
deforestation, overgrazing and conversion of natural
ecosystem into arable land are rampant (Solomon et al.
2002a; Lemenih and Itanna 2004; Ashagrie et al.
2005). However, remnant trees left on agricultural
lands created a traditional (parkland) agroforestry
(AF) system with unique configuration, mode of
establishment and management. Very little crops
residue is returned to the soil in both AF and F land
uses as these are used for animal feed and household
fuel. This type of residue management does not permit
the replenishment of depleted organic matter (OM)
and thus can lead to decline in soil quality (Yimer et al.
2007; Blanco-Canqui and Lal 2007). Soil C stock were
40.3 Mg C ha-1 and 5.3 Mg N ha-1 in semi-arid
woodland in the Rift Valley of Ethiopia, and
234.6 Mg C and 20.2 Mg N ha-1 in Podocarpus
falcatus forest soil, while C and total N stocks in
cropland soils were less (Solomon et al. 2002b;
Lemenih and Itanna 2004; Yimer et al. 2007).
However, little is known of changes in soil C and N
stocks following conversion of natural forest to either
agroforestry or farmland in Gambo district, Southern
Ethiopia and throughout sub-Saharan Africa. It is
hypothesized that SOC and N stocks in traditional
agroforestry systems differ compared to treeless
farming. The objectives of the study were to deter-
mine: (1) the changes in the concentration and stocks
of SOC and N in soils during 12, 20, 30, 40 and
50 years after conversion of natural forest to agrofor-
estry and farm lands under the prevailing farmer’s
practice, and (2) the distribution of SOC and N in the
soil profile to 1 m depth of these land use systems.
Materials and methods
Description of the study site
The study was conducted at three sites namely, Ashoka,
Leye and Beseko, which are adjacent to the natural forest
in Gambo district, Southern Ethiopia that covers an area
positioned on the lower fringe of the western escarpment
of the southeastern highlands (Fig. 1). The escarpment
extends from about 2,100 to 3,200 m a.s.l and the plain
descends gradually to the Rift Valley lakes at about
1,600 m a.s.l. The Ashoka, Leye and Beseko sites are
adjacent to each other, lie within 7�170N and 7�200N and
38�480E and 38�490E, at about 240 km southeast of Addis
Ababa. The altitude ranges from 2,137 to 2,215 m a.s.l,
and the slope from 4 to 11 % (Table 1).
Rainfall is bimodal with mean annual precipitation
of 973 mm, of which 50.3 % falls in July–September.
Temperature ranged between the mean annual max-
imum of 26.6 �C and mean of 10.4 �C for the period
from 1999 to 2007.
The soil parent materials of Gambo District are of
volcanic origin, principally trachytes and basalts with
ignimbrites and pumices at the Rift Valley floor
(Solomon et al. 2002a). The soil textural class ranges
from silt loam to clay (Table 2) and are classified as
Andic Paleustalfs with thick argillic horizon and some
Andic soil material in the upper soil layers (Soil
Survey Staff 1999).
366 Nutr Cycl Agroecosyst (2013) 95:365–375
123

The dominant species of the upper storey vegeta-
tion in the natural forest and agricultural landscapes
are P. falcatus Thunb.ex Mirb., Croton macrostachys
Hochst.ex Rich., Prunus africana (Hook.F.) Kalkm,
Schefflera abyssinica (Hochst. Ex A. Rich) Harms.,
Syzygium guineense (Willd.) DC and Ficus sure
(Forsk). The under story vegetation of the natural
forest is dominated by: Lannea schimperi (A.Rich.)
Engl. Rytigynia neglecta (Hiern) Robyns, Maytenus
arbutifolia (Hochst.ex A.Rich.) Wilezek, Bersama
abyssinica Fres, and Psydrax schimperiana (A. Rich).
The most abundant herb in the forest floor is Hypoestes
furskaolii (Vahl.)R. Br.
The trees in the traditional agroforestry system of
all age chronosequences are trees left deliberately
during the clearance of the natural forest and trees that
emerged in crop fields (Table 1). Farmers deliberately
kept the number of trees very small (median = 5/ha)
in their farm lands to avoid excessive shading on their
crops. These trees are mostly semi-deciduous trees
that contribute leaf litter and recycle soil nutrients.
Branches are harvested for fuel, fencing and timber for
construction, and for sale.
The main crops are maize (Zea mays L.), wheat
(Triticum aestivum L.), sorghum (Sorghum bicolor L.)
and potato (Solanum tuberrosum Linnaeus). Crops are
grown during the rainy season and management is
similar for both AF and F land uses. After harvest,
farmers often remove or heap and burn the crop
residues several weeks before the land preparation for
the next growing season.
Soil sampling and analysis
Due to lack of permanent plots for monitoring
temporal changes in C and N stocks at the study sites,
a spatial analogue and chronosequence approach was
used for soil sampling in the designated land use
systems (Sa et al. 2001; Turner et al. 2005; Liao et al.
2006). The Ashoka, Leye and Beseko study sites have
an age chronosequence of agroforestry and farm lands
within similar soil and climate (Fig. 1). The
Fig. 1 Maps showing the sites of the natural forest (NF) and the chronosequence of Aroforestry (AF) and farm (F) land uses in Gambo
District, Southern Ethiopia
Nutr Cycl Agroecosyst (2013) 95:365–375 367
123

Table 1 Sample field location and characteristics for two land uses and three locations in Southern Ethiopia
Site Land use Age
(years)
T. species in
AF land use
D1.3 (cm) H(M) Plt no Elevation
(m a.s.l)
Coordinate of soil sampling pits Slope
%Longitude Latitude
Ashoka Agroforestry 12 P f 212 42.2 1(4) 2205 07�170N 038�480E 11
Pa 134 41.1 2(4) 2208 07�170N 038�480E 11
Pa 120 36.2 3(4) 2212 07�170N 038�480E 11
Pa 116 35.7 4(4) 2203 07�170N 038�480E 11
Pa 105 27.0
Ashoka Agroforestry 20 F.s 115 12.6 1(4) 2178 07�180N 038�480E 8
F.s 103 12.6 2(4) 2183 07�180N 038�480E 8
C.m 103 30.6 3(4) 2181 07�180N 038�480E 8
C.m 98 12.6 4(4) 2187 07�180N 038�480E 8
C.m 88 16.8
C.m 84 13.8
C.m 80 18.0
C.m 74 25.2
C.m 66 25.0
C.m 65 26.8
Ashoka Agroforestry 30 S.a 129 20.0 1(4) 2177 07�180N 038�480E 6
Pa 112 29.4 2(4) 2182 07�180N 038�480E 6
P f 86 24.6 3(4) 2179 07�180N 038�480E 6
Pa 72 20.8 4(4) 2159 07�180N 038�480E 6
P f 60 20.5
Beseko Agroforestry 40 P f 133 30.9 1(4) 2149 07�190N 038�490E 7
P f 130 30.6 2(4) 2151 07�190N 038�490E 7
P f 124 32.7 3(4) 2157 07�190N 038�490E 7
P f 124 22.6 4(4) 2166 07�190N 038�490E 7
P f 121 34.8
P f 101 31.8
P f 98 29.4
P f 94 28.3
Leye Agroforestry 50 P f 232 53.1 1(4) 2163 07�180N 038�480E 8
P f 200 40.2 2(4) 2168 07�180N 038�480E 8
3(4) 2165 07�180N 038�480E 8
4(4) 2167 07�180N 038�480E 8
Ashoka Farm 12 1(4) 2205 07�170N 038�480E 11
2(4) 2209 07�170N 038�480E 11
3(4) 2215 07�170N 038�480E 11
4(4) 2207 07�170N 038�480E 11
Ashoka Farm 20 1(4) 2182 07�180N 038�480E 4
2(4) 2190 07�170N 038�480E 4
3(4) 2185 07�170N 038�480E 4
4(4) 2184 07�170N 038�480E 4
368 Nutr Cycl Agroecosyst (2013) 95:365–375
123

chronosequences of AF and F land uses were of 12, 20,
30, 40 and 50 years since their conversion from the
natural forest. The natural forest at Ashoka was the
reference land use. The information of the time since
conversion was obtained from elderly key informants,
farmers owning the farm and cross cheeked with the
Forest Department archive.
The sampling was done with four replicates
(Table 1). The sampling points were within rectangu-
lar plots of 20 9 20 m. The maximum distance in
which the tree litter observed in the field was 20 m
from the tree trunk. The size of the plots was then
determined by taking into account that the trees
influence on the accrual of C and N in the AF land use
can be captured up to a distance of 20 m. Within
approximately the same contour line, two trees with a
minimum of 60 cm diameter growth and a minimum
of 40 m distance between them were selected for each
age chronosequence of AF land uses. Then two of the
20 9 20 m plots were assigned and laid against the
slope on the east and western side of each tree.
Similarly 4 sampling plots in a row were laid out in the
east west direction against the slop gradient for each
age chronosequence in crop fields. However, the land
use types and their respective chronosequences were
not replicated in different sites of the study area. Lack
of land uses with similar chronosequences in the study
area makes their replication difficult.
For each land use a 1 9 1 9 1 m soil pit was dug in
each corner of the plots of which two were very close
to the tree (4 m from the trunk) and two were at 20 m
distance. The soil samples were collected from 0 to 10,
10 to 20, 20 to 40, 40 to 60, 60 to 100 cm depth
increments. The samples were then bulked corre-
sponding to the depth increments. Accordingly, 4*5
bulked samples were obtained from each land use.
Hence, in both AF and F land uses, a total of 200
bulked soil samples were collected. The number of
samples collected from the NF is as described in
Demessie et al. (2011). These samples were air-dried,
ground, passed through a 2 mm sieve and analyzed for
physical and chemical properties. In addition to these
pits, representative bigger pits, up to a depth of 3 m,
were dug across the study sites for profile description
and soil texture determination.
Soil core samples were collected (by forcing a sharp
edged steel cylinder) from the same direction and
depth increments in each peat for bulk density (BD)
determination (Tan 2005). In all, 200 core samples
were collected. Soil samples were then oven-dried at
105 �C for 24 h and weighed using electronic balance.
The dry soil was crushed and passed through 2 mm
sieve for making correction in soil BD for gravel
content. The pH was determined by potentiometric
method (Tan 2005). The concentrations of N were
measured using a LECO CHN-1000 Carbon and
Table 1 continued
Site Land use Age
(years)
T. species in
AF land use
D1.3 (cm) H(M) Plt no Elevation
(m a.s.l)
Coordinate of soil sampling pits Slope
%Longitude Latitude
Ashoka Farm 30 1(4) 2181 07�180N 038�480E 6
2(4) 2176 07�180N 038�480E 6
3(4) 2175 07�180N 038�480E 6
4(4) 2186 07�180N 038�480E 6
Beseko Farm 40 1(4) 2139 07�200N 038�490E 6
2(4) 2137 07�200N 038�490E 6
3(4) 2137 07�200N 038�490E 6
4(4) 2139 07�200N 038�490E 6
Leye Farm 50 1(4) 2159 07�180N 038�480E 9
2(4) 2158 07�180N 038�480E 9
3(4) 2163 07�180N 038�480E 9
4(4) 2157 07�180N 038�480E 9
Values in the parenthesis indicate number of pits/plot
Where T = Tree, AF = Traditional agroforestry system, Plt = Plot No, D1.3 = Diameter at breast height, H = Height, Pf = P.
falcatus, Pa = P. africana, Fs = F.sure, Cm = C.machrostachus, Sa = S. abyssinica
Nutr Cycl Agroecosyst (2013) 95:365–375 369
123

Nitrogen Analyzer. SOM was analyzed using titri-
metric method (Walkley and Black 1934).The SOC
was obtained by dividing the SOM concentration by a
factor of 1.724 (Tan 2005). Texture was measured by
the hydrometer method for the selected profiles of the
study sites (Table 2).
Measurements and calculations
The SOC stock (Mg ha-1) for each sampled depth was
calculated using equivalent soil mass by adjusting the
thickness of the soil as described by Ellert et al.
(2001); to correct error that may be introduced due to
variation in BD.
SOC stock Mg ha�1� �
¼ Cconc: � BD � T
� 10000 m2ha�1
� 0:001 Mg kg�1
� CFcoarse ð1Þ
where Cconc. = concentration (kg Mg -1), BD = bulk
density (Mg m-3)
T ¼ depth thickness mð Þ; CFcoarse
¼ correction factor�1�
�Gravel %
þ Stone %�=100
�
The soil mass was calculated using Eq. (2) and
thickness of the soil depths were adjusted using Eq. (3).
Msoil ¼ BD � T � 10; 000 m2ha�1 ð2Þ
where Msoil = soil mass per unit area (Mg ha-1)
Tadd ¼ Msoil;equiv � Msoil;layer
� �
� 0:0001 ha m�2=BD subsurface ð3Þ
where Tadd = additional thickness of sub surface layer
required to attain the equivalent soil mass (m)
Msoil;equiv ¼ equivalent soil mass
¼ mass of heaviest soil layer at each
1m depth Mg ha�1� �
BD subsurface
¼ bulk density of subsurface layer Mg m�3� �
Table 2 Soil characteristics of three selected profiles and two locations in Southern Ethiopia
Sites Horizon Depth
(cm)
pH(H2O)
1:2.5
BD
(g cm-3)
Particle size Textural
class
Oxalate extraction Allophane
%Sand
%
Silt
%
Clay
%
Alox
%
Siox
%
Alp
(%)
Leye 1A 5 7.6 0.9 44 37.3 18.7 L 0.21 0.1 0.1 0.7
1A2 10 6.9 0.9 54 33.3 12.7 SL 0.23 0.1 0.1 0.6
1A3 25 7.8 1.0 38 31.3 30.7 CL 0.19 0.1 0.2 0.5
AB 85 5.8 1.1 20 31.3 48.7 C 0.21 0.1 1.0 0.2
Bt1 125 5.1 1.2 22 19.3 58.7 C 0.19 0.1 1.4 0.1
Bt2 300 5.1 ND 12 19.3 68.7 C 0.20 0.1 2.5 0.0
Ashoka(NF) 1A 9 7.5 0.7 34 31.3 34.7 CL 0.18 0.1 0.3 0.4
E 18 7.8 0.9 55.3 21.3 23.4 SCL 0.16 0.1 0.2 0.4
2A 40 7.6 1.1 37.3 29.3 33.4 CL 0.17 0.1 0.2 0.4
AB 85 7.5 1.2 27.3 35.3 37.4 CL 0.16 0.1 0.8 0.2
B 210 7.4 1.3 21.3 11.3 67.4 C 0.19 0.1 2.0 0.1
Ashoka 1Ap 15 6.5 1.0 49.3 35.3 15.4 L 0.17 0.1 0.1 0.5
2A1 35 6.6 1.0 47.3 31.3 21.4 C 0.19 0.1 0.1 0.5
3Bt1 90 5.3 1.0 21.3 11.3 67.4 C 0.24 0.1 1.7 0.0
3Bt2 160 5.1 1.1 23.3 11.3 65.4 C 0.25 0.1 2.9 0.0
4BC 180 4.7 1.2 37.3 13.3 49.4 C 0.24 0.1 1.7 0.1
BD = Bulk density, BS = Base saturation, L = loam, SL = Silt loam, CL = Clay loam, C = Clay, SCL = Silt clay loam,
Jp = Juniperusprocera, AF = agroforestry, NF = natural forest, Alox. and Siox = Acid oxalate extractable Al, SI,
Alp = Pyrophosphate extractable Al, P = phosphate retention (Blakemore et al. 1987), % Allophane = 100(% Sio/(23.4–5.1x))
where x = (Alox-Alp)/Siox representing the atomic ratio of Al and Si in allophane
370 Nutr Cycl Agroecosyst (2013) 95:365–375
123

Allophane contents of three selected profiles of 3 m
depth were calculated according to Mizota and Van
Reeuwijk (1989).
% allophone ¼ 100 % Sio= 23:4� 5:1xð Þð Þ ð4Þ
where x = (Alo–Alp)/Sio representing the atomic ratio
of Al and Si in allophane
Alo ¼ oxalate extractable Al; Alp
¼ pyrophosphate extractable Al
Total stock of N (Mg ha-1) for each sampling depth
was also computed using the equations as for SOC
stock. The total soil SOC and N stocks were calculated
by adding the stock of the prescribed soil layer to 1 m
depth. The change of SOC stocks over time was
computed by subtracting the stocks of chronosequence
of AF and F land uses from that of NF and dividing it
by the number of years of the chronosequence.
Statistical analysis
The data obtained were analyzed using SAS software
(SAS Inc. 2003).The effect of land uses on SOC, N, pH
and BD (dependent variables) and their distribution in
each of the 1 m depth interval were subjected to one way
analysis of variance using the general linear model
procedures of SAS. Land uses and depth were the
independent variables. The mean square error (R) was
obtained by adding the square of differences between
the observed and the mean of the dependant variables
and dividing it to residual degree of freedom, i.e.
R =P
(y–�y)2/Residual DF. The Multiple compari-
son of means for each class variable was carried out
using the Student–Newman–Keuls (SNK) test at
a = 0.05.
Results
The physical and chemical soil characteristics of three
selected profiles at Ashoka and Lye sites are shown in
Table 2. Statistics is not provided as the 3 m depth
profiles were not replicated. However, the measured
value of the clay content in the surface soils at Ashoka
tended to be higher than that at Lye site but the allophone
in the surface layers of 0–10 cm depth tended to be
higher in soils at Lye compared to Ashoka sites.
Soil pH was low in the surface 0–10 cm depth
compared with 10–100 cm depth in all land uses
(Table 3). Soil pH was higher for NF, compared with
F12 for the 0–10 cm depth and most year systems for the
10–20 cm depth. BD in the 0–10 cm depth under NF was
0.7 compared with a mean of 1.0 g cm-3 for cultivated
fields. In 10–20 cm, it was 1.2 under F50 compared with
0.9 kg m-3 under NF. The BD at 20–40 cm under AF50
and F50 was high compared with AF40. Apart from few
exceptions at 100 cm depth, no significant variations in
BD was observed below 40 cm depth (Table 3). In
general, BD increased with soil depth.
In the 0–10 cm soil depth, SOC concentration
under NF was about 48–66 % higher compared with
the mean for all other and similar among F and AF
chronosequence (Figs. 2 and 3). In the 10–20 cm
depth, SOC concentration under F20 was low com-
pared with that under NF, AF40, AF50 and F40. In the
20–40 and 40–60 cm depth, the SOC concentration
did not differ (P \ 0.05) among land uses. In the
60–100 cm depth, the SOC under NF was higher with
F30, and F20 (P \ 0.05) and higher for AF40 and AF50
compared with F20 (Figs. 2 and 3). Soil N concentra-
tion in the surface layers of 0–10 cm depth under NF
was significantly high compared with F and AF land
uses (P \ 0.05) but it did not differ by land uses for
depth below 10 cm (Table 3).
The SOC stock under land uses of all age chron-
osequences with the exception of AF40, was low
compared with NF. The SOC stock F compared with
AF did not differ within time under cultivation
(Fig. 4). Land uses did not affect N stock except for
more under AF40 compared with AF20 (Fig. 5).
Conversion of the relict NF into arable land caused
decline in SOC stocks for all chronosequences of AF
and F land uses but the N stock did not decline. The
SOC stock in F and AF land uses of 12, 20 and
30 years of cultivation was 130.8–156.4 Mg ha-1 or
32–43 % lower compared with NF while the corre-
sponding SOC stock under the chronosequence of 40
and 50 years of both land uses varied from 164.5 to
201.5 Mg ha-1 or 12 to 28 % lower than that under
the NF. The SOC stock under the age chronosequence
of 12, 20, 30, 40 and 50 years of F and AF land uses
varied from 28.2 to 98.9 Mg ha-1 or 12 to 43 %.
Generally, the decline of SOC stocks was higher for
the first 12–20 years but approached to a steady state
after 40–50 years under both land uses of age chron-
osequences (Fig. 6). The SOC decline was lower
under AF (0.7 to 6.2 Mg ha-1 year-1) than that of
under F land use (1.3–6.6 Mg ha-1 year-1).
Nutr Cycl Agroecosyst (2013) 95:365–375 371
123
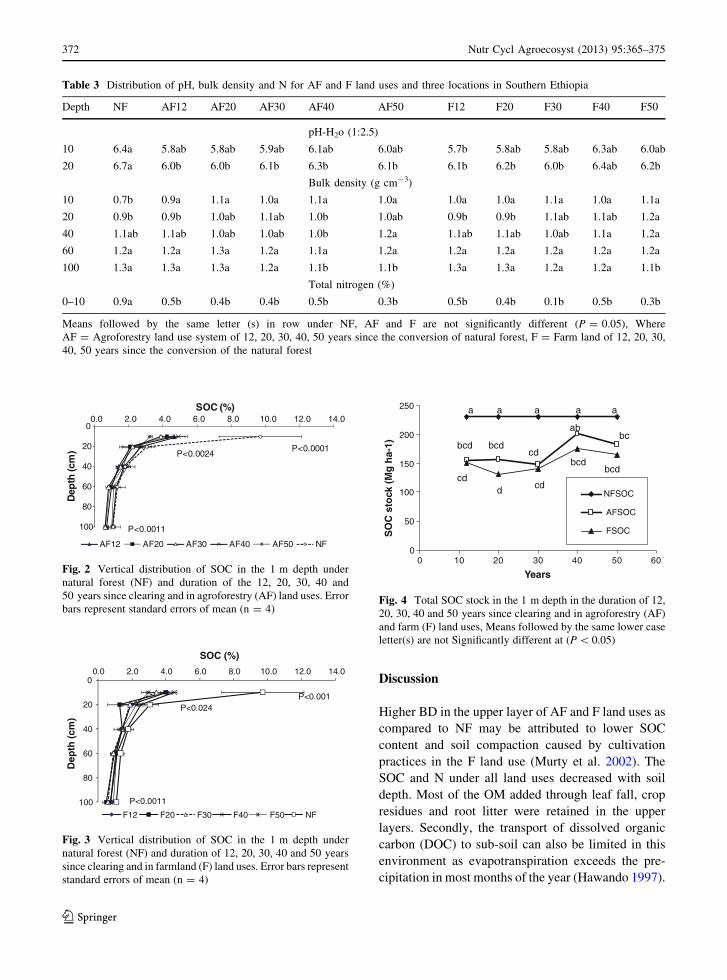
Discussion
Higher BD in the upper layer of AF and F land uses as
compared to NF may be attributed to lower SOC
content and soil compaction caused by cultivation
practices in the F land use (Murty et al. 2002). The
SOC and N under all land uses decreased with soil
depth. Most of the OM added through leaf fall, crop
residues and root litter were retained in the upper
layers. Secondly, the transport of dissolved organic
carbon (DOC) to sub-soil can also be limited in this
environment as evapotranspiration exceeds the pre-
cipitation in most months of the year (Hawando 1997).
Table 3 Distribution of pH, bulk density and N for AF and F land uses and three locations in Southern Ethiopia
Depth NF AF12 AF20 AF30 AF40 AF50 F12 F20 F30 F40 F50
pH-H2o (1:2.5)
10 6.4a 5.8ab 5.8ab 5.9ab 6.1ab 6.0ab 5.7b 5.8ab 5.8ab 6.3ab 6.0ab
20 6.7a 6.0b 6.0b 6.1b 6.3b 6.1b 6.1b 6.2b 6.0b 6.4ab 6.2b
Bulk density (g cm-3)
10 0.7b 0.9a 1.1a 1.0a 1.1a 1.0a 1.0a 1.0a 1.1a 1.0a 1.1a
20 0.9b 0.9b 1.0ab 1.1ab 1.0b 1.0ab 0.9b 0.9b 1.1ab 1.1ab 1.2a
40 1.1ab 1.1ab 1.0ab 1.0ab 1.0b 1.2a 1.1ab 1.1ab 1.0ab 1.1a 1.2a
60 1.2a 1.2a 1.3a 1.2a 1.1a 1.2a 1.2a 1.2a 1.2a 1.2a 1.2a
100 1.3a 1.3a 1.3a 1.2a 1.1b 1.1b 1.3a 1.3a 1.2a 1.2a 1.1b
Total nitrogen (%)
0–10 0.9a 0.5b 0.4b 0.4b 0.5b 0.3b 0.5b 0.4b 0.1b 0.5b 0.3b
Means followed by the same letter (s) in row under NF, AF and F are not significantly different (P = 0.05), Where
AF = Agroforestry land use system of 12, 20, 30, 40, 50 years since the conversion of natural forest, F = Farm land of 12, 20, 30,
40, 50 years since the conversion of the natural forest
0
20
40
60
80
100
0.0 2.0 4.0 6.0 8.0 10.0 12.0 14.0
Dep
th (c
m)
SOC (%)
AF12 AF20 AF30 AF40 AF50 NF
P<0.0001P<0.0024
P<0.0011
Fig. 2 Vertical distribution of SOC in the 1 m depth under
natural forest (NF) and duration of the 12, 20, 30, 40 and
50 years since clearing and in agroforestry (AF) land uses. Error
bars represent standard errors of mean (n = 4)
0
20
40
60
80
100
0.0 2.0 4.0 6.0 8.0 10.0 12.0 14.0
Dep
th (
cm)
SOC (%)
F12 F20 F30 F40 F50 NF
P<0.001P<0.024
P<0.0011
Fig. 3 Vertical distribution of SOC in the 1 m depth under
natural forest (NF) and duration of 12, 20, 30, 40 and 50 years
since clearing and in farmland (F) land uses. Error bars represent
standard errors of mean (n = 4)
0
50
100
150
200
250
0 10 20 30 40 50 60
Years
SO
C s
tock
(M
g h
a-1)
NFSOC
AFSOC
FSOC
a a a a a
bcd bcdcd
abbc
cdd cd
bcdbcd
Fig. 4 Total SOC stock in the 1 m depth in the duration of 12,
20, 30, 40 and 50 years since clearing and in agroforestry (AF)
and farm (F) land uses, Means followed by the same lower case
letter(s) are not Significantly different at (P \ 0.05)
372 Nutr Cycl Agroecosyst (2013) 95:365–375
123

The findings of Lemenih and Itanna (2004) showed
that in the Rift valley of Ethiopia, 50 % of soil C was
retained in the upper 20 cm of the soil. Similar results
were also reported by Awasthi et al. (2005) in the
Mardi watershed of Nepal that corroborates with our
finding.
The concentrations of SOC, and N were higher
under the reference NF than under either AF or F land
uses, probably due to the continuous and greater litter
input from diverse vegetation community compared
with annual crops and little or no soil perturbation
from cultivation. This trend of soil C distribution was
also observed in several other studies (Awasthi et al.
2005; Godsey et al. 2007; Jimqnez et al. 2007). In
general the SOM concentration in the cultivated soils
is less protected than that in the uncultivated soils (Fu
et al. 2004). Soil mixing due to tillage and increase in
soil temperature due to soil exposure and the enhanced
biological activity may lead to accelerated decompo-
sition of SOM.
The higher concentration of the SOC under AF40
compared with F12, F20 and F30 may be due to the
continuous litter input from relatively larger popula-
tion of P. falcatus a widespread coniferous trees
species in and around the AF40 sites. The result is
consistent with the finding reported by Demessie et al.
(2011, 2012a) that the SOC and N stock sequestered in
soils under the coniferous species in the same study
area was higher than the Eucalyptus plantations.
Wheat is often grown in the AF40 compared with
other fields where sorghum and maize are more
frequently produced. Hence the most of root growth
and leftover of crop residue of wheat that remains in
the field after the bulk of it is transported to the house-
holds for cattle feed may also contribute its part for the
higher value of SOC stock. The sorghum and maize
stalks are either burnt in place or are removed for use
in the house-holds during land preparation for the next
growing season. Such management during land prep-
aration process suggests that the input of crop residues
is minimal and not adequate to replace the depleted
SOC during the growing period. The low return of
crop residues can adversely affect soil physical and
chemical properties (Blanco-Canqui and Lal 2008),
and reduce agronomic productivity.
Tree density in AF was not the sole determinant of
SOC stock. Field AF20 had the greatest tree density but
it did not have high SOC compared with other AF
fields. Tree size, species as well as the starting
condition of the field may also be important for the
accrual of SOC stock (Demessie et al. 2012b).
Soil type also influence organic matter turnover due
to differences in soil clay content. Clay is assumed to
protect OM against decomposition and some of the
mechanisms proposed to explain stabilization of SOC
are adsorption of organics onto surfaces of clays or
organic complexes (Oades 1988) and entrapment of
organic particles in aggregates (Van Veen and Kuik-
man 1990). Parent material with high base status and
or the presence of substantial content of Al and Fe
oxides has also positive influence on stabilizing SOM
(Zunino et al. 982; Percival et al. 2000).
Cultivated land had less SOC compared with NF.
Soils have a C sink (storage) capacity, i.e. equilibrium
SOC content depending on the nature of vegetation,
climatic conditions and management (Gupta and Rao
1994). The C flux equilibrium is affected by land use
change until a new equilibrium is established (Guo and
Gifford 2002). The clearance of forests and the
0
5
10
15
20
25
0 10 20 30 40 50 60Years
N s
tock
(M
g h
a-1)
NF AF F
ab ab
a
ab
b
ab ab
ab ab ab
ab
ab
ab
ab
ab
Fig. 5 Total N stock of in the 1 m depth in the duration of 12,
20, 30, 40 and 50 years since clearing and in agroforestry (AF)
and farm (F) land uses, Means followed by the same lower case
letter(s) are not significantly different at (P \ 0.05)
0
1
2
3
4
5
6
7
AF12 AF20 AF30 AF40 AF50 F12 F20 F30 F40 F50Land use
SO
C lo
ss (
Mg
ha-1
yr-1
)
Fig. 6 Loses of soil organic carbon (SOC) for the period since
the conversion of (NF) natural forest to AF (agroforestry) and F
(Farm) land uses in the duration of 12, 20, 30, 40 and 50 years
since clearing
Nutr Cycl Agroecosyst (2013) 95:365–375 373
123

subsequent tillage practices affect soil C sink capacity
by: (1) the dwindling supply of litter to compensate for
decomposition, (2) reduced soil capacity to physically
protect SOC from decomposition due to the destruc-
tion of soil aggregates and (3) the enhanced leaching
of DOC or loss of particulate organic C by runoff and
erosion (Post and Kwon 2000; Lal 2002).
In cultivated soils of small land holders such as in
the study region, the amount of crop residues returned
to the soil is only a small portion of the total amount
produced. Even if the crop residue is fully returned to
the soil, it may not balance the quantity and quality of
litter supply that would increase the SOC to its
potential level as it used to be before the conversion of
the NF. This trend may be partly due to high rate of
mineralization (Singh and Lal 2005) and partly
because of the less diverse and lack of continuous
input from crops (Elberling et al. 2003). Most of
cultivated soils in the Midwestern USA have lost
25–40 Mg C ha-1, and their SOC content is below the
potential levels for perennial vegetation (Lal 2002).
Despite the initial SOC stock in AF and F land use
of 12 years of cultivation is not known, the low stocks
compared with the NF suggests that there was rapid
reduction of SOC stock during the early years of
cultivation. There is no evidence of further decline in
SOC stock with more than 12 years of cultivation
indicating a quasi equilibrium for cultivated lands.
The SOC stocks were not higher with AF compared
with F suggesting that the parkland systems as
practiced is not sufficient to shift the SOC equilibrium.
Acknowledgments The financial support to this study through
NORAD to Hawassa University, Ethiopia is gratefully
acknowledged. Our special thanks go to Line Tau Strand, Jan
Mulder and Tore Krogstad for their inspiring comment during
the write up of the manuscript. Our special thanks go to Mr
Teramage Tesfaye for his enormous assistance during the entire
period of data collection and practical work in the field.
References
Albrecht A, Kandji ST (2003) Carbon sequestration in tropical
agroforestry systems. Agric Ecosyst Environ 99:15–27
Ashagrie Y, Zech W, Guggenberger G (2005) Transformation of
a Podocarpus falcatus dominated natural forest into a
monoculture Eucalyptus globulus plantation at Munesa,
Ethiopia: soil organic C, N and S dynamics in primary
particle and aggregate-size fractions. Agric Ecosyst Envi-
ron 106:89–98
Awasthi KD, Singh BR, Sitaula BK (2005) Profile carbon and
nutrient levels and management effect on soil quality
indicators in the Mardi watershed of Nepal. Acta Agric
Scand B 55:192–204
Blakemore LC, Searle PL, Daly BK (1987) Methods for
chemical analysis of soils. New Zealand soil bureau sci-
entific report 80. Soil Bureau, Lower Hutt, New Zealand
Blanco-Canqui H, Lal R (2007) Soil and crop response to har-
vesting corn residues for biofuel production. Geoderma
141:355–362
Blanco-Canqui H, Lal R (2008) Corn stover removal impacts on
micro-scale soil physical properties. Geoderma 145:335–346
Demessie A, Singh BR, Lal R (2011) Soil carbon and nitrogen
stocks under plantations in Gambo District, Southern
Ethiopia. Sustain For 30(6):496–517
Demessie A, Singh BR, Lal R, Børresen T (2012a) Effects of
eucalyptus and coniferous plantations on soil properties in
Gambo District, Southern Ethiopia. Acta Agric Scand Sect
B Plant Soil Sci 62:467–476
Demessie A, Singh BR, Lal R, Børresen T (2012b) Leaf litter
fall and litter decomposition under Eucalyptus and conif-
erous plantations in Gambo District, Southern Ethiopia.
Acta Agric Scand Sect B Plant Soil Sci 62:467–476
Dixon RK (1995) Agroforestry systems: sources of sinks of
greenhouse gases? Agrofor Syst 31:99–116
Duiker SW, Lal R (2000) Carbon budget study using CO2 flux
measurements from a no till system in central Ohio. Soil
Tillage Res 54:21–30
Elberling B, Toure A, Rasmussen K (2003) Changes in soil
organic matter following groundnut-millet cropping at
three locations in semi-arid Senegal, West Africa. Agric
Ecosyst Environ 96:37–47
Ellert BH, Janzen HH, McConkey BG (2001) Measuring and
comparing soil carbon storage. In: Lal R, Kimble JM,
Follet RF, Stewart BA (eds) Assessment methods for soil
carbon. Lewis imprint of the CRC Press, Boca Raton, FL,
pp 131–146
Fu BJ, Liu SL, Chen LD, Lu YH, Qiu J (2004) Soil quality
regime in relation to land cover and slope position across a
highly modified slope landscape. Ecol Res 19:111–118
Godsey CB, Pierzynski GM, Mengel DB, Lamond RE (2007)
Changes in soil pH, organic carbon, and extractable alu-
minum from crop rotation and tillage. Soil Sci Soc Am J
71:1038–1044
Guo LB, Gifford RM (2002) Soil carbon stocks and land use
change: a meta analysis. Glob Change Biol 8:345–360
Gupta RK, Rao DLN (1994) Potential of wastelands for
sequestering carbon by reforestation. Curr Sci Bangalore
65:378–380
Hawando T (1997) Desertification in Ethiopian highlands. Rala
Report No. 200
Janzen HH (2006) The soil carbon dilemma: shall we hoard it or
use it? Soil Biol Biochem 38:419–424
Jimqnez JJ, Lal R, Leblanc HA, Russo RO (2007) Soil organic
carbon pool under native tree plantations in the Caribbean
lowlands of Costa Rica. For Ecol Manage 241:134–144
Kirby KR, Potvin C (2007) Variation in carbon storage among
tree species: implications for the management of a small-
scale carbon sink project. For Ecol Manage 246:208–221
Lal R (2002) Soil carbon dynamics in cropland and rangeland.
Environ Pollut 116:353–362
374 Nutr Cycl Agroecosyst (2013) 95:365–375
123

Lemenih M, Itanna F (2004) Soil carbon stocks and turnovers in
various vegetation types and arable lands along an eleva-
tion gradient in Southern Ethiopia. Geoderma
123:177–188
Liao JD, Boutton TW, Jastrow JD (2006) Storage and dynamics
of carbon and nitrogen in soil physical fractions following
woody plant invasion of grassland. Soil Biol Biochem
38:3184–3196
Loveland P, Webb J (2003) Is there a critical level of organic
matter in the agricultural soils of temperate regions: a
review. Soil Tillage Res 70:1–18
Mizota C Van Reeuwijk LP (1989) Clay mineralogy and
chemistry of soils formed in volcanic materials in di-
verseclimatic regions. Soil Monograph 2, Wageningen
ISRIC, pp 186
Murty D, Kirschbaum MUF, Mcmurtrie RE, Mcgilvray H
(2002) Does conversion of forest to agricultural land
change soil carbon and nitrogen? A review of the literature.
Glob Change Biol 8:105–123
Oades JM (1988) The retention of organic matter in soils. Bio-
geochemistry 5:35–70
Paustian K, Andren O, Janzen HH, Lal R, Smith P, Tian G,
Tiessen H, Van Noordwijk M, Woomer PL (1997) Agri-
cultural soils as a sink to mitigate CO2 emissions. Soil Use
Manag 13:230–244
Percival HJ, Parfitt RL, Scott NA (2000) Factors controlling soil
carbon levels in New Zealand grasslands: is clay content
important? Soil Sci Soc Am J 64:1623
Post WM, Kwon KC (2000) Soil carbon sequestration and land-
use change: processes and potential. Glob Change Biol
6:317–327
Sa JCD, Cerri CC, Dick WA, Lal R, Venske SP, Piccolo MC,
Feigl BE (2001) Organic matter dynamics and carbon
sequestration rates for a tillage chronosequence in a Bra-
zilian Oxisol. Soil Sci Soc Am J 65:1486–1499
SAS (2003) SAS/Procedure Guide, Release SAS 9.1.3, Service
Pack 1. SAS Iistitute Inc, Cary, NC, USA
Singh BR, Lal R (2005) The potential of soil carbon seques-
tration through improved management practices in Nor-
way. Environ Dev Sustain 7(161–184):2001
Soil Survey Staff (1999) Soil taxonomy: a basic system of
soil classification for making and interpreting soil surveys,
2nd ed. United States Department of Agriculture, Natural
resource Conservation Service, Washington, DC, 20402
Solomon D, Fritzsche F, Lehmann J, Tekalign M, Zech W
(2002a) Soil organic matter dynamics in the subhumid
agroecosystems of the Ethiopian highlands: evidence from
natural C-13 abundance and particle-size fractionation.
Soil Sci Soc Am J 66:969–978
Solomon D, Lehmann J, Mamo T, Fritzsche F, Zech W (2002b)
Phosphorus forms and dynamics as influenced by land use
changes in the sub-humid Ethiopian highlands. Geoderma
105:21–48
Takimoto A, Nair PKR, Nair VD (2008) Carbon stock and
sequestration potential of traditional and improved agro-
forestry systems in the West African Sahel. Agric Ecosyst
Environ 125:159–166
Takimoto A, Nair PKR, Nair VD (2009) Contribution of trees to
soil carbon sequestration under agroforestry systems in the
West African Sahel. Agrofor Syst 76:11–25
Tan KH (2005) Soil sampling, preparation, and analysis, 2nd
edn. Tailor & Francis Group, Boca Raton
Turner J, Lambert MJ, Johnson DW (2005) Experience with
patterns of change in soil carbon resulting from forest
plantation establishment in eastern Australia. For Ecol
Manage 220:259–269
Van Veen JA, Kuikman PJ (1990) Soil structural aspects of
decomposition of organic matter by micro-organisms.
Biogeochemistry 11:213–233
Walkley A, Black IA (1934) An examination of the Degtjareff
method for determining soil organic matter, and a proposed
modification of the chromic acid titration method. Soil Sci
37:29
Yimer F, Ledin S, Abdelkadir A (2007) Changes in soil organic
carbon and total nitrogen contents in three adjacent land
use types in the Bale Mountains, south-eastern highlands of
Ethiopia. For Ecol Manage 242:337–342
Zunino H, Borie F, Aguilera S, Martin JP, Haider K (1982)
Decomposition of 14C-labeled glucose, plant and micro-
bial products and phenols in volcanic ash-derived soils of
Chile. Soil Biol Biochem 14:37–43
Nutr Cycl Agroecosyst (2013) 95:365–375 375
123