STABILIZATION OF BLACK COTTON SOIL WITH IRON ORE ...
150
i STABILIZATION OF BLACK COTTON SOIL WITH IRON ORE TAILING BY SAMADOU JAHAROU B. ENG (CIVIL), A.B.U. M.SC/ENG/2128/2009 – 2010 A THESIS PRESENTED IN PARTIAL FULFILMENT OF THE REQUIREMENT FOR THE AWARD OF THE DEGREE OF MASTER OF SCIENCE IN CIVIL ENGINEERING DEPARTMENT OF CIVIL ENGINEERING FACULTY OF ENGINEERING, AHMADU BELLO UNIVERSITY ZARIA, NIGERIA SUPERVISORS Prof K.J. Osinubi Dr T.S. Ijimdiya MARCH 2015
-
Upload
khangminh22 -
Category
Documents
-
view
7 -
download
0
Transcript of STABILIZATION OF BLACK COTTON SOIL WITH IRON ORE ...

i
STABILIZATION OF BLACK COTTON SOIL
WITH IRON ORE TAILING
BY
SAMADOU JAHAROU
B. ENG (CIVIL), A.B.U.
M.SC/ENG/2128/2009 – 2010
A THESIS PRESENTED IN PARTIAL FULFILMENT OF THE
REQUIREMENT FOR THE AWARD OF THE DEGREE OF MASTER
OF
SCIENCE IN CIVIL ENGINEERING
DEPARTMENT OF CIVIL ENGINEERING
FACULTY OF ENGINEERING, AHMADU BELLO UNIVERSITY
ZARIA, NIGERIA
SUPERVISORS
Prof K.J. Osinubi
Dr T.S. Ijimdiya
MARCH 2015

ii
DECLARATION
I hereby declare that this thesis is a research carried out by me in the Department of Civil
Engineering, Ahmadu Bello University, Zaria. It has not been accepted in any previous
application for a higher degree. All sources of information have been fully acknowledged
by means of references.
………………………………….. ……………………………….. Samadou Jaharou Date M.SC./ENG/2128/2009-2010

iii
CERTIFICATION
This thesis titled STABILIZATION OF BLACK COTTON SOIL WITH IRON ORE
TAILING carried out by SAMADOU JAHAROU meets the requirement for the award of
the degree of Master of Science (Civil Engineering) of Ahmadu Bello University, Zaria
and is approved for its contribution to knowledge and literary presentation.
01.04.15 …………………………..…………… ……………………....
Prof. K. J. Osinubi Date Chairman, Supervisory Committee
……………………………………… …………………….... Dr. T. S. Ijimdiya Date Member, Supervisory Committee
……………………………………… ……………………....
Dr. Y. D. Amartey Date Head of Department
……………………………………… ……………………....
Prof. A. Z. Hassan Date Dean of Postgraduate School

iv
DEDICATION
I dedicate this work to Almighty Allah for His guidance, blessing and protection
throughout this research work and also to my family members for their support and
understanding.

v
ACKNOWLEDGEMENTS
I am grateful to Almighty Allah for giving me the patience to complete this work. I
would like to express my deepest and sincere thanks and gratitude to my supervisor Prof.
K. J. Osinubi for his unconditional motivation, contributions and advice towards the
attainment of this research work. I am also grateful to Dr T. S. Ijimdiya for contributions
and guidance in making this research successful. I will like to recognize and acknowledge
the guidance and useful contribution of Dr. A. O. Eberemu and Engr. J. Ochepo
throughout this research work.
I am also indebted to the Head of Department, Dr. Y. D. Amartey, Postgraduate
Coordinator, Dr. J. Sadeeq, Prof. S. P. Ejeh, Dr. O. S. Abejide, Dr. A.T. Olowosulu,
Dr. A. Ocholi and Dr. I. Abubakar for their contributions to my success. Furthermore,
I will not fail to appreciate the following persons whose contributions assisted in making
this project a success, Engr H.S. Samaila, John Sani, Frederick Kigha, Godwin Lazhi,
Ishola Kazeem and to the entire staff of soil research laboratory of Civil Engineering,
Ahmadu Bello University, Zaria.

vi
ABSTRACT
Results of preliminary investigation of the natural black cotton soil used in the study shows that
it belongs to A – 7 – 6 (13) or CH in the AASHTO and Unified Soil Classification System
(USCS), respectively. Soils under these groups are highly plastic and of poor engineering
benefit. The soil was treated with up to 16% iron ore tailing, IOT (a mining waste) by dry weight
of soil and compacted using three energy levels (British Standard light, BSL, West African
Standard, WAS and British Standard heavy, BSH). Tests were carried out to determine index
properties, compaction characteristics, strength characteristics, durability and microanalysis of
specimens. Test results showed an increase in the particle sizes with higher IOT content as
particle size distribution curves shifted from the region of fine-grained soils to coarse-grained
soil. The liquid limit and plastic limit initially increased from 64.5 and 25.0% for the natural soil
to peak values of 71.0 and 34.9 % for 2 and 8% IOT treatments, respectively, and thereafter
decreased with higher IOT treatments to 59.9 and 27.5% at 16% IOT content. The linear
shrinkage generally reduced with higher IOT treatment from 27.14% for the natural soil to
18.0% at 16% IOT content. Generally, the maximum dry density (MDD) increased while
optimum moisture content (OMC) decreased with higher IOT treatment. The 7day unconfined
compressive strength (UCS) values for the natural soil are 172.59, 328.38 and 448.83 kN/m2
when compacted with BSL, WAS and BSH energies, respectively, increased to peak values of
337.77, 487.57 and 821.57 kN/m2 at 16, 10 and 12% IOT contents, respectively. However, the
recorded values did not meet the 1034.25 or 1710 kN/m2 requirement for adequate lime or
cement stabilization, respectively. Similarly, the California bearing ratio (CBR) values
(unsoaked) of the compacted natural soil increased from 7.89, 9.82 and 15.03 % to peak values
of 16.62, 19.64, and 29.06% at 12, 14 and 12% IOT using BSL, WAS and BSH energies,
respectively. For the 24 hour soaked condition the CBR values of 3, 4 and 5 % for the natural

vii
soil increased to 5.66, 8.69 and 11.33% for BSL, WAS and BSH compactive energies at 12%
IOT treatments. The resistance to loss in strength increased from 10. 81, 11.84 and 13.09 % for
the natural soil to peak values of 24.71, 24.73 and 17.18% at 8, 12 and 10 % IOT treatments for
BSL, WAS and BSH compactions, respectively. Microanalysis of specimens treated with an
optimal 10% IOT and statistical analysis of the results using the analysis of variance (ANOVA)
showed that the soil characteristics i mp r o ve d . The results recorded show that although iron
ore tailing (IOT) improved the properties of black cotton soil (a s demonstrated by its
statistically significant effect on soil properties), however, it cannot be used as a stand-alone
stabilizer but in admixture stabilization of the soil.

viii
TABLE OF CONTENT
TITLE i
DECLARATION ii
CERTIFICATION iii
DEDICATION iv
ACKNOWLEDGEMENTS v
ABSTRACT vi
TABLE OF CONTENT viii
LIST OF FIGURES xiii
LIST OF TABLES xv
LIST OF ABBREVIATIONS xxii
CHAPTER ONE: INTRODUCTION
1.1 Preamble 1
1.2 Statement of the Problem 4
1.3 Justification for the Study 5
1.4 Aim and Objectives of the study 6
1.5 Scope of the Study 7
1.6 Research Methodology 7
CHAPTER TWO: LITERATURE REVIEW
2.1 Expansive Soils 9

ix
2.1.1 Origin of black cotton soil 10
2.1.2 Mineralogical and chemical composition of black cotton soil 10
2.2 Iron ore tailing 11
2.3 Soil stabilization 13
2.3.1 Mechanical stabilization 14
2.3.2 Chemical stabilization 15
2.3.2.1 Cement stabilization 16
2.3.2.2 Lime Stabilization 16
2.3.2.3 Bitumen stabilization 17
2.3.2.4 Agricultural and/or industrial waste stabilization 17
2.4 Pozzolanas 19
2.4.1 Properties of pozzolanas 19
2.4.2 Fineness of pozzolanas 20
CHAPTER THREE: MATERIALS AND METHODS
3.1 Materials 21
3.1.1 Black cotton soil 21
3.1.2 Iron ore tailing 22
3.2 Methods 23
3.2.1 Moisture content 23
3.2.2 Specific gravity 23
3.2.3 Particle size distribution 24
3.2.4 Atterberg limits 25

x
3.2.4.1 Liquid limit 25
3.2.4.2 Plastic limit 26
3.2.4.3 Plasticity index 26
3.2.5 Linear shrinkage 26
3.2.6 Free swell 27
3.2.7 Cation exchange capacity 27
3.2.8 Compaction 29
3.2.8.1 Maximum dry density 30
3.2.8.2 Optimum moisture content 31
3.2.9 Unconfined compressive strength 31
3.2.10 California bearing ratio 32
3.2.11 Durability 343
3.2.12 Analysis of variance 34
3.2.13 Microanalysis 36
CHAPTER FOUR: RESULTS AND DISCUSSION
4.1 Properties of the Materials Used in the Study 37
4.1.1 Black cotton soil 37
4.1.2 Iron ore tailing 39
4.1.3 Cation exchange capacity 40
4.2 Sieve analysis 41
4.2.1 Wet sieving 42

xi
4.2.2 Dry sieving 42
4.2.1.1 Using optimum moisture content from British Standard light compaction 42
4.2.1.2 Using optimum moisture content from West African Standard compaction 43
4.2.1.3 Using optimum moisture content from British Standard heavy compaction 44
4.3 Atterberg limits
465
4.3.1 Liquid limit
465
4.3.2 Plastic limit 47
4.3.3 Plasticity index 48
4.3.4 Linear shrinkage 48
4.4 Compaction characteristics 49
4.4.1 Maximum dry density 49
4.4.2 Optimum moisture content 52
4.5 Strength characteristics 54
4.5.1 Unconfined compressive strength 54
4.5.1.1 7 days curing period 54
4.5.1.2 14 days curing period
589
4.5.1.3 28 days curing period 59
60

xii
4.5.1.4 7 days curing and 7 days soaking periods
612
4.6 California bearing ratio
634
4.6.1 Unsoaked California bearing ratio
634
4.6.2 Soaked California bearing ratio
667
4.7 Microanalysis
689
4.7.1 7 days curing period micrographs for British Standard compaction
689
4.7.2 28 days curing period micrographs for British Standard compaction
701
4.8 Durability
722
CHAPTER FIVE: CONCLUSION AND RECOMMENDATION
5.1 Conclusion
756
5.2 Recommendation
787
REFERENCES 789

xiii
Appendix A
923
Appendix B
1023
LIST OF FIGURES
Figure Page
3.1 Geology of the black cotton soil of Northern Eastern Nigeria 222
4.1 Particle size distribution curve for the natural soil 399
4.2 Variation of cation exchange capacity of black cotton soil with

xiv
iron ore tailing content
40 40 4.3:
Particle size distribution curves for black cotton soil-iron ore
tailing mixtures (Wet Sieving) 422
4.4: Particle size distribution curves for black cotton soil-iron ore
tailing mixtures (BSL Compaction) 43
43
4.5: Particle size distribution curves for black cotton soil-iron ore
tailing mixtures (WAS Compaction) 44
44
4.6: Particle size distribution curves for black cotton soil-iron ore
tailing mixtures (BSH Compaction)
4545
4.7: Variation of Atterberg limits of black cotton soil with iron ore
tailing content 46
46
4.8: Variation of maximum dry density of black cotton soil with iron
ore tailing content 49
49
4.9 Variation of optimum moisture content of black cotton soil with
Comment [KJO1]: Ditto for others

xv
iron ore tailing content 52
52
Figure
Page
4.10: Variation of unconfined compressive strength (7 days curing period)
of black cotton soil with iron ore tailing content 545
4.11: Variation of unconfined compressive strength (14 days curing period)
of black cotton soil with iron ore tailing content 598
4.12 Variation of unconfined compressive strength (28 days curing period)
of black cotton soil with iron ore tailing content 601
4.13: Variation of unconfined compressive strength (7 days wax-curing and
7 days soaking period) of black cotton soil with iron ore tailing content 623
4.14: Variation of California bearing ratio (unsoaked) of black cotton soil
with iron ore tailing content 645
4.15: Variation of California bearing ratio (24 hours soaking period) of black
cotton soil with iron ore tailing content 678
4.16: Variation of resistance to loss in strength of treated black cotton soil
with iron ore tailing Content 734
Comment [KJO2]: Ditto

xvi
LIST OF TABLES
Table Page
2.1 Properties of pozzolanas 20
4.1 Properties of the natural soil 38
4.2 Oxide composition of iron ore tailing 39
4.3 Results of one-way analysis of variance for Atterberg limits
of black cotton soil - iron ore tailing mixtures 47
4.4 Results of one-way analysis of variance for compaction
characteristics of black cotton soil - iron ore tailing mixtures 51
4.5 Results of two-way analysis of variance for compaction
characteristics of iron ore tailing - compactive effort 51
4.6: Results of Analysis of Variance for unconfined compressive strength
of Black Cotton Soil - Iron Ore Tailing Mixtures 56
4.7: Results of Two-way Analysis of Variance for Unconfined Compressive
Strength of Iron Ore Tailing- Compactive Effort 57
4.8: Results of one-way analysis of variance for California bearing ratio
of black cotton soil-iron ore tailing mixtures
655
Comment [KJO3]: Correct texts as shown above for the remaining table titles

xvii
4.9: Results of Two Way Analysis of Variance for California Bearing
Ratio of Iron Ore Tailing- Compactive Effort 667
4.10: Results of Analysis of Variance for Durability of Black Cotton
Soil - Iron Ore Tailing Mixtures 745
Page
Table Page
4.11: Results of Two Way Analysis of Variance for Durability
of Iron Ore Tailing-Compactive Effort
745
A4.1: Results of specific gravity of black cotton soil-iron ore
tailing mixtures
923
A4.2: Results of specific gravity of black cotton soil-iron
ore tailing mixtures
923
A4.3: Results of moisture content of natural black cotton soil
923 A4.4a: Results of wet sieve analysis of
black cotton soil-iron
ore tailing mixtures
934
A4.4a: Results of wet sieve analysis of black cotton soil-iron

xviii
ore tailing mixtures (continuation)
945 A4.4(b): Results of dry sieve of black cotton soil-iron ore
tailing mixtures (BSL Compaction)
956
A4.4 (c): Results of dry sieve of black cotton soil-iron ore
tailing mixtures (WAS Compaction)
956
A4.4(d): Results of dry sieve of black cotton soil-iron ore
tailing mixtures (BSH Compaction)
967
A4.5: Results of Atterberg Limits of black cotton-iron
ore tailing mixtures 967
A4.6 Results of cation exchange capacity of black cotton
soil-iron ore tailing mixtures
967
Table
Page
A4.7: Results of maximum dry density of black cotton soil-iron
ore tailing mixtures
978
A4.8: Results of optimum moisture content of black cotton soil-iron

xix
ore tailing mixtures
978
A4.9a: Results of unconfined compressive strength
(7 days curing period) of black cotton soil-iron ore tailing mixtures
989
A4.9b: Results of unconfined compressive strength (14 days curing period)
of black cotton soil-iron ore tailing mixtures
989
A4.9c: Results of unconfined compressive strength (28 days curing period)
of black cotton soil-iron ore tailing mixtures 99
100
A4.9d: Results of unconfined compressive strength (7 days curing,
7 days soaking period) Test Results of Soil-IOT Mixture 99
100
A4.10a: Results of California bearing ratio (Unsoaked) of black
cotton soil-iron ore tailing mixtures
1001
A4.10b: Results of California bearing ratio (Soaked) of black cotton
soil-iron ore tailing mixtures
1001 A4.11: Results of resistance to loss in strength of black cotton
soil-iron ore tailing mixtures
1012

1
CHAPTER ONE
INTRODUCTION
1.1 Preamble
The stability of structures founded on soil depends to a large extent on the
interaction of the said soil with water. Some soils of the tropics (e.g., black cotton soil),
absorb large amount of water during the rainy seasons and do not allow easy passage of
such water. This consequently results in a large volume increase which drastically
reduces during the dry season. This phenomenon has substantial effect on structures
founded on such soils. Also, road bases built with soils that are not easily drained are
affected by the development of pore water pressures which causes the formation of
potholes and, eventually, the total failure of such roads. In an attempt to minimize these
effects, such soils are subjected to treatments aimed at either disallowing water into them
or allowing easy passage (drainage) of water to prevent pore water build up (Alhassan,
2008).
Problematic soils such as expansive soils are normally encountered in foundation
engineering designs for highways, embankments, retaining walls, backfills, etc.
Expansive soils are normally found in semi – arid regions of tropical and temperate
climate zones and are abundant where the annual evaporation exceeds the precipitation
(Chen, 1988; Warren and Kirby; 2004).
Black cotton soil is an expansive soil (Tomlinson, 1999; Osinubi et al., 2010). It is
found in the north eastern part of Nigeria, Cameroon, Lake Chad Basin, Sudan, Ethiopia,
Kenya and South Zimbabwe. The soil is also found in India, Australia, south west of
United States of America (Ola, 1978), South Africa and Israel (Plait, 1953).
Formatted

2
Two groups of parent rock materials have been associated with the formation of
expansive soils. The first group comprises sedimentary rock of volcanic origin, which can
be found in North America, South Africa and Israel (Plait, 1953), while the second group
of parent materials are basic igneous rocks found in India, Nigeria and South Western
U.S.A. (Medjo and Riskowiski, 2004). Morin, (1971) gives the engineering definition for
black cotton soil as dark grey to black soil with a high content of clay, usually over 50 %
in which montmorillonite is the principal clay mineral and which is commonly expansive.
They have the tendency to expand and shrink with changes in moisture and appreciable
plasticity due to the clay fraction.
Black cotton soils are expansive soils also referred to as tropical black clay. They
are so named because of their suitability for growing cotton. Black cotton soils have
varying colours‟ ranging from light grey to dark grey and black. The mineralogy of this
soil is dominated by the presence of montmorillonite which is characterized by large
volume change from wet to dry seasons and vice versa. Deposits of black cotton soil in
the field show a general pattern of cracks during the dry season of the year. Cracks
measuring 70 mm wide and over 1 m deep have been observed and may extend up to 3m
or more in case of deep deposits (Adeniji, 1991). These soils are poor materials to
employ for highway or airfield construction because they contain high percentages of
plastic clay. In areas where they occur, usually there are no suitable natural gravels or
aggregates and most deposits cover significantly large areas that avoiding them is not
possible.

3
Although poor and undesirable for engineering purposes, its properties could be
improved to meet standard specification by stabilization processes. Stabilization of the
soil with chemical admixtures is a common method of reducing the swell – shrink
tendencies of the soil and also makes the soil less plastic (Ola, 1983; Balogun, 1991;
Osinubi, 1995; 1999). In traditional practices, stabilizers such as cement, lime, and
bitumen, alone or in combination, are used as additives to stabilize soils. However, there
is a variety of non-traditional soil stabilization/modification additives available from the
commercial sector such as polymer emulsions, acids, lignin derivatives, enzymes, tree
resin emulsions, and silicates. To achieve stability, the additive must be incorporated with
the soil (Newman and Tingle, 2004).
Researchers (Ola, 1983, Balogun, 1990, Osinubi, 1995, 1999, Osinubi and
Medubi, 1998) reported that appreciable improvements in the geotechnical properties of
black cotton soils were observed when treated with lime, as well as lime admixed with
cement. The need to reduce the rising cost of soil stabilizers and overdependence on
industrially manufactured soil improving additives (cement, lime, etc.), has led to intense
global research towards economic utilization of wastes for engineering purposes (Oriola
and Moses, 2010).
Research works (Mohammedbhai and Baguant, 1990; Osinubi, 1997;
Osinubi and Stephen, 2005; Osinubi et al., 2009) in the field of geotechnical engineering
focus on the search for cheaper and locally available materials for use in stabilization. A
large percentage of such materials are agricultural wastes that produce cementituous
compounds on addition of moisture. These studies tried to match the need for safe and

4
environmental disposal of waste, for the society, and the engineer‟s need for better and
cost effective construction materials (Collins and Ciesiellski, 1993).
Itakpe iron ore deposit, with an estimated reserve of about 200 million tons, was
found in 1977 (Ola et al., 2009). The deposit is embedded in the Itakpe Hill near Okene
in the north-central Kogi State of Nigeria.
Itakpe iron ore processing plant produces a waste material of about 64 % of its
capacity. At a production rate of 4,737 tonnes/day, large quantities of tailings are
obtained as waste product of the beneficiated iron ore (Adepoju and Olaleye, 2001). The
management of tailings from iron ore mines is an important issue, from the point of view
not only of pollution control but also of the conservation of resources (Ghose, 1997).
1.2 Statement of the Problem
Black cotton soils belong to the smectite group, which includes montmorillonite
that are highly expansive and are the most troublesome clay minerals when encountered
in construction. Primarily, the problem that arises with regard to expansive soils is that
their deformations are significantly greater than the elastic deformations and therefore
cannot be predicted by classical, elastic or plastic theory. Movement is usually in an
uneven pattern and of such a magnitude as to cause extensive damage to the structures
and pavements resting on them (Nelson and Miller, 1992).
Black cotton soils pose great threat and dangers to engineering structures because
of their expansive characteristics. Expansive soils cause more damage to structures,
particularly light buildings and pavements, than any other natural hazards, including earth
quakes and floods (Jones and Holtz, 1993).

5
Though such damages are yet to be quantified in Nigeria, evidence of colossal
damages on buildings and road pavements are very obvious in regions of the country
especially in the North – eastern part of the country where black cotton soil exists
extensively (Osinubi, 1995). Because of the above mentioned problems and because the
black cotton soils occupy an estimated area of 104,000 km2 in the north- eastern part of
Nigeria, there is need to further investigate cost-effective ways of stabilizing them.
1.3 Justification for the Study
The rising cost of traditional additives such as cement and lime has motivated
the search for cheaper and locally available materials for improving problematic or
deficient soils to meet geotechnical engineering requirements in the construction
industry. The safe disposal of industrial and agricultural waste products demands urgent
and cost effective solutions because of the debilitating effect of these materials on the
environment and to the health hazards that these wastes constitute (Oriola and Moses,
2010).
Recent trend in research works in the field of geotechnical engineering and
construction materials (Osinubi, 1997; Osinubi, 2000a,b; Cokca, 2001; Medjo and
Riskowski, 2004; Moses, 2008; Osinubi and Medubi, 1997 a,b; Osinubi and Eberemu,
2005; Osinubi and Stephen, 2005, 2006a,b; Osinubi et al., 2007a,b; 2008a; Osinubi and
Eberemu, 2009) focused more on the search for cheap and locally available materials
such as bagasse ash, fly ash, blast furnace slag etc. as stabilizing agents for the purpose of
full or partial replacement of traditional stabilizers.

6
Therefore, the possible use of other locally available industrial and agricultural
wastes (such as iron ore tailings) with pozzolanic properties as possible substitutes or as
admixtures to main stabilizers to modify/stabilize black cotton soils, will considerably
reduce the cost of construction and as well as reduce or eliminate the environmental
hazards caused by such wastes.
1.4 Aim and Objectives of the Study
The aim of this research was to evaluate the effect of iron ore tailing (a by-product
of mining process) when used to stabilize black cotton soil.
The following specific objectives were designed to be achieved:
1. Determination of the oxide compositions of iron ore tailing and black cotton soil.
2. Determination of the moisture – density relationships of the natural and treated
soil using various compactive efforts (i.e., British Standard light, West African
Standard and British Standard heavy.)
3. Evaluation of cation exchange capacity (CEC)
4. Determination of the strength and durability properties of the treated soil.
5. Determination of the optimal quantity of iron ore tailing needed to stabilize black
cotton soil
6. Microanalysis of optimally treated black cotton soil
7. Statistical analysis of the results using analysis of variance (ANOVA) method
The parameters that were investigated include:
Atterberg limits, compaction characteristics (i.e., dry density and moisture content),
unconfined compressive strength (UCS), California bearing ratio (CBR) and durability.
1.5 Scope of the Study

7
This research was carried out to determine the suitability of iron ore tailing (IOT) as
additive for black cotton soil stabilization. Tests were carried out to determine the effect
of IOT at various compactive efforts (British Standard light (BSL), West African
Standard (WAS) and British Standard heavy (BSH)) on the properties of black cotton
soil. All tests were carried out in accordance with procedures outlined in BS 1377 (1990)
and BS 1924 (1990).
1.6 Research Methodology
All tests on the natural and stabilized soil were carried out in accordance with BS 1377
(1990) and BS 1924 (1990), respectively. Black cotton soil was treated with IOT in
stepped concentrations of 0, 2, 4, 6, 8, 10, 12, 14 and 16 % by dry weight of the soil.
The following tests were carried out:
1. Sieve analysis
2. Atterberg limits
3. Compaction
4. Unconfined compression
5. California bearing ratio
6. Cation exchange capacity
7. Microanalysis of specimens
8. Durability

8

9
CHAPTER TWO
LITERATURE REVIEW
2.1 Expansive soils
Expansive soil is a type of clayey soil which expands when it comes in contact
with water and shrinks when the water evaporates. This soil is generally found in arid and
semi-arid regions of the world. A lot of damages occur on structures founded on this type
of soil. The damages normally appear as cracks on buildings, canal beds and linings,
pavements, lifting of water supply pipeline and sewerage lines, etc. (Sabat, 2012).
Expansive soils owe their expansive character mainly to the constituent clay
mineral. The most important clay mineral, which is the cause for expansive nature is
montmorillonite. It has an octahedral sheet sandwiched between two silica sheets. When
this mineral is exposed to moisture, water is absorbed between interlayering lattice
structures and exert an upward pressure. This upward pressure, known as swelling
pressure, causes most of the damages associated with expansive soils. Most of the
structural damage by expansive soils results from the differential rather than the total
movement of the foundation soil as a result of swelling (Holtz and Hart, 1978).
An example of expansive soils is the black cotton soil which is dark–grey to black
in colour. The name originated from India where locations of these soils are favourable
for growing cotton. It is also the Nigerian type of expansive soils (Osinubi, 1999).
2.1.1 Origin of black cotton soil
Tropical black clay otherwise known as Canada‟s swelling clays, India‟s black
cotton soil and Kenya black cotton soils can be found all over the world (Chen, 1988).

10
Black cotton soils are black clays that are produced from the breakdown of basic igneous
rocks, where seasonal variation of weather is extreme. Nigerian black cotton soils (BCS)
are formed from the weathering of shaly and clayey sediments and basaltic rocks. The
Nigerian BCS contains more of the montmorillonite mineral with subsequent
manifestation of swell properties and expansive tendencies (Ola, 1983). Black cotton
soils are confined to the semi-arid regions of tropical and temperate climatic zones and
are abundant where the annual evaporation exceeds the precipitation (Chen, 1988;
Warren and Kirby; 2004),
Balogun (1991) reported that black cotton soils occur in continuous stretches as
superficial deposits and are typical of flat terrains with poor drainage. The absence of
quartz in the clay mineralogy enhances the formation of fine-grained soil material, which
is impermeable and waterlogged. Other conditions favouring the formation of black
cotton soils are evaporation exceeding precipitation, poor leaching, alkaline conditions
and retention of magnesium and calcium in the soil (Ola, 1983).
2.1.2 Mineralogical and chemical composition of black cotton soil
Ola (1983) showed that the Nigerian black cotton soils contains about 70 %
montmorillonite and 30 % kaolinite and the predominance of this montmorillonite is due
to the weathering of the basic constituents. The swell and shrink characteristics of the
soil are largely due to montmorillonite mineral while kaolinite is likely responsible for
high strength value because of its inability to swell with absorbed water.
The montmorillonite clay structure consists of layer sheet formed and stacked one
above the other and the bonding between successive layers is by van der Waals forces

11
and by cation that may be present to balance charge deficiencies in the structure. These
bonds are however, weak and easily separated by cleavage or adsorption of water and
other liquids. There is an extensive isomorphous substitution for aluminium and silicon
with its lattice which gives the clay a net negative charge resulting in the water absorbing
tendencies and an attraction for hydroxyl ions and water molecules to the clay surface
(Nelson and Miller, 1992). On the other hand, kaolinite is a relatively inactive clay
mineral. Its structure is made of repeating layers of elemental silica-gibbsite sheets in 1:1
lattice (Das, 1998).
2.2 Iron Ore Tailing
Tailings are the discarded material resulting from the concentration of ore during
beneficiation operations. Tailings are characterized by fine particle size and varying
mineralogical and chemical composition (Aleshin, 1978).
The iron ore extracted from the mines are beneficiated to separate out the valuable
mineral content. The prime function of beneficiation of iron ore is to improve the iron
(Fe) content and to decrease the Alumina / Silica ratio for smooth blast furnace
operations. The left over residue of the iron ore after the beneficiation which usually
constitutes of fine particles mixed in a slurry form, known as tailings are needed to be
disposed of in the tailings pond for containment. Tailings contain all other constituents of
the ore but the extracted metal, among them heavy metals and other toxic substances that
are either added to the tailings in the milling process or available with the ore before that
(ICOLD, 2003). Therefore, tailings are the waste silica and quartz particles, as well as
12
fine-grained ore that are unable to be recovered within the existing concentration
processes.
The Itakpe iron ore deposit in Nigeria which has a total estimated reserve of about
182.5 million metric tonnes consists mainly of quartzite with magnetite and haematite
and the Itakpe project was designed to treat a minimum of 24,000 tons of ore per day and
operate 300 days per year (Ajaka, 2009). The deposit contains a mixture of magnetite and
hematite with ratio varying throughout the deposit. The ore consists of coarse, medium
and fine grained particles. The fine ores are located mainly in the eastern part of the
deposit and in thin layers, while the coarse and medium ores are relatively mixed.
However, the coarse ore predominates in the north and west of the central layers while
the medium one does in the centre of the central layers. The average iron content of the
ore deposit was determined to be approximately 35% (Ola et al., 2009).
The disposal of tailings is a major environmental problem, which is becoming
more serious with increasing extraction of lower grade deposits. The tailings are usually
transported and deposited as slurry of high water content into a massive pond for
containment, which are generally called as tailing ponds / tailing dams (CPCB, 2007).
Tailings embankments are susceptible to rapid erosion, cutting down and complete
breaching (Toland, 1977). The creation of artificial tailings ponds creates environmental
problems of air and water pollution, deforestation and has impacts on agriculture and
forestry. Of particular concern is direct discharge of tailings into rivers. Another cause of
surface water pollution is the discharge of supernatant effluent into water courses.

13
In certain mines where ores have high sulfur content, drainage from mine
workings and waste heaps can become highly acidic and can contain high concentrations
of dissolved heavy metals. This acid mine drainage (AMD) can have a pH of 3 or lower;
sulphate levels of 800–1,800 milligrams per litre (mg/l) depending on the contents of the
ore. Effluent from tailings ponds may contain concentrations of chromium of several
milligrams per liter, chemicals used in flotation and other metal concentration processes
could create toxicity problems (World Bank Group, 1998). In the sedimentary deposit
mining areas the water table and aquifers are damaged and thus the availability of water
from these sources reduces. Tailings must be managed to optimize human safety and
environmental protection that is the reason why intensive research and development
efforts are being intensified in finding cost-effective solutions in utilizing these industrial
wastes.
2.3 Soil Stabilization
Soil stabilization is the alteration of one or more soil properties, by mechanical or
chemical means, to create an improved soil material possessing the desired engineering
properties. Earlier, soil improvement has been in the qualitative sense only, but more
recently, it has also become associated with quantitative values (compressive strength,
shearing strength, load bearing quality, adsorption softening and reduction in strength) of
strength and durability, which are related to performance (Amu et al., 2005). Soils may
be stabilized to increase strength and durability or to prevent erosion and dust generation.
Soil stabilization deals with the physical, physico-chemical and chemical methods to

14
make the stabilized soil to serve its purpose as pavement component material (Koteswara,
2011).
According to Johnson et al. (1988) stabilization infers improvement in both
strength and durability. Osinubi and Katte (1991) referred to soil stabilization as the
alteration or control of any soil property. It covers not only the increase or decrease of
any soil property, but also the variation of any property with changes in environmental
condition, namely moisture or pressure.
Primarily, the objectives of stabilization are to improve soil strength, to decrease
permeability and water absorption and to improve bearing capacity and durability under
cyclical conditions such varying moisture content (Akinmade, 2008).
Soil stabilization has been used in the building of roads, aircraft runways, earth dams and
embankment in erosion control (Diamond, 1975; Kawamura and Diamond, 1975) and in
reduction of frost heaving.
2.3.1 Mechanical stabilization
This is the process of altering soil properties by changing the gradation through
mixing with other soils, densifying the soils using compaction energies, or undercutting
the existing soils and replacing them with granular material. In the field, hand–operated
vibrating plates and motorized vibratory rollers of various sizes are very efficient in
compacting sand and gravelly soils. Large falling weights have been used to dynamically
compact loose granular fills (Markwick, 1944).
15
The objective of mechanical compaction is the improvement of the engineering
properties of the soil mass, and the several advantages which are obtained through
compaction are as follows (O‟ Flaherty, 1988):
i. Reduction in settlement due to reduced void ratio
ii. Increase in soil strength
iii. Reduction in shrinkage.
2.3.2 Chemical stabilization
Soil stabilization using chemical admixtures is the oldest and most widespread
method of ground improvement. Chemical stabilization is mixing of soil with one of or a
combination of admixtures of powder, slurry, or liquid for the general objectives of
improving or controlling its volume stability, strength and stress-strain behavior,
permeability, and durability (Winterkorn and Pamukçu, 1990).
Traditional stabilizers such as Portland cement, lime and bitumen are used to
stabilize soil. However, there are a variety of non-traditional additives available from the
commercial sector such as polymer emulsions, acids, lignin derivatives, enzymes, tree
resin emulsions, and silicates.
Inorganic salts such as sodium chloride and calcium chloride have long been used
in stabilization. Their chief function is to reduce plasticity and facilitate densification
(Gillot, 1987; Yamanouchi, 1975; Habercom, 1978; Balogun, 1991).
2.3.2.1 Cement stabilization
Soil which is stabilized with cement is known as cement-soil. The chemical
reaction between cement and soil during hydration process will produce binding force.

16
Cement stabilization is suitable for inorganic soil (Bergado et al., 1996). However, high
early strength cement is more effective than the Portland cement (Hammond, 1961).
The Portland Cement Association (1970) has indicated that nearly all types of soils
can be stabilized with cement. In general, gravels require about 10 % by weight of
cement, sand requires about 7 to10 %; silts about 12 to 15 % and clays about 12 to 20 %
by weight of cement (Gillot, 1987). When soils are sandy, mixing of cement and soil can
be carried out at or slightly about optimum moisture content but with clayey soils mixing
is most readily achieved with moisture slightly below optimum (Akinmade, 2008).
2.3.2.2 Lime stabilization
Lime reacts with medium, moderately fine and fine-grained soils to produce
decreased plasticity, increased workability, reduced swelling, and increased strength. The
main reactions include cation exchange, flocculation and pozzolanic reactions (Nelson
and Miller, 1992).
Eades and Grim (1960) found that there exists a chemical reaction between lime
and pure clay minerals (kaolinite, illite and montmorillonite) with accompanying increase
in bearing value. The quantity of lime needed to effectively treat a soil to develop
increased strength varies with the type of clay mineral present. Akawwi and Al-
Kharabsheh (2002) reported that the swelling and shrinkage potential of soils are affected
by mineralogical constituents and surrounding environment.
The optimum amount of lime for maximum strength gain in stabilizing soil with
lime according to Eades and Grim (1960) is 4 - 6 % for kaolinite, about 8 % for illite and

17
montmorillonite. Ola (1978) reported a linear relationship between the strength of lime –
stabilized black cotton soil and up to 10 % lime content.
2.3.2.3 Bitumen stabilization
This method enhances the strength of the soil by making it waterproof, forms
binding among the soil particles and maintain low moisture content of soil. Bitumen
stabilization of any soil can only be feasible if the plasticity index of the soil lies between
6 and 10 %, if otherwise; it may become difficult to stabilize such soils with bitumen, due
to the non-pulverizing of the soil (Yoder and Witczak, 1975). Gillot, (1987), Osinubi and
Bajeh (1994) as well as Osinubi (2000b, 2001b) reported that bituminous soil
stabilization has been most successfully employed in the stabilization of non-cohesive or
mildly cohesive soils particularly in warm dry climates where the soil has low moisture
content.
2.3.2.4 Agricultural and/or industrial waste stabilization
Previous researches have revealed that the soils could be stabilized effectively
using bitumen, lime or cement. Balogun (1991) reported that stabilization of black cotton
soil, with lime for example, was not adequate to meet the requirements of the
conventional specification for use of the soil in road and highway construction. Similarly,
Ibrahim (1983) found that high percentage of cement would be required to stabilize black
cotton soil effectively.
The rising cost of conventional soil stabilizers coupled with the need to reduce the
cost of waste disposal as well as the need for the economical utilization of industrial and
agricultural waste have prompted an investigation into the stabilizing potential of wastes

18
for beneficial engineering purposes. Fly ash is one of the most plentiful and industrial by-
products. It is generated in vast quantities as a by-product of burning coal at electric
power plants (Senol et al., 2006).
Fly ash generated by coal combustion based power plants typically fall within the
ASTM fly ash classes C and F (Reyes and Pando, 2007). Yudhbir and Honjo (1991)
stated that the pozzolanic fly ashes can be advantageously made use of to improve the
geotechnical properties of black cotton soils.
Studies have been carried out on the beneficial use of agricultural and industrial
waste for construction purposes in the Department of Civil Engineering, Ahmadu Bello
University, Zaria. Akinmade (2008) and Osinubi et al. (2009b; 2011) reported that
locust bean waste ash has a good potential in improving some of the geotechnical
properties of the soil.
Osinubi and Stephen (2005; 2006a,b; 2007), Osinubi and Ijimdiya (2009), Osinubi
and Mustapha (2005; 2008), Osinubi and Eberemu (2006), Osinubi et al., (2007a,b;
2009a,b) focused on the use of bagasse ash as possible stabilizers/admixtures for the
stabilization of expansive soils. Stephen (2006) studied the potential of bagasse ash as
stabilizer on black cotton soil, while Moses (2006) and Osinubi et al. (2008a, b) admixed
bagasse ash with lime and cement in stabilizing black cotton soil.
. Sayah (1993) and Zaman et al. (1992) reported the effectiveness of cement kiln
dust in stabilizing highly expansive clay soils. The use of cement kiln dust in stabilization
of clays has been shown to improve the unconfined compressive strength and reduce the
plasticity index using dust with low loss on ignition (LOI). On the other hand, adding
19
cement kiln dust with high LOI resulted in relatively lower unconfined compressive
strengths and higher plasticity indices (Bhatty et al., 1996).
2.4 Pozzolanas
Pozzolans are defined as siliceous and aluminous materials which themselves possess
little or no cementitious value but will, in the presence of moisture, chemically react with
calcium hydroxide at ordinary temperatures to form compounds possessing cementitious
properties (Robert, 1993).
2.4.1 Properties of pozzolanas
The chemical composition of pozzolanas can be roughly summarized as follows:
Silica + Alumina + Iron Oxide – Not less than 70 percent
Other Oxides and Alkalis – Not more than 15 percent
Loss on ignition – Not more than 15 percent
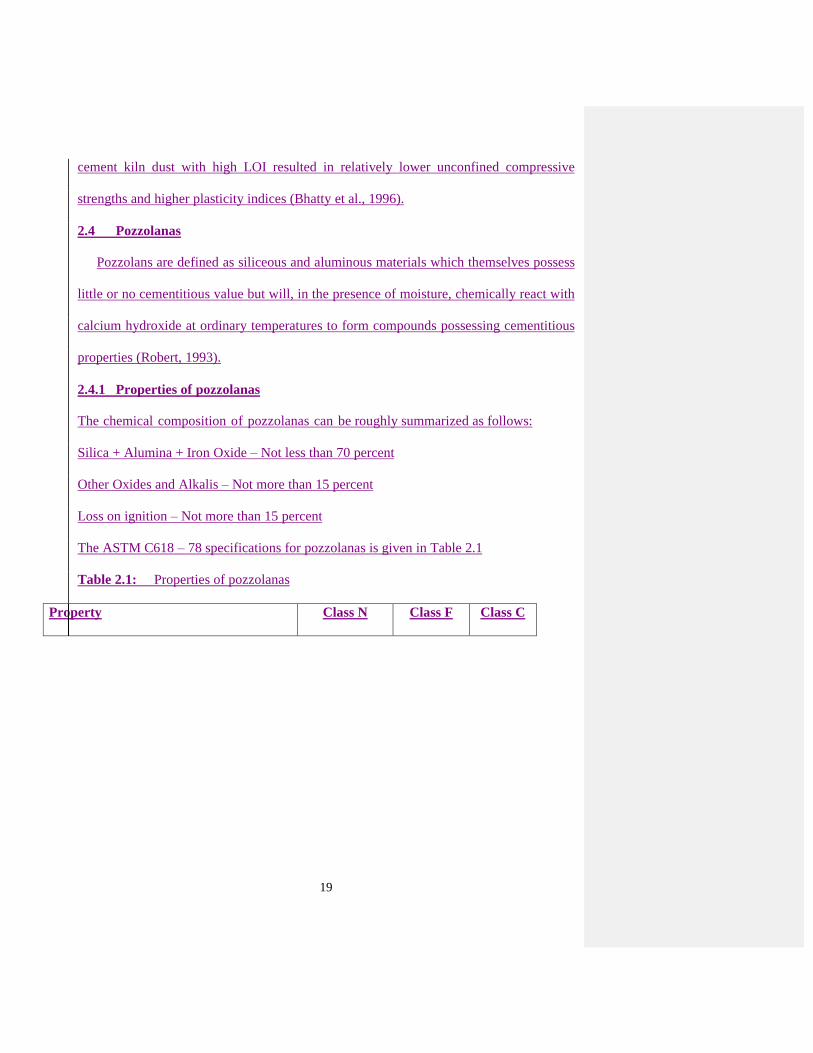
The ASTM C618 – 78 specifications for pozzolanas is given in Table 2.1
Table 2.1: Properties of pozzolanas
Property Class N Class F Class C

20
Chemical Properties
SiO2 + Al2O3 + Fe2O3 (%)
SO3 (Max %)
MgO (Max %)
Loss on ignition
Physical Properties
Moisture content (%)
Fineness (%) on sieve No. 200 (mm)
Pozzolanic Activity
Index with OPC at 28 days (%)
Pozzolanic Activity Index with lime
at 7 days
70
4
5
10
3
85
75
5.5
70
5
5
2
3
85
75
5.5
50
5
5
6
3
85
75
5.5
Source: ASTM C618-78
2.4.2 Fineness of pozzolanas
An essential physical property of a cementing material that affects its affinity for
water is its fineness. The activity of pozzolanas is increased by fine grinding. ASTM
C618-78 specification requires that the percentage passing sieve No. 200 ≥ 85% (Lea,
1956, Smith, 1992).

21
CHAPTER THREE
MATERIALS AND METHODS
3.1 Materials
3.1.1 Black cotton soil
The soil sample used in this study was obtained near Baure village in Deba Local
Government Area (LGA) of Gombe State. It was collected as disturbed sample,
excavated from depth not less than 0.5 m so as to avoid any organic material. The
samples were packaged in sealed plastic bags for use in laboratory. The collected soil
sample was air-dried and pulverized into particles passing BS No. 4 (4.75 mm aperture)
sieve before laboratory tests were carried out.
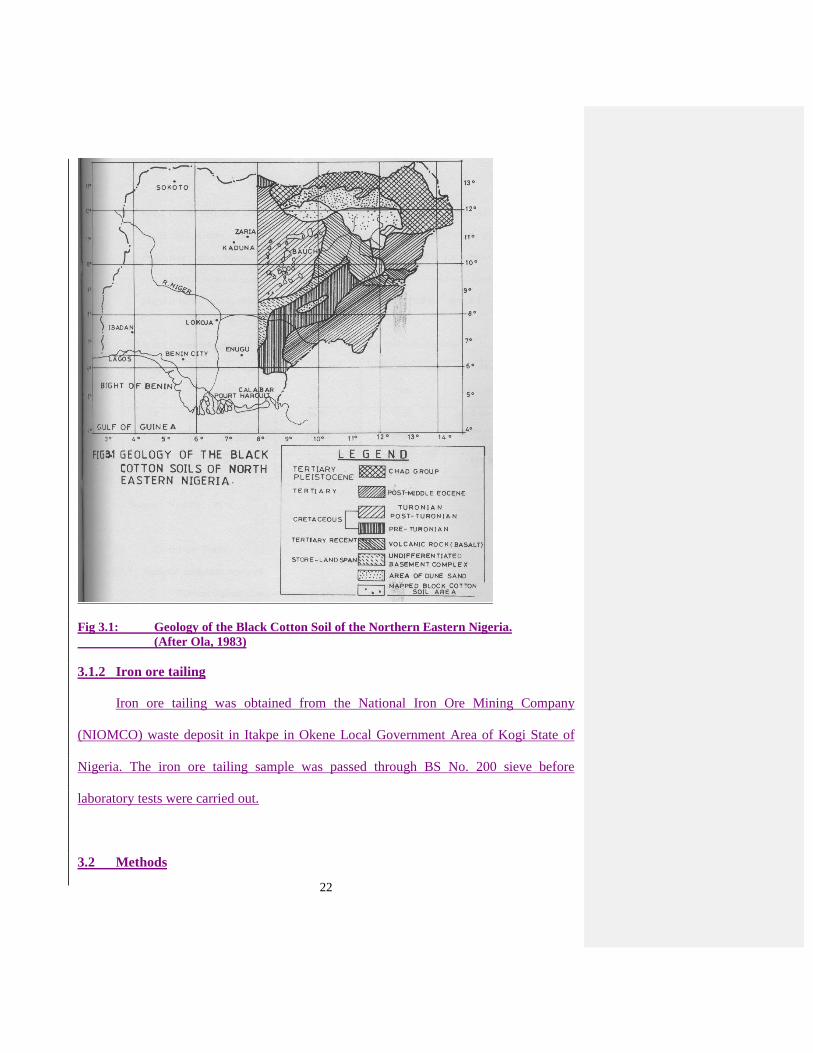
Morin (1971) reported that the Lake Chad Basin is the only extensive lacustrine deposit
of black cotton soil in Africa. The black cotton soils of north eastern Nigeria were laid during the
tertiary and quaternary periods of the Chad formation and are composed of a sequence of
lacustrine and fluviatile clays and sands of Pleistocene age. Figure 3.1 shows the geology of the
black cotton soil of the Northern Eastern Nigeria.
22
Fig 3.1: Geology of the Black Cotton Soil of the Northern Eastern Nigeria.
(After Ola, 1983)
3.1.2 Iron ore tailing
Iron ore tailing was obtained from the National Iron Ore Mining Company
(NIOMCO) waste deposit in Itakpe in Okene Local Government Area of Kogi State of
Nigeria. The iron ore tailing sample was passed through BS No. 200 sieve before
laboratory tests were carried out.
3.2 Methods

23
3.2.1 Moisture content
The natural moisture content of the black cotton soil (BCS) was determined in
accordance with BS 1377 (1990) Part 2; Test 1(A). A weighing container was cleaned
and weighed to the nearest 0.01g. Freshly crumbled sample was loosely placed in the
weighed container. The container with sample was weighed to the nearest 0.01g and
placed in a thermostatically controlled oven and dried at temperature 105-110⁰C for 24
hours. The dried sample and container were then weighed to the same accuracy.
Moisture content was determined using the equation
%100 13
32
MM
MMW (3.1)
W - Moisture content (%)
M1 - mass of container (g)
M2 - mass of container + wet soil (g)
M3 - mass of container + dry soil
Three different tests were carried out from which average natural moisture content was
determined.
3.2.2 Specific gravity
The determination of specific gravity was carried out according to BS 1377 (1990)
test (B) for fine–grained soils. The density bottle and the stopper were weighed to the
nearest 0.01g (m1). The air-dried soil was transferred into the density bottle, and the
bottle, content and the cover were weighed as m2. Water was then added just enough to
cover the soil, the solution is gently stirred to remove any air bubble. The bottle was then
completely filled up and covered. The covered bottle was then wiped dry and the whole

24
weighed to the nearest 0.01g (as m3). The bottle was subsequently emptied and filled
completely with water, wiped dry and weighed to the nearest 0.01g (m4). The specific
gravity is calculated using eqn. (3.2)
)()( 1314
12
mmmm
mmGS (3.2)
The procedure was repeated to obtain three values from which the average specific
gravity of the modified BCS and IOT were determined.
3.2.3 Particle size distribution
The particle size distribution of the natural soil was determined using both
sedimentation analysis and dry sieving of the coarse fraction as specified by BS 1377
(1990) for cohesive soils. The soil sample (200 g) was soaked for 24 hours and washed
through BS No. 200 sieve. The materials retained was oven-dried for 24 hours and sieved
by agitating it through a range of sieves from sieves No. 7 or 2.4 mm sieve and
downwards. The mixture that passes through sieve No. 200 was poured into a 1000 ml
measuring cylinder then 25 ml of sodium hexametaphosphate (commercial grade) was
added and stirred thoroughly, then hydrometer is immerse gently and readings were taken
at intervals stipulated by BS 1377; 1990 Part 2.
3.2.4 Atterberg limits
The Atterberg limits test included the determination of liquid limits, plastic limits
and plasticity indices of the natural and modified soil samples. They were also conducted
in accordance with Test 1(A) B S 1377 (1990) Part 2 for the natural soil and BS 1924
(1990) for the stabilized soils.

25
3.2.4.1 Liquid limit
Test 1(A) B.S 1377 (1990) describes the procedure for the determination of
liquid limit test of a soil which was adopted for this work. In this test, 200 g of the sample
material passing BS No. 40 sieve (425 µm aperture) was placed on a clean glass plate.
The soil was thoroughly mixed with water on this flat glass plate, using palette knife and
spatula to form a homogenous paste. A proportion of the paste was placed in Casagrande
apparatus and level parallel to the base of the chip and divided by drawing the grooving
tool through the paste along diameter passing the centre of the hinge. The crank was
turned to lift-drop the cup at the rate of 2 revs per second, noting the number of blows
(falls) that would make the bottom two parts of the groove come together. . The liquid
limit tests were determined at various moisture contents from drier states to the wetter
states. The moisture content was plotted against the respective number of blows on the
semi logarithm paper. The liquid limit was deduced as the moisture content
corresponding to 25 blows.
3.2.4.2 Plastic limit
A portion of the soil/soil–IOT mixes used for the liquid limit test was retained for the
determination of plastic limit. A small portion of the soil sample was put on a flat glass
plate and mixed thoroughly enough to be shaped into a small ball. The ball was then
moulded between fingers and then rolled on the glass plate with palm of hand into thread
of about 3mm diameter when the thread crumbles by shearing. The crumbled threads

26
were immediately put in weighing pan for moisture content determination. The same test
was performed for each of the modified soils.
3.2.4.3 Plasticity index
Having determined the values of the liquid limit and the plastic limit of the soil, plasticity
Indices of the natural and modified soil samples were derived using equation
PI = LL – PL (3.3)
where,
PI = Plasticity Index
LL= Liquid Limit
PL= Plasticity Limit
3.2.5 Linear shrinkage
The test was performed according to BS 1377 (1990), Test 5, by mixing 125 g of
soil passing sieve with 425 μm aperture with water to obtain a homogenous paste. Water
mixed with the soil sample was in the same amount as the moisture content
corresponding to the liquid limit. The sample was put in shrinkage mould and vibrated
gently in order to expel trapped air in the mixture. The soil in the mould was levelled
using spatula and then air dried at 60⁰C until the soil shrinks clear off the mould before
oven-drying at 105 to 110⁰C to establish a clear and complete shrinkage. After cooling,
the sample length was measured using ruler. The linear shrinkage was determined from
the equation:
% 100Length Initial
length) Dried -length (InitialShrinkageLinear
(3.4)
This test was carried out for all the soil samples considered.

27
3.2.6 Free swell
This test was carried out according to United State Bureau of Reclamation
(USBR) method (Holtz and Gibbs, 1959). Some 10 g of soil passing sieve with aperture
425 µm was oven dried and allowed to cool in a desiccator. The sample was then slowly
poured into 100 cc measuring cylinder to which water was added to the 100 cc mark. The
content was then shaken to obtain a homogenous mixture and should be allowed to settle
for at least 24 hours before the final level was recorded. Free swell was determined from
the equation:
100%Volume Inital
Volume Initial -Volume FinalSwell Free
(3.5)
3.2.7 Cation exchange capacity
The test was carried out in accordance with the procedures given by International Soil
and Reference Information Center, ISRIC (1998). Some quantity of the natural soil was
sieved through the 2 mm screen and 10g of the sieved sample was put into a 100 ml
plastic beaker. About 40 ml of ammonium acetate (1N at pH7) was added and stirred
using a glass rod and left over night. The sample was then filtered with a light suction
using a 55 mm Butcher funnel. The soil was leached with 250 ml of Ammonium acetate
( Ac) until no test for calcium could be obtained in the effluent solution. To test for
calcium, diluted Sodium hydroxide (NaOH), few drops of each of 1N Cl and 10 %
ammonium oxalate were added to 10 ml of the leachate in a test tube and heated to near
boiling point. The presence of calcium was indicated by a white precipitate or turbidity.
As long as calcium was detected, the process was repeated until there was no trace of it.

28
The calcium-free soil was then leached with neutral 1N ammonium chloride Cl four
times and once with 0.25 N of the acid. The electrolyte was then washed out using 150-
200 ml of isopropyl alcohol.
Chloride in the leachate was tested for using silver nitrate (0.1N AgN03) till its
trace was negligible, and the soil was left to drain thoroughly. A 10% percent acidified
NaCl was added little by little to the ammonium saturated soil until 250 ml had passed
through the sample, allowing each portion to pass through the sample before adding the
next portion. The leachate was transferred in quantities to flask for titration. To it, 25 ml
of 1N NaOH was added, and 60 ml of the solution distilled into 50mL of 2% . Ten
drops of bromocresol green-mythel was added. The colour changed from bluish green to
pink at the end of the titration. Blank titration was run on the reagents to correct titration
figure for the reagents and the milliequivalents of ammonium in 100g of soil was
calculated. The -borate was titrated with a standard acid 0.1N HCl in the blank
titration. The cation exchange capacity was calculated using eq. (3.6):
(3.6)
where
B = Blank
NA = Normality of acid
This same procedure was then repeated for each of the sample treated with IOT.
3.2.8 Compaction

29
Compaction tests on the soil samples were carried out in accordance with BS 1377
(1990) Part 4:3:3 using the British Standard light (BSL) and British Standard heavy
(BSH) energies.as well as West African Standard (WAS) described in Nigerian General
Specifications (1997). For the BSL, 3 kg of soil sample was thoroughly mixed with 8 %
of water (and the water is added at 8 % for each of the compactions). The wet soil was
then placed in 1000 mould and compacted in three equal layers; each layer
receiving 27 blows of 2.5 kg rammer, falling through a height of 300 mm. At the end of
the compaction, extension collar on the mould was removed and the top of the soil
trimmed to level by means of a straight edge. The weight of the mould and the soil
sample were measured. The weight of the mould and base had earlier been measured.
In the case of the BSH compactor, test mould of the same capacity was filled in
five layers and alternately compacted with 4.5kg rammer falling from 300mm up to 27
blows per layer. The same procedure was followed to determine moisture content. The
WAS compactive, effort was derived from a 4.5 kg rammer falling through 300 mm
height, 10 times on five layers of the soil and trimmed to level with the mould.
3.2.8.1 Maximum dry density
The bulk and dry density in (Mg/m3) was obtained for each of the soil samples
using equation:
1000
12 mm
(3.7)
The dry density was also calculated using the equation:
)100/(100 wd (3.8)

30
where,
ρ - Bulk density (Mg/m3)
m1 - Mass of empty mould and base (g)
m2 - Mass of mould, soil and base (g)
W - Moisture content (%)
ρd - Dry density.
The values of the dry densities as obtained from eqn. (3.8) were plotted against their
respective moisture contents and the maximum dry density (MDD) was deduced as the
maximum point on the resultant curves
3.2.8.2 Optimum moisture content
Optimum moisture content, the amount of water content corresponding to
maximum dry density of the sample read from the MDD/moisture content graph.
3.2.9 Unconfined compressive strength
The unconfined compressive strength (UCS) tests were performed on the soil
samples according to BS 1377; 1990 Part 7 using the British Standard light (BSL), West
African Standard (WAS) and British Standard heavy (BSH) energy levels. The natural air
dried soil sample/the stabilized soil samples were compacted in 1000 cm3
moulds at their
respective optimum moisture contents using the three energy levels described earlier. The
predetermined quantities of soil, iron ore tailing and water obtained from moisture-
density relationship were thoroughly mixed. Three samples for various percentages of
soil iron ore tailing mixes were extruded from the moulds and trimmed into a cylindrical
specimen of 38.1 mm diameter and 76.2 mm length. Each specimen was cured by sealing

31
in a polythene bag for 7, 14 and 28 days with another set of samples cured for 7days and
soaked in water for another 7 day for durability assessment.
At the elapsed day of curing, the specimens were then placed centrally on the
lower platen of a compression testing machine and a compressive force was applied to
the specimen with a strain control at 0.10 % mm. Record was taken simultaneously of the
axial deformation and the axial force at regular interval until failure of the sample
occurred. The UCS of the sample was determined at the point on the stress–strain curve
at which failure occurred. The UCS was calculated from the following equation:
Specimen of Area Surface
load Failurestrength eCompressiv
(3.9)
3.2.10 California bearing ratio
The California bearing ratio (CBR) test was carried out as a measure of strength of the
natural and stabilized soil. The aim of the CBR test was to determine the relationship
between force and penetration. The CBR is expressed by the force exerted by the plunger
by the depth of its penetration into the specimen. The tests were carried out in conformity
with the B.S. 1377 (1990), B.S. 1924 (1990) and the Nigerian General Specifications
(1997).
For the British Standard light (standard Proctor) compaction, 5 kg of the natural or
stabilised soil sample were mixed at respective optimum moisture content in 2360 cm3
mould, at the three compactive efforts. The mixture was then compacted in 3 equal layers
in the CBR mould, with 62 blows of the 2.5 kg rammer was applied to each layer for
BSL. For the WAS, the samples were compacted in five layers with 25 blows from the
4.5 kg rammer and for the BSH, the sample received 62 blows in 5 layers from the 4.5 kg

32
rammer. The extension collar was removed and the top of the compacted sample trimmed
carefully and waxed. The samples were kept in the humidity room at a temperature of 20
± 2°C and 100 % relative humidity for 6 days. Durability assessment of CBR specimens
entailed immersion of the 6 days cured specimens in water for about 24 hours before
testing; this is in accordance with the Nigerian General Specifications (1997). The
specimens were then transferred to the CBR testing machine. The plunger was then made
to penetrate the specimen at a uniform rate. The dial reading indicating, forces were taken
each at 0.25 mm interval of penetration until the maximum of 7.50 mm was attained or
alternatively until failure was reached. The bottom of the specimens was also tested in
like manner. The CBR curves were plotted using the values obtained from the tests. The
CBR was calculated at the penetration of 2.50 mm and 5.0 mm as:
%100load Standard
load MeasuredCBR
(3.10)
where standard load = 13.24 kN of 2.5 mm penetration
= 19.96 kN of 5.0 mm penetration
However, where the values are within 10 % of each other, the mean value of the
two readings was considered, otherwise the higher value was recorded as the CBR of
the specimen
3.2.11 Durability
The durability assessment (under adverse field conditions) of the soil sample was
determined by resistance to loss in strength when immersed in water. It was expressed as

33
the ratio of UCS of the specimen cured for 7 days and soaked for another 7 days to the
UCS of the specimen cured for 14 days:
%100cured)day UCS(14
soaked)day 7 curedday UCS(7(%)strength in loss toResistance
(3.11)
3.2.12 Analysis of variance
The problem of analyzing quality of estimated regression line can be handled by analysis
of variance (ANOVA). This procedure subdivides the total variations in independent
variables into meaningful components that are observed and treated in a systematic
manner. Let our experimental data be in the form (xi.yi) in n-numbers of experiments and
the regression line is estimated then (Montgomery, 2001)
where,
b = slope of underlying straight line of relationship.
An alternative and perhaps more informative formulation is
By using the above formula, the total experimental data are partitioned into two
components with corrected sum of squares of y that makes the best fit line of regression
to establish whether results of experiments fall within acceptable limits or confidence
level.
This partitioning shall be represented symbolically as:

34
where,
SSR = the regression sum of squares which reflects variation in the parallel values of the
model i.e. a postulated straight line.
SSE = the second component, the sum of squares of errors, reflecting variation about the
regression lines.
Suppose that we have to test the following hypothesis
HQ: β = 0,
HI: β ≠ 0,
Where the null hypothesis indicates that the model is µy\x = a. That means Y results from
chance or random fluctuations which are independent of values of x. Under the null
hypothesis it can be shown that SSR/o2 and SSE/σ
2 are values of chi-squared variables
with 1 and (n-2) degrees of freedom respectively. This implies that SST/a2
is also a value
of a chi-squared variable with n-1 degrees of freedom.
For the above hypothesis testing, let calculate
We should note that HQ is rejected as the level of significance, “when the null hypothesis
is rejected. That is, when the F-statistic exceed the critical value, fQ(l,n — 2), we conclude
that there is a significant amount of variation in the response accounted for by the
postulated straight line function. If the F-statistic is smaller we reject, we conclude that
the data did not reflect sufficient evidence to support the model postulated”. The
computed results from this analysis are presented by means of table of analysis of
35
variance. It is customary to refer to the various sums of squares divided by their
respective degrees of freedom as the mean squares.
3.2.13 Microanalysis
Microanalysis of specimens treated with optimal concentration of IOT was carried
out using a scanning electron microscope (SEM) to examine the structural arrangement.
The natural soil and soil sample that gave the optimum blend for the BSL compactive
effort were prepared and cured for 7 days and 28 days then a section of it was viewed
using the scanned electron microscope.

36
CHAPTER FOUR
RESULTS AND DISCUSSION
4.1 Properties of Materials Used in the Study
4.1.1 Black cotton soil
Preliminary tests conducted on the natural properties of the black cotton soil
revealed that the soil has low moisture content of 15.2 %. The index properties are
summarized in Table 4.1. The particle size distribution is shown in Fig. 4.1. The soil
belongs to the CH group in the Unified Soil Classification System (ASTM, 1992) or A-7-
6 (13) soil group of the AASHTO soil classification system (AASHTO, 1986). The soil is
greyish black in colour (from wet to dry states) with a liquid limit of 64.5 %, plastic limit
of 25 % and plasticity index of 39.5 %.
The soil has a free swell of about 85 %, soaked California bear ratio (CBR) values
of 3, 4 and 5 % for British Standard light, West African Standard and British Standard
heavy compaction energies, respectively, and unconfined compressive strength (UCS)
values of 238.03, 346.98 and 458.37 kN/m2 for the three energy levels, respectively. The
soil was found to be highly plastic and fell below the standard recommendation for most
geotechnical construction works especially highway construction in agreement with the
findings reported by Butches and Sailie (1984) as well as Osinubi and Medubi (1997a).
Detailed test results are given in Tables A4.2 – A4.11 in Appendix A.

37
Table 4.1: Properties of the natural soil Property Quantity
Percentage Passing BS No. 200 sieve
Natural Moisture Content, %
Liquid Limit, %
Plastic Limit, %
Plasticity Index, %
Linear Shrinkage, %
Free Swell, %
Specific Gravity
AASHTO Classification
USCS
Maximum Dry Density, Mg/m3
British Standard light
West African Standard
British Standard heavy
Optimum Moisture Content, %
British Standard light
West African Standard
British Standard heavy
Unconfined Compressive Strength, kN/m2
British Standard light
West African Standard
British Standard heavy
California Bearing Ratio (Soaked), %
British Standard light
West African Standard
British Standard heavy
Colour
Dominant clay mineral
74.7
15.2
64.5
25.0
39.5
27.1
85.0
2.42
A-7-6 (13)
CH
1.38
1.52
1.59
28.5
18.5
16.5
238.03
346.98
458.37
3
4
5
Greyish black
Montmorillonite

38
Fig. 4.1: Particle size distribution curve for the natural soil
4.1.2 Iron ore tailing
The specific gravity of the iron ore tailing (IOT) was found to be 3.76. The high content
of silicon and iron oxides in IOT provided the required improvement in the stabilization
process. Table 4.3 shows the summary of the oxide composition of IOT
Table 4.2: Oxide composition of iron ore tailing
Oxide Concentration (%)
CaO
SiO2
Fe2O3
Al2O3
MnO
TiO2
K2O
PbO
Na2O
MgO
LOI
0.607
45.64
47.70
3.36
0.067
0.240
0.607
0.415
0.405
0.393
3.0
39
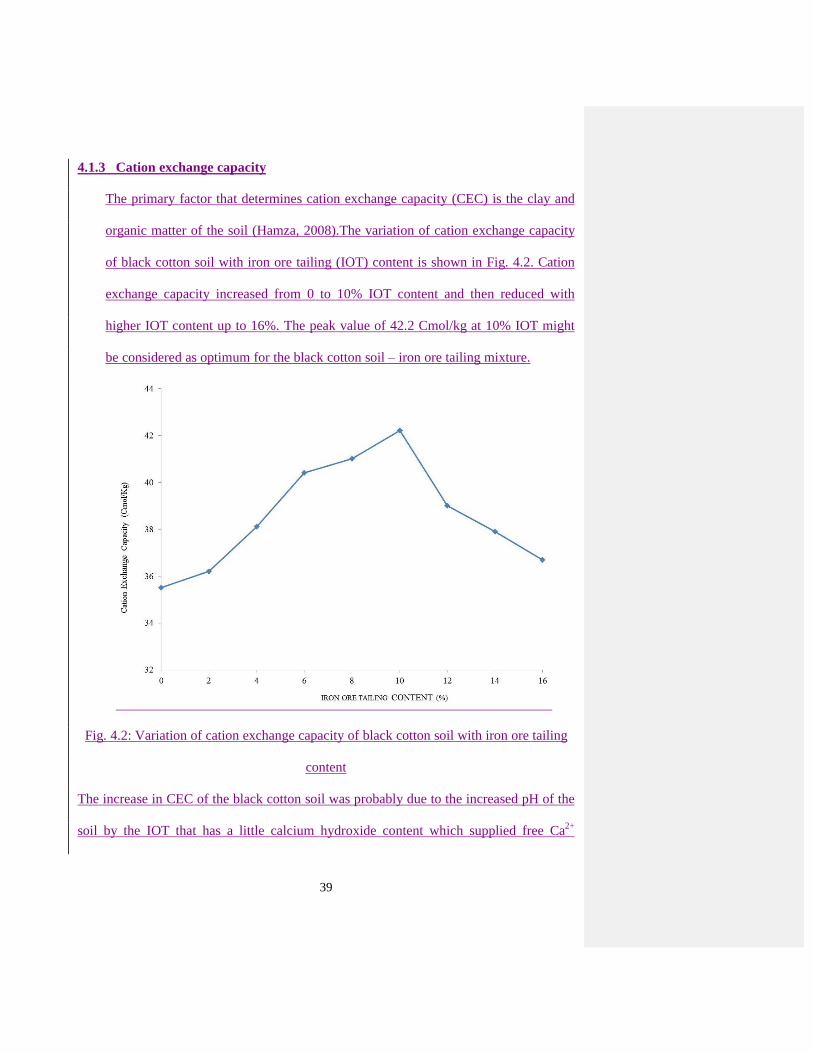
4.1.3 Cation exchange capacity
The primary factor that determines cation exchange capacity (CEC) is the clay and
organic matter of the soil (Hamza, 2008).The variation of cation exchange capacity
of black cotton soil with iron ore tailing (IOT) content is shown in Fig. 4.2. Cation
exchange capacity increased from 0 to 10% IOT content and then reduced with
higher IOT content up to 16%. The peak value of 42.2 Cmol/kg at 10% IOT might
be considered as optimum for the black cotton soil – iron ore tailing mixture.
Fig. 4.2: Variation of cation exchange capacity of black cotton soil with iron ore tailing
content
The increase in CEC of the black cotton soil was probably due to the increased pH of the
soil by the IOT that has a little calcium hydroxide content which supplied free Ca2+

40
required for the cation exchange between the clay mineral particles and additive. The
detailed results are given in Table A4.6 of Appendix A.
An analysis of variance (ANOVA) test on the CEC result shows that the effect of IOT on
black cotton soil was statistically significant (FCAL = 238.52> FCRIT = 4.49) . The detailed
test results are given in Table B4.1 of Appendix B.
4.2 Sieve Analysis
4.2.2 Wet sieving
The particle size distribution from hydrometer test for the natural and treated black
cotton soil samples are shown in Fig. 4.3. A reduction in the percentage of fines with
increasing IOT content can be noticed. It was observed that there was a slight reduction
in the silt fraction of the soil from 14.33 % for the natural soil to 0 % at 16 % IOT
content. This reduction may not be unconnected with the agglomeration and flocculation
of the clay particles and a result of ion exchange at the surface of the clay particles; as the
excess Ca2+
in IOT reacted with the lower valence metallic ions in the clay structure.
Detailed test results are given in Table A4.4(a) of Appendix A.

41
Fig. 4.3: Particle size distribution curves for black cotton soil – iron ore tailing
mixtures(Wet sieving)
4.2.3 Dry Sieving
4.2.3.1 Using optimum moisture content from British Standard light compaction
The particle size distribution of the modified soil using optimum moisture content
from BSL compaction is shown in Fig. 4.4. A reduction in the percentage of fines with
increasing IOT content was noticed.
The reduction in clay content was due to the hydration of IOT which acted as a
nucleus to which soil particles adhered. With increase in IOT content the quantity of free
silt and clay progressively reduced and coarser materials were formed in agreement with
Kedzi (1979), Osinubi (1995) and Sani (2012). Detailed test results are given in Table
A4.4 (b) of Appendix A.

42
Fig. 4.4: Particle size distribution curves for black cotton soil – iron ore tailing mixtures
(BSL compaction)
4.2.3.2 Using optimum moisture content from West African Standard compaction
The particle size distribution of the modified soil using optimum moisture content
from WAS compaction is shown in Fig. 4.4. A reduction in the percentage of fines with
increasing IOT content was noticed.
The reduction in clay content was due to the hydration of IOT which acted as a
nucleus to which soil particles adhered. With increase in IOT content the quantity of free
silt and clay progressively reduced and coarser materials were formed in agreement with
Kedzi (1979), Osinubi (1995) and Sani (2012). Detailed test results are given in Table
A4.4 (b) of Appendix A.

43
Fig. 4.5: Particle size distribution curves for black cotton soil – iron ore tailing mixtures
(WAS compaction)
4.2.3.3 Using optimum moisture content from British Standard heavy compaction
The particle size distribution for BSH compaction are shown in Fig. 4.6. There
was a reduction in the percentage of fines with increased in IOT content as shown on the
curves. A little change is noticed in the coarser sizes. The IOT content caused the soil -
IOT mixture to flocculate and agglomerate more and hence the mixture got coarser
enabling the clay particle to form pseudo silt sizes. The results are consistent with the
findings reported by Osula (1991), Obeahon (1993) and Oyelakin (2011). Detailed test
results are given in Table A4.4 (d) of Appendix A.

44
Fig. 4.6: Particle size distribution curves for black cotton soil – iron ore tailing mixtures
(BSH compaction)
4.3 Atterberg Limits
4.3.1 Liquid limit
The variation of liquid limit (LL) of the black cotton soil with iron ore tailing
content is shown in Fig.4.7. An initial increase in liquid limit with addition of IOT was
observed. The liquid limit increased from 64.5 % for the natural black cotton soil to 71 %
at 2% IOT content and thereafter steadily decreased to 59.9 % at 16% IOT content. The
initial increase in the liquid limit value could be due to pozzolanic substances in the IOT
that required more amount of water for hydration to go to completion while the reduction
might be the result of agglomeration and flocculation of the clay particles. Detailed test
results are given in Table A4.5 of Appendix A.

45
Fig. 4.7: Variation of Atterberg limits of black cotton soil with iron ore tailing
content
The analysis of variance (ANOVA) test results (see Table 4.3) shows that the effect of
the IOT on the liquid limit of black cotton soil was statistically significant (FCAL =
693.0489> FCRIT = 4.49). Detailed test results are given in Table B4.2 (a) of Appendix B.
Table 4.3 : Results of one - way analysis of variance for Atterberg limits of black
cotton soil - iron ore tailing mixtures
Property Source of
variation
Degree of
freedom
FcaL P-value Fcrit Remark
Liquid IOT 1 693.05 1.33E-14 4.49 FCAL> FCRIT,

46
Limit Significant effect
Plastic
Limit
IOT 1 117.53 8.83E-09 4.49 FCAL> FCRIT,
Significant effect
Plasticity
Index
IOT 1 165.37 7.5E-10 4.49 FCAL> FCRIT,
Significant effect
Linear
Shrinkage
IOT 1 41.33 8.33E-06 4.49 FCAL> FCRIT,
Significant effect
4.3.2 Plastic limit
The variation of the plastic limit of black cotton soil with iron ore tailing content is
shown in Fig. 4.7. Plastic limit increased from a value of 25 % for the natural black
cotton soil to a peak value of 34.9 % at 8% IOT content. Thereafter, it reduced with
higher IOT content to 27.5 % at 16 % IOT content. This trend is in conformity with the
findings reported by Alhassan (2006) and Mustapha (2006). Detailed test results are
given in Table A4.5 of Appendix A.
The analysis of variance (ANOVA) test results (see Table 4.3) shows that the
effect of IOT on the plastic limit of the treated black cotton soil was statistically
significant (FCAL = 117.43 > FCRIT = 4.49) Detailed test results are given in Table B4.2(b)
of Appendix B.
4.3.3 Plasticity index
The variation of the plasticity index of black cotton soil with iron ore tailing
content is shown in Fig. 4.7. There was an initial slight increase in the plasticity index
value from 39.5 % for the natural soil to 40.59 % at 2 % IOT content. Thereafter, the
value decreased to 42.4 % at 16 % IOT content. Detailed test results are given in Table
A4.5 of Appendix A.

47
The one-way analysis of variance (ANOVA) test results (see Table 4.3) shows that
the effect of IOT on the plasticity index of the treated black cotton soil was statistically
significant (FCAL = 165.36 > FCRIT = 4.49). Detailed test results are given in Table A4.2
(c) of Appendix B.
4.3.4 Linear shrinkage
The variation of the linear shrinkage of black cotton soil with iron ore tailing
content is shown in Fig. 4.7. Generally, the linear shrinkage of black cotton soil reduced
with higher IOT treatments from 27.14 % for the natural soil to 16.2 % at 16 % IOT
content. This trend is in conformity with the findings reported by Ola (1991), Osinubi
(1995, 1999) and Azige (2012). Detailed test results are given in Table A4.5 of Appendix
A.
The analysis of variance (ANOVA) test results (see Table 4.3) shows that the
effect of IOT on the linear shrinkage of black cotton soil was statistically significant
(FCAL = 41.32 > FCRIT = 4.49). Detailed test results are given in Table A4.2(d) of
Appendix B.
4.4 Compaction Characteristics
4.4.1 Maximum dry density
The variation of the maximum dry density (MDD) of black cotton soil with iron
ore tailing content for the three compactive efforts is shown in Fig. 4.8. The MDD values
increased with higher iron ore tailing content and compactive effort.

48
Fig. 4.8: Variation of maximum dry density of black cotton soil with iron ore tailing
content
Maximum dry density values increased from 1.38, 1.52 and 1.59 Mg/m3
for the natural
black cotton soil compacted with BSL, WAS and BSH energies, respectively, to 1.53,
1.66 and 1.72 Mg/m3, respectively, at 16 % IOT content. The increase in MDD for the
BSL, WAS and BSH compactive efforts is in conformity with the trend of increasing
MDD/decreasing OMC. This is as a result of IOT occupying the void within the soil
matrix in addition to the flocculation and agglomeration of the clay particle due to
exchange of ions (Osinubi, 2000 a; Moses, 2008; Oriola and Moses, 2010). Detailed test
results are given in Table A4.7 of Appendix A.

49
Results of one way analysis of variance for compaction characteristics of black
cotton soil – iron ore tailing mixtures are summarised in Table 4.4. The results shows that
the effect of IOT on the maximum dry density was statistically significant for BSL (FCAL
= 12.75 > FCRIT = 4.49), WAS ((FCAL = 12.30 > FCRIT = 4.49) and BSH (FCAL = 12.04 >
FCRIT = 4.49) compactions. Detailed test results are given in Table B4.3a - c of Appendix
B.
Results of two-way analysis of variance (ANOVA) for compaction characteristics of iron
ore tailing-compactive effort are summarised in Table 4.5. The results show that the
effect of the iron ore tailing and compactive effort on the maximum dry density was
statistically significant (FCAL = 74.85 > FCRIT = 2.59) for IOT and (FCAL = 900.04 > FCRIT
= 3.63). The effect of compactive effort was more significant than that of iron ore tailing.
Detailed test results are given in table B4.8 of Appendix B.
Table 4.4: Results of one-way analysis of variance for compaction characteristics of
black cotton soil - iron ore tailing mixtures
Property
Source
of
variation
Degree
of
freedom
Fcalulated P-value Fcritical Remark
BSL
MDD IOT 1 12.76 0.0025 4.49 FCAL> FCRIT,
Significant effect
OMC IOT 1 69.60 3.21E-
07 4.49
FCAL> FCRIT,
Significant effect
WAS MDD IOT 1
12.30 0.0029
4.49 FCAL> FCRIT,
Significant effect

50
OMC IOT 1
18.11 0.0006
4.49 FCAL> FCRIT,
Significant effect
BSH
MDD IOT 1
12.05 0.0032 4.49 FCAL> FCRIT,
Significant effect
OMC IOT 1
8.62 1.23E-
09
4.49 FCAL> FCRIT,
Significant effect
Table 4.5: Results of two-way analysis of variance for compaction characteristics of iron
ore tailing - compactive effort
Property Source of
variation
Degree
of
freedom
Fcalulated P-value Fcritical Remark
MDD
IOT 8
74.85106
3.24E-
11 2.591096
FCAL> FCRIT,
Significant
effect
COMPACTIVE
EFFORT 2
900.0426
3.63E-
17 3.633723
FCAL> FCRIT,
Significant
effect
OMC
IOT
8
54.73333
3.58E-
10 2.591096
FCAL> FCRIT,
Significant
effect
COMPACTIVE
EFFORT
2
1499.893
6.28E-
19 3.633723
FCAL> FCRIT,
Significant
effect
4.4.2 Optimum moisture content
The variation of optimum moisture content of black cotton soil with IOT for BSL,
WAS and BSH compactive efforts is shown in Fig. 4.9. Optimum moisture content
(OMC) values decreased from 28.5, 18.5 and 11.5 % for the natural black cotton soil
compacted with BSL, WAS and BSH energies, respectively, to minimum values of 22.0
14.0 and 11.5 % at 16, 14 and 14 % IOT contents, respectively.

51
Fig. 4.9: Variation of optimum moisture content of black cotton soil with iron ore tailing
content
The decrease in OMC values were probably due to self –desiccation in which all
the water was used, resulting in low hydration. When no water movement to or from soil-
IOT paste is permitted, the water is used up in the hydration reaction, until too little is left
to saturate the solid surfaces and hence the relative humidity within the paste decreases.
The process described above might have affected the reaction mechanism of IOT treated
black cotton soil (Osinubi and Stephen, 2007, Moses, 2008).
Furthermore, the cause for the reduction in the OMC values can also be explained
as follows: the cation exchange between additives and expansive soil decreases the
thickness of electric double layer and promotes the flocculation. The flocculation of the

52
solid particles implies that the water-additives–soil mixtures can be compacted with
lower water content, and the optimum water content is reduced (Bose, 2012).
The observed decrease of OMC values with higher compactive efforts was
because it was easier to breakdown flocculated aggregates, destroy shear planes and
eliminate large pores, at higher compactive efforts (Osinubi, 1999). Detailed test results
are given in Table A4.9 of Appendix A.
Results of one way analysis of variance for compaction characteristics of
black cotton soil – iron ore tailing mixtures given in Table 4.4 show that the effect of IOT
on the optimum moisture content of black cotton soil was statistically significant for BSL
(FCAL = 69.59 > FCRIT = 4.49), WAS (FCAL = 18.11 > FCRIT = 4.49) and BSH (FCAL = 8.61
> FCRIT = 4.49) Detailed test results are given in Table B4.4 (c) of Appendix B.
Results of two-way analysis of variance (ANOVA) for compaction characteristics
of iron ore tailing-compactive effort are summarised in Table 4.5. The results show that
the effect of the iron ore tailing and compactive effort on the optimum moisture content
was statistically significant (FCAL = 54.73 > FCRIT = 2.59) for IOT and (FCAL = 1499.89 >
FCRIT = 3.63). The effect of compactive effort was more significant than that of iron ore
tailing. Detailed test results are given in table B4.9 of Appendix B.
4.5 Strength Characteristics
4.5.1 Unconfined compressive strength
The main test recommended for use for determining required amount of
additive to be used in the stabilization of soils is the unconfined compressive strength

53
(UCS) test (Singh, 1991). It is an important factor in the evaluation of the design criteria
for the use of soil as a pavement material (Ola, 1983).
4.5.1.1 7 days curing period
The UCS of specimens compacted at the energy levels of the BSL, WAS and BSH
and cured for 7 days are shown in Fig. 4.10. Generally, UCS values increased with higher
compactive effort and IOT content.
Fig. 4.10 Variation of unconfined compressive strength (7 days curing period) of black
cotton soil with iron ore tailing content
For BSL compaction, UCS values increased from 172.59 kN/m2 for the natural
black cotton soil to 337.77 kN/m2 at 16 % IOT. The compaction carried out using WAS
energy showed that UCS value increased from 328.36 kN/m2
for the natural soil to a peak
value of 487.57 kN/m2 at 10 % IOT content and thereafter reduced to 429.99 kN/m
2 at 16
% IOT treatment. With respect to BSH compaction, UCS values increased from
488.83kN/m2 for the natural black cotton soil to 821.57kN/m
2 at 12 % IOT content and
thereafter reduced to 754.94kN/m2 at 16 % IOT content. The increase in UCS values

54
could be attributed to ion exchange at the surface of clay particles. The Ca2+
in the
additives reacted with the lower valence metallic ions in the clay microstructure which
resulted in agglomeration and flocculation of the clay particles (Moses and Saminu,
2012). Detailed test results are given in Table A4.9 of Appendix A.
Results of analysis of variance (ANOVA) for strength characteristics of black
cotton soil – iron ore tailing mixtures are given in Table 4.6. For BSL, WAS and BSH
compactions the results show that the effect of IOT on unconfined compressive strength
(7 days curing period) was statistically significant for BSL (FCAL = 154.49.39 > FCRIT =
4.49), WAS (FCAL = 661.26 > FCRIT = 4.49) and BSH (FCAL = 309.15 > FCRIT = 4.49)
compactive efforts. Detailed test results are given in Table B4.5 of Appendix B.
Results of two-way analysis of variance (ANOVA) for strength characteristics of
iron ore tailing-compactive effort are summarised in Table 4.7. The results show that the
effect of the iron ore tailing and compactive effort on the unconfined compressive
strength (7 days curing period) was statistically significant (FCAL = 6.48 > FCRIT = 2.59)
for IOT and (FCAL = 198.75 > FCRIT = 3.63). The effect of compactive effort was more
significant than that of iron ore tailing. Detailed test results are given in table B4.10a of
Appendix B.

55
Table 4.6: Results of analysis of variance for unconfined compressive strength of
black cotton soil - iron ore tailing mixtures
Property Source
of
variation
Degree
of
freedom
Fcalulated P-value Fcritical Remark
BSL
7 Days IOT 1 154.5 1.23E-09 4.49 Significant effect
14 Days IOT 1 319.01 5.43E-12 4.49 Significant effect
28 Days IOT 1 296.09 9.59E-12 4.49 Significant effect
7+7 Days IOT 1 48.97 3E-06 4.49 Significant effect
WAS
7 Days IOT 1 661.26 6.90E-12 4.49 Significant effect
14 Days IOT 1
781.09 5.22E-15
4.49 Significant effect
28 Days IOT 1
228.53 6.80E-11
4.49 Significant effect
7+7 Days IOT 1
63.28 5.97E-07
4.49 Significant effect
BSH
7 Days IOT 1 309.15 6.90E-12 4.49 Significant effect
14 Days IOT 1
264 9.59E-12 4.49 Significant effect
28 Days IOT 1
307.23 7.24E-12 4.49 Significant effect
7+7 Days IOT 1
171.08 5.84E-10 4.49 Significant effect
7, 14 and 28 days - Curing periods
7 + 7 days – 7 days cured + 7 days soaked
Table 4.7: Results of Two-way analysis of variance for unconfined compressive
strength of iron ore tailing - compactive effort
Property
Source of
variation
Degree
of
freedom
Fcalulated P-value Fcritical Remark
UCS 7 IOT 8
6.484655 0.000779 2.591096
FCAL>
FCRIT,
Comment [KJO4]: Table should not be broken
Comment [KJO5]: Table should not be broken

56
4.5.1.2 14 days curing period
The UCS of specimens compacted at the energy levels of the BSL, WAS and BSH
and cured for 14 days are shown in Fig. 4.11.The UCS values increased with higher IOT
content and compactive effort.
DAYS Significant
effect
COMPACTIVE
EFFORT 2
198.7564 5.02E-12 3.633723
FCAL>
FCRIT,
Significant
effect
UCS 14
DAYS
IOT
8
9.585109 7.91E-05 2.591096
FCAL>
FCRIT,
Significant
effect
COMPACTIVE
EFFORT
2
125.6755 1.65E-10 3.633723
FCAL>
FCRIT,
Significant
effect
UCS 28
DAYS
IOT
8
19.62054 6.84E-07 2.591096
FCAL>
FCRIT,
Significant
effect
COMPACTIVE
EFFORT
21
201.0831 4.59E-12 3.633723
FCAL>
FCRIT,
Significant
effect
UCS 7 + 7
DAYS
IOT
8
41.33723 2.99E-09 2.591096
FCAL>
FCRIT,
Significant
effect
COMPACTIVE
EFFORT
2
56.21174 5.81E-08 3.633723
FCAL>
FCRIT,
Significant
effect

57
Fig. 4.11: Variation of unconfined compressive strength (14 days curing period) of
black cotton soil with iron ore tailing content
For BSL compaction the UCS values increased from 238.03 kN/m2 for natural
black cotton soil to 432.16 kN/m2 at 16 % IOT. The compaction carried out using WAS
and BSH energies showed that UCS increased from 346.98 and 458.37 kN/m2 for natural
soil to peak values of 478.1 and 789.23 kN/m2
, respectively, at 14 % IOT content.
Detailed test results are given in Table A4.9(a) of Appendix A.
This increase in compressive strength with curing period can be attributed to time
dependent strength gain of the pozzolanas.
Results of analysis of variance (ANOVA) for strength characteristics of black
cotton soil – iron ore tailing mixtures are given in Table 4.6. For BSL, WAS and BSH
compactions the results show that the effect of IOT on the unconfined compressive

58
strength (14 days curing period) was statistically significant for BSL (FCAL = 319.01 >
FCRIT = 4.49, WAS (FCAL =781.09 > FCRIT = 4.49, BSH (FCAL = 263.99 > FCRIT = 4.49).
Detailed test results are given in Table A4.5 (d, e and f) of the Appendix.
Results of two-way analysis of variance (ANOVA) for strength characteristics of
iron ore tailing-compactive effort are summarised in Table 4.7. The results show that the
effect of the iron ore tailing and compactive effort on the unconfined compressive
strength (14 days curing period) was statistically significant (FCAL = 9.58 > FCRIT = 2.59)
for IOT and (FCAL = 125.67 > FCRIT = 3.63). The effect of compactive effort was more
significant than that of iron ore tailing. Detailed test results are given in table B4.10b of
Appendix B.
4.5.1.3 28 days curing period
The UCS of specimens compacted at the energy levels of the BSL, WAS and BSH
and cured for 28 days are shown in Fig. 4.12. Generally, UCS values increased with
higher compactive effort and IOT content.
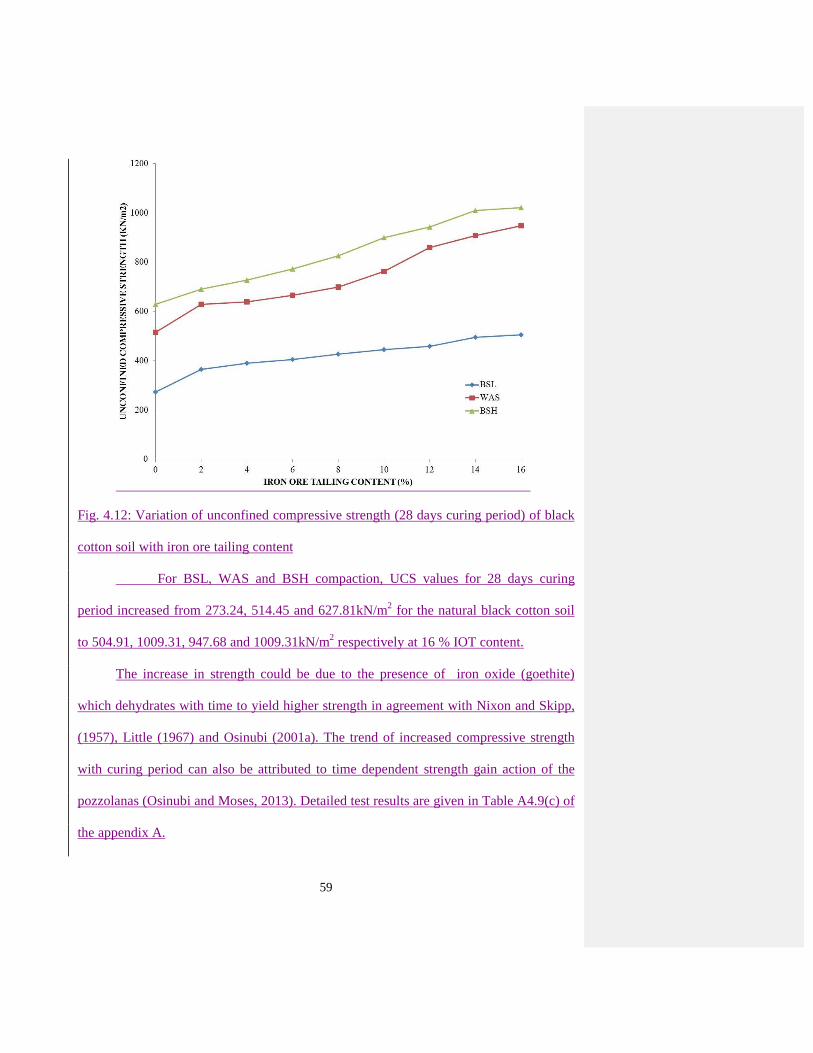
59
Fig. 4.12: Variation of unconfined compressive strength (28 days curing period) of black
cotton soil with iron ore tailing content
For BSL, WAS and BSH compaction, UCS values for 28 days curing
period increased from 273.24, 514.45 and 627.81kN/m2 for the natural black cotton soil
to 504.91, 1009.31, 947.68 and 1009.31kN/m2 respectively at 16 % IOT content.
The increase in strength could be due to the presence of iron oxide (goethite)
which dehydrates with time to yield higher strength in agreement with Nixon and Skipp,
(1957), Little (1967) and Osinubi (2001a). The trend of increased compressive strength
with curing period can also be attributed to time dependent strength gain action of the
pozzolanas (Osinubi and Moses, 2013). Detailed test results are given in Table A4.9(c) of
the appendix A.

60
Results of analysis of variance (ANOVA) for strength characteristics of black
cotton soil – iron ore tailing mixtures are given in Table 4.6. For BSL, WAS and BSH
compactions the results show that the effect of IOT on the unconfined compressive
strength (28 days curing period) was statistically significant for BSL (FCAL = 296.09 >
FCRIT = 4.49), WAS (FCAL = 228.52 > FCRIT = 4.49), BSH (FCAL = 307.22 > FCRIT = 4.49).
Detailed test results are given in Table B4 .5 (g, h and i) of Appendix B.
Results of two-way analysis of variance (ANOVA) for strength characteristics of
iron ore tailing-compactive effort are summarised in Table 4.7. The results show that the
effect of the iron ore tailing and compactive effort on the unconfined compressive
strength (28 days curing period) was statistically significant (FCAL = 19.62 > FCRIT = 2.59)
for IOT and (FCAL = 201.08 > FCRIT = 3.63). The effect of compactive effort was more
significant than that of iron ore tailing. Detailed test results are given in table B4.10c of
Appendix B.
4.5.1.4 7 days curing and 7 days soaking periods
The UCS of specimens compacted at the energy levels of the BSL, WAS and BSH
and cured for 7 days curing and 7 days soaking periods are shown in Fig 4.13. UCS
values increased with higher compactive effort and IOT content.

61
Fig. 4.13: Variation of unconfined compressive strength (7 days curing + 7 days
soaking) of black cotton soil with iron ore tailing content
UCS values for specimens compacted at the energies of the BSL, WAS and BSH,
increased from 25.72, 41.08 and 60.02 kN/m2
for the natural black cotton soil to peak
values of 90.37, 115.14 and 120.03 kN/m2
at 10, 12 and 10 % IOT respectively and then
reduced to minimum values of 59.70, 78.90 and 97.05 kN/m2 at 16 % IOT treatment. It
is pertinent to note here that the UCS values for the soaked specimens are too low
compared to those obtained for 7 and 14 days curing periods; which is probably due to
the ingress of water that resulted in loss of strengths. Detailed test results are given in
Table A4.9(d) of Appendix A.
Results of analysis of variance (ANOVA) for strength characteristics of black
cotton soil – iron ore tailing mixtures are given in Table 4.6. For BSL, WAS and BSH

62
compactions the results show that the effect of IOT on the unconfined compressive
strength (7 days curing + 7 days soaking periods) was statistically significant for BSL
(FCAL = 48.96 > FCRIT = 4.49), WAS (FCAL = 63.27 > FCRIT = 4.49) and BSH (FCAL =
171.08 > FCRIT = 4.49). Detailed test results are given in Table B4.5 (j, k and l) of
Appendix B.
Results of two-way analysis of variance (ANOVA) for strength characteristics of
iron ore tailing-compactive effort are summarised in Table 4.7. The results show that the
effect of the iron ore tailing and compactive effort on the unconfined compressive
strength (7 days curing and 7 days soaking periods) was statistically significant (FCAL =
41.33 > FCRIT = 2.59) for IOT and (FCAL = 56.21 > FCRIT = 3.63). The effect of
compactive effort was more significant than that of iron ore tailing. Detailed test results
are given in table B4.10d of Appendix B.
4.6 California Bearing Ratio
California bearing ratio (CBR) is an important parameter that indicates the
strength and bearing ability of a soil, which will assist the designer in recommending or
rejecting the soil as suitable for base or sub-base for a flexible road pavement.
4.6.1 Unsoaked California bearing ratio
The variation of California bearing ratio (unsoaked condition) with iron ore tailing
content for specimens compacted at the energy levels of the BSL, WAS and BSH is
shown in Fig. 4.14. For BSL, WAS and BSH compactions, unsoaked CBR values
increased from 8, 10 and 15 % for the natural black cotton soil to peak values of 29, 20
and 17 % were recorded at 12, 14 and 12 % IOT content, respectively.

63
Detailed test results are given in Table A4.10(a) of Appendix A.
Fig. 4.14: Variation of California bearing ratio (unsoaked condition) with iron ore tailing
content
The Nigerian General Specifications (1997) recommends that a CBR value of 180
% should be attained in the laboratory for cement stabilization. However, an unsoaked
CBR value of 80 % is required for bases and soaked value of 30 % for sub-bases both
when compacted at optimum moisture content and at 100 % West African Standard
compaction (Gidigasu and Dogbey, 1980; Gidigasu, 1982; Osinubi, 2001a). The CBR
values recorded for the IOT stabilized soil at the three compactive efforts are lower than
those prescribed by Nigerian General Specifications (1997). It implies that IOT cannot be
used as a „stand alone‟ additive.
Results of analysis of variance (ANOVA) for unsoaked CBR of black cotton soil –
iron ore tailing mixtures are given in Table 4.8. For WAS and BSH compactions the

64
results show that the effect of IOT on the unsoaked CBR was statistically significant for
WAS (FCAL = 10.69 > FCRIT = 4.49) and BSH (FCAL = 36.88 > FCRIT = 4.49). Detailed test
results are given in Table B4.6(a, b andc) of Appendix B.
Results of two-way analysis of variance (ANOVA) for California bearing ratio of
iron ore tailing-compactive effort are summarised in Table 4.9. The results show that the
effect of the iron ore tailing and compactive effort on the unsoaked CBR was statistically
significant (FCAL = 7.75 > FCRIT = 2.59) for IOT and (FCAL = 52.67 > FCRIT = 3.63). The
effect of compactive effort was more significant than that of iron ore tailing. Detailed test
results are given in table B4.11 of Appendix B.
Table 4.8: Results of one-way analysis of variance for California bearing ratio of
black cotton soil-iron ore tailing mixtures
Property
Source of
Variation
Degree
of
Freedom
FCAL P-value FCRIT Remark
BSL
Unsoaked IOT 1 4.16 0.0582 4.49 No Significant
effect
Soaked IOT 1 4.10 0.0598 4.49 No Significant
effect
WAS
Unsoaked IOT 1 10.70 0.0048 4.49 Significant
effect
Soaked IOT 1 0.79 0.3863 4.49 No Significant
effect
BSH
Unsoaked IOT 1 36.88 1.61E-05 4.49 Significant
effect
Soaked IOT 1 0.17 0.6857 4.49 No Significant
effect
Table 4.9: Results of two - way analysis of variance for California bearing ratio of
iron ore tailing - compactive effort
Property
Source of
variation
Degree
of
freedom
Fcalulated P-value Fcritical Remark
UNSOAKED
CBR
IOT 8
7.74834 0.000284 2.591096
FCAL>
FCRIT,
Significant
effect

65
COMPACTIVE
EFFORT 2
52.6748 9.13E-08 3.633723
FCAL>
FCRIT,
Significant
effect
SOAKED
CBR
IOT
8
9.516362 8.27E-05 2.591096
FCAL>
FCRIT,
Significant
effect
COMPACTIVE
EFFORT
2
65.63648 1.94E-08 3.633723
FCAL>
FCRIT,
Significant
effect
4.6.2 Soaked California bearing ratio
The variation of California bearing ratio (24 hours soaking period) with iron ore
tailing content for specimens compacted at the energy levels of the BSL, WAS and BSH
is shown in Fig. 4.15. It was observed that with higher IOT content and

66
Fig. 4.15: Variation of California bearing ratio (24 hours soaking period) with iron ore
tailing content
compactive effort, CBR values increased to peak values of 6, 9 and 11 % for BSL, WAS
and BSH compaction respectively at 12 % IOT content. The recorded soaked CBR values
did not meet the 30 % requirement for sub-bases both when compacted at optimum
moisture content and at 100 % West African Standard compaction. Detailed test results
are given in Table A4.10(b) of Appendix A.
Results of analysis of variance (ANOVA) for CBR (soaked for 24 hours) of black
cotton soil – iron ore tailing mixtures are given in Table 4.8. For BSL, WAS and BSH
compactions the results show that the effect of IOT on the soaked CBR was not
statistically significant for BSL (FCAL = 4.10 < FCRIT = 4.49), WAS (FCAL = 0.79 < FCRIT =
4.49) and BSH (FCAL = 0.16 < FCRIT = 4.49). Detailed test results are given in Table
B4.6(d, e and f) of Appendix B.
Results of two-way analysis of variance (ANOVA) for California bearing ratio of
iron ore tailing-compactive effort are summarised in Table 4.9. The results show that the
effect of the iron ore tailing and compactive effort on the soaked CBR was statistically
significant (FCAL = 9.51 > FCRIT = 2.59) for IOT and (FCAL = 65.63 > FCRIT = 3.63). The
effect of compactive effort was more significant than that of iron ore tailing. Detailed test
results are given in table B4.12 of Appendix B.
4.7 Microanalysis
Microstructure of specimens before and after treatment with optimal concentration
of IOT were observed on the Scanning Electron Microscope (SEM). The objectives were
to obtain a SEM micrograph to investigate the bond formation, the surface texture, the

67
mineral structure and geometry of the element due to the curing and iron ore tailing-soil
interaction (Saravut et al., 2012).
4.7.1 7 days curing period micrographs for British Standard light compaction
The micrographs of UCS specimens of the natural soil and 10 % IOT treated black
cotton soil cured for 7 days are shown on Plates 4.1 and 4.2, respectively.
The micrograph of the natural soil after 7 days curing shows that the soil was cohesive
because
almost no significant
reaction might
have occurred
during the curing
period.
Plate 4.1:
Micrograph of
natural black cotton
soil (7 days curing)
Comment [KJO6]: It is better to place the plates beside each other for comparative purpose.

68
Plate 4.2: Micrograph of black cotton soil - 10 % iron ore tailing mixture
(7 days curing)
As IOT was added to the soil there was a slight reduction in the cohesiveness of
the soil due to the cation exchange reaction which forced the weakly bonded ions in the
clay structure to be substituted by the more active and higher valent cations and this led
to the flocculation and liberation of water bonded at the outer layers (Asma and Dariusz,
2013).
4.7.2 28 days curing period micrographs for British Standard light compaction
The micrographs of UCS specimens of the natural and 10 % IOT treated black
cotton soil cured for 28 days are shown on Plates 4.3 and 4.4, respectively. The
micrograph of UCS specimens of the natural soil cured for 28 days is not significantly
different from that of specimen cured for 7 days although their structural particle
arrangements appear to be different. This could be attributed to lesser inter-surface
activity that might have taken place during curing.
Comment [KJO7]: It is better to place the plates beside each other for comparative purpose.

69
Plate 4.3:
Micrograph of
natural black cotton
soil (28 days curing)

70
Plate 4.4: Micrograph of black cotton soil - 10 % iron ore tailing mixture
(28 days curing)
The micrograph of black cotton soil – 10 % IOT mixture cured for 28 days
gives a better view of how the sample became coarser than those of specimens
cured for 7 days. A complete reaction of the soil-iron ore tailing mixture might
have taken place with complete cation exchange and the gain in full strength after
28 days (Sani, 2012).
4.8 Durability
In order to simulate the worst condition that could occur in the field, durability
was evaluated by the immersion of specimens in water to determine resistance to loss in
strength which is more acceptable for tropical regions like Nigeria (Ola, 1974). The
resistance to loss in strength was determined as the ratio of the unconfined compressive
strength of specimen cured for 7 days, and later immersed in water for 7 days, to those
cured for 14 days. Conventionally, an allowable 20% loss in strength is recommended for
a specimen cured for 7 days and immersed in water for 4 days (Ola, 1974; Osinubi,
1998a; 1999).
The variation of resistance to loss in strength.of black cotton soil with iron ore
tailing content for BSL, WAS and BSH compactions is shown in Fig. 4.16. For BSL,
WAS and BSH compactions, resistance to loss in strength increased from 10.81 % (i.e.,
loss in strength of 89.19 %), 11.84 % (i.e., loss in strength of 88.16%) and 13.09 % (i.e.,
loss in strength of 86.91%) % for the natural black cotton soil to peak values of 24.71%
(i.e., loss in strength of 75.29 %), 24.73 % (i.e., loss in strength of 75.27 %) and 17.18 %
(i.e., loss in strength of 82.82 %) at 8, 12 and 10 % IOT contents, respectively.

71
Fig. 4.16: Variation of resistance to loss in strength.of black cotton soil with iron ore
tailing content
The recorded peak resistance to loss in strength value of 24.73 % is above 20 % as
required maximum. This implies that the IOT stabilized black cotton soil sample did not
meet the minimum durability requirement for use in pavement construction. Detailed test
results are given in Table A4.11 of Appendix A.
Results of analysis of variance (ANOVA) for durability of black cotton soil – iron
ore tailing mixtures are given in Table 4.10. For BSL, WAS and BSH Compactions the
results show that the effect of IOT on the durability was statistically significant for BSL
(FCAL = 14.86 > FCRIT = 4.49) , WAS (FCAL = 16.92 > FCRIT = 4.49) and BSH (FCAL =
12.13 > FCRIT = 4.49 ) compactive efforts. Detailed test results are given in Table B4.7 of
Appendix B.

72
Table 4.10: Results of analysis of variance for durability of black cotton soil - iron ore
tailing mixtures
Property Source of
Variation
Degree of
Freedom FCAL P-Value FCRIT Remark
BSL
IOT 1 14.87 0.0014 4.49 Significant
effect
WAS
IOT 1 16.93 0.0008 4.49 Significant
effect
BSH
IOT 1 12.13 0.0031 4.49 Significant
effect
Table 4.11: Results of two - way analysis of variance for durability of iron ore
tailing-compactive effort
Property
Source of
variation
Degree
of
freedom
Fcalulated P-value Fcritical Remark
RESISTANCE
TO LOSS IN
STRENGTH
IOT 8
5.653084 0.00163 2.591096
FCAL>
FCRIT,
Significant
effect
COMPACTIVE
EFFORT 2
4.581997 0.026713 3.633723
FCAL>
FCRIT,
Significant
effect
Results of two-way analysis of variance (ANOVA) for durabilty of iron ore
tailing-compactive effort are summarised in Table 4.11. The results show that the effect
of the iron ore tailing and compactive effort on the durabity was statistically significant
(FCAL = 5.65 > FCRIT = 2.59) for IOT and (FCAL = 4.58 > FCRIT = 3.63). The effect of
compactive effort was more significant than that of iron ore tailing. Detailed test results
are given in table B4.13 of Appendix B.
CHAPTER FIVE
CONCLUSION AND RECOMMENDATION
5.1 Conclusion

73
The preliminary investigation conducted on the natural black cotton soil collected
at Baure, in Deba L.G.A of Gombe State shows that it falls under A-7-6 (13)
classification for AASHTO (1986) and CH according to Unified Soil Classification
System (ASTM, 1992). The natural soil has low moisture content of 15.17 %, liquid limit
of 64.5 %, plastic limit of 25 %, plasticity index of 39.5 %, linear shrinkage of 27.14 %,
free swell of 85 %, and specific gravity of 2.42. These values indicate that the soil is of
high plasticity with about 74.7 % of the soil particles passing the BS. No 200 sieve.
The gradation of the black cotton soil improved as the iron ore tailing (IOT)
content increased. The Atterberg limits showed that the liquid limit increased from 64.5
% of the natural at 0 % IOT to 71 % at 2 % IOT content then decreased to 59.9 % at 16 %
IOT content. Plastic limit increased from a natural soil value of 25 % to a peak value of
34.9 % at 8 % IOT content and then reduced to 27.46 % at 16 % IOT content. The
plasticity index reduced from the natural soil value of 39.5 % to 32.44 % at 16 % IOT
content.
The maximum dry density (MDD) of black cotton soil increased with higher IOT
content and compactive efforts from 1.38, 1.52 and 1.59 Mg/m3
for the natural soil when
compacted using British Standard light (BSL), West African Standard (WAS) and British
standard heavy (BSH) energies, respectively, to 1.53, 1.66 and 1.72 Mg/m3, at 16 % IOT
content.
The optimum moisture content (OMC) values decreased from 28.5, 18.5 and
16.5% for the natural black cotton soil to minimum values of 22, 14 and 11.5 % at 16, 14

74
and 14% IOT contents when compacted at the energy levels of the BSL, WAS and BSH,
respectively.
The 7 day unconfined compressive strength (UCS) values for BSL, WAS and
BSH compactive efforts recorded for the natural black cotton soil were 172.59, 328.36
and 448.83 kN/m2, respectively. The UCS values of the treated soil increased to 337.77,
479.44 and 821.57 kN/m2 at 16, 12 and 12 % IOT content, respectively, for the three
energy levels considered. These did not meet the 1710 kN/m2 prescribed by Road Note
31 for economic range of ordinary Portland cement stabilization.
The soaked CBR values of 3, 4 and 5 % for the natural black cotton soil
compacted with BSL, WAS and BSH energies, respectively, increased to peak values of
6, 9 and 11 %, respectively, when treated with 12 % IOT. None of the recorded peak
CBR values for the three energy levels meets the minimum requirement of 15 %
prescribed by the Nigerian General Specifications, section vi, clause 6201 for subgrade
materials compacted at the BSL energy level.
The resistance to loss in strength of black cotton soil increased from 10.81, 11.84,
and 13.09 % for the natural soil to peak values of 24.71, 24.73 and 17.18 % for BSL,
WAS and BSH compaction energies at 8, 12, and 10 % IOT contents, respectively. The
recorded peak resistance to loss in strength of value (75.29 %) fell short of the acceptable
conventional 80 % accepted as maximum resistance to loss in strength.
Based on the foregoing, an optimal 10 % iron ore tailing treatment of black cotton
soil when compacted with British Standard heavy energy can be used as sub base
material in road construction.

75
5.2 Recommendation
Based on the results obtained in this study:
1. An optimal 10 % iron ore tailing content can be used to improve the properties
of black cotton soil when compacted with BSH energy.
2. Iron ore tailing (IOT) cannot be used as a stand-alone stabilizer but should
be used as admixture in lime or cement stabilization of black cotton soil.

76
REFERENCES
AASHTO (1986). Standard Specifications for Transport Materials and Methods of
Sampling and Testing. 14th
Edition, American Association of State Highway and
Transport Officials (AASHTO), Washington, D.C
Adeniji, F. A. (1991) “Recharge function of vertisolic vadose Zone in sub-sahelian Chad
Basin”. Proc. Ist Inter. Conf. On Arid Zone Ideology Hydrology and Water
Resources, Maduguri, pp. 331 – 348
Adepoju, S. O. and Olaleye, B. M., (2001). “Gravity concentration of silica sand from
Itakpe iron-ore tailings by tabling operation”. Nigerian Journal of Engineering
Management. Vol. 2, No. 2, pp. 51-55.
Ajaka, E. O. (2009). “Recovering fine iron minerals from Itakpe iron ore process tailing”,
ARPN Journal of Engineering and Applied Sciences, Vol. 4, No. 9, pp. 17-28
Akawwi, E. and Al-Kharabsheh, A. (2002).“Lime stabilization effects on
properties of expansive soils in Amman, Jordan”. Electronic
Journal of Geotechnical Engineering. www.ejge.com/2000 ppr0020.
Akinmade, O. B., (2008). Stabilization of Black Cotton Soil Using Locust Bean Waste
Ash.. Unpublished M.Sc thesis, Civil Engineering Department, Ahmadu Bello
University, Zaria.
Alhassan, M. (2008). ―Potentials of rice husk ash for soil stabilization.‖ Assumption
University Journal of Technology Vol. 11, No. 4, pp.246-50
Alhassan, M. (2006). Effect of Bagasse Ash on Lime Modified Laterite. Unpublished
M.Sc.Thesis Civil Engineering Department, Ahmadu Bello University, Zaria
Aleshin, E. (1978), “Power plant fly ash as a source of alumina.” Proceedings of the 6th
Mineral Waste Utilization Symposium, 2-3 May, Bureau of Mines and IIT
Research Institute Chicago, Illinois pp. 334-339.
Amu, O.O., Fajobi, A.B. and Oke, B.O. (2005), “Effect of eggshell powder on the
stabilizing potential of lime on expansive clay soil” Journal of Applied Science.,
Vol. 5, No. 8, pp. 1474-1478
Comment [KJO8]: Correct as shown for Journals, Books, Proceedings and Theses

77
Asma, M. and Dariusz, W. (2013), “Effect of lime stabilization on the strength and
microstructure of clay”, IOSR Journal of Mechanical and Civil Engineering
(IOSR-JMCE) e-ISSN: 2278-1684,p-ISSN: 2320-334X, Volume 6, Issue 3 (May.
- Jun. 2013), PP 87-94 www.iosrjournals.org
ASTM (1992). Annual Book of Standards Vol. 04.08, American Society for Testing and
Materials, Philadelphia.
ASTM C618-78(1978). ―Specification for Fly Ash and Raw Calcined Natural Pozzolana
for use as a Mineral Admixture in Portland Cement Concrete‖.American Society
for Testing and Materials, Philadelphia
Azige, P . (2012). “Locust Bean Waste Ash Modification of Black Cotton Soil using
Cement Kiln Dust as an Activator‖.Unpublished M.Sc. Thesis, Ahmadu Bello
University, Zaria, Nigeria.
Balogun, L. A. (1991). “Effect of sand and salt additives on some geotechnical properties
of lime stabilized Black Cotton Soil”. The Nigeria Engineer, Vol. 26 No., 15 – 24.
Balogun, L.A (1990). ―Foundation investigation and design techniques for residential
buildings on expansive black cotton soils.‖ The Nigerian Engineer. Vol. 20, No. 2,
pp. 34-41.
Bell, F. G. (1989). “Lime stabilization of clay soil.” Bulletin of the Int. Assoc. of
Engineering Geology, Paris, No39, pp. 67-74.
Bergado, D. T., Anderson, L. R., Miura, N., Balasubramaniam, A. S., (1996), ―Soft
ground improvement in lowland and other environments‖, New York: ASCE
Press.
Bhatty, J. I., Bhottacharja, S., and Tordes, H. A., (1996) ―Use of cement kiln dust in
stabilizing clay soils‖ Portland Cement Association, Skokie Illinois, USA.
Bose B. (2012) ―Geo-engineering properties of expansive soil stabilized with fly ash‖,
Electronic Journal of Geotechnical Engineering, Vol. 17 pp. 1339-1353
BS 1377 (1990). Method of Testing Soil for Civil Engineering British Standard Institute
(BSI) London.
BS 1924 (1990). Method of Tests for Stabilized Soils.British Standard Institute (BSI)
London.
Comment [KJO9]: Ditto for this and other
references

78
Butches, F. and Sailie, E. L (1984) “Swelling behaviour of tropical black clays.”
Proceedings of the 8th
Regional Conference for Africa on Soil Mechanics and
Foundation Engineering, Harare. 81 – 86.
Chen, F. H. (1988). Foundations on Expansive Soils. Elsevire Scientific Publishing
Company, Amsterdam.
Cokca, Erdal (2001) ―Use of Class F Ashes for the Stabilization of an Expansive
Soils‖.Jounal of Geotechnical Engrg. Vol. 127 No. 7, pp. 568-573.
Collins, R. J. and Ciesiellski, S. K. (1993) ―Recycling and use of waste materials or by
products in highway construction.‖ Vols. 1 and 2. Pp 568-578.
CPCB, (2007), “Comprehensive industry document on iron ore mining”. Parivesh
Bhawan, East Arjuin Nagar, New Delhi, pp4-10
Das, B. M. (1998). Principles of Geotechnical Engineering. 4th
Edition, PWS, Publishing
Division of International Thomas Publishing Company, New York.
Diamond, S. (1975). “Soil stabilization for erosion control.” JHRP L36-50H, Final Rep.,
JHRP 75-20, Purdue and Indiana State Publication 47.
Eades, J. L., and Grim, R. E., (1960), “The reaction of hydrated lime with pure clay
minerals in soil stabilization.”, U. S. Highway Research Board Bulletin, Vol. 262,
pp. 51-63
Ghose, M.K. (1997), ―Environmental management for disposal of spoils and tailings
from mines‘, Env. And Ecology 15(1), 206-210.
Gidigasu, M. D. (1982). “Importance of material selection, construction control and field
performance studies in developing acceptance specification for laterite paving
gravels.” Solos and Rocha, Rio de Janeiro, Brazil. Vol. 5 No1
Gidigasu, M.D. and Dogbey, J.L.K. (1980). “Geotechnical characteristics of laterized
decomposed rocks for pavement construction in dry sub-humid environment.”
Proc. 6th Southeast Asian Conf. on Soil Engrg. Taipei, Vol. 1. pp. 492-506
Gilliot, J. E. (1987). Clay in Engineering Geology. Elsevier Publishing Company,
Amsterdam.
Habercom, G. E. (1976). Soil Stabilization. (A Bibliography with Abstracts). National
Technical Information Service Biblio. 221pp.

79
Hammond, R., (1961), ―Laterite soil engineering.”, Amsterdam: Elsevier Scientific
publishing Company.
Hamza, M. A. (2008), “Understanding soil analysis data”, Resource Management
Technical Report 327, pp. 32-34
Holtz, W. G. and Hart, S. S., (1978) “Home construction on shrinking and swelling
soils”, special publication 11, American Society of Civil Engineers, pp. 1-18
Holtz, W. G. and Gibbs, H. J. (1956). “Engineering properties of expansive clays.” ASCE
Transaction, Vol. 121 No 1, Paper 2814.
Ibrahim, A. (1983). “Black cotton soil in road pavement design, construction and
performance.” In S. A. Ola (ed.) Tropical Soils of Nigeria in Engineering
Practice, A. A. Balkema, The Netherlands, Rotherdam, pp. 260-278.
ICOLD, (2003),‖ International Commission on Large Dam report 151‖, Boulevard
Haussmann, 75008, Paris, France.
ISRIC (1998). “World soil information” International Soil and Reference Information
Center.
Johnson,W. A., Herrin, M., Davidson, T. D. and Handy, L.R. (1988) Soil stabilization in
: Highway Design Reference Guide, edited by Woods, K. B and Ross, S. S. MC
Graw –Hill Book Company. New York.
Jones B. K and Holtz W. G (1993). ―Expansive Soil, the hidden Disaster”. American
Society of Civil Engineering (43 No. 8pp 78 – 79).
Kawamura ,M. and Diamond, S. (1975). “Stabilization of clays soils against erosion
loss.” JHRP-75-4, Tech. Paper, Purdue and Indiana State Highway Commission.
Kedzi, A. (1979). Stabilized Earth Roads. Elsevier, Amsterdam, pp 327.
Koteswara, R. D., (2011), ―The efficacy of reinforced technique on the fly ash stabilized
expansive soil as a subgrade embankment for highways‖. Int. Journal of Eng. Sc.
And Technol. (IJEST), Vol. 3 No.2, pp. 776
Lea, F.M. (1956). The Chemistry of Cement and Concrete, Edward Arnold Publishers.
London

80
Little A.L (1967) “The use of tropically weathered soil in the construction of earthdams.”
Proc. Of 3rd
Asian Reg. Conf. Soil Mech & Foundation Engrg., Haifa, Israel,
Vol.1, pp 35-41.
Markwick, A. H. D. (1944).”The basic principles of soil compaction and their
application.” Institute of Civil Engineering, London, Road Engineering Div.,
Road Paper No. 16.
Medjo .E. and Riskowiski, G. (2004). ―A procedure for processing mixtures of soil,
cement and sugar cane bagasse.‖ Agricultural Engineering International Journal
of Scientific Research and Development Manuscript BC 990, Vol. III, pp. 1-6.
Mohammedbhai, G. T. G. and Bagant, B. T. (1990) ―Possibility of using bagasse ash and
other furnace residue as partial substitute for cement in Maritius.‖ Revue Agricole
et Sulclriere de l‘lle Maurice, Vol. 64, No 3 pp.1-10.
Montgomery, D., (2001) “Design and Analysis of Experiments”, 5th edition, 2001, New
York: John Wiley & Sons, 2001
Morin, W. J. (1971). ―Properties of African tropical black clay soils.”. Proceedings 5th
Regional Conference for Africa on Soil Mechanics and Foundation Engineering
Luanda, Vol. 1, pp. 51-59.
Moses, G. (2008) ―stabilization of black cotton soil with ordinary portland cement Using
Bagasse ash as admixture‖ IRJI Journal of Research in Engrg. Vol.5 No.3 , pp.
107-115
Moses, G.. (2006), ―Stabilization of Black Cotton Soil with ordinary Portland Cement
using Bagasse Ash as Admixture”. M.Sc. Thesis, Department of Civil Engineering,
Ahmadu Bello University, Zaria
Moses G. K. and Saminu A. (2012), ―Cement kiln dust stabilization of compacted black
cotton soil‖, Electronic Journal of Geotechnical Engineering Vol. 17, pp. 875-
836.
Mustapha, A.M. (2006).“The Effect of Bagasse Ash on Cement Stabilized
Laterite‖.Unpublished M.Sc. Thesis, Ahmadu Bello University, Zaria, Nigeria.
Nelson, D. and Miller, J. (1992). Expansive Soils Problems and Practice in Foundation
and Pavement Engineering. John Wiley and Sons, Inc., New York.

81
Newman, K. and Tingle, J. S., (2004), “Emulsion Polymers for soil stabilization”, 2004
FAA Worlwide Airport Technology Transfert conference, Atlantic city, New
Jersey, USA.
Nigerian General Specifications (1997). Roads and Bridges. Federal Ministry of Works,
Abuja, Nigeria.
Nixon.I.K and Skipp.H.O.(1957). “Airfield construction on overseas soils and laterite.”
Proc. of British Inst. Civil Engrg.,London,United Kingdom.Vol.8,pp.253-292.
Obeahon S. O. (1993). The Effect of Elapse Time After Mixing on the Properties of
Modified Laterite. Unpublished M. Sc. Thesis Civil Engineering Department
Ahmadu Bello University Zaria.
O‟Flaherty. C.A (1988). Highway Engineering. Vol. 2, Edward Arnold, London. U.K
Ochepo, J. (2008), ―The Effect of Elapsed Time on the Geotechnical Properties of Black
Cotton Soils Stabilized with Lime-Bagasse Ash Admixture‖, Unpublished M.Sc.
Thesis, Department of Civil Engineering, Ahmadu Bello University, Zaria.
Ola, S. A., Adeleke, A. O., Usman, G. A., Odunaike, A. A., Kollere, S. M., and Ajiboye,
P. O., (2009), “Study on the magnetic concentration of Nigerian Itakpe sinter
concentrate to a Midrex-grade concentrate”, Maejo Int. J. Sci. Technol. 2009,
3(03), 400-407.
Ola S.A. (1983).‖The geotechnical properties of black cotton soils of North Eastern
Nigeria.‖ In: S.A Ola(ed). Tropical Soils of Nigeria in Engineering Practice.
Balkema, Rotterdam, pp. 260-178.
Ola, S. A. (1974) “Need for estimated cement requirement for stabilizing lateritic soil.”
Journal of Transporationt Div., ASCE, Vol. 17,No 8, pp. 379-388.
Ola, S. A. (1978) ―The geology and geotechnical properties of the black cotton soils of
North Eastern Nigeria.‖ Engineering Geology, Vol. 12, pp. 375-391.
Oriola, F. and Moses G., (2010).Groundnut Shell Ash Stabilization of Black Cotton Soil.
EJGE.Vol.15.,P415-428.
Osinubi, K. J. (2001a). “Influence of Compaction Energy Levels and Delays on Cement
Treated Soil.” Nigerian Society of Engineers Technical Transactions. Vol. 36, No
4.

82
Osinubi K.J (2001b), “Stabiization of lateritic soil with cationic bitumen emulsion.‖
Journal of Engineering Research, Vol. JER-9, No 384, pp. 137-150.
Osinubi, K. J. (2000a). ―Laboratory trial of soil stabilization of Nigerian black cotton
soils‖ Nigerian Society of Engineers Technical Transactions, Vol. 35, No 4 pp 13
– 21.
Osinubi, K. J. (2000b) ―Treatment of laterite with anionic bitumen emulsion and cement:
A Comparative Study.‖ Ife Journal of Technology, Obafemi Awolowo University,
Ile-Ife, Vol. 9, No 1, pp. 139–145.
Osinubi, K.J (1999). “Evaluation of admixture stabilization of Nigerian black cotton
soils.” NSE Technical Transaction, Vol. 34, No. 3, pp 88-96.
Osinubi, K.J., (1998a). Influence of compactive efforts and compaction delays on lime
treated soil. Journal of Transportation Engineering, ASCE, Vol.124, No.2,
pp.149-155.
Osinubi, K. J. (1998b). “Stabilization of tropical black clay with cement and pulverised
coal bottom ash admixture.” In: Advances in Unsaturated Geotechnics. Edited by
Charles, D., Shackelford, Sandra L. Houston and Nien-Yin Cheng. ASCE
Geotechnical Special Publication, No 99, pp 289-302.
Osinubi K.J. (1995). ―Lime modification of black cotton soils.‖ Spectrum Journal, Vol.
2, Nos. 1 and 2, pp. 112-122.
Osinubi K J and Medubi A (1998). “Evaluation of Cement and Phosphatic Waste
Admixture on Tropical Black Clay Road Foundation‖, Proc of Engineering
Analysis and Modeling (SEAM4) Accra vol, pp297-30.
Osinubi, K. J. (1997). ―Soil stabilization using phosphatic waste.” Proceedings of 4th
Regional Conference on Geotechnical Engineering, GEOTROPIKA ‗97. Johor
Bahru, Malaysia, 11 – 12 Nov., pp 225 -244.
Osinubi, K.J. and Moses, G. (2013). “Influence of compactive efforts on cement-bagasse
ash treatment of expansive black cotton soil”, World Academy of Science,
Engineering and Technology 79 2013 pp. 1574-1581.

83
Osinubi, K J and Oyelakin, M A (2012). “ Optimising soil-cement-ash stabilisation mix
for maximum compressive strength: A case study of the tropical clay sub-base
material stabilised with cement-locus bean waste ash” In: Laryea, S., Agyepong,
S.A., Leiringer, R. and Hughes, W. (Eds) Procs 4th West Africa Built Environment
Research (WABER) Conference, 24-26 July 2012, Abuja, Nigeria, 1207-1218.
Osinubi, K. J., Eberemu, A. O. and Oyelakin, M. A. (2011). “Improvement of Black
Cotton Soil with Ordinary Portland Cement - Locust Bean Waste Ash Blend”
Electronic Journal of Geotechnical Engineering, Bund. F. Vol. 16 pp 619 – 627.
Osinubi, K. J., Soni, E. J. and Ijimdiya, T. S. (2010) ―Lime and slag admixture
improvement of tropical black clay road foundation‖ Transportation Research
Board (TRB) 89th Annual Meeting CD-ROM, January 10 - 14 Washington, D. C.,
U.S.A. Subject: Recycled Materials in Transportation Infrastructure, Session
AFP40 – Physico-chemical and Biological Processes in Soils Committee, Paper #
.10-0585, pp. 1 -18.
Osinubi, K. J., Akinmade, O. B. and Eberemu, A. O. (2009). ―Stabilization potential of
locust bean waste ash on black cotton soil.” Journal of Engineering Research,
University of Lagos, Nigeria, Vol. 14, No. 2, pp. 1-13.
Osinubi, K. J. and Eberemu, A. O., (2009) “Desiccation-induced shrinkage of compacted lateritic
soil treated with bagasse ash”. The twenty fourth international conference of solid waste
technology and management CD-ROM, 15th
-18th
March 2009, Philadelphia, PA. USA.
Session 5c, bioreactors and innovative landfills pp. 856-867
Osinubi, K. J. and Ijimdiya, T. S. (2009) “Laboratory investigation of desiccation
characteristics of black cotton soil treated with bagasse ash.‖ Proceedings of Bi-
monthly Meetings/Workshops organized by Zaria Chapter of Materials Society of
Nigeria, pp. 61 - 68.
Osinubi, K. J. and Eberemu, A. O. (2009a) “ Compatibility and attenuative properties of laterite-
blast furnace slag mixtures.” Journal of waste technology and management, vol. 35. No.
1, pp. 7-16
Osinubi, K. J., Eberemu, A. O. (2009b) ―Desiccation-induced Shrinkage of Compacted
Lateritic Soil treated with bagasse ash.‖ The Twenty-Fourth International

84
Conference on Solid Waste Technology and Management CD-ROM, 15-18 March,
Philadelphia, PA, U.S.A. Session 5C: Bio-reactors and Innovative Landfills,
pp.856-867.
Osinubi, K. J. and Mustapha, A. M. (2008). 'Effect of compactive efforts on cement –
sugarcane bagasse ash – laterite mixture.‟ Nigerian Society of Engineers Technical
Transactions. Vol. 43, No. 2, pp 33 – 46
Osinubi, K.J., Ijimdiya, T. S. and Nmadu, I. (2008a). ‗Effect of compactive effort on lime
treated black cotton soil using bagasse ash as admixture.‘ Book of Abstracts of the
2nd
International Conference on Engineering Research & Development:
Innovations (ICER&D 2008), Benin City, Nigeria, 15-17 April. Technical Session
9B – Construction and Structures, Paper ICERD08056, p. 216 - 217.
Osinubi, K.J., Ijimdiya, T. S. and Nmadu, I. (2008b). ‗Lime stabilization of black cotton
soil using bagasse ash as admixture.‘ Book of Abstracts of the 2nd
International
Conference on Engineering Research & Development: Innovations (ICER&D
2008), Benin City, Nigeria, 15-17 April. Technical Session 9B – Construction and
Structures, Paper ICERD08058, p. 217
Osinubi, K. J., Bafyau, V. and Eberemu, A. O.(2008c). „Bagasse ash stabilization of
lateritic soil.‟ In:Appropriate Technologies for Environmental Production in the
developing World. Edited by E. K. Yanful Springer, Netherlands.( To be
published in 2008).
Osinubi, K. J., Eberemu, A.O. and Aliu, O.S. (2007a) ―Stabilization of laterite with
cement and bagasse ash admixture.‖ Proc. of the first Inter. Conf. on Environ.
Res., echn. And Policy “ERTEP 2007” under the auspices of International Society
of Environmental Geotechnology, Accra, Ghana, 16 – 19 July, Category B:
Mining and Environment, PP. 1.
Osinubi, K. J., Eberemu, A. O. and Simon, K. L. (2007c). “Influence of Bagasse ash
content and curing period on the permeability of lateritic soil compacted at
reduced Proctor effort.” Proc. of Bi-monthly Meetings/Workshops organized by
the Zaria Chapter of Materials Society of Nigeria, pp.17 -25

85
Osinubi, K. J. and Stephen, A. T. (2007). “Influence of compactive efforts on bagasse ash
treated black cotton soil.” Nigerian Journal of Soil and Environmental Research,
Vol. 7, pp. 92 – 101.
Osinubi, K. J. and Eberemu, A. O. (2006). “Effect of bagasse ash on the strength of
stabilized lateritic soil.” Book of Abstracts of the 5th
Nigerian Materials
Congress ―NIMACON 2006‖, Abuja, Nigeria, 17-19 November. pp.202– 208.
Osinubi, K. J. and Stephen, T. A. (2006a). „Effect of bagasse ash content on particle size
distribution and plasticity characteristics of black cotton soil.” Proceedings of the
5th
Nigerian Materials Congress ―NIMACON 2006‖, Abuja, Nigeria, 17-19
November. pp. 214 - 220.
Osinubi, K. J. and Stephen, T .A. (2006b). „Effect of curing period on bagasse ash
stabilized black cotton soil.‟ Proc. of Bi-monthly Meetings/Workshops organized
by the Zaria Chapter of Materials Society of Nigeria, pp. 1 - 9.
Osinubi K. J. and Eberemu, A. O. (2005). ―The use of blast furnance slag treated latrite
in attenuation of ground contaminants.‖ Proc. Of The Nigeria Marterial Congress
2005 (NIMACON). Nov. 17th – 19th 2005. Zaria, Nigeria. pp. 28-35.
Osinubi, K. J. and Stephen, T. A. (2005). ―Economic utilization of an agro-industrail
waste-bagasse ash.‖ Proc. of The Nigerian Material Congress 2005 (NIMACON
2005). 17-19 Nov., Zaria, Nigeria, pp. 36-40.
Osinubi, K. J. and Mustapha.A. M. (2005). „Potentials of bagasse ash as a pozzolana.‟
Proceedings of the 4th
Nigerian Materials Congress ―NIMACON 2005”, Zaria,
Nigeria, 17 – 19 November, pp. 41 -45.
Osinubi, K. J. and Medubi, A. B. (1997a). ―Evaluation of cement and phosphatic waste
admixture on tropical black clay road foundation.‖ Proceedings of 4th
Intn‘l.
Conference on Structural Engineering Analysis and Modeling (SEAM 4), Kumasi,
Ghana, 9-11 July, Vol. 2, pp. 297-307.
Osinubi, K. J. and Medubi, A. B. (1997b) ―Effect of lime and phosphatic waste
admixture on tropical black clay.” Proceedings, 4th
Regional Conference on
Geochemical Engineering, GEOTROPIKA ‟97, Johor Bahru, 11-12 Nov.,
Malaysia, pp. 257–272.

86
Osinubi, K. J., and Brajeh, I., (1994), ―Bituminous stabilization of laterite‖, Spectrum
Journal, Vol. 1, No. 2, pp. 104-112
Osinubi, K. J. and Katte, V. Y. (1991), ―Effect of elapsed time after mixing on grain size
and plasticity characteristics.”NSE technical transactions, Vol. 34 No. 3, pp. 38-46
Osula, D. O. A. (1991) “Lime Modification of Problem Laterite”. Eng. g Geol. 30, pp
141 – 149
Oyediran I.A. and Kalejaiye M. (2011), “Effect of increasing cement content on strength
and compaction parameters of some lateritic soils from southeastern Nigeria”,
Electronic Journal of Geotechnical Engineering, vol. 16 pp. 1501-1514
Oyelakin , M. A . (2011). “Cement Stabilization of Black Cotton Soil Using Locust
Bean Waste Ash as Admixture‖.Unpublished M.Sc. Thesis, Ahmadu Bello
University, Zaria, Nigeria.
Plait, R. M. (1953). “Determination of swelling pressure of black cotton soil–A method.”
Proceedings of the Third Intn‘l. Conference on Soil Mechanics and Foundation
Engineering., Zurich, Switzerland, 16th
– 27th
August, Vol. 1, pp. 170–172.
Portland Cement Association (1970). Recommended Practice for construction of
Residential Concrete Floors on Expansive soil. Vo1. 2. Portland Cement
Association, Los Angeles.
Reyes, A. and Pando, M. (2007), ―Evaluation of CFBC fly ash for improvement of soft
clays‖, World of Coal Ash (WOCA), Covington, Kentucky, USA, May 7-10
Robert, L. S. (1993) “Fly ash for use in the stabilization of industrial wastes.” In: Fly Ash
for Soil Improvement, K. D. Sharp (ed.) Geotechnical Engineering Division of the
ASCE, Geotechnical Special Publication, No 36, K. D. Sharp(ed) Geotechnical
Engineering Division of ASCE, pp. 30-35.
Sabat, A. K. (2012), “A study on some geotechnical properties of lime stabilized
expansive soil-quarry dust mixes”, Int. Journal of emerging trends in Engineering
and Development, ISSn 2249-6149 issue2, vol. 1, pp. 42-49
Sani, J .E. (2012). “Locust Bean Waste Ash Stabilization of Black Cotton Soil using
Cement Kiln Dust as an Activator‖.Unpublished M.Sc. Thesis, Ahmadu Bello
University, Zaria, Nigeria.

87
Saravut, J., William, O. Y. and Pichai, T., (2012), “Microstructure and strength
characteristics of lateritic soil-cement”, EJGE vol. 13, Bund. B , pp. 2393-2403
Sayah, A. I, (1993), “Stabilization of a highly expansive clay using cement kiln dust‘,
M.Sc Thesis, University of Oklahoma, Graduate College, Norman, Oklahoma,
USA.
Senol, A., Edil, T.C., Hector, A. A., and Benson, C. H., (2006), “Soft subgrades
stabilization by using various fly ashes”, Resources, Conversation and recycling,
46 (4); pp. 365-376
Stephen, A. T. (2006). Stabilization Potential of Bagasse Ash on Black cotton Soil.
Unpublished M.Sc. Thesis, Department of Civil Engineering, Ahmadu Bello
University, Zaria.
Singh, G. (1991): Highway Engineering, 3rd
Edition, Standard Publishers Distributors. pp
599 – 619.
Smith, R.G (1992), "Alternatives to ordinary portland cement". British Building Society
Journal, Vol.25, pp.1-17.
Toland, G. (1977), “Case history of failure and reconstruction of Mike Horse tailings dam
near Lincoln, Montana.‖ In Proc. 15th
Am. Eng. Geol. And Soil Eng. Symp. Idaho
State University.
Tomlinson, M.J. (1999), Foundation Design and Construction. 6th edition, Longman,
Harlow, Essex.
TRRL (1977). “A guide to the structural design of bitumen surfaced roads in tropical and
sub-tropical countries.” Transport and Road Research Laboratory, Road Note 31,
H. M. S. O., London.
Warren, K.W. And Kirby, T.M. (2004) ―Expansive Clay Soil A Wide Spread And Costly
Geohazard”, Geostra, Geoinstitute Of The American Society Of Civil Engineers.
Winterkorn, H. F., and Pamukcu, S., (1990), ―Soil stabilization and grouting.‖
Foundation Engineering Handbook edited by Hsai-Yang Fang, 2nd
edn, Van
Nostrand Reinhold, New York.
World Bank Group (1998), “Pollution prevention and abatement Handbook”.

88
Yamanouchi, T (1975). ”Problems in the development of soil stablilization.”, State and
Municipal Record, Vo1.68, No. 7, pp. 365-374.
Yoder, F. J and Witczak N. W (1975). Principles of Pavement Design. Wiley-Intercience
Publication, New York. 711pp
Yudhbir, L. and Honjo, Y. (1991),“Application of geotechnical engineering to
environmental control,” 9 ARC, Vol. 2, Bangkok Thailand, pp. 431-469.
Zaman, M., Laguros, J. G., and Sayah, A. I., (1992), “Soil stabilization using cement kiln
dust”, Proceeding of the 7th
International conference on expansive soils, Dallas,
Texas, USA
APPENDIX A
Table A4.1: Results of specific gravity of iron ore tailing
Flask No K23 L91 L10
Mass of Bottle M1 20.7 23 18.1
Mass of Bottle + Soil M2 25.3 27.8 23
Mass of Bottle + Soil + Water M3 49 51.3 46.8
Mass of Bottle + Water M4 45.6 47.8 43.2
M2 - M1 4.6 4.8 4.9
M4 - M1 24.9 24.8 25.1
M3 - M2 23.7 23.5 23.8
(M4 - M1) - (M3 - M2) 1.2 1.3 1.3
Gs = (M2-M1) / ((M4-M1)-(M3-M2)) 3.8333 3.6923 3.7692
Average Gs 3.76
Table A4.2: Results of specific gravity of black cotton soil - iron ore tailing mixtures
Comment [KJO10]: Correct text of titles as
shown

89
IOT
content
%
specific
gravity
0 2.42
2 2.46
4 2.52
6 2.64
8 2.68
10 2.74
12 2.79
14 2.83
16 2.88
Table A4.3: Results of moiture content of natural black cotton Soil
Container No X46 1Q M15
Mass of Container M1 10.2 11.6 13.6
Mass of Container + Wet Soil M2 77 89.7 84.2
Mass of Container + Dry Soil M3 68.21 79.4 74.9
Mass of Dry Soil (M3-M1) = Ws 58.01 67.8 61.3
Mass of Wet Soil (M2- M1) 66.8 78.1 70.6
Ww = (M2-M10-(M3-M1) 8.79 10.3 9.3
Moisture Content = W = Ww/Ws 15.153 15.192 15.171
Average W 15.17
Table A4.4a: Results of wet sieve analysis values of black cotton soil-iron ore tailing
mixtures
0% IOT 2% IOT 4% IOT 6% IOT 8% IOT 10% IOT
B.S
SIEVE
SIZE
%
PASSI
NG
B.S
SIEV
E
SIZE
%
PASSI
NG
B.S
SIEV
E
SIZE
%
PASSI
NG
B.S
SIEV
E
SIZE
%
PASSI
NG
B.S
SIEV
E
SIZE
%
PASSI
NG
B.S
SIEV
E
SIZE
%
PASSI
NG
2.4 90.3 2.4 89.3 2.4 91.2 2.4 90.3 2.4 89.7 2.4 92.55
1.4 89 1.4 88 1.4 89.8 1.4 89 1.4 88.35 1.4 91.55
0.6 84.95 0.6 84.25 0.6 85.9 0.6 84.95 0.6 84.85 0.6 87.55
0.425 80 0.425 79.6 0.425 81.05 0.425 80 0.425 79.4 0.425 81.4
0.3 78.85 0.3 78.5 0.3 80.05 0.3 78.85 0.3 77.95 0.3 79.75
0.212 77.65 0.212 77.3 0.212 79 0.212 77.65 0.212 76.35 0.212 77.75
0.15 76.35 0.15 74.75 0.15 77.65 0.15 76.35 0.15 74.35 0.15 75
0.075 74.7 0.075 72.9 0.075 75.95 0.075 74.7 0.075 72.2 0.075 72.4
0.067 47.33 0.067 48.55 0.067 49.57 0.067 47.33 0.067 45.2 0.067 44.7
0.049 44.11 0.049 45.19 0.049 47.08 0.049 44.11 0.049 42.02 0.049 40.79
0.037 43.3 0.037 43.51 0.037 46.26 0.037 43.3 0.037 39.63 0.037 39.21
0.027 40.89 0.027 40.15 0.027 42.94 0.027 40.89 0.027 37.25 0.027 35.06
Comment [KJO11]: Ditto for the remaining
table titles

90
0.019 31.23 0.019 27.58 0.019 32.99 0.019 31.23 0.019 27.69 0.019 25.83
0.014 23.99 0.014 20.84 0.014 26.36 0.014 23.99 0.014 20.53 0.014 18.74
0.01 21.38 0.01 18.31 0.01 24.7 0.01 21.38 0.01 18.1 0.01 16.38
0.009 20.77 0.009 14.95 0.009 20.56 0.009 20.77 0.009 15.75 0.009 14.05
0.006 14.33 0.006 11.59 0.006 16.41 0.006 14.33 0.006 11.78 0.006 10.05
0.004 12.87 0.004 11.89 0.004 12.29 0.004 9.01 0.004 8.79 0.004 8.58
Table A4.4a:Results of wet sieve analysis values of black cotton soil-iron ore tailing
Mixture (continuation)
12% IOT 14% IOT 16% IOT
B.S SIEVE SIZE %
PASSING
B.S SIEVE
SIZE
%
PASSING
B.S SIEVE
SIZE
%
PASSING
2.4 92.2 2.4 92.1 2.4 94.35
1.4 91 1.4 91 1.4 93.2
0.6 87.1 0.6 87.05 0.6 88.9
0.425 80.75 0.425 80.4 0.425 81.25
0.3 78.85 0.3 78.3 0.3 78.9
0.212 76.3 0.212 75.7 0.212 76.15
0.15 73.55 0.15 72.5 0.15 72.95
0.075 70.45 0.075 69.25 0.075 70
0.067 44.18 0.067 46.24 0.067 44.25
0.049 40.29 0.049 41.6 0.049 41.97
0.037 36.4 0.037 38.51 0.037 38.91
0.027 34.07 0.027 34.64 0.027 36.61
0.019 24.73 0.019 33.09 0.019 32.78
0.014 16.18 0.014 23.81 0.014 22.06
0.01 14.62 0.01 10.67 0.01 6.74
0.009 11.15 0.009 8.35 0.009 4.44
0.006 7.62 0.006 6.03 0.006 1.39
0.004 8.53 0.004 2.17 0.004 0

91

92
Table A4.4 (b): Results of dry sieve values of black cotton soil-iron ore tailing
mixtures (BSL Compaction)
BS
0% IOT 2% IOT 4% IOT 6% IOT 8% IOT 10%IOT 12%IOT 14%IOT 16%IOT
SIEVE
SIZE % PASSING % PASSING % PASSING % PASSING % PASSING % PASSING % PASSING % PASSING % PASSING
3.175 100 100 100 100 100 100 100 100 100
2.4 53.7 52.85 40.45 43.8 57.8 42.25 52 50.7 57.5
1.4 46.8 45.1 32.9 36.55 50.1 35.75 43.3 42.45 50.45
0.6 28.8 25.3 18.2 20.5 29.2 22.3 24.55 23.7 35.45
0.425 8.8 6.85 5.8 6.25 8.45 9.5 9.15 8.25 14.7
0.3 6.55 3.95 3.95 4.05 5.9 7.35 6.55 6.05 11.45
0.212 4.95 2.45 2.9 2.75 4.3 5.35 4.65 4.05 8.95
0.15 3.6 1.5 2.15 1.7 3.2 3.9 2.9 2.75 6.8
0.075 2.7 0.7 1.65 0.85 2.3 2.95 1.7 1.45 5.05
Table A4.4 (c): Results of dry sieve values of black cotton soil-iron ore tailing
mixtures (WAS Compaction)
BS
0% IOT 2% IOT 4% IOT 6% IOT 8% IOT 10%IOT 12%IOT 14%IOT 16%IOT
SIEVE
SIZE % PASSING % PASSING % PASSING % PASSING % PASSING % PASSING % PASSING % PASSING % PASSING
3.175 100 100 100 100 100 100 100 100 100
2.4 68.15 70 71.15 72.8 75.6 75.4 63.1 70.1 71.3
1.4 60.6 60.65 64.2 64.9 68.9 69.5 52.4 59.5 64.9
0.6 39.85 39.05 43.55 44.5 48.2 49.7 33.15 42.45 46.65
0.425 11.55 13.25 13.75 15.75 17.5 18.5 12 18.4 20.55
0.3 8.45 9.2 8.85 10.75 11.95 13.4 8.65 13.2 14.2
0.212 6.4 6.85 6.4 8 8.7 9.95 6.35 9.5 11.2
0.15 5.2 5.35 4.5 5.5 6.3 7.8 4.75 7.05 7.9
0.075 4.1 3.5 3.25 3.95 4.1 5.25 2.95 4.55 4.9

93
Table A4.4 (d): Results of dry sieve values of black cotton soil-iron ore tailing
mixtures (BSH Compaction)
BS
0% IOT 2% IOT 4% IOT 6% IOT 8% IOT 10%IOT 12%IOT 14%IOT 16%IOT
SIEVE
SIZE % PASSING % PASSING % PASSING % PASSING % PASSING % PASSING % PASSING % PASSING % PASSING
3.175 100 100 100 100 100 100 100 100 100
2.4 59.7 67.8 72.6 64.75 69.4 68.55 69.7 68.05 65.15
1.4 51.75 59.7 64.95 57.55 62.8 61.35 63.1 62.15 58.6
0.6 29.6 35.7 44.05 36.45 41.05 40 42.4 44.7 41.1
0.425 6.9 9.25 11.15 11.1 13.05 14.35 14.7 19.7 16.5
0.3 4.45 6.1 7.45 7.1 8.25 9.95 10.5 14.65 12.25
0.212 2.75 4.15 5.05 4.85 5.3 6.95 7.2 10.45 8.8
0.15 1.95 2.65 3.2 3.35 3.3 4.85 5.2 7.1 6.1
0.075 1.35 1.9 2.2 1.9 1.6 3 3 4.2 3.8
Table A4.5: Results of Atterberg limit of black cotton soil-iron ore tailing mixtures
IOT
CONTENT
%
LL PL PI LS
0 64.5 25 39.5 27.14
2 71 30.41 40.59 25.71
4 69.4 32.94 36.46 23.57
6 68.3 34.05 34.25 21.43
8 67.6 34.9 32.7 20.71
10 65 32.86 32.14 20
12 64.6 30.14 34.46 19.29
14 61.5 29.48 32.02 18.57
16 59.9 27.46 32.44 18
Table: A4.6 Results of cation exchange capacity of black cotton soil-iron ore tailing
mixtures
0%IOT 2%IOT 4%IOT 6%IOT 8%IOT 10%IO
T
12%IO
T
14%IO
T
16%IO
T
35.5 36.2 38.1 40.4 41 42.2 39 37.9 36.7
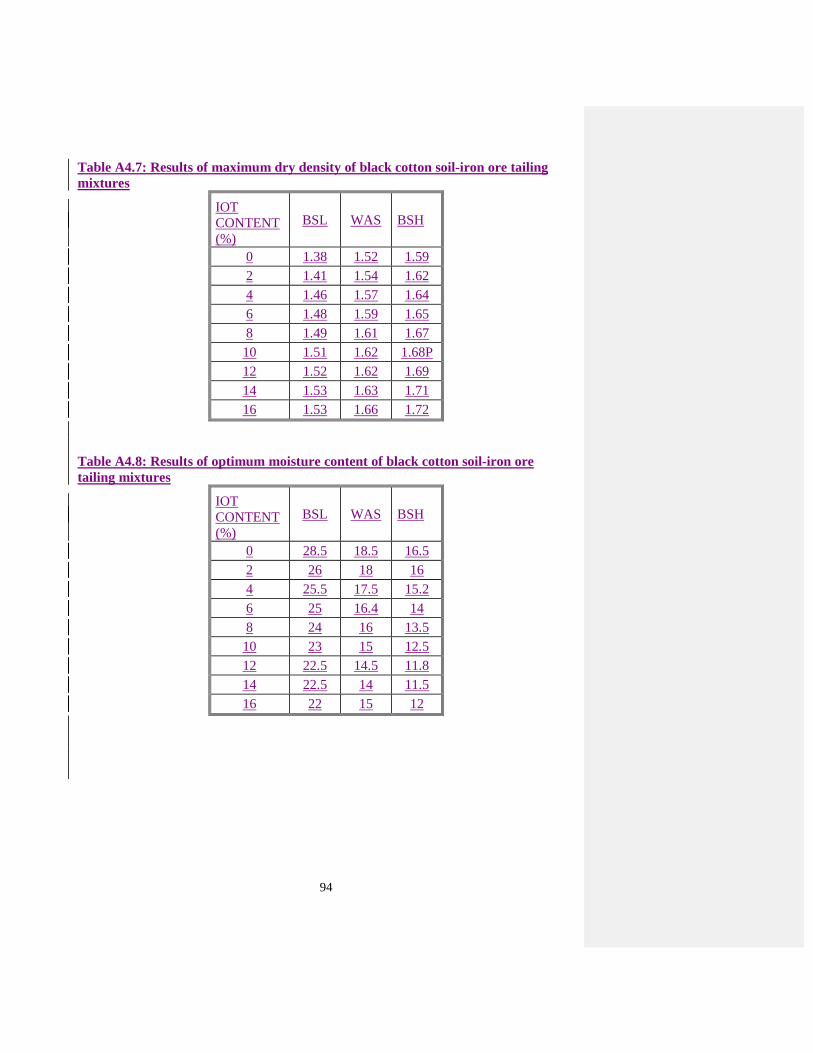
94
Table A4.7: Results of maximum dry density of black cotton soil-iron ore tailing
mixtures
IOT
CONTENT
(%)
BSL WAS BSH
0 1.38 1.52 1.59
2 1.41 1.54 1.62
4 1.46 1.57 1.64
6 1.48 1.59 1.65
8 1.49 1.61 1.67
10 1.51 1.62 1.68P
12 1.52 1.62 1.69
14 1.53 1.63 1.71
16 1.53 1.66 1.72
Table A4.8: Results of optimum moisture content of black cotton soil-iron ore
tailing mixtures
IOT
CONTENT
(%)
BSL WAS BSH
0 28.5 18.5 16.5
2 26 18 16
4 25.5 17.5 15.2
6 25 16.4 14
8 24 16 13.5
10 23 15 12.5
12 22.5 14.5 11.8
14 22.5 14 11.5
16 22 15 12

95
Table A4.9a: Results of unconfined compressive strength (7 days curing period) of
black cotton soil-iron ore tailing mixture
IOT
CONTENT
(%)
BSL WAS BSH
0 172.59 328.36 448.83
2 197.36 392.18 599.21
4 204.96 430.29 663.19
6 213.84 445.03 705.94
8 242.08 471.45 739.41
10 270.75 487.57 793.32
12 296.73 479.44 821.57
14 318.48 447.74 797.53
16 337.77 429.99 754.96
Table A4.9b: Results of unconfined compressive strength (14 days curing period) of
black cotton soil-iron ore tailing mixture
0 238.03 346.98 458.37
2 311.14 376.71 510.73
4 329.8 411.11 565.72
6 345.36 428.28 629.61
8 356.67 433.83 660.34
10 383.23 458.31 698.85
12 397.35 463.2 747.4
14 400.12 478.1 789.23
16 432.16 472.98 779.55

96
Table A4.9c: Results of unconfined compressive strength (28 days curing period) of
black cotton soil-iron ore tailing mixture
IOT
CONTENT
(%)
BSL WAS BSH
0 273.24 514.45 627.81
2 364.26 628.46 691.14
4 389.96 638.23 727.42
6 405.3 666.13 772.42
8 427.23 698.73 824.91
10 445.03 762.17 899.91
12 458.88 859.85 942.89
14 494.36 907.41 1009.3
16 504.91 947.68 1021.2
Table A4.9d: Results of unconfined compressive strength (7 days curing, 7 days
soaking period) of black cotton soil-iron ore tailing mixture
IOT
CONTENT
(%)
BSL WAS BSH
0 25.72 41.08 60.02
2 33.94 46.17 75.55
4 50.91 58.76 86.19
6 74.75 78.9 90.03
8 88.15 92.34 106.61
10 90.37 110.91 120.03
12 84.86 114.54 115.14
14 71.52 85.29 102.35
16 59.7 78.9 97.05

97
Table A4.10a: Results of California bearing ratio (unsoaked) of black cotton soil-
iron tailing mixtures
IOT
CONTENT
(%)
BSL WAS BSH
0 7.93 9.82 15.03
2 8.69 11.33 18.04
4 9.44 12.84 21.15
6 10.2 13.6 22.66
8 12.31 15.11 25.68
10 14.35 16.09 27.19
12 16.62 18.13 29.06
14 16.24 19.64 21.15
16 15.86 18.88 20.54
Table A4.10b: Results of California bearing ratio (Soaked) of black cotton soil-iron
tailing mixtures
IOT
CONTENT
(%)
BSL WAS BSH
0 3.02 3.78 5.29
2 3.32 4.15 6.42
4 3.78 5.29 7.52
6 4.53 5.66 9.02
8 5.29 6.42 9.44
10 5.66 7.55 10.57
12 5.66 8.69 11.33
14 3.78 8.31 10.57
16 3.02 6.8 9.06
Table A4.11: Results of resistance to loss in strength of black cotton soil-iron ore
tailing mixtures
IOT
CONTENT
(%)
BSL WAS BSH

98
0 10.81 11.84 13.09
2 10.99 12.26 14.79
4 15.44 14.29 15.24
6 21.64 18.42 14.3
8 24.71 21.28 16.14
10 23.58 24.2 17.18
12 21.36 24.73 15.41
14 17.87 17.84 12.97
16 13.81 16.68 12.43

99
APPENDIX B
Table B4.1: Results of analysis of variance for cation exchange capacity
of black cotton soil-iron ore tailing mixtures
SUMMARY
Groups Count Sum Average Variance
IOT 9 72 8 30
CEC 9 347 38.556 5.2278
ANOVA
Source of
Variation
SS df MS F P-value F crit
Between Groups 4201.4 1 4201.4 238.53 4.9281E-11 4.494
Within Groups 281.82 16 17.614
Total 4483.2 17
Table B4.2a: Results of analysis of variance for liquid limit of black cotton
soil-iron ore tailing mixtures
SUMMARY
Groups Count Sum Average Variance
IOT 9 72 8 30
LIQUID LIMIT 9 591.8 65.756 13.318
ANOVA
Source of
Variation SS df MS F P-value F crit
Between Groups 15011 1 15011 693.05 1.33367E-14 4.494
Within Groups 346.54 16 21.659
Total 15357 17

100
Table B4.2b: Results of analysis of variance for plastic limit of black cotton
soil-iron ore tailing mixtures
SUMMARY
Groups Count Sum Average Variance
IOT 9 72 8 30
PLASTI LIMIT 9 276.07 30.674 9.3693
ANOVA
Source of
Variation SS df MS F P-value F crit
Between Groups 2313.6 1 2313.6 117.53 8.82764E-09 4.494
Within Groups 314.95 16 19.685
Total 2628.5 17
Table B4.2c: Results of analysis of variance for plasticity index of black
cotton soil-iron ore tailing mixtures
SUMMARY
Groups Count Sum Average Variance
IOT 9 72 8 30
PLASTIC
INDEX 9 315.73 35.081 9.9144
ANOVA
Source of
Variation SS df MS F P-value F crit
Between Groups 3300.2 1 3300.2 165.37 7.50517E-10 4.494
Within Groups 319.32 16 19.957
Total 3619.6 17

101
Table B4.2d: Results of analysis of variance for linear shrinkage of black
cotton soil-iron ore tailing mixtures
SUMMARY
Groups Count Sum Average Variance
IOT 9 72 8 30
LINEAR
SHRINKAGE 9 194.42 21.602 10.2903
ANOVA
Source of Variation SS df MS F P-value F crit
Between Groups 832.59 1 832.59 41.3296 8.33973E-06 4.494
Within Groups 322.32 16 20.145
Total 1154.9 17
Table B4.3a: Results of analysis of variance for maximum dry density
(BSL Compaction) of black cotton soil-iron ore tailing mixtures
SUMMARY
Groups Count Sum Average Variance
IOT 9 72 8 30
MDD 9 13.31 1.4789 0.0029
ANOVA
Source of
Variation SS df MS F
P-
value F crit
Between Groups 191.36 1 191.36 12.756 0.0025 4.494
Within Groups 240.02 16 15.001
Total 431.38 17

102
Table B4.3b: Results of analysis of variance for maximum dry density
(WAS Compaction) of black cotton soil-iron ore tailing mixtures
SUMMARY
Groups Count Sum Average Variance
IOT 9 72 8 30
MDD 9 14.36 1.5956 0.002
ANOVA
Source of
Variation SS df MS F
P-
value F crit
Between Groups 184.58 1 184.58 12.304 0.0029 4.494
Within Groups 240.02 16 15.001
Total 424.59 17
Table B4.3c: Results of analysis of variance for maximum dry density
(BSH Compaction) of black cotton soil-iron ore tailing mixtures
SUMMARY
Groups Count Sum Average Variance
IOT 9 72 8 30
MDD 9 14.97 1.6633 0.0018
ANOVA
Source of
Variation SS df MS F
P-
value F crit
Between Groups 180.69 1 180.69 12.045 0.0032 4.494
Within Groups 240.01 16 15.001
Total 420.7 17

103
Table B4.4a: Results of analysis of variance for optimum moisture content
(BSL Compaction) of black cotton soil-iron ore tailing mixtures
SUMMARY
Groups Count Sum Average Variance
IOT 9 72 8 30
OMC 9 219 24.333 4.5
ANOVA
Source of
Variation SS df MS F P-value F crit
Between Groups 1200.5 1 1200.5 69.594 3.20657E-07 4.494
Within Groups 276 16 17.25
Total 1476.5 17
Table B4.4b: Results of analysis of variance for optimum moisture content
(WAS Compaction) of black cotton soil-iron ore tailing mixtures
SUMMARY
Groups Count Sum Average Variance
IOT 9 72 8 30
OMC 9 144.9 16.1 2.6025
ANOVA
Source of Variation SS df MS F
P-
value F crit
Between Groups 295.25 1 295.25 18.112 0.0006 4.494
Within Groups 260.82 16 16.301
Total 556.07 17

104
Table B4.4c: Results of analysis of variance for optimum moisture content
(BSH Compaction) of black cotton soil-iron ore tailing mixtures
SUMMARY
Groups Count Sum Average Variance
IOT 9 72 8 30
OMC 9 123 13.667 3.535
ANOVA
Source of
Variation SS df MS F
P-
value F crit
Between Groups 144.5 1 144.5 8.6179 0.0097 4.494
Within Groups 268.28 16 16.768
Total 412.78 17
Table B4.5a: Results of analysis of variance for unconfined compressive strength
(7 days curing period) , (BSL Compaction) of black cotton soil-iron ore
tailing mixtures
SUMMARY
Groups Count Sum Average Variance
IOT 9 72 8 30
UCS 9 2254.6 250.51 3395.9
ANOVA
Source of
Variation SS df MS F P-value F crit
Between Groups 264643 1 264643 154.5 1.23392E-09 4.494
Within Groups 27407 16 1712.9
Total 292050 17

105
Table B4.5b: Results of analysis of variance for unconfined compressive
strength (7 days curing period), (WAS Compaction)
of black cotton soil-iron ore tailing mixtures
SUMMARY
Groups Count Sum Average Variance
IOT 9 72 8 30
UCS 9 3912.1 434.67 2447.7
ANOVA
Source of
Variation SS df MS F P-value F crit
Between Groups 819221 1 819221 661.26 1.9258E-14 4.494
Within Groups 19822 16 1238.9
Total 839043 17
Table B4.5c: Results of analysis of variance for unconfined compressive
strength (7 days curing period), (BSH Compaction) of black cotton
soil-iron ore tailing mixtures
SUMMARY
Groups Count Sum Average Variance
IOT 9 72 8 30
UCS 9 6324 702.662 14018
ANOVA
Source of
Variation SS df MS F P-value F crit
Between Groups 2171500 1 2171500 309.15 6.90388E-12 4.494
Within Groups 112385 16 7024.08
Total 2283885 17
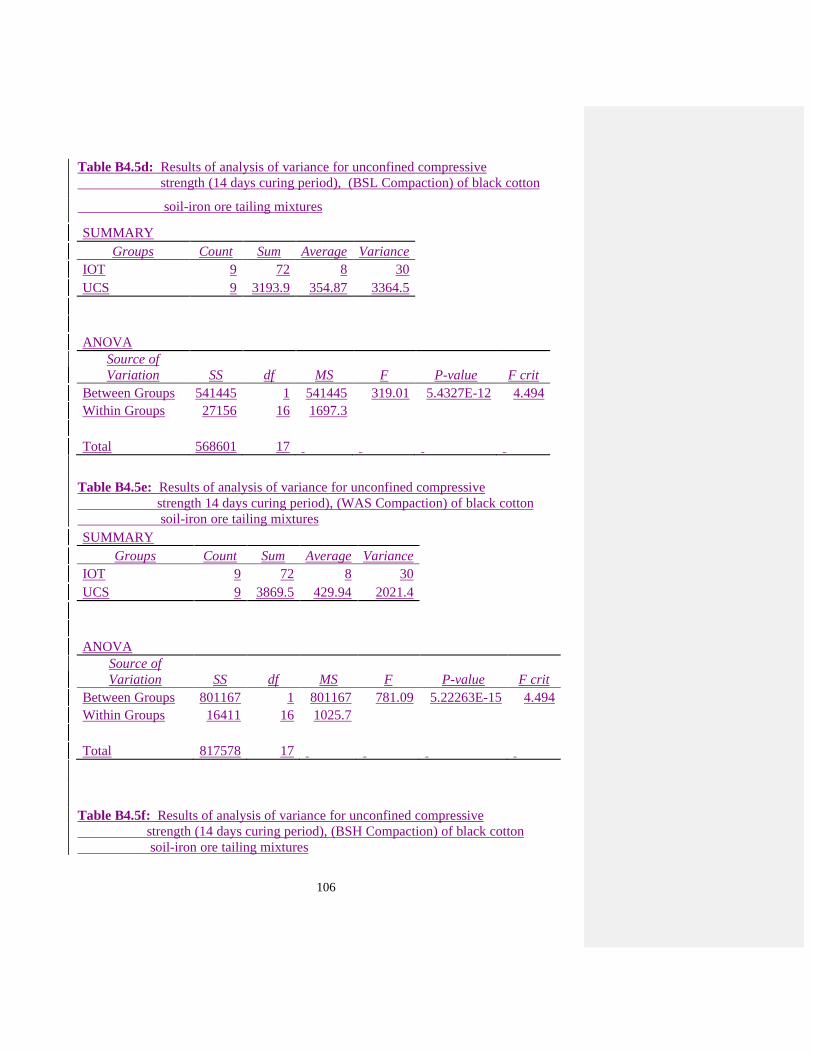
106
Table B4.5d: Results of analysis of variance for unconfined compressive
strength (14 days curing period), (BSL Compaction) of black cotton
soil-iron ore tailing mixtures
SUMMARY
Groups Count Sum Average Variance
IOT 9 72 8 30
UCS 9 3193.9 354.87 3364.5
ANOVA
Source of
Variation SS df MS F P-value F crit
Between Groups 541445 1 541445 319.01 5.4327E-12 4.494
Within Groups 27156 16 1697.3
Total 568601 17
Table B4.5e: Results of analysis of variance for unconfined compressive
strength 14 days curing period), (WAS Compaction) of black cotton
soil-iron ore tailing mixtures
SUMMARY
Groups Count Sum Average Variance
IOT 9 72 8 30
UCS 9 3869.5 429.94 2021.4
ANOVA
Source of
Variation SS df MS F P-value F crit
Between Groups 801167 1 801167 781.09 5.22263E-15 4.494
Within Groups 16411 16 1025.7
Total 817578 17
Table B4.5f: Results of analysis of variance for unconfined compressive
strength (14 days curing period), (BSH Compaction) of black cotton
soil-iron ore tailing mixtures

107
SUMMARY
Groups Count Sum Average Variance
IOT 9 72 8 30
UCS 9 5839.8 648.867 13972
ANOVA
Source of
Variation SS df MS F P-value F crit
Between Groups 1848195 1 1848195 264 2.29179E-11 4.494
Within Groups 112014 16 7000.86
Total 1960209 17
Table B4.5g: Results of analysis of variance for unconfined compressive
strength (28 days curing period) , (BSL Compaction) of black cotton
soil-iron ore tailing mixtures
SUMMARY
Groups Count Sum Average Variance
IOT 9 72 8 30
UCS 9 3763.2 418.13 5082.8
ANOVA
Source of
Variation SS df MS F P-value F crit
Between Groups 756930 1 756930 296.09 9.59175E-12 4.494
Within Groups 40902 16 2556.4
Total 797832 17
Table B4.5h: Results of analysis of variance for unconfined compressive
strength (28 days curing period), (WAS Compaction) of black cotton
soil-iron ore tailing mixtures
SUMMARY
Groups Count Sum Average Variance
IOT 9 72 8 30
UCS 9 6623.1 735.901 20837

108
ANOVA
Source of Variation SS df MS F P-value F crit
Between Groups 2384280 1 2384280 228.53 6.79943E-11 4.494
Within Groups 166933 16 10433.3
Total 2551213 17
Table B4.5i: Results of analysis of variance for unconfined compressive
strength (28 days curing period), (BSH Compaction) of black cotton
soil-iron ore tailing mixtures
SUMMARY
Groups Count Sum Average Variance
IOT 9 72 8 30
UCS 9 7517 835.226 20016
ANOVA
Source of Variation SS df MS F P-value F crit
Between Groups 3079360 1 3079360 307.23 7.2408E-12 4.494
Within Groups 160370 16 10023.1
Total 3239729 17
Table B4.5j: Results of analysis of variance for unconfined compressive
strength (7 days curing and 7 days soaking period), (BSL Compaction)
of black cotton soil-iron ore tailing mixtures
SUMMARY
Groups Count Sum Average Variance
IOT 9 72 8 30
UCS 9 579.92 64.436 555.37
ANOVA
Source of Variation SS df MS F P-value F crit
Between Groups 14332 1 14332 48.969 3.00764E-06 4.494
Within Groups 4682.9 16 292.68

109
Total 19015 17
Table B4.5k: Results of analysis of variance for unconfined compressive strength
(7 days curing, 7 days soaking) test results (WAS Compaction)
SUMMARY
Groups Count Sum Average Variance
IOT 9 72 8 30
UCS 9 706.89 78.543 677.8
ANOVA
Source of Variation SS df MS F P-value F crit
Between Groups 22394 1 22394 63.277 5.96925E-07 4.494
Within Groups 5662.4 16 353.9
Total 28056 17
Table B4.5l: Results of analysis of variance for unconfined compressive
strength (7 days curing, 7 days soaking period), (BSH Compaction) of black cotton soil-
iron ore tailing mixtures
SUMMARY
Groups Count Sum
Averag
e
Varianc
e
IOT 9 72 8 30
UCS 9 852.97 94.774 366.11
ANOVA
Source of Variation SS df MS F P-value F crit
Between Groups 33884 1 33884 171.08 5.84737E-10 4.494
Within Groups 3168.9 16 198.06
Total 37053 17

110
Table B4.6a: Results of analysis of variance for California bearing ratio
(Unsoaked), (BSL Compaction) of black cotton soil-iron ore
tailing mixtures
SUMMARY
Groups Count Sum Average Variance
IOT 9 72 8 30
CBR 9 111.64 12.404 11.96
ANOVA
Source of
Variation SS df MS F
P-
value F crit
Between Groups 87.296 1 87.296 4.1609 0.0582 4.494
Within Groups 335.68 16 20.98
Total 422.98 17
Table B4.6b: Results of analysis of variance for California bearing ratio
(Unsoaked), (WAS Compaction) of black cotton soil-iron ore
tailing mixtures
SUMMARY
Groups Count Sum Average Variance
IOT 9 72 8 30
CBR 9 135.44 15.049 11.811
ANOVA
Source of Variation SS df MS F
P-
value F crit
Between Groups 223.59 1 223.59 10.695 0.0048 4.494
Within Groups 334.49 16 20.905
Total 558.08 17
Table B4.6c: Results of analysis of variance for California bearing ratio

111
(Unsoaked), (BSH Compaction) of black cotton soil-iron ore
tailing mixtures
SUMMARY
Groups Count Sum
Averag
e
Varianc
e
IOT 9 72 8 30
CBR 9 200.5 22.278 19.738
ANOVA
Source of Variation SS df MS F P-value F crit
Between Groups 917.35 1 917.35 36.887 1.61259E-05 4.494
Within Groups 397.9 16 24.869
Total 1315.2 17
Table B4.6d: Results of analysis of variance for California bearing ratio
(Soaked), (BSL Compaction) of black cotton soil-iron ore tailing
mixtures
SUMMARY
Groups Count Sum Average Variance
IOT 9 72 8 30
CBR 9 38.06 4.2289 1.1831
ANOVA
Source of Variation SS df MS F
P-
value F crit
Between Groups 63.996 1 63.996 4.1045 0.0598 4.494
Within Groups 249.46 16 15.592
Total 313.46 17
Table B4.6e: Results of analysis of variance for California bearing ratio
(Soaked), (WAS Compaction) of black cotton soil-iron ore tailing
mixtures
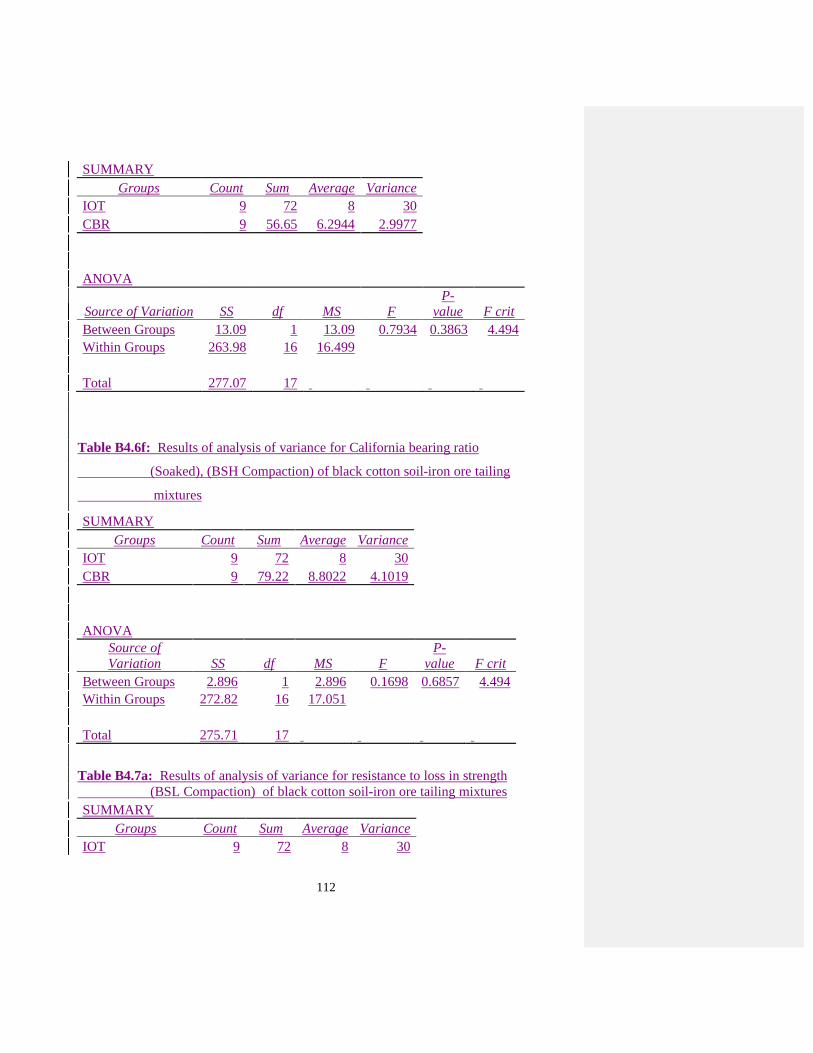
112
SUMMARY
Groups Count Sum Average Variance
IOT 9 72 8 30
CBR 9 56.65 6.2944 2.9977
ANOVA
Source of Variation SS df MS F
P-
value F crit
Between Groups 13.09 1 13.09 0.7934 0.3863 4.494
Within Groups 263.98 16 16.499
Total 277.07 17
Table B4.6f: Results of analysis of variance for California bearing ratio
(Soaked), (BSH Compaction) of black cotton soil-iron ore tailing
mixtures
SUMMARY
Groups Count Sum Average Variance
IOT 9 72 8 30
CBR 9 79.22 8.8022 4.1019
ANOVA
Source of
Variation SS df MS F
P-
value F crit
Between Groups 2.896 1 2.896 0.1698 0.6857 4.494
Within Groups 272.82 16 17.051
Total 275.71 17
Table B4.7a: Results of analysis of variance for resistance to loss in strength
(BSL Compaction) of black cotton soil-iron ore tailing mixtures
SUMMARY
Groups Count Sum Average Variance
IOT 9 72 8 30

113
DURABILITY 9 160.21 17.801 28.163
ANOVA
Source of
Variation SS df MS F
P-
value F crit
Between Groups 432.28 1 432.28 14.864 0.0014 4.494
Within Groups 465.31 16 29.082
Total 897.58 17
Table B4.7b: Results of analysis of variance for resistance to loss in strength
(WAS Compaction) of black cotton soil-iron ore tailing mixtures
SUMMARY
Groups Count Sum Average Variance
IOT 9 72 8 30
DURABILITY 9 161.54 17.949 22.634
ANOVA
Source of Variation SS df MS F
P-
value F crit
Between Groups 445.41 1 445.41 16.925 0.0008 4.494
Within Groups 421.07 16 26.317
Total 866.48 17
Table B4.7c: Results of analysis of variance for resistance to loss in strength
(BSH Compaction) of black cotton soil-iron ore tailing mixtures
SUMMARY
Groups Count Sum Average Variance
IOT 9 72 8 30
DURABLITY 9 131.55 14.617 2.4829

114
ANOVA
Source of Variation SS df MS F
P-
value F crit
Between Groups 197.01 1 197.01 12.13 0.0031 4.494
Within Groups 259.86 16 16.241
Total 456.87 17

115
Table B4.8: Results of two way analysis of variance for maximum dry density of iron
tailing-compactive effort
SUMMARY Count Sum Average Variance
0 % IOT 3 4.49 1.49667 0.01143
2 % IOT 3 4.57 1.52333 0.01123
4 % IOT 3 4.67 1.55667 0.00823
6 % IOT 3 4.72 1.57333 0.00743
8 % IOT 3 4.77 1.59 0.0084
10 % IOT 3 4.81 1.60333 0.00743
12 % IOT 3 4.83 1.61 0.0073
14 % IOT 3 4.87 1.62333 0.00813
16 % IOT 3 4.91 1.63667 0.00943
BSL 9 13.31 1.47889 0.00286
WAS 9 14.36 1.59556 0.00203
BSH 9 14.97 1.66333 0.0018
ANOVA
Source of Variation SS df MS F P-value F crit
IOT 0.05211852 8 0.00651 74.8511 3.23624E-11 2.5911
COMPACTIVE
EFFORT 0.15667407 2 0.07834 900.043 3.63E-17 3.63372
Error 0.00139259 16 8.7E-05
Total 0.21018519 26

116
Table B4.9: Results of two way analysis of variance for optimum moisture content of
iron tailing-compactive effort
SUMMARY Count Sum Average Variance
0 % IOT 3 63.5 21.1667 41.3333
2 % IOT 3 60 20 28
4 % IOT 3 58.2 19.4 29.23
6 % IOT 3 55.4 18.4667 33.4533
8 % IOT 3 53.5 17.8333 30.0833
10 % IOT 3 50.5 16.8333 30.0833
12 % IOT 3 48.8 16.2667 30.9633
14 % IOT 3 48 16 33.25
16 % IOT 3 49 16.3333 26.3333
BSL 9 219 24.3333 4.5
WAS 9 144.9 16.1 2.6025
BSH 9 123 13.6667 3.535
ANOVA
Source of Variation SS df MS F P-value F crit
IOT 82.1 8 10.2625 54.7333 3.58E-10 2.5911
COMPACTIVE
EFFORT 562.46 2 281.23 1499.89 6.27704E-19 3.63372
Error 3 16 0.1875
Total 647.56 26
Table B4.10a: Results of two way analysis of variance for unconfined compressive
strength (7 days curing period) of iron tailing-compactive effort
SUMMARY Count Sum Average Variance
0 % IOT 3 949.78 316.593 19181
2 % IOT 3 1188.75 396.25 40383.3

117
4 % IOT 3 1298.44 432.813 52498.5
6 % IOT 3 1364.81 454.937 60614.2
8 % IOT 3 1452.94 484.313 61958.4
10 % IOT 3 1551.64 517.213 68928.9
12 % IOT 3 1597.74 532.58 70982.2
14 % IOT 3 1563.75 521.25 61425
16 % IOT 3 1522.72 507.573 48026.3
BSL 9 2254.56 250.507 3395.9
WAS 9 3912.05 434.672 2447.75
BSH 9 6323.96 702.662 14018.2
ANOVA
Source of Variation SS df MS F P-value F crit
IOT 121440 8 15180 6.48466 0.00078 2.5911
COMPACTIVE
EFFORT 930541 2 465270 198.756 5E-12 3.63372
Error 37454.5 16 2340.91
Total 1089435 26

118
Table B4.10b: Results of two way analysis of variance for unconfined compressive
strength (14 days curing period) of iron tailing-compactive effort
SUMMARY Count Sum Average Variance
0 % IOT 3 1043.38 347.793 12137.9
2 % IOT 3 1198.58 399.527 10349.5
4 % IOT 3 1306.63 435.543 14362.3
6 % IOT 3 1403.25 467.75 21367.9
8 % IOT 3 1450.84 483.613 24912.7
10 % IOT 3 1540.39 513.463 27185.4
12 % IOT 3 1607.95 535.983 34606.8
14 % IOT 3 1667.45 555.817 42381.6
16 % IOT 3 1684.69 561.563 36055.2
BSL 9 3193.86 354.873 3364.53
WAS 9 3869.5 429.944 2021.4
BSH 9 5839.8 648.867 13971.7
ANOVA
Source of Variation SS df MS F P-value F crit
IOT 128127 8 16015.8 9.58511 7.90706E-05 2.5911
COMPACTIVE
EFFORT 419984 2 209992 125.676 1.64553E-10 3.63372
Error 26734.5 16 1670.91
Total 574845 26

119
Table B4.10c: Results of two way analysis of variance for unconfined compressive
strength (28 days curing period) of iron tailing-compactive effort
SUMMARY Count Sum Average Variance
0 % IOT 3 1415.5 471.833 32792.1
2 % IOT 3 1683.86 561.287 30096.8
4 % IOT 3 1755.61 585.203 30578.7
6 % IOT 3 1843.85 614.617 35684.5
8 % IOT 3 1950.87 650.29 41297.2
10 % IOT 3 2107.11 702.37 54411
12 % IOT 3 2261.62 753.873 66989.7
14 % IOT 3 2411.07 803.69 74359.2
16 % IOT 3 2473.79 824.597 78001
BSL 9 3763.17 418.13 5082.75
WAS 9 6623.11 735.901 20836.6
BSH 9 7517 835.222 20014.9
ANOVA
Source of Variation SS df MS F P-value F crit
IOT 333480 8 41685.1 19.6205 6.84115E-07 2.5911
COMPACTIVE
EFFORT 854427 2 427214 201.083 4.59375E-12 3.63372
Error 33993 16 2124.56
Total 1221901 26

120
Table B4.10d: Results of two way analysis of variance for unconfined compressive
strength (7 days curing + 7 days soaking periods) of iron tailing-compactive effort
SUMMARY Count Sum Average Variance
0 % IOT 3 126.82 42.2733 295.191
2 % IOT 3 155.66 51.8867 457.358
4 % IOT 3 195.86 65.2867 343.118
6 % IOT 3 243.68 81.2267 62.4296
8 % IOT 3 287.1 95.7 93.6601
10 % IOT 3 321.31 107.103 230.797
12 % IOT 3 314.54 104.847 299.69
14 % IOT 3 259.16 86.3867 238.524
16 % IOT 3 235.65 78.55 348.847
BSL 9 579.92 64.4356 555.368
WAS 9 706.89 78.5433 677.799
BSH 9 852.97 94.7744 366.112
ANOVA
Source of Variation SS df MS F P-value F crit
IOT 12203.8 8 1525.47 41.3372 2.99427E-09 2.5911
COMPACTIVE
EFFORT 4148.78 2 2074.39 56.2117 5.80503E-08 3.63372
Error 590.45 16 36.9031
Total 16943 26

121
Table B4.11: Results of two way analysis of variance for California bearing ratio
(unsoaked) of iron tailing-compactive effort
SUMMARY Count Sum Average Variance
0 % IOT 3 32.78 10.9267 13.521
2 % IOT 3 38.06 12.6867 23.236
4 % IOT 3 43.43 14.4767 36.29
6 % IOT 3 46.46 15.4867 41.4825
8 % IOT 3 53.1 17.7 49.7203
10 % IOT 3 57.63 19.21 48.5172
12 % IOT 3 63.81 21.27 46.0831
14 % IOT 3 57.03 19.01 6.3247
16 % IOT 3 55.28 18.4267 5.62973
BSL 9 111.64 12.4044 11.9603
WAS 9 135.44 15.0489 11.8108
BSH 9 200.5 22.2778 19.7378
ANOVA
Source of Variation SS df MS F P-value F crit
IOT 276.66 8 34.5825 7.74834 0.00028 2.5911
COMPACTIVE
EFFORT 470.198 2 235.099 52.6748 9.1E-08 3.63372
Error 71.4114 16 4.46321
Total 818.269 26

122
Table B4.12: Results of two way analysis of variance for California bearing ratio
(soaked) of iron tailing-compactive effort
SUMMARY Count Sum Average Variance
0 % IOT 3 12.09 4.03 1.3351
2 % IOT 3 13.89 4.63 2.5753
4 % IOT 3 16.59 5.53 3.5401
6 % IOT 3 19.21 6.40333 5.45443
8 % IOT 3 21.15 7.05 4.6033
10 % IOT 3 23.78 7.92667 6.13343
12 % IOT 3 25.68 8.56 8.0499
14 % IOT 3 22.66 7.55333 11.9554
16 % IOT 3 18.88 6.29333 9.31293
BSL 9 38.06 4.22889 1.18309
WAS 9 56.65 6.29444 2.99768
BSH 9 79.22 8.80222 4.10189
ANOVA
Source of Variation SS df MS F P-value F crit
IOT 54.7539 8 6.84424 9.51636 8.26591E-05 2.5911
COMPACTIVE
EFFORT 94.4125 2 47.2063 65.6365 1.94078E-08 3.63372
Error 11.5073 16 0.71921
Total 160.674 26

123
Table B4.13: Results of two way analysis of variance for resistance to loss in strength of
iron tailing-compactive effort
SUMMARY Count Sum Average Variance
0 % IOT 3 35.74 11.9133 1.30363
2 % IOT 3 38.04 12.68 3.7423
4 % IOT 3 44.97 14.99 0.3775
6 % IOT 3 54.36 18.12 13.5364
8 % IOT 3 62.13 20.71 18.6049
10 % IOT 3 64.96 21.6533 15.1041
12 % IOT 3 61.5 20.5 22.2703
14 % IOT 3 48.68 16.2267 7.95463
16 % IOT 3 42.92 14.3067 4.70063
BSL 9 160.21 17.8011 28.1633
WAS 9 161.54 17.9489 22.6337
BSH 9 131.55 14.6167 2.4829
ANOVA
Source of Variation SS df MS F P-value F crit
IOT 314.849 8 39.3561 5.65308 0.00163 2.5911
COMPACTIVE
EFFORT 63.7987 2 31.8993 4.582 0.02671 3.63372
Error 111.39 16 6.96189
Total 490.038 26
Formatted: Left

124
Table
Page
B4.1: Results of analysis of variance for cation exchange capacity
of black cotton soil-iron ore tailing mixtures 1023
B4.2a: Results of analysis of variance for liquid limit of black cotton
soil-iron ore tailing mixtures 1023
B4.2b: Results of analysis of variance for plastic limit of black cotton
soil-iron ore tailing mixtures 1034
B4.2c: Results of analysis of variance for plasticity index of black
cotton soil-iron ore tailing mixtures 1034
B4.2d: Results of analysis of variance for linear shrinkage of black
cotton soil-iron ore tailing mixtures 1045
B4.3a: Results of analysis of variance for maximum dry density
(BSL Compaction) of black cotton soil-iron ore tailing mixtures 1045
B4.3b: Results of analysis of variance for maximum dry density
(WAS Compaction) of black cotton soil-iron ore tailing mixtures 1065
B4.3c: Results of analysis of variance for maximum dry density
(BSH Compaction) of black cotton soil-iron ore tailing mixtures 1056
B4.4a: Results of analysis of variance for optimum moisture content
(BSL Compaction) of black cotton soil-iron ore tailing mixtures 1067
B4.4b: Results of analysis of variance for optimum moisture content
(WAS Compaction) of black cotton soil-iron ore tailing mixtures 1067
B4.4c: Results of analysis of variance for optimum moisture content

125
(BSH Compaction) of black cotton soil-iron ore tailing mixtures 1078
Table
Page
B4.5a: Results of analysis of variance for unconfined compressive strength
(7 days curing period) , (BSL Compaction) of black cotton soil-iron
ore tailing mixtures
1078
B4.5b: Results of analysis of variance for unconfined compressive
strength (7 days curing period), (WAS Compaction)
of black cotton soil-iron ore tailing mixtures
1089
B4.5c: Results of analysis of variance for unconfined compressive
strength (7 days curing period), (BSH Compaction) of black cotton
soil-iron ore tailing mixtures
1089
B4.5d: Results of analysis of variance for unconfined compressive
strength (14 days curing period), (BSL Compaction) of black cotton
soil-iron ore tailing mixtures
109110
B4.5e: Results of analysis of variance for unconfined compressive
strength 14 days curing period), (WAS Compaction) of black cotton

126
soil-iron ore tailing mixtures
109110
B4.5f: Results of analysis of variance for unconfined compressive
strength (14 days curing period), (BSH Compaction) of black cotton
soil-iron ore tailing mixtures
1101
B4.5g: Results of analysis of variance for unconfined compressive strength
(28 days curing period) , (BSL Compaction) of black cotton soil-iron
ore tailing mixtures
110111
Table Page
B4.5h: Results of analysis of variance for unconfined compressive
strength (28 days curing period), (WAS Compaction) of black cotton
soil-iron ore tailing mixtures
1112
B4.5i: Results of analysis of variance for unconfined compressive
strength (28 days curing period), (BSH Compaction) of black cotton
soil-iron ore tailing mixtures
1112
B4.5j: Results of analysis of variance for unconfined compressive
strength (7 days curing and 7 days soaking period), (BSL Compaction)

127
of black cotton soil-iron ore tailing mixtures
1123
B4.5k: Results of analysis of variance for unconfined compressive strength
(7 days curing, 7 days soaking) test results (WAS Compaction)
1123
B4.5l: Results of analysis of variance for unconfined compressive strength
(7 days curing, 7 days soaking period), (BSH Compaction) of black
cotton soil-iron ore tailing mixtures
1134
B4.6a: Results of analysis of variance for California bearing ratio
(Unsoaked), (BSL Compaction) of black cotton soil-iron ore
tailing mixtures
1134
B4.6b: Results of analysis of variance for California bearing ratio
(Unsoaked), (WAS Compaction) of black cotton soil-iron ore
tailing mixtures
1145
Table Page
B4.6c: Results of analysis of variance for California bearing ratio
(Unsoaked), (BSH Compaction) of black cotton soil-iron ore
tailing mixtures 1145

128
B4.6d: Results of analysis of variance for California bearing ratio
(Soaked), (BSL Compaction) of black cotton soil-iron ore tailing
mixtures 1156
B4.6e: Results of analysis of variance for California bearing ratio
(Soaked), (WAS Compaction) of black cotton soil-iron ore tailing
mixtures 1156
B4.6f: Results of analysis of variance for California bearing ratio
(Soaked), (BSH Compaction) of black cotton soil-iron ore tailing
mixtures 1167
B4.7a: Results of analysis of variance for resistance to loss in strength
(BSL Compaction) of black cotton soil-iron ore tailing mixtures
1167
B4.7b: Results of analysis of variance for resistance to loss in strength
(WAS Compaction) of black cotton soil-iron ore tailing mixtures 1178
B4.7c: Results of analysis of variance for resistance to loss in strength
(BSH Compaction) of black cotton soil-iron ore tailing mixtures 1178
B4.8: Results of two way analysis of variance for maximum dry density
of iron tailing-compactive effort
1189
Table
Page

129
B4.9: Results of two way analysis of variance for optimum moisture content
of iron tailing-compactive effort
11920
B4.10a: Results of two way analysis of variance for unconfined compressive
strength (7 days curing period) of iron tailing-compactive effort
1201
B4.10b: Results of two way analysis of variance for unconfined compressive
strength (14 days curing period) of iron tailing-compactive effort
1212
B4.10c: Results of two way analysis of variance for unconfined compressive
strength (28 days curing period) of iron tailing-compactive effort
1223
B4.10d: Results of two way analysis of variance for unconfined compressive
strength (7 days curing + 7 days soaking periods) of iron tailing-
compactive effort
1234
B4.11: Results of two way analysis of variance for California bearing ratio
(unsoaked) of iron tailing-compactive effort
1245
B4.12: Results of two way analysis of variance for California bearing ratio
(soaked) of iron tailing-compactive effort
1256

130
B4.13: Results of two way analysis of variance for resistance to loss in
strength of iron tailing-compactive effort
1267
LIST OF ABBREVIATIONS
AASHTO American Association of State Highway and Transportation Officials
ANOVA Analysis of Variance
ASTM American Society for Testing and Materials
BS British Standard
BSH British Standard heavy
BSL British Standard light
CEC Cation Exchange Capacity
FCRIT F- Critical value
FSTAT F- Statistic
IOT Iron Ore Tailing
LL Liquid Limit
MDD Maximum Dry Density
OMC Optimum Moisture Content

131
PL Plastic Limit
PI Plasticity Index
USCS Unified Soil Classification System
WAS West African Standard