SSR Damping Controller Design and Optimal Placement in Rotor-Side and Grid-Side Converters of...
12
IEEE TRANSACTIONS ON SUSTAINABLE ENERGY 1 SSR Damping Controller Design and Optimal Placement in Rotor-Side and Grid-Side Converters of Series Compensated DFIG-Based Wind Farm Hossein Ali Mohammadpour, Member, IEEE, Enrico Santi, Senior Member, IEEE. Abstract—This paper deals with sub-synchronous resonance (SSR) phenomena in a capacitive series compensated DFIG- based wind farm. Using both modal analysis and time-domain simulation, it is shown that the DFIG wind farm is potentially unstable due to the SSR mode. In order to damp the SSR, the rotor-side converter (RSC) and grid-side converter (GSC) controllers of the DFIG are utilized. The objective is to design a simple proportional SSR damping controller (SSRDC) by properly choosing an optimum input control signal (ICS) to the SSRDC block so that the SSR mode becomes stable without decreasing or destabilizing the other system modes. Moreover, an optimum point within the RSC and GSC controllers to insert the SSRDC is identified. Three different signals are tested as potential ICSs including rotor speed, line real power, and voltage across the series capacitor, and an optimum ICS is identified using residue- based analysis and root-locus method. Moreover, two methods are discussed in order to estimate the optimum ICS, without measuring it directly. The studied power system is a 100 MW DFIG-based wind farm connected to a series-compensated line whose parameters are taken from IEEE first benchmark model for computer simulation of the SSR. Matlab/Simulink is used as a tool for modeling and design of the SSRDC, and PSCAD/EMTDC is used to perform time-domain simulation for design process validation. Index Terms—Doubly-fed induction generator (DFIG), SSR, eigenvalue analysis, sustainable energy, wind power. I. I NTRODUCTION D UE to the recent rapid penetration of wind power into the power systems some countries in central Europe, e.g. Germany, have ran out of suitable sites for onshore wind power projects, due to the high population density in these countries [1] - [4]. Moreover, it has been found that the offshore wind power resources are much larger than onshore wind power sources [2], [4]. Therefore, offshore wind farms have a great potential as large-scale sustainable electric energy resources [5]. One promising solution for offshore wind farm is that of doubly-fed induction generator (DFIG), which has gained recent attention of the electric power industry [6] - [9]. Because of their larger size and breadth, offshore wind farms require higher voltage and more robust transmission Manuscript received May 05, 2014; revised September 02, 2014, and November 21, 2014; accepted December 08, 2014. This work was supported by the National Science Foundation (NSF) I/UCRC (Industry/University Cooperative Research Center) for Grid- Connected Advanced Power Electronic Systems (GRAPES) center, under #0934378. H. A. Mohammadpour and E. Santi are with the Department of Electrical Engineering, University of South Carolina, Columbia, SC, 29208 USA e-mail: ([email protected]; [email protected]). schemes to achieve adequate efficiency [4], [10]. The transmis- sion system options to transmit the wind power to the shore are high-voltage AC (HVAC) or high-voltage DC (HVDC) [11] - [15]. Studies show that transmitting the offshore wind power through less expensive HVAC is technically feasible for distances larger than 250 km, if series capacitive compensation is provided for the transmission line [4]. However, a factor hindering the extensive use of series ca- pacitive compensation is the potential risk of sub- synchronous resonance (SSR) [16] - [22]. The SSR is a condition where the wind farm exchanges energy with the electric network, to which it is connected, at one or more natural frequencies of the electric or mechanical part of the combined system, comprising the wind farm and the network, and the frequency of the exchanged energy is below the fundamental frequency of the system. This phenomenon may cause severe damage in the wind farm, if not prevented [22] - [24]. In order to address the SSR problem in DFIG based wind farm, this paper studies SSR damping in DFIG based wind farms by designing a SSRDC using residue-based analysis and root-locus diagrams. Three signals are tested as ICS including rotor speed, transmission line real power, and voltage across the series capacitor, and the optimum ICS is identified using both residue-based analysis and root-locus method. Moreover, several possible points of the rotor-side converter (RSC) and grid-side converter (GSC) controllers of the DFIG wind farm, where the SSRDC can be introduced, are studied, and the optimum points are identified. The SSR damping using DFIG - based wind farms has also been studied by Fan and Miao in [25]. Their goal is to design an auxiliary SSRDC for the GSC controllers using eigenvalue analysis method in order to increase the stability of both sub-synchronous and supersynchronous modes. Only averaged converter models are used for validation. The novel contribution of the current work over [25] can be summarized as follows: 1) all different points of the RSC and GSC are tested in order to find the optimal point to insert the SSRDC, 2) the discussions presented based on small-signal stability and eigenvalue analysis in Matlab/Simulink are validated using de- tailed time-domain simulations in PSCAD/EMTDC, including converter switching models, 3) using both eigenvalue analysis and time-domain simulations, it is shown why the RSC cannot be used as a potential insertion point for the SSRDC, 4) it is shown that the improper selection of the input control signal to the SSRDC not only may result in unstable super- synchronous mode but also can make other system modes, This is the author's version of an article that has been published in this journal. Changes were made to this version by the publisher prior to publication. The final version of record is available at http://dx.doi.org/10.1109/TSTE.2014.2380782 Copyright (c) 2015 IEEE. Personal use is permitted. For any other purposes, permission must be obtained from the IEEE by emailing [email protected].
-
Upload
independent -
Category
Documents
-
view
2 -
download
0
Transcript of SSR Damping Controller Design and Optimal Placement in Rotor-Side and Grid-Side Converters of...
IEEE TRANSACTIONS ON SUSTAINABLE ENERGY 1
SSR Damping Controller Design and OptimalPlacement in Rotor-Side and Grid-Side Convertersof Series Compensated DFIG-Based Wind Farm
Hossein Ali Mohammadpour, Member, IEEE, Enrico Santi, Senior Member, IEEE.
Abstract—This paper deals with sub-synchronous resonance(SSR) phenomena in a capacitive series compensated DFIG-based wind farm. Using both modal analysis and time-domainsimulation, it is shown that the DFIG wind farm is potentiallyunstable due to the SSR mode. In order to damp the SSR,the rotor-side converter (RSC) and grid-side converter (GSC)controllers of the DFIG are utilized. The objective is to designa simple proportional SSR damping controller (SSRDC) byproperly choosing an optimum input control signal (ICS) to theSSRDC block so that the SSR mode becomes stable withoutdecreasing or destabilizing the other system modes. Moreover, anoptimum point within the RSC and GSC controllers to insert theSSRDC is identified. Three different signals are tested as potentialICSs including rotor speed, line real power, and voltage across theseries capacitor, and an optimum ICS is identified using residue-based analysis and root-locus method. Moreover, two methodsare discussed in order to estimate the optimum ICS, withoutmeasuring it directly. The studied power system is a 100 MWDFIG-based wind farm connected to a series-compensated linewhose parameters are taken from IEEE first benchmark modelfor computer simulation of the SSR. Matlab/Simulink is used as atool for modeling and design of the SSRDC, and PSCAD/EMTDCis used to perform time-domain simulation for design processvalidation.
Index Terms—Doubly-fed induction generator (DFIG), SSR,eigenvalue analysis, sustainable energy, wind power.
I. INTRODUCTION
DUE to the recent rapid penetration of wind power intothe power systems some countries in central Europe, e.g.
Germany, have ran out of suitable sites for onshore wind powerprojects, due to the high population density in these countries[1] - [4]. Moreover, it has been found that the offshore windpower resources are much larger than onshore wind powersources [2], [4]. Therefore, offshore wind farms have a greatpotential as large-scale sustainable electric energy resources[5]. One promising solution for offshore wind farm is thatof doubly-fed induction generator (DFIG), which has gainedrecent attention of the electric power industry [6] - [9].
Because of their larger size and breadth, offshore windfarms require higher voltage and more robust transmission
Manuscript received May 05, 2014; revised September 02, 2014, andNovember 21, 2014; accepted December 08, 2014.
This work was supported by the National Science Foundation (NSF)I/UCRC (Industry/University Cooperative Research Center) for Grid-Connected Advanced Power Electronic Systems (GRAPES) center, under#0934378.
H. A. Mohammadpour and E. Santi are with the Department of ElectricalEngineering, University of South Carolina, Columbia, SC, 29208 USA e-mail:([email protected]; [email protected]).
schemes to achieve adequate efficiency [4], [10]. The transmis-sion system options to transmit the wind power to the shoreare high-voltage AC (HVAC) or high-voltage DC (HVDC)[11] - [15]. Studies show that transmitting the offshore windpower through less expensive HVAC is technically feasible fordistances larger than 250 km, if series capacitive compensationis provided for the transmission line [4].
However, a factor hindering the extensive use of series ca-pacitive compensation is the potential risk of sub- synchronousresonance (SSR) [16] - [22]. The SSR is a condition wherethe wind farm exchanges energy with the electric network,to which it is connected, at one or more natural frequenciesof the electric or mechanical part of the combined system,comprising the wind farm and the network, and the frequencyof the exchanged energy is below the fundamental frequencyof the system. This phenomenon may cause severe damage inthe wind farm, if not prevented [22] - [24].
In order to address the SSR problem in DFIG based windfarm, this paper studies SSR damping in DFIG based windfarms by designing a SSRDC using residue-based analysis androot-locus diagrams. Three signals are tested as ICS includingrotor speed, transmission line real power, and voltage acrossthe series capacitor, and the optimum ICS is identified usingboth residue-based analysis and root-locus method. Moreover,several possible points of the rotor-side converter (RSC) andgrid-side converter (GSC) controllers of the DFIG wind farm,where the SSRDC can be introduced, are studied, and theoptimum points are identified.
The SSR damping using DFIG - based wind farms hasalso been studied by Fan and Miao in [25]. Their goal isto design an auxiliary SSRDC for the GSC controllers usingeigenvalue analysis method in order to increase the stabilityof both sub-synchronous and supersynchronous modes. Onlyaveraged converter models are used for validation. The novelcontribution of the current work over [25] can be summarizedas follows: 1) all different points of the RSC and GSC aretested in order to find the optimal point to insert the SSRDC,2) the discussions presented based on small-signal stability andeigenvalue analysis in Matlab/Simulink are validated using de-tailed time-domain simulations in PSCAD/EMTDC, includingconverter switching models, 3) using both eigenvalue analysisand time-domain simulations, it is shown why the RSC cannotbe used as a potential insertion point for the SSRDC, 4)it is shown that the improper selection of the input controlsignal to the SSRDC not only may result in unstable super-synchronous mode but also can make other system modes,
This is the author's version of an article that has been published in this journal. Changes were made to this version by the publisher prior to publication.The final version of record is available at http://dx.doi.org/10.1109/TSTE.2014.2380782
Copyright (c) 2015 IEEE. Personal use is permitted. For any other purposes, permission must be obtained from the IEEE by emailing [email protected].
IEEE TRANSACTIONS ON SUSTAINABLE ENERGY 2
such as electromechanical and shaft modes, unstable 5) twomethods are discussed to derive the optimal input controlsignal to the SSRDC, and the methods are validated usingtime-domain simulations.
The organization of the rest of the paper is as follows.In Section II, the studied power system and its small-signal stability modeling is briefly described. In Section III,the SSR phenomenon in fixed series compensated DFIG isbriefly presented. In this section, time-domain simulation inPSCAD/EMTDC is also presented to verify the eigenvalueanalysis. In Section IV, the rotor-side converter (RSC) andgrid-side converter (GSC) controllers of DFIG used in thispaper are described. In Section V, a SSRDC is designedusing residue-based and root-locus methods. Using these twomethods, the optimum point within the DFIG converter whereto insert the SSRDC and optimum input-control signal (ICS)to the SSRDC are identified. The optimum converter and ICSshould enable the SSRDC to damp the SSR mode using asimple proportional gain, without destabilizing other systemmodes. The proportional controller is chosen, over other op-tions, such as lead-lag compensators and state compensators,for its simplicity and for the fact that the root locus methodcan be used for determining the proportional gain value. Morecomplex compensators have a larger number of parameters andtend to require trial-and-error parameter tuning, which is timeconsuming and undesirable. In Section VI, the effectivenessof the SSRDC design process is validated using time-domainsimulations in PSCAD/EMTDC. In Section VII, two methodsare discussed to locally estimate the ICS. Finally, Section VIIconcludes the work.
II. POWER SYSTEM DESCRIPTION
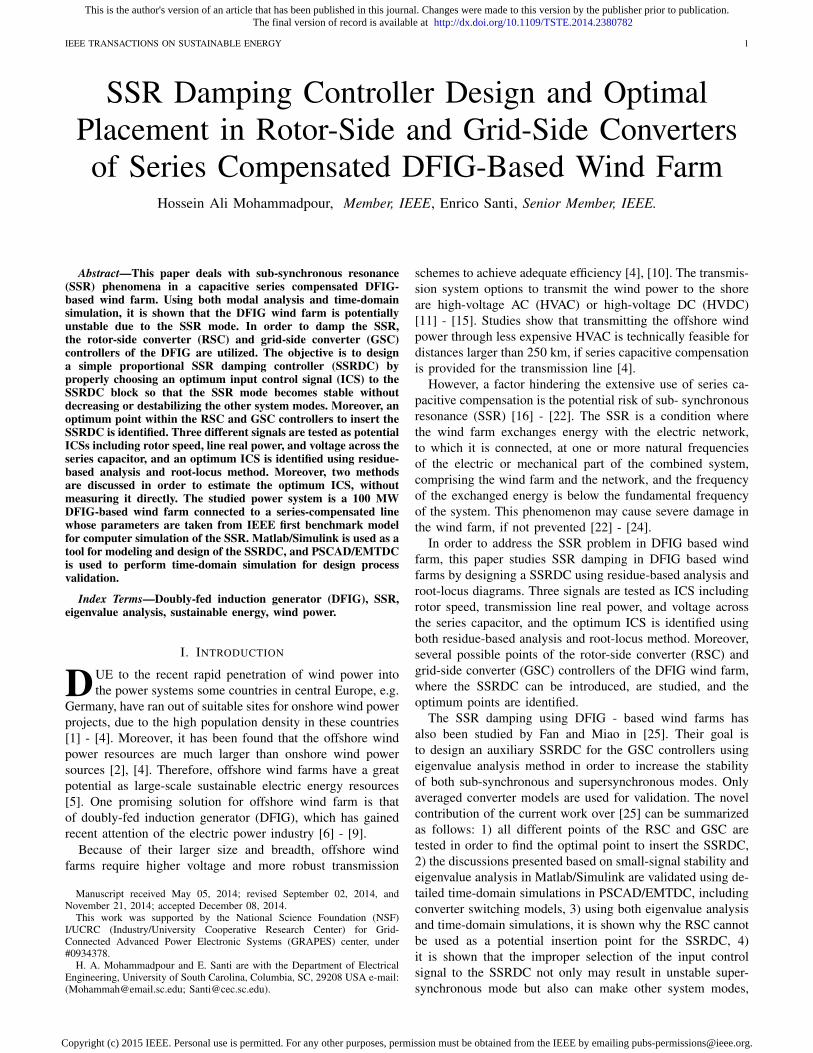
The studied power system, shown in Fig. 1, is adapted fromthe IEEE first benchmark model (FBM) for SSR studies [22].In this system, a 100 MW DFIG-based offshore wind farm isconnected to the infinite bus via a 161 kV series compensatedtransmission line [26], [27]. The 100 MW wind farm is anaggregated model of 50 wind turbine units, where each unit hasa power rating of 2 MW. In fact, a 2 MW wind turbine is scaledup to represent the 100 MW wind farm. This simplificationis supported by several studies [12], [28] showing that anaggregated wind farm model is adequate for power systemdynamics studies.
The differential equations for eigenvalue analysis are ob-tained using the parameters of the system directly. Detailedmodal analysis of the power system modes have been de-scribed in the authors’ previous research in [29], [30]. A sixth-order model is used to represent the induction generator (IG)stator and rotor current dynamics, while a third-order model isused to represent the shaft system. The high-frequency switch-ing dynamics of the grid-side converter (GSC) and rotor-side converter (RSC) are neglected in the dynamic modelingprocess, but both the inner and outer control loops of RSCand GSC are modeled in this paper. The dynamics of theDC link between RSC and GSC are also considered, which isrepresented by a first order differential equations. Additionally,a fourth-order model is considered for the series compensated
Fig. 1. One line diagram of the studied power system. RL = transmission lineresistance, XL = transmission line reactance, XT = transformer reactance,Xsys = system impedance, XC = fixed series capacitor, Xtg = transformerreactance in grid side converter (GSC), Vs = generator’s terminal voltage, iL= line current, ig = GSC current, is = stator current, ir = rotor current [2],[22].
TABLE IEIGENVALUES OF THE SYSTEM AT 55% SERIES COMPENSATION AND 7
M/S WIND SPEED.
Mode Eigenvalue Mode Eigenvalueλ1,2 +1.2126 ± j128.5545 λ15 -113.5742λ3,4 -5.2253 ± j620.3963 λ16 -0.5000λ5,6 -10.9322 ± j 100.0909 λ17 -0.01392λ7,8 -0.9974 ± j5.9965 λ18 -0.0028λ9,10 -859.1914 ± j4219.9308 λ19 -19.9297λ11,12 -0.1178 ± j0.5332 λ20 -20.8000λ13 -2181.4727 λ21 -0.0000λ14 -97.6980 λ22 -0.0000
transmission line . Thus, the complete system model is of 22nd
order.
III. SSR ANALYSIS IN SERIES COMPENSATED DFIG
A series compensated power system with a compensationlevel defined as K = XC∑
X excites sub-synchronous currentsat a frequency given by [21]:
fn = fs
√XC∑X
(1)
where∑X is the entire reactance seen from infinite bus, fn
is the natural frequency of the electric system, and fs is thefundamental frequency of the system.
At this frequency the slip, given by (2), becomes negativesince the natural resonance frequency, fn, is less than the elec-trical frequency corresponding to the generator rotor speed, fr.
S =fn − frfn
(2)
If the magnitude of the equivalent rotor resistance, i.e. Rr
S <0, exceeds the sum of the resistances of the armature and thenetwork, there will be an equivalent negative resistance at thesub-synchronous frequency, and the sub-synchronous currentwould increase with time. This phenomenon is called inductiongenerator effect (IGE) [21], and only involves rotor electricaldynamics [21].
This is the author's version of an article that has been published in this journal. Changes were made to this version by the publisher prior to publication.The final version of record is available at http://dx.doi.org/10.1109/TSTE.2014.2380782
Copyright (c) 2015 IEEE. Personal use is permitted. For any other purposes, permission must be obtained from the IEEE by emailing [email protected].
IEEE TRANSACTIONS ON SUSTAINABLE ENERGY 3
TABLE IIPARTICIPATION FACTORS AT 55% SERIES COMPENSATION AND 7 M/S WIND SPEED.
λ1,2 λ3,4 λ5,6 λ7,8 λ9,10q-axis stator current-iqs 0.2791 0.2210 0.2783 0.0031 0.3435d-axis stator current-ids 0.2081 0.1755 0.2057 0.0971 0.09770q-axis rotor current-iqr 0.2790 0.2027 0.2907 0.0034 0.1319d-axis rotor current-idr 0.2082 0.1610 0.2172 0.1117 0.0830q-axis cap. voltage-vCq 0.0069 0.0671 0.0016 0.0030 0.0003d-axis cap. voltage-vCd 0.0066 0.0689 0.0015 0.0000 0.0000q-axis line current-iLq 0.0050 0.0487 0.0014 0.0000 0.0717d-axis line current-iLd 0.0056 0.0544 0.0017 0.0056 0.0051rotor speed-ωr 0.0007 0.0000 0.0015 0.3097 0.0000turbine speed-ωm 0.0000 0.0000 0.0000 0.0668 0.0000torque between masses Ttg 0.0000 0.0000 0.0000 0.3849 0.0000DC-link voltage-vDC 0.0000 0.0002 0.0000 0.0000 0.2613
A. System Modes and Participation Factor
Table I shows the eigenvalues of the system when the windspeed is 7 m/s and the compensation level is 55%. In Table I,eigenvalues λ13 to λ22 represent non-oscillatory stable modes.Also, complex conjugate eigenvalues λ11,12 are related to thePI regulators.
Participation factor is a measure of the relative participationof jth state variable in the ith mode of the system. The magni-tude of the normalized participation factors for an eigenvalue,λi, is defined as [31]:
Pji =|Φji||Ψij |n∑k=1
|Φki||Ψik|(3)
where Pji is the participation factor, n is the number of modesor state variables, Φ is the right eigenvector, and Ψ is the lefteigenvector.
Table II shows the participation factors of the system modesof interest when the wind speed is 7 m/s and the compensationlevel is 55%. In this table, larger participation factors in eachcolumn are bolded. By looking at this table, one can readilyfind the participation of each state variable in system modes.Based on Table II and using participation factors related toλ9,10, one can see that this mode is associated primarily tothe q-axis stator current iqs, the q-axis rotor current idr, andthe DC link voltage, vDC .
Through examination of participation factor analysis andof the actual frequencies of the system modes, λ5,6 andλ7,8 are identified to be the electro-mechanical mode and theshaft mode, respectively. Eigenvalues λ1,2 with the oscillatingfrequency of 20.46 Hz and λ3,4 with the oscillating frequencyof 98.74 Hz are the SSR and super-synchronous (SupSR)modes, respectively. Table I also shows that the SSR modeat 55% compensation and 7 m/s wind speed is unstable, asthe real part of this mode is positive.
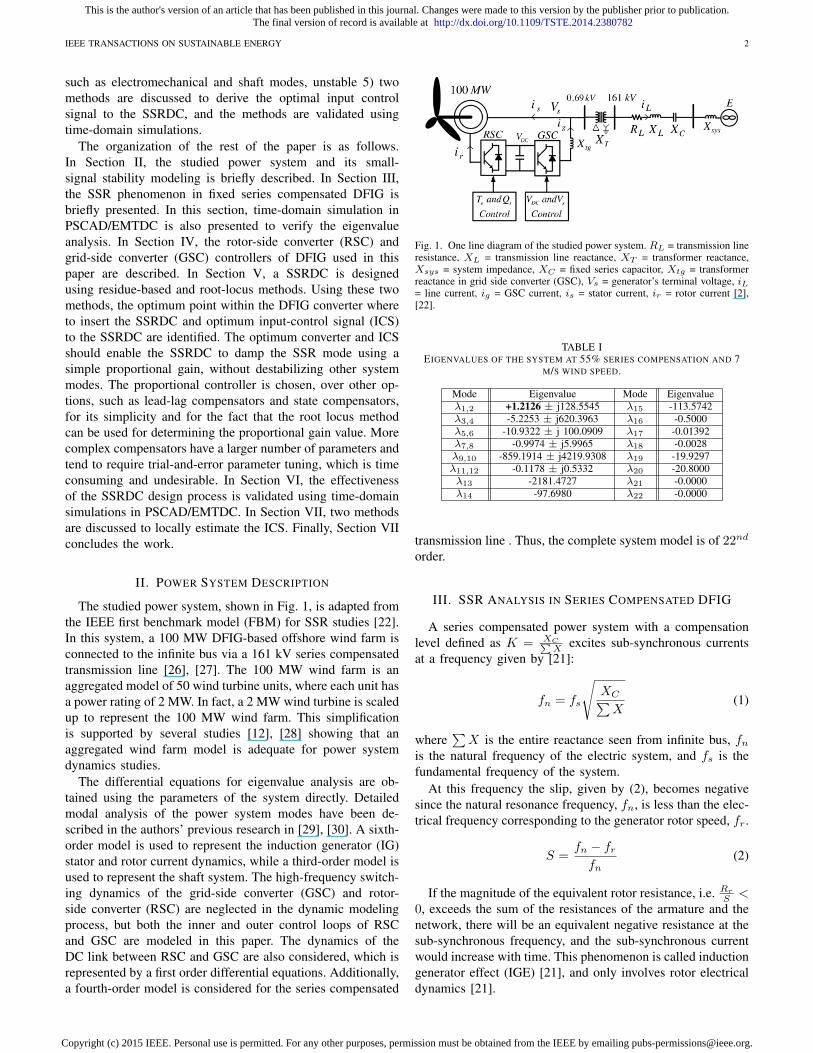
B. Time-Domain Simulation
In order to confirm the eigenvalue analysis provided in TableI, time-domain simulation is also presented. Fig. 2 shows realpower of the transmission line when the series compensationis 55% and the wind speed is 7 m/s. Note that in the givensimulation result, the system is first started with a seriescompensation level, i.e. 50% at which the wind farm is stable,
0.5 0.75 1.0 1.25 1.50
0.2
0.4
0.6
PL (
p.u.
)
Time (s)
Fig. 2. Transmission line real power PL at 55% compensation level and 7m/s wind speed.
0.5 0.75 1 1.25 1.5 1.75 2
0
0.5
1
1.5
Pω(p.u.)
ωm(p.u.)
Wind power (p.u.)
Vω =10 m/s
Vω = 6 m/s
Vω = 12 m/s
Vω = 7 m/s
Vω = 11 m/s
Vω = 9 m/sVω = 8 m/s
Maximum Power Point Tracking (MPPT) Curve
Wind PowerCurves Pω
Fig. 3. Wind power Pω (p.u.), wind turbine shaft speed ωm (p.u.), andwind speed Vω (m/s) relationship.
and then at t = 0.5 s, the compensation level is changed. Asthis figure shows, as we expected from Table I, the systemis unstable, and the oscillating frequency is about 20.45 Hz,which matches well with what is calculated in Table I usingmodal analysis ( 128.55452π = 20.46 Hz).
IV. DFIG CONVERTER CONTROLLERS
In order to achieve high efficiency in the DFIG wind farm,the maximum power point tracking (MPPT) is used [32]. Fig.3 shows the wind power versus wind turbine shaft speed inper unit for various wind speeds with indication of MPPTcurve. To enforce operation on the MPPT curve, for a givenwind speed Vω , the optimum reference power and optimum
This is the author's version of an article that has been published in this journal. Changes were made to this version by the publisher prior to publication.The final version of record is available at http://dx.doi.org/10.1109/TSTE.2014.2380782
Copyright (c) 2015 IEEE. Personal use is permitted. For any other purposes, permission must be obtained from the IEEE by emailing [email protected].
IEEE TRANSACTIONS ON SUSTAINABLE ENERGY 4
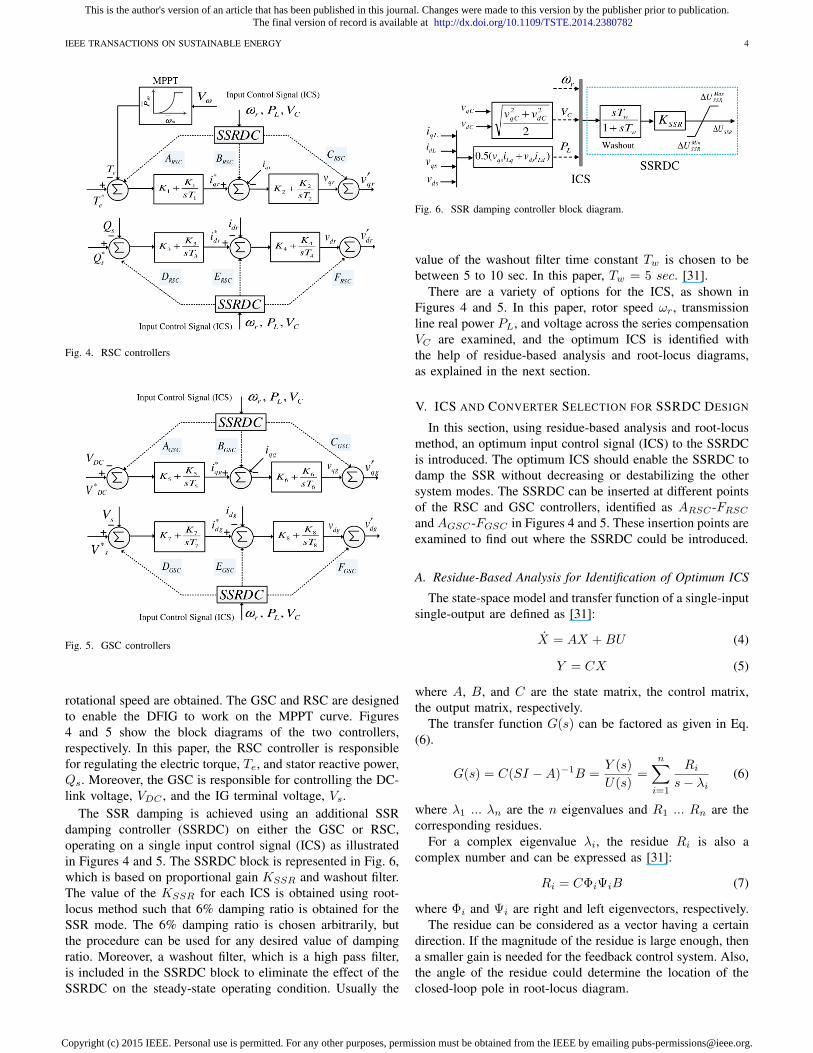
Fig. 4. RSC controllers
Fig. 5. GSC controllers
rotational speed are obtained. The GSC and RSC are designedto enable the DFIG to work on the MPPT curve. Figures4 and 5 show the block diagrams of the two controllers,respectively. In this paper, the RSC controller is responsiblefor regulating the electric torque, Te, and stator reactive power,Qs. Moreover, the GSC is responsible for controlling the DC-link voltage, VDC , and the IG terminal voltage, Vs.
The SSR damping is achieved using an additional SSRdamping controller (SSRDC) on either the GSC or RSC,operating on a single input control signal (ICS) as illustratedin Figures 4 and 5. The SSRDC block is represented in Fig. 6,which is based on proportional gain KSSR and washout filter.The value of the KSSR for each ICS is obtained using root-locus method such that 6% damping ratio is obtained for theSSR mode. The 6% damping ratio is chosen arbitrarily, butthe procedure can be used for any desired value of dampingratio. Moreover, a washout filter, which is a high pass filter,is included in the SSRDC block to eliminate the effect of theSSRDC on the steady-state operating condition. Usually the
Fig. 6. SSR damping controller block diagram.
value of the washout filter time constant Tw is chosen to bebetween 5 to 10 sec. In this paper, Tw = 5 sec. [31].
There are a variety of options for the ICS, as shown inFigures 4 and 5. In this paper, rotor speed ωr, transmissionline real power PL, and voltage across the series compensationVC are examined, and the optimum ICS is identified withthe help of residue-based analysis and root-locus diagrams,as explained in the next section.
V. ICS AND CONVERTER SELECTION FOR SSRDC DESIGN
In this section, using residue-based analysis and root-locusmethod, an optimum input control signal (ICS) to the SSRDCis introduced. The optimum ICS should enable the SSRDC todamp the SSR without decreasing or destabilizing the othersystem modes. The SSRDC can be inserted at different pointsof the RSC and GSC controllers, identified as ARSC-FRSCand AGSC-FGSC in Figures 4 and 5. These insertion points areexamined to find out where the SSRDC could be introduced.
A. Residue-Based Analysis for Identification of Optimum ICS
The state-space model and transfer function of a single-inputsingle-output are defined as [31]:
X = AX +BU (4)
Y = CX (5)
where A, B, and C are the state matrix, the control matrix,the output matrix, respectively.
The transfer function G(s) can be factored as given in Eq.(6).
G(s) = C(SI −A)−1B =Y (s)
U(s)=
n∑i=1
Ris− λi
(6)
where λ1 ... λn are the n eigenvalues and R1 ... Rn are thecorresponding residues.
For a complex eigenvalue λi, the residue Ri is also acomplex number and can be expressed as [31]:
Ri = CΦiΨiB (7)
where Φi and Ψi are right and left eigenvectors, respectively.The residue can be considered as a vector having a certain
direction. If the magnitude of the residue is large enough, thena smaller gain is needed for the feedback control system. Also,the angle of the residue could determine the location of theclosed-loop pole in root-locus diagram.
This is the author's version of an article that has been published in this journal. Changes were made to this version by the publisher prior to publication.The final version of record is available at http://dx.doi.org/10.1109/TSTE.2014.2380782
Copyright (c) 2015 IEEE. Personal use is permitted. For any other purposes, permission must be obtained from the IEEE by emailing [email protected].
IEEE TRANSACTIONS ON SUSTAINABLE ENERGY 5
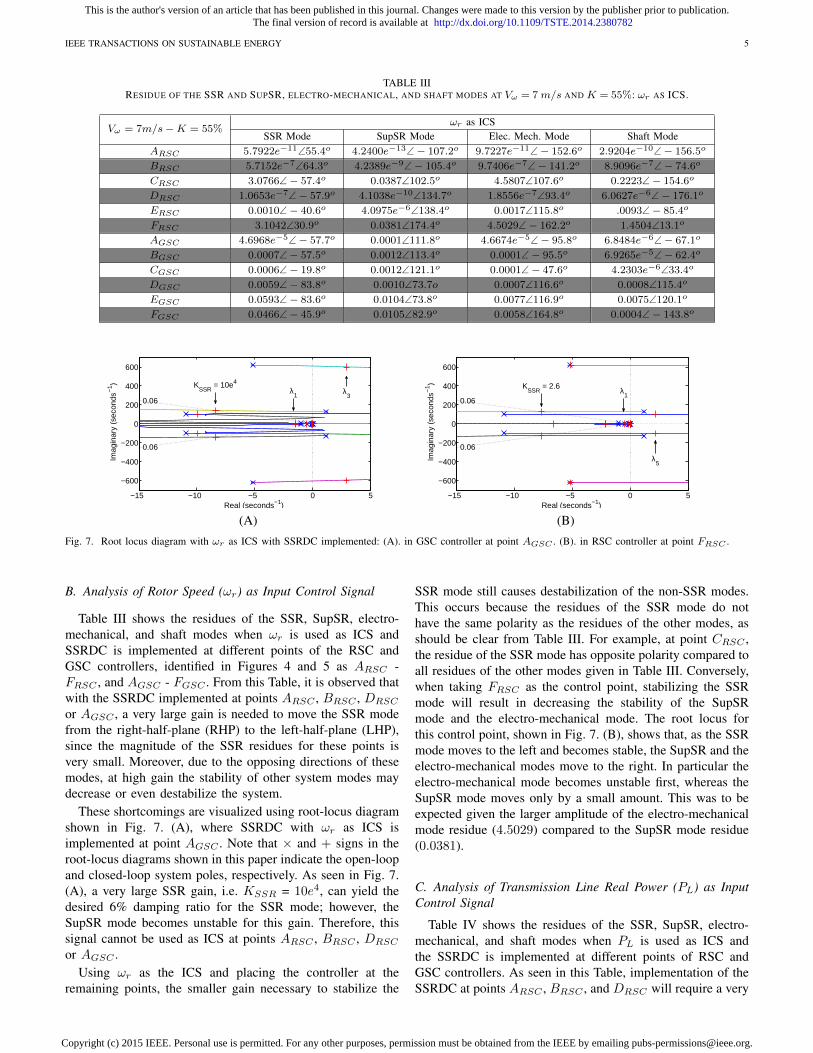
TABLE IIIRESIDUE OF THE SSR AND SUPSR, ELECTRO-MECHANICAL, AND SHAFT MODES AT Vω = 7 m/s AND K = 55%: ωr AS ICS.
Vω = 7m/s−K = 55%ωr as ICS
SSR Mode SupSR Mode Elec. Mech. Mode Shaft ModeARSC 5.7922e−11∠55.4o 4.2400e−13∠− 107.2o 9.7227e−11∠− 152.6o 2.9204e−10∠− 156.5o
BRSC 5.7152e−7∠64.3o 4.2389e−9∠− 105.4o 9.7406e−7∠− 141.2o 8.9096e−7∠− 74.6o
CRSC 3.0766∠− 57.4o 0.0387∠102.5o 4.5807∠107.6o 0.2223∠− 154.6o
DRSC 1.0653e−7∠− 57.9o 4.1038e−10∠134.7o 1.8556e−7∠93.4o 6.0627e−6∠− 176.1o
ERSC 0.0010∠− 40.6o 4.0975e−6∠138.4o 0.0017∠115.8o .0093∠− 85.4o
FRSC 3.1042∠30.9o 0.0381∠174.4o 4.5029∠− 162.2o 1.4504∠13.1o
AGSC 4.6968e−5∠− 57.7o 0.0001∠111.8o 4.6674e−5∠− 95.8o 6.8484e−6∠− 67.1o
BGSC 0.0007∠− 57.5o 0.0012∠113.4o 0.0001∠− 95.5o 6.9265e−5∠− 62.4o
CGSC 0.0006∠− 19.8o 0.0012∠121.1o 0.0001∠− 47.6o 4.2303e−6∠33.4o
DGSC 0.0059∠− 83.8o 0.0010∠73.7o 0.0007∠116.6o 0.0008∠115.4o
EGSC 0.0593∠− 83.6o 0.0104∠73.8o 0.0077∠116.9o 0.0075∠120.1o
FGSC 0.0466∠− 45.9o 0.0105∠82.9o 0.0058∠164.8o 0.0004∠− 143.8o
−15 −10 −5 0 5
−600
−400
−200
0
200
400
600
0.06
0.06
Real (seconds−1)
Imag
inar
y (s
econ
ds−
1 ) KSSR
= 10e4
λ3
λ1
−15 −10 −5 0 5
−600
−400
−200
0
200
400
600
0.06
0.06
Real (seconds−1)
Imag
inar
y (s
econ
ds−
1 ) KSSR
= 2.6
λ5
λ1
(A) (B)
Fig. 7. Root locus diagram with ωr as ICS with SSRDC implemented: (A). in GSC controller at point AGSC . (B). in RSC controller at point FRSC .
B. Analysis of Rotor Speed (ωr) as Input Control Signal
Table III shows the residues of the SSR, SupSR, electro-mechanical, and shaft modes when ωr is used as ICS andSSRDC is implemented at different points of the RSC andGSC controllers, identified in Figures 4 and 5 as ARSC -FRSC , and AGSC - FGSC . From this Table, it is observed thatwith the SSRDC implemented at points ARSC , BRSC , DRSC
or AGSC , a very large gain is needed to move the SSR modefrom the right-half-plane (RHP) to the left-half-plane (LHP),since the magnitude of the SSR residues for these points isvery small. Moreover, due to the opposing directions of thesemodes, at high gain the stability of other system modes maydecrease or even destabilize the system.
These shortcomings are visualized using root-locus diagramshown in Fig. 7. (A), where SSRDC with ωr as ICS isimplemented at point AGSC . Note that × and + signs in theroot-locus diagrams shown in this paper indicate the open-loopand closed-loop system poles, respectively. As seen in Fig. 7.(A), a very large SSR gain, i.e. KSSR = 10e4, can yield thedesired 6% damping ratio for the SSR mode; however, theSupSR mode becomes unstable for this gain. Therefore, thissignal cannot be used as ICS at points ARSC , BRSC , DRSC
or AGSC .Using ωr as the ICS and placing the controller at the
remaining points, the smaller gain necessary to stabilize the
SSR mode still causes destabilization of the non-SSR modes.This occurs because the residues of the SSR mode do nothave the same polarity as the residues of the other modes, asshould be clear from Table III. For example, at point CRSC ,the residue of the SSR mode has opposite polarity compared toall residues of the other modes given in Table III. Conversely,when taking FRSC as the control point, stabilizing the SSRmode will result in decreasing the stability of the SupSRmode and the electro-mechanical mode. The root locus forthis control point, shown in Fig. 7. (B), shows that, as the SSRmode moves to the left and becomes stable, the SupSR and theelectro-mechanical modes move to the right. In particular theelectro-mechanical mode becomes unstable first, whereas theSupSR mode moves only by a small amount. This was to beexpected given the larger amplitude of the electro-mechanicalmode residue (4.5029) compared to the SupSR mode residue(0.0381).
C. Analysis of Transmission Line Real Power (PL) as InputControl Signal
Table IV shows the residues of the SSR, SupSR, electro-mechanical, and shaft modes when PL is used as ICS andthe SSRDC is implemented at different points of RSC andGSC controllers. As seen in this Table, implementation of theSSRDC at points ARSC , BRSC , and DRSC will require a very
This is the author's version of an article that has been published in this journal. Changes were made to this version by the publisher prior to publication.The final version of record is available at http://dx.doi.org/10.1109/TSTE.2014.2380782
Copyright (c) 2015 IEEE. Personal use is permitted. For any other purposes, permission must be obtained from the IEEE by emailing [email protected].
IEEE TRANSACTIONS ON SUSTAINABLE ENERGY 6
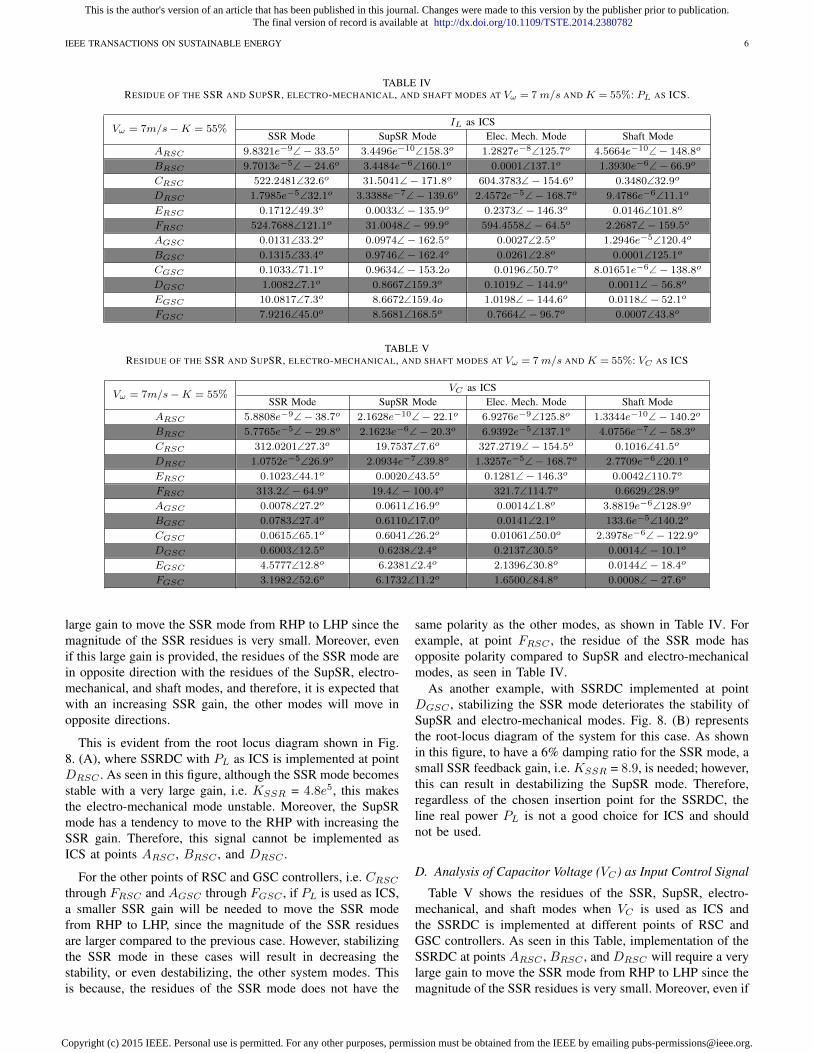
TABLE IVRESIDUE OF THE SSR AND SUPSR, ELECTRO-MECHANICAL, AND SHAFT MODES AT Vω = 7 m/s AND K = 55%: PL AS ICS.
Vω = 7m/s−K = 55%IL as ICS
SSR Mode SupSR Mode Elec. Mech. Mode Shaft ModeARSC 9.8321e−9∠− 33.5o 3.4496e−10∠158.3o 1.2827e−8∠125.7o 4.5664e−10∠− 148.8o
BRSC 9.7013e−5∠− 24.6o 3.4484e−6∠160.1o 0.0001∠137.1o 1.3930e−6∠− 66.9o
CRSC 522.2481∠32.6o 31.5041∠− 171.8o 604.3783∠− 154.6o 0.3480∠32.9o
DRSC 1.7985e−5∠32.1o 3.3388e−7∠− 139.6o 2.4572e−5∠− 168.7o 9.4786e−6∠11.1o
ERSC 0.1712∠49.3o 0.0033∠− 135.9o 0.2373∠− 146.3o 0.0146∠101.8o
FRSC 524.7688∠121.1o 31.0048∠− 99.9o 594.4558∠− 64.5o 2.2687∠− 159.5o
AGSC 0.0131∠33.2o 0.0974∠− 162.5o 0.0027∠2.5o 1.2946e−5∠120.4o
BGSC 0.1315∠33.4o 0.9746∠− 162.4o 0.0261∠2.8o 0.0001∠125.1o
CGSC 0.1033∠71.1o 0.9634∠− 153.2o 0.0196∠50.7o 8.01651e−6∠− 138.8o
DGSC 1.0082∠7.1o 0.8667∠159.3o 0.1019∠− 144.9o 0.0011∠− 56.8o
EGSC 10.0817∠7.3o 8.6672∠159.4o 1.0198∠− 144.6o 0.0118∠− 52.1o
FGSC 7.9216∠45.0o 8.5681∠168.5o 0.7664∠− 96.7o 0.0007∠43.8o
TABLE VRESIDUE OF THE SSR AND SUPSR, ELECTRO-MECHANICAL, AND SHAFT MODES AT Vω = 7 m/s AND K = 55%: VC AS ICS
Vω = 7m/s−K = 55%VC as ICS
SSR Mode SupSR Mode Elec. Mech. Mode Shaft ModeARSC 5.8808e−9∠− 38.7o 2.1628e−10∠− 22.1o 6.9276e−9∠125.8o 1.3344e−10∠− 140.2o
BRSC 5.7765e−5∠− 29.8o 2.1623e−6∠− 20.3o 6.9392e−5∠137.1o 4.0756e−7∠− 58.3o
CRSC 312.0201∠27.3o 19.7537∠7.6o 327.2719∠− 154.5o 0.1016∠41.5o
DRSC 1.0752e−5∠26.9o 2.0934e−7∠39.8o 1.3257e−5∠− 168.7o 2.7709e−6∠20.1o
ERSC 0.1023∠44.1o 0.0020∠43.5o 0.1281∠− 146.3o 0.0042∠110.7o
FRSC 313.2∠− 64.9o 19.4∠− 100.4o 321.7∠114.7o 0.6629∠28.9o
AGSC 0.0078∠27.2o 0.0611∠16.9o 0.0014∠1.8o 3.8819e−6∠128.9o
BGSC 0.0783∠27.4o 0.6110∠17.0o 0.0141∠2.1o 133.6e−5∠140.2o
CGSC 0.0615∠65.1o 0.6041∠26.2o 0.01061∠50.0o 2.3978e−6∠− 122.9o
DGSC 0.6003∠12.5o 0.6238∠2.4o 0.2137∠30.5o 0.0014∠− 10.1o
EGSC 4.5777∠12.8o 6.2381∠2.4o 2.1396∠30.8o 0.0144∠− 18.4o
FGSC 3.1982∠52.6o 6.1732∠11.2o 1.6500∠84.8o 0.0008∠− 27.6o
large gain to move the SSR mode from RHP to LHP since themagnitude of the SSR residues is very small. Moreover, evenif this large gain is provided, the residues of the SSR mode arein opposite direction with the residues of the SupSR, electro-mechanical, and shaft modes, and therefore, it is expected thatwith an increasing SSR gain, the other modes will move inopposite directions.
This is evident from the root locus diagram shown in Fig.8. (A), where SSRDC with PL as ICS is implemented at pointDRSC . As seen in this figure, although the SSR mode becomesstable with a very large gain, i.e. KSSR = 4.8e5, this makesthe electro-mechanical mode unstable. Moreover, the SupSRmode has a tendency to move to the RHP with increasing theSSR gain. Therefore, this signal cannot be implemented asICS at points ARSC , BRSC , and DRSC .
For the other points of RSC and GSC controllers, i.e. CRSCthrough FRSC and AGSC through FGSC , if PL is used as ICS,a smaller SSR gain will be needed to move the SSR modefrom RHP to LHP, since the magnitude of the SSR residuesare larger compared to the previous case. However, stabilizingthe SSR mode in these cases will result in decreasing thestability, or even destabilizing, the other system modes. Thisis because, the residues of the SSR mode does not have the
same polarity as the other modes, as shown in Table IV. Forexample, at point FRSC , the residue of the SSR mode hasopposite polarity compared to SupSR and electro-mechanicalmodes, as seen in Table IV.
As another example, with SSRDC implemented at pointDGSC , stabilizing the SSR mode deteriorates the stability ofSupSR and electro-mechanical modes. Fig. 8. (B) representsthe root-locus diagram of the system for this case. As shownin this figure, to have a 6% damping ratio for the SSR mode, asmall SSR feedback gain, i.e. KSSR = 8.9, is needed; however,this can result in destabilizing the SupSR mode. Therefore,regardless of the chosen insertion point for the SSRDC, theline real power PL is not a good choice for ICS and shouldnot be used.
D. Analysis of Capacitor Voltage (VC) as Input Control Signal
Table V shows the residues of the SSR, SupSR, electro-mechanical, and shaft modes when VC is used as ICS andthe SSRDC is implemented at different points of RSC andGSC controllers. As seen in this Table, implementation of theSSRDC at points ARSC , BRSC , and DRSC will require a verylarge gain to move the SSR mode from RHP to LHP since themagnitude of the SSR residues is very small. Moreover, even if
This is the author's version of an article that has been published in this journal. Changes were made to this version by the publisher prior to publication.The final version of record is available at http://dx.doi.org/10.1109/TSTE.2014.2380782
Copyright (c) 2015 IEEE. Personal use is permitted. For any other purposes, permission must be obtained from the IEEE by emailing [email protected].
IEEE TRANSACTIONS ON SUSTAINABLE ENERGY 7
−15 −10 −5 0 5 10
−600
−400
−200
0
200
400
600
0.06
0.06
Real (seconds−1)
Imag
inar
y (s
econ
ds−
1 )
λ5
λ1
KSSR
= 4.8e5
−20 −15 −10 −5 0 5
−600
−400
−200
0
200
400
600
0.06
0.06
Real (seconds−1)
Imag
inar
y (s
econ
ds−
1 )
λ3λ
1K
SSR = 8.9
(A) (B)
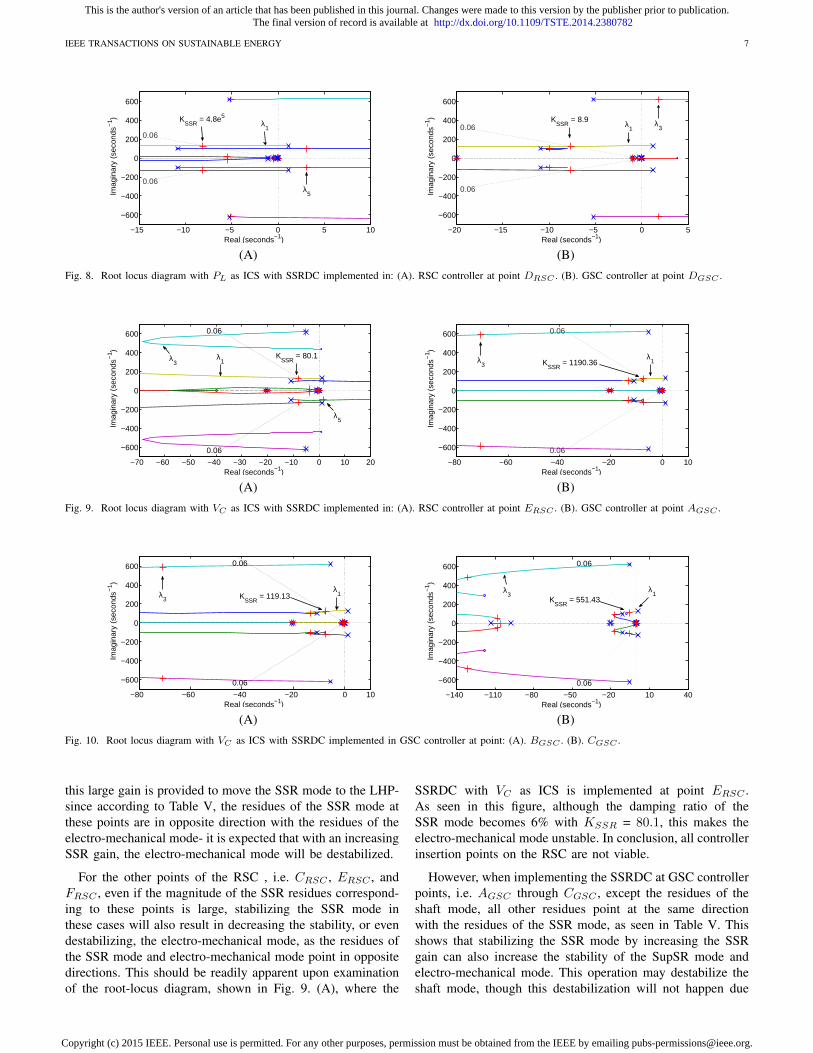
Fig. 8. Root locus diagram with PL as ICS with SSRDC implemented in: (A). RSC controller at point DRSC . (B). GSC controller at point DGSC .
−70 −60 −50 −40 −30 −20 −10 0 10 20
−600
−400
−200
0
200
400
600 0.06
0.06
Real (seconds−1)
Imag
inar
y (s
econ
ds−
1 )
KSSR
= 80.1
λ5
λ3
λ1
−80 −60 −40 −20 0 10
−600
−400
−200
0
200
400
600 0.06
0.06
Real (seconds−1)
Imag
inar
y (s
econ
ds−
1 )
λ3 K
SSR = 1190.36
λ1
(A) (B)
Fig. 9. Root locus diagram with VC as ICS with SSRDC implemented in: (A). RSC controller at point ERSC . (B). GSC controller at point AGSC .
−80 −60 −40 −20 0 10
−600
−400
−200
0
200
400
600 0.06
0.06
Real (seconds−1)
Imag
inar
y (s
econ
ds−
1 )
λ3 K
SSR = 119.13
λ1
−140 −110 −80 −50 −20 10 40
−600
−400
−200
0
200
400
600 0.06
0.06
Real (seconds−1)
Imag
inar
y (s
econ
ds−
1 )
λ3
KSSR
= 551.43λ
1
(A) (B)
Fig. 10. Root locus diagram with VC as ICS with SSRDC implemented in GSC controller at point: (A). BGSC . (B). CGSC .
this large gain is provided to move the SSR mode to the LHP-since according to Table V, the residues of the SSR mode atthese points are in opposite direction with the residues of theelectro-mechanical mode- it is expected that with an increasingSSR gain, the electro-mechanical mode will be destabilized.
For the other points of the RSC , i.e. CRSC , ERSC , andFRSC , even if the magnitude of the SSR residues correspond-ing to these points is large, stabilizing the SSR mode inthese cases will also result in decreasing the stability, or evendestabilizing, the electro-mechanical mode, as the residues ofthe SSR mode and electro-mechanical mode point in oppositedirections. This should be readily apparent upon examinationof the root-locus diagram, shown in Fig. 9. (A), where the
SSRDC with VC as ICS is implemented at point ERSC .As seen in this figure, although the damping ratio of theSSR mode becomes 6% with KSSR = 80.1, this makes theelectro-mechanical mode unstable. In conclusion, all controllerinsertion points on the RSC are not viable.
However, when implementing the SSRDC at GSC controllerpoints, i.e. AGSC through CGSC , except the residues of theshaft mode, all other residues point at the same directionwith the residues of the SSR mode, as seen in Table V. Thisshows that stabilizing the SSR mode by increasing the SSRgain can also increase the stability of the SupSR mode andelectro-mechanical mode. This operation may destabilize theshaft mode, though this destabilization will not happen due
This is the author's version of an article that has been published in this journal. Changes were made to this version by the publisher prior to publication.The final version of record is available at http://dx.doi.org/10.1109/TSTE.2014.2380782
Copyright (c) 2015 IEEE. Personal use is permitted. For any other purposes, permission must be obtained from the IEEE by emailing [email protected].
IEEE TRANSACTIONS ON SUSTAINABLE ENERGY 8
−15 −10 −5 0 5
−600
−400
−200
0
200
400
600
0.06
0.06
Real (seconds−1)
Imag
inar
y (s
econ
ds−
1 ) λ3 λ
1K
SSR = 12.43
−15 −10 −5 0 5
−600
−400
−200
0
200
400
600
0.06
0.06
Real (seconds−1)
Imag
inar
y (s
econ
ds−
1 ) KSSR
= 1.24λ
1λ
3
(A) (B)
Fig. 11. Root locus diagram with VC as ICS with SSRDC implemented in GSC controller at point: (A). DGSC . (B). EGSC .
−20 −15 −10 −5 0 5
−600
−400
−200
0
200
400
600
0.06
0.06
Real (seconds−1)
Imag
inar
y (s
econ
ds−
1 ) λ3 K
SSR = 2.14 λ
1
Fig. 12. Root locus diagram with VC as ICS with SSRDC implemented inGSC controller at point FGSC .
to the much smaller magnitude of the residues of this mode.Fig. 9. (B) and Fig. 10. (A) and (B) confirm this prediction;stabilizing the SSR mode by increasing the SSR gain has alsoincreased the stability of the SupSR and electro-mechanicalmodes. Moreover, no unstable shaft mode was observed byincreasing the SSR gain.
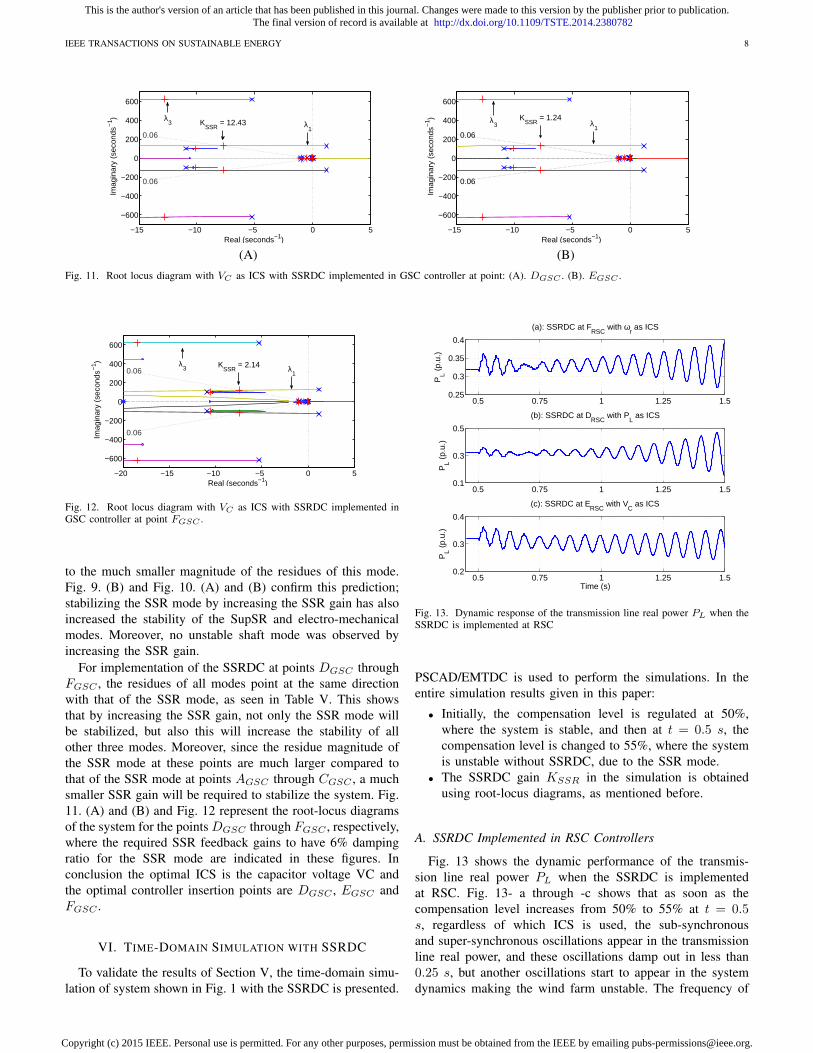
For implementation of the SSRDC at points DGSC throughFGSC , the residues of all modes point at the same directionwith that of the SSR mode, as seen in Table V. This showsthat by increasing the SSR gain, not only the SSR mode willbe stabilized, but also this will increase the stability of allother three modes. Moreover, since the residue magnitude ofthe SSR mode at these points are much larger compared tothat of the SSR mode at points AGSC through CGSC , a muchsmaller SSR gain will be required to stabilize the system. Fig.11. (A) and (B) and Fig. 12 represent the root-locus diagramsof the system for the points DGSC through FGSC , respectively,where the required SSR feedback gains to have 6% dampingratio for the SSR mode are indicated in these figures. Inconclusion the optimal ICS is the capacitor voltage VC andthe optimal controller insertion points are DGSC , EGSC andFGSC .
VI. TIME-DOMAIN SIMULATION WITH SSRDC
To validate the results of Section V, the time-domain simu-lation of system shown in Fig. 1 with the SSRDC is presented.
0.5 0.75 1 1.25 1.50.25
0.3
0.35
0.4
PL (
p.u.
)
(a): SSRDC at FRSC
with ωr as ICS
0.5 0.75 1 1.25 1.50.1
0.3
0.5
PL (
p.u.
)
(b): SSRDC at DRSC
with PL as ICS
0.5 0.75 1 1.25 1.50.2
0.3
0.4
PL (
p.u.
)
(c): SSRDC at ERSC
with VC
as ICS
Time (s)
Fig. 13. Dynamic response of the transmission line real power PL when theSSRDC is implemented at RSC
PSCAD/EMTDC is used to perform the simulations. In theentire simulation results given in this paper:
• Initially, the compensation level is regulated at 50%,where the system is stable, and then at t = 0.5 s, thecompensation level is changed to 55%, where the systemis unstable without SSRDC, due to the SSR mode.
• The SSRDC gain KSSR in the simulation is obtainedusing root-locus diagrams, as mentioned before.
A. SSRDC Implemented in RSC Controllers
Fig. 13 shows the dynamic performance of the transmis-sion line real power PL when the SSRDC is implementedat RSC. Fig. 13- a through -c shows that as soon as thecompensation level increases from 50% to 55% at t = 0.5s, regardless of which ICS is used, the sub-synchronousand super-synchronous oscillations appear in the transmissionline real power, and these oscillations damp out in less than0.25 s, but another oscillations start to appear in the systemdynamics making the wind farm unstable. The frequency of
This is the author's version of an article that has been published in this journal. Changes were made to this version by the publisher prior to publication.The final version of record is available at http://dx.doi.org/10.1109/TSTE.2014.2380782
Copyright (c) 2015 IEEE. Personal use is permitted. For any other purposes, permission must be obtained from the IEEE by emailing [email protected].
IEEE TRANSACTIONS ON SUSTAINABLE ENERGY 9
0.5 0.6 0.7 0.8 0.9 10.3
0.32
0.34
0.36P
L (p.
u.)
(a) SSRDC at AGSC
with ωr as ICS
0.5 0.6 0.7 0.8 0.9 10.3
0.32
0.34
0.36
PL (
p.u.
)
(b): SSRDC at DGSC
with PL as ICS
0.5 0.6 0.7 0.8 0.9 10.3
0.32
0.34
0.36
PL (
p.u.
)
(c): SSRDC at DGSC
with VC
as ICS
Time (s)
Fig. 14. Dynamic response of the transmission line real power PL when theSSRDC is implemented at GSC
0.5 10 20 30 401160
1180
1200
1220
VD
C (
V)
(a)
AGSC
BGSC
CGSC
0.5 0.75 1 1.25 1.51160
1180
1200
1220
VD
C(V
)
(b)
Time (s)
AGSC
BGSC
CGSC
Fig. 15. Dynamic response of the DC link voltage when SSRDC isimplemented at: (A). AGSC , BGSC , and CGSC . (a). Simulation time fromt = 0.5 s to t = 40 s. (b). Simulation time from t = 0.45 s to t = 1.5 s.
these oscillations are in range of electro-mechanical mode(λ5,6).
Indeed, the reason for the instability of the wind farm inthis case is not the SSR mode, but it is the unstable electro-mechanical mode. This was expected from root-locus diagramsshown in Fig. 7. (B), Fig. 8. (A), and Fig. 9. (A). Theseroot-locus figures clearly show that increasing the SSR gain,to make the SSR mode stable, causes the electro-mechanicalmode to go unstable. Therefore, in spite of what kind of ICS isused, the SSRDC cannot be implemented at RSC controllers.
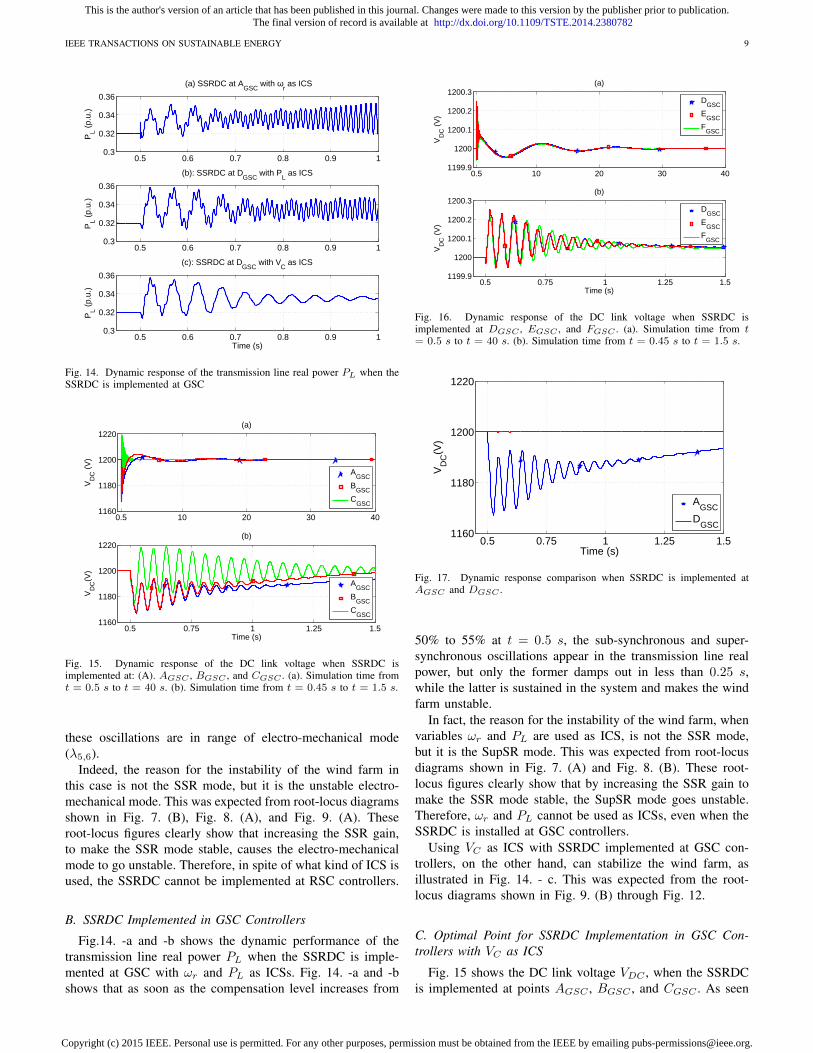
B. SSRDC Implemented in GSC Controllers
Fig.14. -a and -b shows the dynamic performance of thetransmission line real power PL when the SSRDC is imple-mented at GSC with ωr and PL as ICSs. Fig. 14. -a and -bshows that as soon as the compensation level increases from
0.5 10 20 30 401199.9
1200
1200.1
1200.2
1200.3
VD
C (
V)
(a)
DGSC
EGSC
FGSC
0.5 0.75 1 1.25 1.51199.9
1200
1200.1
1200.2
1200.3
VD
C (
V)
(b)
Time (s)
DGSC
EGSC
FGSC
Fig. 16. Dynamic response of the DC link voltage when SSRDC isimplemented at DGSC , EGSC , and FGSC . (a). Simulation time from t= 0.5 s to t = 40 s. (b). Simulation time from t = 0.45 s to t = 1.5 s.
0.5 0.75 1 1.25 1.51160
1180
1200
1220
VD
C(V
)
Time (s)
AGSC
DGSC
Fig. 17. Dynamic response comparison when SSRDC is implemented atAGSC and DGSC .
50% to 55% at t = 0.5 s, the sub-synchronous and super-synchronous oscillations appear in the transmission line realpower, but only the former damps out in less than 0.25 s,while the latter is sustained in the system and makes the windfarm unstable.
In fact, the reason for the instability of the wind farm, whenvariables ωr and PL are used as ICS, is not the SSR mode,but it is the SupSR mode. This was expected from root-locusdiagrams shown in Fig. 7. (A) and Fig. 8. (B). These root-locus figures clearly show that by increasing the SSR gain tomake the SSR mode stable, the SupSR mode goes unstable.Therefore, ωr and PL cannot be used as ICSs, even when theSSRDC is installed at GSC controllers.
Using VC as ICS with SSRDC implemented at GSC con-trollers, on the other hand, can stabilize the wind farm, asillustrated in Fig. 14. - c. This was expected from the root-locus diagrams shown in Fig. 9. (B) through Fig. 12.
C. Optimal Point for SSRDC Implementation in GSC Con-trollers with VC as ICS
Fig. 15 shows the DC link voltage VDC , when the SSRDCis implemented at points AGSC , BGSC , and CGSC . As seen
This is the author's version of an article that has been published in this journal. Changes were made to this version by the publisher prior to publication.The final version of record is available at http://dx.doi.org/10.1109/TSTE.2014.2380782
Copyright (c) 2015 IEEE. Personal use is permitted. For any other purposes, permission must be obtained from the IEEE by emailing [email protected].
IEEE TRANSACTIONS ON SUSTAINABLE ENERGY 10
Fig. 18. Derivation of voltage across the series capacitor using qd-axis line currents (Method A).
Fig. 19. Derivation of voltage across the series capacitor using instantaneous line current (Method B).
in this figure, the SSRDC has successfully damped the SSRmode, and has made the wind farm stable, as expected fromroot-locus diagrams given in Fig. 9. (B) and Fig. 10. (A) and(B). Fig. 15 shows that implementing the SSRDC at pointsAGSC and BGSC gives superior performance compared toimplementing the SSRDC at CGSC in terms of settling time.
Moreover, Fig. 16 represents the DC link voltage VDC ,when the SSRDC is implemented at points DGSC , EGSC ,and FGSC in GSC controllers. As seen in this figure, asexpected from root-locus diagrams shown in Fig. 11. (A) and(B) and Fig. 12, the SSRDC has successfully attenuated theSSR mode and achieved wind farms stability. Fig. 16 showsthat implementing the SSRDC at points DGSC and EGSCbrings slightly better performance compared to implementingthe SSRDC at points FGSC in terms of settling time. Thisshows that the SSRDC can interchangeably be implementedat points DGSC , EGSC , and FGSC .
Furthermore, Fig. 17 compares the DC link with the SSRDCimplemented at point AGSC and DGSC . This figure shows thatimplementation of the SSRDC at point DGSC causes muchless overshoot and settling time in DC link voltage comparedto when the SSRDC is implemented at point AGSC . Thisshows that implementation of the SSRDC at DGSC , EGSC ,and FGSC is a better option compared to AGSC , BGSC , andCGSC .
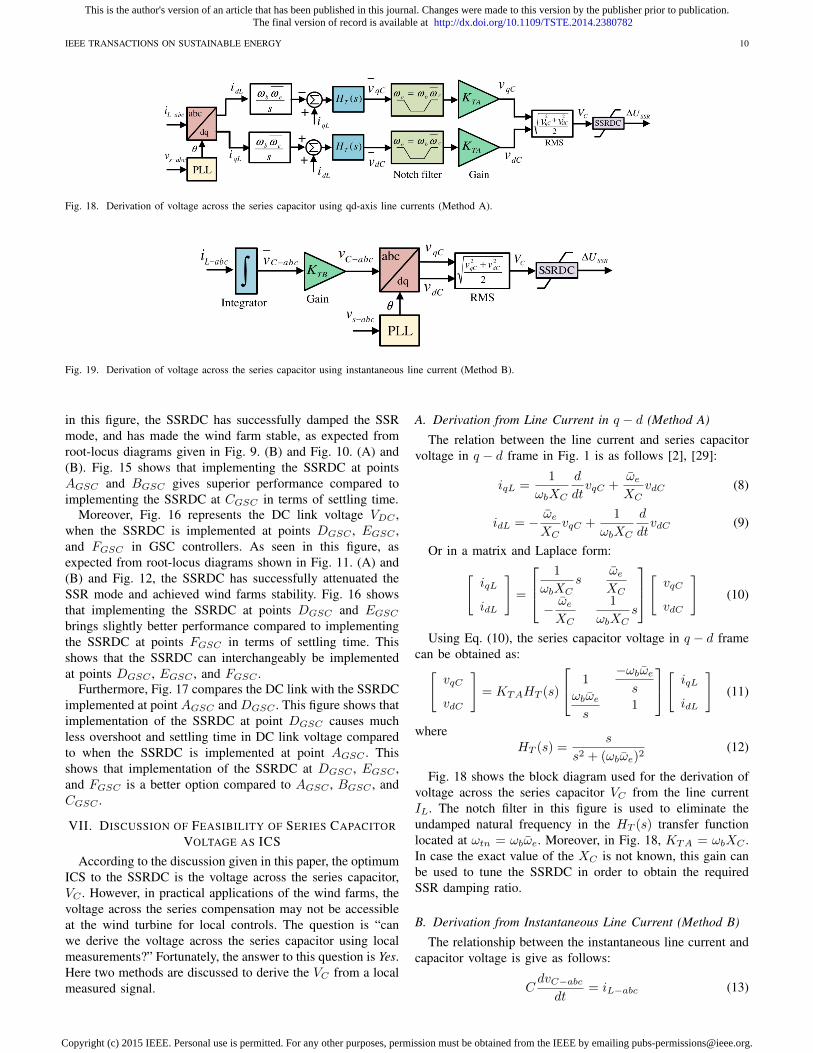
VII. DISCUSSION OF FEASIBILITY OF SERIES CAPACITORVOLTAGE AS ICS
According to the discussion given in this paper, the optimumICS to the SSRDC is the voltage across the series capacitor,VC . However, in practical applications of the wind farms, thevoltage across the series compensation may not be accessibleat the wind turbine for local controls. The question is “canwe derive the voltage across the series capacitor using localmeasurements?” Fortunately, the answer to this question is Yes.Here two methods are discussed to derive the VC from a localmeasured signal.
A. Derivation from Line Current in q − d (Method A)
The relation between the line current and series capacitorvoltage in q − d frame in Fig. 1 is as follows [2], [29]:
iqL =1
ωbXC
d
dtvqC +
ωeXC
vdC (8)
idL = − ωeXC
vqC +1
ωbXC
d
dtvdC (9)
Or in a matrix and Laplace form:[iqL
idL
]=
1
ωbXCs
ωeXC
− ωeXC
1
ωbXCs
[vqC
vdC
](10)
Using Eq. (10), the series capacitor voltage in q − d framecan be obtained as:[
vqC
vdC
]= KTAHT (s)
1−ωbωes
ωbωes
1
[iqL
idL
](11)
whereHT (s) =
s
s2 + (ωbωe)2(12)
Fig. 18 shows the block diagram used for the derivation ofvoltage across the series capacitor VC from the line currentIL. The notch filter in this figure is used to eliminate theundamped natural frequency in the HT (s) transfer functionlocated at ωtn = ωbωe. Moreover, in Fig. 18, KTA = ωbXC .In case the exact value of the XC is not known, this gain canbe used to tune the SSRDC in order to obtain the requiredSSR damping ratio.
B. Derivation from Instantaneous Line Current (Method B)
The relationship between the instantaneous line current andcapacitor voltage is give as follows:
CdvC−abc
dt= iL−abc (13)
This is the author's version of an article that has been published in this journal. Changes were made to this version by the publisher prior to publication.The final version of record is available at http://dx.doi.org/10.1109/TSTE.2014.2380782
Copyright (c) 2015 IEEE. Personal use is permitted. For any other purposes, permission must be obtained from the IEEE by emailing [email protected].
IEEE TRANSACTIONS ON SUSTAINABLE ENERGY 11
0.5 0.75 1 1.25 1.50.3
0.32
0.34
0.36P
L (p.
u.)
Time (s)
Direct measurementMethod AMethod B
Fig. 20. Transmission line real power PL obtained with: direct measurementof VC , method A, and method B.
Eq. (13) shows that the capacitor voltage can be estimatedthrough the local current. Fig. 19 shows the block diagramused to estimate the voltage across the capacitor. The value of
KTB in Fig. 19 is equal to1
C. Even in case the exact value
of the series capacitor is not known, the SSRDC can be tunedusing KT to obtain the required SSR damping ratio.
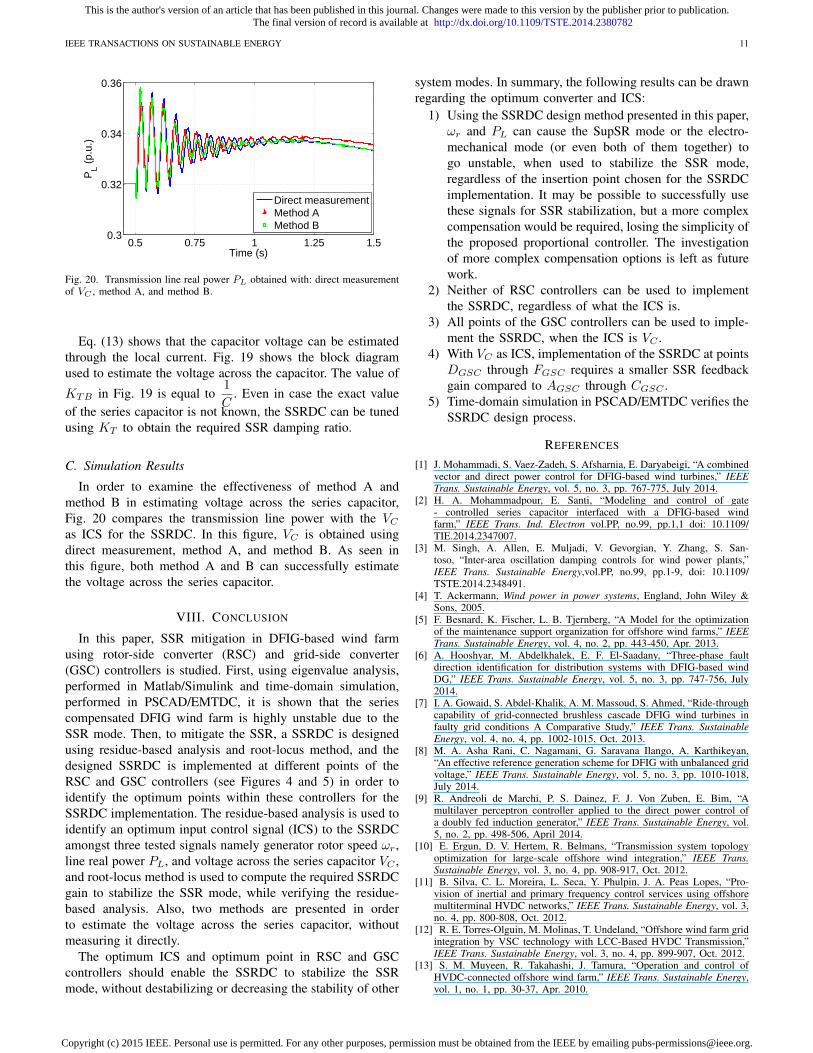
C. Simulation Results
In order to examine the effectiveness of method A andmethod B in estimating voltage across the series capacitor,Fig. 20 compares the transmission line power with the VCas ICS for the SSRDC. In this figure, VC is obtained usingdirect measurement, method A, and method B. As seen inthis figure, both method A and B can successfully estimatethe voltage across the series capacitor.
VIII. CONCLUSION
In this paper, SSR mitigation in DFIG-based wind farmusing rotor-side converter (RSC) and grid-side converter(GSC) controllers is studied. First, using eigenvalue analysis,performed in Matlab/Simulink and time-domain simulation,performed in PSCAD/EMTDC, it is shown that the seriescompensated DFIG wind farm is highly unstable due to theSSR mode. Then, to mitigate the SSR, a SSRDC is designedusing residue-based analysis and root-locus method, and thedesigned SSRDC is implemented at different points of theRSC and GSC controllers (see Figures 4 and 5) in order toidentify the optimum points within these controllers for theSSRDC implementation. The residue-based analysis is used toidentify an optimum input control signal (ICS) to the SSRDCamongst three tested signals namely generator rotor speed ωr,line real power PL, and voltage across the series capacitor VC ,and root-locus method is used to compute the required SSRDCgain to stabilize the SSR mode, while verifying the residue-based analysis. Also, two methods are presented in orderto estimate the voltage across the series capacitor, withoutmeasuring it directly.
The optimum ICS and optimum point in RSC and GSCcontrollers should enable the SSRDC to stabilize the SSRmode, without destabilizing or decreasing the stability of other
system modes. In summary, the following results can be drawnregarding the optimum converter and ICS:
1) Using the SSRDC design method presented in this paper,ωr and PL can cause the SupSR mode or the electro-mechanical mode (or even both of them together) togo unstable, when used to stabilize the SSR mode,regardless of the insertion point chosen for the SSRDCimplementation. It may be possible to successfully usethese signals for SSR stabilization, but a more complexcompensation would be required, losing the simplicity ofthe proposed proportional controller. The investigationof more complex compensation options is left as futurework.
2) Neither of RSC controllers can be used to implementthe SSRDC, regardless of what the ICS is.
3) All points of the GSC controllers can be used to imple-ment the SSRDC, when the ICS is VC .
4) With VC as ICS, implementation of the SSRDC at pointsDGSC through FGSC requires a smaller SSR feedbackgain compared to AGSC through CGSC .
5) Time-domain simulation in PSCAD/EMTDC verifies theSSRDC design process.
REFERENCES
[1] J. Mohammadi, S. Vaez-Zadeh, S. Afsharnia, E. Daryabeigi, “A combinedvector and direct power control for DFIG-based wind turbines,” IEEETrans. Sustainable Energy, vol. 5, no. 3, pp. 767-775, July 2014.
[2] H. A. Mohammadpour, E. Santi, “Modeling and control of gate- controlled series capacitor interfaced with a DFIG-based windfarm,” IEEE Trans. Ind. Electron vol.PP, no.99, pp.1,1 doi: 10.1109/TIE.2014.2347007.
[3] M. Singh, A. Allen, E. Muljadi, V. Gevorgian, Y. Zhang, S. San-toso, “Inter-area oscillation damping controls for wind power plants,”IEEE Trans. Sustainable Energy,vol.PP, no.99, pp.1-9, doi: 10.1109/TSTE.2014.2348491.
[4] T. Ackermann, Wind power in power systems, England, John Wiley &Sons, 2005.
[5] F. Besnard, K. Fischer, L. B. Tjernberg, “A Model for the optimizationof the maintenance support organization for offshore wind farms,” IEEETrans. Sustainable Energy, vol. 4, no. 2, pp. 443-450, Apr. 2013.
[6] A. Hooshyar, M. Abdelkhalek, E. F. El-Saadany, “Three-phase faultdirection identification for distribution systems with DFIG-based windDG,” IEEE Trans. Sustainable Energy, vol. 5, no. 3, pp. 747-756, July2014.
[7] I. A. Gowaid, S. Abdel-Khalik, A. M. Massoud, S. Ahmed, “Ride-throughcapability of grid-connected brushless cascade DFIG wind turbines infaulty grid conditions A Comparative Study,” IEEE Trans. SustainableEnergy, vol. 4, no. 4, pp. 1002-1015, Oct. 2013.
[8] M. A. Asha Rani, C. Nagamani, G. Saravana Ilango, A. Karthikeyan,“An effective reference generation scheme for DFIG with unbalanced gridvoltage,” IEEE Trans. Sustainable Energy, vol. 5, no. 3, pp. 1010-1018,July 2014.
[9] R. Andreoli de Marchi, P. S. Dainez, F. J. Von Zuben, E. Bim, “Amultilayer perceptron controller applied to the direct power control ofa doubly fed induction generator,” IEEE Trans. Sustainable Energy, vol.5, no. 2, pp. 498-506, April 2014.
[10] E. Ergun, D. V. Hertem, R. Belmans, “Transmission system topologyoptimization for large-scale offshore wind integration,” IEEE Trans.Sustainable Energy, vol. 3, no. 4, pp. 908-917, Oct. 2012.
[11] B. Silva, C. L. Moreira, L. Seca, Y. Phulpin, J. A. Peas Lopes, “Pro-vision of inertial and primary frequency control services using offshoremultiterminal HVDC networks,” IEEE Trans. Sustainable Energy, vol. 3,no. 4, pp. 800-808, Oct. 2012.
[12] R. E. Torres-Olguin, M. Molinas, T. Undeland, “Offshore wind farm gridintegration by VSC technology with LCC-Based HVDC Transmission,”IEEE Trans. Sustainable Energy, vol. 3, no. 4, pp. 899-907, Oct. 2012.
[13] S. M. Muyeen, R. Takahashi, J. Tamura, “Operation and control ofHVDC-connected offshore wind farm,” IEEE Trans. Sustainable Energy,vol. 1, no. 1, pp. 30-37, Apr. 2010.
This is the author's version of an article that has been published in this journal. Changes were made to this version by the publisher prior to publication.The final version of record is available at http://dx.doi.org/10.1109/TSTE.2014.2380782
Copyright (c) 2015 IEEE. Personal use is permitted. For any other purposes, permission must be obtained from the IEEE by emailing [email protected].
IEEE TRANSACTIONS ON SUSTAINABLE ENERGY 12
[14] A. Moawwad, M. Shawky El Moursi, W. Xiao, “A novel transient controlstrategy for VSC-HVDC connecting offshore wind power plant,” IEEETrans. Sustainable Energy, vol.5, no.4, pp.1056-1069, Oct. 2014.
[15] M. A. Penalba, O. Gomis-Bellmunt, M. Martins, “Coordinated controlfor an offshore wind power plant to provide fault ride through capability,”IEEE Trans. Sustainable Energy, vol.4, no.4, pp.1253-1261, Oct. 2014.
[16] N.G. Hingorani, L. Gyugi, Understanding FACTS, IEEE Press, April,2000.
[17] A. Moharana, R. K. Varma, R. Seethapathy, “SSR alleviationby STATCOM in induction-generator-based wind farm connectedto series compensated line,” IEEE Trans. Sustainable Energy, doi:10.1109/TSTE.2014.2311072, vol. 5, no. 3, pp. 947-957, July 2014.
[18] H. A. Mohammadpour, S. M. H. Mirhoseini, A. Shoulaie, “Comparativestudy of proportional and TS fuzzy controlled GCSC for SSR mitiga-tion,” IEEE Power Engineering, Energy and Electrical Drives, 2009.POWERENG ’09. International Conference on, pp.564-569, 18-20 March2009.
[19] H. A. Mohammadpour, M. R. Pahlavani, A. Shoulaie, “On control ofgate controlled series capacitor for SSR and power oscillation damping,”IEEE Compatibility and Power Electronics, 2009. CPE ’09., pp.196 -203, 20-22 May 2009.
[20] M. Pahlavani, H. A. Mohammadpour, “Damping of sub-synchronousresonance and low-frequency power oscillation in a series-compensatedtransmission line using gate-controlled series capacitor,” Electric PowerSystems Research, vol. 81, Issue 2, pp. 308-317, February 2011.
[21] K. R. Padiar, Analysis of sub-synchronous resonance in power systems,Kluwer Academic Publishers (KAP), Boston, 1999.
[22] IEEE SSR Task Force, “First benchmark model for computer simulationof subsynchronous resonance,” IEEE Trans. Power App. Syst., vol. PAS-96, pp. 1562-1572, Sep./Oct. 1997.
[23] H. A. Mohammadpour, E. Santi, “Sub-synchronous resonance analysisin DFIG-based wind farms: definitions and problem identification - PartI,” IEEE Energy Conversion Congress and Exposition (ECCE) 2014, pp.812 - 819, September 2014.
[24] H. A. Mohammadpour, E. Santi, “Sub-synchronous resonance analysisin DFIG-based wind farms: mitigation methods - TCSC, GCSC, andDFIG controllers - Part II,” IEEE Energy Conversion Congress andExposition (ECCE) 2014, pp. 1550 - 1557, September 2014.
[25] L. Fan and Z. Miao, “Mitigating SSR using DFIG-based wind genera-tion,” IEEE Trans. Sustainable Energy, vol. 3, no. 3, pp. 349-358, July2012.
[26] C. Zhu, M. Hu, Z. Wu, “Parameters impact on the performance of adouble-fed induction generator-based wind turbine for sub-synchronousresonance control,” IET Renewable Power Generation, vol. 6, no. 2, pp.92-98, March 2012.
[27] Z. Miao, “Impedance-model-based SSR analysis for type 3 wind gen-erator and series-compensated network,” IEEE Transactions on EnergyConversion, vol. 27, no. 4, pp. 984-991, December 2012.
[28] L. Wang, Long-Yi Chen, “Reduction of power fluctuations of a large-scale grid-connected offshore wind farm using a variable frequency
transformer,” IEEE Trans. Sustainable Energy, vol. 2, no. 3, pp. 226-234,July 2011.
[29] H. A. Mohammadpour, Y. J. Shin, E. Santi, “SSR analysis of a DFIG- based wind farm interfaced with a gate-controlled series capacitor,”Applied Power Electronics Conference and Exposition, APEC 2014, pp.3110-3117, March 2014.
[30] H. A. Mohammadpour, A. Ghaderi, E. Santi, “Analysis of sub-synchronous resonance in doubly-fed induction generator-based windfarms interfaced with gate controlled series capacitor,” IET Genera-tion, Transmission & Distribution vol.PP, no.99, pp.1,1 doi: 10.1049/iet-gtd.2013.0643Applied Power Electronics Conference and Exposition, APEC 2014, pp.3110-3117, March 2014.
[31] P. Kundur, Power system stability and control, McGraw-Hill, Inc., NY,1994.
[32] K. Chen, S. Tian, Y. Cheng, L. Bai, “An improved MPPT controllerfor Photovoltaic system under partial shading condition,” IEEE Trans.Sustainable Energy, vol. 5, no. 3, pp. 978-985, July 2014.
Hossein Ali Mohammadpour (S’10) received theB.Sc. and M.Sc. degrees all in electrical engineeringpower systems from the Iran University of Scienceand Technology (IUST), Tehran, Iran, in 2006 and2009, respectively. He also received the Ph.D. degreein electrical engineering - electric power systemsfrom the University of South Carolina, Columbia,SC, USA, in December 2014, where he is currentlya postdoctoral fellow. His primary research interestsinclude power systems stability and control, controlof power electronics systems, renewable energy,
smart grid, FACTS technologies, and electric ship system modeling andanalysis.
Enrico Santi (S 90 M 94 SM 02) received theDr. Ing. degree in electrical engineering from theUniversity of Padua, Italy in 1988 and the M.S.and Ph.D. degree from Caltech in 1989 and 1994,respectively. He worked as a senior design engineerat TESLAco from 1993 to 1998, where he wasresponsible for the development of various switchingpower supplies for commercial applications. Since1998 he has been with the University of SouthCarolina where he is currently an associate professorin the electrical engineering department. He has
published over one hundred papers in power electronics and modeling andsimulation in international journals and conference proceedings and holdstwo patents. His research interests include switched-mode power converters,advanced modeling and simulation of power systems, modeling and simulationof semiconductor power devices, control of power electronics systems.
This is the author's version of an article that has been published in this journal. Changes were made to this version by the publisher prior to publication.The final version of record is available at http://dx.doi.org/10.1109/TSTE.2014.2380782
Copyright (c) 2015 IEEE. Personal use is permitted. For any other purposes, permission must be obtained from the IEEE by emailing [email protected].


![[side] THEORY BASE OF ACCOUNTING](https://static.fdokumen.com/doc/165x107/6316e2fb1e5d335f8d0a2c0c/side-theory-base-of-accounting.jpg)