SRI & Sustainability - Long Finance
58
c58da9b710df662c >> Employed by a non-US affiliate of MLPF&S and is not registered/qualified as a research analyst under the FINRA rules. Refer to "Other Important Disclosures" for information on certain BofA Merrill Lynch entities that take responsibility for this report in particular jurisdictions. BofA Merrill Lynch does and seeks to do business with companies covered in its research reports. As a result, investors should be aware that the firm may have a conflict of interest that could affect the objectivity of this report. Investors should consider this report as only a single factor in making their investment decision. Refer to important disclosures on page 56 to 58. Analyst Certification on Page 55. Link to Definitions on page 55. 11091608 SRI & Sustainability Cracking down on fracking: shale gas & HSE risks Shale gas revolution The past few years have seen a revolution in natural gas supply driven by a boom in the production of unconventional gas resources, such as shale gas. US gas prices have decoupled from oil and have fallen by more than 60% since the peak in 2008. With up to 2,500tcf in recoverable resources, shale gas is expected to account for nearly two-thirds of US gas production by 2035. Globally, recoverable shale gas reserves are equivalent to over 60 years of current annual consumption. But growing HSE concerns over fracking The shale gas boom has largely been premised largely on advances in horizontal drilling and the practice of “fracking”, which involves pumping a mix of water, chemicals and proppants into wells to unlock the gas. Fracking has raised a number of health, safety and environmental (HSE) concerns, with stakeholders pointing to potential risks associated with emotive issues like freshwater use and injected water and wastewater treatment, as well as full life-cycle greenhouse gas emissions. Other potential HSE concerns are biodiversity, clean-up, faults and fissures, and pipelines. Greater scrutiny & regulation lies ahead Companies and investors cannot afford to ignore these “fractivists”, as regulators are following stakeholders in moving towards greater scrutiny of potential HSE risks. Fracking is the subject of moratoriums and bans in a number of US cities and states, as well as in France. It is currently under investigation by the US Environmental Protection Agency (EPA), the Securities and Exchange Commission (SEC), and the European Commission. We expect this to result in much more stringent HSE regulation and disclosure requirements. Cost impact could make or break some shale plays It is too early to estimate the potential cost burden of regulation, but producers can expect additional costs arising from red tape, increased drilling costs, delays in production, greener practices, greater disclosure, and potential litigation and regulatory risks associated with fracking. This could be margin make-or-break for higher-cost shale fields and may result in tightened shale gas supply. Bearish on shale or bullish on shale regulation? Go green Assuming shale gas is hit by stricter regulation, we believe that investors might seek three types of investment exposure: 1) Water and wastewater companies to treat recovered fracking fluid; 2) Oil services companies that are developing green(er) fracking chemicals to reduce water-related risks; and 3) Renewable energy and utility companies on the back of higher gas prices. SRI Equity | Global | SRI 28 September 2011 Sarbjit Nahal >> +44 20 7996 8031 Equity Strategist MLI (UK) [email protected] Matthew Yates >> +44 20 7996 4537 Research Analyst MLI (UK) [email protected] Valery Lucas-Leclin >> +44 20 7996 8058 Equity Strategist MLI (UK) [email protected] Julie Dollé >> +33 1 53655828 Equity Strategist Merrill Lynch (France) [email protected] John King +44 20 7996 9062 Global SRI Sales MLI (UK) [email protected] Click the image above to watch the video. Unauthorized redistribution of this report is prohibited. This report is intended for [email protected].
-
Upload
khangminh22 -
Category
Documents
-
view
1 -
download
0
Transcript of SRI & Sustainability - Long Finance
c58da9b710df662c
>> Employed by a non-US affiliate of MLPF&S and is not registered/qualified as a research analyst under the FINRA rules. Refer to "Other Important Disclosures" for information on certain BofA Merrill Lynch entities that take responsibility for this report in particular jurisdictions. BofA Merrill Lynch does and seeks to do business with companies covered in its research reports. As a result, investors should be aware that the firm may have a conflict of interest that could affect the objectivity of this report. Investors should consider this report as only a single factor in making their investment decision. Refer to important disclosures on page 56 to 58. Analyst Certification on Page 55. Link to Definitions on page 55. 11091608
SRI & Sustainability
Cracking down on fracking: shale gas & HSE risks
Shale gas revolution The past few years have seen a revolution in natural gas supply driven by a boom in the production of unconventional gas resources, such as shale gas. US gas prices have decoupled from oil and have fallen by more than 60% since the peak in 2008. With up to 2,500tcf in recoverable resources, shale gas is expected to account for nearly two-thirds of US gas production by 2035. Globally, recoverable shale gas reserves are equivalent to over 60 years of current annual consumption.
But growing HSE concerns over fracking The shale gas boom has largely been premised largely on advances in horizontal drilling and the practice of “fracking”, which involves pumping a mix of water, chemicals and proppants into wells to unlock the gas. Fracking has raised a number of health, safety and environmental (HSE) concerns, with stakeholders pointing to potential risks associated with emotive issues like freshwater use and injected water and wastewater treatment, as well as full life-cycle greenhouse gas emissions. Other potential HSE concerns are biodiversity, clean-up, faults and fissures, and pipelines.
Greater scrutiny & regulation lies ahead Companies and investors cannot afford to ignore these “fractivists”, as regulators are following stakeholders in moving towards greater scrutiny of potential HSE risks. Fracking is the subject of moratoriums and bans in a number of US cities and states, as well as in France. It is currently under investigation by the US Environmental Protection Agency (EPA), the Securities and Exchange Commission (SEC), and the European Commission. We expect this to result in much more stringent HSE regulation and disclosure requirements.
Cost impact could make or break some shale plays It is too early to estimate the potential cost burden of regulation, but producers can expect additional costs arising from red tape, increased drilling costs, delays in production, greener practices, greater disclosure, and potential litigation and regulatory risks associated with fracking. This could be margin make-or-break for higher-cost shale fields and may result in tightened shale gas supply.
Bearish on shale or bullish on shale regulation? Go green Assuming shale gas is hit by stricter regulation, we believe that investors might seek three types of investment exposure: 1) Water and wastewater companies to treat recovered fracking fluid; 2) Oil services companies that are developing green(er) fracking chemicals to reduce water-related risks; and 3) Renewable energy and utility companies on the back of higher gas prices.
SRI
Equity | Global | SRI 28 September 2011
Sarbjit Nahal >> +44 20 7996 8031 Equity Strategist MLI (UK) [email protected] Matthew Yates >> +44 20 7996 4537 Research Analyst MLI (UK) [email protected] Valery Lucas-Leclin >> +44 20 7996 8058 Equity Strategist MLI (UK) [email protected] Julie Dollé >> +33 1 53655828 Equity Strategist Merrill Lynch (France) [email protected] John King +44 20 7996 9062 Global SRI Sales MLI (UK) [email protected]
Click the image above to watch the video.
Un
auth
ori
zed
red
istr
ibu
tio
n o
f th
is r
epo
rt is
pro
hib
ited
.T
his
rep
ort
is in
ten
ded
fo
r ta
nya
.blo
mfi
eld
@b
aml.c
om
.
2
SRI & Susta inab i l i ty 28 September 2011
Contents Shale gas & HSE risks in brief 3
Shale gas revolution 12
Fracking, HSE risks 26
Greater scrutiny, costlier regulation 35
Appendix 1 – O&G company actions to reduce HSE impacts of fracking 46
Appendix 2: EU member states measures on shale gas 50
Appendix 3: Overview of shale gas HSE incidents 52
SRI & Susta inab i l i ty 28 September 2011
3
Shale gas & HSE risks in brief The past few years have seen a revolution in natural gas supply driven by a boom in the production of shale gas, which could see it account for up to two-thirds of US gas production by 2035 (Source: IEA). This boom has partly been driven by the practice of hydraulic fracturing, or “fracking”, which raises a number of potential HSE concerns including water use, injected water and wastewater treatment, as well as full life-cycle greenhouse gas emissions. These concerns are already on stakeholders’ agendas and are now under investigation by the US EPA and SEC and European Commission, among others.
Greater scrutiny, regulation & costs We believe that the combination of stakeholder and regulatory scrutiny will result in much more stringent HSE regulation and disclosure requirements for the shale gas industry. This will mean additional costs arising from red tape, increased drilling costs, delays in production, greener practices, greater disclosure, and potential litigation and regulatory risks associated with fracking. This could be margin make-or-break for higher-cost shale fields and may result in tightened shale gas supply.
Look for investment opportunities Assuming that shale gas is hit by stricter regulation, we believe that investors might seek three types of investment exposure:
1. Water and wastewater companies to treat recovered fracking fluid;
2. Green(er) fracking chemicals providers to reduce water-related risks; and
3. Renewable energy and utility companies on the back of higher gas prices.
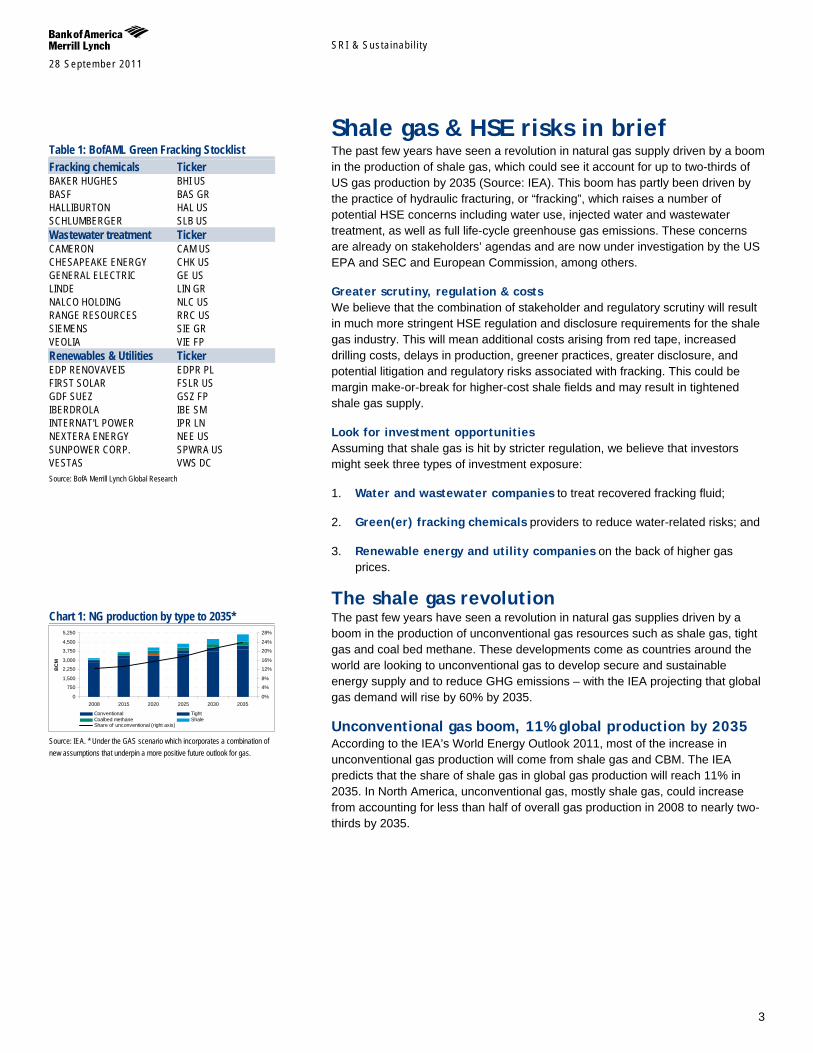
The shale gas revolution The past few years have seen a revolution in natural gas supplies driven by a boom in the production of unconventional gas resources such as shale gas, tight gas and coal bed methane. These developments come as countries around the world are looking to unconventional gas to develop secure and sustainable energy supply and to reduce GHG emissions – with the IEA projecting that global gas demand will rise by 60% by 2035.
Unconventional gas boom, 11% global production by 2035 According to the IEA’s World Energy Outlook 2011, most of the increase in unconventional gas production will come from shale gas and CBM. The IEA predicts that the share of shale gas in global gas production will reach 11% in 2035. In North America, unconventional gas, mostly shale gas, could increase from accounting for less than half of overall gas production in 2008 to nearly two-thirds by 2035.
Table 1: BofAML Green Fracking Stocklist Fracking chemicals Ticker BAKER HUGHES BHI US BASF BAS GR HALLIBURTON HAL US SCHLUMBERGER SLB US Wastewater treatment Ticker CAMERON CAM US CHESAPEAKE ENERGY CHK US GENERAL ELECTRIC GE US LINDE LIN GR NALCO HOLDING NLC US RANGE RESOURCES RRC US SIEMENS SIE GR VEOLIA VIE FP Renewables & Utilities Ticker EDP RENOVAVEIS EDPR PL FIRST SOLAR FSLR US GDF SUEZ GSZ FP IBERDROLA IBE SM INTERNAT'L POWER IPR LN NEXTERA ENERGY NEE US SUNPOWER CORP. SPWRA US VESTAS VWS DC Source: BofA Merrill Lynch Global Research
Chart 1: NG production by type to 2035*
0
750
1,500
2,250
3,000
3,750
4,500
5,250
2008 2015 2020 2025 2030 2035
BC
M
0%
4%
8%
12%
16%
20%
24%
28%
Conventional TightCoalbed methane ShaleShare of unconventional (right axis)
Source: IEA. * Under the GAS scenario which incorporates a combination of new assumptions that underpin a more positive future outlook for gas.
SRI & Susta inab i l i ty 28 September 2011
4
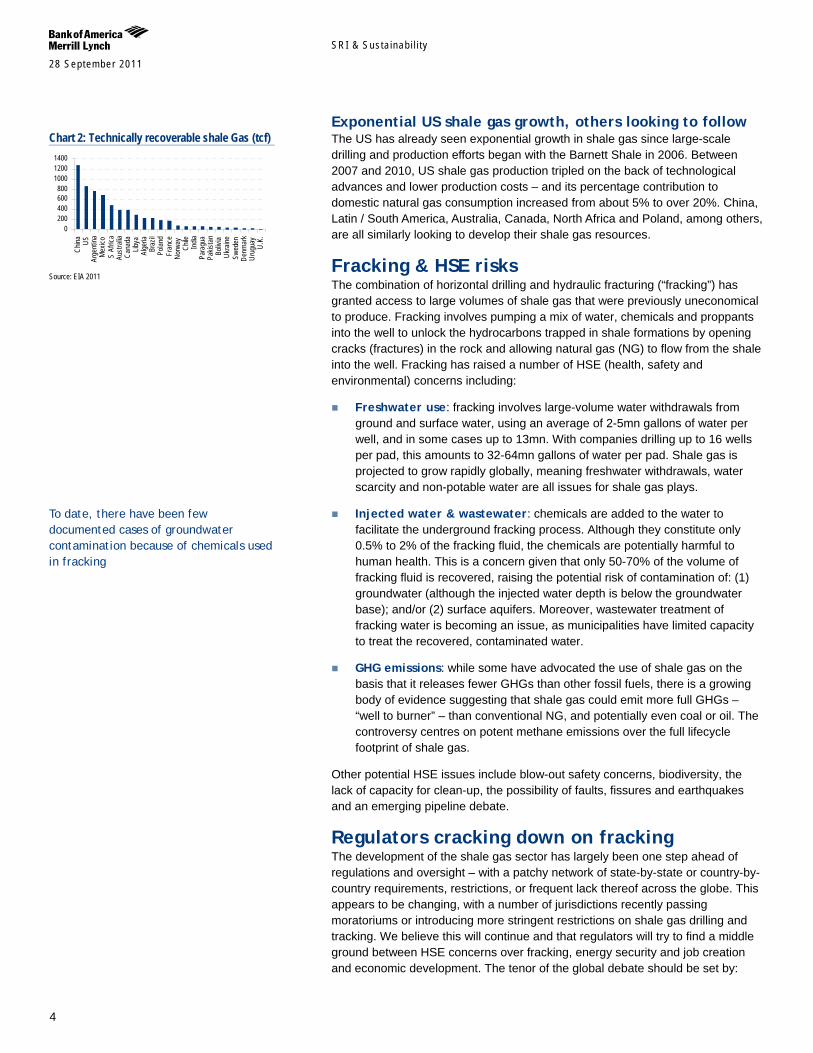
Exponential US shale gas growth, others looking to follow The US has already seen exponential growth in shale gas since large-scale drilling and production efforts began with the Barnett Shale in 2006. Between 2007 and 2010, US shale gas production tripled on the back of technological advances and lower production costs – and its percentage contribution to domestic natural gas consumption increased from about 5% to over 20%. China, Latin / South America, Australia, Canada, North Africa and Poland, among others, are all similarly looking to develop their shale gas resources.
Fracking & HSE risks The combination of horizontal drilling and hydraulic fracturing (“fracking”) has granted access to large volumes of shale gas that were previously uneconomical to produce. Fracking involves pumping a mix of water, chemicals and proppants into the well to unlock the hydrocarbons trapped in shale formations by opening cracks (fractures) in the rock and allowing natural gas (NG) to flow from the shale into the well. Fracking has raised a number of HSE (health, safety and environmental) concerns including:
Freshwater use: fracking involves large-volume water withdrawals from ground and surface water, using an average of 2-5mn gallons of water per well, and in some cases up to 13mn. With companies drilling up to 16 wells per pad, this amounts to 32-64mn gallons of water per pad. Shale gas is projected to grow rapidly globally, meaning freshwater withdrawals, water scarcity and non-potable water are all issues for shale gas plays.
Injected water & wastewater: chemicals are added to the water to facilitate the underground fracking process. Although they constitute only 0.5% to 2% of the fracking fluid, the chemicals are potentially harmful to human health. This is a concern given that only 50-70% of the volume of fracking fluid is recovered, raising the potential risk of contamination of: (1) groundwater (although the injected water depth is below the groundwater base); and/or (2) surface aquifers. Moreover, wastewater treatment of fracking water is becoming an issue, as municipalities have limited capacity to treat the recovered, contaminated water.
GHG emissions: while some have advocated the use of shale gas on the basis that it releases fewer GHGs than other fossil fuels, there is a growing body of evidence suggesting that shale gas could emit more full GHGs – “well to burner” – than conventional NG, and potentially even coal or oil. The controversy centres on potent methane emissions over the full lifecycle footprint of shale gas.
Other potential HSE issues include blow-out safety concerns, biodiversity, the lack of capacity for clean-up, the possibility of faults, fissures and earthquakes and an emerging pipeline debate.
Regulators cracking down on fracking The development of the shale gas sector has largely been one step ahead of regulations and oversight – with a patchy network of state-by-state or country-by-country requirements, restrictions, or frequent lack thereof across the globe. This appears to be changing, with a number of jurisdictions recently passing moratoriums or introducing more stringent restrictions on shale gas drilling and tracking. We believe this will continue and that regulators will try to find a middle ground between HSE concerns over fracking, energy security and job creation and economic development. The tenor of the global debate should be set by:
Chart 2: Technically recoverable shale Gas (tcf)
0200400600800
100012001400
China US
Arge
ntina
Mex
icoS
Afric
aAu
stra
liaCa
nada
Libya
Alge
riaBr
azil
Polan
dFr
ance
Norw
ayCh
ileIn
diaPa
ragu
aPa
kista
nBo
livia
Ukra
ineSw
eden
Denm
ark
Urug
uay
U.K.
Source: EIA 2011
To date, there have been few documented cases of groundwater contamination because of chemicals used in fracking
SRI & Susta inab i l i ty 28 September 2011
5
US EPA investigation: Congress has asked the EPA to study the safety of the hydraulic fracturing technology and the potential dangers to groundwater. Research should be completed by the end of 2012, and the EPA’s Hydraulic Fracturing Report is expected to be completed in 2014 with the findings likely to go some way towards clarifying some of the HSE issues around shale oil for the US market.
US SEC investigation: The SEC has recently stepped into the fray and is both seeking greater disclosure from companies on fracking risks and the chemicals used, and issuing subpoenas, indicating a more formal investigation is under way. While it is still early days, the effects could be significant, especially given that the potential risks associated with fracking impact almost all O&G development companies (with fracking also used for conventional wells).
EC favouring EU-wide rules: Brussels intends to draft EU-wide rules on shale gas reserves, according to the Commission’s Energy Commissioner, who has said that it is seeking environmental protection standards that enable member states to grant licences within a clear framework – which he feels are best achieved by European common standards. He has suggested that the Commission might put the proposals to member states as early as spring 2012. The European parliament is also looking to an Energy Quality Directive that could penalise or even ban shale gas.
Greater scrutiny, regulation & costs The potential HSE risks associated with shale gas are, in our view, likely to lead to much stricter regulation on a 1-3Y time horizon. At the very least, we think that we will see much more in the way of regulation along the lines of recent decisions to require energy companies to disclose chemicals used in the fracking process. We also anticipate regulations covering the treatment of the fluids used to drill a well, tighter restrictions on where companies get water, stricter standards for the casing that lines a well hole and a greater government role in water monitoring.
Cost impact could make or break some shale plays While it is too early to estimate the cost of such regulation, producers can expect additional costs arising from red tape, increased drilling costs, delays in production, greener practices, greater disclosure, and potential litigation and regulatory risks associated with fracking. We are seeing companies take note of this with protection clauses being included in shale gas purchases, allowing the acquiring company to walk away if new laws restrict fracking. Greater regulation could ultimately be margin make-or-break for higher-cost shale fields – and could result in tightened shale gas supply.
Companies need to adopt a prudent approach to shale gas For shale gas to achieve a long-term licence to operate globally, industry must deal with the HSE impacts of E&P, comply with existing regulations, pro-actively anticipate new regulations and ensure stakeholder buy-in. We are seeing growing signs of this realisation, such as through stakeholder-friendly industry partnerships like FracFocus.
Still a long way to go But they still have a long way to go to prove to stakeholders and regulators that they are: safeguarding the quality and quantity of regional surface and groundwater resources through sound wellbore construction practices; sourcing
SEC is looking to ensure investors are told about the potential fracking risks that a company may face
SRI & Susta inab i l i ty 28 September 2011
6
fresh-water alternatives and recycling water for reuse as far as is practicably possible; measuring and disclosing water to reduce the environmental impact; supporting the development of fracturing fluid additives with the least environmental risk; and supporting the disclosure of fracturing fluid additives.
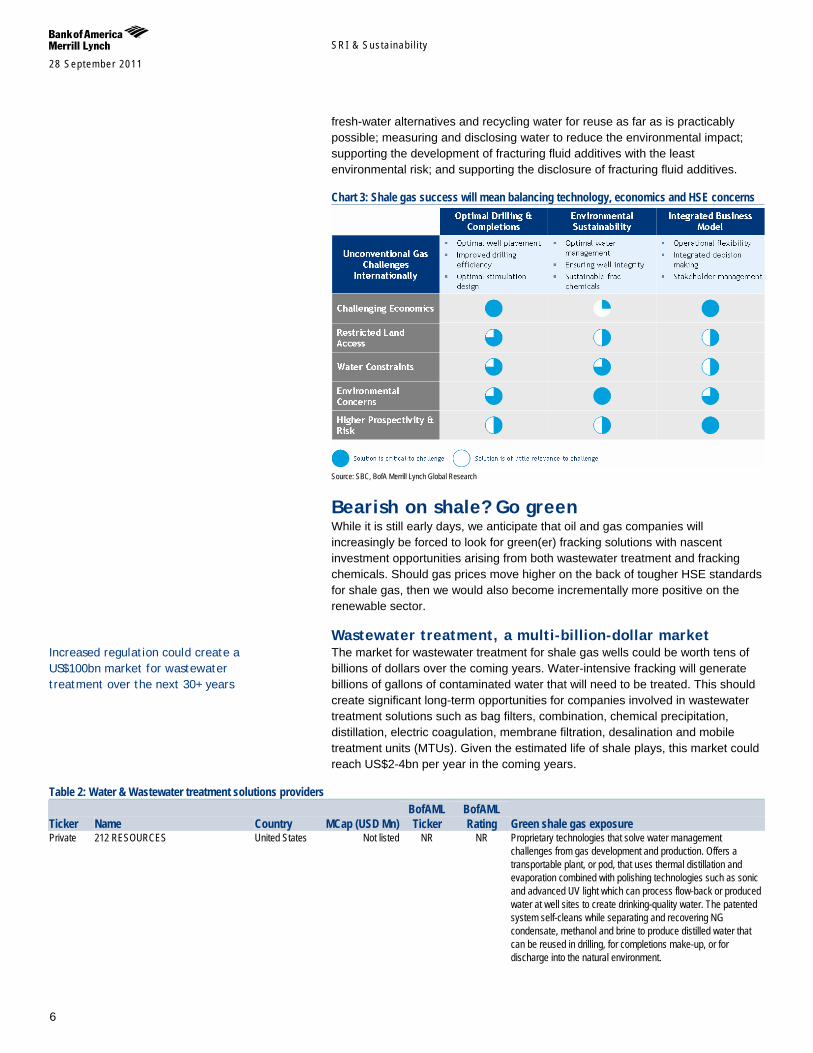
Chart 3: Shale gas success will mean balancing technology, economics and HSE concerns
Source: SBC, BofA Merrill Lynch Global Research
Bearish on shale? Go green While it is still early days, we anticipate that oil and gas companies will increasingly be forced to look for green(er) fracking solutions with nascent investment opportunities arising from both wastewater treatment and fracking chemicals. Should gas prices move higher on the back of tougher HSE standards for shale gas, then we would also become incrementally more positive on the renewable sector.
Wastewater treatment, a multi-billion-dollar market The market for wastewater treatment for shale gas wells could be worth tens of billions of dollars over the coming years. Water-intensive fracking will generate billions of gallons of contaminated water that will need to be treated. This should create significant long-term opportunities for companies involved in wastewater treatment solutions such as bag filters, combination, chemical precipitation, distillation, electric coagulation, membrane filtration, desalination and mobile treatment units (MTUs). Given the estimated life of shale plays, this market could reach US$2-4bn per year in the coming years.
Table 2: Water & Wastewater treatment solutions providers
Ticker Name Country MCap (USD Mn) BofAML Ticker
BofAML Rating Green shale gas exposure
Private 212 RESOURCES United States Not listed NR NR Proprietary technologies that solve water management challenges from gas development and production. Offers a transportable plant, or pod, that uses thermal distillation and evaporation combined with polishing technologies such as sonic and advanced UV light which can process flow-back or produced water at well sites to create drinking-quality water. The patented system self-cleans while separating and recovering NG condensate, methanol and brine to produce distilled water that can be reused in drilling, for completions make-up, or for discharge into the natural environment.
Increased regulation could create a US$100bn market for wastewater treatment over the next 30+ years

SRI & Susta inab i l i ty 28 September 2011
7
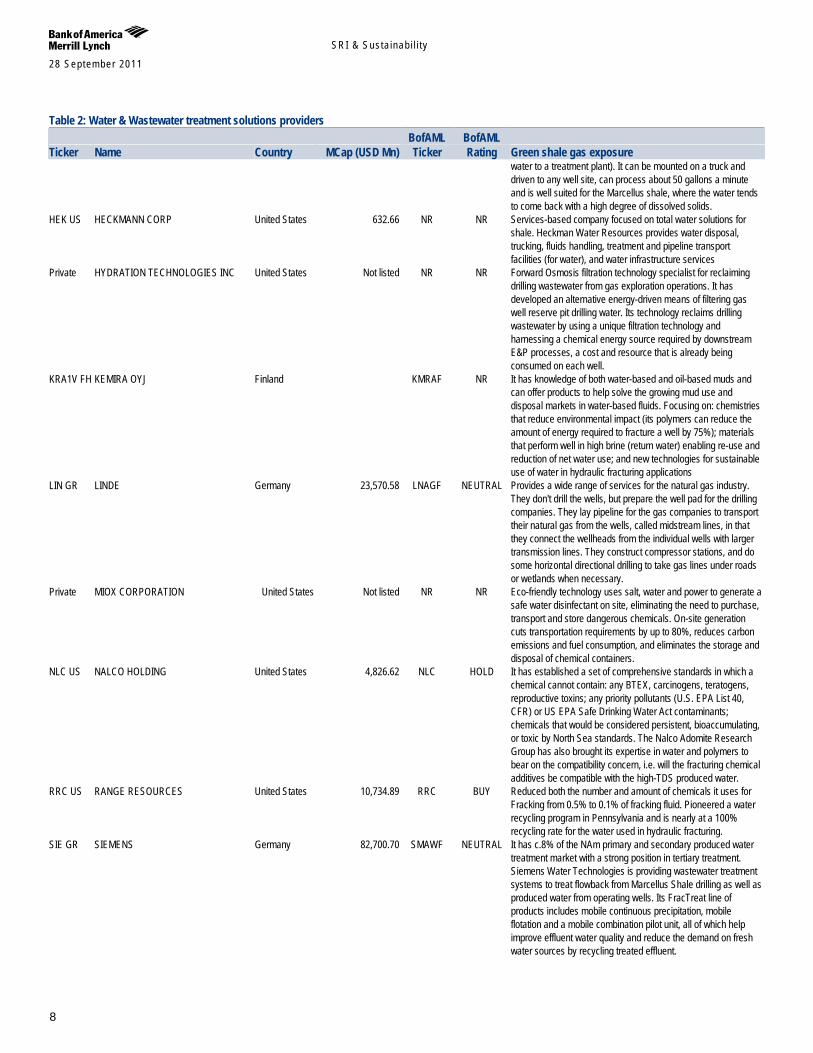
Table 2: Water & Wastewater treatment solutions providers
Ticker Name Country MCap (USD Mn) BofAML Ticker
BofAML Rating Green shale gas exposure
ABHD US ABTECH INDUSTRIES, INC United States 20.80 NR NR Water treatment technologies & systems including EPA-approved storm water antimicrobial and new approach for oil and gas industry. Its products are based on polymer technologies capable of removing hydrocarbons, sediment and other foreign elements from still or flowing water.
AQE CN AQUA-PURE VENTURES INC. Canada 10.55 NR NR Provides integrated solutions for treatment and reuse of flowback and produced water. Developed a patented wastewater distillation process used in wastewater recycling. Clear Solutions system provides evaporation technology that can easily mix with other wastewater-treatment methods. It has cleaned up more than 500mn gallons (1.9 million m3) of water in the Barnett Shale and plans to use this expertise in the Marcellus Shale
Private AquaTech Systems United States Not listed NR NR Treatment offerings for flowback and produced water including the MoVap™, Mobile Evaporator, for onsite treatment at wellhead and Zero Liquid discharge (ZLD) technology for centralised treatment facility. The MoVap™ unit is a solution specifically designed for the growing frac and produced waste water treatment needs
Private ATLETA INC. United States Not listed NR NR AltelaRain® technology desalinates and decontaminates produced water without the energy intensive equipment, high temperatures or pressure of other water desalination technologies. It uses a highly efficient process of thermal distillation, which captures the heat generated by condensation and uses it for evaporation (a la rainwater).
CAM US CAMERON United States 11,584.54 CAM BUY Dominant position in the NAm produced water management market (c.50% market share): strong in oil and water separation, induced gas flotation and nutshell filtration. Their frac trees, frac isolation systems, and well testing and flowback equipment are backed by service expertise which maximises efficiency and reduces wellsite footprint and project complexity.
CHK US CHESAPEAKE ENERGY United States 18,534.60 CHK XRVW Green Frac program calls for the elimination of any chemical not critical to the drilling process. Through the program, the company has eliminated 25% of the chemicals previously used in the fracking process. In addition, Chesapeake is actively searching for safer alternatives for the remaining chemicals.
ESPH US ECOSPHERE TECHNOLOGIES, INC. United States 65.28 NR NR Diversified water engineering and services company focused on the NG industry and providing energy companies with chemical-free water reclamation that allows them to recycle 100% of flowback and produced waters. Ozonix oxidation technologies combine ozone (as a disinfectant), hydrodynamic cavitation, acoustic cavitation and electro-oxidation in a piece of equipment used to destroy bacteria, organics, and contaminates – and allows operators to re-use 100% of the water. Over 19mn bbl treated.
Private
Filterbox
Canada
Not listed NR
NR
Packaged water treatment company offering technologies to non-conventional O&G on an equipment sale or rental/design-BOO basis
Private FILTERBOXX Canada Not listed- NR NR Offers technologies to non-conventional O&G on an equipment sale or rental/design-BOO basis. Experience in treating process water. Designs and builds skid mounted and/or containerized (S Series, and C Series) portable, packaged water and wastewater solutions
GSFVF US
GASFRAC Canada 525.03 NR NR Dedicated to efficient and environmentally friendly, virtually waterless fracking. The company uses LPG in gel form, as opposed to water, to extract natural gas which reduces or eliminates many of the environmental issues associated with hydraulic fracturing. GasFrac claims the proprietary technology enhances well productivity as well as eliminates any possible reservoir contamination.
GE US GENERAL ELECTRIC United States 163,384.45 GE NEUTRAL Developed a mobile evaporator designed to help drillers recycle waste water produced during fracking on site (vs. trucking the
SRI & Susta inab i l i ty 28 September 2011
8
Table 2: Water & Wastewater treatment solutions providers
Ticker Name Country MCap (USD Mn) BofAML Ticker
BofAML Rating Green shale gas exposure
water to a treatment plant). It can be mounted on a truck and driven to any well site, can process about 50 gallons a minute and is well suited for the Marcellus shale, where the water tends to come back with a high degree of dissolved solids.
HEK US HECKMANN CORP United States 632.66 NR NR Services-based company focused on total water solutions for shale. Heckman Water Resources provides water disposal, trucking, fluids handling, treatment and pipeline transport facilities (for water), and water infrastructure services
Private HYDRATION TECHNOLOGIES INC United States Not listed NR NR Forward Osmosis filtration technology specialist for reclaiming drilling wastewater from gas exploration operations. It has developed an alternative energy-driven means of filtering gas well reserve pit drilling water. Its technology reclaims drilling wastewater by using a unique filtration technology and harnessing a chemical energy source required by downstream E&P processes, a cost and resource that is already being consumed on each well.
KRA1V FH KEMIRA OYJ Finland KMRAF NR It has knowledge of both water-based and oil-based muds and can offer products to help solve the growing mud use and disposal markets in water-based fluids. Focusing on: chemistries that reduce environmental impact (its polymers can reduce the amount of energy required to fracture a well by 75%); materials that perform well in high brine (return water) enabling re-use and reduction of net water use; and new technologies for sustainable use of water in hydraulic fracturing applications
LIN GR LINDE Germany 23,570.58 LNAGF NEUTRAL Provides a wide range of services for the natural gas industry. They don't drill the wells, but prepare the well pad for the drilling companies. They lay pipeline for the gas companies to transport their natural gas from the wells, called midstream lines, in that they connect the wellheads from the individual wells with larger transmission lines. They construct compressor stations, and do some horizontal directional drilling to take gas lines under roads or wetlands when necessary.
Private MIOX CORPORATION United States Not listed NR NR Eco-friendly technology uses salt, water and power to generate a safe water disinfectant on site, eliminating the need to purchase, transport and store dangerous chemicals. On-site generation cuts transportation requirements by up to 80%, reduces carbon emissions and fuel consumption, and eliminates the storage and disposal of chemical containers.
NLC US NALCO HOLDING United States 4,826.62 NLC HOLD It has established a set of comprehensive standards in which a chemical cannot contain: any BTEX, carcinogens, teratogens, reproductive toxins; any priority pollutants (U.S. EPA List 40, CFR) or US EPA Safe Drinking Water Act contaminants; chemicals that would be considered persistent, bioaccumulating, or toxic by North Sea standards. The Nalco Adomite Research Group has also brought its expertise in water and polymers to bear on the compatibility concern, i.e. will the fracturing chemical additives be compatible with the high-TDS produced water.
RRC US RANGE RESOURCES United States 10,734.89 RRC BUY Reduced both the number and amount of chemicals it uses for Fracking from 0.5% to 0.1% of fracking fluid. Pioneered a water recycling program in Pennsylvania and is nearly at a 100% recycling rate for the water used in hydraulic fracturing.
SIE GR SIEMENS Germany 82,700.70 SMAWF NEUTRAL It has c.8% of the NAm primary and secondary produced water treatment market with a strong position in tertiary treatment. Siemens Water Technologies is providing wastewater treatment systems to treat flowback from Marcellus Shale drilling as well as produced water from operating wells. Its FracTreat line of products includes mobile continuous precipitation, mobile flotation and a mobile combination pilot unit, all of which help improve effluent water quality and reduce the demand on fresh water sources by recycling treated effluent.

SRI & Susta inab i l i ty 28 September 2011
9
Table 2: Water & Wastewater treatment solutions providers
Ticker Name Country MCap (USD Mn) BofAML Ticker
BofAML Rating Green shale gas exposure
TCW CN TRICAN WELL SERVICES Canada 2,448.00 YTCW XRVW Floating Sand is a new product it has designed specifically for shale gas which allows it to float any type of proppant in non-viscous water, which will prevent sand from settling to the bottom of the fracture. It is particularly applicable in fracturing shales with slick water type treatments. It has also designed an enhanced emulsified CO2 system that allows the company to place very large fracturing treatments (100 tonnes-plus) into water-sensitive shales.
VIE FP VEOLIA France 7,809.88 VEOEF BUY World’s leading water treatment company with c. 8% of the Nam primary and secondary produced water treatment market. Strong position in tertiary treatment. VWS offer includes i) thermal evaporation and crystallization technology as the primary treatment for both flowback and produced water from fracking, offering zero discharge liquid (95% of effluent recovered for reuse); ii) Optimized Pretreatment and Unique Separation) (oil removal followed by degasification, chemical softening, media filtration, and reverse osmosis); and iii) MULTIFLO, mobile water softening designs for shale which enable reuse of the treated water in fracking operations, decreasing the demand for fresh supply water. The mobile units can treat up to 10,000 barrels per day of Produced and Frac Flowback Water.
Private WATERTECTRONICS United States Not listed NR NR Onsite water treatment technology and services company. High volume recovery technologies for O&G industry (e.g. flowback, frac, and produced water for reuse). Chemical-free WaveIonics electric coagulation system can handle up to 50,000bpd.
WEIR LN WEIR GROUP United Kingdom
5,811.31 WEIGF BUY Weir SPM is a market leader in well service pumps and high pressure flow control equipment. Its line of reciprocating plungers and pumps are used in various applications including cementing, acidizing, and fracturing. The expanding flow control product line features products used to safely transport fluids at high pressure into the wellbore during various well service applications. It should benefit from frac sit evolution: shorter pump life expectancy; more repair and replacement of spares. Shale gas JV in China with Shengli Oilfield Highland Petroleum Equipment Co. Ltd.
Source: Companies, BofA Merrill Lynch Global Research, Bloomberg. GWI. NR = not covered or rated by BofAML Global Research. MCap data as at 26/09/11
Green(er) fracking chemicals, a rapidly emerging market With shale gas set for ongoing significant growth, new opportunities will arise for integrated O&G services and chemicals companies that are working on more environmentally friendly frac / completion fluids, especially in areas close to communities and drinking water supply. We anticipate that green fracking fluids will gain an increasing proportion of the c.US$8.3bn completion fluid market. This includes water-based fluids which have lower environmental impacts, and even fluids made from materials used in processed food, which allegedly meet FDA standards for consumption. We anticipate that demand and prices will increase for green fracking fluids.
Table 3: Green fracking chemical solutions providers
Ticker Name Country MCap (US$ Mn) BofAML Ticker
BofAML Rating Green shale gas exposure
BHI US
BAKER HUGHES
United States
23,666.11
BHI
Buy
Launched its BJ SmartCare family of environmentally friendly fracking fluids and additives (e.g. water-based). The offering has been qualified through a recognised third-party chemical evaluation process. It is the no.3 player in the completion fluids market.
BAS GR
BASF
Germany 56,908.94 BFFAF
Neutral
Oilfield division provides: i) drilling fluid additives (focuses on products for water-based drilling fluids; Polydrill®it minimise the
"Green" fracking fluids need to meet or exceed standards of the US Safe Drinking Water Act – ie, only traces of toxins such as benzene, toluene, ethylbenzene and zilene

SRI & Susta inab i l i ty 28 September 2011
10
Table 3: Green fracking chemical solutions providers
Ticker Name Country MCap (US$ Mn) BofAML Ticker
BofAML Rating Green shale gas exposure
loss of water from the drilling fluid on the way into the geological formation); ii) cementing additives (reliable cementing); and iii) stimulation additives (reduced water loss, biocides)
FTK US
FLOTEK INDUSTRIES IN
United States 249.84 NR NR Downhole equipment, specialty chemicals and equipment for cementing and stimulation for oilfield services companies. It has several catalysts for environmentally friendly nano-fluids (microemulsifiers), which it claims can improve production and reservoir integrity – e.g. sells a fracking fluid made from citrus. Looking for growth in NAm, Poland, Turkey, Paris basin.
HAL US
HALLIBURTON
United States
30,888.97 HAL
Buy
Has also developed a water-based shale specific fluid called SHALEDRIL. New green fracking line: i) CleanStim, a fracking fluid composed entirely of ingredients found in processed foods, which is said to provide excellent performance in terms of pumpability, proppant transport and retained conductivity; ii) CleanStream Service which uses UV light to kill bacteria that can form in the well; and iii) CleanWave which uses a portable electrocoagulation component that binds with water contaminants and forces them either to the surface where they can be removed by a skimmer, or to the bottom of the tank leaving clear water above suitable for reuse in drilling and production operations. The technique minimizes fresh water consumption and costs associated with procurement and disposal. HAL is the no.2 player in the completion fluids market.
NR US
NEWPARK RESOURCES
United States
601.29 NR
NR
Newpark Drilling Fluids and Environmental Services accounts for 83% of company revenues. Provides environmental services to the O&G industry. Its proprietary Deepdrill and Evolution water-based drilling fluids are said to be more environmentally friendly, safer and easier to use than oil-based mud systems. Newpark claims this product increases the rate of penetration and reduces operating expenses. It is the no.4 player in the completion fluids market.
SLB US
SCHLUMBERGER
United States
85,374.47 SLB
Buy
Number of water-based systems compatible with shale gas. It is the no.1 player in the completion fluids market.
TTI US
TETRA TECHNOLOGIES
United States
662.20 NR
NR
Energy services company with integrated chemicals operation supplying the energy industry. Completion fluids is the second- largest source of revenues.
Source: Companies, BofA Merrill Lynch Global Research, Bloomberg. GWI. NR = not covered or rated by BofAML Global Research. MCap data as at 26/09/11
Renewables, a positive spark for the sector Part of our analysts’ bearish stance on the renewable sector relates to the prevailing low US gas price, which makes wind and solar relatively less competitive and has served to reduce demand. Should gas prices move higher on the back of tougher HSE standards for shale gas, then they would become incrementally more positive on the renewable sector. This group includes wind turbine manufacturers such as Vestas and Hansen; solar manufacturers with an interesting US franchise such as First Solar and Sunpower; and renewable developers with US pipelines or installed merchant assets such as EDP Renovaveis, Iberdrola and NextEra. Certain utility companies could also benefit from higher gas prices, for example GDF Suez (higher LNG price for US imports from the Middle East) and International Power (gas power plants exposed to merchant power prices).
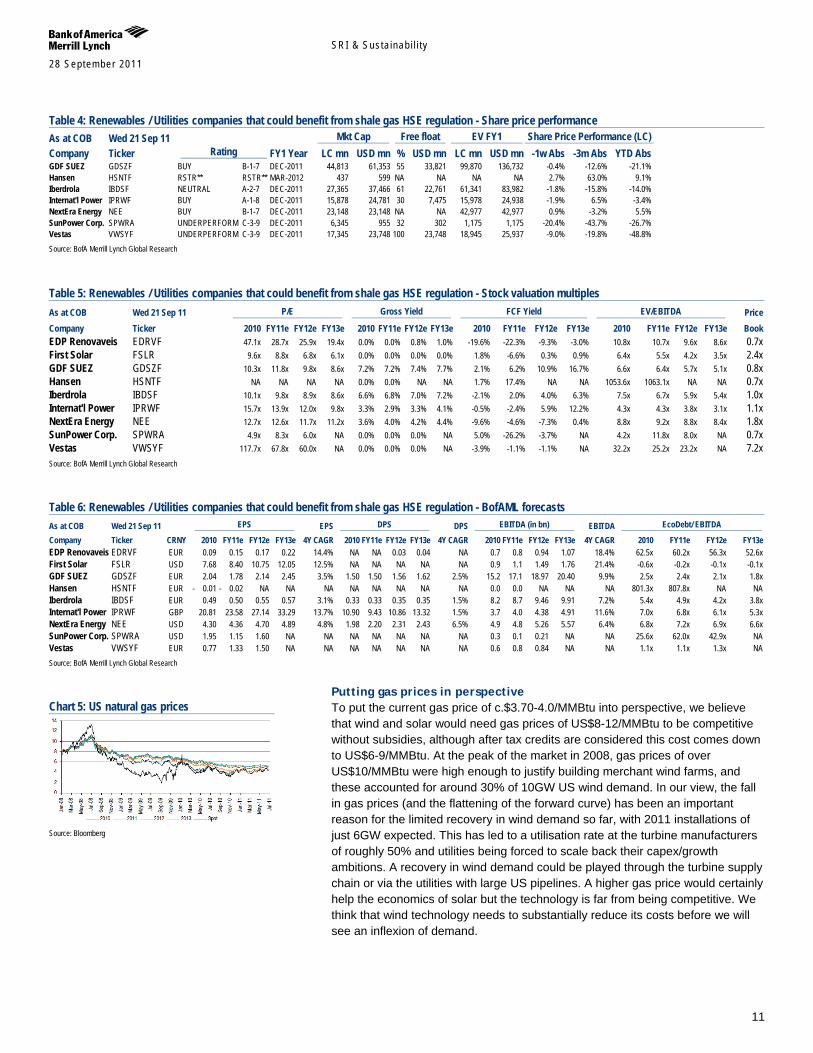
Table 4: Renewables / Utilities companies that could benefit from shale gas HSE regulation - Share price performance As at COB Wed 21 Sep 11 Mkt Cap Free float EV FY1 Share Price Performance (LC) Company Ticker Rating FY1 Year LC mn USD mn % USD mn LC mn USD mn -1w Abs -3m Abs YTD Abs EDP Renovaveis EDRVF BUY C-1-9 DEC-2011 3,636 4,978 22 1,118 7,708 10,553 -2.0% 1.2% -0.5% First Solar FSLR BUY C-1-9 DEC-2011 6,345 6,345 NA NA 5,819 5,819 -18.8% -36.9% -43.9%
Chart 4: US wind installations
0
2000
4000
6000
8000
10000
12000
2000 2001 2002 2003 2004 2005 2006 2007 2008 2009 2010 2011E 2012E
Source: AWEA? BofA Merrill Lynch Global Research
SRI & Susta inab i l i ty 28 September 2011
11
Table 4: Renewables / Utilities companies that could benefit from shale gas HSE regulation - Share price performance As at COB Wed 21 Sep 11 Mkt Cap Free float EV FY1 Share Price Performance (LC) Company Ticker Rating FY1 Year LC mn USD mn % USD mn LC mn USD mn -1w Abs -3m Abs YTD Abs GDF SUEZ GDSZF BUY B-1-7 DEC-2011 44,813 61,353 55 33,821 99,870 136,732 -0.4% -12.6% -21.1% Hansen HSNTF RSTR** RSTR** MAR-2012 437 599 NA NA NA NA 2.7% 63.0% 9.1% Iberdrola IBDSF NEUTRAL A-2-7 DEC-2011 27,365 37,466 61 22,761 61,341 83,982 -1.8% -15.8% -14.0% Internat'l Power IPRWF BUY A-1-8 DEC-2011 15,878 24,781 30 7,475 15,978 24,938 -1.9% 6.5% -3.4% NextEra Energy NEE BUY B-1-7 DEC-2011 23,148 23,148 NA NA 42,977 42,977 0.9% -3.2% 5.5% SunPower Corp. SPWRA UNDERPERFORM C-3-9 DEC-2011 6,345 955 32 302 1,175 1,175 -20.4% -43.7% -26.7% Vestas VWSYF UNDERPERFORM C-3-9 DEC-2011 17,345 23,748 100 23,748 18,945 25,937 -9.0% -19.8% -48.8% Source: BofA Merrill Lynch Global Research
Table 5: Renewables / Utilities companies that could benefit from shale gas HSE regulation - Stock valuation multiples As at COB Wed 21 Sep 11 P/E Gross Yield FCF Yield EV/EBITDA Price Company Ticker 2010 FY11e FY12e FY13e 2010 FY11e FY12e FY13e 2010 FY11e FY12e FY13e 2010 FY11e FY12e FY13e Book EDP Renovaveis EDRVF 47.1x 28.7x 25.9x 19.4x 0.0% 0.0% 0.8% 1.0% -19.6% -22.3% -9.3% -3.0% 10.8x 10.7x 9.6x 8.6x 0.7x First Solar FSLR 9.6x 8.8x 6.8x 6.1x 0.0% 0.0% 0.0% 0.0% 1.8% -6.6% 0.3% 0.9% 6.4x 5.5x 4.2x 3.5x 2.4x GDF SUEZ GDSZF 10.3x 11.8x 9.8x 8.6x 7.2% 7.2% 7.4% 7.7% 2.1% 6.2% 10.9% 16.7% 6.6x 6.4x 5.7x 5.1x 0.8x Hansen HSNTF NA NA NA NA 0.0% 0.0% NA NA 1.7% 17.4% NA NA 1053.6x 1063.1x NA NA 0.7x Iberdrola IBDSF 10.1x 9.8x 8.9x 8.6x 6.6% 6.8% 7.0% 7.2% -2.1% 2.0% 4.0% 6.3% 7.5x 6.7x 5.9x 5.4x 1.0x Internat'l Power IPRWF 15.7x 13.9x 12.0x 9.8x 3.3% 2.9% 3.3% 4.1% -0.5% -2.4% 5.9% 12.2% 4.3x 4.3x 3.8x 3.1x 1.1x NextEra Energy NEE 12.7x 12.6x 11.7x 11.2x 3.6% 4.0% 4.2% 4.4% -9.6% -4.6% -7.3% 0.4% 8.8x 9.2x 8.8x 8.4x 1.8x SunPower Corp. SPWRA 4.9x 8.3x 6.0x NA 0.0% 0.0% 0.0% NA 5.0% -26.2% -3.7% NA 4.2x 11.8x 8.0x NA 0.7x Vestas VWSYF 117.7x 67.8x 60.0x NA 0.0% 0.0% 0.0% NA -3.9% -1.1% -1.1% NA 32.2x 25.2x 23.2x NA 7.2x Source: BofA Merrill Lynch Global Research
Table 6: Renewables / Utilities companies that could benefit from shale gas HSE regulation - BofAML forecasts As at COB Wed 21 Sep 11 EPS EPS DPS DPS EBITDA (in bn) EBITDA EcoDebt/ EBITDA
Company Ticker CRNY 2010 FY11e FY12e FY13e 4Y CAGR 2010 FY11e FY12e FY13e 4Y CAGR 2010 FY11e FY12e FY13e 4Y CAGR 2010 FY11e FY12e FY13e EDP Renovaveis EDRVF EUR 0.09 0.15 0.17 0.22 14.4% NA NA 0.03 0.04 NA 0.7 0.8 0.94 1.07 18.4% 62.5x 60.2x 56.3x 52.6x First Solar FSLR USD 7.68 8.40 10.75 12.05 12.5% NA NA NA NA NA 0.9 1.1 1.49 1.76 21.4% -0.6x -0.2x -0.1x -0.1x GDF SUEZ GDSZF EUR 2.04 1.78 2.14 2.45 3.5% 1.50 1.50 1.56 1.62 2.5% 15.2 17.1 18.97 20.40 9.9% 2.5x 2.4x 2.1x 1.8x Hansen HSNTF EUR - 0.01 - 0.02 NA NA NA NA NA NA NA NA 0.0 0.0 NA NA NA 801.3x 807.8x NA NA Iberdrola IBDSF EUR 0.49 0.50 0.55 0.57 3.1% 0.33 0.33 0.35 0.35 1.5% 8.2 8.7 9.46 9.91 7.2% 5.4x 4.9x 4.2x 3.8x Internat'l Power IPRWF GBP 20.81 23.58 27.14 33.29 13.7% 10.90 9.43 10.86 13.32 1.5% 3.7 4.0 4.38 4.91 11.6% 7.0x 6.8x 6.1x 5.3x NextEra Energy NEE USD 4.30 4.36 4.70 4.89 4.8% 1.98 2.20 2.31 2.43 6.5% 4.9 4.8 5.26 5.57 6.4% 6.8x 7.2x 6.9x 6.6x SunPower Corp. SPWRA USD 1.95 1.15 1.60 NA NA NA NA NA NA NA 0.3 0.1 0.21 NA NA 25.6x 62.0x 42.9x NA Vestas VWSYF EUR 0.77 1.33 1.50 NA NA NA NA NA NA NA 0.6 0.8 0.84 NA NA 1.1x 1.1x 1.3x NA Source: BofA Merrill Lynch Global Research
Putting gas prices in perspective To put the current gas price of c.$3.70-4.0/MMBtu into perspective, we believe that wind and solar would need gas prices of US$8-12/MMBtu to be competitive without subsidies, although after tax credits are considered this cost comes down to US$6-9/MMBtu. At the peak of the market in 2008, gas prices of over US$10/MMBtu were high enough to justify building merchant wind farms, and these accounted for around 30% of 10GW US wind demand. In our view, the fall in gas prices (and the flattening of the forward curve) has been an important reason for the limited recovery in wind demand so far, with 2011 installations of just 6GW expected. This has led to a utilisation rate at the turbine manufacturers of roughly 50% and utilities being forced to scale back their capex/growth ambitions. A recovery in wind demand could be played through the turbine supply chain or via the utilities with large US pipelines. A higher gas price would certainly help the economics of solar but the technology is far from being competitive. We think that wind technology needs to substantially reduce its costs before we will see an inflexion of demand.
Chart 5: US natural gas prices
Source: Bloomberg

SRI & Susta inab i l i ty 28 September 2011
12
Shale gas revolution Unconventional gas boom The past few years have seen a revolution in gas supplies driven by a boom in the production of unconventional gas resources such as shale gas, tight gas and coal bed methane. Many countries are looking to unconventional gas to develop secure and sustainable energy supply and to reduce GHG emissions. Global gas demand is expected to rise by 60% by 2035, according to the IEA.
Shale gas has revitalised the US NG industry The combination of horizontal drilling and hydraulic fracturing (“fracking”) has granted access to large volumes of shale gas that were previously uneconomical to produce. The production of NG from shale formations has rejuvenated the natural gas industry in the US – and North American unconventional gas reserves are large enough to meet domestic demand for the next century. It has also sparked interest in gas shales in Canada, Europe, Asia, MENA and Australia, among other areas.
Fracking is likely to mean increased scrutiny, regulation & costs Concerns about hydraulic fracturing (“fracking”), the method used to extract natural gas from shale rock, has resulted in bans or proposed bans on the method in several jurisdictions. We anticipate that regulators will follow stakeholders in trying to seek a balance between producing shale gas economically and minimising HSE concerns. Either way, the result should be the same, with oil & gas companies facing the prospect of stricter safety regulations and higher production costs.
Table 7: Unconventional gas primer Issue Overview What is it? Natural gas from reservoirs with low permeability Types Shale gas, Tight gas, Coal bed methane Difference from conventional gas
Shale gas reservoirs require successful stimulation (fracturing/fracking) to be produced
Cost Unconventional gas breakeven at US$4-6/mmBtu vs breakeven of US$1.5-3/mmBtu for conventional gas Key cost elements: drilling & completion; finding cost; initial production (IP)/Expected ultimate recovery (EUR)
How much is there? 2,500 trillion cubic feet (TCF) of shale gas resources in the US – enough to supply the US for 110 years at current consumption
Why has the US led the way? Better geology (shallower deposits), lax regulatory framework (initially), low taxation, good access to technology and infrastructure
Source: BofA Merrill Lynch Global Research
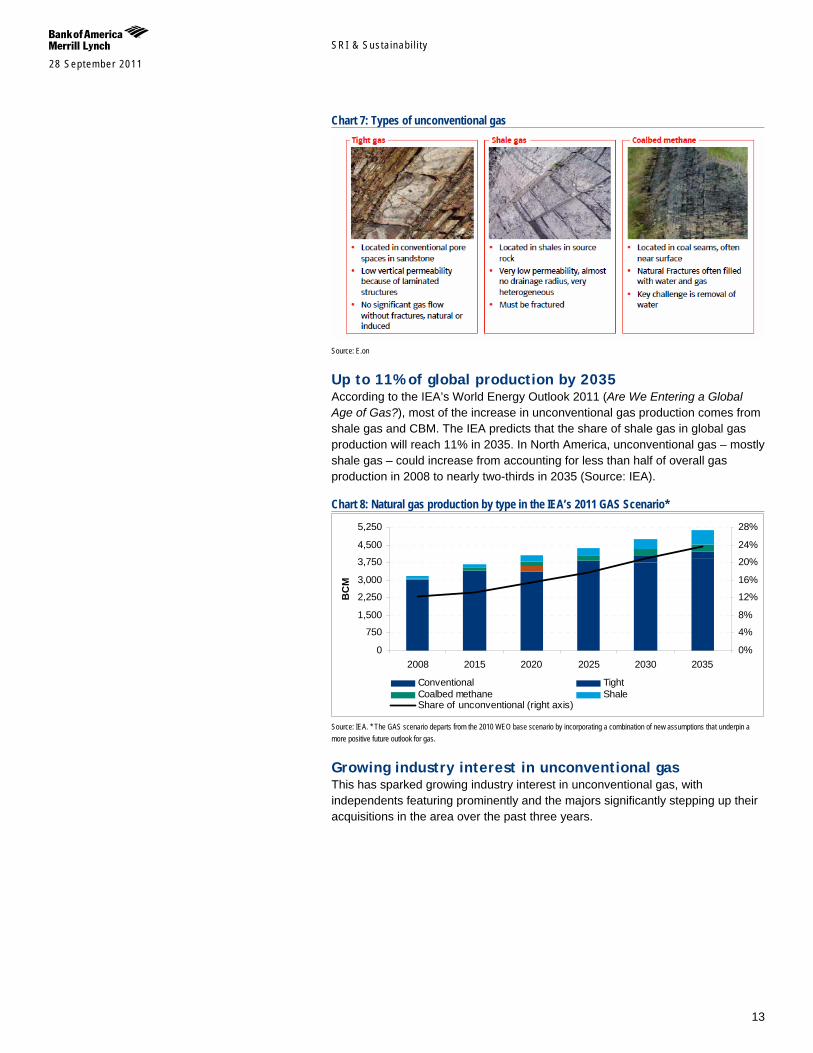
Unconventional gas boom There are three main sources of unconventional gas:
1) Tight gas: Gas trapped in impermeable and non porous sandstones
2) Coalbed Methane (CBM): Formed in low permeability coal seams and absorbed by coal particles
3) Shale gas: Formed in shale rock (fine grained rock) and held by clay particles or in pores and cracks
Chart 6: Est. 2011 global unconventional gas production
Shale13.0 bcfd
Tight Gas17.5 bcfd
CBM5.7 bcfd
Source: Wood Mackenzie, BofA Merrill Lynch Global Research
SRI & Susta inab i l i ty 28 September 2011
13
Chart 7: Types of unconventional gas
Source: E.on
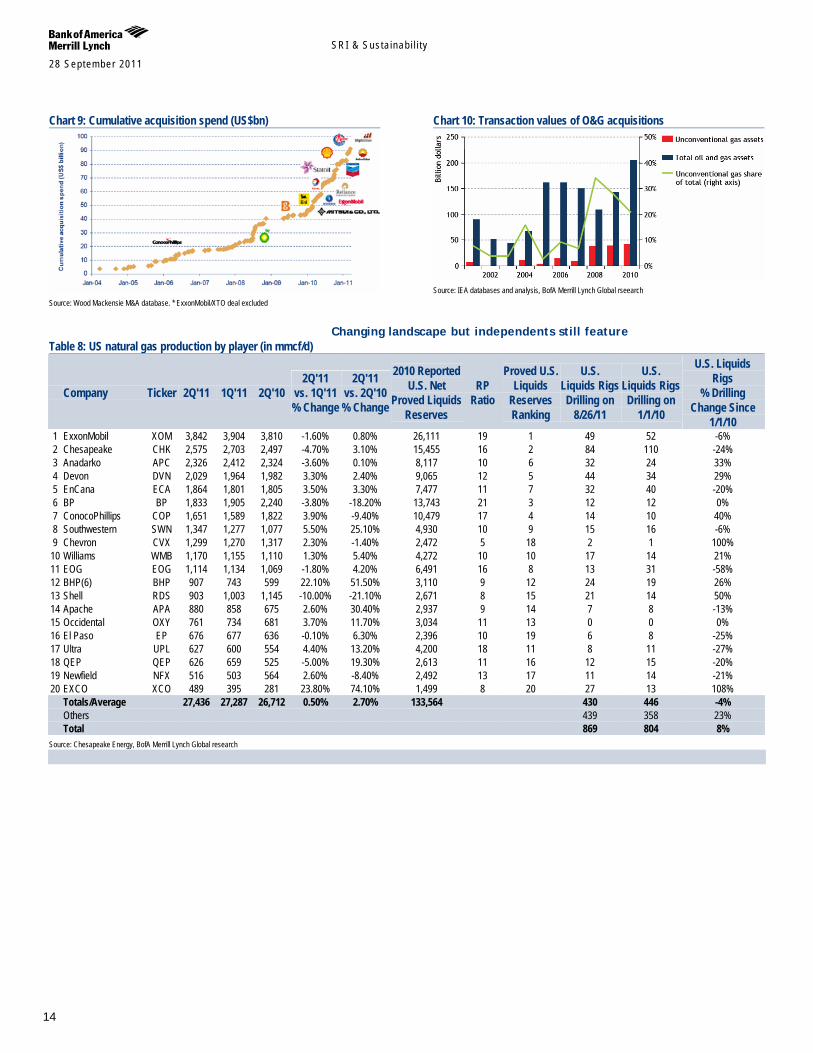
Up to 11% of global production by 2035 According to the IEA’s World Energy Outlook 2011 (Are We Entering a Global Age of Gas?), most of the increase in unconventional gas production comes from shale gas and CBM. The IEA predicts that the share of shale gas in global gas production will reach 11% in 2035. In North America, unconventional gas – mostly shale gas – could increase from accounting for less than half of overall gas production in 2008 to nearly two-thirds in 2035 (Source: IEA).
Chart 8: Natural gas production by type in the IEA’s 2011 GAS Scenario*
0
750
1,500
2,250
3,000
3,750
4,500
5,250
2008 2015 2020 2025 2030 2035
BC
M
0%
4%
8%
12%
16%
20%
24%
28%
Conventional TightCoalbed methane ShaleShare of unconventional (right axis)
Source: IEA. * The GAS scenario departs from the 2010 WEO base scenario by incorporating a combination of new assumptions that underpin a more positive future outlook for gas.
Growing industry interest in unconventional gas This has sparked growing industry interest in unconventional gas, with independents featuring prominently and the majors significantly stepping up their acquisitions in the area over the past three years.
SRI & Susta inab i l i ty 28 September 2011
14
Changing landscape but independents still feature Table 8: US natural gas production by player (in mmcf/d)
Company Ticker 2Q'11 1Q'11 2Q'10 2Q'11
vs. 1Q'11 % Change
2Q'11 vs. 2Q'10 % Change
2010 Reported U.S. Net
Proved Liquids Reserves
RP Ratio
Proved U.S. Liquids
Reserves Ranking
U.S. Liquids Rigs Drilling on
8/26/11
U.S. Liquids Rigs Drilling on
1/1/10
U.S. Liquids Rigs
% Drilling Change Since
1/1/10 1 ExxonMobil XOM 3,842 3,904 3,810 -1.60% 0.80% 26,111 19 1 49 52 -6% 2 Chesapeake CHK 2,575 2,703 2,497 -4.70% 3.10% 15,455 16 2 84 110 -24% 3 Anadarko APC 2,326 2,412 2,324 -3.60% 0.10% 8,117 10 6 32 24 33% 4 Devon DVN 2,029 1,964 1,982 3.30% 2.40% 9,065 12 5 44 34 29% 5 EnCana ECA 1,864 1,801 1,805 3.50% 3.30% 7,477 11 7 32 40 -20% 6 BP BP 1,833 1,905 2,240 -3.80% -18.20% 13,743 21 3 12 12 0% 7 ConocoPhillips COP 1,651 1,589 1,822 3.90% -9.40% 10,479 17 4 14 10 40% 8 Southwestern SWN 1,347 1,277 1,077 5.50% 25.10% 4,930 10 9 15 16 -6% 9 Chevron CVX 1,299 1,270 1,317 2.30% -1.40% 2,472 5 18 2 1 100%
10 Williams WMB 1,170 1,155 1,110 1.30% 5.40% 4,272 10 10 17 14 21% 11 EOG EOG 1,114 1,134 1,069 -1.80% 4.20% 6,491 16 8 13 31 -58% 12 BHP(6) BHP 907 743 599 22.10% 51.50% 3,110 9 12 24 19 26% 13 Shell RDS 903 1,003 1,145 -10.00% -21.10% 2,671 8 15 21 14 50% 14 Apache APA 880 858 675 2.60% 30.40% 2,937 9 14 7 8 -13% 15 Occidental OXY 761 734 681 3.70% 11.70% 3,034 11 13 0 0 0% 16 El Paso EP 676 677 636 -0.10% 6.30% 2,396 10 19 6 8 -25% 17 Ultra UPL 627 600 554 4.40% 13.20% 4,200 18 11 8 11 -27% 18 QEP QEP 626 659 525 -5.00% 19.30% 2,613 11 16 12 15 -20% 19 Newfield NFX 516 503 564 2.60% -8.40% 2,492 13 17 11 14 -21% 20 EXCO XCO 489 395 281 23.80% 74.10% 1,499 8 20 27 13 108% Totals/Average 27,436 27,287 26,712 0.50% 2.70% 133,564 430 446 -4% Others 439 358 23% Total 869 804 8%
Source: Chesapeake Energy, BofA Merrill Lynch Global research
Chart 9: Cumulative acquisition spend (US$bn)
Source: Wood Mackensie M&A database. * ExxonMobil/XTO deal excluded
Chart 10: Transaction values of O&G acquisitions
Source: IEA databases and analysis, BofA Merrill Lynch Global rseearch
SRI & Susta inab i l i ty 28 September 2011
15
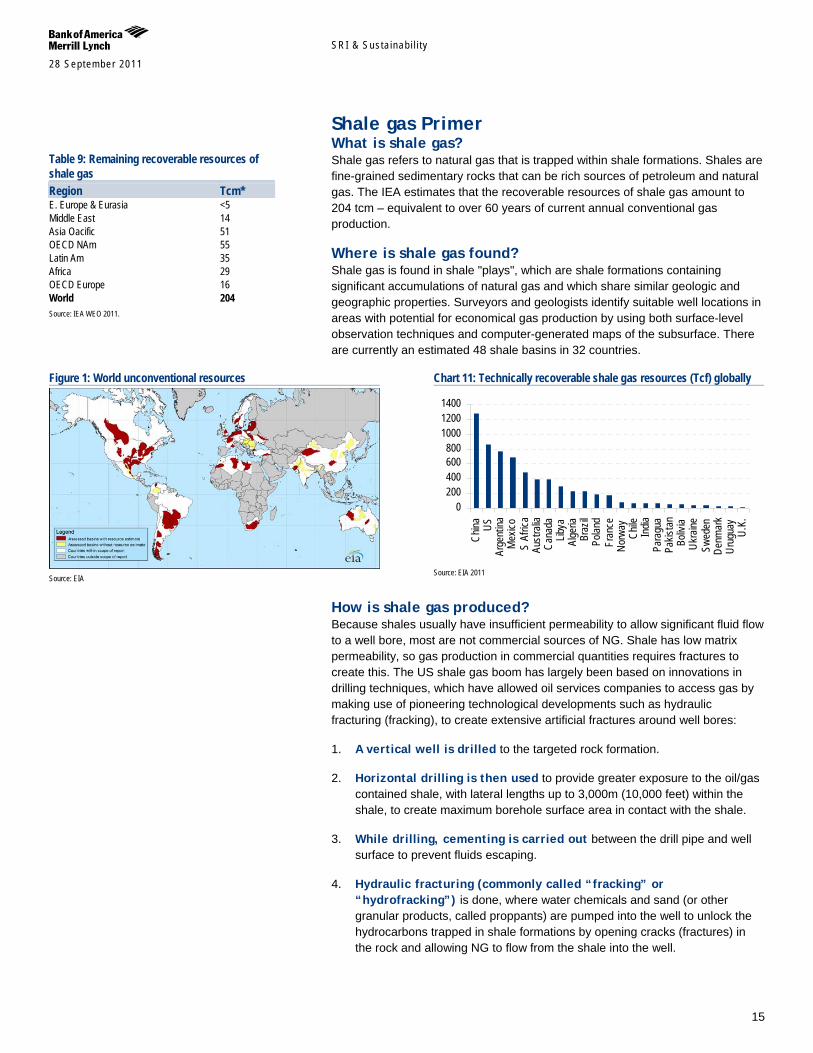
Shale gas Primer What is shale gas? Shale gas refers to natural gas that is trapped within shale formations. Shales are fine-grained sedimentary rocks that can be rich sources of petroleum and natural gas. The IEA estimates that the recoverable resources of shale gas amount to 204 tcm – equivalent to over 60 years of current annual conventional gas production.
Where is shale gas found? Shale gas is found in shale "plays", which are shale formations containing significant accumulations of natural gas and which share similar geologic and geographic properties. Surveyors and geologists identify suitable well locations in areas with potential for economical gas production by using both surface-level observation techniques and computer-generated maps of the subsurface. There are currently an estimated 48 shale basins in 32 countries.
How is shale gas produced? Because shales usually have insufficient permeability to allow significant fluid flow to a well bore, most are not commercial sources of NG. Shale has low matrix permeability, so gas production in commercial quantities requires fractures to create this. The US shale gas boom has largely been based on innovations in drilling techniques, which have allowed oil services companies to access gas by making use of pioneering technological developments such as hydraulic fracturing (fracking), to create extensive artificial fractures around well bores:
1. A vertical well is drilled to the targeted rock formation.
2. Horizontal drilling is then used to provide greater exposure to the oil/gas contained shale, with lateral lengths up to 3,000m (10,000 feet) within the shale, to create maximum borehole surface area in contact with the shale.
3. While drilling, cementing is carried out between the drill pipe and well surface to prevent fluids escaping.
4. Hydraulic fracturing (commonly called “fracking” or “hydrofracking”) is done, where water chemicals and sand (or other granular products, called proppants) are pumped into the well to unlock the hydrocarbons trapped in shale formations by opening cracks (fractures) in the rock and allowing NG to flow from the shale into the well.
Table 9: Remaining recoverable resources of shale gas Region Tcm* E. Europe & Eurasia <5 Middle East 14 Asia Oacific 51 OECD NAm 55 Latin Am 35 Africa 29 OECD Europe 16 World 204 Source: IEA WEO 2011.
Figure 1: World unconventional resources
Source: EIA
Chart 11: Technically recoverable shale gas resources (Tcf) globally
0200400600800
100012001400
China US
Arge
ntina
Mex
icoS
Afric
aAu
stra
liaCa
nada
Libya
Alge
riaBr
azil
Polan
dFr
ance
Norw
ayCh
ileIn
diaPa
ragu
aPa
kista
nBo
livia
Ukra
ineSw
eden
Denm
ark
Urug
uay
U.K.
Source: EIA 2011
SRI & Susta inab i l i ty 28 September 2011
16
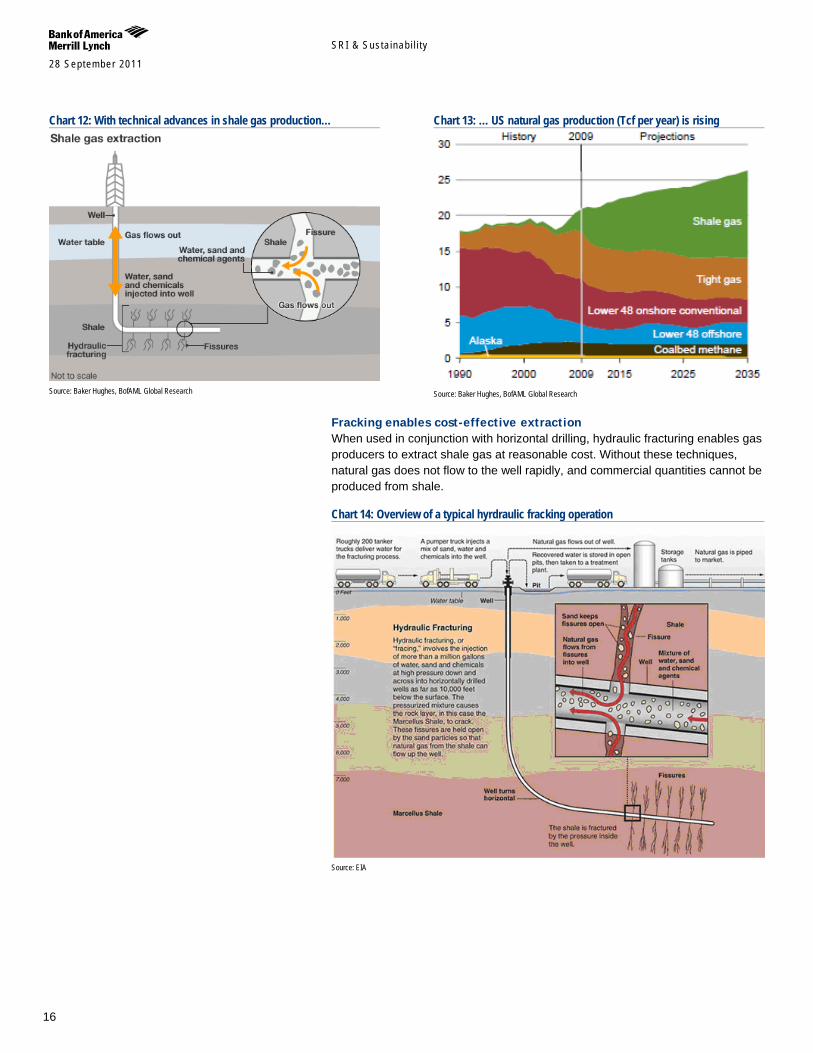
Fracking enables cost-effective extraction When used in conjunction with horizontal drilling, hydraulic fracturing enables gas producers to extract shale gas at reasonable cost. Without these techniques, natural gas does not flow to the well rapidly, and commercial quantities cannot be produced from shale.
Chart 14: Overview of a typical hyrdraulic fracking operation
Source: EIA
Chart 12: With technical advances in shale gas production…
Source: Baker Hughes, BofAML Global Research
Chart 13: … US natural gas production (Tcf per year) is rising
Source: Baker Hughes, BofAML Global Research

SRI & Susta inab i l i ty 28 September 2011
17
How does shale gas production differ from conventional NG? Conventional reservoirs are created when NG migrates toward the earth’s surface from an organic-rich source formation into highly permeable reservoir rock, where it is trapped by an overlying layer of impermeable rock. In contrast, shale gas resources form within the organic-rich shale source rock. The low permeability of the shale greatly inhibits the gas from migrating to more permeable reservoir rocks. Without horizontal drilling and fracking, shale gas production would not be economically feasible because the NG would not flow from the formation at high enough rates to justify the cost of drilling.
Table 10: Conventional vs. shale gas Conventional gas Shale gas Usually in discrete traps as independent or associated with oil
Usually found in formations with large volumes but low recovery (15-30%)
Easier to develop Very complex to develop & completion can be uneconomic, but very few dry holes are drilled
The source, trap and reservoirs are different in this case
For some of the types the gas source, trap and reservoir are the same
80% recovery factor of gas in place Wells produce at high initial rates that decline steeply Source: Wood Mackenzie
Why does the world need shale gas? With two-thirds of the 100 countries currently producing O&G liquids and the majority of global giant oil fields past their production peak, the world needs:
the equivalent of four to six more Saudi Arabias if it is to maintain current levels of production by 2030. This, along with increasingly globalised competition for reserves, is pushing oil & gas companies towards more difficult types of hydrocarbons and increasingly complex E&P to meet growing global energy demand – such as shale gas.
a diversified supply mix, energy security and price stability: Many countries are looking to shale gas in the context of the ongoing debate over supply diversification plans for their respective energy mix – and the twin goals of energy security and long-term price stability. For countries with high levels of energy insecurity, or reliance on a single supplier, domestic or imported shale gas production could help meet increased domestic consumption.
Chart 17: Global crude oil demand has been growing at among the fastest rates since 2005
55,000
60,000
65,000
70,000
75,000
80,000
85,000
90,000
95,000
1Q1986 1Q1990 1Q1994 1Q1998 1Q2002 1Q2006 1Q2010
Global oil demand
kb/d BofAML f'casts
Source: IEA, BofA Merrill Lynch Global research
Chart 15: Conventional sandstone
Source: Wood Mackaenzie
Chart 16: Shale
Source: Wood Mackaenzie

SRI & Susta inab i l i ty 28 September 2011
18
Economics of shale gas Shale had long been considered uneconomic to develop because of very low rock permeability, which yielded wells with low production rates. However, the combination of horizontal drilling and fracking has allowed North America to achieve economic production rates of between US$4/MBtu and US$6/MBtu – which compares favourably with most sources of conventional gas (ie, US$1.5/MBtu to US$3/MBtu). The key cost elements are:
1. Drilling & completion;
2. Finding cost;
3. Initial production (IP) / Expected ultimate recovery (EUR).
In this report we explore the emerging costs associated with increased scrutiny and regulations around fracking.
Chart 18: Shale gas breakeven costs per area
$-
$1.00
$2.00
$3.00
$4.00
$5.00
$6.00
$7.00
$8.00
$9.00
0% 20% 40% 60% 80% 100% 120% 140%
% of Required New Supply
Brea
keve
n Pr
ice (N
YMEX
, $/M
cf)
Marcellus SW
Bakken, Cana ,Permian oil, Vertical oil, EagleFord oil
Deep Bossier
Haynesville Non Core
Fayetteville Low EUR
Barnett Tier 3
Vertical High Cost
Jonah
Marcellus NE
WoodfordBarnett Core
Fayetteville High EUR Haynesville Core
GOM
Barnett Tier 2
Pinedale core
Pinedale Non core
EagleFord Liq Rich Gas
Granite Wash
Source: BofA Merrill Lynch Global Research
Cost efficiencies over time The US experience shows that costs will fall significantly as production increases and the benefits of experience, competition and economies of scale kick in.
Chart 19: Cost efficiencies in the Marcellus Shale in the US over time
Source: Centrica, Wood Mackenzie analysis of data from Pennsylvania DEP, Wright & Co.
SRI & Susta inab i l i ty 28 September 2011
19
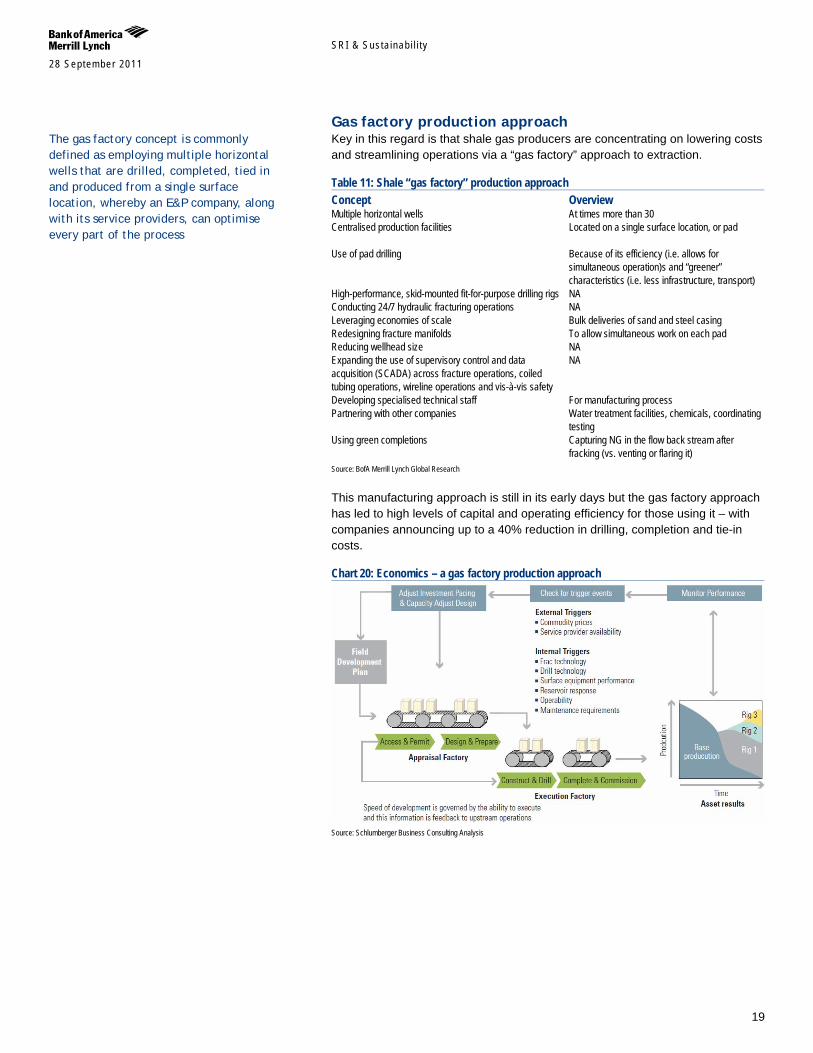
Gas factory production approach Key in this regard is that shale gas producers are concentrating on lowering costs and streamlining operations via a “gas factory” approach to extraction.
Table 11: Shale “gas factory” production approach Concept Overview Multiple horizontal wells At times more than 30 Centralised production facilities Located on a single surface location, or pad
Use of pad drilling Because of its efficiency (i.e. allows for
simultaneous operation)s and “greener” characteristics (i.e. less infrastructure, transport)
High-performance, skid-mounted fit-for-purpose drilling rigs NA Conducting 24/7 hydraulic fracturing operations NA Leveraging economies of scale Bulk deliveries of sand and steel casing Redesigning fracture manifolds To allow simultaneous work on each pad Reducing wellhead size NA Expanding the use of supervisory control and data acquisition (SCADA) across fracture operations, coiled tubing operations, wireline operations and vis-à-vis safety
NA
Developing specialised technical staff For manufacturing process Partnering with other companies Water treatment facilities, chemicals, coordinating
testing Using green completions Capturing NG in the flow back stream after
fracking (vs. venting or flaring it) Source: BofA Merrill Lynch Global Research
This manufacturing approach is still in its early days but the gas factory approach has led to high levels of capital and operating efficiency for those using it – with companies announcing up to a 40% reduction in drilling, completion and tie-in costs.
Chart 20: Economics – a gas factory production approach
Source: Schlumberger Business Consulting Analysis
The gas factory concept is commonly defined as employing multiple horizontal wells that are drilled, completed, tied in and produced from a single surface location, whereby an E&P company, along with its service providers, can optimise every part of the process
SRI & Susta inab i l i ty 28 September 2011
20
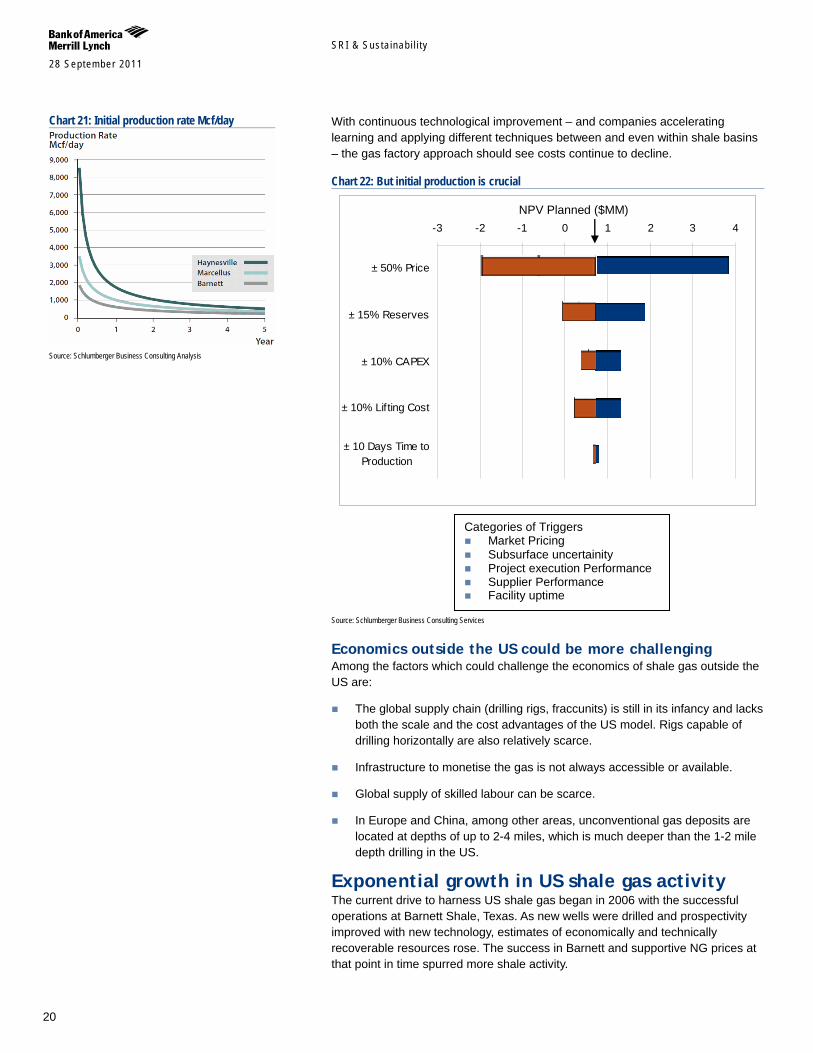
With continuous technological improvement – and companies accelerating learning and applying different techniques between and even within shale basins – the gas factory approach should see costs continue to decline.
Chart 22: But initial production is crucial
-3 -2 -1 0 1 2 3 4
± 50% Price
± 15% Reserves
± 10% CAPEX
± 10% Lifting Cost
± 10 Days Time toProduction
NPV Planned ($MM)
Categories of Triggers Market Pricing Subsurface uncertainity Project execution Performance Supplier Performance Facility uptime
Source: Schlumberger Business Consulting Services
Economics outside the US could be more challenging Among the factors which could challenge the economics of shale gas outside the US are:
The global supply chain (drilling rigs, fraccunits) is still in its infancy and lacks both the scale and the cost advantages of the US model. Rigs capable of drilling horizontally are also relatively scarce.
Infrastructure to monetise the gas is not always accessible or available.
Global supply of skilled labour can be scarce.
In Europe and China, among other areas, unconventional gas deposits are located at depths of up to 2-4 miles, which is much deeper than the 1-2 mile depth drilling in the US.
Exponential growth in US shale gas activity The current drive to harness US shale gas began in 2006 with the successful operations at Barnett Shale, Texas. As new wells were drilled and prospectivity improved with new technology, estimates of economically and technically recoverable resources rose. The success in Barnett and supportive NG prices at that point in time spurred more shale activity.
Chart 21: Initial production rate Mcf/day
Source: Schlumberger Business Consulting Analysis
SRI & Susta inab i l i ty 28 September 2011
21
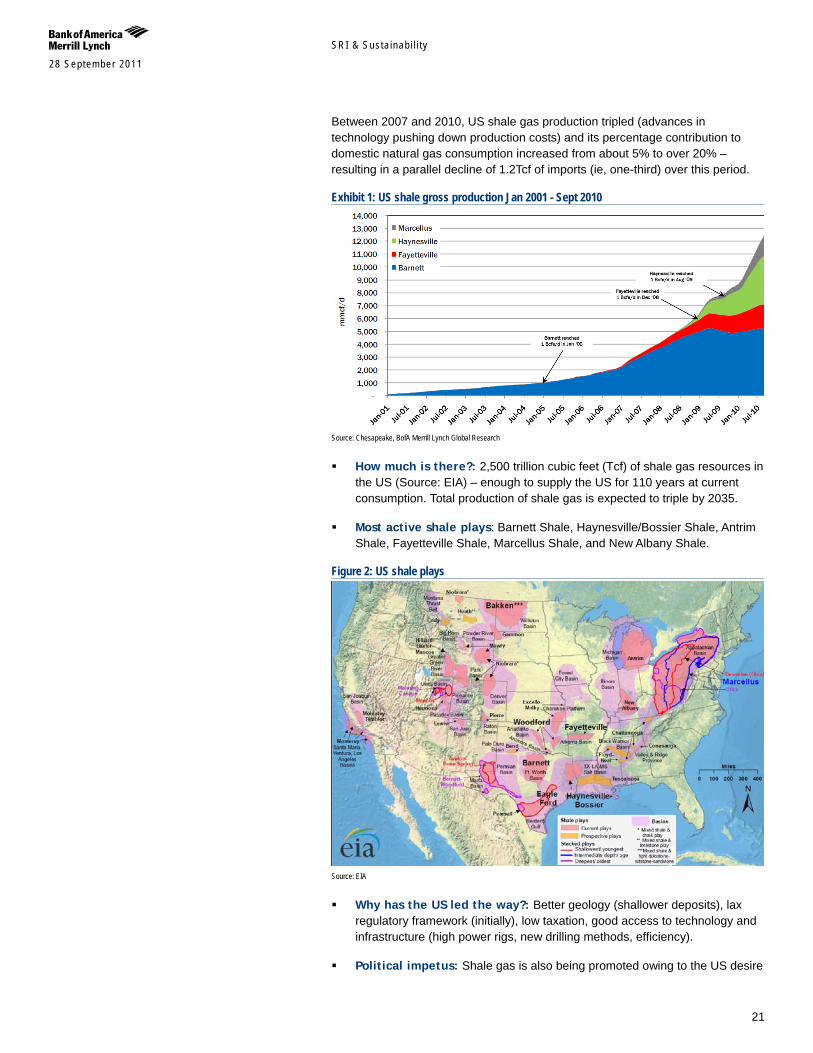
Between 2007 and 2010, US shale gas production tripled (advances in technology pushing down production costs) and its percentage contribution to domestic natural gas consumption increased from about 5% to over 20% – resulting in a parallel decline of 1.2Tcf of imports (ie, one-third) over this period.
Exhibit 1: US shale gross production Jan 2001 - Sept 2010
Source: Chesapeake, BofA Merrill Lynch Global Research
How much is there?: 2,500 trillion cubic feet (Tcf) of shale gas resources in the US (Source: EIA) – enough to supply the US for 110 years at current consumption. Total production of shale gas is expected to triple by 2035.
Most active shale plays: Barnett Shale, Haynesville/Bossier Shale, Antrim Shale, Fayetteville Shale, Marcellus Shale, and New Albany Shale.
Figure 2: US shale plays
Source: EIA
Why has the US led the way?: Better geology (shallower deposits), lax regulatory framework (initially), low taxation, good access to technology and infrastructure (high power rigs, new drilling methods, efficiency).
Political impetus: Shale gas is also being promoted owing to the US desire

SRI & Susta inab i l i ty 28 September 2011
22
for energy security, as well as President Obama’s push for a Natural Gas Bill. GHG emissions are also at play, with Democrats and Republicans arguing shale gas’s green credentials.
How much gas is there really? Take estimates with a pinch of salt In August 2011, the US Geological Survey released its latest estimate of the amount of "undiscovered technically recoverable" natural gas in the Marcellus Shale formation. The estimated volume, around 84tcf, is 80% smaller than an estimate published earlier this year by the DoE’s Energy Information Administration. This discrepancy has raised questions about how much shale gas there really is, how estimates are calculated, the dependence on industry estimates for calculations, and the possible evidence of greater risk and uncertainty around shale gas than some may previously have thought.
Technology has been key to US developments The key element of the success of North American shale gas production has, once again, been the combination of cost-effective horizontal drilling with fracking.
But there may be limits to the oil services sector’s ability to expand these technologies while reducing unit costs to levels at which they can be more widely deployed globally.
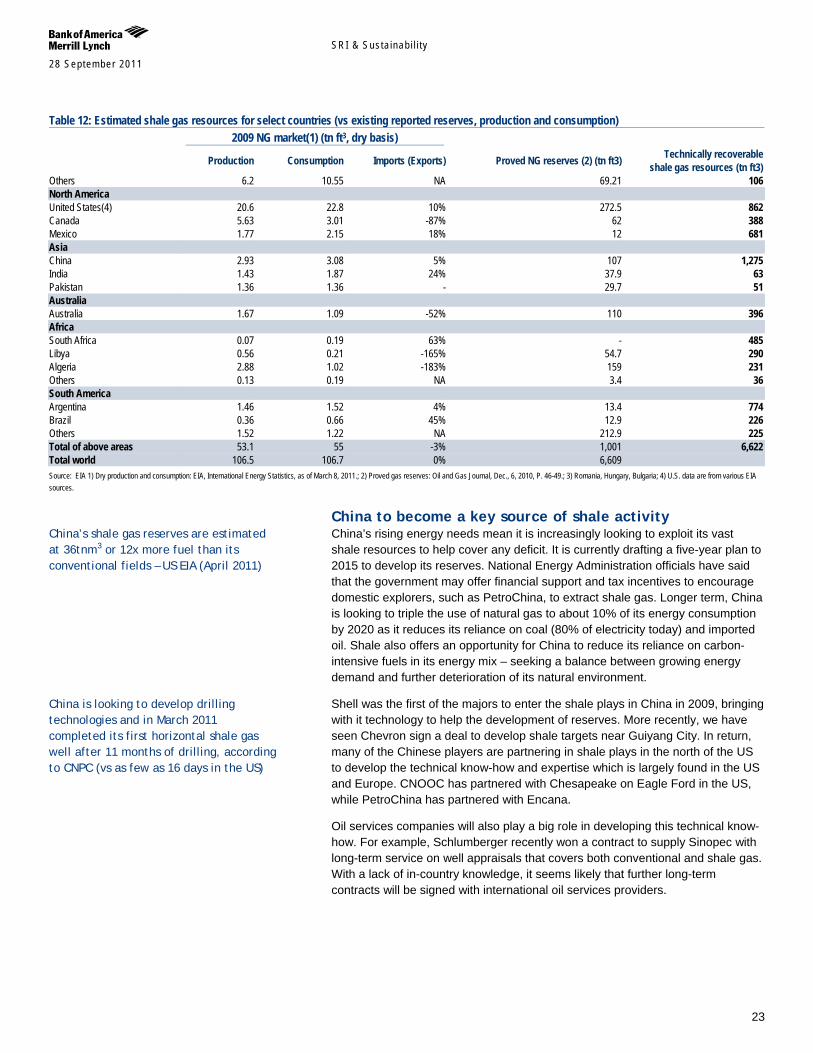
Shale gas ex-US, growing interest Worldwide production of shale gas is still small compared with conventional gas. Having seen the US fully embracing the resource and the technological side improving, we expect shale plays to attract increasing interest from other regions. We see both Europe and China moving in this direction. According to the latest EIA data, China has 1275 Tcf of shale gas resources, compared with 862 Tcf in the US and 639 Tcf in Europe as a whole.
Table 12: Estimated shale gas resources for select countries (vs existing reported reserves, production and consumption) 2009 NG market(1) (tn ft3, dry basis)
Production Consumption Imports (Exports) Proved NG reserves (2) (tn ft3) Technically recoverable shale gas resources (tn ft3)
Europe Poland 0.21 0.58 64% 5.8 187 France 0.03 1.73 98% 0.2 180 Norway 3.65 0.16 -2156% 72 83 Ukraine 0.72 1.56 54% 39 42 Sweden - 0.04 100% 41
Chart 23: Growth in horizontal drilling (a)
0100200300400500600700800900
Jan-
05
Jul-0
5
Jan-
06
Jul-0
6
Jan-
07
Jul-0
7
Jan-
08
Jul-0
8
Jan-
09
Jul-0
9
Jan-
10
Jul-1
0
Jan-
11
Directional Horizontal Vertical Total
Source: Baker Hughes, BofAML Global Research
Chart 24: Growth in horizontal drilling (b)
0
500
1,000
1,500
2,000
2,500
Jan-
05
Jun-
05
Nov-
05
Apr-0
6
Sep-
06
Feb-
07
Jul-0
7
Dec-
07
May
-08
Oct-0
8
Mar
-09
Aug-
09
Jan-
10
Jun-
10
Nov-
10
Apr-1
1
Directional Horizontal Vertical
Source: Baker Hughes, BofAML Global Research
SRI & Susta inab i l i ty 28 September 2011
23
Table 12: Estimated shale gas resources for select countries (vs existing reported reserves, production and consumption) 2009 NG market(1) (tn ft3, dry basis)
Production Consumption Imports (Exports) Proved NG reserves (2) (tn ft3) Technically recoverable shale gas resources (tn ft3)
Others 6.2 10.55 NA 69.21 106 North America United States(4) 20.6 22.8 10% 272.5 862 Canada 5.63 3.01 -87% 62 388 Mexico 1.77 2.15 18% 12 681 Asia China 2.93 3.08 5% 107 1,275 India 1.43 1.87 24% 37.9 63 Pakistan 1.36 1.36 - 29.7 51 Australia Australia 1.67 1.09 -52% 110 396 Africa South Africa 0.07 0.19 63% - 485 Libya 0.56 0.21 -165% 54.7 290 Algeria 2.88 1.02 -183% 159 231 Others 0.13 0.19 NA 3.4 36 South America Argentina 1.46 1.52 4% 13.4 774 Brazil 0.36 0.66 45% 12.9 226 Others 1.52 1.22 NA 212.9 225 Total of above areas 53.1 55 -3% 1,001 6,622 Total world 106.5 106.7 0% 6,609 Source: EIA 1) Dry production and consumption: EIA, International Energy Statistics, as of March 8, 2011.; 2) Proved gas reserves: Oil and Gas Journal, Dec., 6, 2010, P. 46-49.; 3) Romania, Hungary, Bulgaria; 4) U.S. data are from various EIA sources.
China to become a key source of shale activity China’s rising energy needs mean it is increasingly looking to exploit its vast shale resources to help cover any deficit. It is currently drafting a five-year plan to 2015 to develop its reserves. National Energy Administration officials have said that the government may offer financial support and tax incentives to encourage domestic explorers, such as PetroChina, to extract shale gas. Longer term, China is looking to triple the use of natural gas to about 10% of its energy consumption by 2020 as it reduces its reliance on coal (80% of electricity today) and imported oil. Shale also offers an opportunity for China to reduce its reliance on carbon-intensive fuels in its energy mix – seeking a balance between growing energy demand and further deterioration of its natural environment.
Shell was the first of the majors to enter the shale plays in China in 2009, bringing with it technology to help the development of reserves. More recently, we have seen Chevron sign a deal to develop shale targets near Guiyang City. In return, many of the Chinese players are partnering in shale plays in the north of the US to develop the technical know-how and expertise which is largely found in the US and Europe. CNOOC has partnered with Chesapeake on Eagle Ford in the US, while PetroChina has partnered with Encana.
Oil services companies will also play a big role in developing this technical know-how. For example, Schlumberger recently won a contract to supply Sinopec with long-term service on well appraisals that covers both conventional and shale gas. With a lack of in-country knowledge, it seems likely that further long-term contracts will be signed with international oil services providers.
China’s shale gas reserves are estimated at 36tnm3 or 12x more fuel than its conventional fields – US EIA (April 2011)
China is looking to develop drilling technologies and in March 2011 completed its first horizontal shale gas well after 11 months of drilling, according to CNPC (vs as few as 16 days in the US)
SRI & Susta inab i l i ty 28 September 2011
24
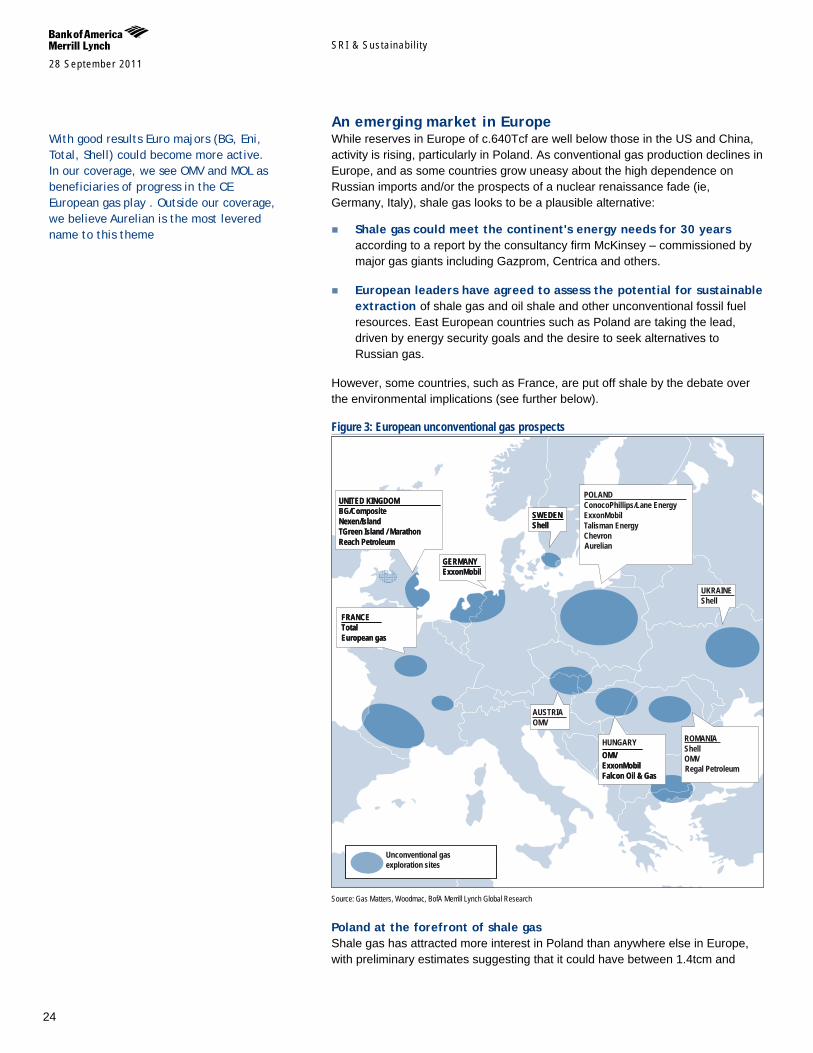
An emerging market in Europe While reserves in Europe of c.640Tcf are well below those in the US and China, activity is rising, particularly in Poland. As conventional gas production declines in Europe, and as some countries grow uneasy about the high dependence on Russian imports and/or the prospects of a nuclear renaissance fade (ie, Germany, Italy), shale gas looks to be a plausible alternative:
Shale gas could meet the continent's energy needs for 30 years according to a report by the consultancy firm McKinsey – commissioned by major gas giants including Gazprom, Centrica and others.
European leaders have agreed to assess the potential for sustainable extraction of shale gas and oil shale and other unconventional fossil fuel resources. East European countries such as Poland are taking the lead, driven by energy security goals and the desire to seek alternatives to Russian gas.
However, some countries, such as France, are put off shale by the debate over the environmental implications (see further below).
Figure 3: European unconventional gas prospects
Unconventional gas exploration sites
FRANCETotalEuropean gas
GERMANYExxonMobil
UNITED KINGDOMBG/CompositeNexen/IslandTGreen Island / MarathonReach Petroleum
SWEDENShell
POLANDConocoPhillips/Lane EnergyExxonMobilTalisman EnergyChevron
AUSTRIAOMV
HUNGARYOMVExxonMobilFalcon Oil & Gas
ROMANIAShell
UKRAINEShell
Aurelian
OMVRegal Petroleum
Unconventional gas exploration sites
FRANCETotalEuropean gas
FRANCETotalEuropean gas
GERMANYExxonMobilGERMANYExxonMobil
UNITED KINGDOMBG/CompositeNexen/IslandTGreen Island / MarathonReach Petroleum
UNITED KINGDOMBG/CompositeNexen/IslandTGreen Island / MarathonReach Petroleum
SWEDENShellSWEDENShell
POLANDConocoPhillips/Lane EnergyExxonMobilTalisman EnergyChevron
AUSTRIAOMV
HUNGARYOMVExxonMobilFalcon Oil & Gas
OMVExxonMobilFalcon Oil & Gas
ROMANIAShell
UKRAINEShell
Aurelian
OMVRegal Petroleum
Source: Gas Matters, Woodmac, BofA Merrill Lynch Global Research
Poland at the forefront of shale gas Shale gas has attracted more interest in Poland than anywhere else in Europe, with preliminary estimates suggesting that it could have between 1.4tcm and
With good results Euro majors (BG, Eni, Total, Shell) could become more active. In our coverage, we see OMV and MOL as beneficiaries of progress in the CE European gas play . Outside our coverage, we believe Aurelian is the most levered name to this theme
SRI & Susta inab i l i ty 28 September 2011
25
5.3tcm of shale gas, with 86 unconventional concessions granted as of H1-11. There is growing interest from oil companies keen to participate. Poland has a number of features that make it attractive for shale:
Its central location gives it good access to infrastructure, being the transport corridor between Russia and Western Europe.
Low taxation has been encouraged, which helps to improve the economics of projects, with the government taking only 20% (19% tax, 1% royalty).
Poland’s power sector is dominated by coal (92%) and shale gas could provide a means of reducing GHG emissions and pollution, as well as improving security of supply.
But the industry will have to address several areas that are currently not widely understood – well depths may be much deeper than in the US, and productivity and recovery rates are unknown in the region.
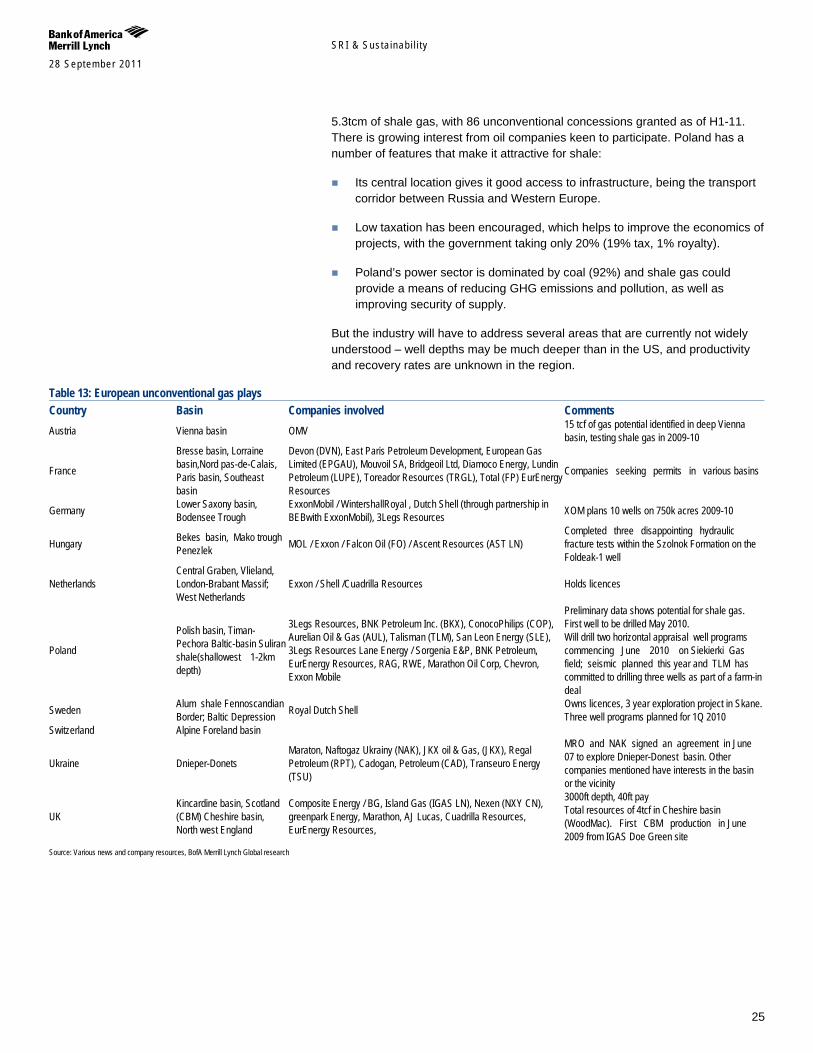
Table 13: European unconventional gas plays Country Basin Companies involved Comments Austria Vienna basin OMV 15 tcf of gas potential identified in deep Vienna
basin, testing shale gas in 2009-10
France
Bresse basin, Lorraine basin,Nord pas-de-Calais, Paris basin, Southeast basin
Devon (DVN), East Paris Petroleum Development, European Gas Limited (EPGAU), Mouvoil SA, Bridgeoil Ltd, Diamoco Energy, Lundin Petroleum (LUPE), Toreador Resources (TRGL), Total (FP) EurEnergy Resources
Companies seeking permits in various basins
Germany Lower Saxony basin, Bodensee Trough
ExxonMobil / WintershallRoyal , Dutch Shell (through partnership in BEBwith ExxonMobil), 3Legs Resources XOM plans 10 wells on 750k acres 2009-10
Hungary Bekes basin, Mako trough Penezlek MOL / Exxon / Falcon Oil (FO) / Ascent Resources (AST LN)
Completed three disappointing hydraulic fracture tests within the Szolnok Formation on the Foldeak-1 well
Netherlands Central Graben, Vlieland, London-Brabant Massif; West Netherlands
Exxon / Shell /Cuadrilla Resources Holds licences
Poland
Polish basin, Timan-Pechora Baltic-basin Suliran shale(shallowest 1-2km depth)
3Legs Resources, BNK Petroleum Inc. (BKX), ConocoPhilips (COP), Aurelian Oil & Gas (AUL), Talisman (TLM), San Leon Energy (SLE), 3Legs Resources Lane Energy / Sorgenia E&P, BNK Petroleum, EurEnergy Resources, RAG, RWE, Marathon Oil Corp, Chevron, Exxon Mobile
Preliminary data shows potential for shale gas. First well to be drilled May 2010. Will drill two horizontal appraisal well programs commencing June 2010 on Siekierki Gas field; seismic planned this year and TLM has committed to drilling three wells as part of a farm-in deal
Sweden Alum shale Fennoscandian Border; Baltic Depression Royal Dutch Shell Owns licences, 3 year exploration project in Skane.
Three well programs planned for 1Q 2010 Switzerland Alpine Foreland basin
Ukraine Dnieper-Donets Maraton, Naftogaz Ukrainy (NAK), JKX oil & Gas, (JKX), Regal Petroleum (RPT), Cadogan, Petroleum (CAD), Transeuro Energy (TSU)
MRO and NAK signed an agreement in June 07 to explore Dnieper-Donest basin. Other companies mentioned have interests in the basin or the vicinity
UK Kincardine basin, Scotland (CBM) Cheshire basin, North west England
Composite Energy / BG, Island Gas (IGAS LN), Nexen (NXY CN), greenpark Energy, Marathon, AJ Lucas, Cuadrilla Resources, EurEnergy Resources,
3000ft depth, 40ft pay Total resources of 4tcf in Cheshire basin (WoodMac). First CBM production in June 2009 from IGAS Doe Green site
Source: Various news and company resources, BofA Merrill Lynch Global research
SRI & Susta inab i l i ty 28 September 2011
26
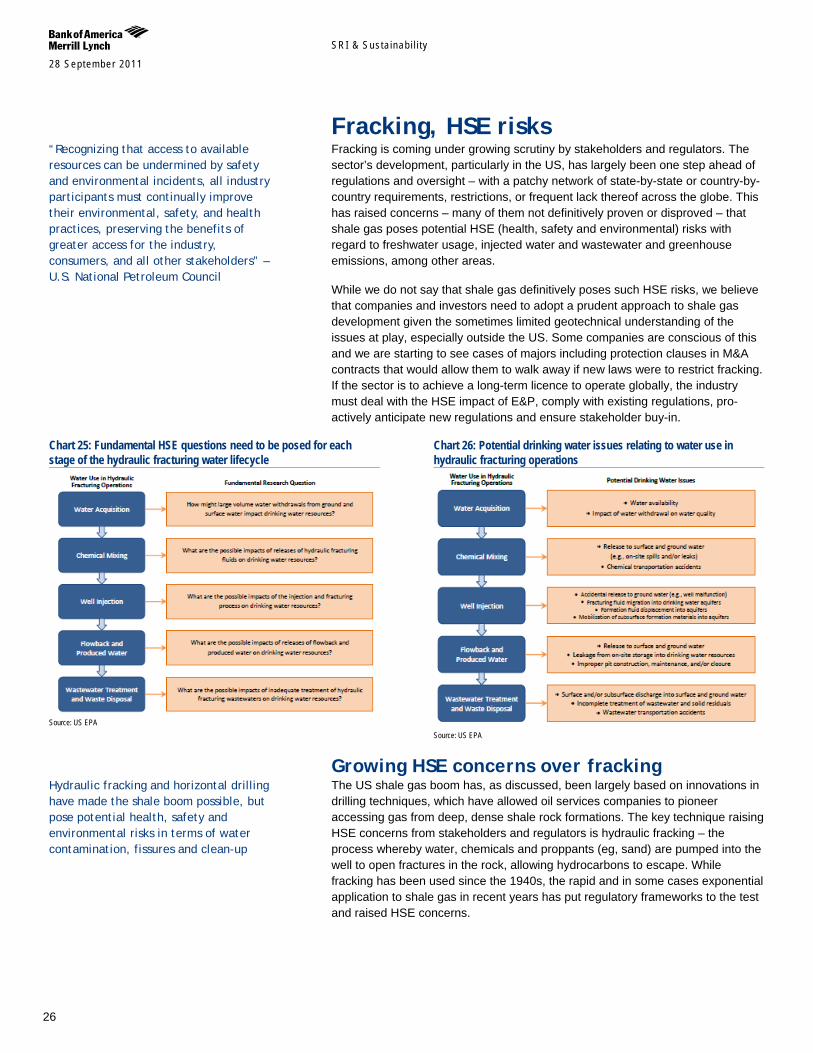
Fracking, HSE risks Fracking is coming under growing scrutiny by stakeholders and regulators. The sector’s development, particularly in the US, has largely been one step ahead of regulations and oversight – with a patchy network of state-by-state or country-by-country requirements, restrictions, or frequent lack thereof across the globe. This has raised concerns – many of them not definitively proven or disproved – that shale gas poses potential HSE (health, safety and environmental) risks with regard to freshwater usage, injected water and wastewater and greenhouse emissions, among other areas.
While we do not say that shale gas definitively poses such HSE risks, we believe that companies and investors need to adopt a prudent approach to shale gas development given the sometimes limited geotechnical understanding of the issues at play, especially outside the US. Some companies are conscious of this and we are starting to see cases of majors including protection clauses in M&A contracts that would allow them to walk away if new laws were to restrict fracking. If the sector is to achieve a long-term licence to operate globally, the industry must deal with the HSE impact of E&P, comply with existing regulations, pro-actively anticipate new regulations and ensure stakeholder buy-in.
Growing HSE concerns over fracking The US shale gas boom has, as discussed, been largely based on innovations in drilling techniques, which have allowed oil services companies to pioneer accessing gas from deep, dense shale rock formations. The key technique raising HSE concerns from stakeholders and regulators is hydraulic fracking – the process whereby water, chemicals and proppants (eg, sand) are pumped into the well to open fractures in the rock, allowing hydrocarbons to escape. While fracking has been used since the 1940s, the rapid and in some cases exponential application to shale gas in recent years has put regulatory frameworks to the test and raised HSE concerns.
“Recognizing that access to available resources can be undermined by safety and environmental incidents, all industry participants must continually improve their environmental, safety, and health practices, preserving the benefits of greater access for the industry, consumers, and all other stakeholders” – U.S. National Petroleum Council
Chart 25: Fundamental HSE questions need to be posed for each stage of the hydraulic fracturing water lifecycle
Source: US EPA
Chart 26: Potential drinking water issues relating to water use in hydraulic fracturing operations
Source: US EPA
Hydraulic fracking and horizontal drilling have made the shale boom possible, but pose potential health, safety and environmental risks in terms of water contamination, fissures and clean-up
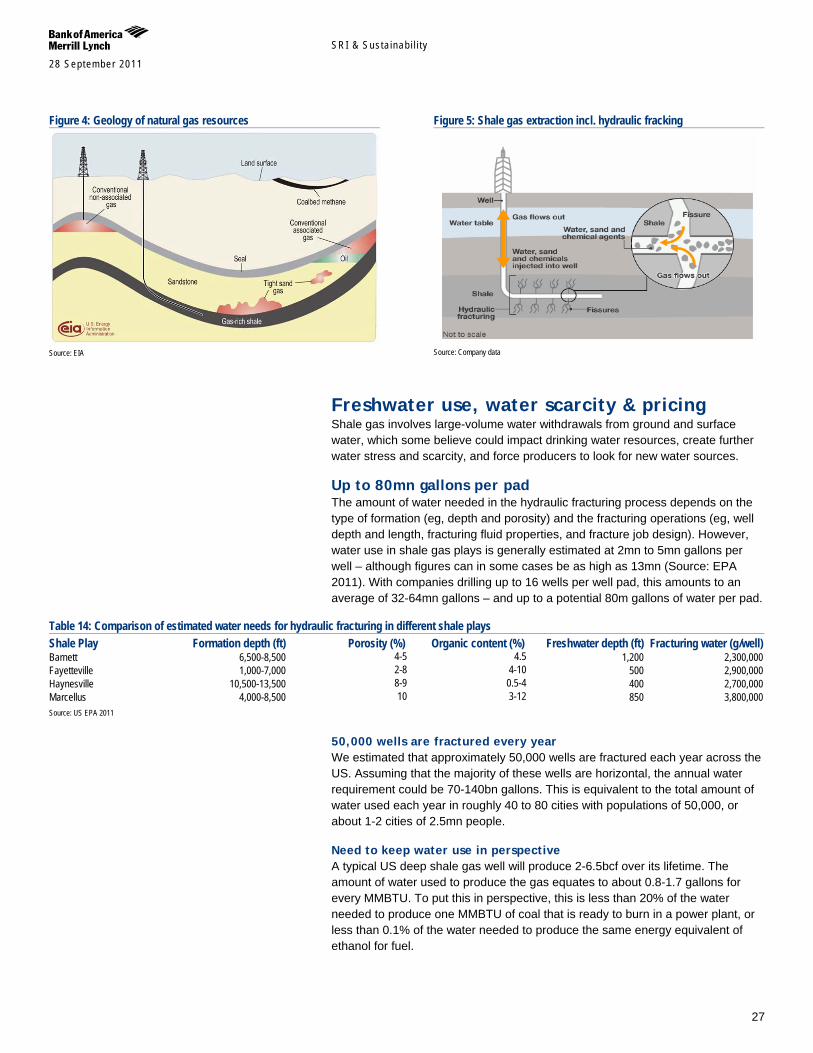
SRI & Susta inab i l i ty 28 September 2011
27
Freshwater use, water scarcity & pricing Shale gas involves large-volume water withdrawals from ground and surface water, which some believe could impact drinking water resources, create further water stress and scarcity, and force producers to look for new water sources.
Up to 80mn gallons per pad The amount of water needed in the hydraulic fracturing process depends on the type of formation (eg, depth and porosity) and the fracturing operations (eg, well depth and length, fracturing fluid properties, and fracture job design). However, water use in shale gas plays is generally estimated at 2mn to 5mn gallons per well – although figures can in some cases be as high as 13mn (Source: EPA 2011). With companies drilling up to 16 wells per well pad, this amounts to an average of 32-64mn gallons – and up to a potential 80m gallons of water per pad.
Table 14: Comparison of estimated water needs for hydraulic fracturing in different shale plays Shale Play Formation depth (ft) Porosity (%) Organic content (%) Freshwater depth (ft) Fracturing water (g/well) Barnett 6,500-8,500 4-5 4.5 1,200 2,300,000 Fayetteville 1,000-7,000 2-8 4-10 500 2,900,000 Haynesville 10,500-13,500 8-9 0.5-4 400 2,700,000 Marcellus 4,000-8,500 10 3-12 850 3,800,000 Source: US EPA 2011
50,000 wells are fractured every year We estimated that approximately 50,000 wells are fractured each year across the US. Assuming that the majority of these wells are horizontal, the annual water requirement could be 70-140bn gallons. This is equivalent to the total amount of water used each year in roughly 40 to 80 cities with populations of 50,000, or about 1-2 cities of 2.5mn people.
Need to keep water use in perspective A typical US deep shale gas well will produce 2-6.5bcf over its lifetime. The amount of water used to produce the gas equates to about 0.8-1.7 gallons for every MMBTU. To put this in perspective, this is less than 20% of the water needed to produce one MMBTU of coal that is ready to burn in a power plant, or less than 0.1% of the water needed to produce the same energy equivalent of ethanol for fuel.
Figure 4: Geology of natural gas resources
Source: EIA
Figure 5: Shale gas extraction incl. hydraulic fracking
Source: Company data
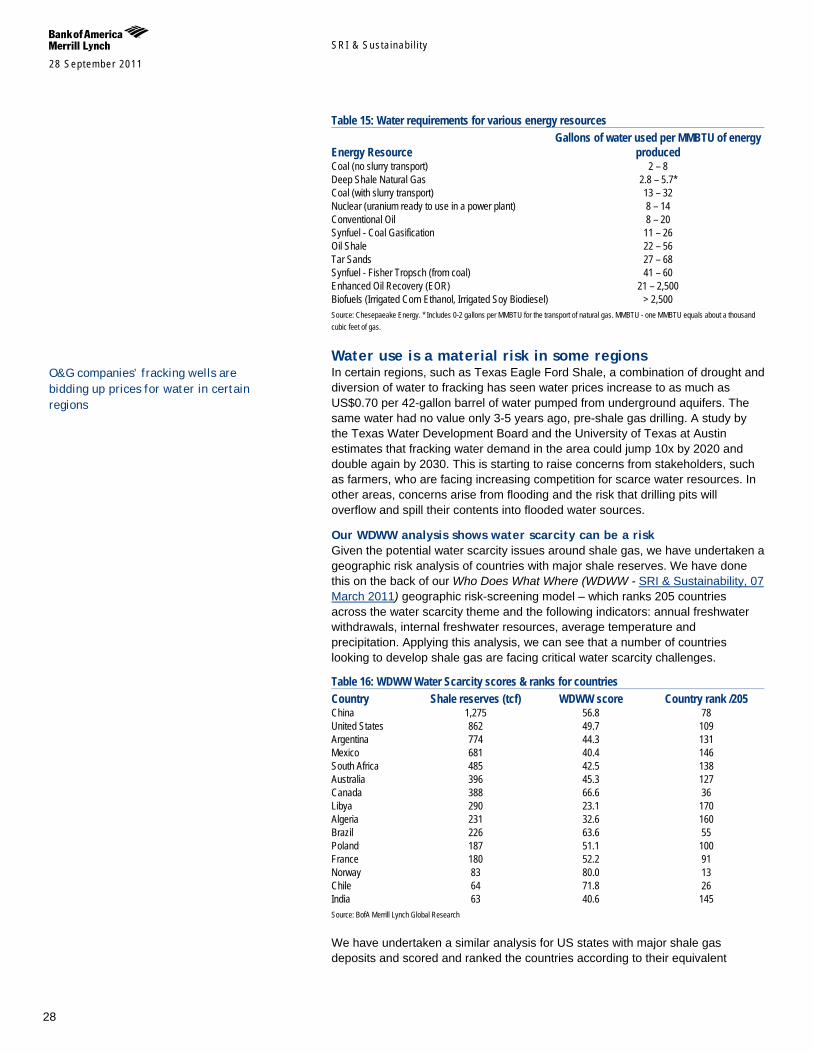
SRI & Susta inab i l i ty 28 September 2011
28
Table 15: Water requirements for various energy resources
Energy Resource Gallons of water used per MMBTU of energy
produced Coal (no slurry transport) 2 – 8 Deep Shale Natural Gas 2.8 – 5.7* Coal (with slurry transport) 13 – 32 Nuclear (uranium ready to use in a power plant) 8 – 14 Conventional Oil 8 – 20 Synfuel - Coal Gasification 11 – 26 Oil Shale 22 – 56 Tar Sands 27 – 68 Synfuel - Fisher Tropsch (from coal) 41 – 60 Enhanced Oil Recovery (EOR) 21 – 2,500 Biofuels (Irrigated Corn Ethanol, Irrigated Soy Biodiesel) > 2,500 Source: Chesepaeake Energy. * Includes 0-2 gallons per MMBTU for the transport of natural gas. MMBTU - one MMBTU equals about a thousand cubic feet of gas.
Water use is a material risk in some regions In certain regions, such as Texas Eagle Ford Shale, a combination of drought and diversion of water to fracking has seen water prices increase to as much as US$0.70 per 42-gallon barrel of water pumped from underground aquifers. The same water had no value only 3-5 years ago, pre-shale gas drilling. A study by the Texas Water Development Board and the University of Texas at Austin estimates that fracking water demand in the area could jump 10x by 2020 and double again by 2030. This is starting to raise concerns from stakeholders, such as farmers, who are facing increasing competition for scarce water resources. In other areas, concerns arise from flooding and the risk that drilling pits will overflow and spill their contents into flooded water sources.
Our WDWW analysis shows water scarcity can be a risk Given the potential water scarcity issues around shale gas, we have undertaken a geographic risk analysis of countries with major shale reserves. We have done this on the back of our Who Does What Where (WDWW - SRI & Sustainability, 07 March 2011) geographic risk-screening model – which ranks 205 countries across the water scarcity theme and the following indicators: annual freshwater withdrawals, internal freshwater resources, average temperature and precipitation. Applying this analysis, we can see that a number of countries looking to develop shale gas are facing critical water scarcity challenges.
Table 16: WDWW Water Scarcity scores & ranks for countries Country Shale reserves (tcf) WDWW score Country rank /205 China 1,275 56.8 78 United States 862 49.7 109 Argentina 774 44.3 131 Mexico 681 40.4 146 South Africa 485 42.5 138 Australia 396 45.3 127 Canada 388 66.6 36 Libya 290 23.1 170 Algeria 231 32.6 160 Brazil 226 63.6 55 Poland 187 51.1 100 France 180 52.2 91 Norway 83 80.0 13 Chile 64 71.8 26 India 63 40.6 145 Source: BofA Merrill Lynch Global Research
We have undertaken a similar analysis for US states with major shale gas deposits and scored and ranked the countries according to their equivalent
O&G companies’ fracking wells are bidding up prices for water in certain regions

SRI & Susta inab i l i ty 28 September 2011
29
country rank on WDWW. The results are similar – water scarcity is clearly a challenge in a number of jurisdictions.
Table 17: WDWW Water Scarcity scores & ranks for US states
U.S. State Proven shale reserves
(Bcf) WDWW score Eq. country rank (205)
Texas 28,167 27.21 166 Louisiana 9,307 50.41 103 Arkansas 9,070 54.75 85 Oklahoma 6,389 55.97 81 Pennsylvania 3,790 62.67 58 Michigan 2,499 45.82 124 West Virginia 688 53.85 88 North Dakota 368 50.37 103 Source: BofA Merrill Lynch Global Research
Injected water, chemical issues Another potential concern is that chemicals are added to the water to facilitate the underground fracturing process – with notable issues arising with regard to the actual chemicals used in the fracking process as well as the lack of systematic disclosure requirements for the chemicals used (with a number of companies arguing that the information is proprietary).
Chemical use in fracking fluids The overall concentration of chemical additives in fracturing fluids used in shale gas plays ranges from 0.5% to 2% by volume with water and proppant comprising the remainder. This indicates that 15,000 to 60,000 gallons of the total fracturing fluid consist of chemical additives (assuming a total fluid volume of 3mn gallons).
Chart 27: Composition of hydraulic fracking fluid (by volume)
Source: GE
Table 18: Chemical components appearing most often in hydraulic fracturing products used in the US 2005-09 Chemical component No. of products containing chemical Methanol (Methyl alcohol) 342 Isopropanol (Isopropyl alcohol, Propan-2-ol) 274 Crystalline silica – quartz (SiO2) 207 Ethylene glycol monobutyl ether (2-butoxyethanol) 126 Ethylene glycol (1,2-ethanediol) 119 Hydrotreated light petroleum distillates 89 Sodium hydroxide (caustic acid) 80 Source: US House of Representatives
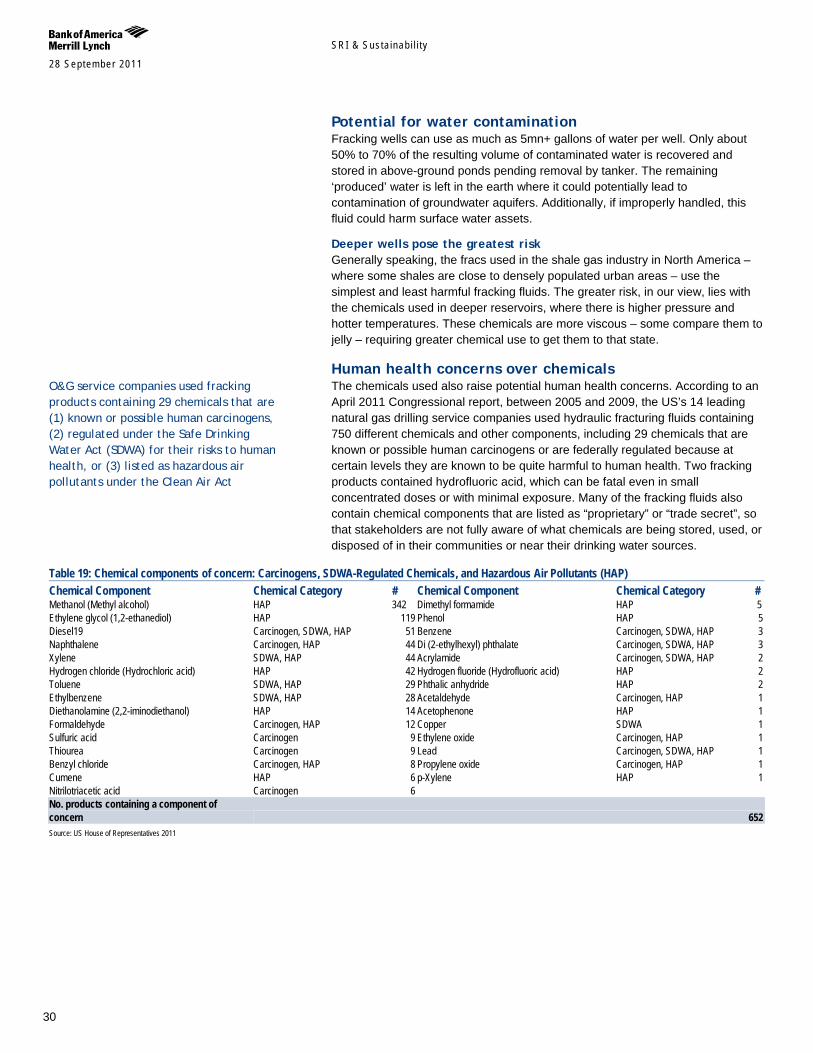
SRI & Susta inab i l i ty 28 September 2011
30
Potential for water contamination Fracking wells can use as much as 5mn+ gallons of water per well. Only about 50% to 70% of the resulting volume of contaminated water is recovered and stored in above-ground ponds pending removal by tanker. The remaining ‘produced’ water is left in the earth where it could potentially lead to contamination of groundwater aquifers. Additionally, if improperly handled, this fluid could harm surface water assets.
Deeper wells pose the greatest risk Generally speaking, the fracs used in the shale gas industry in North America – where some shales are close to densely populated urban areas – use the simplest and least harmful fracking fluids. The greater risk, in our view, lies with the chemicals used in deeper reservoirs, where there is higher pressure and hotter temperatures. These chemicals are more viscous – some compare them to jelly – requiring greater chemical use to get them to that state.
Human health concerns over chemicals The chemicals used also raise potential human health concerns. According to an April 2011 Congressional report, between 2005 and 2009, the US’s 14 leading natural gas drilling service companies used hydraulic fracturing fluids containing 750 different chemicals and other components, including 29 chemicals that are known or possible human carcinogens or are federally regulated because at certain levels they are known to be quite harmful to human health. Two fracking products contained hydrofluoric acid, which can be fatal even in small concentrated doses or with minimal exposure. Many of the fracking fluids also contain chemical components that are listed as “proprietary” or “trade secret”, so that stakeholders are not fully aware of what chemicals are being stored, used, or disposed of in their communities or near their drinking water sources.
Table 19: Chemical components of concern: Carcinogens, SDWA-Regulated Chemicals, and Hazardous Air Pollutants (HAP) Chemical Component Chemical Category # Chemical Component Chemical Category # Methanol (Methyl alcohol) HAP 342 Dimethyl formamide HAP 5 Ethylene glycol (1,2-ethanediol) HAP 119 Phenol HAP 5 Diesel19 Carcinogen, SDWA, HAP 51 Benzene Carcinogen, SDWA, HAP 3 Naphthalene Carcinogen, HAP 44 Di (2-ethylhexyl) phthalate Carcinogen, SDWA, HAP 3 Xylene SDWA, HAP 44 Acrylamide Carcinogen, SDWA, HAP 2 Hydrogen chloride (Hydrochloric acid) HAP 42 Hydrogen fluoride (Hydrofluoric acid) HAP 2 Toluene SDWA, HAP 29 Phthalic anhydride HAP 2 Ethylbenzene SDWA, HAP 28 Acetaldehyde Carcinogen, HAP 1 Diethanolamine (2,2-iminodiethanol) HAP 14 Acetophenone HAP 1 Formaldehyde Carcinogen, HAP 12 Copper SDWA 1 Sulfuric acid Carcinogen 9 Ethylene oxide Carcinogen, HAP 1 Thiourea Carcinogen 9 Lead Carcinogen, SDWA, HAP 1 Benzyl chloride Carcinogen, HAP 8 Propylene oxide Carcinogen, HAP 1 Cumene HAP 6 p-Xylene HAP 1 Nitrilotriacetic acid Carcinogen 6 No. products containing a component of concern 652 Source: US House of Representatives 2011
O&G service companies used fracking products containing 29 chemicals that are (1) known or possible human carcinogens, (2) regulated under the Safe Drinking Water Act (SDWA) for their risks to human health, or (3) listed as hazardous air pollutants under the Clean Air Act
SRI & Susta inab i l i ty 28 September 2011
31
Casing & cementing are key to groundwater protection Casing strings are an important element of groundwater protection because they provide for the isolation of fresh water zones and groundwater from the inside of the well. Casing also transmits flowback fluids from well treatment. Surface casing is the first line of defence and production casing is a second layer of protection for groundwater. Equally important is the cementation of the casing that adds huge value to groundwater protection. Proper sealing of annular spaces with cement creates a hydraulic barrier to both vertical and horizontal fluid migration. As a result, the quality of the initial cement job is a critical factor in the prevention of fluid movement from deeper zones into groundwater resources (Source: FracFocus).
Produced water, treatment risks & opportunities While some efforts are being made to treat or contain the used fracking fluid, enforcement is currently not well developed. Moreover, the ways in which these chemicals are acting together with the sub-surface and potential leak into ground water is still not 100% understood or researched. In addition, recovered water may contain materials from the rock, such as naturally occurring radioactive materials and heavy metals. Greater regulation will mean a significant increase in wastewater treatment requirements and costs, which could rise by up to 300% in some areas.
Traditional treatment solutions are not viable One concern is the possible lack of capacity by companies and relevant government authorities to clean up frac fluid-contaminated wastewater. This has been the subject of stakeholder scrutiny after a series of frack spills in the US, despite claims by many companies that the process is safe and time-tested. Existing solutions are coming under increasing stress.
Table 20: Concerns over traditional wastewater treatment of fracking fluid Treatment method Concern Dumping tainted water into ponds and rivers
Coming under increasing stakeholder attack and stringent regulation
Recycling wastewater for non-potable uses
A salty, contaminated sludge by-product can be used for de-icing roads or suppressing dust
Injecting it underground in “disposal wells”
Coming under increasing stakeholder attack and stringent regulation Not permitted in certain areas and/or the geological terrain (e.g. Marcellus shale) makes piping water over long distances unviable
Treatment by municipalities Lack of appropriate equipment or capacity of many municipalities for additional treatment.
Fluid spill action plans Lack of disclosure Lack of regulation enforcing spill response plans
Source: BofA Merril Lynch Global Research
Water treatment, a multi-billion-dollar opportunity The market for the wastewater treatment of shale gas wells could be worth tens of billions of dollars over the coming years. The billions of gallons of contaminated water should create significant long-term opportunities for companies involved in wastewater treatment solutions such as bag filters, combination, chemical precipitation, distillation, electric coagulation, membrane filtration, desalination and mobile treatment units (MTUs). Given the estimated life of shale plays, this market could reach US$2-4bn per year in the coming years.
Casing is typically hollow steel pipe used to line the inside of the drilled hole (wellbore) and is essential for protection of groundwater and aquifers in a drilling operation Cementing is the process of placing a cement sheath around casing strings
Stricter HSE regulation will make wastewater treatment risks a multi-billion-dollar opportunity
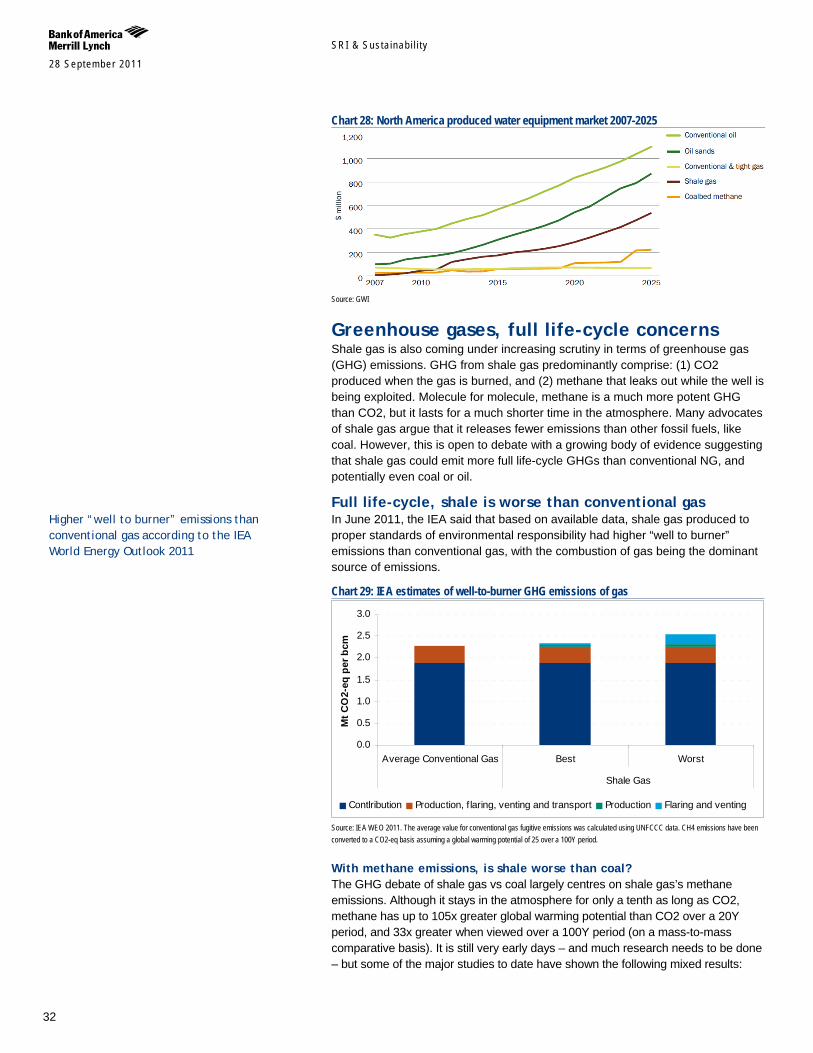
SRI & Susta inab i l i ty 28 September 2011
32
Chart 28: North America produced water equipment market 2007-2025
Source: GWI
Greenhouse gases, full life-cycle concerns Shale gas is also coming under increasing scrutiny in terms of greenhouse gas (GHG) emissions. GHG from shale gas predominantly comprise: (1) CO2 produced when the gas is burned, and (2) methane that leaks out while the well is being exploited. Molecule for molecule, methane is a much more potent GHG than CO2, but it lasts for a much shorter time in the atmosphere. Many advocates of shale gas argue that it releases fewer emissions than other fossil fuels, like coal. However, this is open to debate with a growing body of evidence suggesting that shale gas could emit more full life-cycle GHGs than conventional NG, and potentially even coal or oil.
Full life-cycle, shale is worse than conventional gas In June 2011, the IEA said that based on available data, shale gas produced to proper standards of environmental responsibility had higher “well to burner” emissions than conventional gas, with the combustion of gas being the dominant source of emissions.
Chart 29: IEA estimates of well-to-burner GHG emissions of gas
0.0
0.5
1.0
1.5
2.0
2.5
3.0
Average Conventional Gas Best Worst
Shale Gas
Mt C
O2-
eq p
er b
cm
Contlribution Production, f laring, venting and transport Production Flaring and venting
Source: IEA WEO 2011. The average value for conventional gas fugitive emissions was calculated using UNFCCC data. CH4 emissions have been converted to a CO2-eq basis assuming a global warming potential of 25 over a 100Y period.
With methane emissions, is shale worse than coal? The GHG debate of shale gas vs coal largely centres on shale gas’s methane emissions. Although it stays in the atmosphere for only a tenth as long as CO2, methane has up to 105x greater global warming potential than CO2 over a 20Y period, and 33x greater when viewed over a 100Y period (on a mass-to-mass comparative basis). It is still very early days – and much research needs to be done – but some of the major studies to date have shown the following mixed results:
Higher “well to burner” emissions than conventional gas according to the IEA World Energy Outlook 2011

SRI & Susta inab i l i ty 28 September 2011
33
The Council of Scientific Society Presidents calls for full life-cycle analysis – in May 2009 the CSPP, an umbrella organisation that represents 1.4mn scientists, urged caution on developing shale gas without a better scientific basis for the policy. It noted that shale gas might actually aggravate global warming, rather than mitigate it. They suggested that any analysis of GHG emissions should encompass full life-cycle GHGs.
EIA says shale emissions are slightly higher than conventional gas According to June 2011 analysis by the EIA, the average emissions of shale gas (including activities specific to it) are 3.5% higher in the best case (flaring the gas) than the equivalent figure for conventional gas – and 12% higher in the worst case (venting the gas).
Cornell study says shale has a worse GHG footprint than coal or fuel oil – the study published in April 2011 in Climatic Change Letters offers the first comprehensive analysis of the life-cycle GHG footprint of shale gas. It concluded that the GHG footprint of shale gas was significantly larger than that of conventional gas, due to methane emissions with flow-back fluids and from drill-out of wells during well completion – whereas routine production and downstream methane emissions are also large, but are the same for conventional and shale gas. The study concluded that shale’s footprint is worse than those of coal and fuel oil when viewed for the integrated 20Y period after emission. On a 100Y integrated time frame, this analysis finds shale gas comparable to coal and worse than fuel oil.
A Carnegie Mellon study said a shift to shale could cut GHGs by 50% The August 2011 study focused on shale gas from the Marcellus formation and found that while current techniques do result in higher methane emissions than from conventional gas wells, the extra methane only increases life-cycle GHG emissions from well to burner tip by 3% on average. It argues that this is the case because the life-cycle emissions are dominated by combustion, which accounts for 74% of total emissions. As a result, when burned in a combined cycle power plant to generate electricity, shale gas results in emissions per kWh that are 20-50% lower than those from coal, depending on equipment and sources. The CMU team found shale gas and LNG roughly comparable, with both emitting around a quarter less CO2 equivalent per BTU than diesel fuel.
Worldwatch/Deutsche Bank finds NG beats coal by 47% The study considered both top-down and bottom-up views of shale gas emissions. They found that the emissions from gas-fired power plants beat coal-fired plants by an average of 47%, even after taking into account higher EPA estimates for methane venting during gas production (and using the IPCC’s 100-year global warming potential for methane of 25x).
Methane studies have come under attack The high impact of methane studies have come in for some criticism from industry and some stakeholders for a number of reasons including incorrect assumptions about the quantity of methane leaked, the residence time of methane in the atmosphere and the GHG warming potential estimates used.
Blow-out safety concerns In light of the GoM disaster, shale gas drilling has raised concerns about wells suffering blowouts – at drilling depths of 1-4 miles – and spilling thousands of gallons of fracking fluids into the surrounding environment, which could heighten concerns about the safety of fracking.
Much depends on green completion - companies’ ability to prevent methane escaping into the atmosphere via venting, flaring or escaping from loose gas distribution pipe fittings
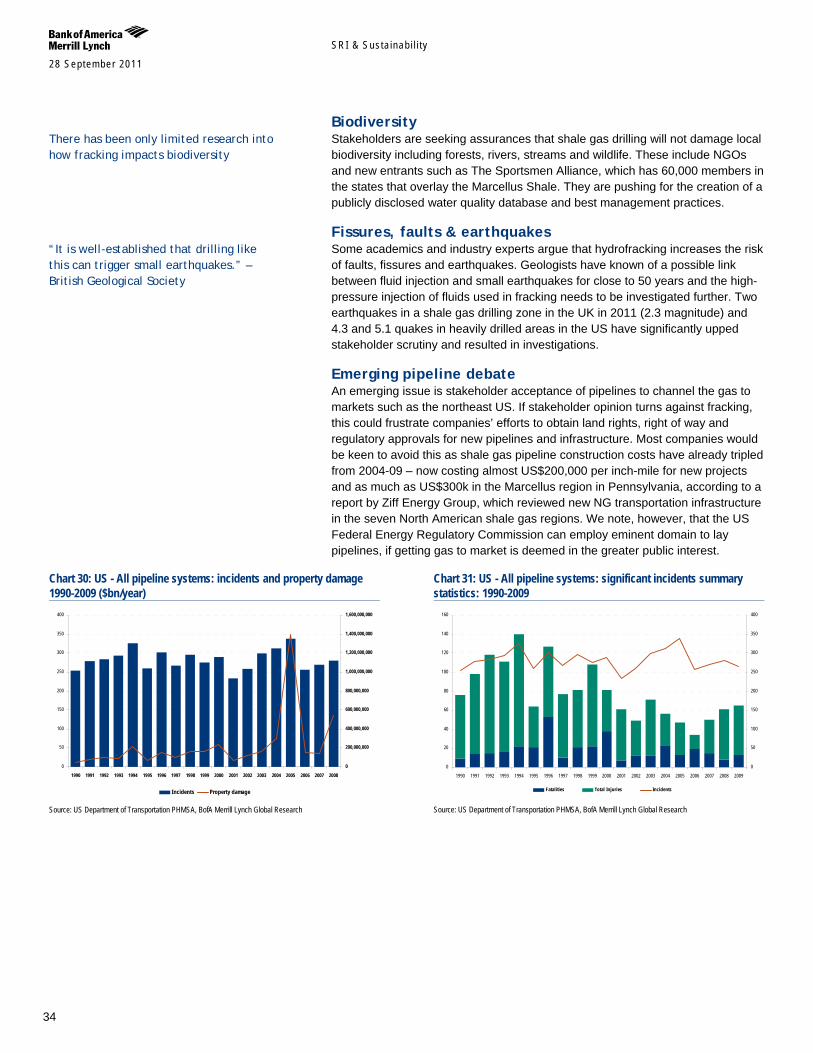
SRI & Susta inab i l i ty 28 September 2011
34
Biodiversity Stakeholders are seeking assurances that shale gas drilling will not damage local biodiversity including forests, rivers, streams and wildlife. These include NGOs and new entrants such as The Sportsmen Alliance, which has 60,000 members in the states that overlay the Marcellus Shale. They are pushing for the creation of a publicly disclosed water quality database and best management practices.
Fissures, faults & earthquakes Some academics and industry experts argue that hydrofracking increases the risk of faults, fissures and earthquakes. Geologists have known of a possible link between fluid injection and small earthquakes for close to 50 years and the high-pressure injection of fluids used in fracking needs to be investigated further. Two earthquakes in a shale gas drilling zone in the UK in 2011 (2.3 magnitude) and 4.3 and 5.1 quakes in heavily drilled areas in the US have significantly upped stakeholder scrutiny and resulted in investigations.
Emerging pipeline debate An emerging issue is stakeholder acceptance of pipelines to channel the gas to markets such as the northeast US. If stakeholder opinion turns against fracking, this could frustrate companies’ efforts to obtain land rights, right of way and regulatory approvals for new pipelines and infrastructure. Most companies would be keen to avoid this as shale gas pipeline construction costs have already tripled from 2004-09 – now costing almost US$200,000 per inch-mile for new projects and as much as US$300k in the Marcellus region in Pennsylvania, according to a report by Ziff Energy Group, which reviewed new NG transportation infrastructure in the seven North American shale gas regions. We note, however, that the US Federal Energy Regulatory Commission can employ eminent domain to lay pipelines, if getting gas to market is deemed in the greater public interest.
There has been only limited research into how fracking impacts biodiversity
“It is well-established that drilling like this can trigger small earthquakes.” – British Geological Society
Chart 30: US - All pipeline systems: incidents and property damage 1990-2009 ($bn/year)
0
50
100
150
200
250
300
350
400
1990 1991 1992 1993 1994 1995 1996 1997 1998 1999 2000 2001 2002 2003 2004 2005 2006 2007 2008
0
200,000,000
400,000,000
600,000,000
800,000,000
1,000,000,000
1,200,000,000
1,400,000,000
1,600,000,000
Incidents Property damage Source: US Department of Transportation PHMSA, BofA Merrill Lynch Global Research
Chart 31: US - All pipeline systems: significant incidents summary statistics: 1990-2009
0
20
40
60
80
100
120
140
160
1990 1991 1992 1993 1994 1995 1996 1997 1998 1999 2000 2001 2002 2003 2004 2005 2006 2007 2008 2009
0
50
100
150
200
250
300
350
400
Fatalities Total Injuries Incidents
Source: US Department of Transportation PHMSA, BofA Merrill Lynch Global Research

SRI & Susta inab i l i ty 28 September 2011
35
Greater scrutiny, costlier regulation Shale gas has developed one step ahead of regulation Shale gas has rapidly become a key element of energy policy. In the US, it has grown from only 1% of natural gas supply in 2001 to upwards of 20% today and is set to rise to as much as two-thirds by 2035. Other key markets outside the US are now looking to shale as a long-term solution. However, the regulators have had trouble keeping up, with shale gas’s rapid development being criticised by stakeholders because of the lack of comprehensive, uniform or strict regulation. Shale gas is subject to a patchy network of state-by-state or country-by-country requirements, restrictions, or frequent lack thereof across the globe.
US and EU set to tighten regulation A number of local jurisdictions, as well as France, have recently passed moratoriums or more stringent restrictions on fracking and shale gas drilling. We expect this process to continue in the US, which is likely to see much stricter regulation on the back of the Environmental Protection Agency’s (EPA) ongoing investigation into shale gas due for 2012-14, and the recent decision of the Securities and Exchange Commission (SEC) to seek greater disclosure and subpoena companies. The European Commission is also looking to develop EU-wide rules on shale gas. We anticipate that other markets will follow the US and EU efforts and that we will see much stricter regulation on a 1-3 year time horizon.
Higher cost and tightened supply At the very least, we expect to see much more in the way of regulation along the lines of recent decisions to require energy companies to disclose the chemicals used in the fracking process. We also anticipate regulations covering the treatment of the fluids used to drill a well, tighter restrictions on where companies get water, stricter standards for the casing that lines a well hole and a greater government role in water monitoring. While it is too early to estimate the cost of such regulation, producers can expect additional costs arising from red tape, increased drilling costs, delays in production, greener practices, greater disclosure, and potential litigation and regulatory risks associated with fracking. This could be margin make-or-break for higher-cost shale fields and could result in tightened shale gas supply.
US: stricter regulation by 2012-14 As things stand today, there is lack of comprehensive, uniform or strict regulation – with shale gas also subject to a number of exemptions from relevant environmental legislation:
Natural gas E+P falls under a range of regulators with competing agendas, resulting in a lack of comprehensive industry oversight. Regulations vary across US states and different parts of the drilling process are subject to different state and federal regulations, including treatment and disposal of potentially contaminating tracking fluid, which is subject to varying federal regulations depending on whether it is above or below ground.
The US Federal Energy Policy Act (2005) exempts fluids – water and chemicals – used in natural gas extraction fracking from the protections contained in the Clean Air Act, Clean Water Act, and the Safe Drinking Water Act (SDWA). This means that shale gas drillers do not have to disclose what chemicals they use. This decision was made after a 2004 EPA study which declared fracking safe, a move which was criticised by certain stakeholders
Shale gas is slipping through the cracks on US HSE regulations, either via competing agendas or exemptions
SRI & Susta inab i l i ty 28 September 2011
36
as being politically motivated by pro-drilling advocates, arguing that the scope of the EPA’s review was too narrow. But, as a result, shale gas drillers do not have to disclose what chemicals they use.
Feds support HSE-friendly shale gas development The Obama administration in its March 2011 “Blueprint for a Secure Energy Future” opened the door to a supportive view on NG as an increasingly important source of US energy needs. The administration is taking several steps to proactively address concerns relating to shale gas development, such as:
Tasking the Secretary of Energy Advisory Board (SEAB) with establishing a multi-stakeholder subcommittee to examine fracking issues;
Identifying steps that can be taken to improve the safety and environmental performance of fracking; and
Developing consensus-recommended advice to the agencies on practices for shale extraction to ensure the protection of public health and the environment.
In addition to the Blueprint, the federal administration is calling on industry to be more transparent about the use of fracking chemicals, particularly on federal lands.
Supporters of NG also introduced a bipartisan bill in April 2011 to encourage natural gas use, the New Alternative Transportation to Give Americans Solutions (NAT GAS) Act.
EPA is targeting pollution from shale gas In April 2011, the EPA targeted pollution from gas drilling, particularly fracking. The proposed regulations are designed to eliminate most releases of smog- and soot-forming pollutants from these wells. New controls on storage tanks, transmission pipelines and other equipment – at both oil and gas drilling sites on land – would reduce by a quarter the amounts of cancer-causing air pollution and methane, the main ingredient in natural gas, but also one of the most powerful contributors to global warming. The rules could even save companies money as they could sell the gas they are forced to collect.
FRAC Act could amend safe water exemptions There has been pressure to repeal the 2005 regulatory exemption under the Energy Policy Act of 2005 and in June 2009 two identical bills named the “FRAC Act” (Fracturing Responsibility and Awareness of Chemicals Act) were introduced to both the US House and the Senate. These bills are designed to amend the Safe Drinking Water Act and would eliminate fracking’s current exemption. This would allow the EPA to reclassify producing wells as injection wells, placing them under federal jurisdiction in states without approved UIC (Underground Injection Control) programs. The bills would also require the energy industry to disclose what chemicals are being used.
Many cities and states have already acted Several North American cities, states and provinces have begun to take action on fracking including Buffalo, Colorado, Maryland, New York City and State, Ohio, Pennsylvania, Pittsburgh, Quebec, Texas, West Virginia and Wyoming, among others. The measures undertaken have ranged from fracking impact studies to disclosure of fracking chemicals to outright bans or moratoriums on fracking.
”We are encouraging the exploration of new frontiers of production and of new ways to safely make use of domestic assets like our vast reserves of natural gas.” – Blueprint for a Secure Energy Future
State by state regulation overview (http://FracFocus.org/regulations-state)

SRI & Susta inab i l i ty 28 September 2011
37
Many local jurisdictions are also looking for compensation in the form of taxes or impact or severance fees for extracting or “severing” NG from where drilling takes place, in order to offset local infrastructure and/or environmental costs.
EPA study 2012-14 will set tone for global HSE debate Congress has also asked the US EPA to study the safety of fracking technology and the potential dangers to groundwater. The purpose of the EPA study is to examine the effects of fracking on the water supply, specifically for human consumption. The research aims to examine the full scope of the water pathway as it moves through the hydraulic fracturing process, including water that is used for the construction of the wells, the fracturing mixture, and subsequent removal and disposal. In June 2011, the Scientific Advisory Board identified seven sites for investigation. EPA investigators will study places where fracking has already taken place and look for any impact on residential water wells and other sources of drinking water. Another part of the study involves monitoring the fracking process throughout the life cycle of a well. Initial research should be completed by the end of 2012, and the EPA’s Hydraulic Fracturing Report is expected to be completed in 2014.
Study will clarify the HSE debate The study is likely to go some way towards clarifying some of the HSE issues around shale oil for the US market. The EPA recently said that because fracking occurs thousands of feet below the surface, there is a certain level of protection against contamination of groundwater. Nonetheless, the EPA addressed the volume of water used in fracking and said it would evaluate the integrity of some individual wells as part of a high-profile study. The EPA claims that the section that would be amended in the Safe Drinking Water Act is flexible, in that it defers the regulation of fracturing and drilling to the state. The EPA also says that since most states currently have regulations on fracturing, they would most likely agree with the state’s policy and there would not be much change.
SEC investigation, increased scrutiny of operations Oil & gas companies involved in shale operations, and oilfield services companies providing fracking services can expect increased scrutiny from the US Securities and Exchange Commission (SEC). The SEC is seeking greater disclosure from companies and has also issued subpoenas, indicating that a more formal investigation is under way. While it is still early days, the effects could be significant, especially given that the potential risks associated with fracking affect almost all O&G development companies (which use fracking with conventional wells, generally using lower injection volumes).
Staff comments on filings seeking greater disclosure The SEC’s Division of Corporation Finance issued comment letters over the summer of 2011 seeking detailed disclosures regarding hydraulic fracturing and shale industry risks and the amount and specific nature of the hydraulic fracturing chemicals used.
Table 21: SEC staff comments seeking shale disclosure Factor Disclosure Hydraulic Fracturing Activities •Location of hydraulic fracturing activities;
•Acreage subject to hydraulic fracturing activities; •Percentage of reserves subject to hydraulic fracturing activities; •Percentage of services involved in hydraulic fracturing; •Anticipated costs and funding, including any capital expenditures, associated with the hydraulic fracturing activities; •Any incidents, citations or suits related to hydraulic fracturing activities for environmental concerns, including the circumstances, any penalties and the response to these matters;
“Our research will be designed to answer questions about the potential impact of hydraulic fracturing on human health and the environment… The study will be conducted through a transparent, peer-reviewed process, with significant stakeholder input." - Paul Anastas, Assistant Administrator for EPA's Office of Research and Development
Industry had been urging the EPA to keep the study narrowly focused
SRI & Susta inab i l i ty 28 September 2011
38
Table 21: SEC staff comments seeking shale disclosure Factor Disclosure Steps taken to minimize any potential environmental impact of hydraulic fracturing activities
•Established steps to ensure that drilling, casing and cementing adhere to known best practices; •Real time monitoring of the rate and pressure of the fracturing treatment for any abrupt rate or pressure change; •Evaluation of the environmental impact of additives to the fracturing fluid; •Any effort to minimize the use of water and/or dispose of it in a way that minimizes the impact to nearby surface water; and •Any established remediation plans or procedures to deal with the environmental impact that would occur in the event of a spill or leak;
Consequences of the loss of hydrocarbon containment during drilling
•Consequences
All material information regarding potential liability in connection with an environmental contamination related to hydraulic fracturing activities
•Applicable policy limits related to insurance coverage; •Related indemnification obligations and those of customers, if applicable; •Insurance coverage with respect to any liability related to any resulting negative environmental effects; and Insured risks for the hydraulic fracturing activities; and •Report (provided to the Staff supplementally) detailing for representative wells in each of the material resource plays where the company operates all chemicals used in the hydraulic fracturing fluid formulation/mixture, the volume/concentration of the chemicals and total amounts utilized.
Source: Company disclosures, BofA Merrill Lynch Global disclosure
Subpoenas: a more formal investigation could be under way The SEC has also issued subpoenas to certain shale producers requesting information pertaining to proved reserve estimates from shale gas wells and the actual productivity of producing shale wells. A number of companies have disclosed receipt of the subpoenas from the SEC, revealing that they request information pertaining to proved developed producing shale gas wells, reserve estimates and well economics. The SEC apparently stated that its investigation is a fact-finding inquiry and noted that the investigation arose out of recent media reports questioning the projected decline curves and economics of shale gas wells.
Europe: regulation before large-scale drilling To date, there has not been any significant regulation on shale gas in the EU, except for an indirect mention in the Second Strategic Energy Review. The situation is complicated by the fact that EU petroleum legislation makes no clear mention of unconventional gas, which means it is not at all clear how the industry will be regulated and on what basis. However, given the current tenor of the debate with stakeholders and the European Commission’s track record in terms of regulating new HSE issues, we see a growing likelihood that the EC itself – as well as many EU member states – will look to create a stringent regulatory framework before shale gas drilling and operations begin.
Energy Commissioner favours EU-wide rules Brussels intends to draft EU-wide rules on shale gas reserves, according to September 2011 comments by Energy Commissioner Guenther Oettinger. Mr Oettinger said that he was seeking environmental protection standards that enable member states to grant licences within a clear framework – which he felt were best achieved by European common standards. He suggested that the Commission put proposals to member states as early as spring 2012.
EU parliament looking to an Energy Quality Directive A highly influential member of the European parliament – German Social Democrat MEP Jo Leinen, who chairs the EU parliament’s main body overseeing environmental regulation – has proposed a new directive that would penalise or even ban the exploitation of shale gas. There are no details as to what such an “energy quality” directive would look like, but, based on other examples, it could impose effective limits or financial penalties on shale gas use, depending on the HSE consequences. Leinen has the power to bring forward proposals that could make it into law within a few years.
"We need to be looking much more carefully at shale gas, and at the consequences of pursuing it" Jo Leinen, June 2011
SRI & Susta inab i l i ty 28 September 2011
39
Industry is likely to be strongly opposed Plans for a Directive on energy quality are likely to be resisted by the O&G industry, which is lobbying for shale gas to be accepted as a "green" alternative to fossil fuels and even renewables. For instance, a European Gas Advocacy Forum has been pushing the argument that gas could deliver GHG savings at lower cost than adopting renewables.
Debate could be influenced by Poland, which has EU leadership for H211 The EU shale gas debate could, however, be influenced in the short term by Poland having taken over the rotating EU presidency for H2 11 for the first time. Poland is one of the EU’s strongest shale gas advocates – and has argued that shale development could be crucial to EU energy security, especially in the wake of stalled nuclear development. As such, it is likely to be staunchly opposed to EU-level regulation of the nascent EU shale gas sector. We note that stakeholders have expressed some concerns over the lack of reference to climate change in Poland’s EU presidency programme. Poland recently blocked proposals to toughen the EU’s CO2 emissions target from 20% to 25% in 2020 (vs. 1990 levels), largely because of its dependence on coal.
Increasing debate and action at country level At individual country level, we are seeing a vigorous dialogue and debate on shale gas with views ranging from the imposition of a complete ban on fracking in France to a pro-active push for development in Poland, along with everything in between. As shale gas attracts increased mainstream coverage, we are also seeing a ratcheting-up of stakeholder scrutiny with local communities, NGOs and political parties all taking views.
China: looking to spur development China, which has some of the world’s largest shale gas deposits, is drafting a five-year plan to 2015 to develop its reserves. National Energy Administration officials have said that the government may offer financial support and tax incentives to encourage domestic explorers, such as PetroChina, to extract shale gas and to help China reduce its reliance on coal and imported oil.
Early days on HSE Given the relative newness of fracking in China, the Ministry of Environmental Protection has yet to comprehensively study the potential environmental impact of shale gas. To date, the Ministry of Environmental Protection’s Pollution Control Department has examined only environmental impacts at shallow depths. This could become a regulatory and cost issue, as the gas in some of China’s key deposits (eg, Sichuan and Tarim basins) is found at depths of 2-4 miles, rather than 1-2 miles in the US, and the Tarim basin is in an arid desert region, posing challenges for already strained groundwater resources.
Cost impact of greater regulations It is too early to estimate the potential cost burden of regulation as we do not yet know the full extent of what will be regulated. However, likely (if not certain) additional cost burdens across a number of areas include:
Additional red tape
Lengthier process for receiving drilling permits
Increased drilling costs (eg, changing the well casing from steel to concrete)
SRI & Susta inab i l i ty 28 September 2011
40
Delays in production
Tightened NG supply
Potential litigation and regulatory risks associated with fracking
Industry’s positioning Industry is, as one might expect, warning of the dangers of increased HSE regulation. For instance, according to research conducted by the industry trade group Independent Petroleum Association of America, regulations such as the US FRAC Act, if passed, could:
Add nearly US$100,000 - US$150,000 in costs to each well.
Remove nearly 245bcf of supply each year, representing 5% of the existing shale gas production.
Force 57% of domestic oil and 35% of domestic gas wells to cease production, costing the federal government US$4bn in revenue, while state treasuries would lose out on US$785mn in state severance and income taxes.
Cut domestic energy production by 183,000bpd and 245bcf of natural gas every year.
Industry must engage with stakeholders If it is to maintain its licence to operate, industry needs to be pro-active and stay one step ahead the regulator, adopting such best practice measures as: safeguarding the quality and quantity of regional surface and groundwater resources through sound wellbore construction practices; sourcing fresh-water alternatives and recycling water for reuse as far as is practicably possible; measuring and disclosing water to reduce the environmental impact; supporting the development of fracturing fluid additives with the least environmental risks; and supporting the disclosure of fracturing fluid additives.
Traditional position is no longer tenable In addition to arguing the energy security, job creation and economic development potential of shale gas, the O&G industry has largely argued that fracking is relatively safe, pointing out that:
Fracking has been used commercially for 60+ years;
There have been no instances of contaminated drinking water in that time;
Fracking takes place at depths of up to 10,000 feet (vs water supplies which are generally 500 feet below ground); and
It has been said to be so by the US EPA, the Groundwater Protection Council and the Interstate Oil and Gas Compact Commission.
Arguments that current regulation is sufficient Industry bodies, such as the Independent Petroleum Association of America, have said that they believe that states already sufficiently regulate fracking and that they see potential changes such as the FRAC Act as an additional layer of regulation that is unnecessary and cumbersome. They have also been uneasy about measures which would force them to disclose the chemical constituents
SRI & Susta inab i l i ty 28 September 2011
41
and formulas used in the fracking process, arguing that such information is a trade secret. Some industry lobbies have gone further, with Energy in Depth saying that the new regulations could cause US domestic gas production to drop by 245bcf/year, along with US$4bn in lost revenue to the federal government.
Adopting a stakeholder-friendly approach makes business sense More recently, industry appears to be taking on board concerns raised by stakeholders and regulators, saying that the benefits of shale gas need to be balanced against environmentally responsible development. We saw this with the September 2011 communiqué of the National Petroleum Council (NPC), which stated that in order to realize the benefits of these larger natural gas and oil resources:
Safe, responsible, and environmentally acceptable production and delivery must be ensured in all circumstances.
Resource development must include effective regulation and a commitment from industry and regulators to continually improving practices to eliminate or minimize environmental risk. These steps are necessary for public trust.
Access to available resources must not be undermined by safety and environmental incidents, so all industry participants must continually improve their environmental, safety, and health practices, preserving the benefits of greater access for the industry, consumers, and all other stakeholders.
Moving to HSE best practice on shale gas In the absence of well-formulated regulations in the US or globally, companies need to pro-actively apply a combination of best practice standards, operational competence & development and new technologies. This is likely to increase costs, but in the long term it should ensure that a licence is gained to operate and that gas is available for sale, thus increasing revenues.
Voluntary disclosure on chemicals In the first instance, companies can go some way towards assuaging stakeholder concerns by voluntarily disclosing the chemicals they use. The most important initiative in this regard is the www.FracFocus.org website, a US registry where companies disclose the chemical additives used in the hydraulic fracturing process. The website was launched by the Ground Water Protection Council (GWPC) and the Interstate Oil and Gas Compact Commission (IOGCC), with funding from the Department of Energy.
The website will show chemical additives used in the hydraulic fracturing process on a well-by-well basis, for wells drilled starting in 2011.
Participating energy companies voluntarily upload information on the website about the chemical additives and the proportion used in each hydraulic fracturing job, using a standard template.
The website gives stakeholders public access to comprehensive information about wells nationwide. Search fields allow users to identify wells by location, operator, state, county and well identification (API) number.
The IOGCC represents the governors of more than 30 O&G producing states, with a mission to conserve domestic resources while ensuring environmental protection The GWPC comprises state water and underground injection control agencies, with a mission to protect and conserve groundwater
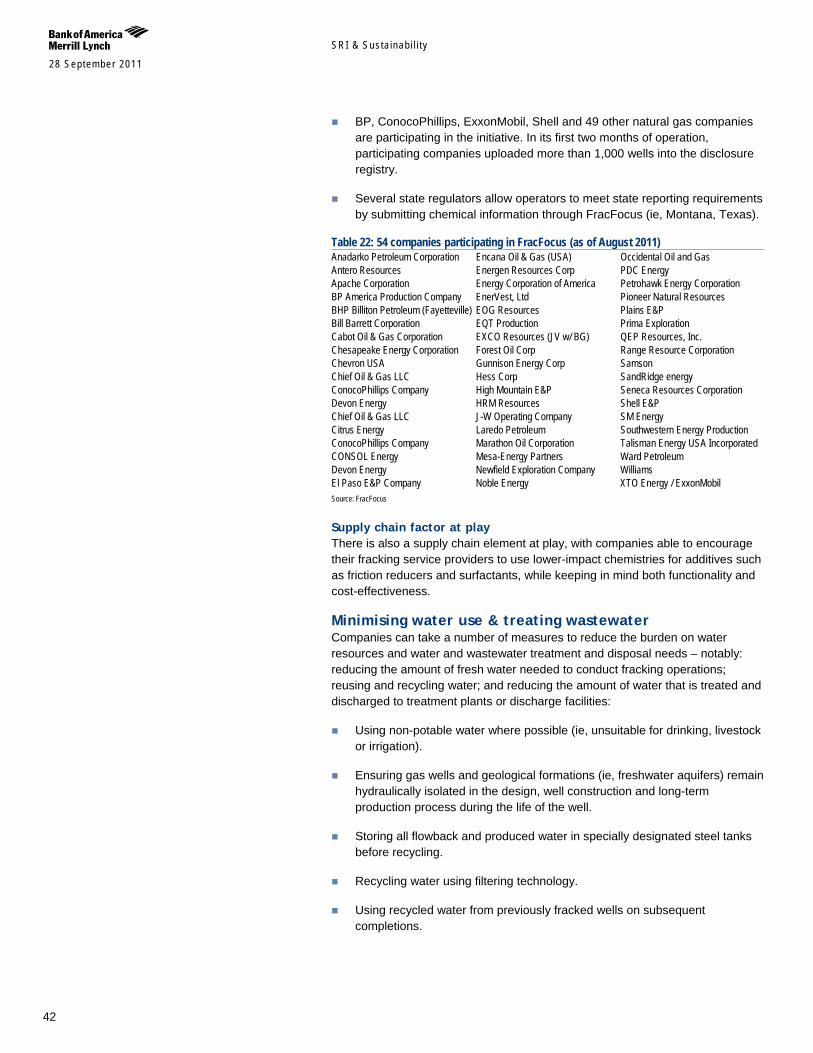
SRI & Susta inab i l i ty 28 September 2011
42
BP, ConocoPhillips, ExxonMobil, Shell and 49 other natural gas companies are participating in the initiative. In its first two months of operation, participating companies uploaded more than 1,000 wells into the disclosure registry.
Several state regulators allow operators to meet state reporting requirements by submitting chemical information through FracFocus (ie, Montana, Texas).
Table 22: 54 companies participating in FracFocus (as of August 2011) Anadarko Petroleum Corporation Encana Oil & Gas (USA) Occidental Oil and Gas Antero Resources Energen Resources Corp PDC Energy Apache Corporation Energy Corporation of America Petrohawk Energy Corporation BP America Production Company EnerVest, Ltd Pioneer Natural Resources BHP Billiton Petroleum (Fayetteville) EOG Resources Plains E&P Bill Barrett Corporation EQT Production Prima Exploration Cabot Oil & Gas Corporation EXCO Resources (JV w/ BG) QEP Resources, Inc. Chesapeake Energy Corporation Forest Oil Corp Range Resource Corporation Chevron USA Gunnison Energy Corp Samson Chief Oil & Gas LLC Hess Corp SandRidge energy ConocoPhillips Company High Mountain E&P Seneca Resources Corporation Devon Energy HRM Resources Shell E&P Chief Oil & Gas LLC J-W Operating Company SM Energy Citrus Energy Laredo Petroleum Southwestern Energy Production ConocoPhillips Company Marathon Oil Corporation Talisman Energy USA Incorporated CONSOL Energy Mesa-Energy Partners Ward Petroleum Devon Energy Newfield Exploration Company Williams El Paso E&P Company Noble Energy XTO Energy / ExxonMobil Source: FracFocus
Supply chain factor at play There is also a supply chain element at play, with companies able to encourage their fracking service providers to use lower-impact chemistries for additives such as friction reducers and surfactants, while keeping in mind both functionality and cost-effectiveness.
Minimising water use & treating wastewater Companies can take a number of measures to reduce the burden on water resources and water and wastewater treatment and disposal needs – notably: reducing the amount of fresh water needed to conduct fracking operations; reusing and recycling water; and reducing the amount of water that is treated and discharged to treatment plants or discharge facilities:
Using non-potable water where possible (ie, unsuitable for drinking, livestock or irrigation).
Ensuring gas wells and geological formations (ie, freshwater aquifers) remain hydraulically isolated in the design, well construction and long-term production process during the life of the well.
Storing all flowback and produced water in specially designated steel tanks before recycling.
Recycling water using filtering technology.
Using recycled water from previously fracked wells on subsequent completions.
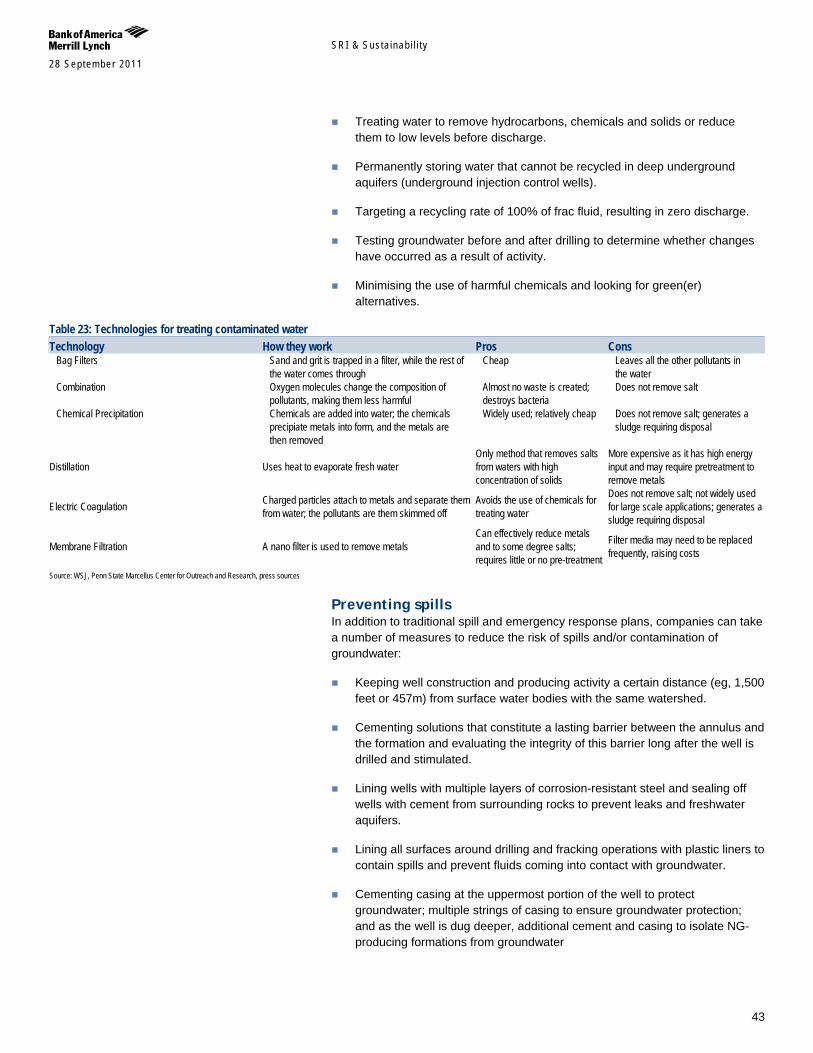
SRI & Susta inab i l i ty 28 September 2011
43
Treating water to remove hydrocarbons, chemicals and solids or reduce them to low levels before discharge.
Permanently storing water that cannot be recycled in deep underground aquifers (underground injection control wells).
Targeting a recycling rate of 100% of frac fluid, resulting in zero discharge.
Testing groundwater before and after drilling to determine whether changes have occurred as a result of activity.
Minimising the use of harmful chemicals and looking for green(er) alternatives.
Table 23: Technologies for treating contaminated water Technology How they work Pros Cons
Bag Filters Sand and grit is trapped in a filter, while the rest of the water comes through
Cheap Leaves all the other pollutants in the water
Combination Oxygen molecules change the composition of pollutants, making them less harmful
Almost no waste is created; destroys bacteria
Does not remove salt
Chemical Precipitation Chemicals are added into water; the chemicals precipiate metals into form, and the metals are then removed
Widely used; relatively cheap Does not remove salt; generates a sludge requiring disposal
Distillation Uses heat to evaporate fresh water Only method that removes salts from waters with high concentration of solids
More expensive as it has high energy input and may require pretreatment to remove metals
Electric Coagulation Charged particles attach to metals and separate them from water; the pollutants are them skimmed off
Avoids the use of chemicals for treating water
Does not remove salt; not widely used for large scale applications; generates a sludge requiring disposal
Membrane Filtration A nano filter is used to remove metals Can effectively reduce metals and to some degree salts; requires little or no pre-treatment
Filter media may need to be replaced frequently, raising costs
Source: WSJ, Penn State Marcellus Center for Outreach and Research, press sources
Preventing spills In addition to traditional spill and emergency response plans, companies can take a number of measures to reduce the risk of spills and/or contamination of groundwater:
Keeping well construction and producing activity a certain distance (eg, 1,500 feet or 457m) from surface water bodies with the same watershed.
Cementing solutions that constitute a lasting barrier between the annulus and the formation and evaluating the integrity of this barrier long after the well is drilled and stimulated.
Lining wells with multiple layers of corrosion-resistant steel and sealing off wells with cement from surrounding rocks to prevent leaks and freshwater aquifers.
Lining all surfaces around drilling and fracking operations with plastic liners to contain spills and prevent fluids coming into contact with groundwater.
Cementing casing at the uppermost portion of the well to protect groundwater; multiple strings of casing to ensure groundwater protection; and as the well is dug deeper, additional cement and casing to isolate NG-producing formations from groundwater

SRI & Susta inab i l i ty 28 September 2011
44
Storing all completion fluid and flowback/formation water in lined tanks; and placing special protective barriers on the well pad under lined storage tanks and where trucks deliver fluids.
Ideal cementing solutions will be able to withstand higher wellbore pressures due to stimulation and be able to “self heal”, or automatically close cracks in the cement sheath when exposed to hydrocarbons.
Limiting gas venting Fracturing fluids which return from the well with the gas can be separated from the gas in temporary facilities during the completion phase. Separated gas can be fed into a gathering system so that it can be used. Flaring is preferable to venting if the gas cannot be used.
Engaging with stakeholders, transparency is key Shale gas companies must be committed to stakeholder engagement, notably via transparency so that the general public and interested groups have the information necessary to understand the challenges, risks and benefits associated with shale gas. This is an essential part of earning and maintaining public trust and critical to establishing appropriate public policies and regulations. They also need to work with communities to seek ways to reduce the tangible or perceived negative impacts of development (eg, predevelopment planning, alternative views, etc). FracFocus is a positive example in this regard.
Investors are expecting action One reason companies need to act is that a growing body of asset owners and asset managers are engaging and targeting companies on shale gas-related HSE risks. 2010 and 2011 have seen a huge increase in shareholder resolutions at O&G companies’ AGMs on shale gas-related issues, which have achieved significant levels of support at major multinational companies and/or been withdrawn after changes in company practices. The proposals have been supported by up to several dozen investors as well as CERES (a coalition of investors and environmental groups that works with companies to improve their business practices) and broadly propose that companies:
Disclose their policies for reducing environmental and financial risks from the use of chemicals
Tackle water impacts and other environmental issues associated with fracking
Start recycling and reusing waste waters, reduce the volume and toxicity of chemicals
Ensure the integrity of well cementing by using pressure testing and other methods
Estimate and disclose the potential litigation and regulatory risks associated with hydraulic fracturing.
Table 24: Outcome of shareholder resolutions on shale gas Company Outcome Resolution filer Year Anadarko Petroleum Corporation Withdrawn in response to corporate commitments Trillium Asset Management 2011 Cabot Oil & Gas Corporation Withdrawn in response to corporate commitments New York State Common Retirement Fund 2011 Cabot Oil and Gas Vote: 36% New York State Common Retirement Fund 2010 Carrizo Oil & Gas Vote: 44% New York State Common Retirement Fund 2011
“The risks associated with unconventional shale gas extraction have the potential to negatively affect shareholder value. I urge companies working in this field to share their risk mitigation and management strategies with investors and the public.” - New York State Comptroller Thomas DiNapoli
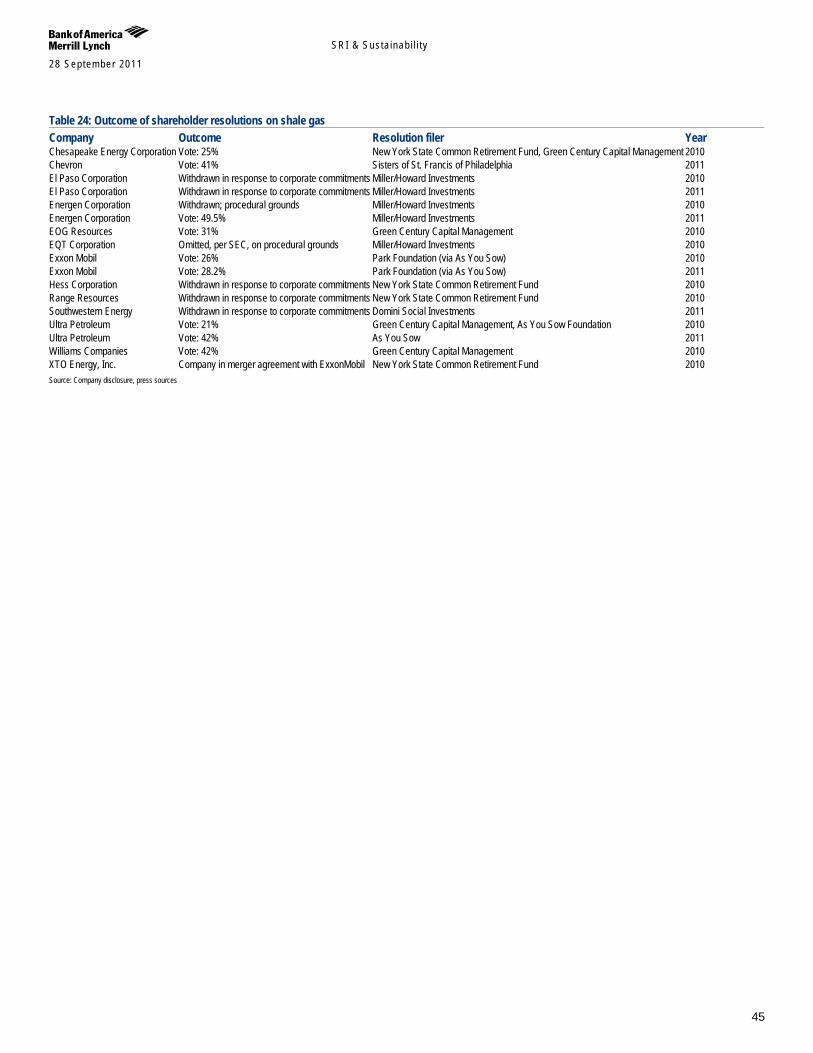
SRI & Susta inab i l i ty 28 September 2011
45
Table 24: Outcome of shareholder resolutions on shale gas Company Outcome Resolution filer Year Chesapeake Energy Corporation Vote: 25% New York State Common Retirement Fund, Green Century Capital Management 2010 Chevron Vote: 41% Sisters of St. Francis of Philadelphia 2011 El Paso Corporation Withdrawn in response to corporate commitments Miller/Howard Investments 2010 El Paso Corporation Withdrawn in response to corporate commitments Miller/Howard Investments 2011 Energen Corporation Withdrawn; procedural grounds Miller/Howard Investments 2010 Energen Corporation Vote: 49.5% Miller/Howard Investments 2011 EOG Resources Vote: 31% Green Century Capital Management 2010 EQT Corporation Omitted, per SEC, on procedural grounds Miller/Howard Investments 2010 Exxon Mobil Vote: 26% Park Foundation (via As You Sow) 2010 Exxon Mobil Vote: 28.2% Park Foundation (via As You Sow) 2011 Hess Corporation Withdrawn in response to corporate commitments New York State Common Retirement Fund 2010 Range Resources Withdrawn in response to corporate commitments New York State Common Retirement Fund 2010 Southwestern Energy Withdrawn in response to corporate commitments Domini Social Investments 2011 Ultra Petroleum Vote: 21% Green Century Capital Management, As You Sow Foundation 2010 Ultra Petroleum Vote: 42% As You Sow 2011 Williams Companies Vote: 42% Green Century Capital Management 2010 XTO Energy, Inc. Company in merger agreement with ExxonMobil New York State Common Retirement Fund 2010 Source: Company disclosure, press sources
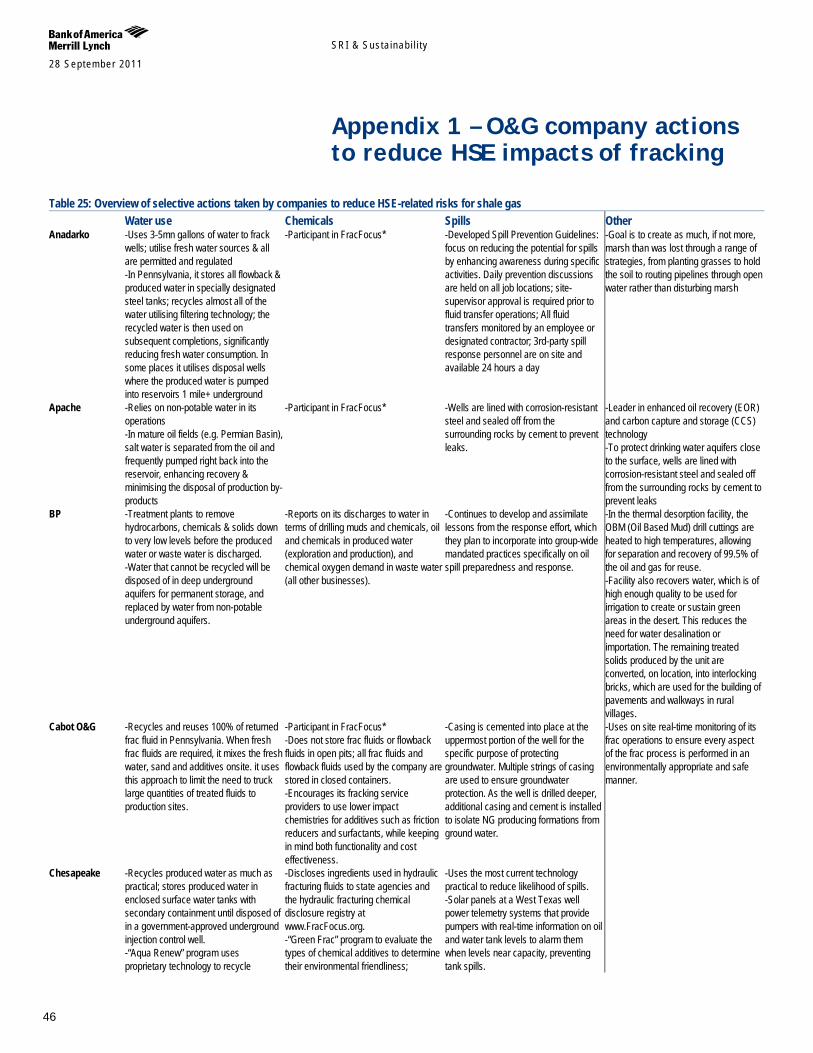
SRI & Susta inab i l i ty 28 September 2011
46
Appendix 1 – O&G company actions to reduce HSE impacts of fracking
Table 25: Overview of selective actions taken by companies to reduce HSE-related risks for shale gas Water use Chemicals Spills Other Anadarko -Uses 3-5mn gallons of water to frack
wells; utilise fresh water sources & all are permitted and regulated -In Pennsylvania, it stores all flowback & produced water in specially designated steel tanks; recycles almost all of the water utilising filtering technology; the recycled water is then used on subsequent completions, significantly reducing fresh water consumption. In some places it utilises disposal wells where the produced water is pumped into reservoirs 1 mile+ underground
-Participant in FracFocus*
-Developed Spill Prevention Guidelines: focus on reducing the potential for spills by enhancing awareness during specific activities. Daily prevention discussions are held on all job locations; site-supervisor approval is required prior to fluid transfer operations; All fluid transfers monitored by an employee or designated contractor; 3rd-party spill response personnel are on site and available 24 hours a day
-Goal is to create as much, if not more, marsh than was lost through a range of strategies, from planting grasses to hold the soil to routing pipelines through open water rather than disturbing marsh
Apache -Relies on non-potable water in its operations -In mature oil fields (e.g. Permian Basin), salt water is separated from the oil and frequently pumped right back into the reservoir, enhancing recovery & minimising the disposal of production by-products
-Participant in FracFocus*
-Wells are lined with corrosion-resistant steel and sealed off from the surrounding rocks by cement to prevent leaks.
-Leader in enhanced oil recovery (EOR) and carbon capture and storage (CCS) technology -To protect drinking water aquifers close to the surface, wells are lined with corrosion-resistant steel and sealed off from the surrounding rocks by cement to prevent leaks
BP -Treatment plants to remove hydrocarbons, chemicals & solids down to very low levels before the produced water or waste water is discharged. -Water that cannot be recycled will be disposed of in deep underground aquifers for permanent storage, and replaced by water from non-potable underground aquifers.
-Reports on its discharges to water in terms of drilling muds and chemicals, oil and chemicals in produced water (exploration and production), and chemical oxygen demand in waste water (all other businesses).
-Continues to develop and assimilate lessons from the response effort, which they plan to incorporate into group-wide mandated practices specifically on oil spill preparedness and response.
-In the thermal desorption facility, the OBM (Oil Based Mud) drill cuttings are heated to high temperatures, allowing for separation and recovery of 99.5% of the oil and gas for reuse. -Facility also recovers water, which is of high enough quality to be used for irrigation to create or sustain green areas in the desert. This reduces the need for water desalination or importation. The remaining treated solids produced by the unit are converted, on location, into interlocking bricks, which are used for the building of pavements and walkways in rural villages.
Cabot O&G -Recycles and reuses 100% of returned frac fluid in Pennsylvania. When fresh frac fluids are required, it mixes the fresh water, sand and additives onsite. it uses this approach to limit the need to truck large quantities of treated fluids to production sites.
-Participant in FracFocus* -Does not store frac fluids or flowback fluids in open pits; all frac fluids and flowback fluids used by the company are stored in closed containers. -Encourages its fracking service providers to use lower impact chemistries for additives such as friction reducers and surfactants, while keeping in mind both functionality and cost effectiveness.
-Casing is cemented into place at the uppermost portion of the well for the specific purpose of protecting groundwater. Multiple strings of casing are used to ensure groundwater protection. As the well is drilled deeper, additional casing and cement is installed to isolate NG producing formations from ground water.
-Uses on site real-time monitoring of its frac operations to ensure every aspect of the frac process is performed in an environmentally appropriate and safe manner.
Chesapeake -Recycles produced water as much as practical; stores produced water in enclosed surface water tanks with secondary containment until disposed of in a government-approved underground injection control well. -“Aqua Renew” program uses proprietary technology to recycle
-Discloses ingredients used in hydraulic fracturing fluids to state agencies and the hydraulic fracturing chemical disclosure registry at www.FracFocus.org. -“Green Frac” program to evaluate the types of chemical additives to determine their environmental friendliness;
-Uses the most current technology practical to reduce likelihood of spills. -Solar panels at a West Texas well power telemetry systems that provide pumpers with real-time information on oil and water tank levels to alarm them when levels near capacity, preventing tank spills.
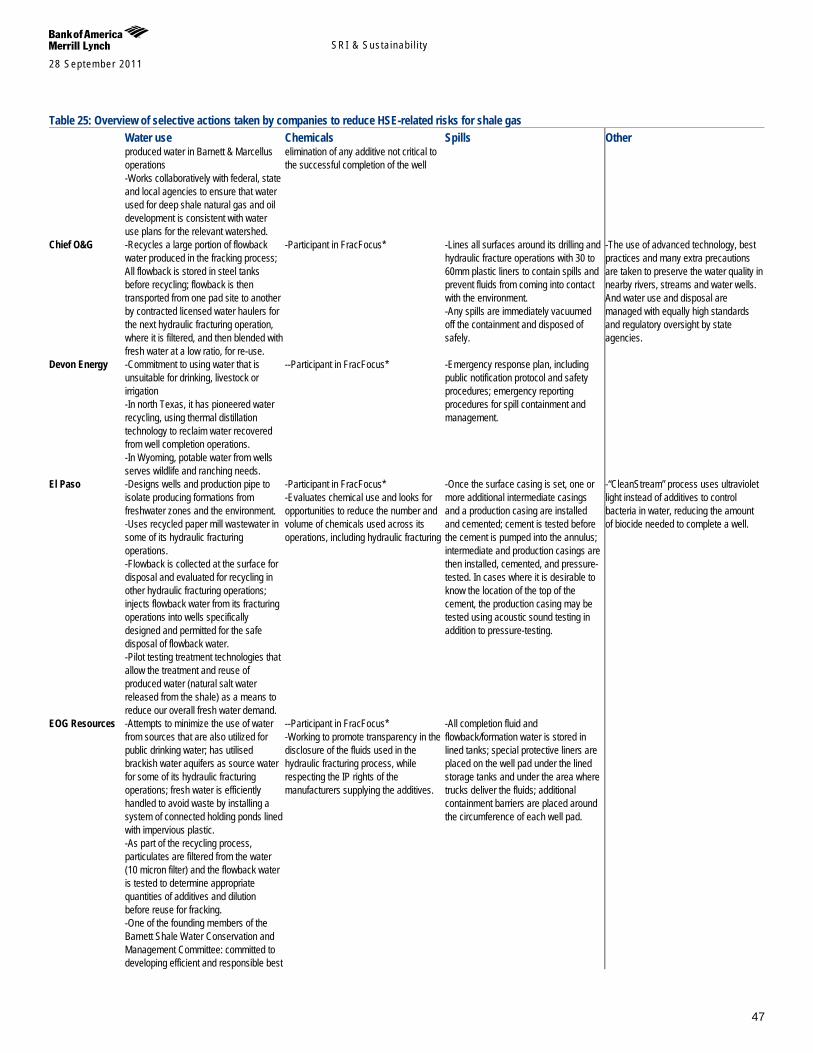
SRI & Susta inab i l i ty 28 September 2011
47
Table 25: Overview of selective actions taken by companies to reduce HSE-related risks for shale gas Water use Chemicals Spills Other
produced water in Barnett & Marcellus operations -Works collaboratively with federal, state and local agencies to ensure that water used for deep shale natural gas and oil development is consistent with water use plans for the relevant watershed.
elimination of any additive not critical to the successful completion of the well
Chief O&G -Recycles a large portion of flowback water produced in the fracking process; All flowback is stored in steel tanks before recycling; flowback is then transported from one pad site to another by contracted licensed water haulers for the next hydraulic fracturing operation, where it is filtered, and then blended with fresh water at a low ratio, for re-use.
-Participant in FracFocus*
-Lines all surfaces around its drilling and hydraulic fracture operations with 30 to 60mm plastic liners to contain spills and prevent fluids from coming into contact with the environment. -Any spills are immediately vacuumed off the containment and disposed of safely.
-The use of advanced technology, best practices and many extra precautions are taken to preserve the water quality in nearby rivers, streams and water wells. And water use and disposal are managed with equally high standards and regulatory oversight by state agencies.
Devon Energy -Commitment to using water that is unsuitable for drinking, livestock or irrigation -In north Texas, it has pioneered water recycling, using thermal distillation technology to reclaim water recovered from well completion operations. -In Wyoming, potable water from wells serves wildlife and ranching needs.
--Participant in FracFocus* -Emergency response plan, including public notification protocol and safety procedures; emergency reporting procedures for spill containment and management.
El Paso -Designs wells and production pipe to isolate producing formations from freshwater zones and the environment. -Uses recycled paper mill wastewater in some of its hydraulic fracturing operations. -Flowback is collected at the surface for disposal and evaluated for recycling in other hydraulic fracturing operations; injects flowback water from its fracturing operations into wells specifically designed and permitted for the safe disposal of flowback water. -Pilot testing treatment technologies that allow the treatment and reuse of produced water (natural salt water released from the shale) as a means to reduce our overall fresh water demand.
-Participant in FracFocus* -Evaluates chemical use and looks for opportunities to reduce the number and volume of chemicals used across its operations, including hydraulic fracturing
-Once the surface casing is set, one or more additional intermediate casings and a production casing are installed and cemented; cement is tested before the cement is pumped into the annulus; intermediate and production casings are then installed, cemented, and pressure-tested. In cases where it is desirable to know the location of the top of the cement, the production casing may be tested using acoustic sound testing in addition to pressure-testing.
-“CleanStream” process uses ultraviolet light instead of additives to control bacteria in water, reducing the amount of biocide needed to complete a well.
EOG Resources -Attempts to minimize the use of water from sources that are also utilized for public drinking water; has utilised brackish water aquifers as source water for some of its hydraulic fracturing operations; fresh water is efficiently handled to avoid waste by installing a system of connected holding ponds lined with impervious plastic. -As part of the recycling process, particulates are filtered from the water (10 micron filter) and the flowback water is tested to determine appropriate quantities of additives and dilution before reuse for fracking. -One of the founding members of the Barnett Shale Water Conservation and Management Committee: committed to developing efficient and responsible best
--Participant in FracFocus* -Working to promote transparency in the disclosure of the fluids used in the hydraulic fracturing process, while respecting the IP rights of the manufacturers supplying the additives.
-All completion fluid and flowback/formation water is stored in lined tanks; special protective liners are placed on the well pad under the lined storage tanks and under the area where trucks deliver the fluids; additional containment barriers are placed around the circumference of each well pad.
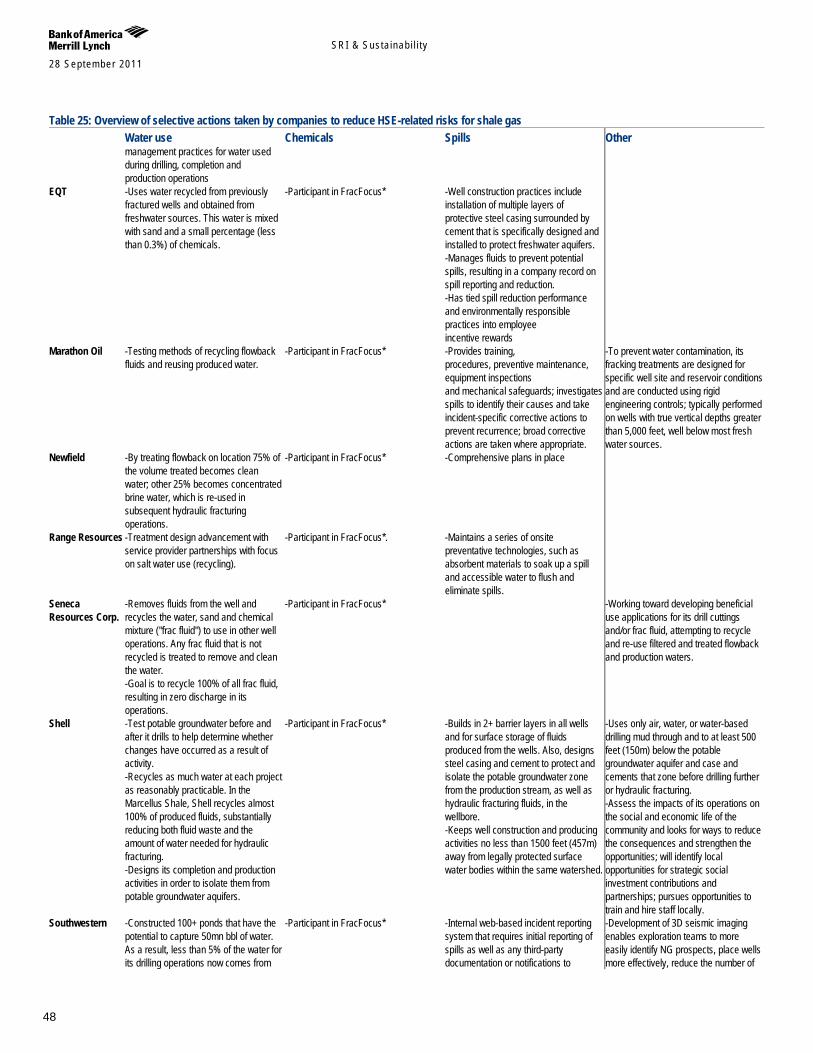
SRI & Susta inab i l i ty 28 September 2011
48
Table 25: Overview of selective actions taken by companies to reduce HSE-related risks for shale gas Water use Chemicals Spills Other
management practices for water used during drilling, completion and production operations
EQT -Uses water recycled from previously fractured wells and obtained from freshwater sources. This water is mixed with sand and a small percentage (less than 0.3%) of chemicals.
-Participant in FracFocus* -Well construction practices include installation of multiple layers of protective steel casing surrounded by cement that is specifically designed and installed to protect freshwater aquifers. -Manages fluids to prevent potential spills, resulting in a company record on spill reporting and reduction. -Has tied spill reduction performance and environmentally responsible practices into employee incentive rewards
Marathon Oil -Testing methods of recycling flowback fluids and reusing produced water.
-Participant in FracFocus* -Provides training, procedures, preventive maintenance, equipment inspections and mechanical safeguards; investigates spills to identify their causes and take incident-specific corrective actions to prevent recurrence; broad corrective actions are taken where appropriate.
-To prevent water contamination, its fracking treatments are designed for specific well site and reservoir conditions and are conducted using rigid engineering controls; typically performed on wells with true vertical depths greater than 5,000 feet, well below most fresh water sources.
Newfield -By treating flowback on location 75% of the volume treated becomes clean water; other 25% becomes concentrated brine water, which is re-used in subsequent hydraulic fracturing operations.
-Participant in FracFocus* -Comprehensive plans in place
Range Resources -Treatment design advancement with service provider partnerships with focus on salt water use (recycling).
-Participant in FracFocus*. -Maintains a series of onsite preventative technologies, such as absorbent materials to soak up a spill and accessible water to flush and eliminate spills.
Seneca Resources Corp.
-Removes fluids from the well and recycles the water, sand and chemical mixture ("frac fluid") to use in other well operations. Any frac fluid that is not recycled is treated to remove and clean the water. -Goal is to recycle 100% of all frac fluid, resulting in zero discharge in its operations.
-Participant in FracFocus* -Working toward developing beneficial use applications for its drill cuttings and/or frac fluid, attempting to recycle and re-use filtered and treated flowback and production waters.
Shell -Test potable groundwater before and after it drills to help determine whether changes have occurred as a result of activity. -Recycles as much water at each project as reasonably practicable. In the Marcellus Shale, Shell recycles almost 100% of produced fluids, substantially reducing both fluid waste and the amount of water needed for hydraulic fracturing. -Designs its completion and production activities in order to isolate them from potable groundwater aquifers.
-Participant in FracFocus* -Builds in 2+ barrier layers in all wells and for surface storage of fluids produced from the wells. Also, designs steel casing and cement to protect and isolate the potable groundwater zone from the production stream, as well as hydraulic fracturing fluids, in the wellbore. -Keeps well construction and producing activities no less than 1500 feet (457m) away from legally protected surface water bodies within the same watershed.
-Uses only air, water, or water-based drilling mud through and to at least 500 feet (150m) below the potable groundwater aquifer and case and cements that zone before drilling further or hydraulic fracturing. -Assess the impacts of its operations on the social and economic life of the community and looks for ways to reduce the consequences and strengthen the opportunities; will identify local opportunities for strategic social investment contributions and partnerships; pursues opportunities to train and hire staff locally.
Southwestern -Constructed 100+ ponds that have the potential to capture 50mn bbl of water. As a result, less than 5% of the water for its drilling operations now comes from
-Participant in FracFocus* -Internal web-based incident reporting system that requires initial reporting of spills as well as any third-party documentation or notifications to
-Development of 3D seismic imaging enables exploration teams to more easily identify NG prospects, place wells more effectively, reduce the number of
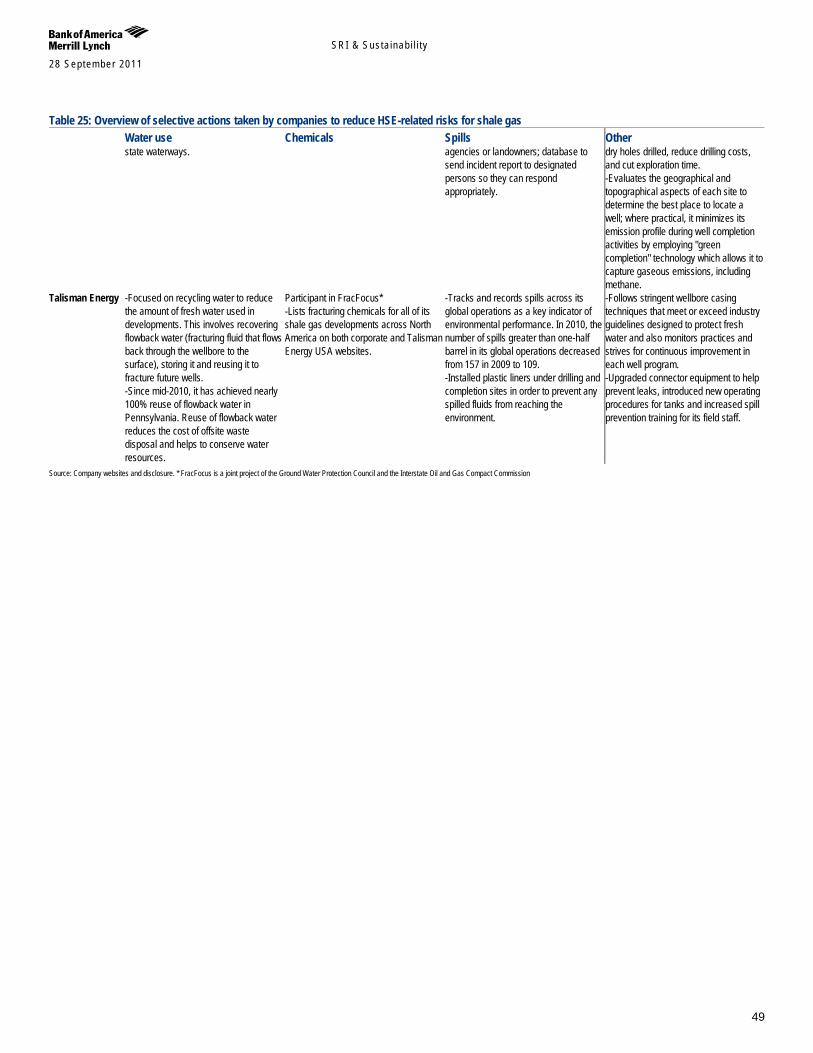
SRI & Susta inab i l i ty 28 September 2011
49
Table 25: Overview of selective actions taken by companies to reduce HSE-related risks for shale gas Water use Chemicals Spills Other
state waterways. agencies or landowners; database to send incident report to designated persons so they can respond appropriately.
dry holes drilled, reduce drilling costs, and cut exploration time. -Evaluates the geographical and topographical aspects of each site to determine the best place to locate a well; where practical, it minimizes its emission profile during well completion activities by employing "green completion" technology which allows it to capture gaseous emissions, including methane.
Talisman Energy -Focused on recycling water to reduce the amount of fresh water used in developments. This involves recovering flowback water (fracturing fluid that flows back through the wellbore to the surface), storing it and reusing it to fracture future wells. -Since mid-2010, it has achieved nearly 100% reuse of flowback water in Pennsylvania. Reuse of flowback water reduces the cost of offsite waste disposal and helps to conserve water resources.
Participant in FracFocus* -Lists fracturing chemicals for all of its shale gas developments across North America on both corporate and Talisman Energy USA websites.
-Tracks and records spills across its global operations as a key indicator of environmental performance. In 2010, the number of spills greater than one-half barrel in its global operations decreased from 157 in 2009 to 109. -Installed plastic liners under drilling and completion sites in order to prevent any spilled fluids from reaching the environment.
-Follows stringent wellbore casing techniques that meet or exceed industry guidelines designed to protect fresh water and also monitors practices and strives for continuous improvement in each well program. -Upgraded connector equipment to help prevent leaks, introduced new operating procedures for tanks and increased spill prevention training for its field staff.
Source: Company websites and disclosure. * FracFocus is a joint project of the Ground Water Protection Council and the Interstate Oil and Gas Compact Commission
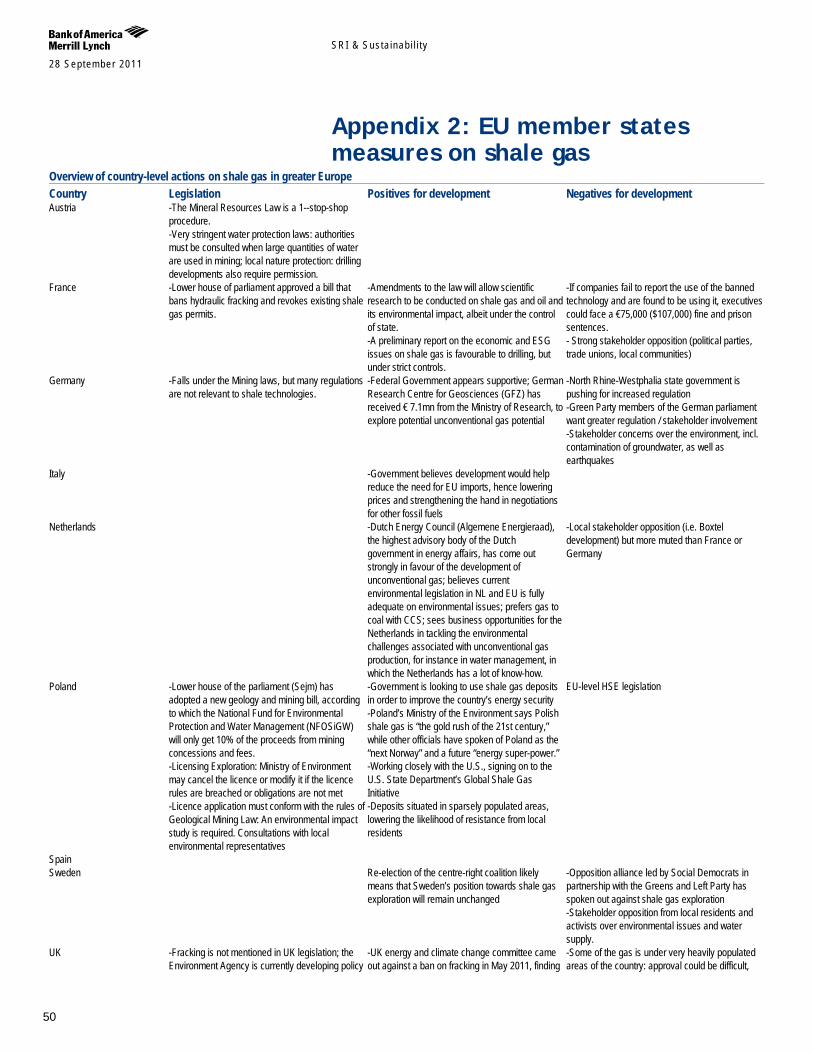
SRI & Susta inab i l i ty 28 September 2011
50
Appendix 2: EU member states measures on shale gas
Overview of country-level actions on shale gas in greater Europe Country Legislation Positives for development Negatives for development Austria -The Mineral Resources Law is a 1--stop-shop
procedure. -Very stringent water protection laws: authorities must be consulted when large quantities of water are used in mining; local nature protection: drilling developments also require permission.
France -Lower house of parliament approved a bill that bans hydraulic fracking and revokes existing shale gas permits.
-Amendments to the law will allow scientific research to be conducted on shale gas and oil and its environmental impact, albeit under the control of state. -A preliminary report on the economic and ESG issues on shale gas is favourable to drilling, but under strict controls.
-If companies fail to report the use of the banned technology and are found to be using it, executives could face a €75,000 ($107,000) fine and prison sentences. - Strong stakeholder opposition (political parties, trade unions, local communities)
Germany -Falls under the Mining laws, but many regulations are not relevant to shale technologies.
-Federal Government appears supportive; German Research Centre for Geosciences (GFZ) has received € 7.1mn from the Ministry of Research, to explore potential unconventional gas potential
-North Rhine-Westphalia state government is pushing for increased regulation -Green Party members of the German parliament want greater regulation / stakeholder involvement -Stakeholder concerns over the environment, incl. contamination of groundwater, as well as earthquakes
Italy -Government believes development would help reduce the need for EU imports, hence lowering prices and strengthening the hand in negotiations for other fossil fuels
Netherlands -Dutch Energy Council (Algemene Energieraad), the highest advisory body of the Dutch government in energy affairs, has come out strongly in favour of the development of unconventional gas; believes current environmental legislation in NL and EU is fully adequate on environmental issues; prefers gas to coal with CCS; sees business opportunities for the Netherlands in tackling the environmental challenges associated with unconventional gas production, for instance in water management, in which the Netherlands has a lot of know-how.
-Local stakeholder opposition (i.e. Boxtel development) but more muted than France or Germany
Poland -Lower house of the parliament (Sejm) has adopted a new geology and mining bill, according to which the National Fund for Environmental Protection and Water Management (NFOSiGW) will only get 10% of the proceeds from mining concessions and fees. -Licensing Exploration: Ministry of Environment may cancel the licence or modify it if the licence rules are breached or obligations are not met -Licence application must conform with the rules of Geological Mining Law: An environmental impact study is required. Consultations with local environmental representatives
-Government is looking to use shale gas deposits in order to improve the country’s energy security -Poland’s Ministry of the Environment says Polish shale gas is “the gold rush of the 21st century,” while other officials have spoken of Poland as the “next Norway” and a future “energy super-power.” -Working closely with the U.S., signing on to the U.S. State Department’s Global Shale Gas Initiative -Deposits situated in sparsely populated areas, lowering the likelihood of resistance from local residents
EU-level HSE legislation
Spain Sweden Re-election of the centre-right coalition likely
means that Sweden’s position towards shale gas exploration will remain unchanged
-Opposition alliance led by Social Democrats in partnership with the Greens and Left Party has spoken out against shale gas exploration -Stakeholder opposition from local residents and activists over environmental issues and water supply.
UK -Fracking is not mentioned in UK legislation; the Environment Agency is currently developing policy
-UK energy and climate change committee came out against a ban on fracking in May 2011, finding
-Some of the gas is under very heavily populated areas of the country: approval could be difficult,
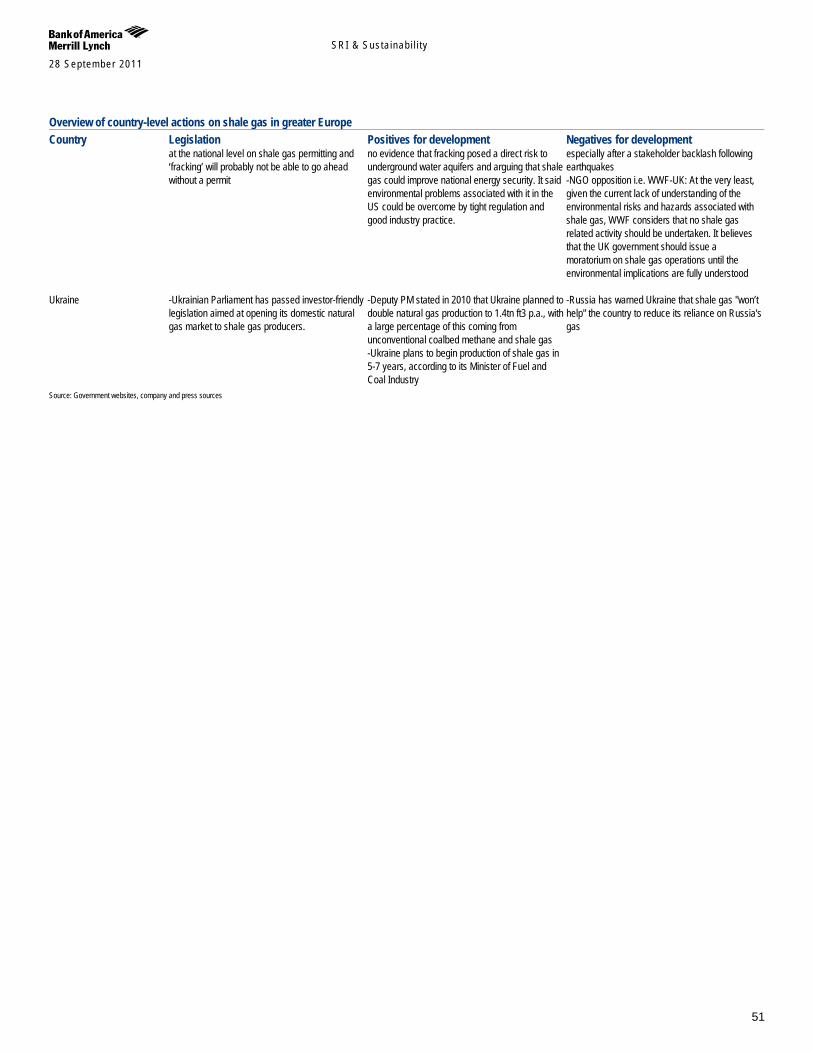
SRI & Susta inab i l i ty 28 September 2011
51
Overview of country-level actions on shale gas in greater Europe Country Legislation Positives for development Negatives for development
at the national level on shale gas permitting and ‘fracking’ will probably not be able to go ahead without a permit
no evidence that fracking posed a direct risk to underground water aquifers and arguing that shale gas could improve national energy security. It said environmental problems associated with it in the US could be overcome by tight regulation and good industry practice.
especially after a stakeholder backlash following earthquakes -NGO opposition i.e. WWF-UK: At the very least, given the current lack of understanding of the environmental risks and hazards associated with shale gas, WWF considers that no shale gas related activity should be undertaken. It believes that the UK government should issue a moratorium on shale gas operations until the environmental implications are fully understood
Ukraine -Ukrainian Parliament has passed investor-friendly legislation aimed at opening its domestic natural gas market to shale gas producers.
-Deputy PM stated in 2010 that Ukraine planned to double natural gas production to 1.4tn ft3 p.a., with a large percentage of this coming from unconventional coalbed methane and shale gas -Ukraine plans to begin production of shale gas in 5-7 years, according to its Minister of Fuel and Coal Industry
-Russia has warned Ukraine that shale gas "won’t help" the country to reduce its reliance on Russia's gas
Source: Government websites, company and press sources

SRI & Susta inab i l i ty 28 September 2011
52
Appendix 3: Overview of shale gas HSE incidents
Table 26: Selection of shale gas HSE incidents Date Company Incident Details Location Hazard(s) Amount Remediation Efforts
Aug 08 - Jul 09
Atlas Energy Resources LLC
Atlas Energy Resources LLC charged with improper planning, maintenance, & dumping
Several sites throughout Fayette, Greene & Washington Counties, PA
Diesel fuel & production fluids
Unknown The PA DEP fined Atlas $85,000 for the violations that occurred between Dec. 2008 & July 2009.
Jan-09
Cabot Oil & Gas
Methane gas leaked into drinking water, then home, following nearby natural gas hydraulic fracturing
Dimock, Susquehanna County, PA
Methane gas, fire
Unknown In February, the PA DEP charged Cabot Oil & Gas with two violations that it says caused the contamination, theorizing that gas leaked from the well casing into fractures underground.
May-09
Range Resources - Appalachia LLC & Chief Oil & Gas LLC
The impoundments draw significant amounts of water per day from nearby waterways. Such large volume diversions could impair the existing uses of the waterways.
Cogan House Township & Mifflin Township, Lycoming County, PA
Water withdrawal
n/a DEP ordered Range Resources - Appalachia LLC & Chief Oil & Gas LLC to suspend a portion of their operations. The orders will remain in effect until the DEP has received & approved a water management plan from both companies, & each firm has obtained the necessary permits.
Jun-09
Range Resources
A leaking waste water pipe from a Range Resources Marcellus shale gas well drilled in polluted water, killing fish, salamanders, crayfish & aquatic insect life.
Cross Creek Lake, Washington County, PA
Returned frac fluid, waste water discharge
Unknown DEP fined Range Resources as of January 2010.
Jun-09
Stallion Oilfield Services
“DEP conducted an inspection at Stallion in June 2009 and discovered that the company was operating a fracking water transfer station without the required DEP permit,”. DEP inspectors also found a 450-square foot area where fracking water had spilled onto the ground. Soil samples showed high levels of chlorides and barium, which are common constituents of fracking water.
Williamsport Frac fluid n/a Fine of $6500; Stallion subsequently excavated and properly disposed of about seven cubic yards of soil.
Sep-09
Consol Energy
A toxic algae bloom resulted in a massive fish kill (complete mussel kill). Favorable algae growth conditions were caused by high TDS levels, dry weather & water withdrawals for fracturing operations.
Along 43 miles of Dunkard Creek (Along WV & PA border)
Golden algae Unknown Lower chlorides & TDS levels. Consol Energy is now allowed to pump out water from its Blackville No. 2 mine on specific conditions issued by the WV DEP.
Sep-09
Cabot Oil & Gas Corp.
Cabot Oil & Gas Corp. experienced 3 separate spills in less than 1 week, which polluted Stevens Creek & a nearby wetland.
Heitsman well in Dimock Township, PA
Water/fluid mixture, paraffinic solvent & poly-saccharide
8,000 gallons
The DEP’s order stopped all hydro fracking operations at each site throughout the county. Cabot has since submitted the necessary forms according to DEP specifications, & resumed operations.
Oct-09
Range Resources
A Range Resources temporary above-ground water transfer line connection failed. Minnows, crawfish & frogs died / were impaired.
Brush Run Creek, Hopewell Township, Pa
Partially recycled flowback & fresh water, chlorides
250 barrels (10,500 gallons)
PA DEP officials inspected about 4/10 of a mile of Brush Run near the spill. Fines for this incident have not yet been published, but should be announced in spring 2010.
Feb-10
Fortuna Energy Inc.
Proper ownership information missing, flow-back fluids discharging into tributary
3 natural gas wells, Troy Township, Bradford County, PA
Flow-back fluids
Unknown Fortuna Energy Inc. promptly placed a pump into the sediment basin to pump the fluids back into tanks & hired a consultant to conduct appropriate sampling. PA DEP has fined the company $3,500 for the violations.
Mar-10
Talisman Energy
PA Department of Environmental Protection announced that it has fined Talisman Energy $24,608 for a large diesel fuel spill that occurred in March 2010 in Bradford County. The spill happened at the Putnam 77 Marcellus natural gas well pad in Armenia Township.
Bradford county Diesel fuel spill n/a Fine of $24,608; Cleaning up the spill required the excavation and removal of 3,800 tons of contaminated soil. It also meant collecting some 132,000 gallons of contaminated water - from which 450 gallons of diesel fuel was recovered.
Mar-10
General Energy
A substance used in the natural gas drilling process was discoloring & distorting the texture of spring water runoff.
Cummings Township, PA
Airfoam HD Unknown Representatives of PA General Energy, w/whom DEP members have been communicating, are investigating the problem
Mar-10
Range Resources
Range Resources: Broken pipe & flushing of water in field Hickory, PA (Caldwell St.)
Water (unknown
Unknown PA DEP investigating. Incident reported to researchers by witness.

SRI & Susta inab i l i ty 28 September 2011
53
Table 26: Selection of shale gas HSE incidents Date Company Incident Details Location Hazard(s) Amount Remediation Efforts
components) Mar-10
Anadarko Corp.
Mud overflowed Anadarko Corp. well pad Sproul State Forest, PA
Mud used as a cooling agent
8,000 - 12,000 gallons
A contractor has begun cleanup.
Mar-10
Atlas Energy
Atlas Energy gas well fire (natural gas storage tank or liner)
Hopewell Township, PA
Fire, smoke n/a Emergency personnel let the fire burn itself out. Investigation being conducted.
Apr-10
Cabot Oil & Gas Corp
Cabot Oil & Gas Corp violated PA's Clean Streams Law and the Oil & Gas Act by failing to fix defective cement & well casings on certain wells and to prevent the unpermitted natural gas discharge into groundwater.
Dimock, PA Migrating natural gas
Unknown Cabot must plug 3 wells within 40 days & install permanent treatment systems in affected homes within 30 days. PA DEP suspending its review of Cabot's permit applications for new drilling activities statewide until the order is fulfilled. Cabot barred from drilling new wells for at least 1 year in the area.
Apr-10
Stallion Oilfield Services
Stallion Oilfield Services operated a transfer station without a permit last year.
Old Lycoming Township, Lycoming County, PA
n/a n/a PA DEP fined the company $6,500.
Apr-10
n/a
Residents reported strong gas odours Washington & Greene Counties, PA
Unknown Unknown PA DEP investigating & taking air samples. Any entity that is found to be operating a source of odours may be fined up to $25,000 under the Air Pollution Control Act.
May-10
Chief Oil & Gas
Chief Oil & Gas withdrew water from the Casselman River without a permit. Water-hauling trucks caused boat dock damage.
Jefferson Township, PA
n/a n/a PA DEP cited the company and will meet with Chief over the permitting confusion. Chief has pledged to repair the boat dock.
June-10 (Approx)
Cabot Oil & Gas Corp.
Fluid leak into the ground water caused by a hole in the pit liner
Dimock, Susquehanna County, PA
Black drilling liquid
Unknown PA DEP issued a notice of violation to Cabot Oil & Gas
Apr-11
Chesapeake Energy Corp.
A gas well in Pennsylvania exploded in April and sent thousands of gallons of fluids through the drilling site and into a local tributary. The fluids contained dangerous chemicals, forcing seven families to evacuate their homes.
Pennsylvania, New york
Frac fluid n/a Fine of $900,000 for contamination of private water supplies $188,000 for a tank fire that injured 3 workers
Jun-11
Cuadrilla Resources
Its activities may have triggered two small earthquakes near a test well close to Blackpool.
Blackpool, UK Earthquakes n/a Suspending operations until the investigation is complete
Source: Company and press sources
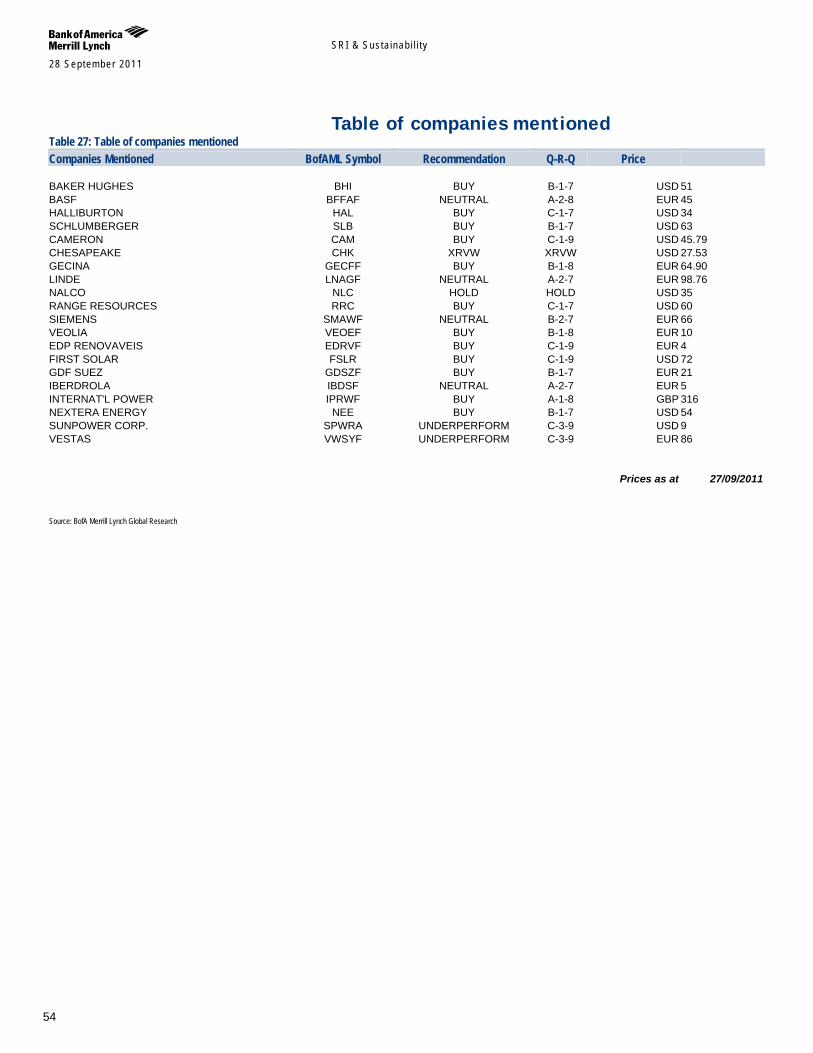
SRI & Susta inab i l i ty 28 September 2011
54
Table of companies mentioned Table 27: Table of companies mentioned Companies Mentioned BofAML Symbol Recommendation Q-R-Q Price BAKER HUGHES BHI BUY B-1-7 USD 51 BASF BFFAF NEUTRAL A-2-8 EUR 45 HALLIBURTON HAL BUY C-1-7 USD 34 SCHLUMBERGER SLB BUY B-1-7 USD 63 CAMERON CAM BUY C-1-9 USD 45.79 CHESAPEAKE CHK XRVW XRVW USD 27.53 GECINA GECFF BUY B-1-8 EUR 64.90 LINDE LNAGF NEUTRAL A-2-7 EUR 98.76 NALCO NLC HOLD HOLD USD 35 RANGE RESOURCES RRC BUY C-1-7 USD 60 SIEMENS SMAWF NEUTRAL B-2-7 EUR 66 VEOLIA VEOEF BUY B-1-8 EUR 10 EDP RENOVAVEIS EDRVF BUY C-1-9 EUR 4 FIRST SOLAR FSLR BUY C-1-9 USD 72 GDF SUEZ GDSZF BUY B-1-7 EUR 21 IBERDROLA IBDSF NEUTRAL A-2-7 EUR 5 INTERNAT'L POWER IPRWF BUY A-1-8 GBP 316 NEXTERA ENERGY NEE BUY B-1-7 USD 54 SUNPOWER CORP. SPWRA UNDERPERFORM C-3-9 USD 9 VESTAS VWSYF UNDERPERFORM C-3-9 EUR 86 Prices as at 27/09/2011 Source: BofA Merrill Lynch Global Research

SRI & Susta inab i l i ty 28 September 2011
55
Link to Definitions Industrials Click here for definitions of commonly used terms.
Macro Click here for definitions of commonly used terms. Analyst Certification I, Sarbjit Nahal, hereby certify that the views expressed in this research report about securities and issuers accurately reflect the research model applied in such analysis. I also certify that no part of my compensation was, is, or will be, directly or indirectly, related to the specific recommendations or view expressed in this research report.
SRI & Susta inab i l i ty 28 September 2011
56
Important Disclosures
FUNDAMENTAL EQUITY OPINION KEY: Opinions include a Volatility Risk Rating, an Investment Rating and an Income Rating. VOLATILITY RISK RATINGS, indicators of potential price fluctuation, are: A - Low, B - Medium and C - High. INVESTMENT RATINGS reflect the analyst’s assessment of a stock’s: (i) absolute total return potential and (ii) attractiveness for investment relative to other stocks within its Coverage Cluster (defined below). There are three investment ratings: 1 - Buy stocks are expected to have a total return of at least 10% and are the most attractive stocks in the coverage cluster; 2 - Neutral stocks are expected to remain flat or increase in value and are less attractive than Buy rated stocks and 3 - Underperform stocks are the least attractive stocks in a coverage cluster. Analysts assign investment ratings considering, among other things, the 0-12 month total return expectation for a stock and the firm’s guidelines for ratings dispersions (shown in the table below). The current price objective for a stock should be referenced to better understand the total return expectation at any given time. The price objective reflects the analyst’s view of the potential price appreciation (depreciation). Investment rating Total return expectation (within 12-month period of date of initial rating) Ratings dispersion guidelines for coverage cluster*
Buy ≥ 10% ≤ 70% Neutral ≥ 0% ≤ 30%
Underperform N/A ≥ 20% * Ratings dispersions may vary from time to time where BofA Merrill Lynch Research believes it better reflects the investment prospects of stocks in a Coverage Cluster.
INCOME RATINGS, indicators of potential cash dividends, are: 7 - same/higher (dividend considered to be secure), 8 - same/lower (dividend not considered to be secure) and 9 - pays no cash dividend. Coverage Cluster is comprised of stocks covered by a single analyst or two or more analysts sharing a common industry, sector, region or other classification(s). A stock’s coverage cluster is included in the most recent BofA Merrill Lynch Comment referencing the stock.
Due to the nature of strategic analysis, the issuers or securities recommended or discussed in this report are not continuously followed. Accordingly, investors must regard this report as providing stand-alone analysis and should not expect continuing analysis or additional reports relating to such issuers and/or securities.
BofA Merrill Lynch Research personnel (including the analyst(s) responsible for this report) receive compensation based upon, among other factors, the overall profitability of Bank of America Corporation, including profits derived from investment banking revenues.
Other Important Disclosures
Officers of MLPF&S or one or more of its affiliates (other than research analysts) may have a financial interest in securities of the issuer(s) or in related investments.
BofA Merrill Lynch Global Research policies relating to conflicts of interest are described at http://www.ml.com/media/43347.pdf. "BofA Merrill Lynch" includes Merrill Lynch, Pierce, Fenner & Smith Incorporated ("MLPF&S") and its affiliates. Investors should contact their BofA
Merrill Lynch representative or Merrill Lynch Global Wealth Management financial advisor if they have questions concerning this report. Information relating to Non-US affiliates of BofA Merrill Lynch and Distribution of Affiliate Research Reports: MLPF&S distributes, or may in the future distribute, research reports of the following non-US affiliates in the US (short name: legal name): Merrill Lynch
(France): Merrill Lynch Capital Markets (France) SAS; Merrill Lynch (Frankfurt): Merrill Lynch International Bank Ltd., Frankfurt Branch; Merrill Lynch (South Africa): Merrill Lynch South Africa (Pty) Ltd.; Merrill Lynch (Milan): Merrill Lynch International Bank Limited; MLI (UK): Merrill Lynch International; Merrill Lynch (Australia): Merrill Lynch Equities (Australia) Limited; Merrill Lynch (Hong Kong): Merrill Lynch (Asia Pacific) Limited; Merrill Lynch (Singapore): Merrill Lynch (Singapore) Pte Ltd.; Merrill Lynch (Canada): Merrill Lynch Canada Inc; Merrill Lynch (Mexico): Merrill Lynch Mexico, SA de CV, Casa de Bolsa; Merrill Lynch (Argentina): Merrill Lynch Argentina SA; Merrill Lynch (Japan): Merrill Lynch Japan Securities Co., Ltd.; Merrill Lynch (Seoul): Merrill Lynch International Incorporated (Seoul Branch); Merrill Lynch (Taiwan): Merrill Lynch Securities (Taiwan) Ltd.; DSP Merrill Lynch (India): DSP Merrill Lynch Limited; PT Merrill Lynch (Indonesia): PT Merrill Lynch Indonesia; Merrill Lynch (Israel): Merrill Lynch Israel Limited; Merrill Lynch (Russia): Merrill Lynch CIS Limited, Moscow; Merrill Lynch (Turkey): Merrill Lynch Yatirim Bankasi A.S.; Merrill Lynch (Dubai): Merrill Lynch International, Dubai Branch; MLPF&S (Zürich rep. office): MLPF&S Incorporated Zürich representative office; Merrill Lynch (Spain): Merrill Lynch Capital Markets Espana, S.A.S.V.; Merrill Lynch (Brazil): Bank of America Merrill Lynch Banco Múltiplo S.A.
This research report has been approved for publication and is distributed in the United Kingdom to professional clients and eligible counterparties (as each is defined in the rules of the Financial Services Authority) by Merrill Lynch International and Banc of America Securities Limited (BASL), which are authorized and regulated by the Financial Services Authority and has been approved for publication and is distributed in the United Kingdom to retail clients (as defined in the rules of the Financial Services Authority) by Merrill Lynch International Bank Limited, London Branch, which is authorized by the Central Bank of Ireland and is subject to limited regulation by the Financial Services Authority – details about the extent of its regulation by the Financial Services Authority are available from it on request; has been considered and distributed in Japan by Merrill Lynch Japan Securities Co., Ltd., a registered securities dealer under the Financial Instruments and Exchange Act in Japan; is distributed in Hong Kong by Merrill Lynch (Asia Pacific) Limited, which is regulated by the Hong Kong SFC and the Hong Kong Monetary Authority; is issued and distributed in Taiwan by Merrill Lynch Securities (Taiwan) Ltd.; is issued and distributed in India by DSP Merrill Lynch Limited; and is issued and distributed in Singapore by Merrill Lynch International Bank Limited (Merchant Bank) and Merrill Lynch (Singapore) Pte Ltd. (Company Registration No.’s F 06872E and 198602883D respectively) and Bank of America Singapore Limited (Merchant Bank). Merrill Lynch International Bank Limited (Merchant Bank) and Merrill Lynch (Singapore) Pte Ltd. are regulated by the Monetary Authority of Singapore. Merrill Lynch Equities (Australia) Limited (ABN 65 006 276 795), AFS License 235132 provides this report in Australia in accordance with section 911B of the Corporations Act 2001 and neither it nor any of its affiliates involved in preparing this research report is an Authorised Deposit-Taking Institution under the Banking Act 1959 nor regulated by the Australian Prudential Regulation Authority. No approval is required for publication or distribution of this report in Brazil. Merrill Lynch (Dubai) is authorized and regulated by the Dubai Financial Services Authority (DFSA). Research reports prepared and issued by Merrill Lynch (Dubai) are prepared and issued in accordance with the requirements of the DFSA conduct of business rules.
Merrill Lynch (Frankfurt) distributes this report in Germany. Merrill Lynch (Frankfurt) is regulated by BaFin.
SRI & Susta inab i l i ty 28 September 2011
57
This research report has been prepared and issued by MLPF&S and/or one or more of its non-US affiliates. MLPF&S is the distributor of this research report in the US and accepts full responsibility for research reports of its non-US affiliates distributed to MLPF&S clients in the US. Any US person receiving this research report and wishing to effect any transaction in any security discussed in the report should do so through MLPF&S and not such foreign affiliates.
General Investment Related Disclosures: This research report provides general information only. Neither the information nor any opinion expressed constitutes an offer or an invitation to make an offer,
to buy or sell any securities or other financial instrument or any derivative related to such securities or instruments (e.g., options, futures, warrants, and contracts for differences). This report is not intended to provide personal investment advice and it does not take into account the specific investment objectives, financial situation and the particular needs of any specific person. Investors should seek financial advice regarding the appropriateness of investing in financial instruments and implementing investment strategies discussed or recommended in this report and should understand that statements regarding future prospects may not be realized. Any decision to purchase or subscribe for securities in any offering must be based solely on existing public information on such security or the information in the prospectus or other offering document issued in connection with such offering, and not on this report.
Securities and other financial instruments discussed in this report, or recommended, offered or sold by Merrill Lynch, are not insured by the Federal Deposit Insurance Corporation and are not deposits or other obligations of any insured depository institution (including, Bank of America, N.A.). Investments in general and, derivatives, in particular, involve numerous risks, including, among others, market risk, counterparty default risk and liquidity risk. No security, financial instrument or derivative is suitable for all investors. In some cases, securities and other financial instruments may be difficult to value or sell and reliable information about the value or risks related to the security or financial instrument may be difficult to obtain. Investors should note that income from such securities and other financial instruments, if any, may fluctuate and that price or value of such securities and instruments may rise or fall and, in some cases, investors may lose their entire principal investment. Past performance is not necessarily a guide to future performance. Levels and basis for taxation may change.
This report may contain a short-term trading idea or recommendation, which highlights a specific near-term catalyst or event impacting the company or the market that is anticipated to have a short-term price impact on the equity securities of the company. Short-term trading ideas and recommendations are different from and do not affect a stock's fundamental equity rating, which reflects both a longer term total return expectation and attractiveness for investment relative to other stocks within its Coverage Cluster. Short-term trading ideas and recommendations may be more or less positive than a stock's fundamental equity rating.
BofA Merrill Lynch is aware that the implementation of the ideas expressed in this report may depend upon an investor's ability to "short" securities or other financial instruments and that such action may be limited by regulations prohibiting or restricting "shortselling" in many jurisdictions. Investors are urged to seek advice regarding the applicability of such regulations prior to executing any short idea contained in this report.
Foreign currency rates of exchange may adversely affect the value, price or income of any security or financial instrument mentioned in this report. Investors in such securities and instruments, including ADRs, effectively assume currency risk.
UK Readers: The protections provided by the U.K. regulatory regime, including the Financial Services Scheme, do not apply in general to business coordinated by BofA Merrill Lynch entities located outside of the United Kingdom. BofA Merrill Lynch Global Research policies relating to conflicts of interest are described at http://www.ml.com/media/43347.pdf.
Officers of MLPF&S or one or more of its affiliates (other than research analysts) may have a financial interest in securities of the issuer(s) or in related investments.
MLPF&S or one of its affiliates is a regular issuer of traded financial instruments linked to securities that may have been recommended in this report. MLPF&S or one of its affiliates may, at any time, hold a trading position (long or short) in the securities and financial instruments discussed in this report.
BofA Merrill Lynch, through business units other than BofA Merrill Lynch Global Research, may have issued and may in the future issue trading ideas or recommendations that are inconsistent with, and reach different conclusions from, the information presented in this report. Such ideas or recommendations reflect the different time frames, assumptions, views and analytical methods of the persons who prepared them, and BofA Merrill Lynch is under no obligation to ensure that such other trading ideas or recommendations are brought to the attention of any recipient of this report.
In the event that the recipient received this report pursuant to a contract between the recipient and MLPF&S for the provision of research services for a separate fee, and in connection therewith MLPF&S may be deemed to be acting as an investment adviser, such status relates, if at all, solely to the person with whom MLPF&S has contracted directly and does not extend beyond the delivery of this report (unless otherwise agreed specifically in writing by MLPF&S). MLPF&S is and continues to act solely as a broker-dealer in connection with the execution of any transactions, including transactions in any securities mentioned in this report.
Copyright and General Information regarding Research Reports: Copyright 2011 Merrill Lynch, Pierce, Fenner & Smith Incorporated. All rights reserved. iQmethod, iQmethod 2.0, iQprofile, iQtoolkit, iQworks are service marks
of Merrill Lynch & Co., Inc. iQanalytics®, iQcustom®, iQdatabase® are registered service marks of Merrill Lynch & Co., Inc. This research report is prepared for the use of BofA Merrill Lynch clients and may not be redistributed, retransmitted or disclosed, in whole or in part, or in any form or manner, without the express written consent of BofA Merrill Lynch. BofA Merrill Lynch Global Research reports are distributed simultaneously to internal and client websites and other portals by BofA Merrill Lynch and are not publicly-available materials. Any unauthorized use or disclosure is prohibited. Receipt and review of this research report constitutes your agreement not to redistribute, retransmit, or disclose to others the contents, opinions, conclusion, or information contained in this report (including any investment recommendations, estimates or price targets) without first obtaining expressed permission from an authorized officer of BofA Merrill Lynch.
Materials prepared by BofA Merrill Lynch Global Research personnel are based on public information. Facts and views presented in this material have not been reviewed by, and may not reflect information known to, professionals in other business areas of BofA Merrill Lynch, including investment banking personnel. BofA Merrill Lynch has established information barriers between BofA Merrill Lynch Global Research and certain business groups. As a result, BofA Merrill Lynch does not disclose certain client relationships with, or compensation received from, such companies in research reports. To the extent this report discusses any legal proceeding or issues, it has not been prepared as nor is it intended to express any legal conclusion, opinion or advice. Investors should consult their own legal advisers as to issues of law relating to the subject matter of this report. BofA Merrill Lynch Global Research personnel’s knowledge of legal proceedings in which any BofA Merrill Lynch entity and/or its directors, officers and employees may be plaintiffs, defendants, co-defendants or co-plaintiffs with or involving companies mentioned in this report is based on public information. Facts and views presented in this material that relate to any such proceedings have not been reviewed by, discussed with, and may not reflect information known to, professionals in other business areas of BofA Merrill Lynch in connection with the legal proceedings or matters relevant to such proceedings.
This report has been prepared independently of any issuer of securities mentioned herein and not in connection with any proposed offering of securities or as agent of any issuer of any securities. None of MLPF&S, any of its affiliates or their research analysts has any authority whatsoever to make any representation or warranty on behalf of the issuer(s). BofA Merrill Lynch Global Research policy prohibits research personnel from disclosing a recommendation, investment rating, or investment thesis for review by an issuer prior to the publication of a research report containing such rating, recommendation or investment thesis.
Any information relating to the tax status of financial instruments discussed herein is not intended to provide tax advice or to be used by anyone to provide tax advice. Investors are urged to seek tax advice based on their particular circumstances from an independent tax professional.
The information herein (other than disclosure information relating to BofA Merrill Lynch and its affiliates) was obtained from various sources and we do not guarantee its accuracy. This report may contain links to third-party websites. BofA Merrill Lynch is not responsible for the content of any third-party website or any linked content contained in a third-party website. Content contained on such third-party websites is not part of this report and is not incorporated by reference into this report. The inclusion of a link in this report does not imply any endorsement by or any affiliation with BofA Merrill Lynch. Access to any third-party website is at your own risk, and you should always review the terms and privacy policies at third-party websites before submitting any personal information to them. BofA Merrill Lynch is not responsible for such terms and privacy policies and expressly disclaims any liability for them.
SRI & Susta inab i l i ty 28 September 2011
58
Subject to the quiet period applicable under laws of the various jurisdictions in which we distribute research reports and other legal and BofA Merrill Lynch policy-related restrictions on the publication of research reports, fundamental equity reports are produced on a regular basis as necessary to keep the investment recommendation current.
Certain outstanding reports may contain discussions and/or investment opinions relating to securities, financial instruments and/or issuers that are no longer current. Always refer to the most recent research report relating to a company or issuer prior to making an investment decision.
In some cases, a company or issuer may be classified as Restricted or may be Under Review or Extended Review. In each case, investors should consider any investment opinion relating to such company or issuer (or its security and/or financial instruments) to be suspended or withdrawn and should not rely on the analyses and investment opinion(s) pertaining to such issuer (or its securities and/or financial instruments) nor should the analyses or opinion(s) be considered a solicitation of any kind. Sales persons and financial advisors affiliated with MLPF&S or any of its affiliates may not solicit purchases of securities or financial instruments that are Restricted or Under Review and may only solicit securities under Extended Review in accordance with firm policies.
Neither BofA Merrill Lynch nor any officer or employee of BofA Merrill Lynch accepts any liability whatsoever for any direct, indirect or consequential damages or losses arising from any use of this report or its contents.