Magneto-hydrodynamic Stirrer for Stationary and Moving Fluids
Upload
independentCategory
view
2download
0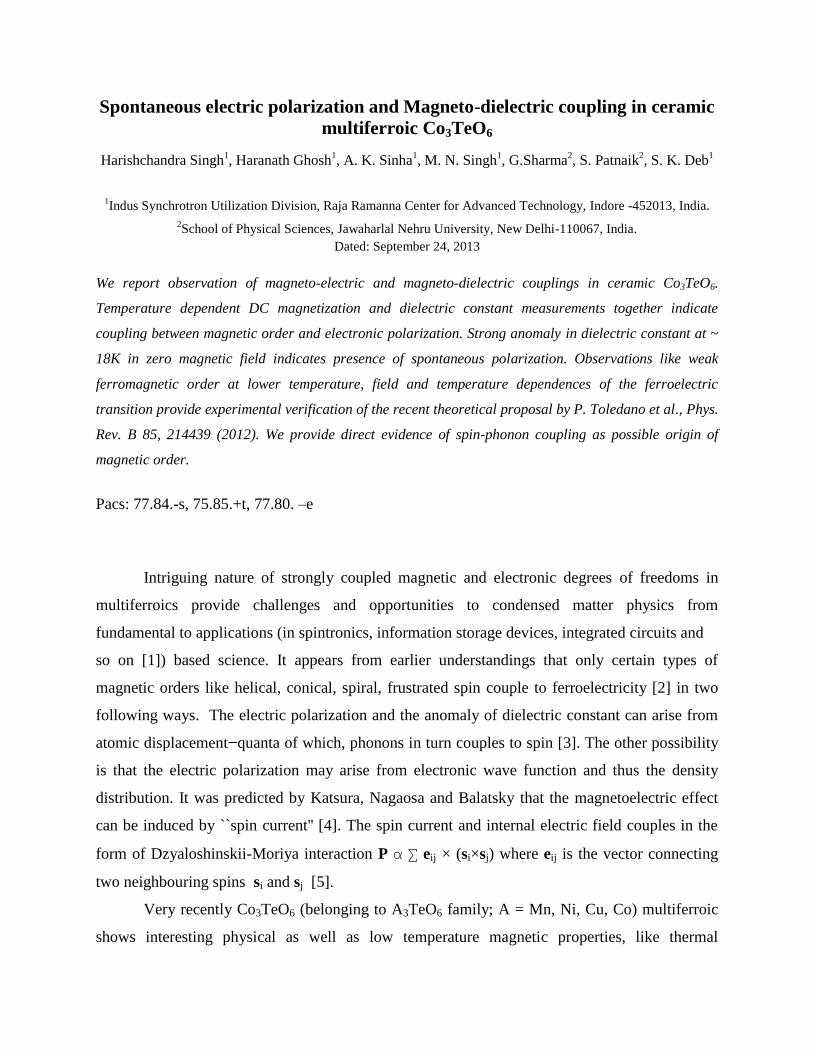
Spontaneous electric polarization and Magneto-dielectric coupling in ceramic
multiferroic Co3TeO6
Harishchandra Singh1, Haranath Ghosh
1, A. K. Sinha
1, M. N. Singh
1, G.Sharma
2, S. Patnaik
2, S. K. Deb
1
1Indus Synchrotron Utilization Division, Raja Ramanna Center for Advanced Technology, Indore -452013, India.
2School of Physical Sciences, Jawaharlal Nehru University, New Delhi-110067, India.
Dated: September 24, 2013
We report observation of magneto-electric and magneto-dielectric couplings in ceramic Co3TeO6.
Temperature dependent DC magnetization and dielectric constant measurements together indicate
coupling between magnetic order and electronic polarization. Strong anomaly in dielectric constant at ~
18K in zero magnetic field indicates presence of spontaneous polarization. Observations like weak
ferromagnetic order at lower temperature, field and temperature dependences of the ferroelectric
transition provide experimental verification of the recent theoretical proposal by P. Toledano et al., Phys.
Rev. B 85, 214439 (2012). We provide direct evidence of spin-phonon coupling as possible origin of
magnetic order.
Pacs: 77.84.-s, 75.85.+t, 77.80. –e
Intriguing nature of strongly coupled magnetic and electronic degrees of freedoms in
multiferroics provide challenges and opportunities to condensed matter physics from
fundamental to applications (in spintronics, information storage devices, integrated circuits and
so on [1]) based science. It appears from earlier understandings that only certain types of
magnetic orders like helical, conical, spiral, frustrated spin couple to ferroelectricity [2] in two
following ways. The electric polarization and the anomaly of dielectric constant can arise from
atomic displacement ̶ quanta of which, phonons in turn couples to spin [3]. The other possibility
is that the electric polarization may arise from electronic wave function and thus the density
distribution. It was predicted by Katsura, Nagaosa and Balatsky that the magnetoelectric effect
can be induced by ``spin current'' [4]. The spin current and internal electric field couples in the
form of Dzyaloshinskii-Moriya interaction P α ∑ eij × (si×sj) where eij is the vector connecting
two neighbouring spins si and sj [5].
Very recently Co3TeO6 (belonging to A3TeO6 family; A = Mn, Ni, Cu, Co) multiferroic
shows interesting physical as well as low temperature magnetic properties, like thermal
variations of magnetization, susceptibility, specfic heat indicating very complex magnetic
structures [6]. Neutron diffraction studies on Co3TeO6 (last but one of ref. [6]) clearly indicate
first-order multi-k phase transitions, a sequence of three antiferromagnetic (AFM) phases
accompanied by magnetoelectric effects. The incommensurate phase I emerging at TN = 26 K
whereas the two commensurate phases at 21.1 K (phase II) and 17.4 K (phase III) respectively.
The evolution of phase II from phase I take place through strong first order transition.
Theoretical Landau free energy analysis taking care of irreducible representations and
monoclinic magnetic group symmetry suggests a strong magnetoelastic effect may be involved
[7]. This further suggests possible abrupt change in interatomic spacing causing the first order
transition which in turn influence exchange energy from phase I to II. A phenomenological
explanation of magnetoelectric behaviour of Co3TeO6 is also developed in ref. [8]. In contrast,
there is smooth second order transition from phase- II to III indicating no significant
discontinuity of lattice parameter. As theoretically explained [7] monoclinic symmetry of phase
III (2´) permits spontaneous weak magnetization as well as spontaneous polarization which is a
single spontaneous zero field polarization component Py [7]. While the former (weak
magnetization) is consistent with domain structure in second harmonic generation (SHG) (last
ref. of [6]) measurements, the spontaneous zero field polarization [7] is yet to be experimentally
verified.
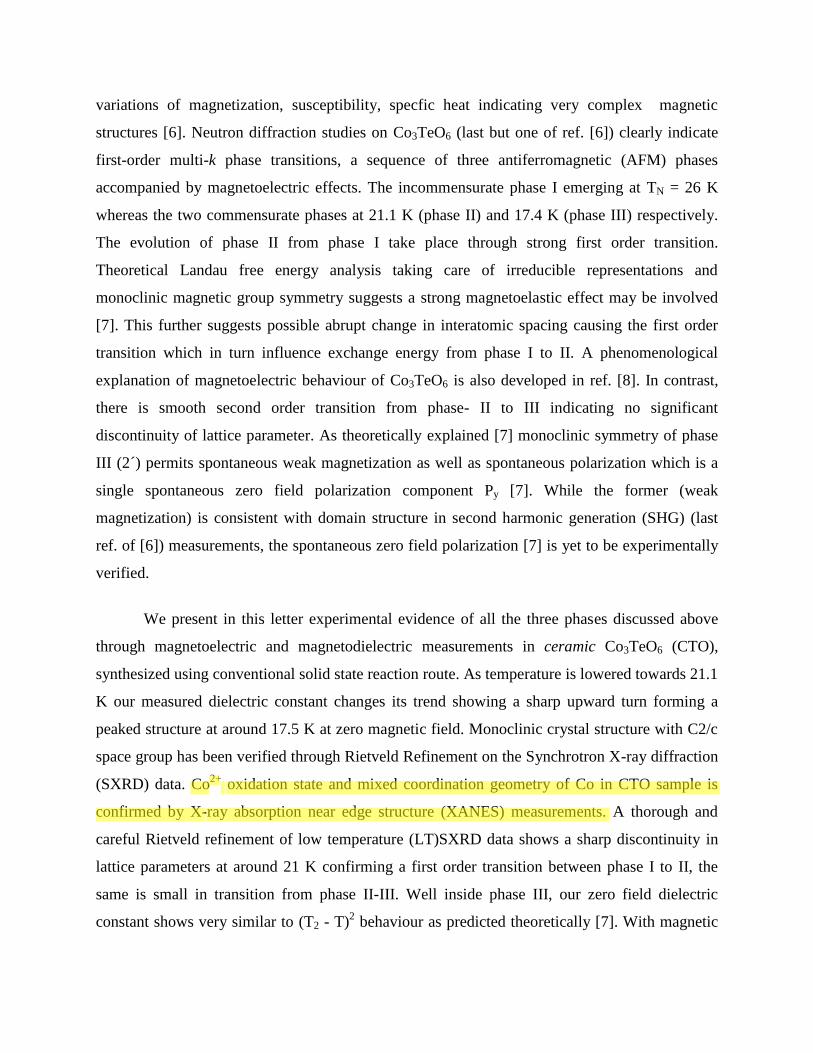
We present in this letter experimental evidence of all the three phases discussed above
through magnetoelectric and magnetodielectric measurements in ceramic Co3TeO6 (CTO),
synthesized using conventional solid state reaction route. As temperature is lowered towards 21.1
K our measured dielectric constant changes its trend showing a sharp upward turn forming a
peaked structure at around 17.5 K at zero magnetic field. Monoclinic crystal structure with C2/c
space group has been verified through Rietveld Refinement on the Synchrotron X-ray diffraction
(SXRD) data. Co2+
oxidation state and mixed coordination geometry of Co in CTO sample is
confirmed by X-ray absorption near edge structure (XANES) measurements. A thorough and
careful Rietveld refinement of low temperature (LT)SXRD data shows a sharp discontinuity in
lattice parameters at around 21 K confirming a first order transition between phase I to II, the
same is small in transition from phase II-III. Well inside phase III, our zero field dielectric
constant shows very similar to (T2 - T)2 behaviour as predicted theoretically [7]. With magnetic
field such behaviour changes with lowering of temperature, showing suppression in overall
magnitude indicating coupling between magnetic order and polarization. Temperature
dependencies of difference in various average Co-O bonds follow similar trend as that of the
magnetization indicating direct coupling between the lattice and spin degrees of freedom.
Furthermore, field dependence of T2 (H) and weak hysteresis indicating spontaneous
magnetization at 2K are also verified. Thus, our data provides pioneering experimental
verification of the theoretical prediction of spontaneous zero magnetic field polarization and
being consistent with measurements in all the other phases.
Ceramic cobalt tellurate are synthesized using conventional solid state reaction route. The
reactants used are cobalt oxide Co3O4 (Alpha Easer 99.7 %) and tellurium dioxide TeO2 (Alpha
Easer 99.99 %). The reactants in stoichiometric ratio are first calcined (700oC for 10 hrs) and
then recalcined (800oC for 20 hrs). SXRD (room temperature to 7 K) and XANES measurements
are performed at angle dispersive x-ray diffraction (ADXRD) beamline (BL-12) [8] at Indus-2
synchrotron source. LTXRD are performed in a liquid helium cryostat (Advanced Research
Systems Inc Model No. LT-3G) using image plate based MAR 345 dtb area detector. The
temperature of the sample is stabilized within 0.1 K. SXRD patterns are corrected using LaB6
and Si standards. The two dimensional patterns are integrated using the programme fit2D [9].
The refinements of the structural parameters from the difraction patterns are obtained using the
Rietveld analysis employing the FULL-PROF program [10]. Magnetic measurements are carried
out with a vibrating sample magnetometer in the magnetic property measurement system
(MPMS-SQUID VSM) of Quantum Design, USA. The temperature stability at the sample
chamber is better than ± 0.2 K. Temperature dependent dielectric measurement is performed
using 1920 QUADTech LCR meter in Cryogenic CFM system. The sample used for the
capacitance measurement is 0.4 mm thick and 78.5 mm2 area.
CTO adopt monoclinic structure with space group C2/c as reported earlier for crushed
single crystal as well as ceramic CTO. The experimental, calculated, and difference powder-
diffraction profiles are shown in Figure 1. For the purpose of structural verification, a
comparative table of lattice parameters of CTO sample is presented in table 1. The corresponding
bond valance sum calculations [11], show the presence of Co2+
, Te6+
and O2-
ions, which are
further confirmed using XANES and X-ray photo electron spectroscopy (XPS) studies (this
along with detailed scanning electron microscopy (SEM),energy dispersive X-ray (EDX) studies
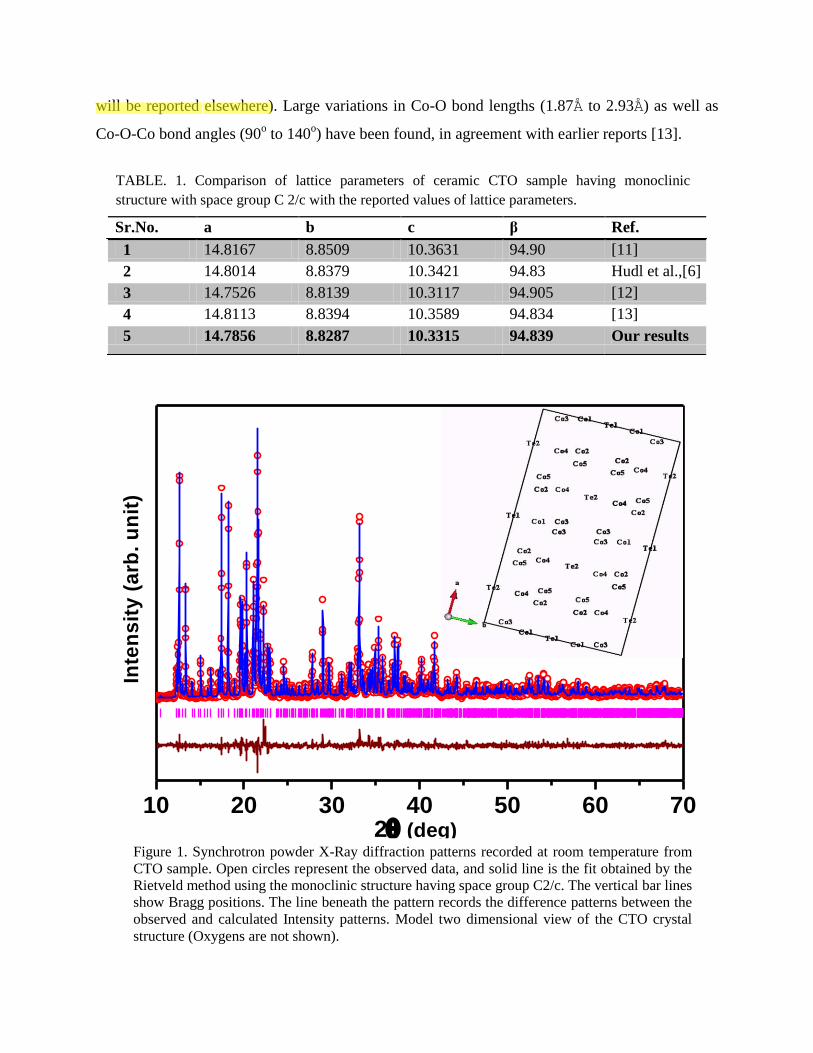
will be reported elsewhere). Large variations in Co-O bond lengths (1.87Å to 2.93Å) as well as
Co-O-Co bond angles (90o to 140
o) have been found, in agreement with earlier reports [13].
Sr.No. a b c β Ref.
1 14.8167 8.8509 10.3631 94.90 [11]
2 14.8014 8.8379 10.3421 94.83 Hudl et al.,[6]
3 14.7526 8.8139 10.3117 94.905 [12]
4 14.8113 8.8394 10.3589 94.834 [13]
5 14.7856 8.8287 10.3315 94.839 Our results
TABLE. 1. Comparison of lattice parameters of ceramic CTO sample having monoclinic
structure with space group C 2/c with the reported values of lattice parameters.
10 20 30 40 50 60 70
Inte
ns
ity
(a
rb.
un
it)
2 (deg)Figure 1. Synchrotron powder X-Ray diffraction patterns recorded at room temperature from
CTO sample. Open circles represent the observed data, and solid line is the fit obtained by the
Rietveld method using the monoclinic structure having space group C2/c. The vertical bar lines
show Bragg positions. The line beneath the pattern records the difference patterns between the
observed and calculated Intensity patterns. Model two dimensional view of the CTO crystal
structure (Oxygens are not shown).
The CTO structure contains inequivalent five Co and two Te cations, where Co occupies 4e and
8f positions, whereas, Te occupies 4b and 8f. Te cations occupy octahedral sites whereas Co sits
in tetra, penta and octahedral sites. The corresponding crystallographically distinct nine O atoms
sit in 8f positions.
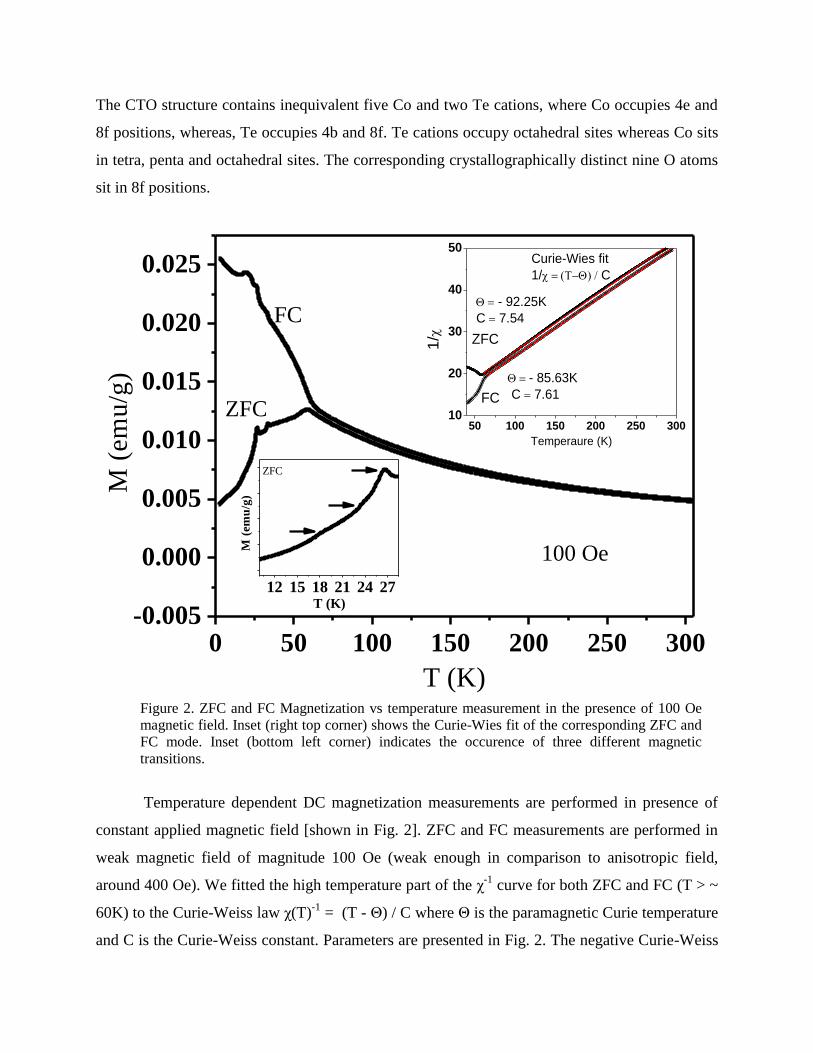
Temperature dependent DC magnetization measurements are performed in presence of
constant applied magnetic field [shown in Fig. 2]. ZFC and FC measurements are performed in
weak magnetic field of magnitude 100 Oe (weak enough in comparison to anisotropic field,
around 400 Oe). We fitted the high temperature part of the χ-1
curve for both ZFC and FC (T > ~
60K) to the Curie-Weiss law χ(T)-1
= (T - Θ) / C where Θ is the paramagnetic Curie temperature
and C is the Curie-Weiss constant. Parameters are presented in Fig. 2. The negative Curie-Weiss
0 50 100 150 200 250 300-0.005
0.000
0.005
0.010
0.015
0.020
0.025
12 15 18 21 24 27
50 100 150 200 250 30010
20
30
40
50
ZFC1/
Temperaure (K)
FC
Curie-Wies fit
1/() C
- 92.25K
C 7.54
- 85.63K
C 7.61
M (
em
u/g
)
T (K)
FC
ZFC
100 OeM (
em
u/g
)
T (K)
ZFC
Figure 2. ZFC and FC Magnetization vs temperature measurement in the presence of 100 Oe
magnetic field. Inset (right top corner) shows the Curie-Wies fit of the corresponding ZFC and
FC mode. Inset (bottom left corner) indicates the occurence of three different magnetic
transitions.
temperature indicates antiferromagnetic (AFM) order. The thermal irreversibility is seen in ZFC
and FC magnetization data near 60K called blocking temperature. We observe three main
magnetic transitions at around 26K, 21.5K and 17.5K in ZFC and FC magnetization curves
(consistent with the neutron diffraction data [6]. Gradual decrease of magnetization (ZFC) below
blocking temperature, generally indicate purely AFM transition. However, in our case,
magnetization first started decreasing from ~ 60K up to ~ 26K and then decrease up to ~ 2K (see
the inset Fig. 3). Different temperature dependencies of magnetization in the temperature ranges
26K to ~ 22 K, from 22 K to 17.5 K and below 17.5 K are observable (see inset Fig. 2),
indicating presence of different phases observed in neutron scattering [6]. Around 35K an
additional transition is observed. Such thermal behaviour of magnetization should be compared
with that of the lattice parameters presented in Figs. 5, 6. Since there is no structural changes
observed throughout the temperature ranges, it is conceivable that nature of phase transition from
phase I to II is first order type. This is so because at around 22 K one observes sharp
discontinuity in all the lattice parameters (shown in Figs. 5, 6).
-0.2 0.0 0.2-0.4
0.0
0.4
-8 -6 -4 -2 0 2 4 6 8
-4
-2
0
2
4
-8 -6 -4 -2 0 2 4 6 8-15
-10
-5
0
5
10
15
M (
emu
/g)
H (T)
2K
M (
em
u/g
)
H (T)
300 K
M (
em
u/g
)
H (T)
2 K
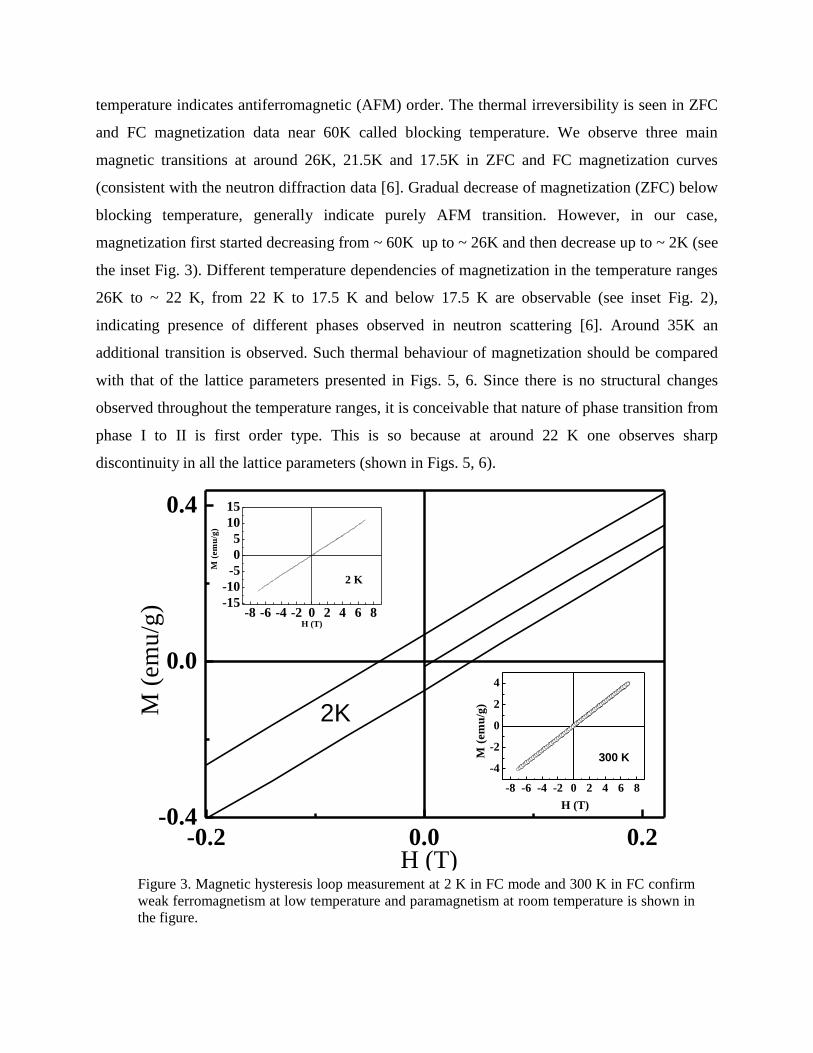
Figure 3. Magnetic hysteresis loop measurement at 2 K in FC mode and 300 K in FC confirm
weak ferromagnetism at low temperature and paramagnetism at room temperature is shown in
the figure.
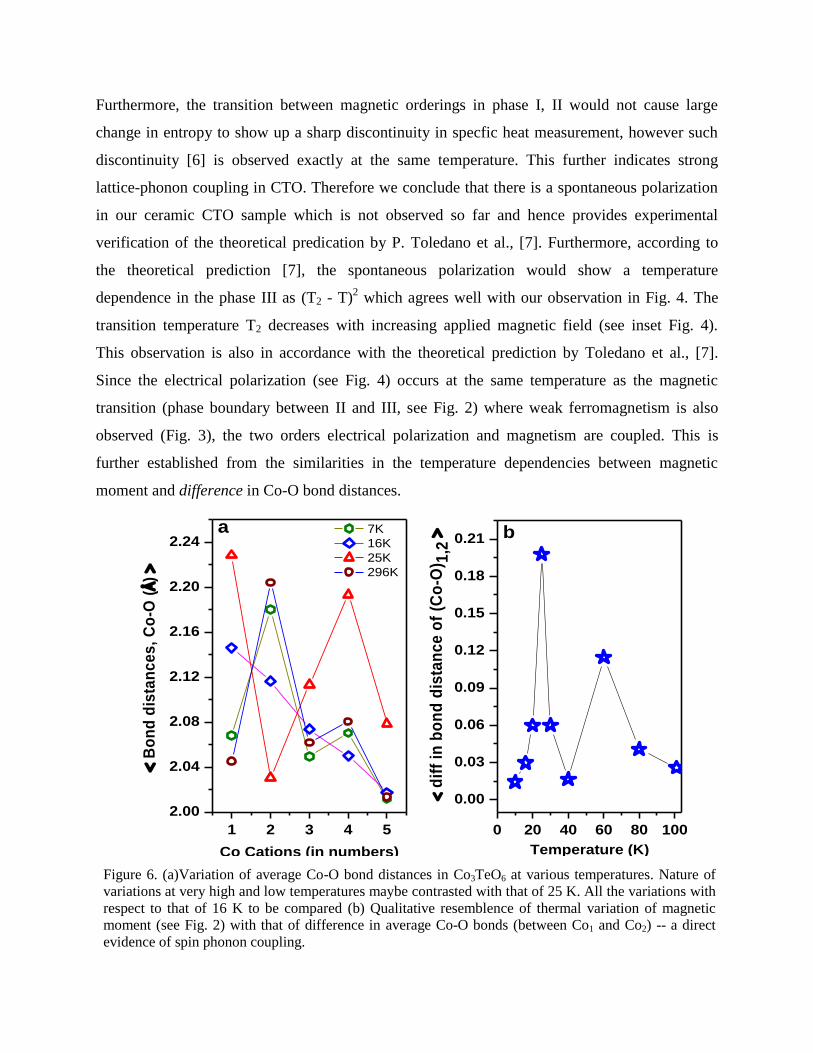
Furthermore, a closer look at Fig. 6 which demonstrates the average Co-O bond distances of
various Co s, indicates that at 16 K i.e. phase -III) the bond length changes very slowly, whereas
at 25 K (phase -I) changes drastically. Discontinuities in all the lattice parameters are limited
only to a small temperature range. Therefore, phase I in our ceramic sample is an
incommensurate antiferromagnetic type whereas the phases II, III are commensurate type. This
becomes more obvious from a closer view of Fig. 6, Co-O bond distances, both at room
temperature (296 K) and 7K show nearly same behavior indicative of commensurate nature. In
contrast, the bond distances at 25 K are exactly asymetric. Strong coupling between spin and
lattice degrees of freedoms become evident from the Fig. 6 (b). A comparision with Fig. 2 shows
overall similarity between the thermal variation of difference in average Co-O bond distances (a
detailed study of which will be reported elsewhere [14]) to that of the magnetic moment (shown
in Fig. 2).
8 12 16 20 24 28 323.3840
3.3845
3.3850
3.3855
3.3860
3.3865
3.3870
14 16 18 20
T (K)
0T
3T
5TT(K)
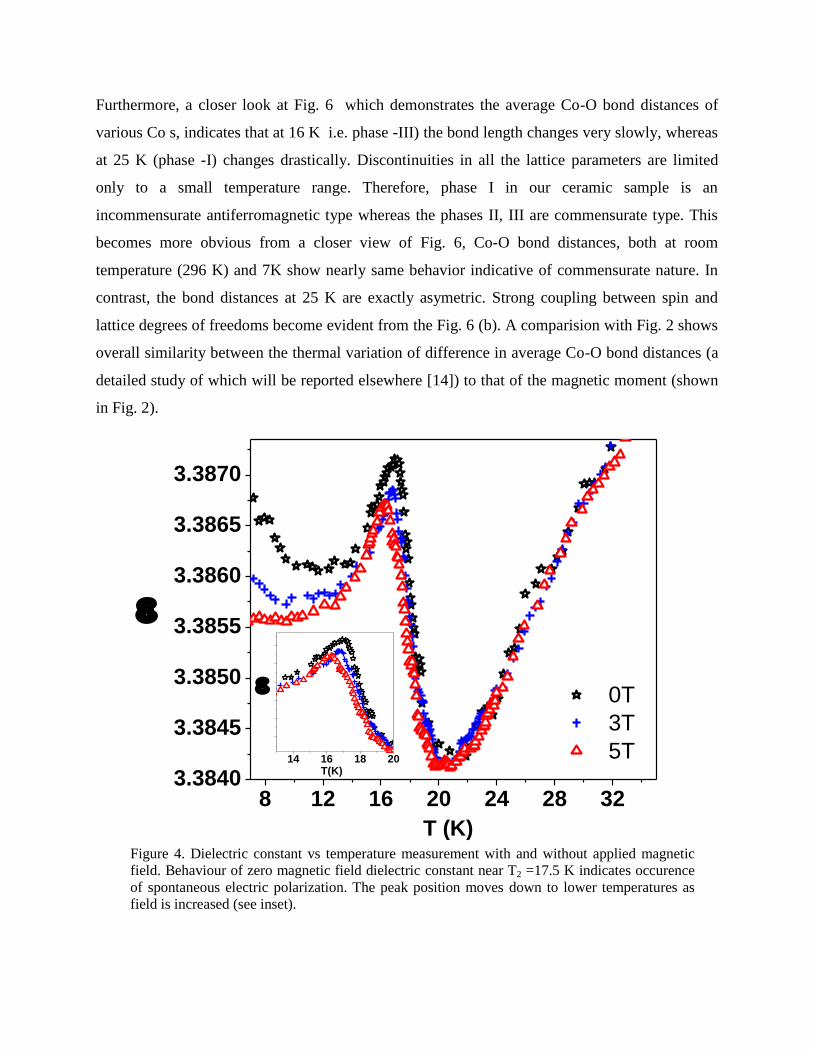
Figure 4. Dielectric constant vs temperature measurement with and without applied magnetic
field. Behaviour of zero magnetic field dielectric constant near T2 =17.5 K indicates occurence
of spontaneous electric polarization. The peak position moves down to lower temperatures as
field is increased (see inset).
According to the prediction by Toledano et al., [7] spontaneous electric polarization is
also accompanied by spontaneous magnetization in phase III. To confirm these, we have
performed magnetic hysteresis loop measurements at 2K and 300K [Fig. 3] as well as dielectric
constant measurements [Fig. 4]. Weak hysteresis loop at 2K confirms the presence of weak
ferromagnetism in the sample. The dielectric constant [Fig. 4] shows a sharp upward turn at
around 21 K which with further lowering in temperature at around T2 = TCFE
≈ 17.5 K, a strong
peak in the dielectric constant is observed in absence of magnetic field (Fig. 4). Such a sharp
upward turn in the dielectric constant appears exactly at the same temperature where all the
lattice parameters show discontinuity. This shows spontaneous polarization in our sample
indicating strong coupling between lattice degrees of freedom and spin. Such changes in lattice
parameter is not causing any structural changes as far as space group is concerned, hence these
modifications in lattice parameters may cause change in the exchange correlation (spin-phonon
coupling) leading to incommensurate to commensurate transition with lowering in temperature,
in agreement with neutron diffraction data [7].
14.70
14.75
14.80
14.85
8.76
8.79
8.82
8.85
8.88
0 20 40 60 80 100
10.26
10.29
10.32
10.35
10.38
0 20 40 60 80 10094.96
94.98
95.00
95.02
a(Å
)
()
b(Å
)
Temperature (K)
c(Å
)
Temperature (K)
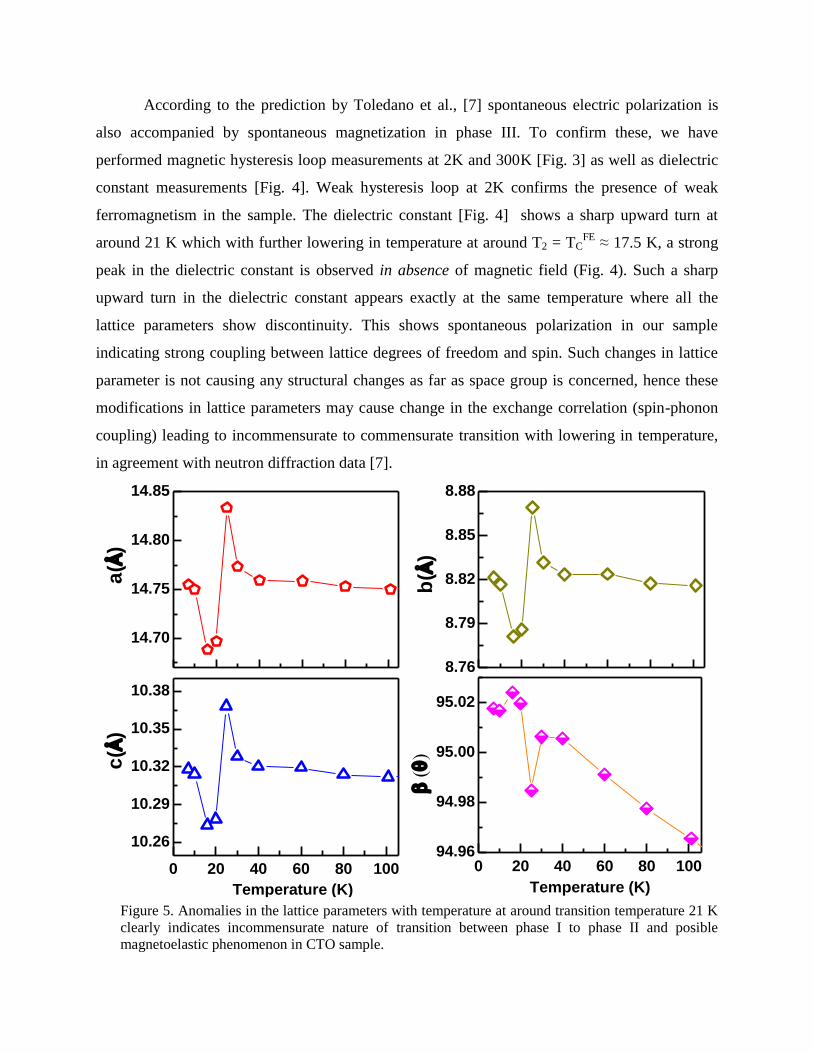
Figure 5. Anomalies in the lattice parameters with temperature at around transition temperature 21 K
clearly indicates incommensurate nature of transition between phase I to phase II and posible
magnetoelastic phenomenon in CTO sample.
Furthermore, the transition between magnetic orderings in phase I, II would not cause large
change in entropy to show up a sharp discontinuity in specfic heat measurement, however such
discontinuity [6] is observed exactly at the same temperature. This further indicates strong
lattice-phonon coupling in CTO. Therefore we conclude that there is a spontaneous polarization
in our ceramic CTO sample which is not observed so far and hence provides experimental
verification of the theoretical predication by P. Toledano et al., [7]. Furthermore, according to
the theoretical prediction [7], the spontaneous polarization would show a temperature
dependence in the phase III as (T2 - T)2 which agrees well with our observation in Fig. 4. The
transition temperature T2 decreases with increasing applied magnetic field (see inset Fig. 4).
This observation is also in accordance with the theoretical prediction by Toledano et al., [7].
Since the electrical polarization (see Fig. 4) occurs at the same temperature as the magnetic
transition (phase boundary between II and III, see Fig. 2) where weak ferromagnetism is also
observed (Fig. 3), the two orders electrical polarization and magnetism are coupled. This is
further established from the similarities in the temperature dependencies between magnetic
moment and difference in Co-O bond distances.
1 2 3 4 5
2.00
2.04
2.08
2.12
2.16
2.20
2.24
0 20 40 60 80 100
0.00
0.03
0.06
0.09
0.12
0.15
0.18
0.21
B
on
d d
ista
nc
es
, C
o-O
(Å
)
Co Cations (in numbers)
7K
16K
25K
296K
a b
d
iff
in b
on
d d
ista
nc
e o
f (C
o-O
) 1,2
Temperature (K)
Figure 6. (a)Variation of average Co-O bond distances in Co3TeO6 at various temperatures. Nature of
variations at very high and low temperatures maybe contrasted with that of 25 K. All the variations with
respect to that of 16 K to be compared (b) Qualitative resemblence of thermal variation of magnetic
moment (see Fig. 2) with that of difference in average Co-O bonds (between Co1 and Co2) -- a direct
evidence of spin phonon coupling.
One of the recent issues in CTO is whether it exhibits zero magnetic field spontaneous
polarization along a particular direction in the low temperature phase (below 18 K) or not.
Whether magnetization also appears along other orthogonal directions or not. We presented
partial answers to the above in this letter. Temperature dependent DC magnetization reveals
complicated magnetic structure in CTO and signature of all the three phases observed in neutron
diffraction. Incommensurate, commensurate magnetic transitions and direct evidence of spin-
phonon coupling are obtained through anamolies in the temperature dependences of lattice
parameters, average Co-O bond distances, and resemblance of magnetic moment with difference
in average Co-O bond distances respectively. The measured dielectric constant exhibits a steep
upward turn at around 21 K forming a well defined peaked structure at around 17.4 K (T2). On
further lowering in temperature, it behaves very similar to (T2 -T)2 and on applying magnetic
field the T2(H) decreases with increasing field. On this phase (at lower temeprature) weak
magnetization is developed as evidenced through hystersis loop. These observations are in very
close agreement with the recent theoretical prediction [7] and may validate the same. We believe
our results will lead to further experimental and theoretical studies in CTO.
Acknowledgements: We thank A. Sundaresan, B. Rajeswaran for magnetic measurements and S. M.
Gupta for useful discussions.
[1] N. Hur et al. Nature 429, 392 (2004); J.H. Choi et al. Appl. Phys. Lett. 77, 4028 (2000);
T. Choi and J. Lee, Appl. Phys. Lett. 84, 5043 (2004); K. Maexa et al. J. Appl. Phys. 93,
11, (2003).
[2] M. Kenzelmann et al. Phys. Rev. Lett. 98, 267205 (2007); T. Kimura, Ann. Rev. Mater.
Res. 37, 387 (2007).
[3] Ivan. A. Sergienko et al. Phys. Rev. B 73, 094434 (2006); I. A. Sergienko, et al. Phys.
Rev. Lett. 97, 227204 (2006).
[4] Hosho. Katsura et al. Phys. Rev. Lett. 95, 057205 (2005).
[5] Dzyaloshinskii, J. Phys. Chem. Solids 4, 241 (1958); T. Moriya, Phys. Rev.120, 91
(1960); K. V. Shanavas, et al. Phys. Rev. B 81, 212406 (2010).
[6] N. V. Golubko et al. Bull. Russ. Acad. Sci.: Phys. 74 724 (2010); I. Zivkovi et al., J.
Phys.: Condens. Matter 22, 056002 (2010); M. Herak et al. J. Phys.: Condens. Matter 17,
7667 (2010); S. A. Ivanov et al. Mater. Res. Bull. 46, 1870 (2011); M. Hudl et al. Phys.
Rev. B 84, 180404(R) (2011).
[7] P. Tol´edano et al. Phys. Rev. B 85, 214439 (2012).
[8] B. Harris, Phys. Rev. B 85, 100403 (R) (2012).
[9] K. Sinha et al. J. Phys. : Conf. Series 925 072017 (2013).
[10] P. Hammersley et al. Nucl. Instr. Meth. A. 346, 312 (1994).
[11] J. Rodriguez-Carvajal, Physica B. 192, 55 (1993).
[12] D. Altermatt et al. Acta Cryst. B41, 244 (1985).
[13] R. Becker et al. Acta Crystallogr. C 62, 167(2006).
[14] W. H. Li et al. Phys. Rev. B 85, 094431 (2012).
[15] S. A. Ivanov et al. Mat. Res. Bull. 47,63 (2012).
[16] H. Singh et al. to be published.
Copyright © 2022 FDOKUMEN