Intermittent aerobic-resistance interval training versus ... - PLOS

Spinal Mechanisms May Provide a Combination ofIntermittent and Continuous Control of Human Posture:Predictions from a Biologically BasedNeuromusculoskeletal ModelLeonardo Abdala Elias*, Renato Naville Watanabe, Andre Fabio Kohn
Biomedical Engineering Laboratory, Escola Politecnica, University of Sao Paulo, Sao Paulo, Brazil
Abstract
Several models have been employed to study human postural control during upright quiet stance. Most have adopted aninverted pendulum approximation to the standing human and theoretical models to account for the neural feedbacknecessary to keep balance. The present study adds to the previous efforts in focusing more closely on modelling thephysiological mechanisms of important elements associated with the control of human posture. This paper studiesneuromuscular mechanisms behind upright stance control by means of a biologically based large-scale neuromusculoske-letal (NMS) model. It encompasses: i) conductance-based spinal neuron models (motor neurons and interneurons); ii)muscle proprioceptor models (spindle and Golgi tendon organ) providing sensory afferent feedback; iii) Hill-type musclemodels of the leg plantar and dorsiflexors; and iv) an inverted pendulum model for the body biomechanics during uprightstance. The motor neuron pools are driven by stochastic spike trains. Simulation results showed that the neuromechanicaloutputs generated by the NMS model resemble experimental data from subjects standing on a stable surface. Interestingfindings were that: i) an intermittent pattern of muscle activation emerged from this posture control model for two of theleg muscles (Medial and Lateral Gastrocnemius); and ii) the Soleus muscle was mostly activated in a continuous manner.These results suggest that the spinal cord anatomy and neurophysiology (e.g., motor unit types, synaptic connectivities,ordered recruitment), along with the modulation of afferent activity, may account for the mixture of intermittent andcontinuous control that has been a subject of debate in recent studies on postural control. Another finding was theoccurrence of the so-called ‘‘paradoxical’’ behaviour of muscle fibre lengths as a function of postural sway. The simulationsconfirmed previous conjectures that reciprocal inhibition is possibly contributing to this effect, but on the other handshowed that this effect may arise without any anticipatory neural control mechanism.
Citation: Elias LA, Watanabe RN, Kohn AF (2014) Spinal Mechanisms May Provide a Combination of Intermittent and Continuous Control of Human Posture:Predictions from a Biologically Based Neuromusculoskeletal Model. PLoS Comput Biol 10(11): e1003944. doi:10.1371/journal.pcbi.1003944
Editor: Francisco J. Valero-Cuevas, University of Southern California, United States of America
Received May 20, 2014; Accepted September 27, 2014; Published November 13, 2014
Copyright: � 2014 Elias et al. This is an open-access article distributed under the terms of the Creative Commons Attribution License, which permits unrestricteduse, distribution, and reproduction in any medium, provided the original author and source are credited.
Data Availability: The authors confirm that all data underlying the findings are fully available without restriction. All data files and source codes are availablefrom the figshare database (DOIs 10.6084/m9.figshare.1029085, 10.6084/m9.figshare.1027609, 10.6084/m9.figshare.1029084).
Funding: This study was funded by Grants from Sao Paulo Research Foundation (FAPESP - www.fapesp.br) and CNPq (Brazilian NSF - www.cnpq.br). LAE receiveda PhD scholarship (Grant no. 2009/15802-0) and a Post-Doctoral Grant (Grant no. 2013/1043301) from FAPESP. RNW holds a PhD scholarship from FAPESP (Grantno. 2011/21103-7). AFK was funded by a Grant from CNPq (Grant no. 303313/2011-0). The funders had no role in study design, data collections and analysis,decision to publish, or preparation of the manuscript.
Competing Interests: The authors have declared that no competing interests exist.
* Email: [email protected]
Introduction
The maintenance of upright quiet stance is a challenging task for
the central nervous system (CNS), and the objective is to achieve the
control of an intrinsically unstable biomechanical system under the
effect of gravity. Posture control is a position control problem in
which the CNS, leg muscles, and different sensory systems (e.g., the
muscle proprioceptors) interact to maintain the horizontal projec-
tion of the centre of mass (COM) within a region bounded by the
feet (for a review of the basics of posture control, see [1]). Sensory
systems, such as the vestibular, visual, and somatosensory, play a
significant role in the aforementioned motor task, so that disorders
in any of these systems may lead to postural instability [2,3].
A conceptual question under debate in the literature concerns
the manner the CNS controls upright stance in adults (i.e., human
beings who already learned to walk). Some researchers argue in
favour of a negative-feedback continuous control, with the leg
muscles reflexively activated in response to drifts or perturbations
away from an equilibrium position [4–6]. Conversely, others
suggest that an anticipatory (feedforward) mechanism is necessary
to explain some findings, such as the low feedback gains observed
in some experiments [7–9]. More recently, the view that human
upright stance is controlled by an intermittent mechanism has
grown [10–15]. The latter is based in part on results from an
experiment involving the manual balancing of a virtual inverted
pendulum controlled by a subject through a computer joystick
[13]. Additionally, other recent studies showed that motor units
(MUs) of the Medial Gastrocnemius (MG) muscle exhibited an
intermittent recruitment during upright quiet stance with a pattern
closely linked to COM and centre of pressure (COP) fluctuations
PLOS Computational Biology | www.ploscompbiol.org 1 November 2014 | Volume 10 | Issue 11 | e1003944
[14,16]. It is noteworthy that the previously referred papers used a
wide-sense/physiological conceptualisation of intermittent postur-
al control, which is understood as one exhibiting discrete (bursty)
actions of the neuronal controller, producing ballistic-like (phasic)
muscle activations. In addition to this more qualitative/physio-
logical view of intermittency, there is a strict, quantitative,
definition of intermittent control that has also been used to
analyse motor control problems, such as stick balancing and
postural control [17]. In the present study we will adopt the former
(physiological) view of intermittency.
From a theoretical standpoint, mathematical models have been
developed to describe and to investigate human postural control.
These models explicitly incorporate the above-mentioned control
strategies hypothesised to be adopted by the CNS during upright
standing control, but do not identify which part of the CNS the
control resides, e.g. cortex, brainstem, cerebellum, spinal cord. For
instance, [4,5,18–20] represented the postural control system as a
negative-feedback continuous control system, so that propriocep-
tive information of body position and velocity were fed back to the
CNS. Alternatively, the models proposed by [21–23] adopted a
continuous predictive control system, while others [11,12,24,25]
represented the control of posture as an intermittent control
system. Despite these fundamental differences, all these models
were based on a control engineering framework, whereby the
whole system was simplified and the CNS was represented by a
PD/PID (proportional-derivative/proportional-integral-deriva-
tive) controller, an optimal continuous controller or an intermit-
tent controller that activated the muscles in discrete bursts. Despite
their advantages of a relative simplicity and the power of
explanation, it is not easy to translate their results in terms of
the underlying physiological mechanisms involved in the control of
human posture.
The present study aims at providing a complementary approach
to those mentioned above in that the fundamental focus is on
biology (anatomy and physiology). A large amount of physiological
knowledge, from the behaviour of neuronal ionic channels to the
dynamics of muscle contraction, was funnelled into a large-scale
mathematical model of the nervous, muscular, and biomechanical
systems involved in posture control. In this vein, a biologically
based large-scale neuromusculoskeletal (NMS) model was devel-
oped and used to investigate the problem of postural control from
a more neurophysiological standpoint. The model encompasses: i)
a spinal neuronal network, which includes conductance-based
models of both a motor neurons (MNs) and interneurons (INs); ii)
Hill-type muscle models to represent the viscoelastic properties of
the Soleus (SO), MG, Lateral Gastrocnemius (LG), and Tibialis
Anterior (TA) muscles; iii) models of both muscle spindle and
Golgi tendon organ (GTO); iv) afferent fibres providing Ia, II, and
Ib feedback; and v) an inverted pendulum model, which is a first
approximation of upright quiet stance [26]. Here the propriocep-
tive feedback is provided by muscular proprioceptors (i.e., spindles
and GTOs), since they seem to be largely responsible for the
position sense of the limb [27,28]. The first hypothesis of the
present study is that stance control might be properly achieved by
a spinal-like controller (SLC, approximated here by the developed
NMS model) based on a proprioceptive feedback. An associated
second hypothesis is that the activation of leg muscles by this SLC
is a continuous process yielding the maintenance of human body
equilibrium.
Another relevant issue related to postural control that the
present study analyses is related to recent experimental findings of
a ‘‘paradoxical’’ behaviour of the calf’s muscle fibre lengths during
postural sway [29,30]. The behaviour was called ‘‘paradoxical’’
because the muscle fibre lengths were negatively correlated with
COM/COP displacements [31]. These studies proposed that
reciprocal inhibition from antagonistic (TA) Ia afferents might be
responsible for this unexpected motor behaviour. With the
availability of the detailed NMS model employed in the present
study, the correlation between muscle fibre length and COM/
COP displacements could be tackled without much difficulty.
Therefore, a third hypothesis of the present study is that a model
structure without the reciprocal inhibition pathway (from TA Ia
afferents to Triceps Surae MNs) would exhibit positive correlation
coefficients between muscle fibre length and COM/COP
displacements. A complement of this hypothesis is that the
reciprocal inhibition neural circuit may increase the probability
of occurrence of the ‘‘paradoxical’’ relation mentioned above. This
combined third hypothesis is, therefore, evaluated here using the
complex NMS physiological model in order to verify a hypothesis
put forward by previous authors on the basis of heuristics and
experimental results from humans [29–31].
To the best of our knowledge, this is the first study to address the
control of an intrinsically unstable neuro-biomechanical system
associated with the maintenance of human quiet standing by
means of a complex large-scale system mostly based on known
physiology. However, others have also used biologically based
reductionist models of the NMS system to investigate how the
CNS controls other motor tasks [32,33]. A minor part of this
material was already published as conference abstracts [34,35].
Results
Model Validation in Terms of Postural ControlTypical biomechanical and neuronal outputs of the NMS model
are presented in Figure 1. The model’s responses resemble
qualitatively those frequently reported in postural control studies
(e.g., [9,29,36]). Irrespective of model structure (i.e., Model 1 or
Model 2 - see Methods for details), the inverted pendulum leaned
about 5 deg forward (equilibrium point), so that COM and COP
displacements oscillated around a basal value of 80 mm (see
Figure 1A). The basal plantar-flexion torque (negative torque) was
*10% of the maximum isometric torque produced by the model.
One can notice that COM and COP (Figure 1A) oscillated in anti-
Author Summary
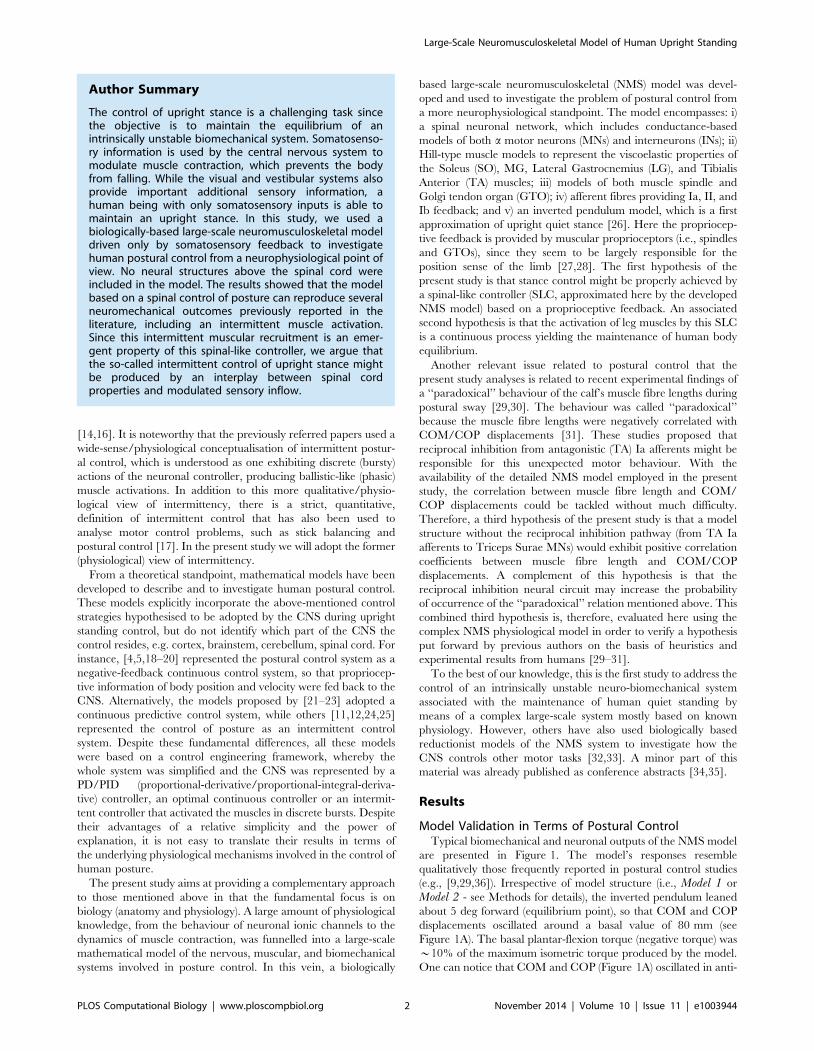
The control of upright stance is a challenging task sincethe objective is to maintain the equilibrium of anintrinsically unstable biomechanical system. Somatosenso-ry information is used by the central nervous system tomodulate muscle contraction, which prevents the bodyfrom falling. While the visual and vestibular systems alsoprovide important additional sensory information, ahuman being with only somatosensory inputs is able tomaintain an upright stance. In this study, we used abiologically-based large-scale neuromusculoskeletal modeldriven only by somatosensory feedback to investigatehuman postural control from a neurophysiological point ofview. No neural structures above the spinal cord wereincluded in the model. The results showed that the modelbased on a spinal control of posture can reproduce severalneuromechanical outcomes previously reported in theliterature, including an intermittent muscle activation.Since this intermittent muscular recruitment is an emer-gent property of this spinal-like controller, we argue thatthe so-called intermittent control of upright stance mightbe produced by an interplay between spinal cordproperties and modulated sensory inflow.
Large-Scale Neuromusculoskeletal Model of Human Upright Standing
PLOS Computational Biology | www.ploscompbiol.org 2 November 2014 | Volume 10 | Issue 11 | e1003944

phase with respect to the muscle torque (Figure 1B), i.e. when the
body leaned forward from its equilibrium position the plantar-
flexion torque increased (more negative). Conversely, muscle
activations (EMG envelopes in Figure 1C-E) were modulated
approximately in phase with postural sway. In the simulations, TA
muscle was silent during postural sway (not shown).
A quantitative analysis was performed to validate the model
with respect to the available data from the literature. Typical time-
domain metrics were calculated from the COP time series and
compared to data from normal subjects and vestibular loss patients
standing on a force plate without visual information (see Table 1).
Root mean square (RMS) and mean velocity (MV) of simulated
COP were higher than the values observed experimentally in
normal subjects, but compatible with data from vestibular loss
patients. Another quantitative validation was based on a cross-
correlation analysis performed between the COM and COP time
series (Figure 2A-B), as well as between COP and EMG envelopes
(Figure 2C-D). COM and COP were highly correlated (r&1) at
lag zero. COP and EMG envelopes were positively correlated with
the correlation peak occurring at a positive lag. Correlation
coefficients (r) and cross-correlation peak lag values were
compatible with experimental data from healthy subjects (see
Table 1). In general, correlation coefficients were higher for
Gastrocnemii in comparison to the SO, and muscles’ activations
(EMGs) were advanced by approximately 200–300 ms in relation
to the postural sway (COP). The 50% power frequency (F50)
estimated from the COP power spectrum (see Figure 2E-F)
resulted quite similar to the value from healthy subjects (see
Table 1). COP power spectra of both model structures were
limited to *1 Hz.
A final quantitative validation was based on the pooled
histogram of COM displacements (1-mm bins) as shown in
Figure 3 (data are from the simulations of Model 2). The
histogram shape was bimodal, with two peaks around the
equilibrium position of the inverted pendulum (value 0 in the
abscissa). The Jarque-Bera goodness-of-fit test was applied to
verify if this histogram could be fitted by a typical Gaussian
probability density function [11]. The null-hypothesis (the
histogram comes from an unimodal Gaussian function) was
rejected (p~0:001). The same result was obtained for Model 1.
Intermittent Recruitment of the Motor UnitsFigures 4 and 5 show how the spike trains from spinal MNs,
INs, and afferent fibres were modulated during postural sway. An
interesting qualitative finding was that MUs from the MG muscle
were intermittently recruited/de-recruited as the inverted pendu-
lum swayed forward/backward (Figure 4B). This intermittent
pattern of MU recruitment was similar for the LG muscle (not
shown), but less evident for the SO muscle (see Figure 5A). The
degree of intermittency for the MG and SO MUs was quantified
Figure 1. Neuromechanical outputs of the postural control model (Model 2) for a typical simulation. (A) Anteroposterior centre of mass(COM; gray curve) and centre of pressure (COP; black curve) displacements. (B) Muscular torque produced during postural sway. The negative valuerepresents a plantar-flexion torque produced by the leg muscles (activation of the Triceps Surae muscle group) (C-E) Electromyogram (EMG)envelopes from Soleus (SO), Medial Gastrocnemius (MG), and Lateral Gastrocnemius (LG) muscles.doi:10.1371/journal.pcbi.1003944.g001
Large-Scale Neuromusculoskeletal Model of Human Upright Standing
PLOS Computational Biology | www.ploscompbiol.org 3 November 2014 | Volume 10 | Issue 11 | e1003944

Figure 2. Cross-correlation functions and centre of pressure (COP) power spectra for typical simulations carried out on Model 1(graphs A, C, and E) and Model 2 (graphs B, D, and F). (A-B) Cross-correlation functions between centre of mass (COM) and COP. Note that forboth models, cross-correlation peaks occurred at zero lag (dashed lines). (C-D) Cross-correlation functions between COP and muscle electromyograms(EMGs). Black, red, and blue curves represent cross-correlation functions for Soleus (SO), Medial Gastrocnemius (MG), and Lateral Gastrocnemius (LG),respectively. Irrespective of the model structure, there was a lag of about 300 ms between COP and EMG envelopes from the three muscles. (E-F) COPpower spectra. Dashed line represents the 50% power frequency (F50). It is noteworthy that for Model 2 there was a broader bandwidth incomparison to Model 1.doi:10.1371/journal.pcbi.1003944.g002
Table 1. Centre of Pressure (COP) metrics and cross-correlation analysis between COP and electromyogram (EMG) obtained fromthe two model structures in comparison with experimental data reported in the literature.
Variable (Unit) Model 1 (n = 3) Model 2 (n = 3) Experimental Data (n) [Ref.]
COP RMS (mm) 9.24 + 0.92 9.75 + 0.99 3.82 + 1.54 (20) [42]
14.90 + 11.50 (10) [3]
COP MV (mm/s) 9.14 + 0.93 10.83 + 0.86 6.72 + 2.18 (20) [42]
60.20 + 59.90 (10) [3]
COP F50 (Hz) 0.29 + 0.01 0.31 + 0.03 0.30 + 0.09 (20) [42]
COP{EMGSO r (2) 0.39 + 0.11 0.15 + 0.13 0.57 + 0.20 (16) [43]
COP{EMGMG r (2) 0.63 + 0.11 0.40 + 0.09 0.71 + 0.12 (16) [43]
COP{EMGLG r (2) 0.62 + 0.16 0.40 + 0.08 0.59 + 0.20 (16) [43]
*0.45 (7) [9]
COP{EMGSO Peak Lag (ms) 213.50 + 25.50 247.80 + 73.60 200 + 20 (16) [43]
COP{EMGMG Peak Lag (ms) 351.50 + 50.40 322.30 + 25.80 190 + 40 (16) [43]
COP{EMGLG Peak Lag (ms) 311.70 + 86.20 268.80 + 49.40 210 + 30 (16) [43]
240–270 (7) [9]
Model 1 is the postural control model without reciprocal inhibition, whereas Model 2 is the complete postural control model (see Methods for details concerning modelstructures). Data are expressed as Mean + Standard Deviation. F50 is defined as the frequency at which 50% of the total power of the COP is confined (see DataAnalysis). Values of r were measured as the peak values of the cross-correlation functions between COP and the EMGs of the Triceps Surae (TS) muscles (i.e., SO, MG, andLG). Data from [9,42,43] were obtained from healthy young subjects standing on a stable surface without visual feedback, while [3] provided data from vestibular losspatients standing on a stable surface without visual feedback.doi:10.1371/journal.pcbi.1003944.t001
Large-Scale Neuromusculoskeletal Model of Human Upright Standing
PLOS Computational Biology | www.ploscompbiol.org 4 November 2014 | Volume 10 | Issue 11 | e1003944

by the activation ratio (see [16] and Methods for details). The
median (range) activation ratios calculated for 90 randomly
selected MG MUs (30 MUs were chosen per simulation) from
Model 1 and Model 2 were 0.69 (0.44–0.80) and 0.65 (0.47–0.81),
respectively. For 90 randomly selected SO MUs the activation
ratios were 0.97 (0.75–1) and 0.96 (0.79–1) for Model 1 and Model2, respectively. Because of these results, the MG and LG muscles
were considered to have ballistic-like activations (see EMG
envelopes in Figures 1D-E and 4B), while the SO muscle was
mostly tonically (continuously) active during the maintenance of
an upright posture (see Figures 1C and 5A).
In order to quantify the intermittent recruitment of MG MUs,
the interval between successive recruitments was computed for a
subset of 30 randomly chosen MUs (10 MUs were chosen per
simulation). In accordance with the method used by [14],
intermittent recruitment was considered if a given MU was
discharging at a rate lower than 4 Hz (i.e., interspike intervals
higher than 250 ms). For Model 1, 899 intervals of 30 MG MUs
were evaluated and the mean (modal) interval between successive
recruitments was equal to 511 (274) ms [i.e. a mean (modal) rate
equal to 1.96 (3.65) Hz]. Similarly, for Model 2, 846 intervals of 30
MG MUs had a mean (modal) value of 505 (277) ms [1.98 (3.61)
Hz]. Therefore, both model structures produced a similar
intermittent recruitment pattern on MG MUs. A low number of
LG MUs was recruited (less than 30) and the SO MUs were mostly
tonically active during the simulation of postural control (see the
activation ratios in previous paragraph), hence the intermittency of
the MUs from these muscles were not quantitatively evaluated
here.
Panels C-I in Figure 4 and panel B in Figure 5 show typical
results of how proprioceptive feedback (encompassing afferent
fibres and spinal INs) was modulated during sway (Model 2 was
used for this simulation). The activity of the Ia afferents from the
MG muscle (Figure 4C) was highly modulated, following approx-
Figure 3. Pooled histogram of centre of mass (COM) displace-ments from the simulations performed on Model 2. The meanvalues of COM displacement (mean equilibrium positions of theinverted pendulum) were subtracted from each simulated COM timeseries so that the data from different simulation runs could be pooledand hence plotted in the same graph. Note that the histogram exhibitsa clear bimodal shape (see text for details).doi:10.1371/journal.pcbi.1003944.g003
Figure 4. Intermittent recruitment of Medial Gastrocnemius (MG) motor units (MUs) and modulation of proprioceptive feedback(typical simulation performed on Model 2). (A) Centre of mass (COM; gray curve) and centre of pressure (COP; black curve) displacements. (B)Raster plots (black dots) of *40 MG MUs intermittently recruited during quiet standing. Red curve represents the global MG electromyogram (EMG)envelope. Note the ballistic-like (phasic) activation of this muscle during postural sway. (C) Raster plots for the population of Ia afferents from the MGmuscle. Note the clear modulation in the recruitment of primary afferents. In addition, continuous curves show the instantaneous firing rate(estimated by a Gaussian kernel convolved with the spike trains) for three Ia afferents (4, 16, 28). (D-F) Raster plots for group II excitatory interneurons(INs), Ib inhibitory INs, and Ia inhibitory INs. Continuous curves in panels D and E represent the instantaneous firing rate for two type-specified INs (2and 94 for group II INs; 24 and 94 for Ib INs). (G-I) Raster plots for type II afferents from MG muscle spindle, Ib afferents from MG muscle spindle, andIa afferents from TA muscle spindle. Continuous curves in panels G and H represent the instantaneous firing rate of two type-specified afferent fibres(9 and 28 for type-II afferents; 22 and 39 for Ib afferents).doi:10.1371/journal.pcbi.1003944.g004
Large-Scale Neuromusculoskeletal Model of Human Upright Standing
PLOS Computational Biology | www.ploscompbiol.org 5 November 2014 | Volume 10 | Issue 11 | e1003944
imately the COM/COP displacement (note the firing rate
modulation for three different Ia afferents, as indicated by the
thin lines). Since there was little variation in the MG muscle torque
(RMS value *2.50% of the maximum MG muscle torque) and
the mean MG muscle fibre length was maintained at an
approximately steady value (i.e., there was little change in the
static component of the muscle fibre length - see below), the
activities of Ib and type II afferents were minimally modulated (see
panels G and H in Figure 4). The proprioceptive pathways
responsible for the reciprocal inhibition were also highly modu-
lated during postural sway (see panels F and I in Figure 4).
Inhibitory Ia INs discharged phasically when the inverted
pendulum swayed backward and this contributed to a decrease
in the ankle joint torque generated by the plantar flexor muscles.
Conversely, Ia afferents from the SO muscle spindles were poorly
modulated in the posture control task (see Figure 5B).
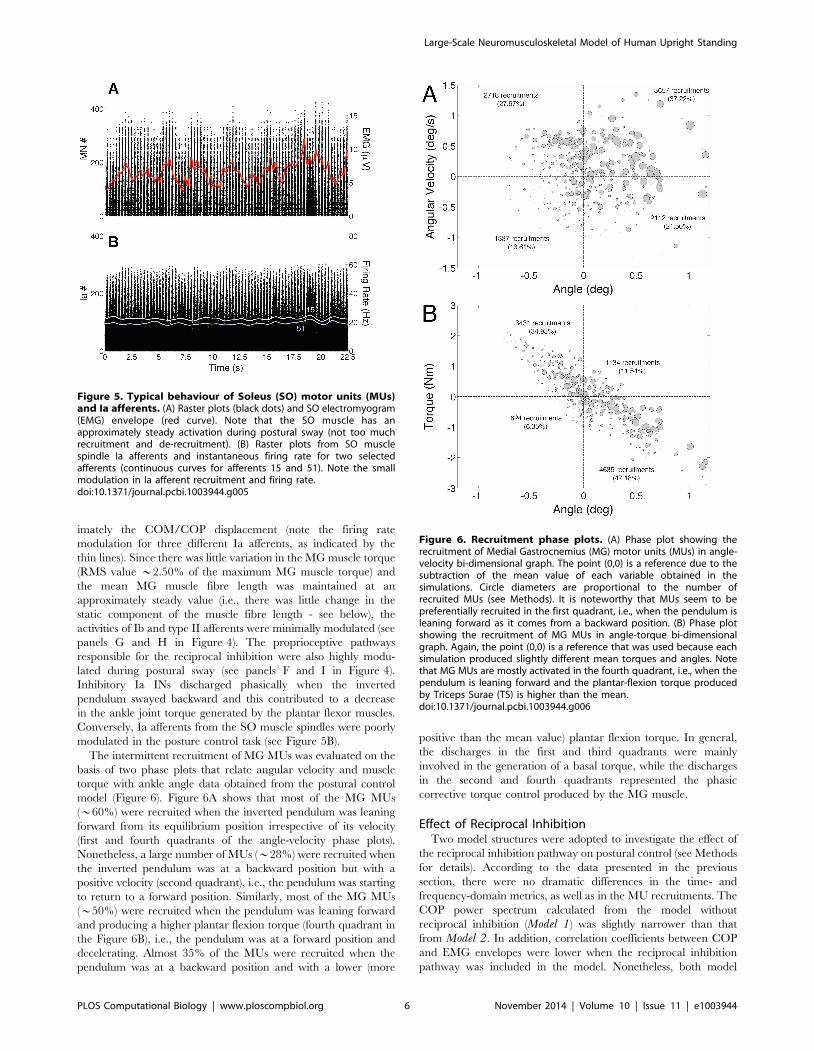
The intermittent recruitment of MG MUs was evaluated on the
basis of two phase plots that relate angular velocity and muscle
torque with ankle angle data obtained from the postural control
model (Figure 6). Figure 6A shows that most of the MG MUs
(*60%) were recruited when the inverted pendulum was leaning
forward from its equilibrium position irrespective of its velocity
(first and fourth quadrants of the angle-velocity phase plots).
Nonetheless, a large number of MUs (*28%) were recruited when
the inverted pendulum was at a backward position but with a
positive velocity (second quadrant), i.e., the pendulum was starting
to return to a forward position. Similarly, most of the MG MUs
(*50%) were recruited when the pendulum was leaning forward
and producing a higher plantar flexion torque (fourth quadrant in
the Figure 6B), i.e., the pendulum was at a forward position and
decelerating. Almost 35% of the MUs were recruited when the
pendulum was at a backward position and with a lower (more
positive than the mean value) plantar flexion torque. In general,
the discharges in the first and third quadrants were mainly
involved in the generation of a basal torque, while the discharges
in the second and fourth quadrants represented the phasic
corrective torque control produced by the MG muscle.
Effect of Reciprocal InhibitionTwo model structures were adopted to investigate the effect of
the reciprocal inhibition pathway on postural control (see Methods
for details). According to the data presented in the previous
section, there were no dramatic differences in the time- and
frequency-domain metrics, as well as in the MU recruitments. The
COP power spectrum calculated from the model without
reciprocal inhibition (Model 1) was slightly narrower than that
from Model 2. In addition, correlation coefficients between COP
and EMG envelopes were lower when the reciprocal inhibition
pathway was included in the model. Nonetheless, both model
Figure 6. Recruitment phase plots. (A) Phase plot showing therecruitment of Medial Gastrocnemius (MG) motor units (MUs) in angle-velocity bi-dimensional graph. The point (0,0) is a reference due to thesubtraction of the mean value of each variable obtained in thesimulations. Circle diameters are proportional to the number ofrecruited MUs (see Methods). It is noteworthy that MUs seem to bepreferentially recruited in the first quadrant, i.e., when the pendulum isleaning forward as it comes from a backward position. (B) Phase plotshowing the recruitment of MG MUs in angle-torque bi-dimensionalgraph. Again, the point (0,0) is a reference that was used because eachsimulation produced slightly different mean torques and angles. Notethat MG MUs are mostly activated in the fourth quadrant, i.e., when thependulum is leaning forward and the plantar-flexion torque producedby Triceps Surae (TS) is higher than the mean.doi:10.1371/journal.pcbi.1003944.g006
Figure 5. Typical behaviour of Soleus (SO) motor units (MUs)and Ia afferents. (A) Raster plots (black dots) and SO electromyogram(EMG) envelope (red curve). Note that the SO muscle has anapproximately steady activation during postural sway (not too muchrecruitment and de-recruitment). (B) Raster plots from SO musclespindle Ia afferents and instantaneous firing rate for two selectedafferents (continuous curves for afferents 15 and 51). Note the smallmodulation in Ia afferent recruitment and firing rate.doi:10.1371/journal.pcbi.1003944.g005
Large-Scale Neuromusculoskeletal Model of Human Upright Standing
PLOS Computational Biology | www.ploscompbiol.org 6 November 2014 | Volume 10 | Issue 11 | e1003944

structures produced fluctuating outputs that resembled experi-
mental data, suggesting that reciprocal inhibition from TA Ia
afferents is not a strict requisite for the control of upright standing.
In the present study, we tested the hypothesis that reciprocal
inhibition may be responsible for the negative correlation between
muscle fibre length and COM/COP displacement [29–31]. This
was tested by performing a correlation analysis between COM
displacements and muscle fibre lengths for the SO, MG, and TA.
Typical signals representing these variables are shown in Figure 7.
For this typical simulation (Model 2) one can notice that MG
muscle fibre length was positively correlated with COM, while TA
muscle fibre length and COM displacement were negatively
correlated. The latter results are a typical ‘‘orthodox’’ behaviour
that has been shown for some healthy subjects during upright quiet
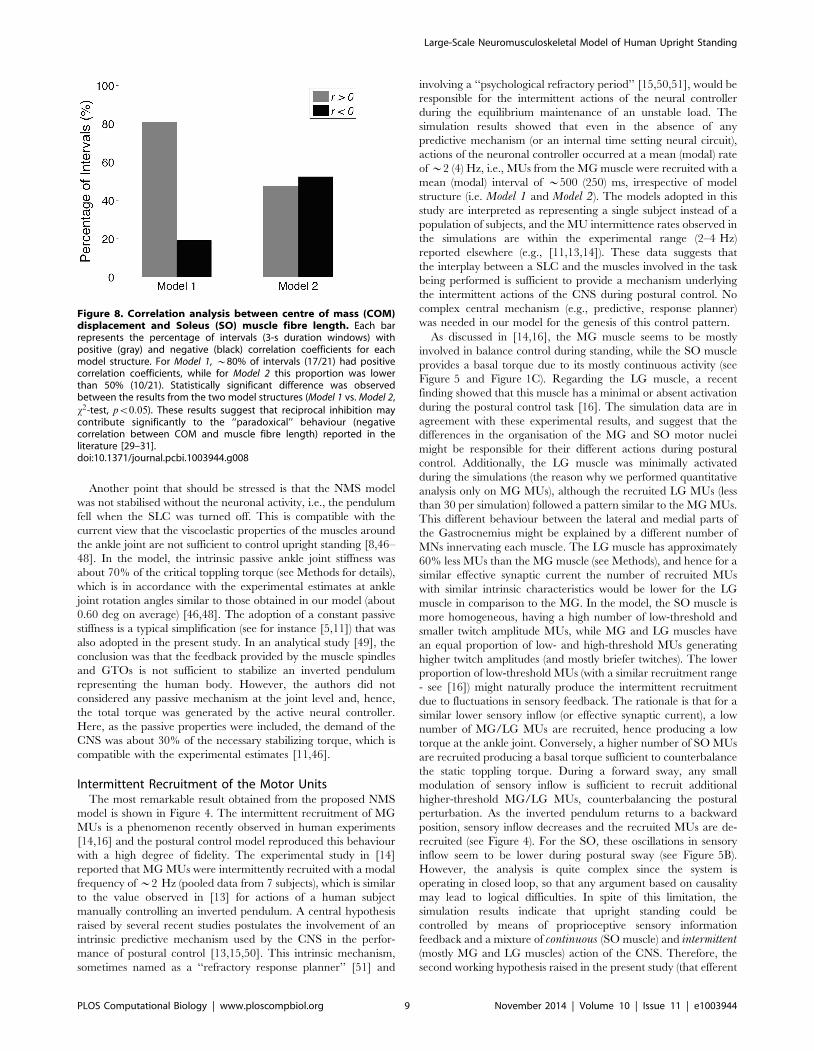
standing [29]. For the SO muscle, a more quantitative analysis was
performed (see Figure 8). Correlation analysis between SO muscle
fibre length and COM displacement was performed on 3-s
windows (see dashed vertical lines in Figure 7) according to the
method adopted in [29]. Correlation coefficients calculated from
Model 1 and Model 2 were pooled into two groups: positively
correlated (rw0) and negatively correlated (rv0). For Model 1most of the intervals (*80%) showed a positive correlation
between SO muscle fibre length and COM displacement (i.e.,
‘‘orthodox’’ behaviour), whereas for Model 2 the number of
negatively correlated intervals increased to *50%. x2-test
revealed a statistically significant difference (pv0:05) between
the responses of the two model structures. This suggests that, at
least for the SO muscle, reciprocal inhibition might be involved in
the genesis of the ‘‘paradoxical’’ behaviour of muscle fibre length.
Nonetheless, a small percentage of negatively correlated intervals
(*20%) might also be generated in the absence of any reciprocal
inhibition from antagonistic Ia afferents.
Discussion
A large-scale NMS model was applied in the present study to
the problem of controlling upright standing in humans. A different
feature of this approach in comparison with most of the previous
studies in the literature (e.g., [4–6,10–12,18,19,22–24]) is that the
structure and behaviours of each element were based on known
physiology, anatomy, and biomechanics encompassing important
parts of the postural control system. Therefore, the control strategy
employed by the modelled CNS emerged from the interaction
between several neuromechanical elements involved. While the
overall mechanisms that control the inverted pendulum sway are
beyond an analytical understanding, the increased biological
realism provides important clues regarding some putative neuro-
physiological mechanisms underlying the posture control task. In
the following sections, the results presented earlier shall be
discussed with respect to relevant experimental findings reported
in the literature.
Postural Control in Quiet StandingThe results presented here showed that a SLC was effective in
maintaining the equilibrium of an intrinsically unstable biome-
chanical system (see Figure 1 for an illustrative example). This
leads to the first contribution of this study, which is to support the
hypothesis that human upright quiet standing may be properly
controlled by spinal mechanisms, for example, without any cortical
involvement. This view is consistent with several studies, which
suggest that cortical control is decreased or may be absent when a
motor task is well trained (e.g., [30–40]). Normal quiet postural
control, under no special restrictions (as standing on a narrow
beam or during dual tasks), is certainly a candidate for a well-
trained task that would not require cortical control. Since the
scope of the present study is limited to the investigation of
neurophysiological mechanisms underlying the control of quiet
standing, the assumed lack of supraspinal neural structures should
not limit the ensuing interpretations. A separate section below (see
Model Limitations and Future Research) presents and discusses
the limitations both of the modelling as well as the conclusions
derived from the simulations.
Time- and frequency-domain metrics obtained from the NMS
model were compatible with experimental data (see Table 1). The
equilibrium values of the inverted pendulum (mean angle, torque,
and COM/COP displacements) varied slightly both within and
between simulations due to programmed (randomised) changes in
system configuration. Between-simulation changes occurred due to
changes in neuronal connectivities and intrinsic properties (e.g.,
action potential thresholds) that were randomly attributed at the
beginning of each simulation [41]. On the other hand, within-
simulation variations were mainly related to the number of
recruited MUs, which varied stochastically due to neuronal noise.
Therefore, the mean equilibrium position of the body depends on
the overall instantaneous configuration of the postural control
system. The analysis of the COP time series showed that the model
was less stable (i.e., presented a larger postural oscillation) than
healthy young subjects [42]. Notwithstanding, simulated data were
compatible with those from vestibular loss subjects standing on a
stable surface without visual information [3]. As a consequence,
the simulation results reinforce that the increased postural
oscillation observed in patients may be due to the lack of other
sensory inputs providing information to the CNS, such as
vestibular and visual sources. Or, in other words, the propriocep-
tive feedback gain in such patients is not sufficient to replace the
other missing sensory feedback modalities. Interestingly, the
variability observed in the simulated postural sway was exclusively
generated by the variability in sensory afferents and descending
commands, which results in random fluctuations of motoneuronal
discharges. Therefore, it is predicted that most of the biomechan-
ical variability (sway) observed during upright standing has a
neuronal origin and is less influenced by internal disturbing forces
(e.g., heartbeats and respiration) as proposed elsewhere
[4,6,8,11,25].
The cross-correlation analysis (Figure 2) showed that EMGs
from the Triceps Surae (TS) muscles were positively correlated
with postural sway (as measured by the COP). Simulation results
are in accordance with experimental data that showed higher
correlation coefficients between EMGs from Gastrocnemii and
COP [9,43]. Additionally, the time lags between COP and EMGs
were within a range of 200–300 ms, which is also compatible with
experimental data [9,43]. This is in some sense a remarkable result
that emerged from the NMS model since the sum of the afferent
and efferent action potential propagation delays is much smaller
than this time lag between COP and EMG. Albeit qualitative, or
semi-quantitative, this is a relatively strong sign that the model was
able to capture at least a part of the overall system dynamics. In
[9] it is argued that the existence of this lag between the
mechanical and neuronal responses would be due to an
anticipatory action of the neuronal controller, i.e., the postural
control is mediated by a feedforward mechanism. However,
theoretical and computer simulation studies [19] showed that even
in the absence of any feedforward mechanism, lags between
neuromechanical signals may be obtained depending on the
parameters of the continuous feedback system and stochastic
features of the input signals. The results presented here
corroborate the latter view, since no feedforward mechanism
was incorporated into the NMS model.
Large-Scale Neuromusculoskeletal Model of Human Upright Standing
PLOS Computational Biology | www.ploscompbiol.org 7 November 2014 | Volume 10 | Issue 11 | e1003944

Another experimental finding from human postural control
studies that was reproduced by the model was the bimodal
distribution of COM displacements (see Figure 3). In [11] most of
the data from young subjects exhibited double-peaked histograms
of COM displacements with a local minimum in between (see
their Figure 5). The authors of the above-mentioned study [11]
showed that the bimodal distribution of COM displacements was
only obtained when they represented the postural control system
by a mixture of both continuous and intermittent (with a phasic
controller operating at a 3–4 Hz burst rate) control mechanisms.
A continuous postural control model produced unimodal
Gaussian-like histograms. Therefore, they argued that the
postural control in humans is not mediated exclusively by a
continuous control mechanism. Our results corroborate this
proposal. However, in our approach the control structure (e.g.,
continuous, intermittent, or a mixture of both) was not imposed apriori. The mixture of continuous (SO motor nucleus and muscle
fibres) and intermittent (mostly Gastrocnemii motor nuclei and
muscle fibres) control behaviours was a result of the interactions
of the several interconnected neuromusculoskeletal elements of
the model and their respective dynamics. Further discussion on
the issue of continuous and intermittent control mechanisms
operating during postural control shall be presented in a separate
section below.
It is worth mentioning that a key parameter for stabilizing the
inverted pendulum model was the constant level of the fusimotor
activity that adjusted the sensitivity of muscle spindles for each
simulation. Without a proper value for both static and dynamic
fusimotor activities the pendulum fell at the beginning of the
simulation. As previously mentioned, some parameters were
randomly distributed in each simulation run [41], hence
producing a different set of initial conditions in different runs.
This explains why the mean values of fusimotor activities vary
(slightly) across the different simulation trials (see Methods). In the
context of human postural control, the dependence of an effective
control upon the fusimotor activity suggests that the CNS must
properly set the muscle spindle sensitivity for the performance of
the task [27,44,45].
Figure 7. Modulation of muscle fibre lengths during postural sway (typical simulation performed on Model 2). (A) Centre of mass(COM; gray curve) and centre of pressure (COP; black curve) displacements. (B-D) Muscle fibre lengths from Soleus (SO), Medial Gastrocnemius (MG),and Tibialis Anterior (TA) muscles. Lateral Gastrocnemius (LG) was not shown here because its behaviour is quite similar to that of the MG muscle.Dashed lines represent the 3-s duration windows used to perform the correlation analysis between COM and muscle fibre lengths (see Methods fordetails and Figure 8).doi:10.1371/journal.pcbi.1003944.g007
Large-Scale Neuromusculoskeletal Model of Human Upright Standing
PLOS Computational Biology | www.ploscompbiol.org 8 November 2014 | Volume 10 | Issue 11 | e1003944
Another point that should be stressed is that the NMS model
was not stabilised without the neuronal activity, i.e., the pendulum
fell when the SLC was turned off. This is compatible with the
current view that the viscoelastic properties of the muscles around
the ankle joint are not sufficient to control upright standing [8,46–
48]. In the model, the intrinsic passive ankle joint stiffness was
about 70% of the critical toppling torque (see Methods for details),
which is in accordance with the experimental estimates at ankle
joint rotation angles similar to those obtained in our model (about
0.60 deg on average) [46,48]. The adoption of a constant passive
stiffness is a typical simplification (see for instance [5,11]) that was
also adopted in the present study. In an analytical study [49], the
conclusion was that the feedback provided by the muscle spindles
and GTOs is not sufficient to stabilize an inverted pendulum
representing the human body. However, the authors did not
considered any passive mechanism at the joint level and, hence,
the total torque was generated by the active neural controller.
Here, as the passive properties were included, the demand of the
CNS was about 30% of the necessary stabilizing torque, which is
compatible with the experimental estimates [11,46].
Intermittent Recruitment of the Motor UnitsThe most remarkable result obtained from the proposed NMS
model is shown in Figure 4. The intermittent recruitment of MG
MUs is a phenomenon recently observed in human experiments
[14,16] and the postural control model reproduced this behaviour
with a high degree of fidelity. The experimental study in [14]
reported that MG MUs were intermittently recruited with a modal
frequency of *2 Hz (pooled data from 7 subjects), which is similar
to the value observed in [13] for actions of a human subject
manually controlling an inverted pendulum. A central hypothesis
raised by several recent studies postulates the involvement of an
intrinsic predictive mechanism used by the CNS in the perfor-
mance of postural control [13,15,50]. This intrinsic mechanism,
sometimes named as a ‘‘refractory response planner’’ [51] and
involving a ‘‘psychological refractory period’’ [15,50,51], would be
responsible for the intermittent actions of the neural controller
during the equilibrium maintenance of an unstable load. The
simulation results showed that even in the absence of any
predictive mechanism (or an internal time setting neural circuit),
actions of the neuronal controller occurred at a mean (modal) rate
of *2 (4) Hz, i.e., MUs from the MG muscle were recruited with a
mean (modal) interval of *500 (250) ms, irrespective of model
structure (i.e. Model 1 and Model 2). The models adopted in this
study are interpreted as representing a single subject instead of a
population of subjects, and the MU intermittence rates observed in
the simulations are within the experimental range (2–4 Hz)
reported elsewhere (e.g., [11,13,14]). These data suggests that
the interplay between a SLC and the muscles involved in the task
being performed is sufficient to provide a mechanism underlying
the intermittent actions of the CNS during postural control. No
complex central mechanism (e.g., predictive, response planner)
was needed in our model for the genesis of this control pattern.
As discussed in [14,16], the MG muscle seems to be mostly
involved in balance control during standing, while the SO muscle
provides a basal torque due to its mostly continuous activity (see
Figure 5 and Figure 1C). Regarding the LG muscle, a recent
finding showed that this muscle has a minimal or absent activation
during the postural control task [16]. The simulation data are in
agreement with these experimental results, and suggest that the
differences in the organisation of the MG and SO motor nuclei
might be responsible for their different actions during postural
control. Additionally, the LG muscle was minimally activated
during the simulations (the reason why we performed quantitative
analysis only on MG MUs), although the recruited LG MUs (less
than 30 per simulation) followed a pattern similar to the MG MUs.
This different behaviour between the lateral and medial parts of
the Gastrocnemius might be explained by a different number of
MNs innervating each muscle. The LG muscle has approximately
60% less MUs than the MG muscle (see Methods), and hence for a
similar effective synaptic current the number of recruited MUs
with similar intrinsic characteristics would be lower for the LG
muscle in comparison to the MG. In the model, the SO muscle is
more homogeneous, having a high number of low-threshold and
smaller twitch amplitude MUs, while MG and LG muscles have
an equal proportion of low- and high-threshold MUs generating
higher twitch amplitudes (and mostly briefer twitches). The lower
proportion of low-threshold MUs (with a similar recruitment range
- see [16]) might naturally produce the intermittent recruitment
due to fluctuations in sensory feedback. The rationale is that for a
similar lower sensory inflow (or effective synaptic current), a low
number of MG/LG MUs are recruited, hence producing a low
torque at the ankle joint. Conversely, a higher number of SO MUs
are recruited producing a basal torque sufficient to counterbalance
the static toppling torque. During a forward sway, any small
modulation of sensory inflow is sufficient to recruit additional
higher-threshold MG/LG MUs, counterbalancing the postural
perturbation. As the inverted pendulum returns to a backward
position, sensory inflow decreases and the recruited MUs are de-
recruited (see Figure 4). For the SO, these oscillations in sensory
inflow seem to be lower during postural sway (see Figure 5B).
However, the analysis is quite complex since the system is
operating in closed loop, so that any argument based on causality
may lead to logical difficulties. In spite of this limitation, the
simulation results indicate that upright standing could be
controlled by means of proprioceptive sensory information
feedback and a mixture of continuous (SO muscle) and intermittent(mostly MG and LG muscles) action of the CNS. Therefore, the
second working hypothesis raised in the present study (that efferent
Figure 8. Correlation analysis between centre of mass (COM)displacement and Soleus (SO) muscle fibre length. Each barrepresents the percentage of intervals (3-s duration windows) withpositive (gray) and negative (black) correlation coefficients for eachmodel structure. For Model 1, *80% of intervals (17/21) had positivecorrelation coefficients, while for Model 2 this proportion was lowerthan 50% (10/21). Statistically significant difference was observedbetween the results from the two model structures (Model 1 vs. Model 2,x2-test, pv0:05). These results suggest that reciprocal inhibition maycontribute significantly to the ‘‘paradoxical’’ behaviour (negativecorrelation between COM and muscle fibre length) reported in theliterature [29–31].doi:10.1371/journal.pcbi.1003944.g008
Large-Scale Neuromusculoskeletal Model of Human Upright Standing
PLOS Computational Biology | www.ploscompbiol.org 9 November 2014 | Volume 10 | Issue 11 | e1003944
actions of the CNS are continuous during postural control - see
Introduction) turned out to be half true, i.e., the leg muscles are
activated by a combination of both continuous and intermittent
processes.
The results in Figure 6 showed that MG MUs were preferen-
tially recruited when the body leaned forward (panel A in
Figure 6) and decelerated (panel B in Figure 6), i.e., MG MUs
were mostly recruited in order to counteract the toppling torque
due to gravity, pushing the body to a backward position. These
simulation results are similar to those obtained from human
subjects, as reported in [14]. The authors of the referred study
proposed that a strategy of MU recruitment instead of MU rate
modulation during upright standing would be generated by the
CNS due to the postural task demands. The data from the
simulations in Figure 6 reinforce this view. The preference for
recruitment coding would be due to the same mechanisms
discussed in the previous paragraph, i.e., structural features of
the MG motor nucleus and modulation of sensory information due
to perturbation from a mean equilibrium position. On the other
hand, recent experimental and computer simulation studies have
shown that during isometric contractions, the TS torque control
relies mainly on rate coding [52] and the variability observed in
both torque and EMGs is highly dependent on the MU discharge
rate variability. Therefore, the same muscle group (i.e., the TS) is
probably being driven according to two different laws depending
on the motor task: rate coding for isometric torque control in a
very stable condition, and recruitment coding (for the MG/LG
muscles) in a more challenging condition, such as erect posture.
Interestingly, recent experimental data relating postural sway with
isometric torque variability (at similar mean torque values) in
young subjects found that they have a positive correlation [53]
albeit the first is much larger in magnitude than the latter. As the
isometric torque control (seated subjects) involved almost certainly
only continuous feedback (mostly from the SO) this experimental
result gives support to the dual control mode (continuous and
intermittent) that was found in the present simulations for standing
posture control.
The Role of Reciprocal InhibitionTwo model structures were simulated in order to investigate
whether postural control may be influenced by the reciprocal
inhibition pathway (see Methods for details). Recent studies have
discussed the importance of reciprocal inhibition in movement
control. For instance, [29,30] hypothesised that this inhibitory
pathway may be a better source of feedback control since TA
proprioceptive activity is unmodulated by the homonymous
muscle activation during postural sway.
An interesting result was that in comparison to the model
without reciprocal inhibition (Model 1) the complete model (Model2) showed an increased number of intervals in which SO muscle
fibre length was negatively correlated with the COM displacement
(see Figure 8). This ‘‘paradoxical’’ behaviour was reported in some
experimental studies [29–31] and was used as evidence to
postulate the significant role of reciprocal inhibition in the control
of upright quiet standing [29]. The simulation results corroborate
the hypothesis that the ‘‘paradoxical’’ behaviour of muscle fibre
lengths may be generated by the reciprocal inhibition pathway.
Nevertheless, no interval with negative correlation was found
between MG and LG muscle fibre lengths and COM. In [29], the
authors reported that two out of eight subjects showed a larger
number of positively correlated intervals for the MG muscle, and
they discussed that these subjects oscillated in a more forward
position. For the physiologically-constrained set of parameters
adopted in the present model the mean equilibrium position was
*5 deg forward, which is similar to experimental findings [36].
Therefore, further studies are necessary to better understand the
real significance of ‘‘paradoxical’’ muscle fibre behaviour and how
it emerges during upright stance control. Yet, it is interesting that a
highly complex and unexpected biological phenomenon may be
partly explained/reproduced by a biologically plausible NMS
model, and, therefore, providing neurophysiological clues to its
genesis.
Regarding basic postural sway metrics (e.g., COP RMS, MV,
and spectral contents) the simulation results did not show large
differences between the two model structures (see Table 1),
suggesting that reciprocal inhibition is not a fundamental
mechanism for postural control.
In spite of the suggestion that TA muscle spindles must be a
better (‘‘cleaner’’) source of ankle angle feedback than TS muscle
spindles [29] the simulation results from Model 1 (without
reciprocal inhibition) showed that even ‘‘noisy’’ sensory feedback
from the TS muscle receptors is sufficient for an adequate postural
control. The TS spindle feedback is ‘‘noisy’’ in the sense that the
TS muscle receptors are signalling a mixture of information from
ankle angle changes as well as changes in muscle length and
tension due to the MN pool activation.
Model Limitations and Future ResearchOne conclusion that can be reached from the present simulation
results is that mechanisms beyond those included in the model are
not strictly necessary to reproduce experimental data from other
studies. However, it is not possible to exclude that, despite
theoretically not necessary, such mechanisms play a role in human
postural control. Specifically, contributions from additional
sensory modalities, such as foot soles, joint and skin receptors,
vision, and vestibular system, certainly contribute by varying
degrees to postural control depending on the particular experi-
mental conditions [2,3,42,54]. Additionally, one cannot rule out
the involvement of supraspinal centres (e.g., brainstem, basal
ganglia, primary motor cortex) [51,55], specially if the mainte-
nance of upright standing is being learned, such as in infants and
adults recovering from a serious medical/neurological disease.
Modulations of fusimotor [44,56] and presynaptic inhibition
activities [57,58] are examples of important spinal-related
mechanisms that certainly play relevant roles too.
In a general context, proprioceptive information from the legs is
provided by muscle, joint and cutaneous receptors [54,59].
However, in the NMS model presented here the proprioceptive
information was provided exclusively by muscle receptors (i.e.
muscle spindles and GTOs), which are postulated as being
primary sources of sensory information in response to limb
movement [27,28]. The degree of influence of joint and cutaneous
receptors on postural control is a controversial issue in the
literature. Some experimental findings showed little change in
postural sway after ischemia or anaesthesia [60,61], while others
showed that stimulation of cutaneous afferents evoked postural
changes during quiet standing [54]. The simulation results
presented here are in accordance with the former view, but
further theoretical/computational and/or experimental studies are
required to investigate what is the relative contribution of
additional neuronal structures for the maintenance of human
upright standing.
Regarding the biomechanics of the human body, it is well
known that the inverted pendulum is an approximation for the
human body during quiet standing [4,26]. Other expansions, for
instance, multi-link and/or multi-dimensional (e.g., including
medial-lateral oscillations) models and analyses [24] are very
interesting research avenues. However, any biomechanical
Large-Scale Neuromusculoskeletal Model of Human Upright Standing
PLOS Computational Biology | www.ploscompbiol.org 10 November 2014 | Volume 10 | Issue 11 | e1003944

expansion in large-scale models such as that used in the present
study should envisage an increasing number of neuronal and
musculoskeletal elements, along with the complexities of their
interactions.
Finally, it is noteworthy that we simulated postural control
during relatively brief periods (about 30 s). Prolonged uncon-
strained standing is associated with large changes in body
equilibrium position along time [62]. A NMS model to provide
approximate postural control during prolonged standing would
probably require a reasonably higher complexity than the one
employed in the present model and this is certainly an interesting
challenge for future research.
Concluding RemarksLarge-scale modelling has been adopted in several fields of
modern neuroscience research (e.g., [32,33,63–67]). To our
knowledge this is the first study aimed at modelling the NMS
system involved in the control of human upright standing from a
more neurophysiological perspective. The main conclusion drawn
from the simulation results is that posture control might be, at least
in part, mediated by spinal mechanisms, with proprioceptive
information being fed back to the spinal neuronal circuitry.
Additionally, the results provided evidence that complex phenom-
ena observed in human experiments, such as intermittent actions
of the CNS, might not depend on intricate control strategies of
complex structures within the CNS. The structure and organisa-
tion of the spinal cord, i.e., the types of MUs, synaptic
connectivities, the ordered recruitment of MUs, as well as the
modulation of proprioceptive information could be sufficient to
explain how the CNS controls body position during upright quiet
standing in a general sense.
Methods
Mathematical ModelsThe model proposed in this study encompasses four main
subsystems (neuronal controller, muscles, proprioceptors, and
body biomechanics) that were interconnected to represent the
NMS system involved in the control of human upright stance. An
overview of this large-scale model is depicted in Figure 9. It is
worth mentioning that the model is aimed to study body sway in
the sagittal plane during unperturbed stance. In this condition, the
posture control task relies mainly on afferent and efferent activities
associated with the muscles around the ankle joint (ankle strategy)
[9]. Figure 9A shows a schematic view of the neuronal circuitry
composed of groups of spinal MNs and INs (see mathematical
description below), referred to as the SLC (Spinal-Like Controller).
MNs were assembled in motor nuclei associated to the TS (i.e.,
SO, MG, and LG) and TA muscles, which is the most relevant
antagonist group of muscles involved in postural control during
ankle strategy [9,29,36]. Stochastic descending commands repre-
sented part of the synaptic inputs from the brain that drive the
spinal MNs during the maintenance of upright standing.
Musculotendon units (MTUs) were represented by Hill-type
models (see mathematical description below), which were driven
by the spike trains from the spinal MNs (Figure 9B). Muscle
spindles were placed in parallel with the muscle fibres and received
commands from Gamma motor neurons (c-MNs), while GTOs
were placed in series with the tendon. Proprioceptive feedback was
provided by Ia, II and Ib axons mediating: i) monosynaptic Ia
excitation; ii) di-synaptic Ib inhibition; iii) di-synaptic II excitation;
and iv) reciprocal inhibition from antagonistic Ia afferents. These
are fundamental pathways frequently associated with different
motor tasks, including upright standing [58]. An inverted
pendulum was adopted to represent the body biomechanics
(Figure 9C), which is a first approximation for unperturbed quiet
standing [4,5,10,11,20,25,26]. In the following sections, the
mathematical details concerning each of these models will be
provided.
Spinal neuron models. The MN pool model has been
extensively described elsewhere [41,52,68,69]. Briefly, ach type-
specified MN (i.e., S-, FR-, and FF-type) was modelled as a two-
compartment conductance-based neuron model. Geometrical and
electrotonical parameters followed those reported in the literature
for lumbar MNs of anaesthetised cats. The somatic compartment
included ionic conductances responsible for the genesis of action
potentials (Naz and fast Kz) and afterhyperpolarization (slow
Kz). Voltage-gated ionic channels were not included in the
dendritic compartment (passive-dendrite model) because they are
mainly involved in the generation of persistent inward currents
(PICs) and the bistable behaviour of MNs [68,69]. It is out of the
scope of this study to evaluate the possible role of PICs on human
postural control. Motor axons were represented as simple spike
conductors, i.e., if a MN generates a spike it is transmitted to the
motor end-plate with a given delay depending on the axon
conduction velocity (S-type: 44–51 m/s; FR-type: 51–52 m/s; FF-
type: 52–53 m/s) and the distance between the spinal cord and the
muscle (0.80 m). IN models were represented as point neurons
(single-compartment) with the same ionic channels adopted in the
MN models [41]. IN passive properties were based on the
estimation reported in [70]. For simplicity, all IN models were
supposed to have the same dynamical behaviour irrespective of the
group they belong (i.e., Ia, II and Ib INs). However, spike
thresholds varied linearly along the IN pool (from 10 mV to
20 mV) in order to represent the scattered recruitment of these
cells within a given group. The time course of each conductance
included in both MN and IN models was simplified [71] in order
to speed up the simulation of thousands of neuronal elements. The
models have been previously validated with respect to their
biophysical properties, for instance, frequency-to-current (f-I)
curve, afterhyperpolarization time course, and response to
synaptic inputs [41,52,69]. Synaptic conductances followed the
kinetic model proposed by [72] with parameters adjusted so that
amplitude and duration of excitatory and inhibitory post-synaptic
potentials matched the values reported in animal experiments (see
[68,69] for details).
As mentioned earlier, MNs were divided in four motor nuclei
depending on the muscle they command. Table 2 shows the
number and types of MNs adopted for each motor nucleus. These
values and proportions follow estimates from the literature [73,74]
Since there is a lack of information regarding the exact number of
spinal INs mediating each pathway represented in the present
model, a fixed number of 350 INs was adopted for each group.
Model of the musculotendon units. MTUs produce both
muscle torque and the surface electromyogram (EMG) (see
Figure 9A). The phenomenological model of muscle EMG was
extensively reported and validated in other studies [41,52,68].
Biomechanical properties of the muscles were represented by
Hill-type models [75–77] containing elements as depicted in
Figure 9B. A non-linear in-series elastic element (cT ) accounted
for the passive property of tendon and distal aponeurosis. Two
passive parallel elements (KPE and b) were adopted so as to
represent the viscoelastic properties of the muscle fibres. In
addition, the contractile properties of type-I (slow) and type-II
(fast) muscle fibres were represented by two contractile elements
(CEI and CEII), which produce active force in response to MN
activation. The pinnation angle between the muscle fibres and
tendon (a) was also represented in the model. A mass (m) was
Large-Scale Neuromusculoskeletal Model of Human Upright Standing
PLOS Computational Biology | www.ploscompbiol.org 11 November 2014 | Volume 10 | Issue 11 | e1003944

introduced to provide computational stability. The Supplemental
Material shows the frequency response of the SO muscle model
that was estimated according to the experimental procedures
reported in [78]. The results presented in this Supplemental are
useful as a complementary validation for the modelling described
in what follows.
Activation dynamics. Activation signals to the muscles were
obtained by a filtering process (second-order critically-damped
Figure 9. Overview of the postural control model. (A) Schematic view of the Spinal-Like Controller (SLC) and the biomechanics of the humanupright standing. Mathematical models of spinal a motor neurons (MNs) and interneurons (INs) make up the motor nuclei associated with the TricepsSurae (TS) and Tibialis Anterior (TA) muscles. MNs from the TS motor nuclei receive constant intensity descending commands during the maintenanceof upright stance. Proprioceptive feedback is provided by Ia, II and Ib afferents from muscle spindles and Golgi tendon organs (GTOs). Theinformation carried through these afferents is fed back to the spinal cord representing fundamental pathways (or neuronal circuits) involved in thepostural control task, such as Ia monosynaptic excitation, Ib di-synaptic inhibition, group II di-synaptic excitation, and reciprocal inhibition fromantagonistic Ia afferents. Activity from Gamma motor neurons (c-MNs) set the sensitivities of the muscle spindles. Ankle joint torque (TA) that drivesthe body biomechanics (to compensate for the gravitational toppling torque) is given by the sum of the torques produced by the muscles (Tm) andthe passive ankle joint torque, represented by the passive ankle joint stiffness (KA) and viscosity (BA). The body angle (hA) is the resultant output ofthe inverted pendulum acted on by gravity and by TA. It indirectly (by means of Equations 8 and 9) defines moment arms (mx) and musculotendon(MTU) lengths (LMT ), which are used to define the dynamics of both MTUs and muscle receptors (see dashed lines). Additionally, hA is fed backwithout delay to account for the intrinsic passive joint impedance (stiffness and viscosity). (B) Hill-type model used to represent the viscoelastic andcontractile properties of the MTUs. Muscle fibres are represented by parallel passive elements (muscle fibre stiffness, KPE , and viscosity, b) and twocontractile elements (CE) representing the contractile properties of type-I and type-II muscle fibres. A pinnation angle (a) is adopted to represent theangle between the muscle fibres and the aponeurosis. In addition, a mass (m) is used to increase the computational stability. Passive properties oftendon and distal aponeurosis are represented by a lumped non-linear stiffness (cT ). Muscle spindle is placed parallel to the muscle fibres, while theGTO is in series with the tendon. (C) Inverted pendulum model used to represent the body biomechanics during the upright quiet stance. Arrowsindicate the positive direction of each variable (see the description of each variable in the text).doi:10.1371/journal.pcbi.1003944.g009
Table 2. Number and types of spinal motor neurons (MNs) adopted for each motor nuclei represented in the model.
Motor nuclei S-type FR-type FF-type
Soleus (SO) 800 50 50
Medial Gastrocnemius (MG) 300 150 150
Lateral Gastrocnemius (LG) 130 65 65
Tibialis Anterior (TA) 250 50 50
These values were based on estimates from the literature [73,74].doi:10.1371/journal.pcbi.1003944.t002
Large-Scale Neuromusculoskeletal Model of Human Upright Standing
PLOS Computational Biology | www.ploscompbiol.org 12 November 2014 | Volume 10 | Issue 11 | e1003944

linear system) applied on the MN spike trains. The filter output
was followed by a non-linear function that provided a smooth
saturation [52,79,80]. The non-linear function (Equation (1))
accounted for the mechanisms responsible for the muscle force
saturation (e.g. Cazz release saturation in the sarcoplasmic
reticulum):
aMU SAT(t)~
1{ exp½{c:aMU (t)�1z exp½{c:aMU (t)� ð1Þ
in which, aMU SAT(t) is the saturated activation signal produced by
a given MU; aMU (t) is the activation signal of a given MU before
the saturation (i.e., after the second-order linear filter); and c is the
shape parameter of the saturation function.
For each MU the parameter c was adjusted so that the tetanic
activation was achieved at a given firing rate (see [52]), i.e., a
low (high) threshold MU achieved its tetanic activation at a low
(high) firing rate. There was also an amplitude scaling
depending on the MU type, i.e., S-type MU produced activation
signals with amplitudes relatively lower than F-type MU. For
more details regarding the distribution of parameter values, see
[52].
The sum of all activation signals produced by S-type MUs
resulted in the activation signal to the CEI [aI (t)]. Similarly, the
activation signal to the CEII [aII (t)] was generated by the sum of
all activation signals produced by FR- and FF-type MUs. These
global activation signals were normalised with respect to the
maximum muscle activation, which was calculated as the sum of
all tetanic activations produced by the MUs of a given muscle. A
similar approach was adopted in [75].
Passive properties. Force-length relationships for the elastic
elements were adopted from [76,77], while the viscous force was
simply proportional to the muscle fibre stretch velocity. The total
parallel passive force (Equation (2)) was normalised by the
maximum muscle force (F0) estimated from the physiological
cross-sectional area of each muscle [75]. Muscle fibre length was
normalised by the optimal fibre length (L0). For the tendon, the
adopted passive force-length relationship (Equation (3)) was the
one reported by [75]. Similarly, the in-series passive force was
normalised by F0 and the tendon length was normalised by LT0 ,
which is the value at which the force produced by the tendon
equals F0.
~FFPE~
exp KPE~LLM{1
EM0
� �� �
exp(KPE)zb ~VV ð2Þ
in which, KPE and b are the elastic (in F0=L0) and viscous (in
F0:s=L0) parameters, respectively; ~LLM is the normalised muscle
fibre length (in L0); EM0 is the normalised muscle strain; and ~VV is
the normalised muscle fibre velocity (in L0=s).
~FFT~kT cT ln exp~LLT{LT
r
kT
� �z1
� �ð3Þ
in which, kT is a constant that defines the curvature of the toe
region in the force-length relationship; cT is the tendon stiffness (in
F0=LT0 ); LT is the normalised tendon length (in LT
0 ); and LTr is the
length at the onset of the linear region.
Muscle fibre length and tendon length are related by Equation
(4). The pinnation angle varied with muscle fibre length (Equation
(5)) so as to maintain the muscle thickness constant [81].
LMT~LTzLMcos½a(~LLM )� ð4Þ
in which, LMT is the MTU length (in m), whose value is given by
inverse kinematics data (see below); and a(~LLM ) is the pinnation
angle as a function of the normalised muscle fibre length.
a(~LLM )~arcsinsin(a0)
~LLM
� �ð5Þ
in which, a0 is the initial pinnation angle (in rad).
Values for the passive parameters of each muscle are presented
in Table 3. These values were based on several data reported in
the literature [75–77,82].
Contraction dynamics. The force generated by contractile
elements is given by Equation (6). Force-length (FL) and force-
velocity (FV ) relations followed the proposal by [75] for type-I and
type-II muscle fibres (see their Table 1 for details).
~FFCE~
aI (t):FLI (~LLM ):FVI (~LLM , ~VV )zaII (t):FLII (~LLM ):FVII (~LLM , ~VV )ð6Þ
Muscle fibre velocity was calculated by integrating muscle fibre
acceleration (Equation (7)), which was obtained by applying the
Newton laws to the mechanical system described above (see
Figure 9B for a schematic view). It is worth noting that positive
velocity means muscle fibre stretch. Accordingly, muscle fibre
length was calculated by integrating muscle fibre velocity.
_VV~F0
m~FFT cos a ~LLM
� �� { ~FFCEz~FFPE� �
cos2 a ~LLM� �� �
ð7Þ
Musculoskeletal geometry. MTU lengths (LMT ) and moment
arms with respect to the ankle joint (mx) were calculated according
to the approach proposed by [83]. For each muscle, fourth-order
polynomials were used to adjust the relations between MTU
length and ankle joint (Equation (8)), as well as moment arm (mx)
and ankle joint angle (Equation (9)). The coefficients of these
functions are presented in Table 4. Relations for the MG and LG
(biarticular muscles) were obtained for the knee angle at zero
degree (fully extended). Inverse kinematic data were reported in
[82].
LMT~X4
k~0
AkhkA ð8Þ
mx~X4
k~0
BkhkA ð9Þ
Models of proprioceptors and afferent fibres. A muscle
spindle model previously reported by [84] was placed parallel to
the muscle fibres (see Figure 9B). It represents the dynamics of bag
1, bag 2 and chain intrafusal muscle fibres. Ia mean firing rate is a
non-linear function of all three instrafusal fibre outputs, hence
conveying both static and dynamic information about muscle
stretch. On the other hand, type II mean firing rate is produced by
Large-Scale Neuromusculoskeletal Model of Human Upright Standing
PLOS Computational Biology | www.ploscompbiol.org 13 November 2014 | Volume 10 | Issue 11 | e1003944

a contribution of bag 2 and chain intrafusal fibre outputs, which
are dependent on the static component of muscle fibre stretch
[84]. Normalised muscle fibre length (~LLM ) is the input to the
muscle spindle model. In addition, bag 1 intrafusal fibre is sensitive
to dynamic fusimotor activity (cd ), while bag 2 and chain intrafusal
fibres are sensitive to static fusimotor activity (cs). In this study,
biophysical properties of c-MNs were not represented. Static and
dynamic fusimotor activities were both modelled as Gaussian
random processes with variance equal to 3% of the mean value
(empirically chosen). The mean value was adjusted in order to
stabilize the biomechanical system (see Simulation Protocol
below). Almost all model parameters were maintained equal to
those reported by [84] (see their Table 1); however, the gain of
each intrafusal fibre was adjusted (Gbag1~7000, Gbag2~3800, and
Gchain~3000) in order to produce Ia and type II firing rates
compatible with experimental data from humans [59].
A GTO model reported by [85] was in-series with the tendon
(see Figure 9B). It represents the lumped dynamics of a population
of Ib afferents in response to the force produced by the tendon
(FT ). Basically, this model encompasses a static non-linear
function (Equation (10)) in series with a linear dynamics (Equation
(11)) resulting in the afferent firing rate [fIb(t)]. The transfer
function that represents the linear dynamics was transformed to a
digital filter (bilinear transformation) so as to reduce the
computational complexity of the system. Individual Ib afferent
activity was obtained by dividing the GTO model output by the
total number of Ib afferents in each muscle. Model parameters
were chosen to produce individual Ib firing rates compatible with
those reported in the literature [59].
R(t)~G1lnFT (t)
G2z1
� �ð10Þ
in which, G1 and G2 are adjustable parameters, chosen equal to
60 Hz and 4 N, respectively.
fIb(s)
R(s)~40:
1:70s2z2:58sz0:40
s2z2:20sz0:40ð11Þ
in which, s is the Laplace variable; R(s) is the Laplace transform of
R(t) (Equation (10)); and fIb(s) is the Laplace transform of the
global Ib firing rate.
Table 3. Passive parameters of the musculotendon units (MTUs).
Parameter (Unit) SO MG LG TA
F0 (N) 3586 1306 606 674
L0 (cm) 4.90 5.70 6.40 6.80
m (kg) 0.53 0.22 0.12 0.15
KPE (F0=L0) 5
b (F0:s=L0) 0.005
EM0 (2) 0.50
a0 (deg) 28.30 9.90 12 9.60
LT0 (cm) 28.90 42.40 41.30 24.90
kT (2) 0.005
cT (F0=LT0 ) 27.80
LTr (LT
0 ) 0.96
These values were based on data from several studies [75–77,82].doi:10.1371/journal.pcbi.1003944.t003
Table 4. Coefficients of equations (8) and (9).
Parameter (Unit) SO MG LG TA
A0 (cm) 32.30 46.40 45.50 30.60
A1 (cm/deg) 7.22 |10{2 7.48 |10{2 7.62 |10{2 27.44 |10{2
A2 (cm/deg2) 22.24 |10{4 21.13 |10{4 21.25 |10{4 21.41 |10{4
A3 (cm/deg3) 23.15 |10{6 23.50 |10{6 23.55 |10{6 2.42 |10{6
A4 (cm/deg4) 9.27 |10{9 7.35 |10{9 7.65 |10{9 1.50 |10{8
B0 (cm) 24.10 24.30 24.40 4.30
B1 (cm/deg) 2.57 |10{2 1.30 |10{2 1.44 |10{2 1.66 |10{2
B2 (cm/deg2) 5.45 |10{4 6.08 |10{4 6.18 |10{4 23.89 |10{4
B3 (cm/deg3) 22.22 |10{6 21.87 |10{6 21.94 |10{6 24.45 |10{6
B4 (cm/deg4) 25.50 |10{9 21.02 |10{8 21.02 |10{8 24.34 |10{8
These values were estimated from inverse kinematics data (least-squares curve fitting) reported in [82].doi:10.1371/journal.pcbi.1003944.t004
Large-Scale Neuromusculoskeletal Model of Human Upright Standing
PLOS Computational Biology | www.ploscompbiol.org 14 November 2014 | Volume 10 | Issue 11 | e1003944

The outputs of the modelled muscle receptors are continuous
functions of time that represent the instantaneous firing rate of Ia,
II, and Ib afferents. These continuous functions [AfMR(t)] (with
MR being either, Ia, II, or Ib muscle receptor afferent) were
converted into independent stochastic point processes to repre-
sent the spiking activity travelling along a bundle of afferent fibres
with a given conduction velocity. The i-th spike train was
modelled as a non-homogeneous Gamma point process with a
mean intensity [Afi(t)] modulated by the output of a muscle
receptor (spindle or GTO) and with an order (or shape factor)
adjusted to produce a variability compatible with experimental
data [86]. The total number of afferents for each muscle (see
Table 5) and conduction velocities (see Table 6) were based on
estimates from the literature [58,87,88]. Afferent fibres were
recruited according to a recruitment law given by Equation 12
[79].
Afi(t)~AfMR(t){RTizIFRi ð12Þ
in which, Afi(t) is the mean firing rate (intensity) of the i-thafferent; AfMR(t) is the output of the muscle receptor models
(spindle or GTO) for a given afferent type; RTi and IFRi are the
recruitment threshold and the initial firing rate of the i-th afferent,
respectively.
The i-th afferent was recruited when the output produced by a
specific muscle receptor afferent [AfMR(t)] crossed a recruitment
threshold (RTi). Irrespective of the afferent type (i.e., Ia, II, and Ib)
the RTi was linearly varied along the afferents from 0–50 Hz, i.e.,
when the specific muscle receptor output reached 50 Hz all
afferent fibres of a given type were recruited. At the time of
recruitment the i-th afferent fibre discharged with an initial firing
rate (IFRi) that was randomly varied along the bundle of afferents
following a Gaussian random number (mean = 5 Hz; standard-
deviation = 2.50 Hz). The values of RTi and IFRi were
empirically chosen so as to produce the recruitment behaviour
of afferent fibres observed in human experiments [59,89]. Table 6
shows the connectivity ratios between sensory afferents and the
spinal neurons (MNs and INs), with values based on data reported
in [58]. Maximum synaptic conductances (see Table 6) were
empirically adjusted in order to produce a stable and meaningful
model response.
Body biomechanics. As mentioned above, body biomechan-
ics during the upright quiet stance was represented by an inverted
pendulum (Figure 9C). Equations of motion of body COM with
respect to the ankle joint (fixed pivot point) are given by Equations
(13) and (14). It is noteworthy that our analysis was restricted to the
sagittal plane, which represents the anteroposterior displacement
of the body COM. Anthropometric parameters were empirically
chosen to represent a young adult with mb = 60 kg and hb
= 0.85 m.
Jb€hhA(t)~TA(t)zmb:g:hb: sin½hA(t)� ð13Þ
in which, Jb is the body inertia (in kg.m2) given by Jb~4=3:mb:h2b;
mb is the body mass excluding the feet (in kg); hb is the COM
height with respect to the ankle joint (in m); TA(t) is the restoring
torque around the ankle joint (see Equation (13)); and g is the
gravity (set to 9.81 m/s2).
TA(t)~Tm(t){BA_hhA(t){KAhA(t) ð14Þ
in which, Tm(t) is torque produced by the leg muscles (in Nm);
BA and KA are the viscoelastic coefficients that represent the
passive property of the joint (in Nm.s/rad and Nm/rad,
respectively).
Muscular torque (Tm(t)) is given by the net torque produced
by the TS and the TA muscles multiplied by two (for simplicity,
we have assumed that both legs produce the same torque and
have the same control mechanism). The torque produced by
the TA muscle was defined as positive, so that activation of the
TS tends to restore the body from the toppling torque produced
by gravity. The viscoelastic passive torque was introduced in
the model because Hill-type muscle models cannot properly
produce muscle stiffness [47]. A preliminary simulation was
performed in order to estimate the ankle joint stiffness due to
the passive properties of the modelled Hill-type MTUs. In this
simulation the neuronal controller was turned off and the ankle
joint angle [hA(t)] was randomly varied (Gaussian stochastic
process). The resultant (passive) muscle torque [Tm(t)] was
measured at the output of the model. A spectral analysis was
carried out to estimate the resultant passive ankle joint
impedance (see [90,91]), and the passive ankle joint stiffness
due to the Hill-type MTUs was estimated as the mean
impedance value in the range 0–1 Hz (static component).
The passive ankle joint stiffness produced by the Hill-type
MTUs was estimated to be only about 5% of the critical
stiffness (mb:g:hb). An additional passive ankle stiffness (KA) was
adopted equal to 65% mb:g:hb, resulting in a total passive ankle
joint stiffness of about 70% [46,48]. A small viscosity (BA equal
to 5.81 Nm.s/rad [46]) was also included in the model. These
viscoelastic intrinsic properties of the ankle joint accounted for
part of the postural control through a mechanism frequently
referred to as preflexes [92] (see Figure 9A).
COM and COP displacements. Typically in human experi-
ments, both COM (yG ) and COP (yP) displacements (projected on
the anteroposterior axis in the present study) have been recorded
to evaluate the body sway during upright stance. Here, these
biomechanical variables were calculated according to Equations
(15) and (16).
Table 5. Number and types of afferent fibres adopted for each muscle represented in the model.
Muscle Ia II Ib
Soleus (SO) 400 500 300
Medial Gastrocnemius (MG) 160 200 120
Lateral Gastrocnemius (LG) 160 200 120
Tibialis Anterior (TA) 280 350 140
These values were based on estimates from the literature [58,88].doi:10.1371/journal.pcbi.1003944.t005
Large-Scale Neuromusculoskeletal Model of Human Upright Standing
PLOS Computational Biology | www.ploscompbiol.org 15 November 2014 | Volume 10 | Issue 11 | e1003944

yG~hb:sin½hA(t)� ð15Þ
yP~hbsin½hA(t)�z Jb
mb:gsin½hA(t)� _hh2
A(t){cos½hA(t)�€hhA(t)n o
ð16Þ
Simulation ProtocolThe models described above were written in Java programming
language (Oracle Corp) and simulated in an open-source web-
based application developed in the Eclipse IDE (The Eclipse
Foundation). Model source code is available for download at the
website http://remoto.leb.usp.br/ and at a public repository
(http://dx.doi.org/10.6084/m9.figshare.1029085). Differential
equations were numerically solved by a fourth-order Runge-Kutta
method with a 50 ms time step.
Recent experimental studies argued that the reciprocal
inhibition from antagonistic Ia afferents (from TA muscle spindles
to TS MNs - see Figure 9 A) has an important role in the postural
control due to the ‘‘orthodox’’ modulation of TA length and the
lack of TA contraction during standing [16,29]. To investigate
this potential role of reciprocal inhibition pathway, two different
model structures were used in this study. The first one, hereafter
referred to as Model 1, excluded the reciprocal inhibition
pathway so that all proprioceptive information was provided
exclusively by the TS sensory afferents (autogenic pathway).
Conversely, Model 2 is the complete model fully described above.
All common parts in both models have the same parameter
values.
Three independent simulations (30-s duration) were carried
out with each model. During the first second of simulation, the
movement of the inverted pendulum was restricted so that the
neuromuscular system reached its steady-state condition. This
prevented instabilities due to the lack of neural activity. In order
to provide a basal activation, descending commands were
modelled as 400 homogeneous stochastic Gamma point
processes with an individual mean rate equal to 50 Hz and a
shape factor equal to 25 (coefficient of variation equal to 20%).
With this descending drive (without any feedback information)
the MN pools produced a small basal muscle torque equal to
approximately 2% of the maximum torque. As mentioned
earlier, the fusimotor drive was modelled as a Gaussian
stochastic process with a small variance. The mean values of
static and dynamic fusimotor activities were adjusted for each
simulation so as to produce outputs in which the inverted
pendulum was oscillating around an equilibrium point for the
whole simulation duration. For Model 1 the values of static
(dynamic) fusimotor activities were 31.10 (33.30), 31.20 (33.30),
and 31.50 (33.60). Similarly, for Model 2 the values of static
(dynamic) fusimotor activities were set to 32 (33.80), 32 (33), and
31.70 (32.70).
Data AnalysisSeveral output variables were analysed in the present study: i)
Spike trains from MNs, INs and afferent fibres; ii) EMGs from the
TS muscles; iii) COM and COP anteroposterior displacements; iv)
Muscular torque; v) Muscle fibre lengths; vi) Joint angle and
angular velocity. These raw variables are available for download at
a public repository (Model 1 - http://dx.doi.org/10.6084/m9.
figshare.1027609; Model 2 - http://dx.doi.org/10.6084/m9.
figshare.1029084). Analyses were performed on 22.50-s duration
time series, so that the initial 5 s and final 2.50 s were removed
due to transient responses and data filtering (see below).
COM, COP, joint angle, angular velocity, muscle fibre length,
and torque time series were detrended and downsampled to
2 kHz. In order to compare model behaviour with experimental
data recorded with force plates, time- and frequency-domain
metrics were estimated from the COP, for instance, RMS, MV
and 50% power frequency [42]. Power spectra were estimated by
Welch’s method. EMGs were downsampled to 2 kHz, rectified,
and lowpass filtered at 2 Hz (zero-phase fourth-order Butterworth
filter).
Table 6. Sensory feedback parameters adopted in the model.
Parameter Value Unit
Conduction velocity: Ia afferents{ 62–67 m/s
Conduction velocity: Ib afferents{ 56–62 m/s
Conduction velocity: type II afferents{ 30–35 m/s
Connectivity: Ia afferents to MNs (homonymous muscle) 80 %
Connectivity: Ia afferents to MNs (synergist muscle)` 15 %
Connectivity: Ia afferents to INs 70 %
Connectivity: Ib and type II afferents to INs 30 %
Connectivity: Ia inhibitory INs to MNs 15 %
Connectivity: Ib inhibitory INs to MNs 10 %
Connectivity: group II excitatory INs to MNs 20 %
Maximum conductance: Ia afferents to MNs 600 nS
Maximum conductance: Ia afferents to INs 600 nS
Maximum conductance: type II afferents to INs 450 nS
Maximum conductance: Ib afferents to INs 300 nS
Maximum conductance: INs to MNs 300 nS
{These values varied linearly along the bundle of sensory afferents.`There is no connection between Ia afferents from MG and SO MNs [58].doi:10.1371/journal.pcbi.1003944.t006
Large-Scale Neuromusculoskeletal Model of Human Upright Standing
PLOS Computational Biology | www.ploscompbiol.org 16 November 2014 | Volume 10 | Issue 11 | e1003944

Similar to the studies reported in [9,19,43], cross-correlation
analysis was performed between COM and COP time series, as
well as COP and EMGs. In addition, similar to the analysis
reported in [29], correlation coefficients were computed between
COM and muscle fibre lengths. For the latter analysis COM and
muscle fibre length time series were binned to 3-s duration
intervals (without overlap) so that the correlation coefficients were
calculated for each bin (see Figure 7).
In order to quantify the degree of intermittency of a given
muscle, the activation ratio of individual MUs was measured. This
ratio was calculated as the percentage of time a given MU had
interspike intervals lower than 250 ms [16]. An activation ratio
equal to 0 indicates that the MU was inactive during the whole
simulation time, whereas a ratio equal to 1 indicates a continuous
activity. Therefore, lower activation ratios represent an intermit-
tently discharging MU. Additionally, phase plots were constructed
to evaluate the MU recruitment during quiet standing. Recruit-
ment phase plots were constructed by binning joint angle, angular
velocity, muscular torque and spike trains in 100-ms non-
overlapping windows. Within each window, the number of
recruited MUs was counted and a circle with diameter propor-
tional to the counting number was plotted in 2-dimension angle-
velocity (see Figure 6A) or angle-torque graphs (see Figure 6B).
Data from the three simulations were pooled together in the same
phase plot. A similar analysis was performed in [14].
When applicable, statistical analysis was performed with a
significance level set at 0.05. All analyses were performed in
Matlab (The MathWorks Inc) and SPSS Statistics (IBM Corp).
Supporting Information
Supporting Information S1 Frequency response of mus-cle model. This supporting information file provides additional
validation data for the muscle model.
(PDF)
Author Contributions
Conceived and designed the experiments: LAE AFK. Performed the
experiments: LAE RNW. Analyzed the data: LAE RNW AFK.
Contributed reagents/materials/analysis tools: LAE RNW. Wrote the
paper: LAE RNW AFK.
References
1. Macpherson JM, Horak FB (2013) Posture. In: Kandel ER, Schwartz JH, JessellTM, Siegelbaum SA, Hudspeth AJ, editors, Principles of neural science, New
York: McGraw-Hill, chapter 41. 5 edition, pp. 935–959.
2. Simoneau GG, Ulbrecht JS, Derr JA, Cavanagh PR (1995) Role ofsomatosensory input in the control of human posture. Gait & Posture 3: 115–
122.
3. Baloh RW, Jacobson KM, Beykirch K, Honrubia V (1998) Static and dynamic
posturography in patients with vestibular and cerebellar lesions. Archives of
Neurology 55: 649–654.
4. Peterka RJ (2000) Postural control model interpretation of stabilogram diffusion
analysis. Biological Cybernetics 82: 335–343.
5. Maurer C, Peterka RJ (2005) A new interpretation of spontaneous sway
measures based on a simple model of human postural control. Journal of
Neurophysiology 93: 189–200.
6. van der Kooij H, de Vlugt E (2007) Postural responses evoked by platform
pertubations are dominated by continuous feedback. Journal of Neurophysiology98: 730–743.
7. Fitzpatrick R, Burke D, Gandevia SC (1996) Loop gain of reflexes controllinghuman standing measured with the use of postural and vestibular disturbances.
Journal of Neurophysiology 76: 3994–4008.
8. Morasso PG, Schieppati M (1999) Can muscle stiffness alone stabilize uprightstanding? Journal of Neurophysiology 82: 1622–1626.
9. Gatev P, Thomas S, Kepple T, Hallett M (1999) Feedforward ankle strategy ofbalance during quiet stance in adults. The Journal of Physiology 514: 915–928.
10. Bottaro A, Casadio M, Morasso PG, Sanguineti V (2005) Body sway during
quiet standing: is it the residual chattering of an intermittent stabilizationprocess? Human Movement Science 24: 588–615.
11. Bottaro A, Yasutake Y, Nomura T, Casadio M, Morasso P (2008) Boundedstability of the quiet standing posture: an intermittent control model. Human
Movement Science 27: 473–95.
12. Gawthrop P, Loram I, Lakie M, Gollee H (2011) Intermittent control: acomputational theory of human control. Biological Cybernetics 104: 31–51.
13. Loram ID, Gollee H, Lakie M, Gawthrop PJ (2011) Human control of aninverted pendulum: is continuous control necessary? Is intermittent control
effective? Is intermittent control physiological? Journal of Physiology 589: 307–324.
14. Vieira TM, Loram ID, Muceli S, Merletti R, Farina D (2012) Recruitment of
motor units in the medial gastrocnemius muscle during human quiet standing: isrecruitment intermittent? What triggers recruitment? Journal of Neurophysiol-
ogy 107: 666–676.
15. van de Kamp C, Gawthrop PJ, Gollee H, Loram ID (2013) Refractoriness in
sustained visuo-manual control: is the refractory duration intrinsic or does it
depend on external system properties? PLoS Computational Biology 9:e1002843.
16. Heroux ME, Dakin CJ, Luu BL, Inglis JT, Blouin JS (2014) Absence of lateralgastrocnemius activity and differential motor unit behavior in soleus and medial
gastrocnemius during standing balance. Journal of Applied Physiology 116: 140–
8.
17. Cabrera J, Milton J (2002) On-Off intermittency in a human balancing task.
Physical Review Letters 89: 158702.
18. Alexandrov AV, Frolov AA, Horak FB, Carlson-Kuhta P, Park S (2005)
Feedback equilibrium control during human standing. Biological Cybernetics93: 309–322.
19. Kohn AF (2005) Cross-correlation between EMG and center of gravity during
quiet stance: theory and simulations. Biological Cybernetics 93: 382–388.
20. Masani K, Vette AH, Popovic MR (2006) Controlling balance during quiet
standing: proportional and derivative controller generates preceding motor
command to body sway position observed in experiments. Gait & Posture 23:
164–172.
21. Kuo AD (2005) An optimal state estimation model of sensory integration in
human postural balance. Journal of Neural Engineering 2: S235–49.
22. van der Kooij H, Jacobs R, Koopman B, Grootenboer H (1999) A multisensory
integration model of human stance control. Biological Cybernetics 80: 299–308.
23. van der Kooij H, Jacobs R, Koopman B, Van der Helm F (2001) An adaptive
model of sensory integration in a dynamic environment applied to human stance
control. Biological Cybernetics 84: 103–115.
24. Suzuki Y, Nomura T, Casadio M, Morasso P (2012) Intermittent control with
ankle, hip, and mixed strategies during quiet standing: a theoretical proposal
based on a double inverted pendulum model. Journal of Theoretical Biology
310: 55–79.
25. Nomura T, Oshikawa S, Suzuki Y, Kiyono K, Morasso P (2013) Modeling
human postural sway using an intermittent control and hemodynamic
perturbations. Mathematical Biosciences 245: 86–95.
26. Gage WH, Winter DA, Frank JS, Adkin AL (2004) Kinematic and kinetic
validity of the inverted pendulum model in quiet standing. Gait & Posture 19:
124–132.
27. Scott SH, Loeb GE (1994) The computation of position sense from spindles in
monoarticular and multiarticular muscles. Journal of Neuroscience 14: 7529–
7540.
28. Proske U, Wise AK, Gregory JE (2000) The role of muscle receptors in the
detection of movements. Progress in Neurobiology 60: 85–96.
29. Di Giulio I, Maganaris CN, Baltzopoulos V, Loram ID (2009) The
proprioceptive and agonist roles of gastrocnemius, soleus and tibialis anterior
muscles in maintaining human upright posture. The Journal of Physiology 587:
2399–2416.
30. Day JT, Lichtwark GA, Cresswell AG (2013) Tibialis anterior muscle fascicle
dynamics adequately represent postural sway during standing balance. Journal
of Applied Physiology 115: 1742–50.
31. Loram ID, Maganaris CN, Lakie M (2005) Active, non-spring-like muscle
movements in human postural sway: how might paradoxical changes in muscle
length be produced? Journal of Physiology 564: 281–293.
32. Schuurmans J, van der Helm FC, Schouten AC (2010) Relating reflex gain
modulation in posture control to underlying neural network properties using a
neuromusculoskeletal model. Journal of Computational Neuroscience 30: 555–
65.
33. Stienen AHA, Schouten AC, Schuurmans J, van der Helm FCT (2007) Analysis
of reflex modulation with a biologically realistic neural network. Journal of
Computational Neuroscience 23: 333–348.
34. Elias LA, Watanabe RN, Kohn AF (2013) Large-scale neuromusculoskeletal
model used to investigate neurophysiological mechanisms behind upright stance
control. In: 43rd Annual Meeting of the Society for Neuroscience. San Diego, p.
293.07.
35. Elias LA, Watanabe RN, Kohn AF (2014) The role of reciprocal inhibition on
human postural control. In: Proceedings of the Bernstein Conference 2014.
Gottingen: BFNT/BCCN, pp. 185–186. doi:10.12751/nncn.bc2014.0202.
Large-Scale Neuromusculoskeletal Model of Human Upright Standing
PLOS Computational Biology | www.ploscompbiol.org 17 November 2014 | Volume 10 | Issue 11 | e1003944

36. Mezzarane RA, Kohn AF (2007) Control of upright stance over inclined
surfaces. Experimental Brain Research 180: 377–388.
37. Taube W, Gruber M, Beck S, Faist M, Gollhofer A, et al. (2007) Cortical andspinal adaptations induced by balance training: correlation between stance
stability and corticospinal activation. Acta Physiologica 189: 347–358.
38. Ushiyama J, Takahashi Y, Ushiba J (2010) Muscle dependency of corticomus-
cular coherence in upper and lower limb muscles and training-related alterationsin ballet dancers and weightlifters Muscle dependency of corticomuscular
coherence in upper and lower limb muscles and training-related alterat. Journalof Applied Physiology 109: 1086–95.
39. Lawrence EL, Fassola I, Werner I, Leclercq C, Valero-Cuevas FJ (2014)
Quantification of dexterity as the dynamical regulation of instabilities:comparisons across gender, age, and disease. Frontiers in Neurology 5: 53.
40. Murnaghan CD, Squair JW, Chua R, Inglis JT, Carpenter MG (2014) Cortical
contributions to control of posture during unrestricted and restricted stance.
Journal of Neurophysiology 111: 1920–6
41. Cisi RRL, Kohn AF (2008) Simulation system of spinal cord motor nuclei andassociated nerves and muscles, in a Web-based architecture. Journal of
Computational Neuroscience 25: 520–542.
42. Prieto TE, Myklebust JB, Hoffmann RG, Lovett EG, Myklebust BM (1996)Measures of postural steadiness: Differences between healthy young and elderly
adults. IEEE Transactions on Biomedical Engineering 43: 956–966.
43. Masani K, Popovic MR, Nakazawa K, Kouzaki M, Nozaki D (2003)
Importance of body sway velocity information in controlling ankle extensoractivities during quiet stance. Journal of Neurophysiology 90: 3774–82.
44. Prochazka A, Hulliger M, Zangger P, Appenteng K (1985) ‘Fusimotor set’: new
evidence for alpha-independent control of gamma-motoneurones duringmovement in the awake cat. Brain Research 339: 136–40.
45. Windhorst U (2007) Muscle proprioceptive feedback and spinal networks. Brain
Research Bulletin 73: 155–202.
46. Casadio M, Morasso PG, Sanguineti V (2005) Direct measurement of anklestiffness during quiet standing: implications for control modelling and clinical
application. Gait & Posture 21: 410–424.
47. Loram ID, Maganaris CN, Lakie M (2007) The passive, human calf muscles in
relation to standing: the non-linear decrease from short range to long rangestiffness. Journal of Physiology-London 584: 661–675.
48. Loram ID, Maganaris CN, Lakie M (2007) The passive, human calf muscles in
relation to standing: the short range stiffness lies in the contractile component.Journal of Physiology-London 584: 677–692.
49. van Soest AJ, Rozendaal LA (2008) The inverted pendulum model of bipedal
standing cannot be stabilized through direct feedback of force and contractileelement length and velocity at realistic series elastic element stiffness. Biological
Cybernetics 99: 29–41.
50. van de Kamp C, Gawthrop PJ, Gollee H, Lakie M, Loram ID (2013) Interfacing
sensory input with motor output: does the control architecture converge to aserial process along a single channel? Frontiers in Computational Neuroscience
7: 55.
51. Loram ID, van de Kamp C, Lakie M, Gollee H, Gawthrop PJ (2014) Does themotor system need intermittent control? Exercise and Sport Sciences Reviews
42: 117–25.
52. Watanabe RN, Magalhaes FH, Elias LA, Chaud VM, Mello EM, et al. (2013)Influences of premotoneuronal command statistics on the scaling of motor
output variability during isometric plantar flexion. Journal of Neurophysiology
110: 2592–606.
53. Mello EM, Magalhaes FH, Kohn AF (2013) Larger plantar flexion torquevariability implies less stable balance in the young: an association affected by
knee position. Human Movement Science 32: 1310–24.
54. Kavounoudias A, Roll R, Roll JP (2001) Foot sole and ankle muscle inputscontribute jointly to human erect posture regulation. Journal of Physiology-
London 532: 869–878.
55. Jacobs JV, Horak FB (2007) Cortical control of postural responses. Journal of
Neural Transmission 114: 1339–1348.
56. Proske U, Gandevia SC (2012) The proprioceptive senses: their roles in signalingbody shape, body position and movement, and muscle force. Physiological
Reviews 92: 1651–97.
57. Zehr EP (2002) Considerations for use of the Hoffmann reflex in exercise studies.European Journal of Applied Physiology 86: 455–68.
58. Pierrot-Deseilligny E, Burke D (2012) The circuitry of the human spinal cord:
Spinal and corticospinal mechanisms of movement. Cambridge: CambridgeUniversity Press, 606 pp.
59. Aniss AM, Diener HC, Hore J, Gandevia SC, Burke D (1990) Behavior of
human muscle receptors when reliant on proprioceptive feedback during
standing. Journal of Neurophysiology 64: 661–670.
60. Diener HC, Dichgans J, Guschlbauer B, Mau H (1984) The significance ofproprioception on postural stabilization as assessed by ischemia. Brain Research
296: 103–9.
61. Meyer PF, Oddsson LIE, De Luca CJ (2004) The role of plantar cutaneoussensation in unperturbed stance. Experimental Brain Research 156: 505–12.
62. Duarte M, Harvey W,ZatsiorskyVM (2000) Stabilographic analysis of
unconstrained standing. Ergonomics 43: 1824–1839.
63. Markram H (2006) The blue brain project. Nature Reviews Neuroscience 7:
153–160.64. Raphael G, Tsianos GA, Loeb GE (2010) Spinal-like regulator facilitates control
of a two-degree-of-freedom wrist. Journal of Neuroscience 30: 9431–9444.
65. Eliasmith C, Stewart TC, Choo X, Bekolay T, DeWolf T, et al. (2012) A large-scale model of the functioning brain. Science 338: 1202–5.
66. Dideriksen JL, Negro F, Enoka RM, Farina D (2012) Motor unit recruitmentstrategies and muscle properties determine the influence of synaptic noise on
force steadiness. Journal of Neurophysiology 107: 3357–3369.
67. Farina D, Negro F, Dideriksen JL (2014) The effective neural drive to muscles isthe common synaptic input to motor neurons. The Journal of Physiology 592:
3427–41.68. Elias LA, Chaud VM, Kohn AF (2012) Models of passive and active dendrite
motoneuron pools and their differences in muscle force control. Journal ofComputational Neuroscience 33: 515–531.
69. Elias LA, Kohn AF (2013) Individual and collective properties of computation-
ally efficient motoneuron models of types S and F with active dendrites.Neurocomputing 99: 521–533.
70. Bui TV, Grande G, Rose PK (2008) Multiple modes of amplification of synapticinhibition to motoneurons by persistent inward currents. Journal of Neurophys-
iology 99: 571–582.
71. Destexhe A (1997) Conductance-based integrate-and-fire models. NeuralComputation 9: 503–514.
72. Destexhe A, Mainen ZF, Sejnowski TJ (1994) An efficient method for computingsynaptic conductances based on a kinetic-model of receptor-binding. Neural
Computation 6: 14–18.73. Johnson MA, Polgar J, Weightman D, Appleton D (1973) Data on the
distribution of fibre types in thirty-six human muscles. An autopsy study. Journal
of the Neurological Sciences 18: 111–129.74. McComas AJ (1991) Invited review: motor unit estimation: methods, results, and
present status. Muscle & Nerve 14: 585–597.75. Cheng EJ, Brown IE, Loeb GE (2000) Virtual muscle: a computational
approach to understanding the effects of muscle properties on motor control.
Journal of Neuroscience Methods 101: 117–130.76. Thelen DG (2003) Adjustment of muscle mechanics model parameters to
simulate dynamic contractions in older adults. Journal of BiomechanicalEngineering 125: 70–77.
77. de Vlugt E, de Groot JH, Wisman WH, Meskers CG (2012) Clonus is explainedfrom increased reflex gain and enlarged tissue viscoelasticity. Journal of
Biomechanics 45: 148–155.
78. Bawa P, Stein RB (1976) Frequency-response of human soleus muscle. Journal ofNeurophysiology 39: 788–793.
79. Chaud VM, Elias LA, Watanabe RN, Kohn AF (2012) A simulation study of theeffects of activation-dependent muscle stiffness on proprioceptive feedback and
short-latency reflex. In: 4th IEEE RAS/EMBS International Conference on
Biomedical Robotics and Biomechatronics. Rome: IEEE, pp. 133–138.doi:10.1109/BioRob.2012.6290871.
80. Watanabe RN, Elias LA, Kohn AF (2013) Low-frequency fluctuations of plantarflexion torque in force and position control tasks studied experimentally and by a
neuromusculoskeletal model. In: 6th International IEEE/EMBS Conference onNeural Engineering (NER). IEEE, pp. 794–797. doi:10.1109/
NER.2013.6696054.
81. Sartori M, Reggiani M, Farina D, Lloyd DG (2012) EMG-driven forward-dynamic estimation of muscle force and joint moment about multiple degrees of
freedom in the human lower extremity. PLoS One 7: e52618.82. Arnold EM, Ward SR, Lieber RL, Delp SL (2010) A model of the lower limb for
analysis of human movement. Annals of Biomedical Engineering 38: 269–279.
83. Menegaldo LL, de Toledo Fleury A, Weber HI (2004) Moment arms andmusculotendon lengths estimation for a three-dimensional lower-limb model.
Journal of Biomechanics 37: 1447–1453.84. Mileusnic MP, Brown IE, Lan N, Loeb GE (2006) Mathematical models of
proprioceptors. I. Control and transduction in the muscle spindle. Journal of
Neurophysiology 96: 1772–1788.85. Lin CC, Crago PE (2002) Neural and mechanical contributions to the stretch
reflex: a model synthesis. Annals of Biomedical Engineering 30: 54–67.86. Matthews PB, Stein RB (1969) Regularity of primary and secondary muscle
spindle afferent discharges. Journal of Physiology-London 202: 59–82.87. Nardone A, Schieppati M (1998) Medium-latency response to muscle stretch in
human lower limb: estimation of conduction velocity of group II fibres and
central delay. Neuroscience Letters 249: 29–32.88. Banks RW (2006) An allometric analysis of the number of muscle spindles in
mammalian skeletal muscles. Journal of Anatomy 208: 753–768.89. Burke D, Hagbarth KE, Skuse NF (1978) Recruitment order of human spindle
endings in isometric voluntary contractions. Journal of Physiology-London 285:
101–112.90. Kearney RE, Hunter IW (1982) Dynamics of human ankle stiffness: variation
with displacement amplitude. Journal of Biomechanics 15: 753–756.91. Hunter IW, Kearney RE (1982) Dynamics of human ankle stiffness: variation
with mean ankle torque. Journal of Biomechanics 15: 747–752.92. Loeb GE, Brown IE, Cheng EJ (1999) A hierarchical foundation for models of
sensorimotor control. Experimental Brain Research 126: 1–18.
Large-Scale Neuromusculoskeletal Model of Human Upright Standing
PLOS Computational Biology | www.ploscompbiol.org 18 November 2014 | Volume 10 | Issue 11 | e1003944
Copyright © 2022 FDOKUMEN