State transitions in a model of intermittent seizure dynamics
Upload
khangminh22Category
view
3download
0
Do Intermittent Renewables Threaten the Electricity
Supply Security?
Mario Liebensteiner∗ Matthias Wrienz†
October 9, 2018
Abstract: Around the globe, intermittent renewable energies in the form of windand solar power are on the rise. This study tests if renewable energies replace conven-tional electricity generation technologies. We estimate a dynamic investment model for14 European economies for the period 2002�2016 and �nd a non-negligible negative im-pact of intermittent renewables on investment in peak-load capacity (mainly gas), whilebase-load plants are una�ected. However, the production �exibility of thermal peak-loadplants represents a particularly vital function to balance the supply intermittency of windand solar. Thus, dispatchable conventional power plants are still necessary to back thesystem under scarcity events, such as unfavorable weather conditions during high elec-tricity demand. In the long-run, the vast deployment of renewables creates a signi�cantunderinvestment gap in peak-load capacity. To prevent the risk of a blackout and toensure a reliable supply of electricity, the need for policy intervention and a redesign ofthe current electricity markets seems inevitable.
Keywords: Electricity Generation, Investment, Missing Money, Intermittent Renew-ables, Supply Security
JEL Classi�cation: D25, L16, L51, L94, Q42
This research did not receive any speci�c grant from funding agencies in the public,commercial, or not-for-pro�t sectors.
∗Corresponding author: University of Kaiserslautern, Institute for Ressource and Energy Economics,[email protected]†Vienna University of Economics and Business (WU), [email protected]
1
1 Introduction
Growing concerns about climate change in combination with unfavorable energy de-
pendence and continuously increasing energy demand have induced politicians in many
economies around the globe to revise incumbent energy policies. As a consequence, re-
newable energy sources (RES), foremost among them wind and solar power, are viewed
as one of the most e�cient tools to tackle these problems. In Europe, RES enjoy tremen-
dous subsidies and have thus become essential components in the energy mix. The market
share of RES has been steadily increasing over the last two decades and is expected to
grow further (IEA, 2017). In 2015, RES made up 29.9% of the EU-28's total electricity
production. In terms of installed electricity generation capacity, the share of wind and
solar increased from a low 0.4% in 1995 to 24.3% in 2015 (EC, 2017). Despite the po-
tential bene�ts of RES to abate carbon emissions through clean electricity production,
adverse e�ects emerge. RES may undermine incentives to invest in conventional thermal
power plants, which are still needed to ensure the security of electricity supply, because
wind and solar plants cannot produce when the wind does not blow and the sun does not
shine. Moreover, given RES's intermittent nature, gaps between electricity supply and
demand have to be �lled by �exible conventional technologies, such as gas-�red power
plants. Underinvestment in conventional electricity generating sources may thus threaten
the system reliability in the long run.
In this paper, we study how the deployment of RES replaces conventional thermal
electricity plants.1 Even if capacity from RES were abundant, their intermittency makes
it necessary to back the electricity system with dispatchable conventional power plants.
One reason is that wind and solar generally enjoy subsidization in the form of prioritized
feed-in at guaranteed (minimum) tari�s, so that their electricity production is decoupled
from demand variations. Instead, they feed in whenever the wind blows or the sun
shines. What aggravates the problem is that large-scale electricity storages are not (yet)
technically and economically feasible, apart from the limited scope of pump storages in
mountain areas (e.g. the Alps).
At the outset, the e�ect of intermittent RES on investment in conventional generation
capacity is not clear-cut. Some studies (e.g. Traber and Kemfert, 2011) mention that
the deployment of RES clearly reduces the residual demand for thermal peak-load plants,
whereas their production volatility may again increase the utilization of these plants. In
a similar vein, Green and Vasilakos (2011) postulate that a large deployment of volatile
wind power in the UK may require a vast amount of peak-load capacity (�plants with low
capital costs�, p. 2) whereas base-load plants may become obsolete. Bushnell and Novan
1From here on we will refer to the e�ect of replacing conventional technologies with RES as `replace-ment e�ect'.
2

(2018) �nd for the Californian electricity market that the drastic expansion of solar power
lead to a decrease of average wholesale prices, whereas the decrease is non-linear, so that
mid-day prices decline while �shoulder hour prices� increase. The authors conclude from
these �ndings that rather base-load plants could be a�ected while peak-load plants may
remain in the market. Hence, it is not entirely clear whether the deployment of RES
decreases investment in base- or peak-load plants.
Nonetheless, a preponderance of arguments point in the direction that RES impede
investment in conventional peak-load capacity for several reasons.2 One reason is that
RES have a negative e�ect on the wholesale electricity price level � the so called `Merit
Order E�ect'. Given that dispatchable thermal plants (foremost gas) operate at high
marginal costs, a low wholesale price may undermine their pro�tability. In contrast,
base-load power plants (e.g. run-of-river hydro, nuclear, and coal) have high �xed costs
but relatively low marginal costs. For these plants, the merit order e�ect may not be
pronounced enough to fall below their marginal costs. Another reason is that not only
a lower price level, but also a shrinking peak/o�-peak price spread resulting from more
RES hinders investment in peak-load plants. The relatively high marginal costs of peak-
load plants require peaking wholesale prices to be pro�table. A third reason is that RES
feed-in at essentially zero marginal cost, which has a decreasing e�ect on the capacity
utilization of peak-load plants as they get pushed out of the merit order more frequently.3
In the long run, the e�ect of replacing conventional peak-load technologies with RES
may be strong enough to put the system viability under pressure, increasing the risk of a
blackout.
Table 1 shows a stylized example of how RES push gas out of the merit order for
a given electricity demand. In panel (a), the market works in the conventional fashion
assuming a country without RES, but having installed base-load capacity in the form of
run-of-river hydro, nuclear, lignite, and hard coal, and peak-load capacity in the form of
gas and oil. In this setup, gas represents the marginal technology and determines the
wholesale market price, P. In panel (b), the country installs RES capacity in the form
of wind and solar plants, which have (almost) zero marginal costs. These plants shift
the supply curve to the right. At given demand, now hard coal becomes the marginal
technology leading to a price drop from P to P' (i.e. the merit order e�ect). We can
see that RES �rst replace peak-load plants (in this case gas) with high marginal costs,
whereas base-load plants remain in the merit order. However, with further deployment
2Section 2 provides in-depth details and reviews the relevant literature on how RES may replaceconventional power plants.
3There may be other reasons for less investment in dispatchable thermal units. For example, a highermarket risk arising from the deployment of RES may discourage investment in conventional thermalplants (see, e.g., Steggals et al., 2011). Also, Cramton and Ockenfels (2012) highlight that political andregulatory uncertainty hinders investment in conventional generation technologies.
3
of RES, it is well possible that base-load plants are also a�ected.
This paper puts forth empirical evidence regarding the renewables' replacement e�ect
on conventional generation capacity � a well-established but surprisingly under-researched
idea. We utilize data from Platts PowerVision on di�erent types of electricity generation
capacity combined with other data sources to provide an aggregate view on how the
deployment of �uctuating RES a�ects capacity investments in conventional technologies
in 14 European economies for the sample period 2002�2016.4 Our results point to a
non-negligible replacement e�ect on investment in peak-load plants in Europe.
A well-known issue in the application of dynamic panel estimations is that simple
OLS with �xed e�ects may yield biased coe�cient estimates. As our investment model
requires the inclusion of a lagged dependent variable, we apply various estimators (i.e.
LSDVC, di�erence GMM, and system GMM) to account for this kind of bias and arrive
at robust estimates. In contrast to peak-load investment, our results indicate that base-
load investment is una�ected by intermittent RES. Moreover, we disentangle the e�ects
of wind and solar power and reach the conclusion that our �nding of a negative reaction
among investments in peak-load capacity due to increased RES is mainly driven by wind
feed-in, whereas the relatively modest solar feed-in during our sample period did not
manifest in a statistically signi�cant e�ect. Our results are also robust to alternative
estimators and model speci�cations.
Our study extends the relatively limited literature that investigates intermittent re-
newables' detrimental investment e�ects. The rising uncertainty about su�cient pro�t
margins to justify investments in conventional power plants has become an in�uential
parameter in investors' decision-making processes and has since gained attention as the
`missing money problem' in the literature (Joskow, 2008). Drawing inferences from a
computational market model, Winkler et al. (2016) argue that the penetration of RES
decreases average wholesale electricity prices, which evokes concerns about the returns
on infrastructure investments. Moiseeva et al. (2017) point out the need for �exible con-
ventional power plants that are capable of balancing gaps between electricity supply and
demand resulting from �uctuating RES and deviations from production forecasts because
of unpredictable weather conditions. A lack of su�cient dispatchable generation capacity
(independent from weather conditions) may cause signi�cant price spikes when variable
electricity generation departs from forecasted levels and may trigger problems in terms of
system reliability and energy supply.5 Based on a computational energy market model for
Germany, Traber and Kemfert (2011) �nd that increasing market penetration of renew-
ables (especially wind) reduces residual demand for conventional plants, which leads to
4The actual regression samples are limited to 2004�2016 due to lags and �rst di�erences in theemployed variables.
5Wozabal et al. (2016) �nd a non-linear e�ect of intermittent RES on the price volatility. While smallto moderate shares of RES dampen the price variance, the e�ect increases with large shares of RES.
4

Figure 1: Merit order (a) without and (b) with RES and the resultingwholesale price
The �gure shows a stylized merit order (supply) curve (a) without and (b) withintermittent RES (i.e. solar and wind) for a given demand, D. In (a) gas is the marginal
technology, which determines the wholesale price P. In (b) the RES shift theconventional technologies to the right, so that now hard coal becomes the marginal
technology at a lower price P'.
5

crowding out e�ects. Additionally, the authors �nd a negative impact of wind penetration
on investment incentives in peak plants (especially gas) and conclude that this result is
mainly driven by the lower utilization of peak-load plants.
Praktiknjo and Erdmann (2016) raise concerns about the long-term viability of the
electricity system in Germany, as they claim that the merit-order e�ect of renewables has
brought about electricity prices to fall below even the most e�cient combined-cycle gas
turbines, so that investments in those �ideal backup units� (p. 91) have been canceled.
Indeed, many other studies (e.g. Clo et al., 2015; De Vos, 2015; Gelabert et al., 2011; Gil
et al., 2012; Hirth, 2013; Ketterer, 2014; Welisch et al., 2016; Würzburg et al., 2013), �nd
corroborative empirical evidence for the negative e�ect of RES on wholesale prices in var-
ious countries. Although many drivers, such as the vast deployment of RES, may be held
responsible for the lack of investment incentives, some authors (Hogan, 2017; Praktiknjo
and Erdmann, 2016) mention that over-capacity � a typical feature of electricity markets
� may also be blamed. Hence, we �ll a gap in the literature as (i) we econometrically
investigate how intermittent RES impact investment in conventional back-up generation
capacity, whereas the few other studies that do so rely on computational models; (ii)
while many studies show that wholesale prices are distorted through the deployment of
RES, we model the direct link between RES and investment; (iii) we explicitly control
for excess capacity in the electricity system and show that otherwise the negative e�ect
of RES on investment in peak-load technologies would be overstated.
The �ndings in our paper that the vast deployment of volatile RES curtails invest-
ment in conventional generation technologies imply consequences for resource adequacy.
This raises the need for action, as the potential threat of underinvestment in conven-
tional peak-load technologies calls into question the current state of electricity market
designs. For countries such as Germany that have been tremendously subsidizing wind
and solar technologies, our results predict a severe investment gap in gas-�red plants,
which will result in missing dispatchable electricity generation capacity in the long run.
Other countries, such as Poland, that still have to achieve the transition from a largely
coal-�red electricity system to a low-carbon intensive production, in order to meet the
EU renewables targets set for 2020 and 2030, may also have to deal with the threat of
underinvestment in electricity backup capacity in the coming years. We emphasize that
the integration of intermittent RES while at the same time maintaining adequate secu-
rity of power supply may not be feasible without political intervention. Policy-makers
may either incentivize investment in conventional generation capacity, for example by
establishing capacity markets or other capacity payment mechanisms, or try to reduce
the adverse e�ects of renewables subsidies in an energy-only market, which may come
at the cost of undesirably high greenhouse gas (GHG) emissions. Our results are also
informative for countries outside of Europe with a massive deployment of wind and solar
6
generation sources in their electricity markets, such as China, USA, Japan, or India.6
2 Background
The International Energy Agency (IEA, 2012) already warned about a potential invest-
ment gap in European electricity markets in 2012, as it identi�ed maintaining the long-
term supply security of electricity during the current phase of decarbonization in Europe
as one of the main challenges. Not only in Europe, but also globally, wind and solar power
are on the rise, because these technologies have been determined by policy-makers as the
most powerful tools to tackle global warming (below we show that advanced economies
heavily invest in wind and solar power). In contrast, other emission-free technologies face
major drawbacks. Nuclear power does not produce greenhouse gas emissions, yet has be-
come politically undesirable in many European economies, not least since the Fukushima
Daiichi nuclear incident in March 2011 (Grossi et al., 2017). Other renewable energy
sources have proven ine�cient as they have not yet achieved technological maturity (e.g.
biofuels) or are limited in their availability (e.g. geothermal).
The global deployment of installed wind generation capacity has multiplied almost
thirty-fold from 17,684 MW in 2000 to 539,256 MW in 2017 (EurObserv'ER, 2018).
Outside Europe, the countries with the highest installed wind turbine capacities are
China (124,710 MW), USA (67,870 MW), India (23,762 MW), and Canada (10,204 MW),
whereas leading European countries are Germany (42,367 MW), Spain (22,987 MW), the
United Kingdom (13,313 MW), and France (9,819 MW).7 At a global level, solar PV also
enjoys a massive capacity build-up from an initial 1,288 MW in 2000 to 404,500 MW in
2017, with China, India, USA, and Japan having the highest forecasted capacity addi-
tions between 2018 and 2022 outside Europe, while Spain, Germany, and France have the
highest in Europe (SolarPower Europe, 2018).
Although con�rmed as a success when it comes to the build-up of renewable capacity
(Dijkgraaf et al., 2018; Jenner et al., 2013; Mints, 2012; Moosavian et al., 2013), these
developments raise concerns among academics and institutions, as the vast deployment of
intermittent wind and solar generation technologies brings about adverse e�ects that put
pressure on the electricity system. The commitment to sustainable energy production has
resulted in higher volatility in energy markets (Hirth, 2013). This is best shown by the
development of electricity prices, where negative power prices in the wholesale electric-
ity market have become a fairly common phenomenon in times of excess energy supply
(De Vos, 2015). Moreover, the increasing penetration of renewables has further caused
6These countries have the highest investment rates in renewable power in 2015 (Bloomberg, 2018).72015 values; data according to the World Wind Energy Association (WWEA), https://wwindea.
org/blog/2015/09/09/hyr2015/, accessed on August 2, 2018.
7
average electricity prices to decrease, which has evoked concerns about the returns on in-
frastructure investments (Winkler et al., 2016).8 The rising uncertainty about su�cient
pro�t margins to justify investments in conventional power plants has become an in�uen-
tial parameter in the decision making process of investors and has since gained attention
as the 'missing money problem' in the literature (Joskow, 2008). The Economist9 has
also investigated the problem of underinvestment due to intermittent RES and expresses
the problem clearly: �an electricity industry that does not produce reliable revenues is
not one that people will invest in.�
The problem of missing money for required investments in conventional power plants
will be further aggravated by the decreasing spread between peak and o�-peak prices,
caused by higher renewable penetration rates in the energy mix. This latter e�ect is
rooted primarily in the high correlation between peak energy demand and the maximum
possible amount of energy which can be supplied by renewables during daytime (solar
PV) or season (wind). Plants that rely heavily on large arbitrage payments become un-
pro�table and impede investment decisions by investors. Hirth (2013) emphasizes that
electricity generation technologies with high marginal costs (e.g. oil, gas) are most prone
to disinvestments due to the development of intermittent RES. This is underlined by
Praktiknjo and Erdmann (2016), who claim that falling wholesale electricity prices in
Germany due to the merit order e�ect of renewables have made even the most e�cient
combined-cycle gas turbines unpro�table as the wholesale price has fallen below their
marginal costs. Moreover, government support schemes for intermittent RES decouple
their investment incentives from market-based mechanisms, while the market prices be-
come more and more distorted, which in turn hinders investment in conventional fossil
technologies. In this regard, Traber and Kemfert (2011) raise the concern that the inte-
gration of intermittent RES may endanger system reliability, for which a political solution
is desirable. Other authors, too, already claim that political intervention in the electricity
markets may be inevitable in order to address the problems arising with further deploy-
ment of renewables (e.g. Hildmann et al., 2015; Cludius et al., 2014; Steggals et al., 2011;
Traber and Kemfert, 2011)
Hence, the integration of intermittent RES, which depend heavily on weather con-
ditions, brings about several market distortions that may impede investment in `dis-
patchable' thermal power plants � plants that are able to adjust output in response to
changing economic conditions and market incentives. The literature highlights decreas-
ing wholesale prices as a response to more RES as one form of distorted investment
8A small thought-experiment may underline this development: in an electricity system that is entirelydriven by zero-marginal-cost-renewables the wholesale price would drop to zero, rendering any investmentunpro�table.
9The Economist, February 25, 2017, �A World Turned Upside Down�, https://www.economist.com/briefing/2017/02/25/a-world-turned-upside-down, accessed on 10.09.2018.
8
signals. Furthermore, a depression in the peak/o�-peak price spread reduces the times
for which peak-load plants are in the merit order, given their relatively high marginal
costs. The problem becomes particularly pronounced when the wind blows during times
of low electricity demand, which yields even negative prices at the power exchange, so
that conventional plants lose money. Moreover, a lower utilization rate of thermal plants
makes further investments unpro�table. In a system where the real-time balance between
supply and demand is a prerequisite for the system stability, large shares of intermittent
renewable energy production pose considerable challenges for grid operators.
However, the deployment of RES may not be the sole reason for decreasing investment
activity in peak-load generation assets. Depressed investment activity may also be the
result of an initial state of over-capacity, which is an inevitable feature of even healthy
electricity markets. Since electricity cannot be stored in large amounts, supply has to
meet demand at all times. Therefore, enough capacity reserve must be available in the
system to meet peak demand (Joskow and Tirole, 2007) or to o�set supply disruptions
(Genc and Thille, 2011). During times of �normal� demand, over-capacity is thus a typical
phenomenon. Indeed, Hogan (2017) even raises the possibility that over-capacity is the
sole reason for missing investment incentives: �Most, if not all, of the �nancial distress
currently plaguing many European and North American generation markets can easily be
traced to overcapacity [...]. Sometimes claims of `missing money' are just rent-seeking in
disguise.� Similarly, Praktiknjo and Erdmann (2016) construe the decline in investment
in electricity generation capacity as a typical market reaction due to missing investment
incentives, also pointing to over-capacity as a driving force. From this perspective, it is
particularly relevant to control for excess capacity in an econometric investment regres-
sion.
To countervail the risk of a blackout in the long-run by securing adequate investment
in conventional electricity generation technologies, the need for policy intervention and/or
a revision of the current market design is emphasized in the literature. Cramton and Ock-
enfels (2012) propose capacity markets as a potential solution to the threefold problem
of missing investment in times of increasing electricity demand, aging power plants that
may retire, and investments becoming more risky due to political uncertainty and in-
creasing volatility of wholesale prices as a consequence of erratic growth of intermittent
RES. Capacity markets seek to guarantee resource adequacy by ensuring payment for
holding enough capacity reserves together with the recall option to retrieve the capacity
(e.g. at the spot price plus a strike price). A theoretical underpinning of the need for
capacity markets is provided by Creti and Fabra (2007). Taking subsidized RES into
consideration, Brown (2018) �nds in a theoretical model that without capacity payment
mechanisms underinvestment in electricity generation capacity occurs, and that capacity
auctions are a way to alleviate the problem (although in that model optimal capacity
9
installations cannot be encompassed).
However, as European electricity markets are strongly interconnected (Gugler et al.,
2018), there are concerns about unilateral policies, such as the implementation of national
capacity markets. Instead, cross-border capacity markets based on market incentives are
desired (Erbach, 2017). Other policy measures that may ensure a reliable electricity
provision are, for example, fostering research in energy storage in order to mitigate and
better adjust the volatility of RES supply to the demand, or to make �nal demand more
price elastic (e.g. through smart metering) so that it better reacts to wholesale price
spikes during scarcity events. Praktiknjo and Erdmann (2016) propose a demand-side
approach that grants a monthly monetary premium to representatives of the demand side
(e.g. industrial customers, retailers, balancing responsible parties) depending on their
share of intermittent RES in their sales portfolio. According to the authors, such a �pull
mechanism� on the demand side gives �market forces the opportunity to �nd innovative
and �exible solutions that are likely to be precisely tailored to accommodate larger shares
of renewables� (Praktiknjo and Erdmann, 2016, p. 102).
In any case, the subsidization of intermittent RES in European electricity markets
creates a distortion of market forces that leads to insu�cient investment signals for con-
ventional back-up capacity through inadequate wholesale prices. Against this backdrop,
this paper adds to the debate about the potential threat of intermittent renewables on
the supply security by empirically investigating the impact of renewables on conventional
generation capacity in terms of direction and magnitude.
3 Empirical Strategy
This empirical section aims at estimating the impact of RES on investment in conven-
tional electricity generation capacity. First and foremost we are interested in the e�ect of
the production share of wind and solar in total electricity production. A higher feed-in
from intermittent RES may bring about signi�cant e�ects on investment activity, as it
is essentially electricity production (and its interplay with demand) that determines the
electricity price and consequently the utilization rates of conventional plants.
Our main hypothesis for empirical examination is that RES have a negative e�ect
on investment in peak-load generation capacity, such as oil and gas plants, because these
technologies make up the steep part of the merit-order curve and are therefore most likely
in�uenced by shifts of the supply curve due to changes in the supply from RES. However,
we expect the investment activity in base-load capacity to react insensitively to changes in
RES. The reason is that base-load technologies, such as hydro, nuclear, and some forms of
coal, are located in the �at part of the supply curve, which may not be severely in�uenced
by supply shifts induced by RES.
10

We follow the related literature that estimates investment in electricity markets (e.g.
Gugler et al., 2013, 2016; Cambini and Rondi, 2010) and consider the following dynamic
investment model:
Ii,t = αIi,t−1 + βRESi,t +X ′i,tγ +X ′tδ + ζT + υi + εi,t, (1)
where i and t denote the country and year, respectively. The dependent variable Ii,t
denotes either the investment rate of peak-load or base-load capacity. We include a lagged
dependent variable Ii,t−1 to account for the possibility that investment in one year may
be systematically followed by capacity additions in the next year. Our main coe�cient of
interest is β, which measures the e�ect of the production share of intermittent renewables
(RES). Xi,t is a set of control variables that vary across countries and time, whereas
Xt contains control variables that are variant over time but not between countries. The
time trend T (T=1 in 2004, ... T=13 in 2016) controls for changes in the dependent
variables that are unobserved (and thus not captured by the right-hand-side variables)
but constant across countries (e.g. technological progress). In a robustness speci�cation
we include year �xed e�ects instead of the time trend, which however forces us to drop Xt
from the regression due to perfect multi-collinearity. The country �xed e�ects υi take up
unobserved country heterogeneity that is time-invariant, while the error term εi,t captures
random shocks. All regressions include heteroskedasticity robust standard errors that are
clustered at the country level to account for serial correlation.
Because we apply a �xed e�ects model, which demeans all variables (i.e. for each
variable the within-country means are subtracted from the actual values), identi�cation
is solely based on the within-country variation.10 Hence, it is important that our variables
have su�cient variation over time within their groups (i.e. per country). Thus, Table A1
decomposes the standard deviations of all relevant variables within and between groups. It
is clear from this table that all variables employed in the analysis indeed exhibit signi�cant
within-country variation.
In our standard application of equation (1) we run OLS with �xed e�ects (OLS-FE).
However, the inclusion of a lagged dependent variable may yield biased estimates under
OLS and render the �xed-e�ects estimator ine�cient (see, e.g., Nickell, 1981; Arellano and
Bond, 1991).11 We therefore apply the LSDVC estimator for unbalanced panels (Bruno,
2005a) that builds on previous work by Bun and Kiviet (2003), Kiviet (1995), and Kiviet
(1999). The LSDVC estimator is designed for panels where N is small (Bruno, 2005b). In
10For example, Wooldridge (2002, p. 296) mentions that the �xed-e�ects estimator �is also called thewithin estimator because it uses the time variation within each cross section.�
11Nickell (1981) shows that not only might the coe�cient of the lagged dependent variable be biased(due to a correlation of the lagged dependent variable and the contemporaneous error term), but if theother regressors are correlated with the path-dependent variable, the dynamic panel bias might spreadon their coe�cients as well.
11
our case, the number of countries is relatively small (N=14), whereas the sample spans a
relatively long period of T=13 years (2004�2016). Other estimators, such as the Anderson-
Hsiao estimator (Anderson and Hsiao, 1982), di�erence GMM (Arellano and Bond, 1991),
or system GMM (Arellano and Bover, 1995), are designed for panel datasets with large N
but small T . Judson and Owen (1999) suggest that the bias-adjusted LSDVC estimator
is a suitable choice if T is relatively large (in their case T = 20), although GMM (and the
Anderson-Hsiao estimator) seem to perform well, too. Bruno (2005b) carries out Monte
Carlo simulations for samples of N = 10, T = 40 and N = 20, T = 20 and concludes that
the bias-corrected LSDVC outperforms GMM estimators. Hence, besides OLS-FE, we run
equation (1) by LSDVC to account for potential bias arising from the path-dependency
of the investment variable. Given the above discussion, we believe that this is the most
appropriate estimator for our analysis.12 However, for the sake of completeness, we also
apply GMM.
4 Data
For the purpose of estimating the investment model, as presented in equation (1), we
utilize panel data on installed electricity generation capacities from Platts PowerVision,
which we combine with data from various sources, such as the International Energy
Agency, the OECD, the BP Statistical Review of World Energy, the World Bank, and
the Fraunhofer Institute. Our estimation sample includes 14 European countries (Aus-
tria, Belgium, Finland, France, Germany, Greece, Ireland, Italy, Netherlands, Portugal,
Spain, Sweden, Switzerland, United Kingdom) for the period 2002�2016. However, as
the investment rate uses the change from year t to year t-1 (relative to t), we lose one
sample year. Moreover, the inclusion of a lagged dependent variable takes out another
year. Hence, the regression sample pans over 2004�2016.
We obtained data on electricity generation capacity for various generation technologies
(distinguished by their primary fuel and turbine type) from Platts PowerVision, a major
independent data and information provider for energy and commodity markets. The data
are structured for the individual plant level and distinguish between di�erent plant types.
For this analysis, we have aggregated the capacity data to the country level at an annual
frequency. Moreover, we place the individual generation types into the following tech-
nology classes: peak-load generation capacity consists of all types of gas and oil plants
(although oil plants amount to a negligible share); base-load capacity consists of hydro-
12Since LSDVC requires stationarity of individual time series when estimated with level data, weperform an Im-Pesaran-Shin panel unit-root test, which automatically chooses the lag length based onthe Bayesian information criterion (BIC). The H0 of a panel-unit root is rejected at the 1% level. Similarly,Fisher-type panel unit-root tests based on the Adjusted Dickey-Fuller approach with both zero and onelag reject the H0 of a panel unit-root.
12
electric, nuclear, waste, geothermal, and coal plants;13 intermittent renewable capacity
consists of installed wind and solar capacities; capacity from other technologies encom-
passes pump storage plants and unde�ned capacity. We then use these data to create mea-
sures of base-load and peak load investment rates as Ig,c,t = (Kg,i,t −Kg,i,t−1)/Kg,i,t−1,
where g denotes the technology (peak or base), i represents the country, and t is the year.
Data on electricity production from di�erent technologies were retrieved from the In-
ternational Energy Association (IEA) Database on Energy Statistics. These data are
structured at the country-year level and allow for creating a measure of wind and so-
lar production as a percentage of total production (RESGenShare). In additional regres-
sions, we also disentangle (the percentage shares of) wind (WINDGenShare) from solar
(SOLARGenShare) to asses their impacts separately.
In the regressions, we control for over-capacity in the system, which we assume to have
a negative in�uence on the decision to invest in peak-load generation capacity. Since
the storage of large amounts of electricity is technically and economically not feasible
(for the time being), there must be enough excess capacity in the system to be able to
meet the highest peak demand.14 Thus, the various European electricity markets are
characterized by signi�cant over-capacities. Our data allow for creating a measure of
over-capacity, which we de�ne as the di�erence between the maximum possible output
under full capacity utilization during each hour per year and the actual annual electricity
output as a percentage of the maximum possible output: OverCap = (Ktotal ∗ 365 ∗ 24−Gtotal)/(Ktotal ∗ 365 ∗ 24) ∗ 100.15 We include our measure of over-capacity lagged by one
year in our regressions to avoid a potential simultaneity bias as the dependent variable
(investment in peak-load capacity) and the over-capacity variable are both derived from
capacity. Indeed, over-capacity turns out to be crucial in our regressions as without
this variable the e�ect of intermittent RES on peak-load capacity investment will be
signi�cantly overestimated by around 25 percentage points (i.e. coe�cients range from
-0.77 with OLS-FE to -0.73 with LSDVC, while the other coe�cients stay robust; see
Appendix Table A5).
13Hydroelectric, waste and geothermal power have not been included as renewable energy sources duetheir non-intermittent nature. In our context, these generation sources are better viewed as base-loadtechnologies.
14With the increasing promotion of international electricity market integration (Gugler et al., 2018),the need for national overcapacity becomes less pressing.
15Another suitable measure would be the electricity generation capacity relative to the peak load,called the �reserve margin� (Joskow, 2007). Unfortunately, we lack hourly load data for our sample of14 countries over the long time period 2002�2016 necessary for determining the peak demand (i.e. themaximum load per year). Nevertheless, our measure of over-capacity may still be useful to test whetheror not over-capacity has a negative e�ect on investment in peak-load plants.
13

Table 1: Sample statistics
Variable Description Mean Std. Dev. Min. Max.Ktotal Total capacity (MW) 50,383 45,932 5,982 172,863Kbase Base-load capacity (MW) 24,684 25,313 1,474 90,504Kpeak Peak-load capacity (MW) 15,232 15,746 201 59,840Kres Wind & solar capacity (MW) 7,851 14,158 9 73,351Kother Other capacity (MW) 2,616 2,558 0 8,464Ipeak (Kpeak,t�Kpeak,t-1)/Kpeak,t-1·100 (%) 2.51 6.89 -18.05 28.13Ibase (Kbase,t�Kbase,t-1)/Kbase,t-1·100 (%) -0.04 4.91 -19.47 47.40RESCapShare Kres/Ktotal·100 (%) 11.25 9.73 0.05 42.72Gtotal Total generation (GWh) 203,488 192,463 25,569 648,394Gres Wind & solar generation (GWh) 13,788 21,435 24 117,932Gwind Wind generation (GWh) 10,800 15,560 6 79,206Gsolar Solar generation (GWh) 2,989 7,029 0 38,726RESGenShare Gres/Gtotal·100 (%) 6.70 6.64 0.04 24.18WINDGenShare Gwind/Gtotal·100 (%) 5.60 5.73 0.01 23.25SOLARGenShare Gsolar/Gtotal·100 (%) 1.10 1.99 0.00 8.11OverCap Share of overcapacity (%) 53.67 9.07 35.82 71.57GDPpc Real GDP per caita (1000 $) 38.796 7.366 23.313 63.192Pgas Gas spot price ($/mBtu) 5.03 2.13 2.46 8.85Peex EEX electr. spot price (e/MWh) 41.58 10.75 26.26 66.77
Note: The sample statistics are provided for the 182 country-year observations during the period2004�2016 as employed in the main regression.
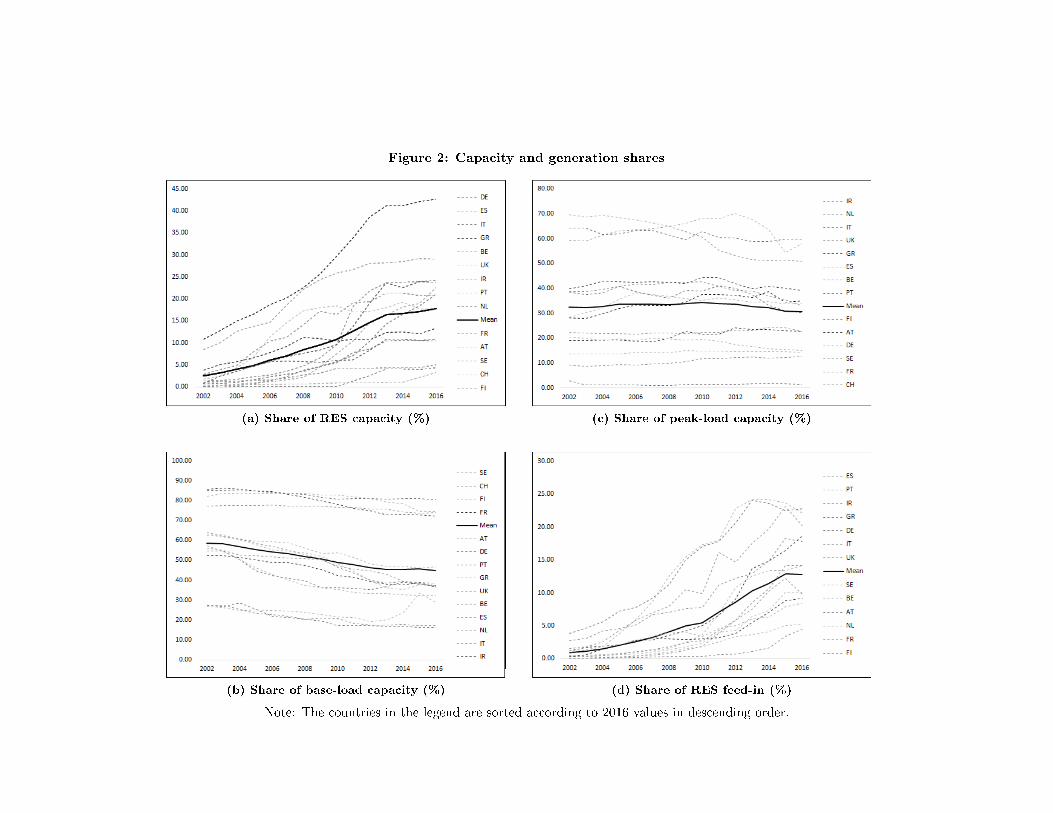
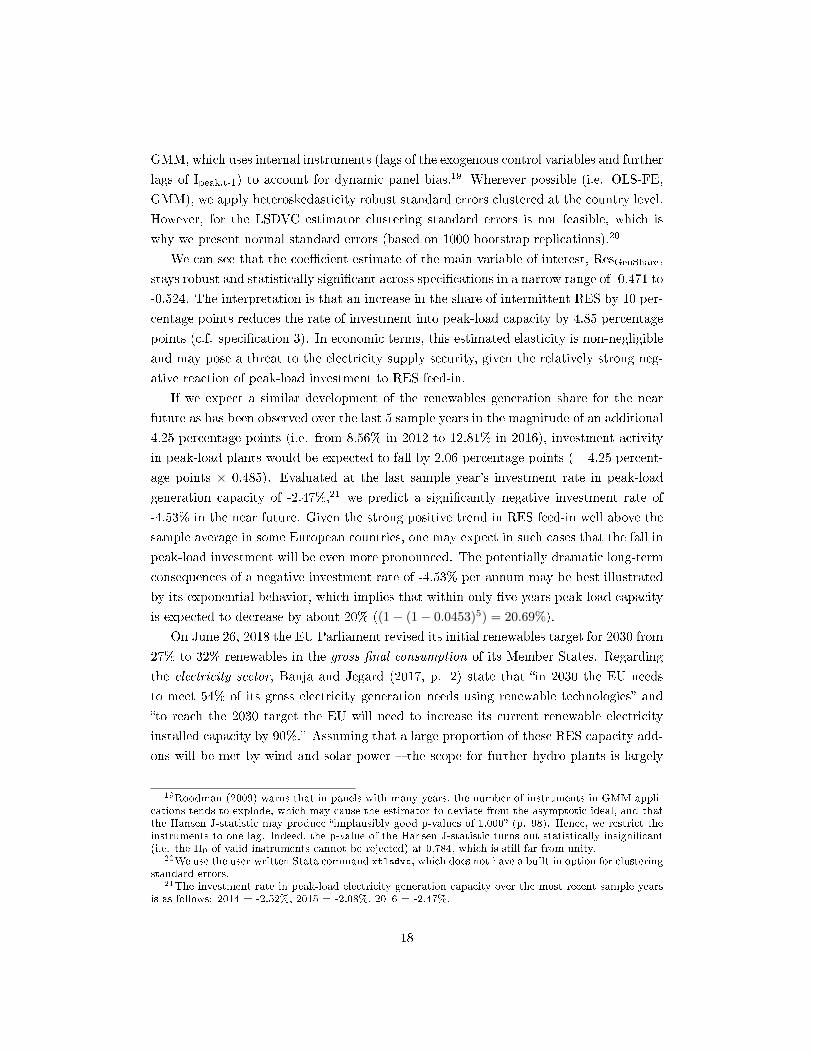
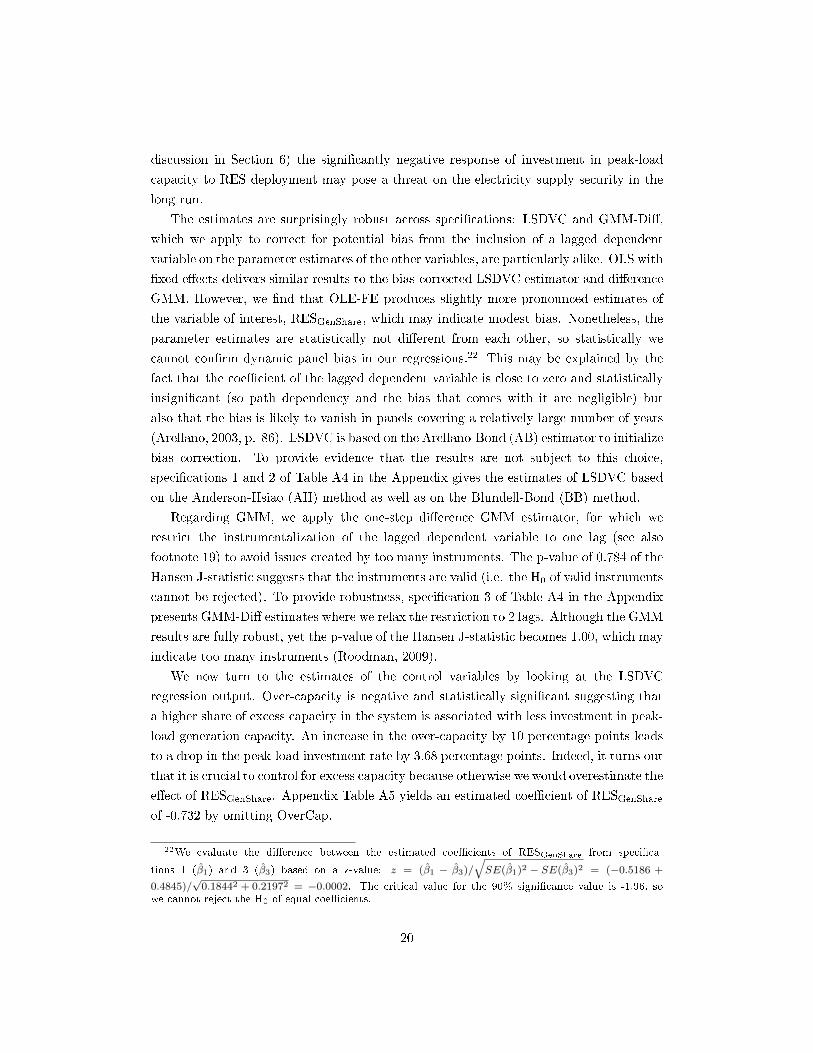
Figure 2: Capacity and generation shares
(a) Share of RES capacity (%)
(b) Share of base-load capacity (%)
(c) Share of peak-load capacity (%)
(d) Share of RES feed-in (%)
Note: The countries in the legend are sorted according to 2016 values in descending order.

We include the real GDP per capita (expenditure approach) in our regressions to ac-
count for country speci�c business cycles and changes in aggregate demand. The variable
is denominated in US dollars at constant prices (base year is 2010) and was retrieved
from the OECD database on national accounts. Moreover, we aim at controlling for in-
put prices, since these are likely to a�ect investment behavior. An increase in fuel prices
may hamper investment in thermal power plants. As input prices are not available for
individual countries, we apply international spot price data that vary over time but not
across countries. Spot prices are applied for two reasons: (i) they represent the oppor-
tunity cost to futures prices, and (ii) peak-load plants may buy at the spot market for
short-term production decisions, whereas futures prices may be more suitable to capture
long-term base-load production decisions. We use the commodity price of gas, namely the
annual mean Henry Hub natural gas spot price (in US Dollars per mBtu16), as obtained
from the BP Statistical Review of World Energy 2017.
Moreover, we include the wholesale price of electricity, which we expect to have a pos-
itive in�uence on investment decisions because a higher wholesale price makes electricity
production more pro�table. Unfortunately, individual spot price data from the countries'
power exchanges are not available for a time period as long as our sample (2002�2016).17
For this reason, we apply the (volume weighted) annual mean EPEX day-ahead spot price
for the German-Austrian price zone as a proxy for the price of wholesale electricity for all
countries in our sample.18 The data are provided by the Fraunhofer Institute for Solar
Energy Systems (ISE).
Table 1 provides sample statistics for all variables employed in this analysis, as well as
the underlying capacity and generation data to create the investment rates and renewable
shares. Table A1 in the Appendix gives correlations of the main variables and indicates
that multi-collinearity is not an issue.
Figures 2a�2c show the developments of the capacity shares of RES, base-load and
peak-load technologies, respectively, as percentages of total installed capacity. Figure
2a depicts a substantial build-up of solar and wind generation capacity over the sample
period, from a low 2.50% in 2002 to 17.80% in 2016. Germany is paving the way with a
dramatic increase in installed wind and solar capacity from 10.85% in 2002 to 42.72% in
2016. Unlike Germany, Finland, Switzerland, Sweden, and Austria have invested signif-
icantly below average in wind and solar power, most likely because of their endowment
with a vast amount of hydro-power, so that for these countries the 2020 climate targets
are already achieved.
Figure 2b shows that essentially all but one country (the Netherlands) face a constantly
16Million British thermal units17Many power exchanges were only established during the late 2000s or early 2010s.18Gugler et al. (2018) show that all individual European day-ahead electricity spot price series are
highly correlated.
16
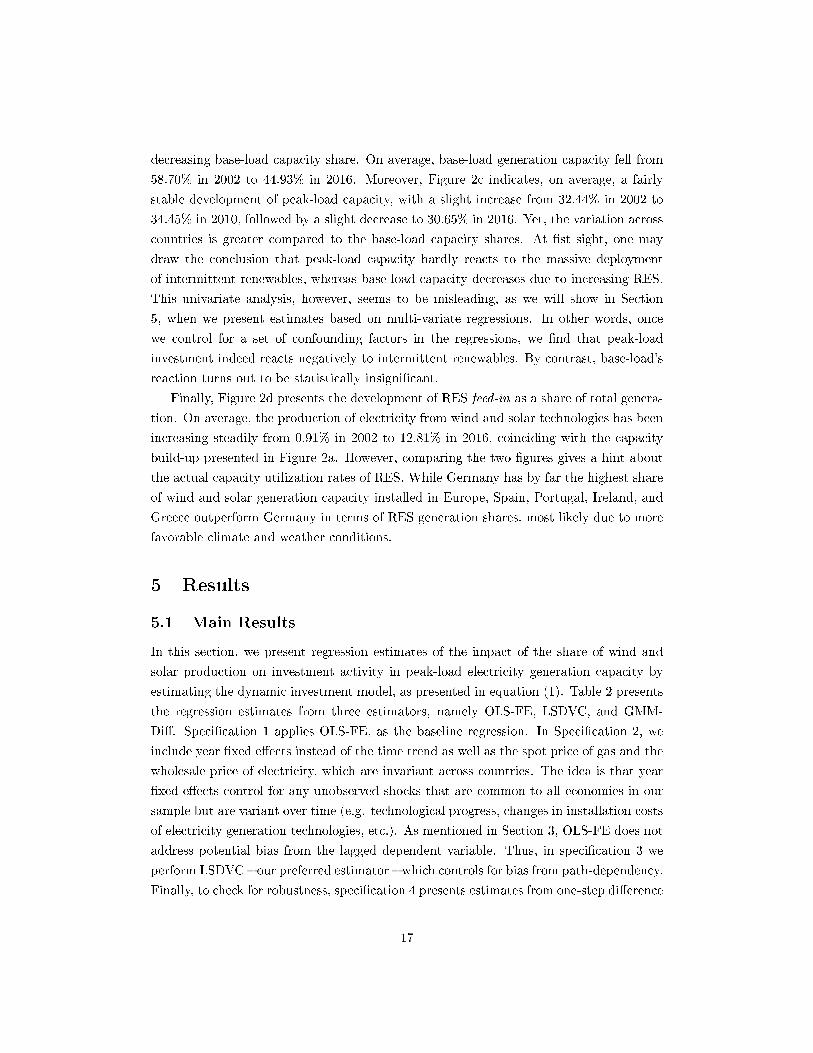
decreasing base-load capacity share. On average, base-load generation capacity fell from
58.70% in 2002 to 44.93% in 2016. Moreover, Figure 2c indicates, on average, a fairly
stable development of peak-load capacity, with a slight increase from 32.44% in 2002 to
34.45% in 2010, followed by a slight decrease to 30.65% in 2016. Yet, the variation across
countries is greater compared to the base-load capacity shares. At �st sight, one may
draw the conclusion that peak-load capacity hardly reacts to the massive deployment
of intermittent renewables, whereas base-load capacity decreases due to increasing RES.
This univariate analysis, however, seems to be misleading, as we will show in Section
5, when we present estimates based on multi-variate regressions. In other words, once
we control for a set of confounding factors in the regressions, we �nd that peak-load
investment indeed reacts negatively to intermittent renewables. By contrast, base-load's
reaction turns out to be statistically insigni�cant.
Finally, Figure 2d presents the development of RES feed-in as a share of total genera-
tion. On average, the production of electricity from wind and solar technologies has been
increasing steadily from 0.91% in 2002 to 12.81% in 2016, coinciding with the capacity
build-up presented in Figure 2a. However, comparing the two �gures gives a hint about
the actual capacity utilization rates of RES. While Germany has by far the highest share
of wind and solar generation capacity installed in Europe, Spain, Portugal, Ireland, and
Greece outperform Germany in terms of RES generation shares, most likely due to more
favorable climate and weather conditions.
5 Results
5.1 Main Results
In this section, we present regression estimates of the impact of the share of wind and
solar production on investment activity in peak-load electricity generation capacity by
estimating the dynamic investment model, as presented in equation (1). Table 2 presents
the regression estimates from three estimators, namely OLS-FE, LSDVC, and GMM-
Di�. Speci�cation 1 applies OLS-FE, as the baseline regression. In Speci�cation 2, we
include year �xed e�ects instead of the time trend as well as the spot price of gas and the
wholesale price of electricity, which are invariant across countries. The idea is that year
�xed e�ects control for any unobserved shocks that are common to all economies in our
sample but are variant over time (e.g. technological progress, changes in installation costs
of electricity generation technologies, etc.). As mentioned in Section 3, OLS-FE does not
address potential bias from the lagged dependent variable. Thus, in speci�cation 3 we
perform LSDVC � our preferred estimator � which controls for bias from path-dependency.
Finally, to check for robustness, speci�cation 4 presents estimates from one-step di�erence
17
GMM, which uses internal instruments (lags of the exogenous control variables and further
lags of Ipeak,t-1) to account for dynamic panel bias.19 Wherever possible (i.e. OLS-FE,
GMM), we apply heteroskedasticity robust standard errors clustered at the country level.
However, for the LSDVC estimator clustering standard errors is not feasible, which is
why we present normal standard errors (based on 1000 bootstrap replications).20
We can see that the coe�cient estimate of the main variable of interest, ResGenShare,
stays robust and statistically signi�cant across speci�cations in a narrow range of -0.471 to
-0.524. The interpretation is that an increase in the share of intermittent RES by 10 per-
centage points reduces the rate of investment into peak-load capacity by 4.85 percentage
points (c.f. speci�cation 3). In economic terms, this estimated elasticity is non-negligible
and may pose a threat to the electricity supply security, given the relatively strong neg-
ative reaction of peak-load investment to RES feed-in.
If we expect a similar development of the renewables generation share for the near
future as has been observed over the last 5 sample years in the magnitude of an additional
4.25 percentage points (i.e. from 8.56% in 2012 to 12.81% in 2016), investment activity
in peak-load plants would be expected to fall by 2.06 percentage points (= 4.25 percent-
age points × 0.485). Evaluated at the last sample year's investment rate in peak-load
generation capacity of -2.47%,21 we predict a signi�cantly negative investment rate of
-4.53% in the near future. Given the strong positive trend in RES feed-in well above the
sample average in some European countries, one may expect in such cases that the fall in
peak-load investment will be even more pronounced. The potentially dramatic long-term
consequences of a negative investment rate of -4.53% per annum may be best illustrated
by its exponential behavior, which implies that within only �ve years peak-load capacity
is expected to decrease by about 20% ((1− (1− 0.0453)5) = 20.69%).
On June 26, 2018 the EU Parliament revised its initial renewables target for 2030 from
27% to 32% renewables in the gross �nal consumption of its Member States. Regarding
the electricity sector, Banja and Jegard (2017, p. 2) state that �in 2030 the EU needs
to meet 54% of its gross electricity generation needs using renewable technologies� and
�to reach the 2030 target the EU will need to increase its current renewable electricity
installed capacity by 90%.� Assuming that a large proportion of these RES capacity add-
ons will be met by wind and solar power � the scope for further hydro plants is largely
19Roodman (2009) warns that in panels with many years, the number of instruments in GMM appli-cations tends to explode, which may cause the estimator to deviate from the asymptotic ideal, and thatthe Hansen J-statistic may produce �implausibly good p-values of 1.000� (p. 98). Hence, we restrict theinstruments to one lag. Indeed, the p-value of the Hansen J-statistic turns out statistically insigni�cant(i.e. the H0 of valid instruments cannot be rejected) at 0.784, which is still far from unity.
20We use the user-written Stata command xtlsdvc, which does not have a built-in option for clusteringstandard errors.
21The investment rate in peak-load electricity generation capacity over the most recent sample yearsis as follows: 2014 = -2.52%, 2015 = -2.08%, 2016 = -2.47%.
18

Table 2: E�ect of RES generation share on investment in peak-load capacity
(1) (2) (3) (4)OLS-FE OLS-FE LSDVC(AB) GMM-Di�(1 lag)Ipeak Ipeak Ipeak Ipeak
Ipeak,t-1 -0.0475 -0.0817** -0.0040 -0.0007(0.0343) (0.0348) (0.0560) (0.0389)
RESGenShare -0.5186** -0.5237* -0.4845** -0.4716***(0.1844) (0.2463) (0.2197) (0.1746)
OverCapt-1 -0.3781** -0.3487** -0.3684** -0.4083***(0.1361) (0.1449) (0.1631) (0.1334)
GDPpc 0.0876 0.3026 0.0817 -0.0368(0.2823) (0.2512) (0.2429) (0.3360)
Pgas -1.4161*** -1.4037*** -1.1971***(0.4057) (0.4237) (0.4282)
Peex 0.1156** 0.1085** 0.0970**(0.0420) (0.0497) (0.0441)
T -0.1396 -0.1745 -0.0422(0.2137) (0.3340) (0.2229)
Country FE Yes Yes Yes YesYear FE No Yes No NoObs. 182 182 182 168R2 0.294 0.347 NA NA
Notes: ∗∗∗p < 1%, ∗∗p < 5%, ∗p < 10%. OLS-FE & GMM: Robust standard errorsclustered at the country level in parentheses. LSDVC: standard errors in parentheses.Speci�cation (2): LSDVC uses the Arellano�Bond (AB) consistent estimator to initializebias correction; standard errors are based on 1000 parametric bootstrap iterations withbias correction up to O(1/T). Speci�cation (3): One-step di�erence GMM is applied. Theestimation is in �rst di�erences and thus corresponds to the inclusion of country �xede�ects. A limit of 1 lag and an orthogonality condition is imposed to keep the number ofinstruments low. Hansen J-stat. p-value = 0.784. Arellano-Bond test for AR(1): p-val. =0.004 & AR(2): p-val. = 0.650.
exhausted; biomass and biogas have still not reached technological maturity and only
make up a negligible fraction of the energy mix � we expect further massive deployment
of intermittent RES in Europe.
Our econometric �nding is consistent with Traber and Kemfert (2011), who show in
a computational model that an increase in RES production (in their case only wind but
not solar) leads to lower incentives to invest in thermal and especially gas-�red power
plants. Once �exible thermal generation capacity becomes su�ciently scarce, the bal-
ancing of �uctuations in the electricity supply or demand becomes particularly di�cult.
Furthermore, the supply of electricity becomes even more volatile and unpredictable with
an increasing deployment of intermittent RES. Without countervailing measures (see a
19
discussion in Section 6) the signi�cantly negative response of investment in peak-load
capacity to RES deployment may pose a threat on the electricity supply security in the
long run.
The estimates are surprisingly robust across speci�cations: LSDVC and GMM-Di�,
which we apply to correct for potential bias from the inclusion of a lagged dependent
variable on the parameter estimates of the other variables, are particularly alike. OLS with
�xed e�ects delivers similar results to the bias-corrected LSDVC estimator and di�erence
GMM. However, we �nd that OLE-FE produces slightly more pronounced estimates of
the variable of interest, RESGenShare, which may indicate modest bias. Nonetheless, the
parameter estimates are statistically not di�erent from each other, so statistically we
cannot con�rm dynamic panel bias in our regressions.22 This may be explained by the
fact that the coe�cient of the lagged dependent variable is close to zero and statistically
insigni�cant (so path dependency and the bias that comes with it are negligible) but
also that the bias is likely to vanish in panels covering a relatively large number of years
(Arellano, 2003, p. 86). LSDVC is based on the Arellano-Bond (AB) estimator to initialize
bias correction. To provide evidence that the results are not subject to this choice,
speci�cations 1 and 2 of Table A4 in the Appendix gives the estimates of LSDVC based
on the Anderson-Hsiao (AH) method as well as on the Blundell-Bond (BB) method.
Regarding GMM, we apply the one-step di�erence GMM estimator, for which we
restrict the instrumentalization of the lagged dependent variable to one lag (see also
footnote 19) to avoid issues created by too many instruments. The p-value of 0.784 of the
Hansen J-statistic suggests that the instruments are valid (i.e. the H0 of valid instruments
cannot be rejected). To provide robustness, speci�cation 3 of Table A4 in the Appendix
presents GMM-Di� estimates where we relax the restriction to 2 lags. Although the GMM
results are fully robust, yet the p-value of the Hansen J-statistic becomes 1.00, which may
indicate too many instruments (Roodman, 2009).
We now turn to the estimates of the control variables by looking at the LSDVC
regression output. Over-capacity is negative and statistically signi�cant suggesting that
a higher share of excess capacity in the system is associated with less investment in peak-
load generation capacity. An increase in the over-capacity by 10 percentage points leads
to a drop in the peak-load investment rate by 3.68 percentage points. Indeed, it turns out
that it is crucial to control for excess capacity because otherwise we would overestimate the
e�ect of RESGenShare. Appendix Table A5 yields an estimated coe�cient of RESGenShare
of -0.732 by omitting OverCap.
22We evaluate the di�erence between the estimated coe�cients of RESGenShare from speci�ca-
tions 1 (β̂1) and 3 (β̂3) based on a z-value: z = (β̂1 − β̂3)/
√SE(β̂1)2 − SE(β̂3)2 = (−0.5186 +
0.4845)/√0.18442 + 0.21972 = −0.0002. The critical value for the 90% signi�cance value is -1.96, so
we cannot reject the H0 of equal coe�cients.
20
In line with expectations we �nd statistically signi�cant e�ects of the price of gas and
the wholesale price of electricity on the investment rate in peak-load electricity genera-
tion capacity. A higher factor price of natural gas (Pgas) attenuates the pro�tability of
investments and thus hampers investment activity. In contrast, a higher wholesale price
of electricity (Peex) triggers investment for the opposite reason (see also Gross et al.,
2010). The e�ect of GDP per capita is positive � a higher level of income is associated
with deeper investment activity in peak-load capacity � but turns out to be statistically
insigni�cant. The time trend, which captures unobserved e�ects, such as technological
change, is also statistically insigni�cant.
As discussed earlier, the signi�cantly negative impact of electricity production from
intermittent RES on investment in peak -load plants con�rms our initial suspicion. How-
ever, we expect the impact on investment in base-load technologies to be less pronounced,
for the reason that not only the merit-order e�ect (i.e. the reduction of the electricity
price due to an increase in the RES production), but also a lower capacity utilization rate,
and a decrease in the peak/o�-peak price spread from higher RES feed-in all unfold in
the steep part of the supply curve, where peak-load plants are located. Indeed, the e�ect
of RES on investment in base-load technologies is negative but statistically insigni�cant,
as the regression estimates of speci�cations 1 and 2 of Table A3 in the Appendix show.23
Since in this study, we group hydro, nuclear, geothermal, waste, and coal genera-
tion sources in the base-load category, one may suspect that coal in particular exhibits
some peak-load characteristics, as it is located at the beginning of the steep part of the
merit-order curve. However, speci�cations 3 and 4 of Table A3 still yield statistically
insigni�cant coe�cient estimates for the RES generation share when speci�cally investi-
gating its impact on investment in coal-�red plants. Our �nding that peak-load rather
than base-load capacity is vulnerable to the deployment of intermittent renewables is also
emphasized by Graf and Marcantonini (2017) who �nd that emission factors of peak-
load (but not of base-load) plants react to the intermittency of RES feed-in through an
increasing ramping activity.24
5.2 Distinction between wind and solar
So far, we have been interested in the overall e�ect of intermittent RES on investment
in peak-load electricity generation capacity. We now disentangle the individual e�ects of
wind and solar generation by replacing RES in equation (1) with the generation shares
23 The regressions for the investment rate in base-load capacity include the spot price of gas for thesake of comparability with the regressions on peak-load investment, whereas the spot price of coal maybe more adequate. When we include the spot price of coal instead, the results stay robust.
24Ramping refers to the adjustment of thermal plants' electricity generation to balance demand andsupply deviations (e.g. through unpredictable generation �uctuations of wind and solar plants), whichhas negative e�ects on their emission factors.
21

of wind (WIND) and solar (SOLAR):
Ii,t = αIi,t−1 + β1WINDi,t + β2SOLARi,t +X ′i,tγ +X ′tδ + ζT + υi + εi,t. (2)
Table 3 presents the regression output of equation (2) by OLS-FE (speci�cation 1)
and LSDVC (speci�cation 2). Both speci�cations yield comparable estimates. They show
clearly that, while the generation share of wind has a negative and statistically signi�cant
in�uence on investment in peak-load power plants, the e�ect of solar power is rendered
statistically insigni�cant. It seems that the overall modest generation output of solar
power of 2,989 GWh and its low generation share of 1.10% on average (see Table 1) have
not yet resulted in a reaction in the peak-load investment activity.
In contrast to solar power, wind power already has a signi�cant share in the overall
electricity mix of 5.6% and a feed-in of 10,800 GWh, on average. As wind power increases
its share, this brings about a signi�cant drop in peak-load investment. An increase in the
wind feed-in share of 10 percentage points leads to a fall in the investment rate of peak-
load plants by 5.61 percentage points. Analogously to the calculations made in Section
5.1, we can assess the impact of a further deployment of wind power for the near future
assuming a similar development to the past 5 sample years. The share of wind power rose
from 6.92% in 2012 to 9.85% in 2016, which corresponds to an increase of 2.93 percentage
points. Given the estimated elasticity of -0.561 of WIND, we expect the investment rate
in peak-load generation capacity to fall by 1.64 percentage points (= 2.93 percentage
points × 0.561). Evaluated at the investment rate in peak-load generation capacity of
-2.47% as of the last sample year 2016, the expected peak-load investment rate for the
near future is -4.11%, driven solely by the deployment of wind energy.
These �ndings are comparable to Lu¬á£ková et al. (2017) and Mulder and Scholtens
(2013). Lu¬á£ková et al. (2017) �nd no evidence for a merit-oder e�ect of solar power
on the Czech wholesale electricity prices but indeed for wind and hydro power. The
authors explain that the few sunshine hours per year in the Czech Republic, during which
solar power shifts the merit order, are not enough to result in a (statistically) signi�cant
merit order e�ect. Mulder and Scholtens (2013) �nd that wind power in Germany has
a decremental e�ect on the Dutch wholesale prices (given the strong interconnection
between the two electricity markets), whereas no such e�ect is found for solar power. For
Italy, a Mediterranean country with more favorable sunshine conditions, Clo et al. (2015)
�nd that the merit order e�ect of solar power is only half as pronounced as of wind power.
From this perspective, it is hardly surprising that our study does not �nd a decremental
e�ect of solar power on investment in conventional electricity generation capacity.25
25In our sample, only four out of 14 countries can be characterized by favorable sunshine conditions(Greece, Italy, Portugal, Spain).
22
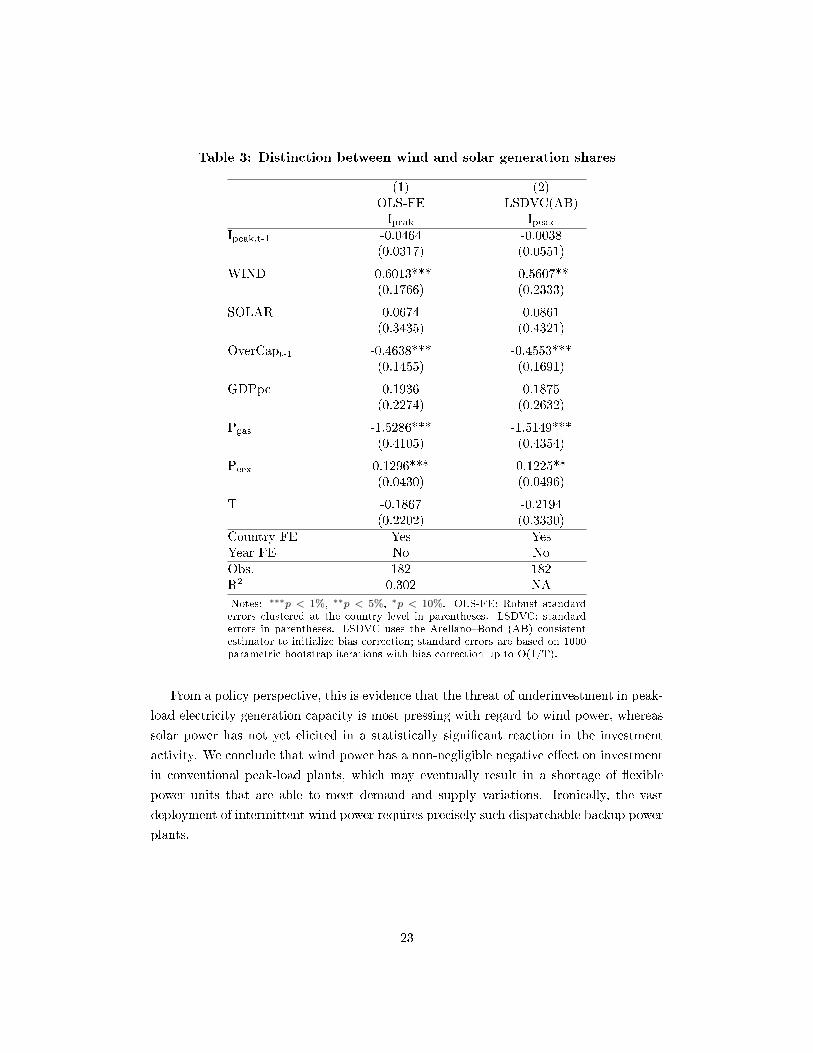
Table 3: Distinction between wind and solar generation shares
(1) (2)OLS-FE LSDVC(AB)Ipeak Ipeak
Ipeak,t-1 -0.0464 -0.0038(0.0317) (0.0551)
WIND -0.6013*** -0.5607**(0.1766) (0.2333)
SOLAR 0.0674 0.0861(0.3435) (0.4321)
OverCapt-1 -0.4638*** -0.4553***(0.1455) (0.1691)
GDPpc 0.1936 0.1875(0.2274) (0.2632)
Pgas -1.5286*** -1.5149***(0.4105) (0.4354)
Peex 0.1296*** 0.1225**(0.0430) (0.0496)
T -0.1867 -0.2194(0.2202) (0.3330)
Country FE Yes YesYear FE No NoObs. 182 182R2 0.302 NA
Notes: ∗∗∗p < 1%, ∗∗p < 5%, ∗p < 10%. OLS-FE: Robust standarderrors clustered at the country level in parentheses. LSDVC: standarderrors in parentheses. LSDVC uses the Arellano�Bond (AB) consistentestimator to initialize bias correction; standard errors are based on 1000parametric bootstrap iterations with bias correction up to O(1/T).
From a policy perspective, this is evidence that the threat of underinvestment in peak-
load electricity generation capacity is most pressing with regard to wind power, whereas
solar power has not yet elicited in a statistically signi�cant reaction in the investment
activity. We conclude that wind power has a non-negligible negative e�ect on investment
in conventional peak-load plants, which may eventually result in a shortage of �exible
power units that are able to meet demand and supply variations. Ironically, the vast
deployment of intermittent wind power requires precisely such dispatchable backup power
plants.
23
5.3 Alternative speci�cation: direct unit e�ects
As a robustness speci�cation, we run a similar model as in equation (1), where we estimate
the impact of RES feed-in in GWh (instead of the percentage share in total generation)
on the peak-load capacity in MW (instead of the percentage share in total capacity):
Kpeak,i,t = αKpeak,i,t−1 + βGres,i,t +X ′i,tγ +X ′tδ + ζT + υi + εi,t, (3)
This model, thus, allows for a more direct interpretation of the e�ect of interest in
terms of unit changes. β tells by how many MW the peak-load capacity (Kpeak) changes
in reaction to an increase in the generation of RES (Gres) by one GWh. What is more,
in an alternative speci�cation, we replace Gres by the wind feed-in, Gwind.
Table 4 presents the estimates of both the e�ects of RES generation as well as the
e�ects of wind generation on peak-load capacity. Again, OLS-FE and LSDVC lead to
similar results, suggesting that the dynamic panel bias is not an issue. The LSDVC
estimator in speci�cation 2 shows that an increase in the generation of renewables by one
GWh reduces the peak-load generation capacity by 0.019 MW. Moreover, speci�cation 4
shows that the e�ect of an increase in the wind generation by one GWh is associated with
a peak-load capacity reduction of the magnitude of 0.027 MW. These e�ects are to be
interpreted along the lines of Section 5.1. Over the last �ve sample years, RES generation
rose by 8,306 GWh (i.e. from 18,004 GWh in 2002 to 26,310 GWh in 2016). Assuming a
similar trend in the near future, peak-load capacity is expected to decline by 157.8 MW
(= 8,306 GWh × 0.019), which accords to a drop of 1% of the sample mean peak-load
generation capacity of 15,562 MW in 2016. Regarding wind, the last �ve sample years
experienced an increase in the feed-in by 5,642 GWh (i.e. from 13,168 GWh in 2012 to
18,811 GWh in 2016), which leads to a predicted decline in the peak-load capacity by 152
MW (= 5,642 MW × 0.027), a similar e�ect as with total RES (i.e. combined wind and
solar power).
24
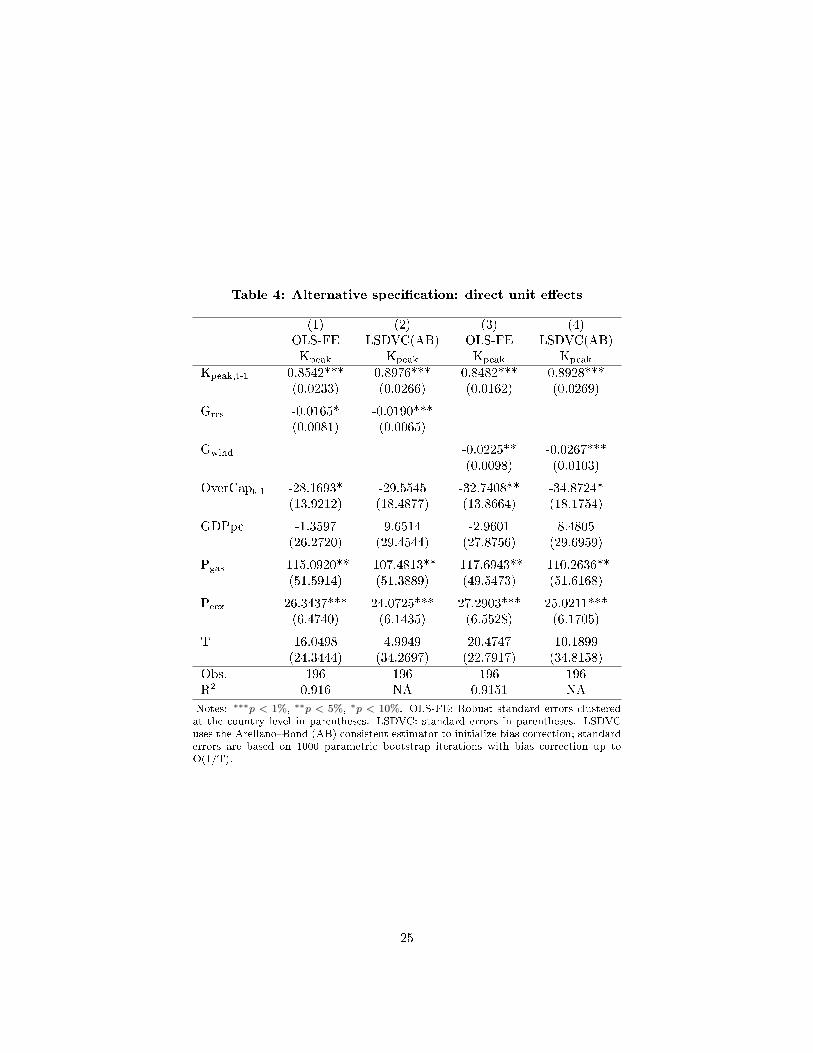
Table 4: Alternative speci�cation: direct unit e�ects
(1) (2) (3) (4)OLS-FE LSDVC(AB) OLS-FE LSDVC(AB)Kpeak Kpeak Kpeak Kpeak
Kpeak,t-1 0.8542*** 0.8976*** 0.8482*** 0.8928***(0.0233) (0.0266) (0.0162) (0.0269)
Gres -0.0165* -0.0190***(0.0081) (0.0065)
Gwind -0.0225** -0.0267***(0.0098) (0.0103)
OverCapt-1 -28.1693* -29.5545 -32.7408** -34.8724*(13.9212) (18.4877) (13.8664) (18.1754)
GDPpc -1.3597 9.6514 -2.9601 8.4805(26.2720) (29.4544) (27.8756) (29.6959)
Pgas -115.0920** -107.4813** -117.6943** -110.2636**(51.5914) (51.3889) (49.5473) (51.6168)
Peex 26.3437*** 24.0725*** 27.2903*** 25.0211***(6.4740) (6.1435) (6.5528) (6.1705)
T 16.0498 4.9949 20.4747 10.1899(24.3444) (34.2697) (22.7917) (34.8158)
Obs. 196 196 196 196R2 0.916 NA 0.9151 NA
Notes: ∗∗∗p < 1%, ∗∗p < 5%, ∗p < 10%. OLS-FE: Robust standard errors clusteredat the country level in parentheses. LSDVC: standard errors in parentheses. LSDVCuses the Arellano�Bond (AB) consistent estimator to initialize bias correction; standarderrors are based on 1000 parametric bootstrap iterations with bias correction up toO(1/T).
25
6 Conclusion
In an electricity system where the real-time balance between supply and demand is a
prerequisite for system stability, large shares of intermittent renewable energy production
pose considerable challenges for grid operators. Many studies have warned that the
current state of European electricity markets, characterized by a massive subsidization
of �uctuating wind and solar power, distorts price signals for su�cient investment in
conventional back-up electricity generating capacity. Along with other adverse e�ects of
RES, this may pose a threat to resource adequacy in the long-run.
Intermittent RES create several distortions, which may deter investment in conven-
tional power plants, such as a decreasing wholesale price (i.e. the merit order e�ect),
lower operating hours of peak-load plants as they get pushed out of the merit order when
RES feed in, and a dampened peak/o�-peak price spread, which renders thermal plants
with high marginal costs unpro�table. However, the very intermittency of RES creates
the need for �exible backup units, such as gas-�red power plants, to support the system.
Dispatchable weather-independent power plants are especially important during times of
high electricity demand when there is no wind or sunshine. Underinvestment in conven-
tional electricity generating capacity may endanger the supply security of electricity and
thus increase the risk of a blackout.
Although the idea that RES distort investment incentives is well-established, sound
economic studies on this subject are scarce. For this reason, we put the potentially nega-
tive e�ect of the deployment of intermittent RES on investment in �exible thermal power
capacity to empirical scrutiny by estimating a dynamic investment model. We �nd a
non-negligible impact, pointing to signi�cant disinvestments in peak-load capacity in the
foreseeable future. Besides other important control variables, such as factor and whole-
sale energy prices, we emphasize the need to control for over-capacity, as otherwise the
negative e�ect of RES on the investment rate in peak-load capacity would be overstated.
To circumvent the potential estimation bias in dynamic models (i.e. the inclusion of
a lagged dependent variable) that may arise with �xed-e�ects OLS, we also apply the
bias-corrected LSDVC estimator as well as di�erence GMM. Both approaches provide
consistent estimates. Moreover, we subject our regression results to robustness tests by
employing alternative estimators and model speci�cations.
While investment in peak-load capacity is signi�cantly deterred by volatile RES, we
provide evidence that base-load, and especially coal-�red generation capacity, which is
located in the rather �at part of the merit order curve, is not a�ected by RES feed-in.
Moreover, we show that most of the threat of intermittent RES on the long-run supply
security stems from wind power, whereas the relatively low feed-in from solar power
during our sample period 2002�2016 appears not to have caused a statistically signi�cant
26

reaction.
Given the targets of the European Union to foster investment in wind and solar power
at least until 2030, our results ought to raise concerns about the long-run viability of the
electricity system. Assuming a similar deployment of RES as over the last �ve sample
years, we predict a negative annual investment rate of the magnitude of -4.53% for the
near future. This rate implies tremendous disinvestment in conventional thermal plant
capacity of around 20% within only 5 years.
Policy-makers should be aware of the alarming threat of underinvestment. State
intervention targeted at incentivizing investment in conventional back-up capacity (e.g.
through capacity markets) or simply direct state aid (e.g. in the form of investment
and feed-in subsidies for gas-�red plants), as well as a redesign of current European
electricity markets, may be inevitable to guarantee the reliability of electricity supply.
With further deployment of RES, electricity storage and transmission may become more
cost e�ective. Both are needed to relief the system by mitigating renewables' uncertain
generation volatility.
27
References
Anderson, T., Hsiao, C., 1982. Formulation and estimation of dynamic models using paneldata. Journal of Econometrics 18, 47�82.
Arellano, M., 2003. Panel Data Econometrics. Oxford University Press.
Arellano, M., Bond, S., 1991. Some tests of speci�cation for panel data: Monte carloevidence and an application to employment equations. The Review of Economic Studies58 (2), 277�297.
Arellano, M., Bover, O., 1995. Another look at the instrumental variable estimation oferror-components models. Journal of Econometrics 68, 29�51.
Banja, M., Jegard, M., 2017. Renewable technologies in the EU electricity sector: Trendsand projections � Analysis in the framework of the EU 2030 climate and energy strategy.JRC Science for Policy Report EUR 28897 EN for the European Commission.
Bloomberg, 2018. Global trends in renewable energy investment 2018. Bloomberg NewEnergy Finance; Frankfurt School-UNEP Centre/BNEF.
Brown, D. P., 2018. Capacity payment mechanisms and investment incentives in restruc-tured electricity markets. Energy Economics 74, 131�142.
Bruno, Giovanni, S., 2005a. Approximating the bias of the lsdv estimator for dynamicunbalanced panel data models. Economics Letters 87, 361�366.
Bruno, Giovanni, S., 2005b. Estimation and inference in dynamic unbalanced panel-datamodels with a small number of individuals. The Stata Journal 5 (4), 473�500.
Bun, Maurice, J., Kiviet, Jan, F., 2003. On the diminishing returns of higher-order termsin asymptotic expansions of bias. Economics Letters 79, 145�152.
Bushnell, J., Novan, K., 2018. Setting with the sun: The impacts of renewable energy onwholesale power markets. National Bureau of Economic Research (NBER), WorkingPaper24980.
Cambini, C., Rondi, L., 2010. Incentive regulation and investment: Evidence from Euro-pean energy utilities. Journal of Regulatory Economics 38, 1�26.
Clo, S., Cataldi, A., Zoppoli, P., 2015. The merit-order e�ect in the Italian power market:The impact of solar and wind generation on national wholesale electricity prices. EnergyPolicy 77, 79�88.
Cludius, J., Hermann, H., Matthes, F. C., Graichen, V., 2014. The merit order e�ect ofwind and photovoltaic electricity generation in Germany 2008�2016: Estimation anddistributional implications. Energy Economics 44, 302�313.
Cramton, P., Ockenfels, A., 2012. Economics and design of capacity markets for the powersector. Zeitschrift für Energiewirtschaft 36 (2), 113�134.
Creti, A., Fabra, N., 2007. Supply security and short-run capacity markets for electricity.Energy Economics 29 (2), 259�276.
28
De Vos, K., 2015. Negative wholesale electricity prices in the German, French and Belgianday-ahead, intra-day and real-time markets. The Electricity Journal 28 (4), 36�50.
Dijkgraaf, E., van Dorp, T. P., Maasland, E., 2018. On the e�ectiveness of feed-in tari�sin the development of solar photovoltaics. Energy Journal 39 (1), 81�99.
EC, 2017. EU energy in �gures. European Commission, Statistical Pocketbook.
Erbach, G., 2017. Capacity mechanisms for electricity. European Parliament ResearchService (EPRS): Brie�ng, PE 603.949.
EurObserv'ER, 2018. Wind energy barometer 2018.
Gelabert, L., Labandeira, X., Linares, P., 2011. An ex-post analysis of the e�ect of re-newables and cogeneration on Spanish electricity prices. Energy Economics 33, 59�65.
Genc, T. S., Thille, H., 2011. Investment in electricity markets with asymmetric tech-nologies. Energy Economics 33 (3), 379�387.
Gil, H., Gomez-Quiles, C., Riquelme, J., 2012. Large-scale wind power integration andwholesale electricity trading bene�ts: Estimation via an ex post approach. EnergyPolicy 41, 849�859.
Graf, C., Marcantonini, C., 2017. Renewable energy and its impact on thermal generation.Energy Economics 66, 421�430.
Green, R., Vasilakos, N., 2011. The long-term impact of wind power on electricity pricesand generating capacity. In: 2011 IEEE Power and Energy Society General Meeting(Proceedings).
Gross, R., Blyth, W., Heptonstall, P., 2010. Risks, revenues and investment in electricitygeneration: Why policy needs to look beyond costs. Energy Economics 32 (4), 796�804.
Grossi, L., Heim, S., Waterson, M., 2017. The impact of the German response to theFukushima earthquake. The Energy Journal 66, 450�465.
Gugler, K., Haxhimusa, A., Liebensteiner, M., 2018. Integration of European electricitymarkets: Evidence from spot prices. Energy Journal 39 (SI2), 41�66.
Gugler, K., Haxhimusa, A., Liebensteiner, M., Schindler, N., 2016. Investment underuncertainty in electricity generation. Department of Economics Working Papers No.234, Vienna University of Economics and Business.
Gugler, K., Rammerstorfer, M., Schmitt, S., 2013. Ownership unbundling and investmentin electricity markets: A cross country study. Energy Economics 40, 702�713.
Hildmann, M., Ulbig, A., Andersson, G., 2015. Empirical analysis of the merit-ordere�ect and the missing money problem in power markets with high RES shares. IEEETransactions on Power Systems 30 (3), 1560�1570.
Hirth, L., 2013. The market value of variable renewables. The e�ect of solar wind powervariability on their relative price. Energy Economics 38, 218�236.
29
Hogan, M., 2017. Follow the missing money: Ensuring reliability at least cost to consumersin the transition to a low-carbon power system. The Electricity Journal 30 (1), 55�61.
IEA, 2012. Challenges in electricity: A focus on Europe. International Energy Agency(IEA).
IEA, 2017. World energy outlook 2017. International Energy Agency (IEA) Publications.
Jenner, S., Groba, F., Indvik, J., 2013. Assessing the strength and e�ectiveness of renew-able electricity feed-in tari�s in european union countries. Energy Policy 52, 385�401.
Joskow, P., 2007. Competitive electricity markets and investment in new generating ca-pacity. In: Helm, D. (Ed.), The New Energy Paradigm. Oxford University Press.
Joskow, P., 2008. Capacity payments in imperfect electricity markets: Need and design.Utilities Policy 16 (3), 159�170.
Joskow, P., Tirole, J., 2007. Reliability and competitive electricity markets. RAND Jour-nal of Economics 38 (1), 60�84.
Judson, Ruth, A., Owen, Ann, L., 1999. Estimating dynamic panel data models: A guidefor macroeconomists. Economics Letters 65, 9�15.
Ketterer, J. C., 2014. The impact of wind power generation on the electricity price inGermany. Energy Economics 44, 270�280.
Kiviet, Jan, F., 1995. On bias, inconsistency, and e�ciency of various estimators in dy-namic panel data models. Journal of Econometrics 68, 53�78.
Kiviet, J. F., 1999. Analysis of panels and limited dependent variable models. In: Hsiao,C., Lahiri, K., Lee, L.-F., Pesaran, M. (Eds.), Analysis of Panels and Limited Depen-dent Variable Models. Cambridge University Press, Cambridge, pp. 199�225.
Lu¬á£ková, P., Pr·²a, J., Janda, K., 2017. The merit order e�ect of czech photovoltaicplants. Energy Policy 106, 138�147.
Mints, P., 2012. The history and future of incentives and the photovoltaic industry andhow demand is driven. Progress in Photovoltaics: Research and Applications 20 (6),711�716.
Moiseeva, E., Wogrin, S., Hesamzadeh, M. R., 2017. Generation �exibility in ramp rates:Strategic behavior and lessons for electricity market design. European Journal of Op-erational Research 261 (2), 755�771.
Moosavian, S., Rahim, N., Selvaraj, J., Solangi, K., 2013. Energy policy to promotephotovoltaic generation. Renewable and Sustainable Energy Reviews 25, 44�58.
Mulder, M., Scholtens, B., 2013. The impact of renewable energy on electricity prices inthe Netherlands. Renewable Energy 57, 94�100.
Nickell, S., 1981. Biases in dynamic models with �xed e�ects. Econometrica 49 (6), 1417�1426.
30

Praktiknjo, A., Erdmann, G., 2016. Renewable electricity and backup capacities: An(un-) resolvable problem? The Energy Journal 37 (SI2), 89�106.
Roodman, D., 2009. How to do xtabond2: An introduction to di�erence and system GMMin Stata. The Stata Journal 9 (1), 86�136.
SolarPower Europe, 2018. Global market outlook for solar power 2018�2022.
Steggals, W., Gross, R., Heptonstall, P., 2011. Winds of change: How high wind pen-etrations will a�ect investment incentives in the GB electricity sector. Energy Policy39 (3), 1389�1396.
Traber, T., Kemfert, C., 2011. Gone with the wind? Electricity market prices and in-centives to invest in thermal power plants under increased wind energy supply. EnergyEconomics 33 (2), 249�256.
Welisch, M., Ortner, A., Resch, G., 2016. Assessment of RES technology market valuesand the merit-order e�ect � an econometric multi-country analysis. Energy & Environ-ment 27 (1), 105�121.
Winkler, J., Gaio, A., P�uger, B., Ragwitz, M., 2016. Impact of renewables on electricitymarkets: Do support schemes matter? Energy Policy 93, 157�167.
Wozabal, D., Graf, C., Hirschmann, D., 2016. The e�ect of intermittent renewables onthe electricity price variance. OR Spectrum 38 (3), 687�709.
Würzburg, K., Labandeira, X., Linares, P., 2013. Renewable generation and electricityprices: Taking stock and new evidence for Germany and Austria. Energy Economics40, 159�171.
31
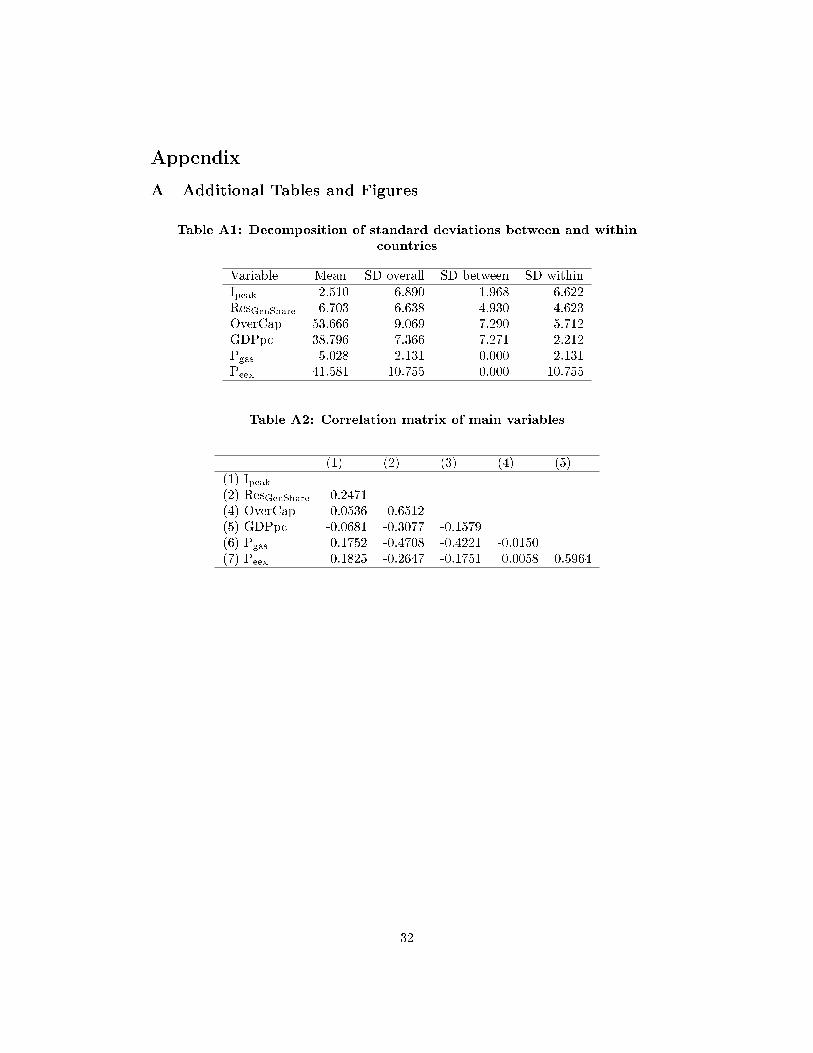
Appendix
A Additional Tables and Figures
Table A1: Decomposition of standard deviations between and withincountries
Variable Mean SD overall SD between SD withinIpeak 2.510 6.890 1.968 6.622ResGenShare 6.703 6.638 4.930 4.623OverCap 53.666 9.069 7.290 5.712GDPpc 38.796 7.366 7.271 2.212Pgas 5.028 2.131 0.000 2.131Peex 41.581 10.755 0.000 10.755
Table A2: Correlation matrix of main variables
(1) (2) (3) (4) (5)(1) Ipeak(2) ResGenShare -0.2471(4) OverCap -0.0536 0.6512(5) GDPpc -0.0681 -0.3077 -0.1579(6) Pgas 0.1752 -0.4708 -0.4221 -0.0150(7) Peex 0.1825 -0.2647 -0.1751 0.0058 0.5964
32
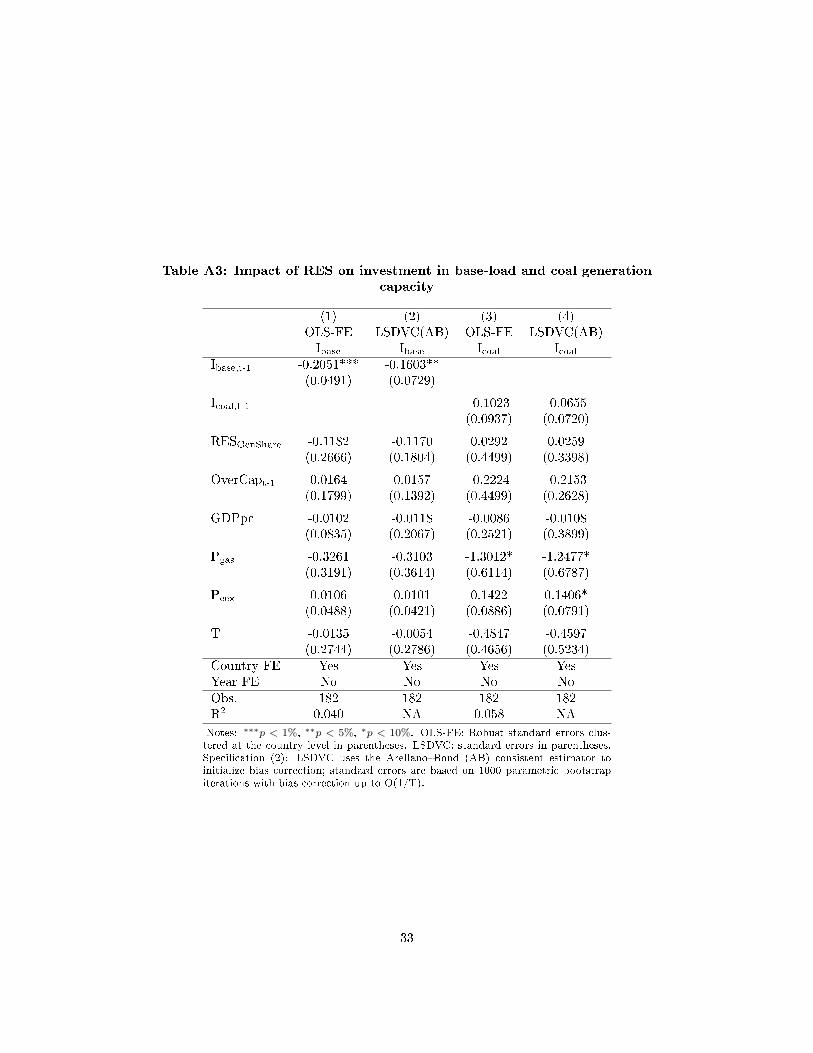
Table A3: Impact of RES on investment in base-load and coal generationcapacity
(1) (2) (3) (4)OLS-FE LSDVC(AB) OLS-FE LSDVC(AB)Ibase Ibase Icoal Icoal
Ibase,t-1 -0.2051*** -0.1603**(0.0491) (0.0729)
Icoal,t-1 -0.1023 -0.0655(0.0937) (0.0720)
RESGenShare -0.1182 -0.1170 0.0292 0.0259(0.2666) (0.1804) (0.4499) (0.3398)
OverCapt-1 0.0164 0.0157 -0.2224 -0.2153(0.1799) (0.1392) (0.4499) (0.2628)
GDPpc -0.0102 -0.0118 -0.0086 -0.0108(0.0835) (0.2067) (0.2521) (0.3899)
Pgas -0.3261 -0.3103 -1.3012* -1.2477*(0.3191) (0.3614) (0.6114) (0.6787)
Peex 0.0106 0.0101 0.1422 0.1406*(0.0488) (0.0421) (0.0886) (0.0791)
T -0.0135 -0.0054 -0.4847 -0.4597(0.2744) (0.2786) (0.4656) (0.5234)
Country FE Yes Yes Yes YesYear FE No No No NoObs. 182 182 182 182R2 0.040 NA 0.058 NA
Notes: ∗∗∗p < 1%, ∗∗p < 5%, ∗p < 10%. OLS-FE: Robust standard errors clus-tered at the country level in parentheses. LSDVC: standard errors in parentheses.Speci�cation (2): LSDVC uses the Arellano�Bond (AB) consistent estimator toinitialize bias correction; standard errors are based on 1000 parametric bootstrapiterations with bias correction up to O(1/T).
33
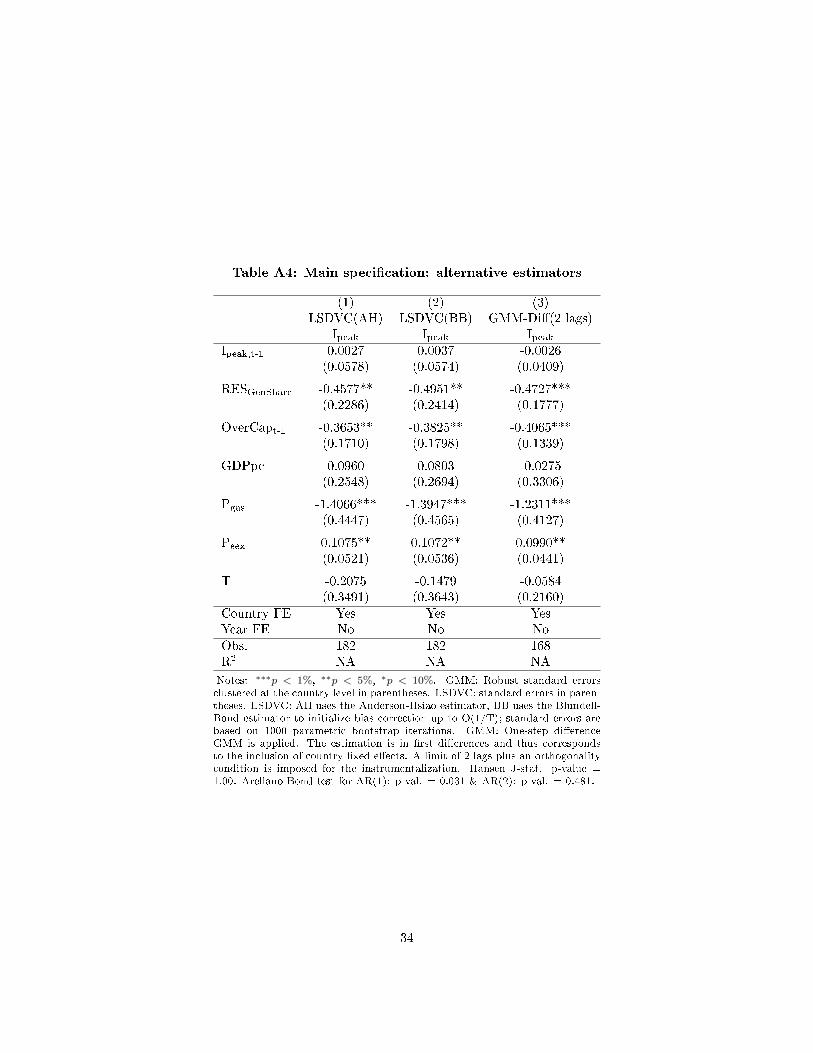
Table A4: Main speci�cation: alternative estimators
(1) (2) (3)LSDVC(AH) LSDVC(BB) GMM-Di�(2 lags)
Ipeak Ipeak IpeakIpeak,t-1 0.0027 0.0037 -0.0026
(0.0578) (0.0574) (0.0409)
RESGenShare -0.4577** -0.4951** -0.4727***(0.2286) (0.2414) (0.1777)
OverCapt-1 -0.3653** -0.3825** -0.4065***(0.1710) (0.1798) (0.1339)
GDPpc 0.0960 0.0803 -0.0275(0.2548) (0.2694) (0.3306)
Pgas -1.4066*** -1.3947*** -1.2311***(0.4447) (0.4565) (0.4127)
Peex 0.1075** 0.1072** 0.0990**(0.0521) (0.0536) (0.0441)
T -0.2075 -0.1479 -0.0584(0.3491) (0.3643) (0.2160)
Country FE Yes Yes YesYear FE No No NoObs. 182 182 168R2 NA NA NA
Notes: ∗∗∗p < 1%, ∗∗p < 5%, ∗p < 10%. GMM: Robust standard errorsclustered at the country level in parentheses. LSDVC: standard errors in paren-theses. LSDVC: AH uses the Anderson-Hsiao estimator, BB uses the Blundell-Bond estimator to initialize bias correction up to O(1/T); standard errors arebased on 1000 parametric bootstrap iterations. GMM: One-step di�erenceGMM is applied. The estimation is in �rst di�erences and thus correspondsto the inclusion of country �xed e�ects. A limit of 2 lags plus an orthogonalitycondition is imposed for the instrumentalization. Hansen J-stat. p-value =1.00. Arellano-Bond test for AR(1): p-val. = 0.031 & AR(2): p-val. = 0.481.
34
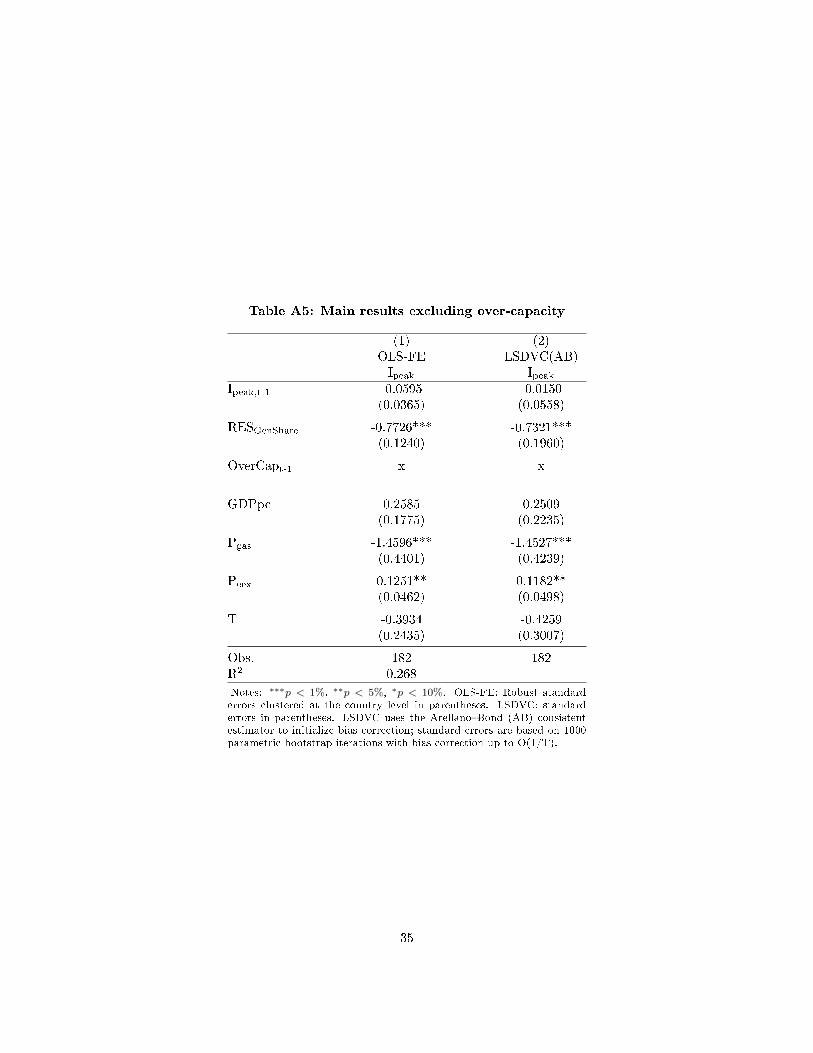
Table A5: Main results excluding over-capacity
(1) (2)OLS-FE LSDVC(AB)Ipeak Ipeak
Ipeak,t-1 -0.0595 -0.0150(0.0365) (0.0558)
RESGenShare -0.7726*** -0.7321***(0.1240) (0.1960)
OverCapt-1 x x
GDPpc 0.2585 0.2509(0.1775) (0.2235)
Pgas -1.4596*** -1.4527***(0.4401) (0.4239)
Peex 0.1251** 0.1182**(0.0462) (0.0498)
T -0.3934 -0.4259(0.2435) (0.3007)
Obs. 182 182R2 0.268
Notes: ∗∗∗p < 1%, ∗∗p < 5%, ∗p < 10%. OLS-FE: Robust standarderrors clustered at the country level in parentheses. LSDVC: standarderrors in parentheses. LSDVC uses the Arellano�Bond (AB) consistentestimator to initialize bias correction; standard errors are based on 1000parametric bootstrap iterations with bias correction up to O(1/T).
35
Copyright © 2022 FDOKUMEN