Controlling posture using a plantar pressure-based, tongue-placed tactile biofeedback system
Upload
khangminh22Category
view
5download
0
SEATED WORKING POSTURE
A Research Thesis with Experimental Methodology and Literature Review
SUBMITTED BY:-
DAVID STANTON PATRICK NELSON for MASTERS DEGREE IN APPLIED SCIENCE 1990
This research thesis is submitted in partial satisfaction of the requirement for the Masters Degree in Applied Science, Ballarat University College, Mt Helen, Victoria
MELBOURNE, JUNE, 1990
PAGE I
SEATED WORKING POSTURE
CONTENTS PAGE NO.
i. CONTENTS i.
ii. ACKNOWLEDGEMENTS iii
iii. ABSTRACT iv.
1. INTRODUCTION 1
1.1 LITERATURE REVIEW 9
1.2 REVIEW OF STANDARDS AND GUIDELINES 62
1.3 DISCUSSION OF STANDARDS AND GUIDELINES 65
1.4 REASONS FOR RESEARCH 67
1.5 HYPOTHESIS 70
2. METHODOLOGY 71
3. RESULTS & DISCUSSION 80
4. CONCLUSIONS 114
5. BIBLIOGRAPHY 118
PAGE II
APPENDICES:-
PAGE NO,
APPENDIX A - Tabular Summaries of the Nine Categories of Postural Measurements, for each Experimental Group
Vlll
APPENDIX B - Histograms of the Nine Categories of Postural Measurements, for each Experimental Group.
IX
APPENDIX C - Scattergrams of the Nine Categories of Postural Measurements, for each Experimental Group.
APPENDIX D - Relationship Graphs Comparing the Three Lineal Measurements Against all Six Angular Measurements.
xi
APPENDIX E - Relationship Graphs comparing Subject Stature against Four Angular Measurements.
XII
APPENDIX F - Relationship Graphs comparing some Lineal Categories of Postural Measurements.
x m
APPENDIX G - Statistical summaries of t-distribution Within and Between Groups Measurements.
xiv
APPENDIX H - Histogram Summaries Within Each Group for Body Stature, Body Mass, Age, Sex and Nationality.
xv
APPENDIX I - Workplace Generated Proformas of Data Giving Individual Results for Nine Categories of Measurement.
xv 1

PAGE III
SEATED WORKING POSTURE
ACKNOWLEDGEMENTS
Support for this study was provided by the following organisations
Australia Post, Headquarters, Carlton South; Australian Postal and Telecommunications Union,
Federal Office, Carlton South; Ballarat University College - Victorian Institute of Occupational Health and Safety, Mt Helen;
Valuable assistance was also provided by:-
The Work Environment unit, Australia Post Headquarters; Mrs Lynne Roberts, Mathematics Department, B.U.C; Mr Pat Prendergast, Computer Programmer, "Comprend", South Hobart, Tasmania;
Mrs Kerri Duffner, Steno-Secretary, Work Environment Unit, Australia Post Headquarters;
The Librarian & Staff of the Library, B.U.C; The Librarian and staff of the Library, Australia Post Headquarters;
The Word Processing Unit, 2nd floor, 71 Rathdowne Street, Carlton South, Australia Post Headquarters.
The study was supervised by:-
Dr Dennis Else, Chairman, Victorian institute of Occupational Health and Safety, Ballarat University College.
I am grateful for the extensive advice offered by Dr Else during the course of his supervision of the research project.
The academic mentor for the study was:-
Dr Michael Barbour, Manager, Work Environment Unit, Australia Post, Headquarters. I am grateful for the personal time given by Dr Barbour to check and advise about content, clarity and quality of the data used in this study.
This study is dedicated to my immediate family; I give special thanks to my wife Teresa and children Christian, Bianca, Xavier and Bede for their consideration and for their support during the time consuming process of the investigation and the research.

PAGE IV SEATED WORKING POSTURE
ABSTRACT
Much has been written about seated working posture -
particularly in the late 19th and early 20th centuries, and
the furniture associated with achieving what is commonly
referred to as the "German Square" postural geometry (after
Mandal, 1974). The physical sciences aspects of chair, desk
and associated furniture ancillary to the task required of
the seated worker, have been described in the scientific
literature and the standards and guideline publications of
the authorities of many countries of the western world. The
most important contribution of multi-adjustable furniture to
the reduction of postural discomfort and musculo-skeletal
complaints is recognised. As a result a variety of
standards and guidelines concerning some of these aspects
exists in countries such as the United Kingdom, Canada,
United States of America, Germany, Australia and the
Scandinavian countries. The International Organisation
for Standardisation published document TC136/SC7 in 1978,
consolidating such existing standards.
Less emphasis has been placed on the interface of the
information exchange and the comfort, performance and
preferences of the seated worker; ie., the practically, the
comfort and the intrinsic safety of the working posture
prescribed by the model established by the many standards.
Existing specifications and guidelines differ in their
orientation towards operator performance and comfort of the
operator, in as much as some purport to be "furniture
standards", for example C.E.N, Comite European de
Normalisation, Paris, 1980, while others purport to be
"postural standards", for example, International
Organisation for Standardisation document TC 136/SC7 (1978).
The standards are uniform in matters of upright trunk and
90° upper and lower limb geometry, but are divided in the
lineal dimensions applied to eye height above the floor,
shoulder acromion to home row of keys (or pen-grip position
of the dominant hand and fingers), and eye distance to copy.
PAGE V SEATED WORKING POSTURE
The relationship between comfort and performance of seated
workers is not well understood and is likely to be complex.
Comfort and performance are not necessarily positively
correlated. The effect upon operator comfort and
performance of the "German Square" postural model and the
furniture advertised as "ergonomic" and multi-adjustable,
currently available has been cited by Mandal, 1974 and 1985.
Corlett (1981) warned that "we cannot afford to ignore
posture, ", whereas Leibowitz (1967) when discussing
the many variations in chair design remarked about seated
posture that "we have accustomed ourselves to habitual modes
of use that are literally disfiguring".
This paper examines the literature available on the related
topics of furniture design and seated posture. The paper
relates this information to the "postural" and "furniture"
standards of authorities, particularly the International
Organisation for Standardisation document TC 136/SC7
published in 1978. The conclusion is that such standards
are not based on adequate scientific investigation.
A methodology based on that used by Grandjean et al (1983)
has been adapted to measure the seated postural preferences
of ninety-four data-processor operators within Australia
Post. All operators within the two separate experimental
groups examined, had received uniform training in the
"German Square" seated posture technique prior to
commencement of work as a data processing operator within
Australia Post. Six separate geometric body angles were
observed and three separate linear dimensions were measured
for each subject at two and eight minutes durations after
the operator commenced work. The findings of the
experimental measuring show that none of the operators
adopted the "German Square" sitting posture and none of the
operators worked in a basically still posture over the
observation time.
PAGE VI SEATED WORKING POSTURE
The results indicate a reclined trunk seated working posture
with substantial degrees of freedom to move over periods of
concentrated working time, is preferred by most operators
within the experimental groups. All results show very
different seated working postures to those depicted in the
text book references and derived from that modelled by the
International Organisation for Standardisation (1978).
The conclusion of the study is that the results should have
a profound effect upon the training postural model known as
the "German Square", currently taught internationally to
seated workers, but the results also demonstrate that many
postural relationships of comfort and performance of seated
workers require further research.

PAGE 1 SEATED WORKING POSTURE
1. INTRODUCTION
Compared to primitive man living an outdoor life, civilised
man has become a "standing-around, and a sitting-down
animal, rather than a running-around one" (Drew, 1926).
Modern man is subjected to "an altered environment to which
the body adapts itself automatically" (Drew, 1926). Nearly
all modern man's activities encourage the forwards position
of the arms and head, with a tendency of gravity to pull the
body forwards and downwards (Zacharkow, 1988).
Cultures where other resting postures such as squatting or
kneeling predominate, like that of the native Bushman of the
Kalahari desert in Southern Africa (Weissner, 1978), also
show transition to the western sitting posture upon a chair
with simultaneous transition to industrialisation (Helbig,
1978). With the transition to industrialiation, there is
actually " a demand for static and sedentary modes of
living" (Barlow, 1946). As Bennett (1928) stated, "the most
universal physical occupation of civilised human beings is
sitting". In regards to school, Bennett (1928) stated that
"civilisation has imposed upon the child one of the most
distinctly sedentary occupations ever devised". It is in
the artifical environment of the school where the child's
postural habits will be formed for life (after Zacharkow,
1988).
Corlett (1981) warned that "we cannot afford to ignore
posture, primarily because to do so creates such wide spread
misery and secondarily because the costs, both the social
costs of unnecessary disease and direct cost in loss
productivity, are more than any modern industrial nation
should be prepared to pay".

PAGE 2 SEATED WORKING POSTURE
In regards to the chair, Aveling (1879) commented that "of
all the machines which civilisation has invented for the
torture of mankind, - there are few which perform there work
more pertinaciously, widely, or cruelly, than the chair. It
is difficult to account for the almost universal adoption,
at least in this country, (U.S.A), of such an unscientific
article or furniture". Coghill (1941), referred to the
chair as "the most atrocious institution hygienically of
civilised life".
Leibowitz (1967) remarked that " hundreds of variations
upon the shape of the chair have been produced, many
differing enormously in terms of how one must sit in them.
Indeed, we, of the chair, have made the compromise. We have
agreed to adjust our bodies to the dictates of the chairs;
only rarely do we find a chair in its design has contracted
to fulfil the requirements of the human body. In such ways
we have permitted the forms and products of our culture to
change our body alignments in order to satisfy these
structural requirements. We have accustomed ourselves to
habitual modes of use that are literally disfiguring".
Posture and seating authorities from over 100 years ago
stressed the extreme importance of appropriate postural
habits and appropriate seating for both school children and
adults (Bennett, 1928; Aveling, 1879; Mosher, 1899; Cohn,
1886; Lewis, 1899; Kotelmann, 1899; Shaw, 1902; Dresslar,
1917). The works of the scientists cited of the late 19th
century and early 20th century are important and relevant
today.
PAGE 3 SEATED WORKING POSTURE
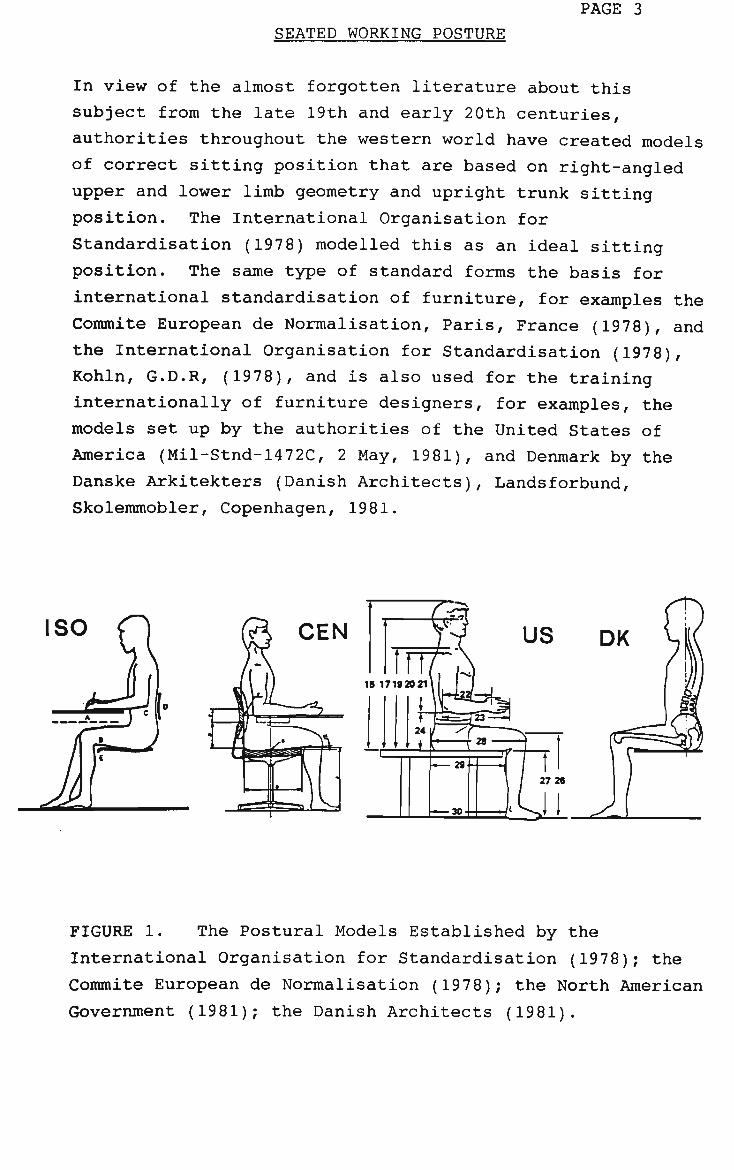
In view of the almost forgotten literature about this
subject from the late 19th and early 2 0th centuries,
authorities throughout the western world have created models
of correct sitting position that are based on right-angled
upper and lower limb geometry and upright trunk sitting
position. The International Organisation for
Standardisation (1978) modelled this as an ideal sitting
position. The same type of standard forms the basis for
international standardisation of furniture, for examples the
Commite European de Normalisation, Paris, France (1978), and
the International Organisation for Standardisation (1978),
Kohln, G.D.R, (1978), and is also used for the training
internationally of furniture designers, for examples, the
models set up by the authorities of the United States of
America (Mil-Stnd-1472C, 2 May, 1981), and Denmark by the
Danske Arkitekters (Danish Architects), Landsforbund,
Skolemmobler, Copenhagen, 1981.
FIGURE 1. The Postural Models Established by the
International Organisation for Standardisation (1978); the
Commite European de Normalisation (1978); the North American
Government (1981); the Danish Architects (1981).
PAGE 4 SEATED WORKING POSTURE
The models such authorities have published have people
sitting with the joints at the ankles, knees, hips and
elbows all making right angles, with the legs together and
parallel and the upper arms tucked into the body sides with
the forearms and hands parallel. This architectural-like
presentation shows subjects in side elevation sitting with a
concave curve in the small of the back and staring into space.
Authorities such as I.O.S. (1978), do not explain the
origin of the concept(s) of the drawings and there is no
published connection with scientific observation.
Bibliographies published with such standards do not shed any
light upon the origin(s) of the upright trunk and right
angle upper and lower limb geometry installed as the "ideal"
sitting posture. Nor do they make reference to physiological
or anatomical data to support the notion of sitting still to
perform the work.
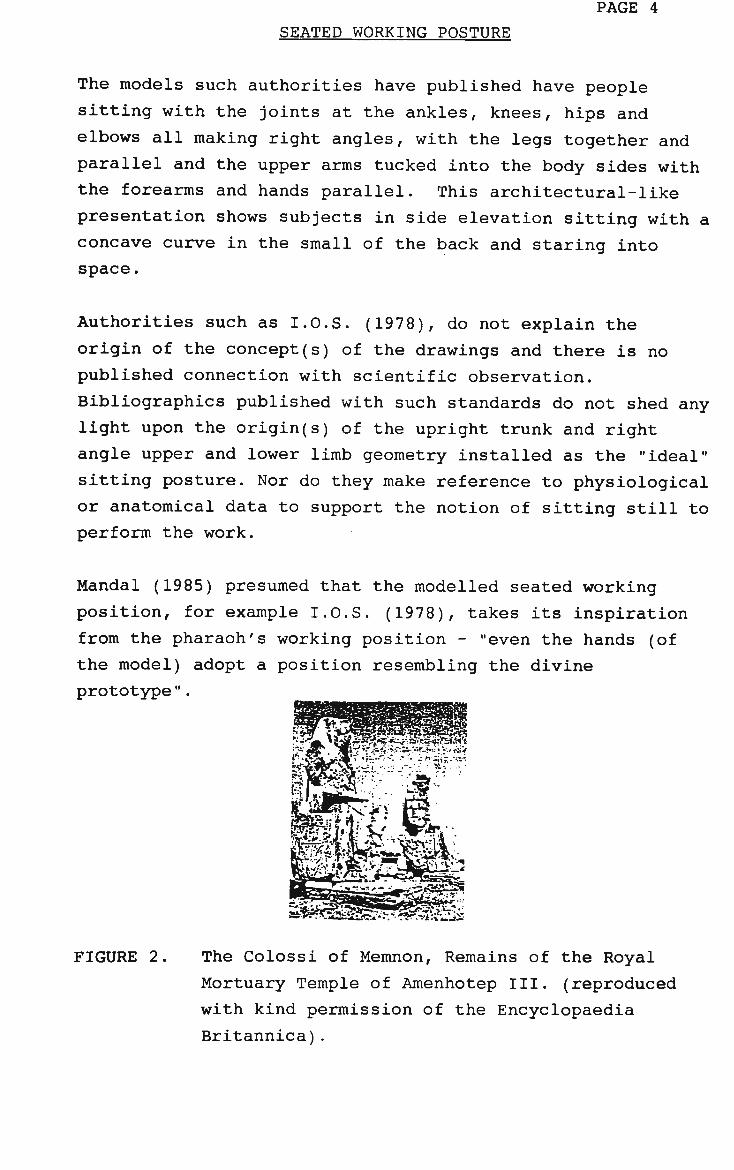
Mandal (1985) presumed that the modelled seated working
position, for example I.O.S. (1978), takes its inspiration
from the pharaoh's working position - "even the hands (of
the model) adopt a position resembling the divine
prototype".
FIGURE 2. The Colossi of Memnon, Remains of the Royal
Mortuary Temple of Amenhotep III. (reproduced
with kind permission of the Encyclopaedia
Britannica).

PAGE 5 SEATED WORKING POSTURE
The deleterious effects on the spine of improper school
furniture which force a kyphotic trunk posture, have been
realised for a long time. As early as 1737, the school
regulations of the German Princedom of Braunschweig-Luneburg
pronounced the bending of the spine in sitting "unwholsome
and injurious" (Kotelmann, 1899; Bennett, 1928). In
Bismarck's Germany the emphasis on "Ordnung", discipline and
the right angle limb geometry and upright sitting posture
led to specific designs in 1884 and 1889 respectively, by F.
Staffel of school furniture to place school children in this
salutatory and well-ordered disciplined appearance. From
this work the phrase "German Square" posture evolved.
As cited by Mandal (19 85) this posture is "just like the
military standing to attention, a parade position, quite in
appropriate for the commencement of any real work. In fact
it requires such an enormous exertion of the muscles to
maintain the upright position that on the whole is
impossible to do anything else."
FIGURE 3. The School Desks Constructed by F. Staffel,1888.
Reproduced with permission of the publisher
J.F. Bergmann Verlag.

PAGE 6 SEATED WORKING POSTURE
In the mid and late reign of Queen Victoria in England
during the latter half of the nineteenth century, office
work was one of the few respectable occupations for the
daughters of the middle class outside of the home
environment. It was important to look respectable even at
work, and corsets and crinolins forced women at work to sit
upright on the edge of their chairs. Women had to sit
upright even in easy chairs. Men, on the other hand, could
sit as they liked in comforably upholstered chairs
preferably in the privacy of their clubs since it was
considered ill-mannered to lounge around when ladies where
present. Nor were children spared - "children are expected
to sit upright and preferably in silence" (Gloag, 1964;
Mandal, 1985).
Clearly the literature of the late 19th century and early
20th century about seated working posture and related
matters could have been reduced from its large number of
observations to a few simple relationships. This set of
relationships could have been formed into a model of working
posture. When scientific knowledge exceeded the data used
to create the model, simply the model could have been
updated but after approximately 1930 the information appears
to have been in scientific limbo. The work of modern
authorities in the western world has not led to the
development of a different model.
PAGE 7 SEATED WORKING POSTURE
Hence, there is no such thing as the "perfect model". The
best that can be achieved is the creation of a model that
explains the data available at a particular point in time.
Some models survive for a long time whereas other do not.
The model is a tool to be used to express hypotheses and
rigously evaluate their consequences. This is not to say
that models are absolutely necessary. Gallileo did not
require a model in order to realise that the earth was
rotating. Nevertheless, as humanity becomes more refined,
the limitations and costs associated with a purely
experimental approach become more pronounced. This is the
reason for modelling biological systems.
With experimental methods not always providing data
sufficient to solve the many problems in medicine and
biology, the theorist can join forces with the
experimentalist. The added dimension of the theoretical
modelling approach can both lead to a further understanding
of the given problem and also potentially provide solutions
not otherwise attainable (after Zachakow, 1988).
This study examines the scientific literature associated
with seated working posture and finds no scientific link
between the promotion of sitting basically still in the
right angle limb geometry and upright trunk sitting
position, promoted by authorities in the western world as
the ideal or "correct" sitting posture.
The study presents a methodology for measuring the effects
of training to sit basically still in the right angle limb
geometry and upright trunk sitting posture, of a group of
data processors within Australia Post. The methodology
demonstrates by measured results the differences in trained
and preferred sitting working postures that data processors
utilise for seated visual and keyboard operation work.
PAGE 8
SEATED WORKING POSTURE
The study concludes with an evaluation of the findings of
the experimental measuring and a comparison between the
seated postural requisites of the "German Square" model and
the postures preferred for seated work by data processors.

PAGE 9 SEATED WORKING POSTURE
1. INTRODUCTION
1.1 LITERATURE REVIEW
1.1.1 Posture and Chair Design
1.1.1.1 Ancestory of the Chair
For five centuries the character of chair design has been
directly connected with or influenced by architecture and
social disciplines. The ancestory of the chair is mixed,
and though far-distant pre-Christian origins have affected
the character of the chairs, human costume and manners have
often determined the shape of seats and also the posture of
those seated. (Petrie, 1922).
The vast spread of the farthingale, worn by women of fashion
in the late 16th and 17th centuries, was accompanied by the
broad back-stool - the so called - farthingale chair, and
the Victorian crinoline inspired the production of the
lady's easy chair, low-seated, with an upright shell back
and vestigial arms; while for centuries the hardness of flat
uncushioned seats was minimised by the voluminous clothes to
those who used them - even a monks habit could be bunched up
to soften the surface of a stall or the cutting edge of a
misericord (a folding form of lean-to seat/body support).
(after Gloag, 1984).

PAGE 10 SEATED WORKING POSTURE
FIGURE 4. A High-Backed Settle, with Arms at Each End, and
the Back Rising to a Point. From the
Twelth-Century Psalter at Trinity College,
Cambridge. Reproduced from "A History of
Domestic Manners and Sentiments in England";
Thomas Wright, 1862.
As cited by Mandal (1974), chairs probably have always been
a symbol of dignity. The African "Ashanti-stools" are
thought to be the direct successors of the original chief's
thrones. The Ashanti were a warrior tribe, and the British
succeeded in capturing and killing several Kings, but this
made little impression on the Ashanti's, who merely
proclaimed a new King. The real authority lay not in the
person but in the stool. Only when the British realised
this in 1900 and captured the stool, they were able to
subjugate the Ashanti.

PAGE 11 SEATED WORKING POSTURE
Seats of most kinds, reveal the posture and carriage of the
humans for whom they were made, and chairs show faithfully
the importance accorded to dignity, elegance, or comfort,
thus supplementing the comprehensive disclosures made by
architecture about life in any period. John Gloag (1964),
commented "that the architectural design of chairs indicates
whether social life was afformal and rigid gracefully
relaxed, casually and careless, austere, voluptuous,
romantic, imitative, democractically standardized affluent,
vulgar, in different to art, dull, snobbish, or poor."
1.1.1.2 Design and social character of chairs and seated
posture
The history of a chair recognisable as "English" begins with
the late mediaeval period, when an individual native style
in architecture and the crafts became recognisable (Edwards,
1954). Although there is evidence that the chair
occasionally developed in isolation (Edwards, 1954), it was
often related to architecture. Thus ancient Greek chairs
may have derived their initial form from the tiers of shaped
marble seats in an open-air theatre just as some
fifteenth-century chairs derived theirs from choir stalls
(Shapland, 1927). This evolutionary process was reversed in
the second half of the 17th century, when chairs were
extended laterally to form double or triple seats - the
so-called love-seat and the settee - with the chair back,
and altered in shape or decoration, used in duplicate or
triplicate (Harris, 1937).
According to Gloag (1964), chair-making began when somebody,
several thousand years ago, suggested that a piece of wood
layed on top of three or four stones at approximately equal
height would provide a movable seat. Collecting a few
stones of about the same size was a simple job compared with
shifting a solid block of wood or stone from place to place,
when a tribe was on the move.

PAGE 12 SEATED WORKING POSTURE
Resting a trimmed and smoothed board on stones was the first
stage in the evolution of a free-standing, movable seat; the
next, which must have taken many generations to reach, was
to fit three or four legs to the under board, plugging them
into holes bored or scraped out on the under-side, and
producing as a result something that was stable, and saved
the trouble of searching for supporting stones. According
to Harris (1937), "as skill in wood carving improved, crued
upright supports for the seat were carved, for primitive and
civilised people alike have a deep need for and love of
ornament, and as craftsmen generally go to nature for
models, some of the earliest examples represent the legs of
animals."
Breasted (1939), mentions stools supported on carved ivory
legs, representing those of a bull, in the First and Second
Dynastys of ancient Egypt 3400-2980BC, and for centuries the
Egyptian civilisation developed the art of furnishing
evolving a stylised fauna and flora for thrones, chairs and
stools, and perfecting such structural inventions as the
folding stool and the braced frame (Nattali, 1846). Wood
has been shaped by cutting tools on a rotating surface since
very early times, and there is no record of when or where
the first lathe was invented. It was used by the Egyptians,
Assyrians, Greeks and Romans, in the Byzantine empire and
throughout the Romanesque period. Structural inventions,
like joinery, led to the making of chairs with high inclined
backs and the yielding seat of woven string, resembling
cane-work, and this gave far more comfort than the
low-backed chair born of a lesser technology. According to
Richter (1926), the Greeks invented the klismos "from no
Egyptian or Assyrian prototype, but apparently evolved from
the simpler type of thrones". The klismos displayed
concaved legs splayed outwards, the upright crossed by a
shallow concave back-rest which allowed a free, natural
position for those seated. Richter (1926), concluded, "the
klismos is certainly one of the most graceful creations of
furniture, combining comfort with elegance. For sheer
beauty of line it has few rivals".
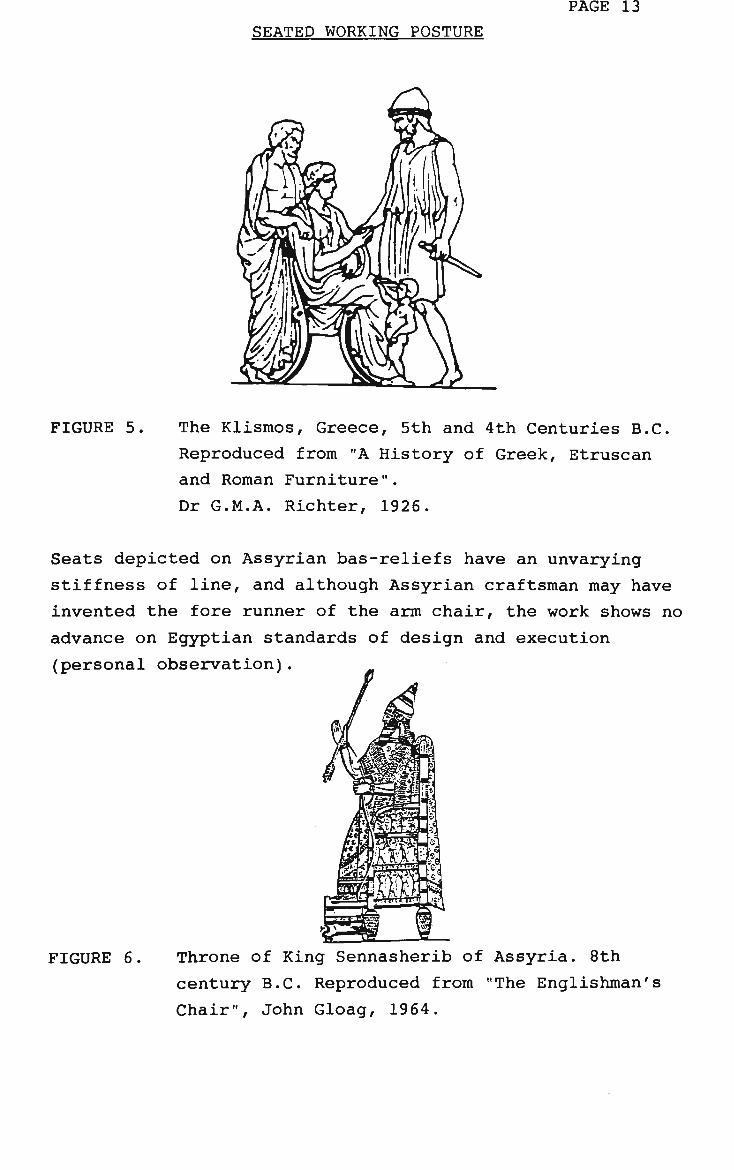
PAGE 13 SEATED WORKING POSTURE
FIGURE 5. The Klismos, Greece, 5th and 4th Centuries B.C
Reproduced from "A History of Greek, Etruscan
and Roman Furniture".
Dr G.M.A. Richter, 1926.
Seats depicted on Assyrian bas-reliefs have an unvarying
stiffness of line, and although Assyrian craftsman may have
invented the fore runner of the arm chair, the work shows no
advance on Egyptian standards of design and execution
(personal observation).
FIGURE 6. Throne of King Sennasherib of Assyria. 8th
century B.C. Reproduced from "The Englishman's
Chair", John Gloag, 1964.

PAGE 14 SEATED WORKING POSTURE
The relationship between architecture and chair design,
established in Greece, has never been broken off, and the
Greek discovery of a natural and graceful form of chairs is
characteristic of the people who perfected the Doric, Ionic,
and Corinthian orders of architecture, and created the
system that governed the proportions of each.
1.1.1.3 Chairs and the modern movement in architecture
As cited by Gloag (1964), English architects in the 1920s
and 1930s were preoccupied with what Jeffrey Scott called
the "Mechanical Fallacy", and the avant-garde gave honour to
the so-called "International Style", chairs of tubular metal
and fabric designed with all traces of national
distinctiveness consciously erased.
According to Mandal (1974), the Stockholm exhibition in 1930
"marked the start of a new epoch for Scandanavian furniture
design under the motto - 'Beauty in every day furniture'.
The aim was a social one. But both functional and social
ideals were quickly modified as the emphasis moved towards
the creation of furniture works of art. Mandal (1974),
commented further that "many of the chairs produced as
functional are refined instruments of torture". Mandal
(1974) cites an example by the Finnish architect Alvar Aalto
- the "sanatorium chair" (1939), and comments that "if
patients were not already ill, they certainly would be in
that furniture".
FIGURE 7. The "Sanatorium Chair" by Alvar Aalto, Finland,
1939. Reproduced from "The Seated Man - Homo
Sedens", A.C. Mandal, 1985.

SEATED WORKING POSTURE
PAGE 15
The architects who designed this type of chair furniture
were concerned with aesthetic and technical quality, while
they mostly ignored the needs of people who were to use it.
Since the Second World War, tradition has reasserted an
individuality that was too strong to be permanently
submerged in the prosaic anonymity of barren functionalism
(Gloag, 1964). LeCorbusier (1947) stated "a house is a
machine for living in", and surplanted another - "an arm
chair is a machine for sitting in and so on". LeCorbusier
exercised an influence on the growth and development of the
modern movement by the consistent logic of his teaching that
social problems are never dissociated from architectural
problems, and steeped in the belief that form must follow
function. The modern movement has out grown the calculated
austerity of its bleak period between the world wars; its
manifestations in architecture and the industrial arts have
mellowed, and materials, manufacturing techniques, and the
general approaches to furniture design have changed more in
the past 40 years than in the previous 400 years.
1.1.1.4 Tradition and the upright sitting posture
The design of seats partly depends on the postures adopted
for dignity or comfort. Different families of the human
race have characteristic ways of sitting which seems to have
a cultural derivation and to not have arisen because of any
anatomical differences between Asiatics, Caucasians, and
Negroids.

SEATED WORKING POSTURE
PAGE 16
Asiatics sit comfortably with the lower limbs arranged
horizontally; a posture that has been described as the
hieratic or Buddha, and is usually depicted in paintings and
sculptured figures of Buddha and adopted by Buddhist priests
(Paine and Soper, 1960). This sitting position has for many
centuries influenced the design of oriental furniture, and
by lowering the eye level of the sitter has lowered the
height of seats and tables, which, by comparison with
European seats and tables, seem very close to the floor
(personal observation). Particularly in the Middle Eastern
countries mats, carpets or cushions placed directly on the
floor are often used instead of stools and chairs.
A less serene and dignified position is squatting with the
legs disposed near vertically, the knees brought together
below the chin, the spine curved forwards in a kyphotic
shape, and the arms extended resting on the knees or clasped
about them. There are two distinct variations of the
squatting posture, and in the second, the individual squats
on the heels or hamstrings, with the buttocks clear of the
ground - a position often shown in ancient Egyptian
paintings and sculpture.
The ancient Egyptians are depicted sitting upright on chairs
and stools with seats of varying height, though even a low
seated-chair was higher than anything Oriental, for the
sitting positions of the Egyptian upper classes were the
same of those of all classes in Europe. Peasants or slaves
might squat, but the Pharaoh and his court officials and his
bureaucrats sat with well drilled-dignity (after Breasted,
1939) .

PAGE 17 SEATED WORKING POSTURE
FIGURE 8. Painting of a Chair with an X-Shaped Underframe,
from the Tomb of Nebamun, Thebes, 1400 B.C.
Reproduced from "The British Museum : Egyptian
Antiquities", M.A. Nattali, London, 1846.
The Greeks and the Romans reclined on low couches when they
dined, and the Greeks had recognised the importance of a
curved, comfortable support for the back when they sat on
chairs (after Richter, 1926). A flat seat and a completely
vertical back throw the head off balance and give no support
to the small of the back (after Mandal, 1974), but for
thousands of years claims of dignity have excluded comfort,
though the Greeks proved dignity and comfort were somewhat
compatible in the klismos chair design.
Asiatic peoples had combined dignity with comfort in the
cross-legged habitual sitting positions; Europeans, who
preferred to sit upright, were prepared to sacrifice
comfort, and retained the unyielding vertical chair back
until the 17th century (Rowland, 1953; Harris, 1937).
Communal native tribes prefer a seat just high enough to
allow the chief to look down on his squatting tribesmen as a
demand of dignity; a block of wood or stone, or as technical
skill advanced, a low stool, were the predecessors of the
throne (after Gloag, 1964; von Rotzler, 1969).

PAGE 18 SEATED WORKING POSTURE
FIGURE 9. The Esono Chair (Elephant Chair), Throne of the
Ashanti Kings of Kumasi, Gold Coast, West
Africa. 19th Century. Reproduced from von
Rotzler, W., (1969) .
In all ages authority has required the enhancement of
superior height - thrones rested on a platform were ascended
by steps, judges were enthroned above the level of their
courts, Prelates and the Masters of mediaeval Guilds also
sat on thrones, and seats occupied by the Feudal Lord, his
relatives and special guests were set on raised dais at one
end of a great hall (after Harris, 1937). Inferior being
had a physical as well as a social meaning; the lower orders
in society were literally at a lower level when in the
presence of their lords and masters who always looked down
on them from a height from a chair of state or from the back
of a horse. In the presence of Kings, Princes of the Church
and great Noblemen, not only Serfs and Servants, but the
lesser nobility and gentry were obliged to show their
respect by kneeling (Gloag, 1964).
In England the chair has for centuries been a symbol of
authority even when no chair is in use.

PAGE 19 SEATED WORKING POSTURE
The account by Charles Dickens (1837), of the election in
the "Pickwick Papers" records a vote of thanks that was
moved by the Mayor of Eatanswill "for his able conduct in
the chair; and the mayor devoutly wishing that he had had a
chair to display his able conduct in (for he had been
standing during the whole proceedings), returned thanks".
In the English language there are a number of words were
"chair" as a component of a phrase, has become synonymous
with authority, for examples, "Papal See", "Judgement-seat",
"Professional-chair". According to Mandal (1974), such
phrases mainly originated in the Middle Ages when chairs
were considered a status symbol associated with the ruling
classes.
Chairman has become a title, invested with power, and though
the chair as a material symbol has become less important, it
still figures prominently in the halls, the council
chambers, the board rooms and other meeting places of the
upper echelon of society, while in monarchies the throne is
an emblem of royal supremacy.
The traditional association of chairs with an upright,
dignified bearing was not overcome until the late 17th
century when the easy chair was invented. This was a
starting point of the slow but continuous decline of seated
dignity. By increasing standards of comfort, chair-makers
and upholsterers began to change posture through design,
thus unwittingly changing the character of manners, which
became less formal, while dignity was relegated to Royal and
offical functions (Petrie, 1922).

PAGE 20 SEATED WORKING POSTURE
1.1.2 Sitting Posture
1.1.2.1 The Upright Sitting and Right Angle Limb Geometry
Sitting Posture.
As early as 1737, the school regulations of the German
Princedom Braunschweig-Luneburg denounced the bending of the
spine in sitting as "unwholesome and injurious" (Kotelmann
1899; Bennett, 1926). According to Kramer (1981), with the
start of prolonged periods of sitting in kindergarten "very
often faulty positions are assumed which jeopardise the
future fate of the intervertebral discs". Among an
elementary school population (students ages 6 to 12 years),
Mierau et al (1984) reported the prevalence of low back pain
to be 22.8%. The prevalence of low back pain was found to
increase to 33.3% among a secondary school population
(students ages 12 to 17 years). Salminen's study (1984) of
370 Finnish school children (students ages 11 to 17 years),
found that, 19.7% of the students reported current neck/or
back symptoms. Of these students with current neck/or back
symptoms 58.9% reported having symptoms whilst sitting.
Wagenhauser (1978) also found sitting to be a major
exacerbating factor among secondary school students
complaining of back ache.
As education became more wide spread, interest in the design
of school furniture grew. In 1888, F. Staffel constructed
the school desk based on Ordnung discipline and the right
angle sitting posture of Bismarck's Germany (Gloag, 1964).
This postural style has also inspired modern furniture
design. Industrialisation of Europe during the 19th century
led to an increasing use of the chair as a sitting device to
be used at work.
PAGE 21 SEATED WORKING POSTURE
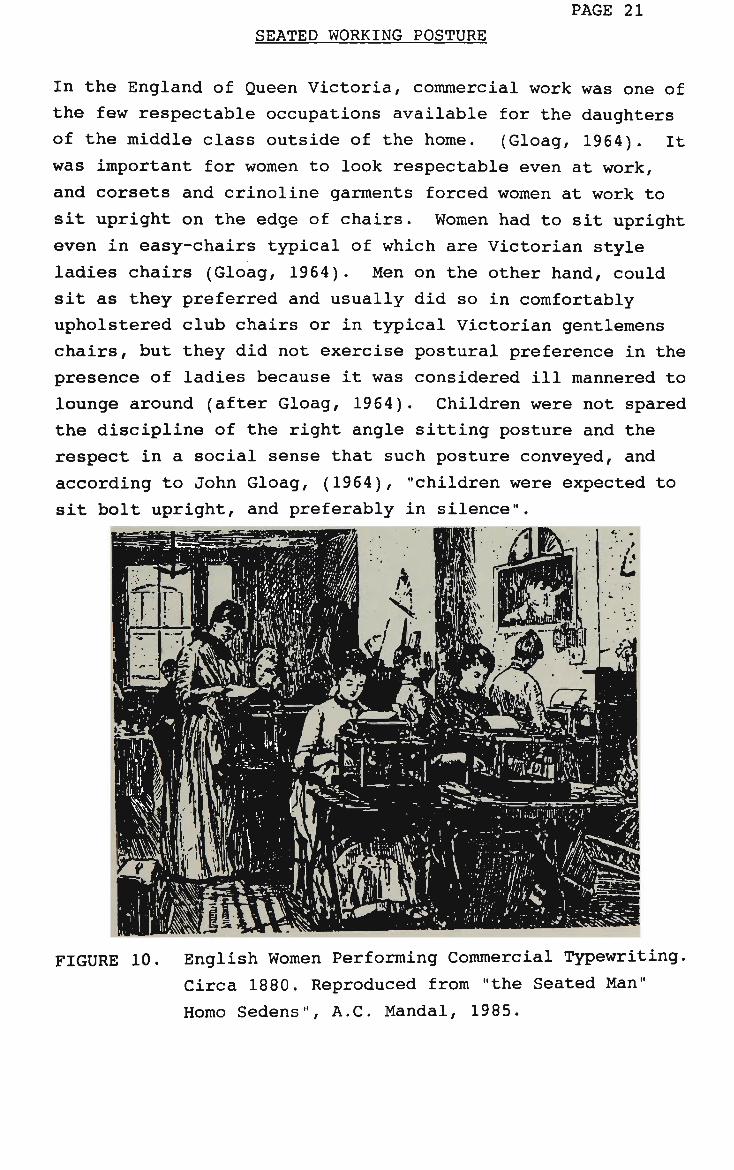
In the England of Queen Victoria, commercial work was one of
the few respectable occupations available for the daughters
of the middle class outside of the home. (Gloag, 1964). It
was important for women to look respectable even at work,
and corsets and crinoline garments forced women at work to
sit upright on the edge of chairs. Women had to sit upright
even in easy-chairs typical of which are Victorian style
ladies chairs (Gloag, 1964). Men on the other hand, could
sit as they preferred and usually did so in comfortably
upholstered club chairs or in typical Victorian gentlemens
chairs, but they did not exercise postural preference in the
presence of ladies because it was considered ill mannered to
lounge around (after Gloag, 1964). Children were not spared
the discipline of the right angle sitting posture and the
respect in a social sense that such posture conveyed, and
according to John Gloag, (1964), "children were expected to
sit bolt upright, and preferably in silence".
FIGURE 10. English Women Performing Commercial Typewriting.
Circa 1880. Reproduced from "the Seated Man"
Homo Sedens", A.C. Mandal, 1985.

PAGE 22 SEATED WORKING POSTURE
1.1.2.2 Back Pain Associated with the Design of Furniture
Bennett (1928) considered going to school to be among the
most sedentary of occupations, and the place were permanents
habits of sitting are formed. Shaw (1902), commented that
"the desks and chairs used in the greatest number of our
schools are constructed with but the slightest regard for
hygienic principles". As a result of improper school
seating Shaw (1902) referred to the "injurious effects as to
posture, and wrong habits of carriage, which are born
through life, and sadly enough come more pronounced as the
years of the life increase". Shaw's comments on school a
furniture are just as pertinent today as they were
eighty-five years ago.
As cited by Mandal (1985), the Aarhus Architectural College,
Denmark, carried out a survey in 1980 which revealed its 60%
of Danish 9th class students (14 and 15 years old range
students) complain of pains in the back, the neck or
shoulders. The survey revealed that the students attribute
blame to the furniture for such pain. From historic
occupations of fisherman, hunters, gatherers and farmers,
the human race has developed into predominantly a sedentry
one at occupation.
The seated working position involves mainly bending the
back, and this leads to the straining of the intervertebral
joints, interconnective tissue of the joints and the bonding
ligamentous structure, together with the musculature and its
connective points on skeletal structure (Frankel and Nordin,
1978). Scientific literature indicates generally that
larger numbers of the workforce are reporting back ailments,
and there seems to be agreement in the literature that the
strain of the anatomical components of the back has an
association with the increased incidents of reporting
(McKenzie, 1981). Straining the back for many hours a day
by sitting in a stooped or forwards bent position is
probably a significant cause of back ache (Mandal, 1985).
PAGE 23 SEATED WORKING POSTURE
Besides the adverse physical effects of improper school
seating, a study by Riskind and Gotay (1982), indicated that
an individuals physical posture can have carry-over effects
on motivated behaviour. In a laboratory setting at two
different universities, twenty under graduate students were
placed in either a slumped, kyphotic sitting posture or an
upright erect sitting posture. The individuals who were
previously placed in a slumped, kyphotic sitting posture
later showed significantly lower persistence in a standard
learned helplessness task - an insoluable geometric puzzle.
These results suggested that "the self perception of being
in a more slumped-over physical posture pre-disposes a
person to more speedily develop self-perceptions of
helplessness later, following exposure to problems that the
person finds to be insoluble" (Riskind and Gotay, 1982).
"Today, the sitting position is the most frequent body
structure in industrialised countries we sit in the
car, we sit in the train on the way to or from work, we sit
most of the time at the workplace, and in the evening we go
and sit in front of the television set. It can be stated
without exaggeration that the sitting position is
characteristic of modern times" (Grandjean and Hunting,
1977) .
Unfortunately, sitting is probably also the most unhealthy
of all the prolonged postures of the human body (Helbig,
1978). Whether due to poorly design chairs or work
stations, musculo skeletal factors, or improper movement
patterns, slouched kyphotic sitting posture dominates among
observed sitting postures. However, compared to standing
postures, poor sitting posture will usually always be
accompanied by a greater degree of spinal flexion.
PAGE 24 SEATED WORKING POSTURE
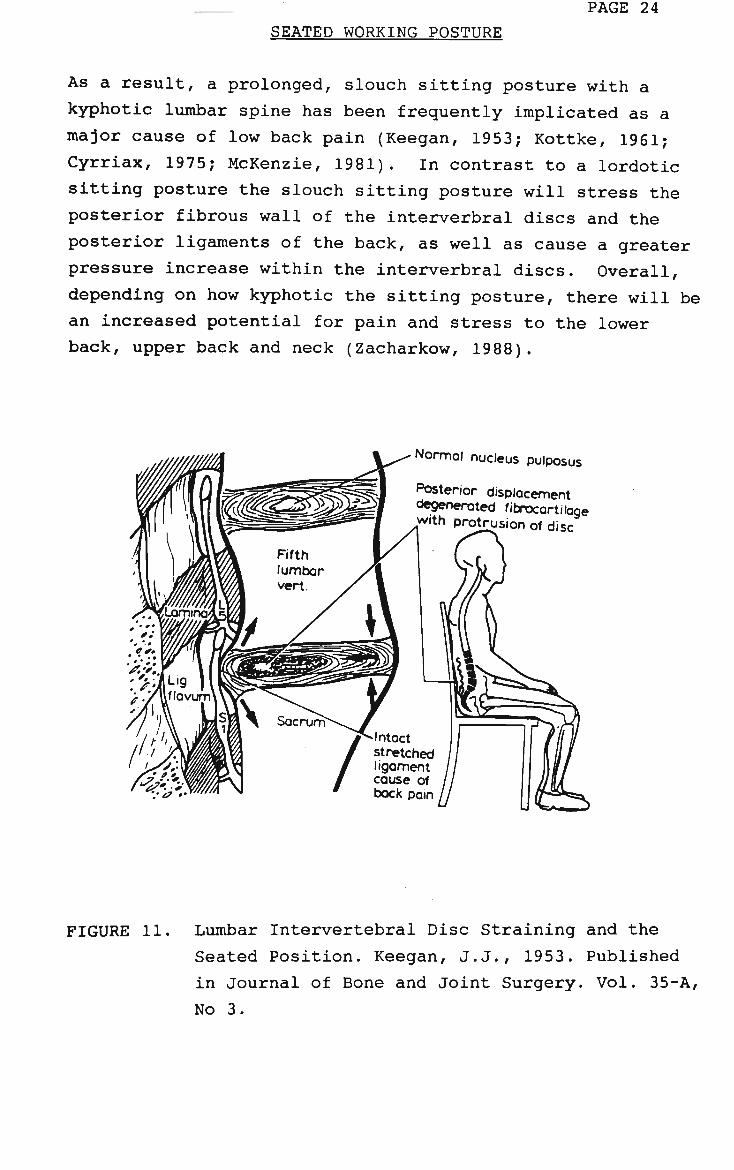
As a result, a prolonged, slouch sitting posture with a
kyphotic lumbar spine has been frequently implicated as a
major cause of low back pain (Keegan, 1953; Kottke, 1961;
Cyrriax, 1975; McKenzie, 1981). In contrast to a lordotic
sitting posture the slouch sitting posture will stress the
posterior fibrous wall of the interverbral discs and the
posterior ligaments of the back, as well as cause a greater
pressure increase within the interverbral discs. Overall,
depending on how kyphotic the sitting posture, there will be
an increased potential for pain and stress to the lower
back, upper back and neck (Zacharkow, 1988).
FIGURE 11. Lumbar Intervertebral Disc Straining and the
Seated Position. Keegan, J.J., 1953. Published
in Journal of Bone and Joint Surgery. Vol. 35-A,
No 3.
PAGE 25 SEATED WORKING POSTURE
This prolonged, slouch sitting posture has also been
implicated as impairing both respiratory and digestive
functioning (Goldthwait, 1909, 1915; Schurmeier, 1927; Bunch
and Keagy, 1976; Golthwait et al, 1952). This posture can
constrict the abdominal and thorasic cavities, and increase
the pressure on the abdominal viscera (Zacharkow, 1988).
"In this position the chest is necessarily lowered, the
lungs are much less fully expanded than normal, the
diaphragm is depressed, the abdominal wall is relaxed, so
that with the less support of the abdominal wall, together
with the lowering the diaphragm, the abdominal organs are
necessarily forced downwards and forward" (Goldthwait, 1915).
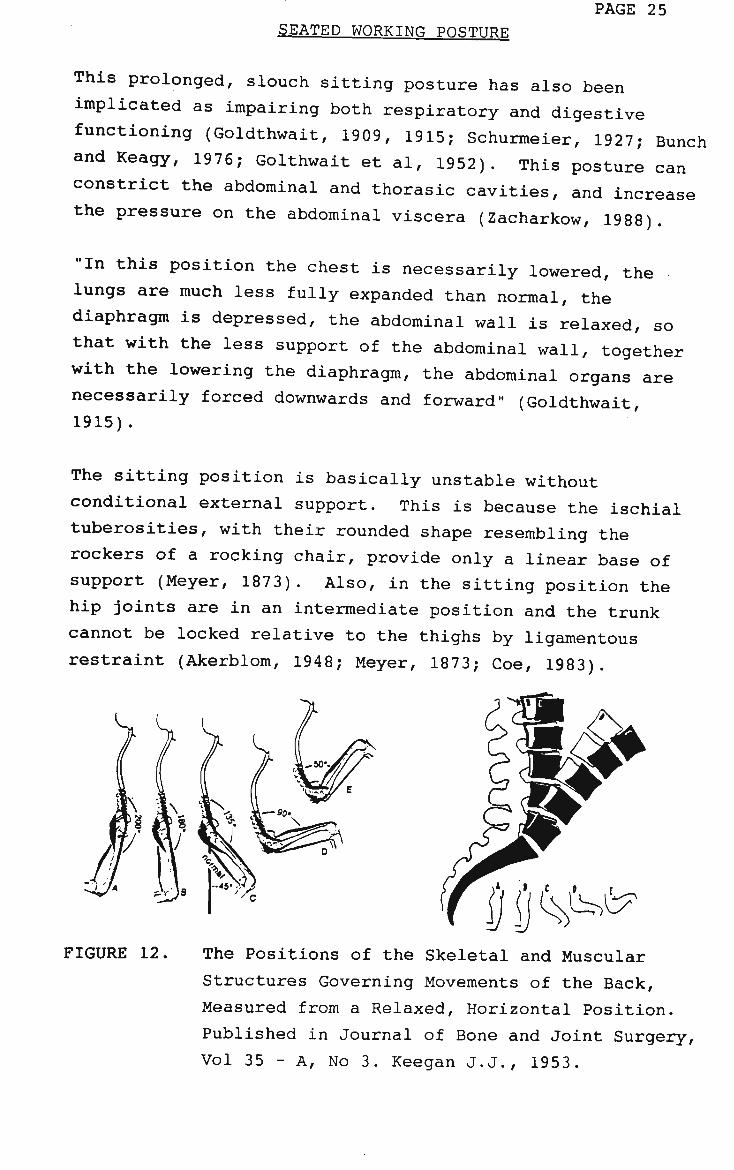
The sitting position is basically unstable without
conditional external support. This is because the ischial
tuberosities, with their rounded shape resembling the
rockers of a rocking chair, provide only a linear base of
support (Meyer, 1873). Also, in the sitting position the
hip joints are in an intermediate position and the trunk
cannot be locked relative to the thighs by ligamentous
restraint (Akerblom, 1948; Meyer, 1873; Coe, 1983).
L\ IN .
FIGURE 12. The Positions of the Skeletal and Muscular
Structures Governing Movements of the Back,
Measured from a Relaxed, Horizontal Position.
Published in Journal of Bone and Joint Surgery,
Vol 35 - A, No 3. Keegan J.J., 1953.

PAGE 26 SEATED WORKING POSTURE
As a result, muscle activity is necessary for fixation of
the trunk when sitting without additional stabilisers. A
common misconception, is to consider sitting in a chair as a
static activity as opposed to dynamic activity. According
to Branton (1966), the sitting body is "not merely an inert
bag of bones, dumped for a time in the seat, but a live
organism in a dynamic state of continuous activity".
Branton's (1969) mechanical model of the sitting body from
the waist down depicts 4 variations of freedom to move, even
with the feet planted firmly on the floor, and they are:
i. rocking of pelvis over ischial tuberosities;
ii. flexion and extension at the pelvic-femoral joint;
iii. flexion and extension at the knee joint;
iv. flexion and extension of the ankle joint.
In the sitting posture, the hip, the knee and ankle joint
are near the mid point of their range of motion, and
therefore they are in the state of maximum mobility
(Zacharkow, 1988). Branton (1966, 1969), mentions that even
if an individual appears to sit still, his body is
continuously moving. The freedom of the pelvis to move,
which will be present in all sitting postures when the upper
sacrum is not supported by a backrest, will result in
"continuous hunting" or relatively fast oscillary movements
of the pelvis rocking over the ischial tuberosities.
Therefore, Branton (1966) hypothesised that there is a
continual need for postural stability when sitting, so that
the seated person "spontaneously takes up such postures as
will allow her/him to sit stably, while relieving her/his
brain and muscles from greater exertion than would be
necessary otherwise".
PAGE 27 SEATED WORKING POSTURE
"If this seat does not allow postures which are both stable
and relaxed the need for stability seems to dominate the
need for relaxation, and postures are adopted which rigidify
the body internally in compensation." In other words, if
the seat features fail to stabilise the body, the person
must stabilise herself/himself, eg. by crossing the legs, or
by supporting the head on her/his hand. This maybe at some
extra cost in muscle work (after Branton, 1966).
Dempster (1955) compared the dynamic body to an open chain
system of links as they rotate about the joint centres. He
described how certain joint motions may be stabilised:
"The fingers of the two hands may be interlocked to
interconnect the right and the left upper limb links;
the legs may be crossed for seated stability; the arms
may be crossed or placed on the hips. In such actions
as these, temporary approximation to closed chains are
effected.
Link chains may be cross-connected as in crossing the
knees (viz, pelvis and right and left thighs) or in
placing the hand on the same or opposite shoulder. To
the extent that these temporary closed chains
approximate a triangular linkage, there is a degree of
stability imparted even without muscular actions, but
this is still approximate because of the interposed soft
tissues. The closer the links approximate a closed
triangular, or pyramidal pattern the less muscles are
called upon for stabilising action at joints. One may
recognise many rest positions involving this
principle ... - crossed arms, hands in pockets, or such
sitting positions as crossed knees, ankle on opposite
knee/ elbow on knee, or head in hand". (Dempster,
1955).
SEATED WORKING POSTURE
PAGE 28
Temporary closed chains may also include certain
environmental objects. The most commonly observed example
is when the arms are supported on a desk (Meyer, 1873).
Pressing the knees as a closed chain of body segment
activity was examined by Akerblom (1948), when he used an
example of a chair with inclined backrest, horizontal seat,
and a slippery seat cover. When the experimental subject
leant against the backrest, there was a force tending to
push the buttocks forwards on the seat, and this action
slowly ejected the sitter. Using Branton's mechanical model
of sitting (1969), there will be four variations of motion
observed as the individual buttocks slide forward on the
seat, with feet firmly on the floor -
i. Upward rotation of the pelvis (rocking over the
ischial tuberosities);
ii. Extension at the hip joints;
iii. Flexion on the knee joints;
iv. Dorsiflexion at the ankle joints.
Another commonly observed closed chain-position would
involve stretching the legs forward into extension. This
posture will lock "the knees and the ankles, and the
lower extremities become rigid posts pushing against the
floor for forward slide (Branton, 1969)."
SEATED WORKING POSTURE PAGE 29
SIDE view
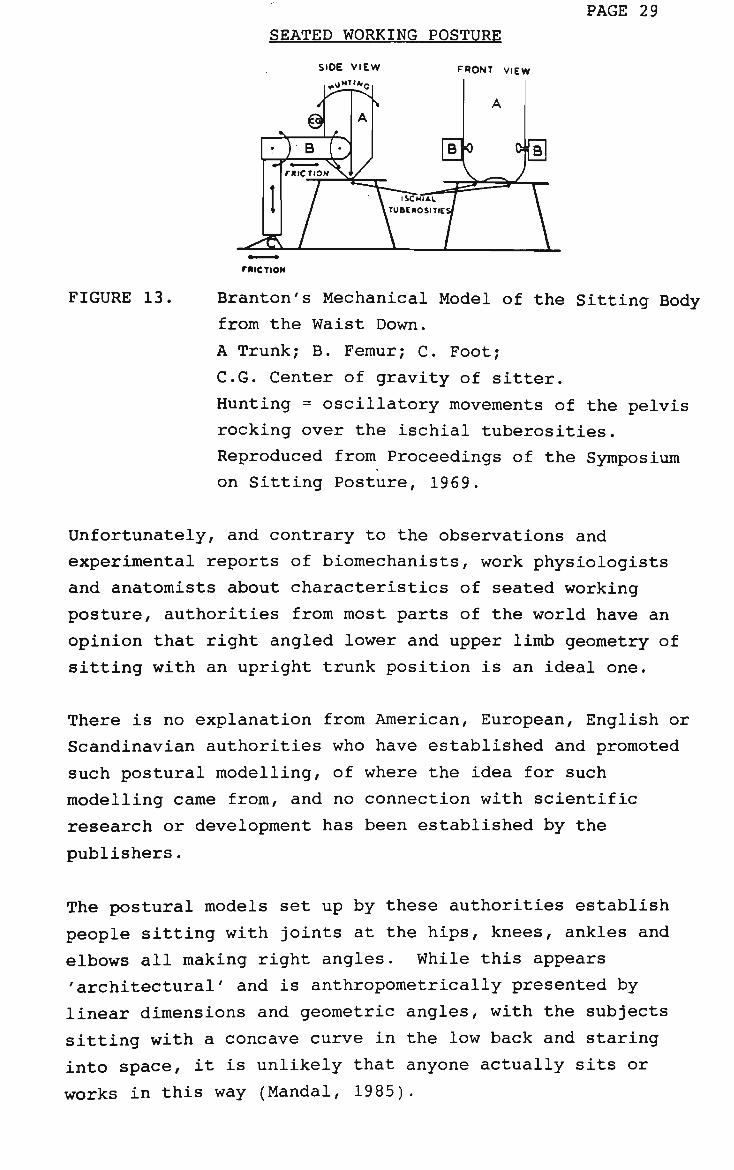
FIGURE 13.
rmcnoN
Branton's Mechanical Model of the Sitting Body
from the Waist Down.
A Trunk; B. Femur; C. Foot;
C.G. Center of gravity of sitter.
Hunting = oscillatory movements of the pelvis
rocking over the ischial tuberosities.
Reproduced from Proceedings of the Symposium
on Sitting Posture, 1969.
Unfortunately, and contrary to the observations and
experimental reports of biomechanists, work physiologists
and anatomists about characteristics of seated working
posture, authorities from most parts of the world have an
opinion that right angled lower and upper limb geometry of
sitting with an upright trunk position is an ideal one.
There is no explanation from American, European, English or
Scandinavian authorities who have established and promoted
such postural modelling, of where the idea for such
modelling came from, and no connection with scientific
research or development has been established by the
publishers.
The postural models set up by these authorities establish
people sitting with joints at the hips, knees, ankles and
elbows all making right angles. While this appears
'architectural' and is anthropometrically presented by
linear dimensions and geometric angles, with the subjects
sitting with a concave curve in the low back and staring
into space, it is unlikely that anyone actually sits or
works in this way (Mandal, 1985).
PAGE 30 SEATED WORKING POSTURE
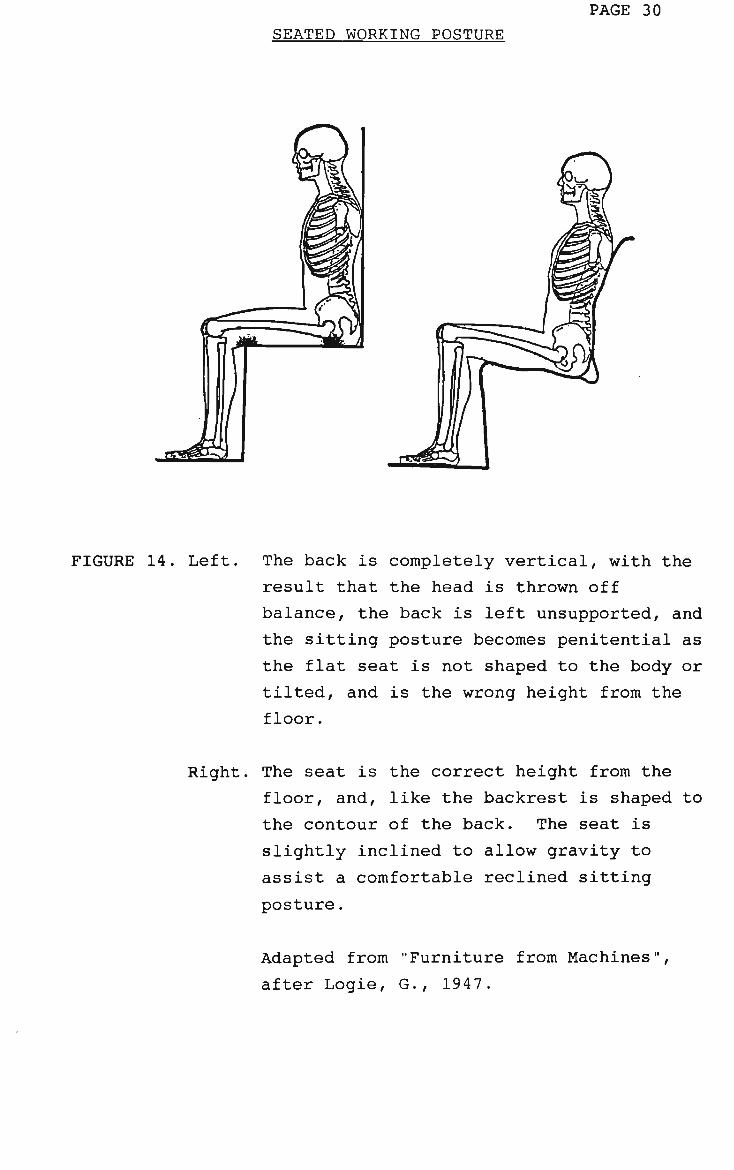
FIGURE 14. Left. The back is completely vertical, with the
result that the head is thrown off
balance, the back is left unsupported, and
the sitting posture becomes penitential as
the flat seat is not shaped to the body or
tilted, and is the wrong height from the
floor.
Right. The seat is the correct height from the
floor, and, like the backrest is shaped to
the contour of the back. The seat is
slightly inclined to allow gravity to
assist a comfortable reclined sitting
posture.
Adapted from "Furniture from Machines",
after Logie, G., 1947.

PAGE 31 SEATED WORKING POSTURE
At school, the right-angled and sitting upright posture
taught to students appears originally to have been a
salutatory one and was only adopted specifically on
occasions upon visits by head teachers or other dignitaries,
whereas the working postures depicted in the International
Standard Organisation (1978), European, Scandinavian,
American, and English and other postural models appear to
have been adopted from the Pharaoh's divine position of
sitting as depicted in the stone sculptures of the Egyptian
civilisation (examples, Kephren, fourth dynasty - Old
Kingdom 2664 - 2155 BC covering Dynasties III - VIII and the
Colossi of Memnon, statuary remains of the mortuary temple
of Amenhotep III - 1417 to 1379 BC, eighteenth Dynasty -
beginning of the New Kingdom), and representing the purely
symbolic work done by the rulers of Egypt (after Mandal,
1985) .
In commenting about the Danish postural models based on the
"German Square" principles and known as DKI and DK2, Mandal
(1985) stated that "you take a skeleton and seat it on a
chair. If that is a model you make a nice drawing and -
abrakadabra - you have the prescription for how living
people must sit".
Mandal (1985) also commented that a skeleton has greater
advantages over living humans when it comes to sitting
"correctly" because:-
i. It can sit and stare into space all day;
ii. It has no tendons or muscles to restrict movement
in the hip and other relevant joints;
iii. It has a bent but flexible bar system through its
spinal structure to replace the natural ligamentous
structure and cental nervous system, so it can sit
in the same lumbar curve normally used in the
standing position.
SEATED WORKING POSTURE
PAGE 32
Further, Mandal (1985) commented that in order to have a
satisfactory overall appearance, the spinal column of the
standing person has been taken, and the legs for a sitting
person have simply been drawn on to it. Thus, without the
slightest regard for the humans actual anatomy in the seated
position, a new human form described in line work has been
contrived to fit available furniture.
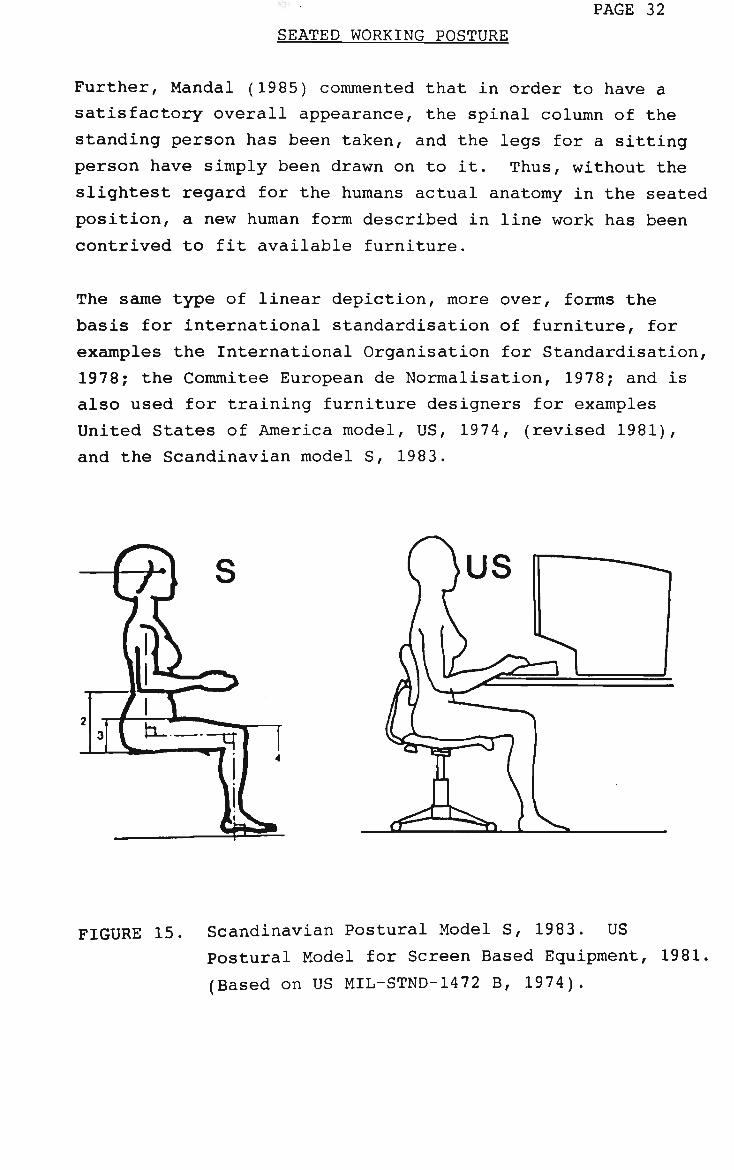
The same type of linear depiction, more over, forms the
basis for international standardisation of furniture, for
examples the International Organisation for Standardisation,
1978; the Commitee European de Normalisation, 1978; and is
also used for training furniture designers for examples
United States of America model, US, 1974, (revised 1981),
and the Scandinavian model S, 1983.
FIGURE 15. Scandinavian Postural Model S, 1983. US
Postural Model for Screen Based Equipment, 1981.
(Based on US MIL-STND-1472 B, 1974).
PAGE 33 SEATED WORKING POSTURE
1.1.2.3 Training to Achieve the Ideal/"Correct" Sitting
Posture in Subjects.
Mandal (1985) cites that in the Gentofte municipality of
Copenhagan, Denmark, most schools provided pupils with about
90 short lessons in correct sitting technique "over a period
of approximately 5 years." The result of this, probably the
greatest teaching effort in correct sitting technique in the
world, has been that pupils all adopt slumped-over kyphotic
back postures and unbalanced asymmetric postures to see,
read and write whilst performing school work. Mandal (1985)
believes that the leading reason for bad working position
lies in the fact that children and young people have an
average optimal visual distance for reading approximately
300mm, and as their work tables are relatively low
(approximately 727mm/28.5 inches high) - being almost at the
seated knee joint height for the taller pupils, they must
consequently bend there backs to anatomical limits to get
their eyes to reasonable reading distance with hard copy.
Yet based on their studies from 1973 until 1978, both Danish
and Swedish authorities came to quite a different
conclusion. They proposed in 197 8 that the International
Organisation for Standardisation (IOS) should reduce the
desk height by 2% inches (approximately 64mm) for most
pupils and for shorter stature pupils the reduction should
be by as much as 4.5 inches (approximately 115mm). Yet, it
is clear that the student group sitting at lower tables as
described by Mandal (1985) will flex their backs or their
hip joints even more so than they currently did at the time
of the survey. Alternatively, the option would be to pick
up the visual material in the hands and use the arms lectern
- like to reduce visual distance for focus and accommodation
and to reduce muscular and skeletal fatigue about the
cervical, thoracic and lumbar spines together with the
activity of the greater trochanter of the hip.

PAGE 34 SEATED WORKING POSTURE
Samuel A. Eliot, a member of the Boston School Committee, in
1833 stressed that "its the duty of parents and those who
act with them to take care that the school shall be a place
where the children may acquire the use of their intellectual
faculties without having there physical organisation
disturbed or there vital powers debilitated by a constrained
position".
Hartwell (1895) determined that elementary school could be
classified as a sedentary occupation for 84% to 88% of the
school period. An english investigation by the Department
of Education and Science (1976) found that students tended
to use the desk and chair more for both working and
listening as they grew older. Among the 16 to 18 year olds
for example, 73.3% of the school period involved using both
desk and chair.
Bennett (1925, 1928) made two detailed studies on school
posture and these were based on 4,637 individual
observations in Chicago elementary schools and high schools.
Observations were based on the spinal profile, which was
classified as either erect or slumped (kyphotic). The
slumped posture involved either a forward slump, a reclined
slump, or a slumped spinal profile with the students sitting
position being fairly vertical. Results showed that 59% of
all observations involved a slumped posture (kyphotic
rearward or forward). The worst postures (65% slump) were
in reading and writing activities. Bennett gives no
definitive angles of trunk, limbs or head to qualify the
slumped postures observed in the two studies.
SEATED WORKING POSTURE
PAGE 35
An investigation reported by Watzka (1969) involved
observations on 42-girls and 42-boys, of mean age 17.2
years, who were in the upper classes at two secondary
schools in England. Three aspects of postural behaviour
most frequently observed involved:-
i. sitting without support from the backrest;
ii. trunks slumped forwrds;
iii. both arms leaning on the desk.
This combined posture appeared to be imposed by the
necessity to write on a horizontal desk. However, writing
was observed to occupy approximately 30% of the total time
whereas of this desk-supported posture was observed to occur
between 65 to 80% of the total time.
Watzka et al (1969), made 2798 observations on students'
sitting behaviour in auditorium seats during lectures.
Approximately 60% of the observed time was spent writing by
the students, approximately 28% of time was spent listening.
Students were observed to lean against the backrest
approximately 32% of the time. Over 80% of the time,
students rested there lower arms on the writing surface.
The German orthopaedic surgeon, Professor Hanns Schoberth
(1962) performed basic research into childrens working
positions. In the ordinary, relaxed sitting position he
found among 1,035 children not one who preserved the lumbar
curve. The children of the sample were asked to sit up,
that is with conscious muscular tension, and he measured a
mean lumbar curve in the sample group of 30.5 degrees.
PAGE 36 SEATED WORKING PDSTTTRP;
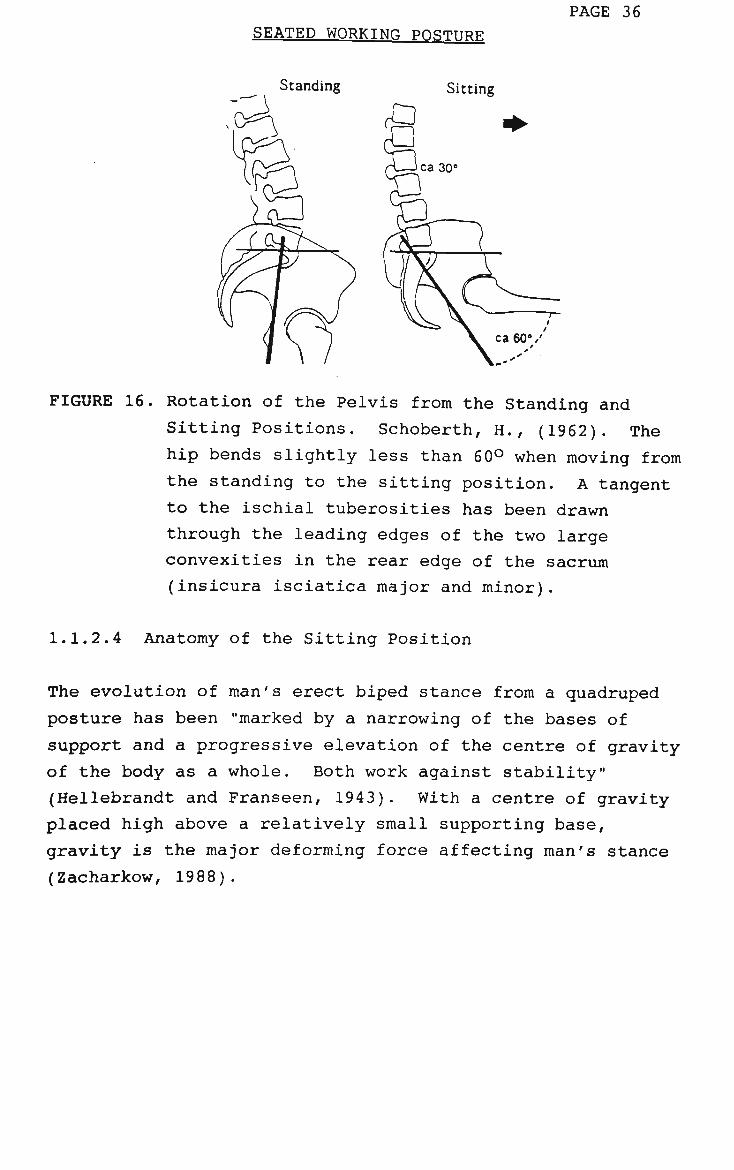
FIGURE 16. Rotation of the Pelvis from the Standing and
Sitting Positions. Schoberth, H., (1962). The
hip bends slightly less than 60° when moving from
the standing to the sitting position. A tangent
to the ischial tuberosities has been drawn
through the leading edges of the two large
convexities in the rear edge of the sacrum
(insicura isciatica major and minor).
1.1.2.4 Anatomy of the Sitting Position
The evolution of man's erect biped stance from a quadruped
posture has been "marked by a narrowing of the bases of
support and a progressive elevation of the centre of gravity
of the body as a whole. Both work against stability"
(Hellebrandt and Franseen, 1943). With a centre of gravity
placed high above a relatively small supporting base,
gravity is the major deforming force affecting man's stance
(Zacharkow, 1988).
PAGE 37 SEATED WORKING POSTURE
In the idealised erect resting posture when standing, a line
of gravity is considered to be located in the middle line
between the following points (Basmajian, 1978; Woodhull et
al 1985) :-
i. The mastoid processes;
ii. A point just in front of the shoulder joint;
iii. A point just behind the centre of the hip joints;
iv. A point just in front of the knee joints;
v. A point approximately 5 to 6 centimetres in front
of the ankle joints (Woodhull et al, 1985) Klausen,
1965; Hellebandt et al, 1938).
- < & •
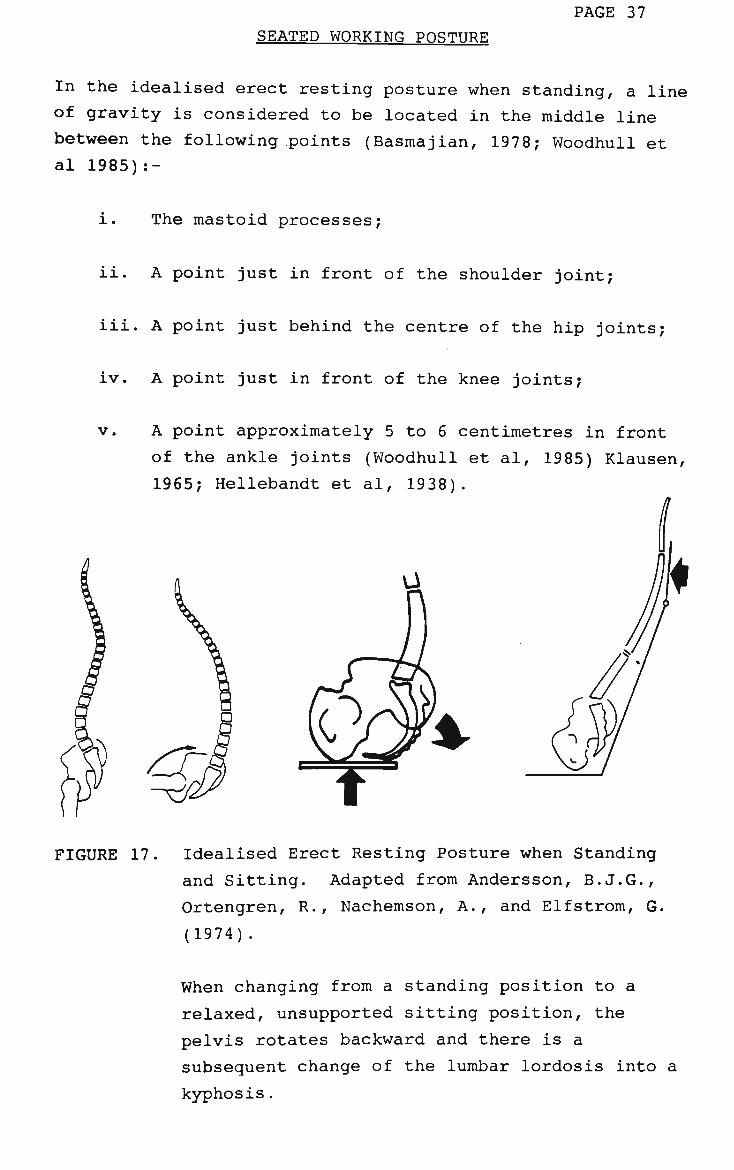
FIGURE 17. Idealised Erect Resting Posture when Standing
and Sitting. Adapted from Andersson, B.J.G.,
Ortengren, R., Nachemson, A., and Elfstrom, G.
(1974) .
When changing from a standing position to a
relaxed, unsupported sitting position, the
pelvis rotates backward and there is a
subsequent change of the lumbar lordosis into a
kyphosis.
PAGE 38 SEATED WORKING POSTURE
If the major weight bearing area on the seat is
posterior to the ischial tuberosities, there
will be localised pressure over the coccyx.
Where there is concavity to the backrest, the
result will be difficulty in maintaining
contact with the lumbar support with poor
pressured distribution over the seat and
backrest.
The muscular activity required at the major body joints to
achieve such idealised standing posture is required of the
ankle joint, the knee joints, the hip joints and the spine.
To understand the problems of the sitting position it is
necessary to study the anatomical changes when a person
moves from standing to a single position. Mandal (1985)
comments that medical and paramedical training has never
included more than "normal anatomical position which
corresponds closely to the military position of attention -
an unusual interest since this is not a position anyone
would naturally choose to stand in".
Medical knowledge of human anatomy evolved from dissections
carried out at the beginning of the 16th Century in Europe,
the time when the first serious attempts were made to find
out how human insides were structured and how the
physiological process worked (Mandal, 1985; Keegan, 1953;
Akerblom, 1948). It is reported by Mandal (1985) that
during the Renaissance period in England dissections were
carried out in public as form as entertainment or as a form
of medical learning, by the barbers. The group formed the
college of Barber-Surgeons and a leading Barber-Surgeon John
Banister is shown illustrated in Mandal's treatise (1985) at
work teaching anatomy in 1581. Mandal states that the
bones, ligaments and muscles of the body were depicted, and
such drawings have later been rotated 90° degrees to
demonstrate what is called "the normal anatomical position".
The position of a body on a mortuary table was viewed as
normal, and interest in the position that most humans adopt
for most of the day - the sitting position, has been
generally ignored.
PAGE 39 SEATED WORKING POSTURE
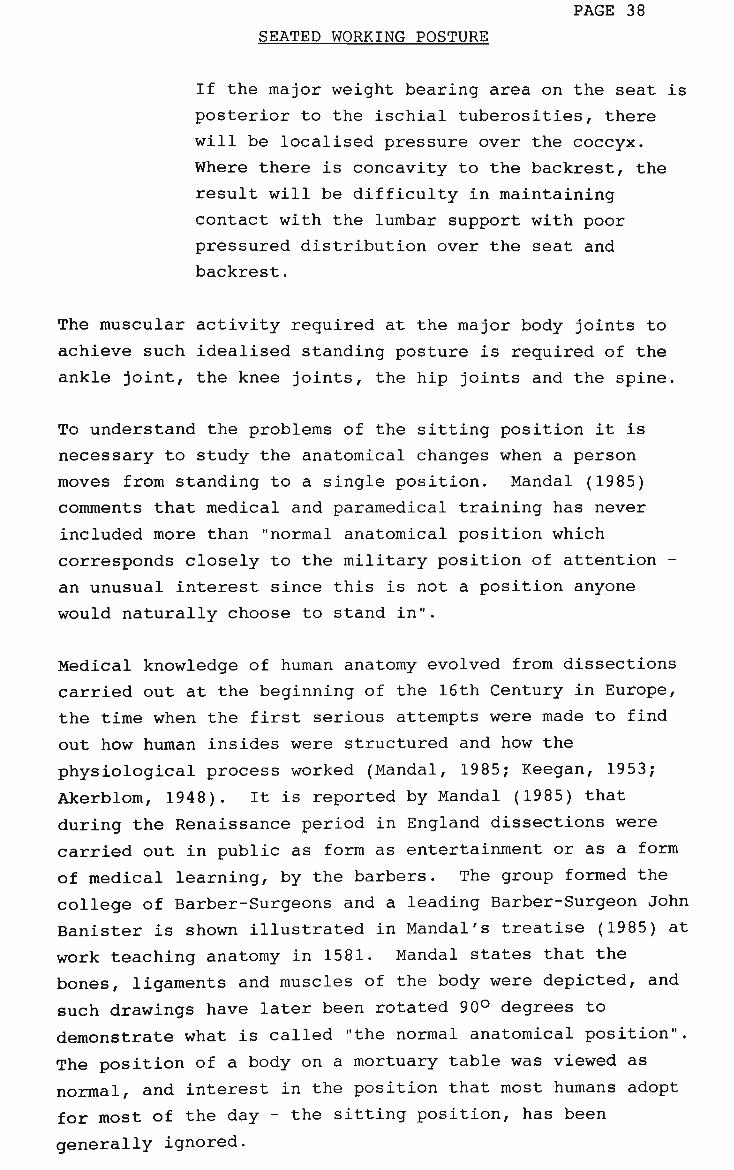
FIGURE 18. Barber-Surgeon John Bannister at Work teaching
Anatomy in 1581.
Reproduced from "the Seated Man, homo Sedens".
A.C. Mandal, 1985.
A small number of internationally respected experts mainly
from the medical profession and predominantly orthopaedic
surgeons, have in the past 30 or so years shown considerable
interest in the anatomy of the sitting position. (Akerblom,
1948; Keegan, 1953; Schoberth, 1962).
When an individual goes from a standing to relaxed,
unsupported sitting position the pelvis rotates backwards
and there is a subsequent change of the lumbar lordosis into
a kyphosis. This pelvic rotation is due is part tension of
the hip extensors as the hips are flexed (Keegan 1953, 1964;
Carlsoo 1972).
However, the major pelvic rotation upon sitting does not
begin until after the buttocks are resting on the seat.
This backward rotation of the pelvis is mainly due to the
posterior rocking over the ischial tuberosities that occurs
as the gravity line trunk comes to line posterior to the
ischial tuberosities (Akerblom, 1948).
PAGE 40 SEATED WORKING POSTURE
The amount of backward pelvic rotation that occurs when
going from a standing to a relaxed unsupported sitting
posture has been investigated by Andersson et al 1979 and
Akerblom (1948). Based on data from 80 individuals age
range from 21 to 44 years, Andersson etal (1979), reported
average pelvic rotation of 28 degrees. Akerblom (1948)
reported an average pelvic rotation of 35 degrees, from a
study involving 32 individuals. Schoberth (1969) stressed
that the shape of the spine in "sitting" depends directly on
the position of the pelvis.
Even though the thighs have changed from a vertical to a
horizontal position when going from standing to a relaxed,
and supported sitting posture, the actual hip flexion that
occurs is not 90 degrees. It is not unusual to find that
only 50 to 60 degrees of actual hip flexion in a relaxed
unsupported sitting posture (Akerblom, 1948); Schoberth,
1962; Carlsoo, 1972). Lumbar flexion or kyphosis that
occurs in relaxed, and supported sitting is necessary in
order for the individual to assume an upright posture after
the pelvis has rotated backwards (Straaser, 1913; Akerblom,
1948). This flexion involves mainly the lower three lumbar
segments, (Andersson et al, 1979, Schoberth, 1962; Akerblom,
1948) .
Based on data from 25 individuals, from age range 5 to 41
years, Schoberth (1962) found an average total flexion of
30.4 degrees from lumbar segments L III - L IV, L V - S 1
when going from a standing to a relaxed, unsupported sitting
position. Overall, Andersson et al. (1979) found an
average decrease in the lumbar lordosis of 38 degress of
which 28 degrees was due to pelvic rotation.
PAGE 41 SEATED WORKING POSTURE
The relaxed kyphotic sitting posture described is not the
only unsupported sitting posture capable of being assumed by
the individual. For example, one can counteract the
backward pelvic rotation and lumbar kyphosis with an active
tightening of the erector spinae musculature, resulting in a
either a straight or lordotic sitting posture (Keegan,
1953) .
The actual unsupported sitting posture assumed depends on
various factors such as the mobility of the hips, the
mobility of the spine, the individuals habitats and the
individuals fatigue level (Zacharkow, 1988).
Schoberth (1962), describes three basic unsupported sitting
postures differentiated by the centre of gravity of the
trunk and the percentage of body weight transmitted by the
feet to the floor. These three sitting postures are most
easily observed when sitting on a flat surface without a
backrest, feet flat on the floor and with thighs horizontal
and the lower legs vertical.
In the middle position, the centre of gravity of the trunk
is above the ischial tuberosities, and the feet transmit
approximately 25% of the body weight to the floor. When
sitting relaxed in this posture, the lumbar spine is either
in a slight kyphosis or straight. However, with an active
contraction of the erector spinae musculature, a more bright
middle position will result, with the lumbar spine changing
to either straight or lordotic. The more lordotic the
upright posture the more the pelvis will rotate forwards
with corresponding anterior shift of the trunk's gravity
line.
SEATED WORKING POSTURE
PAGE 42
In the anterior position, centre of gravity of the trunk is
anterior to the ischial tuberosities and the feet transmit
more than 25% of the body weight to the floor. This
forwards leaning posture can be assumed from the middle
position in either of 2 ways (after Andersson et al, 1975) -
i. with little or no pelvic rotation but maximum
flexion of the spine (after Andersson et al, 1975);
ii. by a forward rotation of the pelvis, keeping the
lumbar spine in either slight kyphosis/or in
lordosis.
The degree of straightening lordosis of the lumbar spine in
this posture would depend on several factors including the
extent of conscious activation of the erector spinae
musculature and the degree of hip mobility.
In the posterior sitting position, the centre of gravity of
the trunk is above or behind the ischial tuberosities, and
the feet transmit less than 25% of body weight to the floor.
Posterior position is obtained from the middle sitting
position by a backwards rotation of the pelvis, resulting in
a kyphosis of the lumbar spine (after Andersson et al,
1975). In this posterior sitting position, the greater the
backwards rotation of the pelvis, the greater the posterior
shift of the trunk's gravity line behind the ischial
tuberosities.
The shape of the lumbar spine is usually the same in the
most frequently observed anterior and posterior sitting
positions. The lumbar spine is in a marked kyphosis and the
erector spinae muscles are relaxed, with the spine being
supported by the posterial ligaments (Akerblom, 1948;
Carlsoo, 1948; Floyd and Silver, 1955).
PAGE 43 SEATED WORKING POSTURE
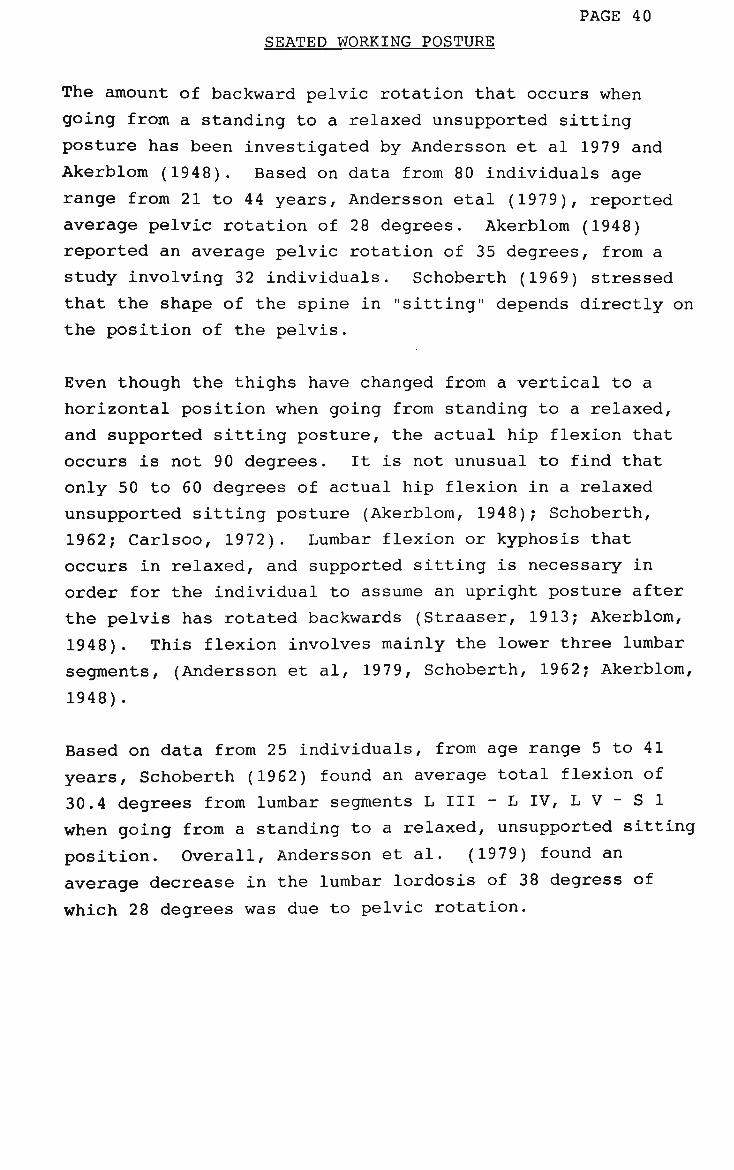
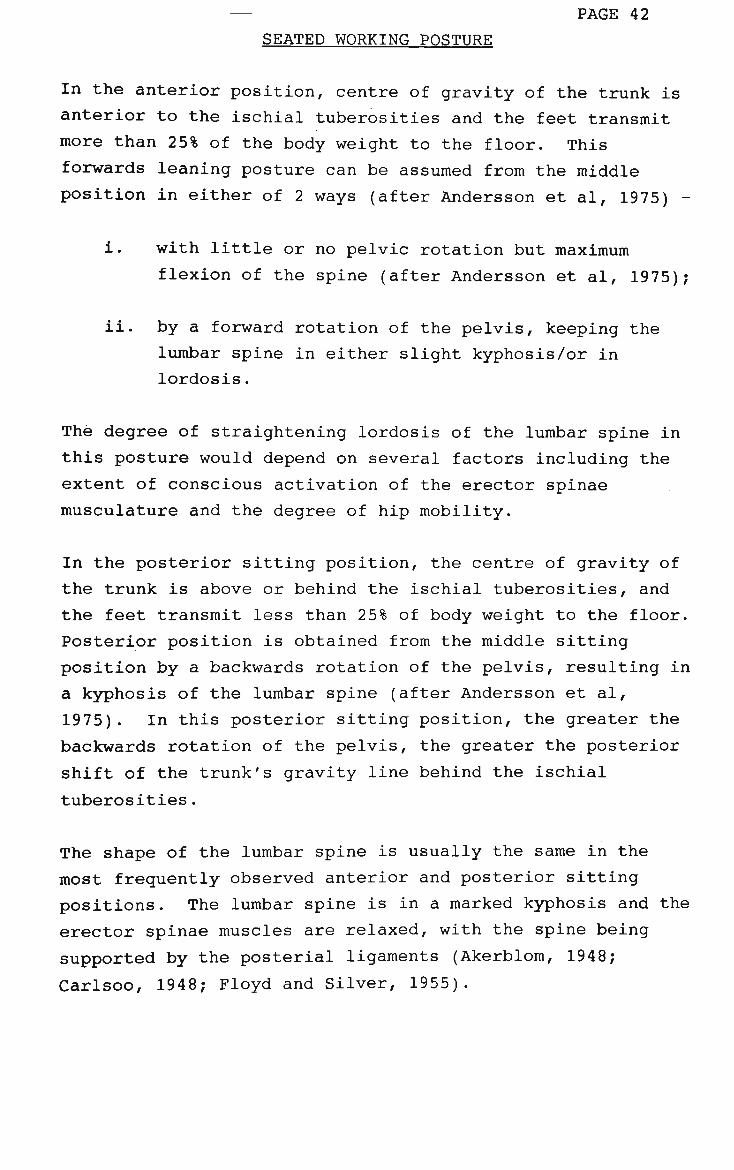
FIGURE 19. Pelvis Rotation of the Lumbar Spine Moving from
the Standing to the Sitting Position.
Akerblom, B., 1948.
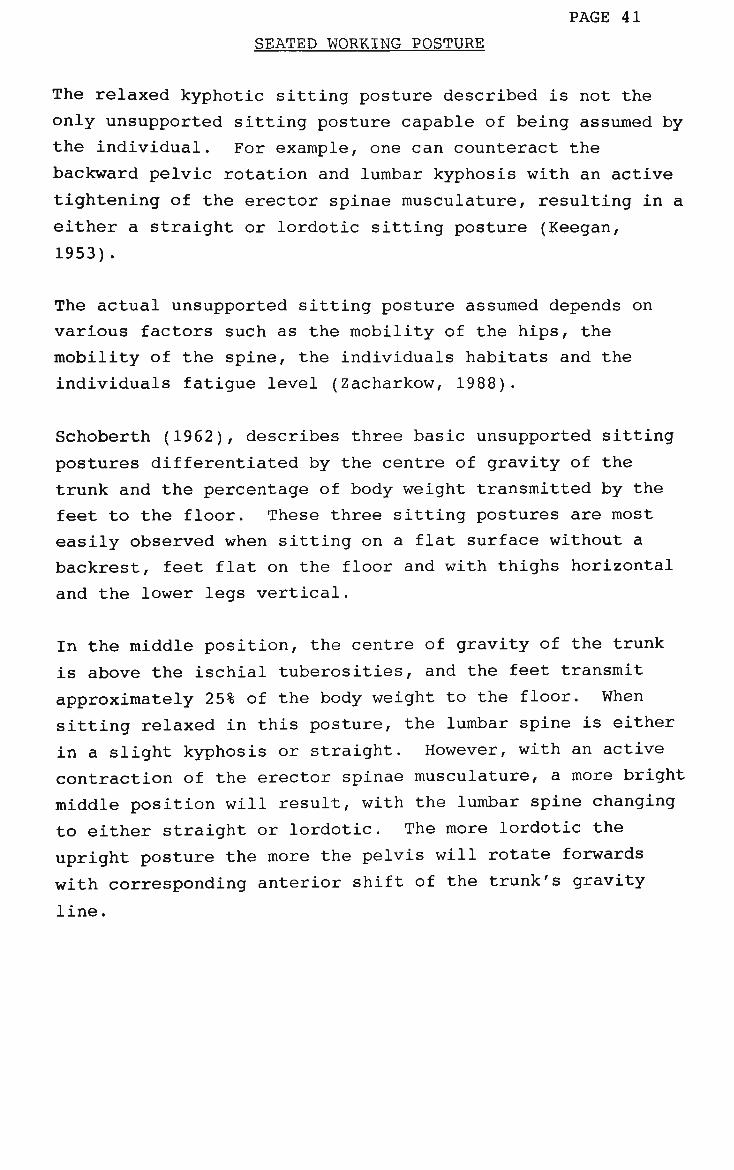
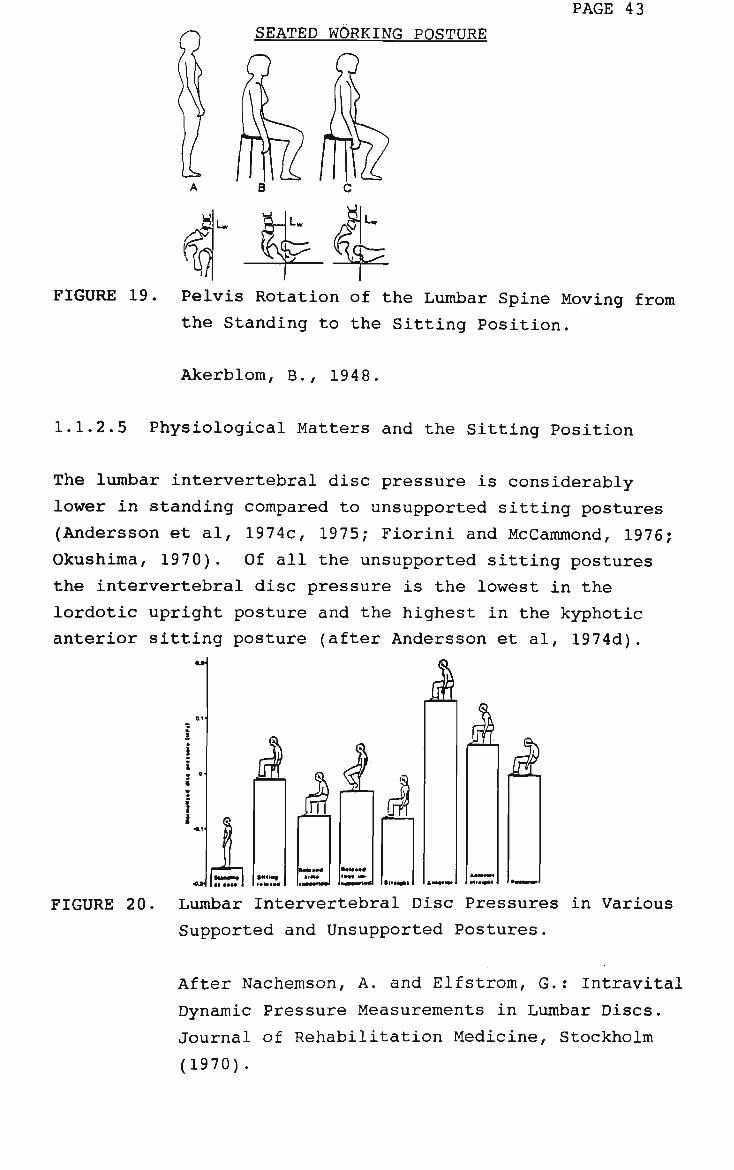
1.1.2.5 Physiological Matters and the Sitting Position
The lumbar intervertebral disc pressure is considerably
lower in standing compared to unsupported sitting postures
(Andersson et al, 1974c, 1975; Fiorini and McCammond, 1976;
Okushima, 1970). Of all the unsupported sitting postures
the intervertebral disc pressure is the lowest in the
lordotic upright posture and the highest in the kyphotic
anterior sitting posture (after Andersson et al, 1974d).
FIGURE 20. Lumbar Intervertebral Disc Pressures in Various
Supported and Unsupported Postures.
After Nachemson, A. and Elfstrom, G.: Intravital
Dynamic Pressure Measurements in Lumbar Discs.
Journal of Rehabilitation Medicine, Stockholm
(1970).

PAGE 44 SEATED WORKING POSTURE
According to Zacharkow (1988), the following factors are
considered responsible for the change in disc pressure from
the standing to the unsupported sitting position.
1. Compared to erect upright standing, in relaxed
unsupported sitting, the pelvis is rotated
backwards with a flatening or reversal of the
lumbar lordosis. The gravity line of the upper
body, already anterior to the lumbar spine in erect
standing, will shift further forwards. This
results in a long lever arm for the force exerted
by the weight of the trunk, producing an increased
torque in the lumbar spine. If the trunk is bent
forwards, this torque will increase even further
(Lindh, 1980; Frankel and Nordin, 1980). With
active contraction of the erector spinae
musculature and a more upright sitting posture, the
intervertebral disc pressure will be reduced as
compared to a relaxed middle or posterior sitting
position. This is because as the backward pelvic
rotation and lumbar flexion are reduced, the lever
arm for the force exerted by the weight of the
trunk will be shortened (Lindh, 1980).
2. In the normal lordotic standing posture, the
intervertebral compressive forces are shared
between the discs and the facet joints.
Approximately 16% of this compressive force is
carried by the facet joints when standing (Adams
and Hutton, 1980). The facet joints will not take
any of this load in kyphotic sitting postures,
resulting in higher compressive loads on
intervetebral discs. (Zacharkow, 1988).
3. Further reason for the increased intervertebral
disc pressure with unsupported kyphotic sitting
postures would be the greater deformation of the
disc in these postures, compared to the normal
physiological shape of the disc in lordosis
(Andersson et al, 1974c).

SEATED WORKING POSTURE
PAGE 45
4. In addition, a drop in the normal resting intra
abdominal pressure when sitting with lax lower
abdominal muscles would also increase the spinal
loading and disc pressure (Frymoyer and Pope, 1978;
Armstrong, 1965). This is an important factor that
is often overlooked.
All unsupported sitting postures are basically unstable
without further external support (Meyer, 1873). This is due
to pelvic instability inherent in unsupported sitting (Coe,
1983). The hip joints are in an intermediate position, and
the "upper part of the body cannot be locked relative to the
thighs by any form of passive checking mechanisms"
(Akerblom, 1948). The balance is therefore maintained by
the muscles of the hip joint and trunk.
When, in the middle sitting position with the centre of
gravity of the trunk directly over the ischial tuberosities
the position is one of unstable equilibrium since the
ischial tuberosities, with their narrowed, curved surface,
provide only a linear support (Helbig, 1978; Meyer, 1873).
An individual can slump into a posterior sitting position,
which will relax the back musculature, (Schoberth, 1962;
Karlsoo, 1962; Andersson et al 1974a). Stability will be
improved due to the additional supporting service provided
by the coccyx, the sacrum, and the posterior buttocks. With
the gravity line now shifted the posterior to the ischial
tuberosities, the psoas major will become the main
antigravity muscle (Keagy et al, 1966).
SEATED WORKING POSTURE
PAGE 46
Leaning back more than a few degrees without external
support (such as a backrest or backward placement of the
hands) becomes a very unstable posture since there is
minimal weight bearing on the legs. To maintain such a
posture also requires increased activity from the rectus
abdominis muscle and the neck musculature (Asatekin, 1975;
Cotton, 1904). Stretching of the arms and legs forwards can
also help the individual to barely maintain this posture
(Meyer, 1873; Akerblom, 1948).
In a lordotic upright sitting posture, the gravity line of
the head passes anterior to the cervical spine, thereby
requiring slight to moderate activity of the poterior neck
musculature to counteract the tendency for the head to
incline forwards (Steen, 1966).
With a slumped, kyphotic sitting posture, the gravity line
of the head will pass further anterior to the cervical
spine, and there will be an increased demand placed on the
poterior neck musculature (Jones et al, 1961; Gray et al,
1966; Bunch and Keagy, 1976). An increase in neck muscle
activity will also be required to keep the head erect and
gaze horizontal (after Bunch and Keagy, 1976). The greater
the slump and the thoraco lumbar kyphosis, the greater will
be the forward thrust of the head, resulting in a marked
increase in activity from the upper trapezius and other
posterior neck musculator (Gray et al, 1966). A greater
than 50% increase in muscle tension at the back of the neck
has been reported when going from an erect sitting posture
(Gray et al, 1966).
The alteration in the shape of the cervical spine in a
slumped, kyphotic sitting posture would probably resemble a
contour described by Inglemark (1942). From radiological
examinations of 16 patients with pain in the middle and
lower neck and trapezius muscle tenderness, Inglemark,
(1942) found an absence of the normal cervical lordosis at
the C IV C VII level, and hyperlordosis above the C IV
level.
SEATED WORKING POSTURE
PAGE 47
Compared to a middle sitting position (upright and erect
trunk posture), the stability is improved as the individual
leans forward into an anterior position. This is due to the
increased supporting surface provided by the upper posterior
thighs and the increased body weight of the feet with this
posture. However, without external support, as the gravity
line is shifted anterior to the ischial tuberosities, the
erector spinae and hip extensor muscles must contract
prevent trunk from falling forwards, (Cotton, 1904,
Akerblom, 1948; Schoberth, 1962; Andersson et al, 1974a).
With extreme spinal flexion, the erector spinae will relax
and only hip extensor activity will be required to maintain
this posture (Akerblom, 1948; Floyd and Silver, 1955; Floyd
and Roberts, 1958; Carlsoo, 1972).
If there is external support, the erector spinae and hip
extensor muscle activity can both be relieved, and the
anterior sitting position can become the most stable
(although not physiologically the most beneficial
unsupported sitting posture). Examples of such external
support are as follows (Meyer, 1873,) -
1. The hands and forearms are supported on the thighs;
2. The anterior trunk is supported by the edge of the
table;
3. The arms are supported on a table.
As the gravity line of the head is also move anterior to the
cervical spine with the anterior sitting postures, there
will be also be an increased stress placed on the posterior
neck musculature.
SEATED WORKING POSTURE
PAGE 48
1.1.2.6 Studies of Seated Working Posture
Besides the various types of visual display work, continuous
or dynamic postures are also characteristic of other office
jobs such as full-time typing the operating of accounting
machines, and reading writing tasks traditionally conducted
in commercial enterprise (Hunting et al, 1981; Maeda et al,
1982; Grandjean, 1984c). For example, Maeda et al (1982)
described the typical posture of an accounting machine
operators as "a continuous sitting posture of the neck and
head tilted forward and to the left with some rotation of
the head to the left to orient the visual line to the
receipts, the left hand being used to turn over the
receipts, and the right hand being rapidly used to operate
the numerical keyboard".
The most frequent musculoskeletal complaints of visual
display terminal (VDT) operators have been found to involve
the neck, neck-shoulder region and back (Cakir et al, 1979;
knave, 1983). The arms, wrists and hands are also sites for
musculoskeletal complaints (Arndt, 1982, 1983; Sauter et al,
1983, 1984; Smith, 1984a; Ostberg, 1979; Ong et al, 1981;
Cakir, 1980; Elias et al, 1983; Kukkenel, 1984).
Musculoskeletal complaints have even been reported among VDT
operators with minimal job dissatisfaction and minimal
psychosocial stress (Smith, 1985).
However, it is important to realise that the musculo -
skeletal complaints associated with the use of VDT's and
other office machines have usually been found in work
settings characterised by poor work station design and poor
sitting postures (Hunting et al, 1981; Ong et al, 1981;
Starr et al, 1982; Maeda et al, 1982; Sauter et al, 1983).
PAGE 49 SEATED WORKING POSTURE
Factors such as non-detachable keyboards, an increased
forwarding inclination of the head, and the lack of proper
arm and back support have been corelated in the studies
aforementioned, with an increased incidence of
musculoskeletal complaints. Also, poor head posture the
work station may also reflect the individual's chronic
sitting and standing postural habit patterns. Neck pain and
headache may also result from the awkward head and neck
posture observed when VDT operators rest a telephone
receiver between the neck and shoulder, while handling
customer enquiries as they type at the keyboards (Travers
and Stanton, 1984; Travell, 1967).
An issue involves the conflicting recommendations that are
given in various VDT articles, brochures, books,
international standards, and those such as issued in the
United States of America, Europe, Great Britain, Australia
and Scandanavia, in regards to proper sitting posture, arm
posture, desk height, keyboard slope, etc at the VDT
workstation.
Upon closer examination, it can be realised that a complex
inter relationship exists among the observed VDT workstation
posture and other workstation factors including -
the inclination and height of the chair backrest;
the keyboard slope and the height from the floor;
the use of an inclined document holder;
the use of forearm supports and the size of such
supports;
the availability of seat tilt and the range of tilt
in the seat of the chair;
the hand links of the operator, (after Zacharkow,
1988).
SEATED WORKING POSTURE
PAGE 50
The international viewpoint in VDT workstation
recommendations is based on a sitting posture with the trunk
in a vertical position, forearms horizontal and the upper
arms vertical. A chair with a low backrest, high enough to
provide lumbar support, is considered adequate for this VDT
sitting posture (Cakir et al, 1980). To achieve this
posture, it is also stressed that the keyboard should have a
minimal thickness, along with very little slope usually
close to 5 degrees. (Knave et al, 1983).
After a short time, due to the inherent instability of a
vertical trunk posture, the operator must seek further
stability from the workstation, (Grandjean et al 1983a). A
forward leaning posture may be adopted, where the operator
can obtain better trunk support by resting the arms on the
desk. A very low back rest height and the lack of an
inclined document of both facilitate a forward leaning
posture. There are also certain VDT tasks such as customer
service counter work, were the operator needs to lean
forward to the customer. (Launis, 1984; Grandjean,1984c).
In the majority of VDT tasks, the operator does not have to
lean forwards towards a client. In such job settings
completely different forearm posture has been frequently
observed. Even on chairs not designed for reclined postures
the VDT operators have been observed to lean backwards on
their chairs (Grandjean et al, 1983a). In addition to
leaning the trunk backwards, commonly observed arm postures
do not involve having the upper arms vertical and the
forearms horizontal. Instead, the shoulders are usually
flexed from 0 to 30 degrees, and the forearms are elevated
from 5 to 30 degrees (Arndt, 1982, 1983).
PAGE 51 SEATED WORKING POSTURE
In field studies by Granjean et al, 1983a) with an
adjustable VDT workstation, the majority of VDT operators at
data entry work in conversational terminals preferred a
backward leaning trunk posture of 10 to 20 degrees from
vertical. The "mean body posture" of the VDT operator
included a 14 degree trunk inclination, with the forearms
elevated 14 degrees, and the shoulders flexed 23 degrees.
As Grandjean (1984c), commented, "many VDT operators in
offices disclose postures very similar to those of car
drivers. This is understandable - who would like to adopt
an upright trunk posture when driving a car for hours?".
According to Grandjean (1984c), the backward leaning trunk
posture is the basis for all the other adopted postural
elements of the VDT operators (including the flexed
shoulders with inclined forearms and the slightly opened
elbow angles beyond 90 degrees. It is therefore important
to detail several inter-related workstation features that
will help facilitate this backward leaning posture with
elevated arms (Zacharkow, 19 88) -
1. A backward leaning trunk posture will be
facilitated by a chair with a high back rest
providing upper back support, along with an
adjustable back rest inclination that can be fixed
at any angle by the operator. Pressure should be
avoided, over the outer part of the scapulae and
the shoulders (Taylor, 1917).
2. A major reason for the elevated forearm posture
probably relates to the slope of the keyboard.
There will be optimum efficiency of arm and wrist
movements with the forearm angle matching the
keyboard angle (Arndt, 1983). Therefore, with
greater keyboard slopes, one will probably observe
a greater elevation of the forearms (Arndt, 1983).
PAGE 52 SEATED WORKING POSTURE
3. With an inclined document holder, Life and Pheasant
(1984), reported a tendency to lean the trunk
backwards and to flex the shoulders forward.
4. Keyboards with forearm supports also help
facilitate a backwards leaning trunk posture.
Compared to small supports, large forearm supports
have been found to result in a greater trunk
inclination and elevation of the arms along with
greater pressure being exerted on the supports
(Nakaseko et al, 1985).
Proper forearm support is essential for maintaining an
elevated arm posture. Keeping the upper arms elevated
forwards without proper forearm support will produce a high
torque about the shoulder joints. Resulting musculo
skeletal stress could then only be reduced by leaning the
trunk forwards from the backrest, thereby reducing the
postural torque about the shoulder joints (Nakaseko et al,
1985); Zacharkow, 1988).
Proper arm support can also reduce the loading of the lumbar
spine and the lumbar interveterbral disc pressure as the
weight of the arms will be taken by the arm supports
(Occhipinti et al, 1985; Andersson and Ortengren, 1974b).
In addition, with a large forearm support one would be able
to exert greater pressure against the support, which will
help extend the upper trunk. This will help to facilitate a
backward leaning trunk posture with greater support being
obtained from the backrest of the chair (Nakaseko et al,
1985). The resulting posture will further help reduce the
lumbar intervertebral disc pressure (Zacharkow, 1988).

PAGE 53
SEATED WORKING POSTURE
A forwards leaning posture at an office workstation with an
unsupported lower spine has been corelated with an increased
incidence of neck and back pain (Maida et al, 1980a; Ong et
al, 1981; Sauter, et al 1983). With ergonomic improvements
at a workstation kyphotic forward bending postures have been
found to be almost totally eliminated as the VDT operators
were observed to spend most of the sitting time with the
trunk supported by the backrest of the chair (Cantoni et al,
1984) .
Proper back support, arm support and foot support are
critical for optimal body stabilisation (Darcus & Weddell,
1947; Branton, 1969; Kroemer, 1982; Nakaseko et al, 1985).
An increase in operator performance has been observed in
several studies after various ergonomic improvements
contributing to operator stability, such as non-flexible
backrest with lumbar supports, footrests and the use of
inclined arm supports (Rohmert and Luczak, 1978; Ong, 1984;
Secrest and Dainoff, 1984).
To allow a backwards leaning posture of the trunk with
proper spinal support, an operator's chair should not only
supply proper pelvic-sacral support, but should also have a
backrest high enough to provide thoracic support. The back
rest should also have an adjustable inclination, that can be
fixed at any angle preferred by the operator (Grandjean,
1984b; Sauter et al, 1984).
The following factors will all help the operator obtain
proper back support and trunk stabilisation from a high
inclined backrest -
1. An inclined seat surface with non-slippery
upholstery cover.
2. Large forearm support (Nakaseko et al, 1984).

PAGE 54 SEATED WORKING POSTURE
3. Adjustable inclined document holder (Ferguson and
Duncan, 1974; Life and Pheasant, 1984);
4. A detachable keyboard (Sauter et al, 1983);
5. Proper foot support with either the feet placed on
the floor or else on a footrest (Coe, 1984).
Footrests maybe required particularly by smaller stature VDT
operators, either when using chairs with an in adequate seat
height adjustment, or when at a VDT table that is too high
or is non adjustable.
Important considerations in footrest design for proper body
stabilisation and comfort are the following (based on
(Benz et al, 1983, Cakir et al, 1980; Bell Telephone
Laboratories, 1983; Schmidtke, 1984; Ruhmann, 1984; Marriott
and Stuchly, 1986) -
i. non-slip upper and lower surfaces are
necessary to properly stabilise the feet on
the footrest, and the footrest on the floor;
ii. the footrest should be adjustable in height
and inclination. Fixed footrests also need to
be adjustable in the horizontal distance from
the operator;
iii. a fixed footrest should be securely attached
to the table or floor. With a moveable
footrest, a non slip floor covering is
critical;

PAGE 55 SEATED WORKING POSTURE
iv. a footrest should have a large enough surface
to allow changes in foot position. This is
critical, as the main disadvantage of a
footrest is the restriction of leg movement
compared to having the feet firmly and
comfortably on the floor with degrees of
freedom of movement for performance and
comfort by the operator (Kotelmann, 1899;
Shaw, 1902; Kerr, 1928; Sauter et al, 1984).
1.1.2.7 Seated Working Posture and Design Implications of
Work Stations
"In regard to the sitting posture, I believe the time will
come when we will have to comform our chairs to the
individual rather than the individual to the chair"
(Meisenbach, 1915).
The proper desk inclination and desk-chair relationship are
critical to ensure erect posture of the head, neck, and
trunk (Bendix and Hagberg, 1984; Weber et al, 1986). Neck
muscle tension forces and cervical compression forces will
be reduced with an inclined desk (Less and Eickelberg,
1976).
Back rest designs that push the shoulders forward will
increase the upper thoracic kyphosis and result in a forward
position of the head (Hawley, 1937).
Proper arm support is critical to promote extension of the
upper thoracic spine, along with the more erect head and
neck posture. In addition, proper arm support can
significantly reduce the trapezius muscle load (Mahlamaki
and Granstrom et al, 1985; Kvarnstrom, 1983; Avon and
Schmitt, 1975). This is critical for supporting elevated
arms in various work situations, thereby reducing the static
load on the shoulder and neck muscles (Westgaard and Aaras,
1984) .
SEATED WORKING POSTURE PAGE 56
There are several ways of achieving proper arms support, such as -
i. on the desk, if there is a proper chair - desk
relationship;
ii. upon the forearm support of a keyboard;
iii. from armrests attached the work surface (Rohmert
and Luczak, 1978);
iv. from armrests on the chair;
v. with hands in the lap.
(after Zacharkow, 1988).
It is critical that armrests are adjustable to provide
proper support for the specific task requirements. Lack of
adjustability is generally a fault in the current armrest
designs available for chairs. Armrest adjustments are
needed in height, angle of inclination, fore-aft adjustment,
and adjustability and distance between the armrests (Aaras,
1983).
Thomas Goldthwait, 1922, considered three factors to be
critical in maintaining an erect trunk posture when sitting:
1. Maintain a normal axial relationship of the thorax
and the pelvis;
2. The ribs and chest must be raised to the normal
position;
3. The head must be held in the normal position.
Critical chair design feature needed to fulfil the first two
factors is a proper back rest support over the T9 through to
LI region of the spine. Proper back support will promote
spinal extension along with stabilisation of the thorax
(Vulcan et al, 1970).
PAGE 57 SEATED WORKING POSTURE
The inferior angle of the scapula is located opposite the
8th thoracic vertebra (Lovett, 1916; Basmajian, 1977). This
would indicate that critical back support should be located
just below the shoulder blade.
Rathbone, 1934, felt that proper chair design with back
support to the spinal region could also improve standing
posture - "While the chair is holding the trunk in extended
position, the neuromuscular system is being patterned in a
desirable posture which can carry over into standing and
into movements".
However, without proper extension of the lower thoracic
spine, along with activation of the lower abdominals, there
will be a decreased resting intra-abdominal pressure and a
lowering abdominal viscera. The resulting relaxed and
protruding lower abdomen will then cause the pelvis to
gradually migrate forwards on the seat. Proper axial
relationship of the thorax and pelvis will be lost, along
with the loss of pelvic and trunk stabilisation. The sitter
will then spontaneously search for other less healthy means
of postural stabilisation (Mosher, 1899).
It is critical for the backrest to provide proper pelvic
stabilisation (Cohn, 1886; Branton, 1969; Schoberth, 1969).
This will reduce or prevent backwards rotation of the
pelvis, along with having a beneficial effect on the lumbar
spinal posture. The shape of the lumbar spine when sitting
depends directly on the position of sacrum and pelvis,
support must be given to the upper sacrum and posterior
iliac crests (Cohn, 1886; Schoberth, 1969, Oxford, 1973;
Wilder et al, 1986).
PAGE 58 SEATED WORKING POSTURE
The commonly placed lumbar support, designed to fit the
lumbar concavity, will loose contact with the spine as the
individual leans forwards away from the backrest. Proper
pelvic-sacral support, can still provide pelvic
stabilisation in a forward leaning posture (Cotton, 1904,
1905; Schoberth, 1969).
According to Cotton, 1904, in leaning forwards there is "a
slight rocking of the pelvis, in attendancy of the pelvis to
slide back (on the yeilding flesh of the buttocks) in such a
way that the back is still in contact with the support, and
it may be definitely steadied by this support if it is
properly curved. This point seems to have been overlooked.
Of course, unless there is a free space beneath the lower
edge of the back-rest no such motion occurs - an important
reason in favour of leaving such a space free".
Additional pelvic stabilisation will be provided by the
following chair features (Hoppenfeld, 1976):
i. an inclined seat (Akerblom, 1948; Murrell, 1965;
Ayoub, 1972);
ii. a slight concavity to the sitting surface for the
buttocks (Kroemer and Robinette, 1968);
iii. avoidance of seat cushioning that is to soft
(Kohara, 1965; Branton, 1966, 1970);
iv. avoidance of slippery, low surface friction seat
covers, (Branton, 1969; Schaedel, 1977);
v. the ability to have both feet firmly supported on
the floor (McConnel, 1933).
SEATED WORKING POSTURE
PAGE 59
Proper foot support when sitting is important for the
following reasons:-
i. pelvic stability will be enhanced when the feet are
firmly supported on the floor (McConnel, 1933);
ii. it will facilitate the use of the backrest
(Swearingen et al, 1962; Darcus and Weddell, 1947);
iii. it is critical to avoid posterior thigh compression
and the obstruction of venous blood flow from the
lower legs (Pottier et al, 1967, 1969; Morimoto,
1973);
iv. it will facilitate leg position changes, thereby
allowing a change in joint angles and muscle
tension at the hips, knees, and ankles along with
reducing venous blood stagnation in the lower legs.
A change in one's leg position can also temporarily shift
pressure for the ischial tuberosities (after Zacharkow,
1988).
According to Shipley (1980), "Too high a seat leaves the
feet dangling and unsupported, inducing the sitter to sit
forwards in order to plant his/her feet on the floor and so
avoiding excessive pressure of the underside of the thighs,
but at the expense of back support. Similar problems can
arise from seats being too deep".
SEATED WORKING POSTURE
PAGE 60
In regards to school children, Cohn (1886), observed that
when the feet are dangling "... the child soon grows tired.
He/she tries to reach the floor with the tips of his toes
at least; and in doing so he/she bends the thigh downward,
slides forward on the edge of the floor and presses his/her
chest on the edge of the table. A necessary result is a
further collapse of attitude."
Sitting of the front portion of the high seat will be both
an unstable and a fatiguing posture (Kroemer and Robinette,
1968). At the other extreme, the acute angle between the
thighs and trunk resulting from a very low seat height will
increase the flexion stress to the lumbar and thoracic
spine. The approximation of the thorax to the pelvis will
also increase the pressure on the abdominal viscera
(Aveling, 1879).
Leg position changes will be facilitated by -
i. the proper seat height (Akerblom, 1954; Andersson
and Ortengren, 1974);
ii. a proper seat depth. Freedom of leg movement will
be lost as the seat depth is increased (Ridder,
1959). However, a very short seat depth may feel
unstable and also result in a lack of surface for
free movement of the legs (Bennett, 1928).
iii. a rounded front edge to the seat, which will
prevent the front edge from cutting into the distal
posterior thighs with leg position changes (Keegan,
1953; Asatekin, 1975; Coe, 1979).
SEATED WORKING POSTURE
PAGE 61
Although footrests will be necessary for some individuals in
order to obtain proper foot support they do have some
disadvantages -
i. they limit the free movement of the individual's
legs. Holding the lower legs continuously in the
same position can be very fatiguing (Kotelmann,
1899; Shaw, 1902; Kerr, 1928);
ii. the footrest should have an inclination similar to
the seat inclination. Otherwise, a very acute
angle of the knees may result. (Kotelmann, 1899).
Intermittent leg exercises is important during prolonged
sitting to reduce the swelling and discomfort of the lower
legs (Winkel, 1981; Winkel and Jorgensen, 1986). Prolonged
passive sitting is also considered a causative factor in
venous thrombosis of the lower extremity (Homans, 1954;
Makris et al, 1986).
The movement of the seated worker at his desk/her desk made
possible on chairs with castors can help produce foot
swelling (Winkel and Jorgensen, 1986). However, castors can
also require increase static muscle work from the legs and
lower back in order to keep the chair in position,
especially on hard floors (Lundervold, 1951a; Damodaran et
al, 1980; Bell Laboratories, 1983).
Therefore, the type of castor and the type of floor covering
are both important factors.

PAGE 62
SEATED WORKING POSTURE
1. INTRODUCTION
1.2 REVIEW OF STANDARDS AND GUIDELINES
Standards, codes of practice and guidelines on the design of
furniture - principally tables and chairs, and the
appropriate setting or "correct" posture required of the
users, have been issued by governments, trade unions and
manufacturers of equipment and furniture.
The first international standard was issued by the
International Organisation for Standardisation (I.O.S.), as
document TL 136/SC7 in 1978. The Commite European de
Normalisation, Paris, France followed with a publication in
1980. The former purports to be a "postural standard"
whereas the latter a "furniture standard", but in practice
they are both used internationally for dual purposes by
health professionals and designers alike. Very similar
documents were produced by the Danske Arkitekters,
Copenhagen, Denmark, 1981, and by the Department of Defence,
United States of America as a military standard for the
North American Services Group, and known as MIL-STND-1472C,
revised 2 May, 1981.
Occupational health and safety standards incorporated the
postural data of the International Organisation for
Standardisation (1978) document from 1979, when the Swedish
Board of Occupational Safety and Health published a document
principally about the design of visual display terminals and
keyboards. German DIN standards followed in 1980/81 and in
the U.K. guidelines were released in 1983 (Helander and Rupp
1984). An International Organisation for Standardisation
committee, No. 159, has been meeting since 1983 and a
document is to be released by them for comment. A plethora
of publications about this subject followed embodying the
postural geometry of the I.O.S. (1978) standard.

PAGE 63 SEATED WORKING POSTURE
In Australia, the Working Environment Branch of the then
Department of Science and Technology, published simple
guidelines in a booklet entitled "V.D.U's at Work", first
published in 1981. The document incorporates the postural
geometry for seated work prescribed in the I.O.S (1978)
standard.
In 1983 the Australian Council of Trade Unions - Victorian
Trades Hall Council (ACTU - VTHC), circulated guidelines on
the use of screen-based equipment which included
recommendations for the "correct" seated working posture as
described by the I.O.S. (1978) standard. The Standards
Association of Australia set up Technical Committee SF/38 in
1983 at the request of the Australian Council of Trade
Unions (ACTU). However, by the time the committee met the
ACTU had withdrawn its support in favour of the then newly
formed National Occupational Health and Safety Commission,
who since has not issued any definitive advice on working
posture or on the use of screen based equipment. In the
meantime, the Standards Association of Australia has
proceeded without ACTU support and at the time of writing
has a standard published May, 1990 titled "Screen-based
workstations" and is presented in two parts representing
equipment and working environment matters. The seated
working posture depicted and described in the published
part 2 : Workstation furniture, is from the I.O.S. (1978)
model. (Whiteman, D., Research Officer, Standards
Association of Australia, personal communication, May,
1990).
As with other aspects of this area of study, standards and
guidelines from around the world vary in their use and
definition of the terminology. What is common between all
such documents is the seated postural geometry of the model
used and known as the "German Square", which depicts upright
trunk, 90 degree upper and lower limb geometry with head
erect and the subject viewing straight ahead.
PAGE 64
SEATED WORKING POSTURE
The documents though, differ in lineal dimensions applied to
"correct" or "ideal" working height(s) for the eyes above
the floor, shoulder acromion to the home row of keys (or pen
grip position), and viewing distance to copy. None of the
documents provides any data as to the origins of the
information about "correct" or "ideal" postural geometry for
seated work. No explanation is given of the science or
otherwise, involved in the derivation of the postural
angles, lineal dimensions, the relationship of seated work
to work station furniture and equipment, or the instruction
embodied in the "German Square" model that the posture is
basically a static one.

PAGE 65
SEATED WORKING POSTURE
1. INTRODUCTION
1.3 DISCUSSION OF STANDARDS AND GUIDELINES
Standards, guidelines, regulations, codes of practice and
recommendations collectively referred to as "standards" in
this paper, are issued by a variety of interested parties.
They are the user groups, trade unions, industry officials,
scientists and government bodies. The groups have different
needs, aims and accountabilities.
Typically, the designers and draughters of standards
represent widely separate groups whose interests are not
always congruent. The result has been that the rationale
forming the standard has not always been based on fact but
rather on consensus. This may be due to the optimum not
always being known; it may be changing or it may be
difficult to achieve either technologically or economically.
Thus the motivation and needs of the designers of standards
and of those who may endorse them, needs to be examined and
made clear. Political expediency on behalf of the sponsor,
may interfere with the policy, the design, and the
application of standards.
Once written, standards may effectively become precedents
when they are referred to in the common law. Standards tend
to be regarded as maxims when the intention of the draughter
is a minimum; unless written with care and consideration
they may not be compatible with technological change and may
be outdated before securing a useful publication life. The
process of upgrading or rewriting standards is lengthy and
is fraught with the same dangers of mixed motivations
encountered in the production of an original document.

SEATED WORKING POSTURE
PAGE 66
Unfortunately, standards have a habit of repeating
themselves insidiously as one group after another adopts
that which is first produced and replicates it. (Blucett,
1984) .
Assistance is needed by the general public who need fast,
expert advice, and so standards as a form of communication
have been developed. The standards referred to and reviewed
within this paper are all in use in various parts of the
world.
The earliest standard reviewed was published in 1979 by
I.O.S. and it has become the international standard for
seated working posture and for the design of furniture for
seated work. The so-called international standards
published by the I.O.S. (1979) and the C.E.N (1980), both
give very explicit and identical geometric guidelines for
seated work but differ in numerical values, as do the
standards that have since followed this familiar format.
That logical standards be produced is vital so that clear
parameters or ranges for the elements can be established and
relied upon. It is clear that they must be written to be
flexible enough to cope with a range of technologies.
Standards must not inhibit innovation and must be based on
the clearest evidence available. The needs of those using
standards varies greatly - from the designers and
manufacturers of equipment, to the users and the procurers
of workstation equipment; this diversity must be
accommodated by the draughters of standards.
Standards can generate important economical, sociological
and political consequences, particularly if they acquire the
status of mandatory requirements or become statutes of the
law.
Much of the responsibility for the production of concise and
accurate standards is firmly with the scientific community.
PAGE 67
SEATED WORKING POSTURE
1. INTRODUCTION
1.4 REASONS FOR RESEARCH
Zacharchow in "Posture: Sitting, Standing, Chair Design and
Exercise" (1988) summarised the characteristics of the three
basic unsupported sitting postures (after Andersson et al,
1975), and concluded that "there will be many variations in
the posture of the lumbar spine in the upright sitting
position". According to Akerblom (1948), "some of the
curves are very different from those obtained in the relaxed
position, while on the other hand there are a few cases in
which the curves are hardly to be distinguished from those
obtained in the standing position. However, they usually
show an intermediate position between standing and maximal
ventriflexion." Hooton (1945) in his survey of body
measurements for seat design concludes that the lumbar
lordosis "tends to be flattened practically to the vanishing
point in most subjects when they sit erect".
A common misconception is to consider sitting in a chair as
a static activity, as opposed to a dynamic activity
(Zacharkow, 1988). According to Brandon (1966), the sitting
body is "not merely an inert bag of bones, dumped for a time
in a seat, but a live organism in a dynamic state of
continuous activity".
That research and experimentation is required to confirm and
consolidate such views, is vital.
\
PAGE 68
SEATED WORKING POSTURE
The groups critically in need of information on seated
working posture and the design of furniture and ancillary
equipment that effect posture are the purchasers, the users,
trainers, trade unions and the manufacturers. Well-informed
purchasers, users, trainers and trade unions will demand
furniture and ancillary equipment that effect posture, of a
particular standard and will agitate for manufacturers to
produce such equipment. The task of ensuring that the
groups are appropriately informed is with the scientific
community, in government, academic institutions, and within
the health training industry. The need has been met in part
but the fundamental fault of the many standards and
guidelines about furniture design - anthropometry - seated
working posture, is that they are not based on good science.
The importance of laboratory - based research in
establishing postural principles for seated work is
paramount, but research about seated working posture in the
work place must be conducted to ensure appropriateness.
Recent research to date has been almost exclusively by
orthopaedic surgeons and has been largely been based in
laboratories using techniques that do not usually reflect
tasks of the seated worker.
Little is known about the relationship of the six main
angular elements of seated postural geometry - trunk
inclination, head inclination, arm flexion, elbow angle, arm
abduction and left ulnar abduction, to each other in the
terms of expectation and intrinsic safety, or about the link
between seated operator performance and comfort. The
effects of the three main lineal dimensions of seated
working posture - seated eye height above the floor,
acromion distance of shoulder to the home row of keys (or
pen grip position), and eye to copy distance to each other
and to the angular elements, are little studied. The
postural effects of the lineal dimensions and the link
between operator comfort and performance have also not been
studied. Opthalmological studies reviewing eye tiredness
and V.D.U workers (Richter, 1981) have sought to prove or
otherwise the evidence of eyestrain, but not to explain the
operator preference for visual distance to copy.
PAGE 69
SEATED WORKING POSTURE
Research in the late nineteenth and early twentieth
centuries was negated by inappropriate methods and a lack of
coordination between the researchers interested in work
station furniture design and those interested in seated
working posture. The small amount of specialised research
conducted post world war two has been negated by singular
aims of individuals, difficulties of inappropriate methods,
the use of inappropriate statistics (Mandal, 1984), and lack
of controls. The gaps in the scientific knowledge about
seated working posture are large.
Reviewing the body of scientific knowledge, it is considered
appropriate to repeat some of the laboratory testing
(Grandjean et al, 1983), in a work place setting.
This is a rationale for a research proposal as follows:-
assess the preferences of data processors with
regard to their seated body posture;
compare the preferential seated postural data
against that prescribed by the "German Square"
seated postural training model;
investigate if possible, the realtionship(s)
between the six main angular elements of postural
geometry together with the three main lineal
dimensions of seated working posture.
PAGE 70 SEATED WORKING POSTURE
1. INTRODUCTION
1.5 HYPOTHESIS
The hypothesis is that a population of alpha and numeric
data processors who have received training in the "German
Square" model of seated working posture, do not comply with
the angular and lineal dimensions established by the
training model.
In order to test this hypothesis, data processor operators
within Australia Post were asked to participate in the
workplace based measurements of preferred seated working
posture.

PAGE 71 SEATED WORKING POSTURE
2. METHODOLOGV
2.0.1 Generally
The experimental measurements were undertaken in Australia
Post Mail Centres at Brisbane (QLD), Rushcutters Bay, Clyde
(NSW), Clayton South (Vic) and Adelaide (SA), and in the
offices at 71 Rathdowne Street, Carlton South and 191 Queen
Street, Melbourne, (Vic).
2.0.2 The Systems of Work - Description
The hypothesis was tested using two experimental groups of
data processor operators.
Letter indexing desk operators within the target mail
centres were chosen as "Experimental Group A" personnel.
The desk operators are employed as "Mail Officers" and are
members of the Australian Postal and Telecommunications
Union. Letter indexing desk operators process standard
letters in an automated desk system of work which presents
each letter in the cone of vision of the seated operator for
alpha-numeric keycoding of the destination address. The
cone of vision for letter indexing desk operators is
primarily in the plane of the letter presentation band on
the machine.
Steno-Secretary and key-punch operators within the
Headquarters and State Administrative offices were chosen as
"Experimental Group B" personnel. The operators are
employed in administrative categories and are members of the
Public Service Union. Steno-Secretaries process words and a
minimum of numbers in a computerised desk system of work
which displays the work in progress on a cathode ray tube
(CRT) screen.
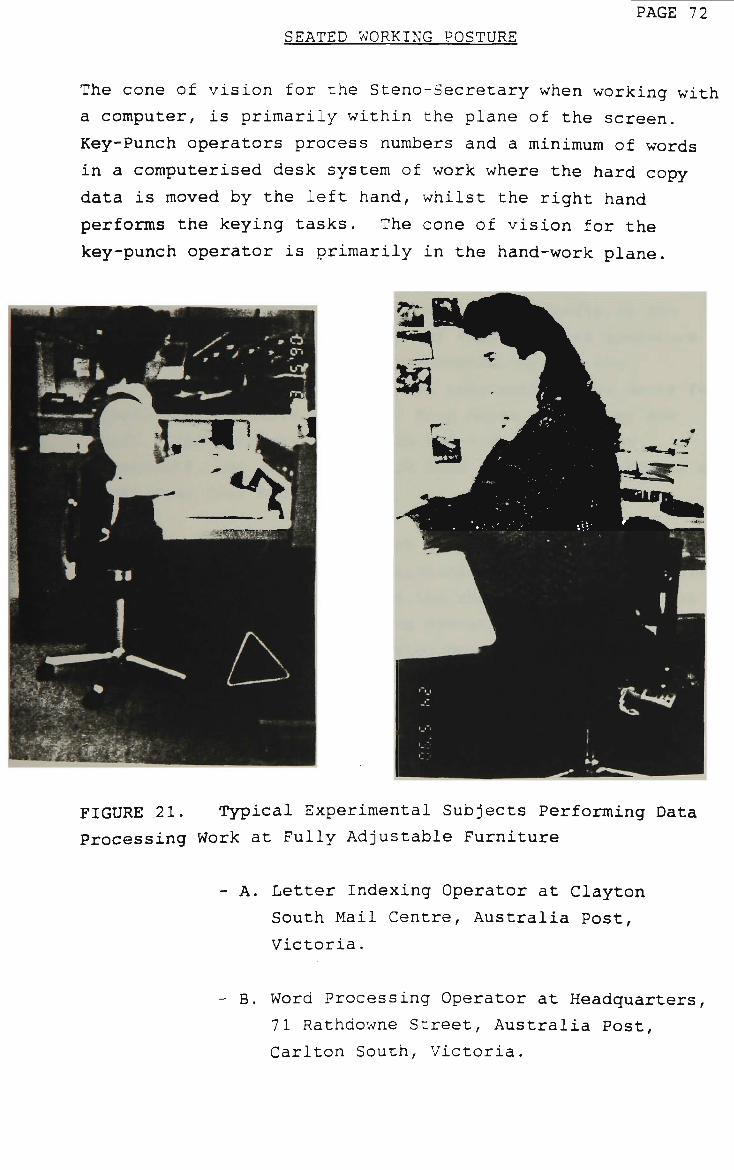
PAGE 72 SEATED WORKING POSTURE
The cone of vision for the Steno-Secretary when working with
a computer, is primarily within the plane of the screen.
Key-Punch operators process numbers and a minimum of words
in a computerised desk system of work where the hard copy
data is moved by the left hand, whilst the right hand
performs the keying tasks. The cone of vision for the
key-punch operator is primarily in the hand-work plane.
FIGURE 21. Typical Experimental Subjects Performing Data
Processing Work at Fully Adjustable Furniture
- A. Letter Indexing Operator at Clayton
South Mail Centre, Australia Post,
Victoria.
- B. Word Processing Operator at Headquarters,
71 Rathdowne Street, Australia Post,
Carlton South, Victoria.

PAGE 73
SEATED WORKING POSTURE
2.0.3 The Population of Operators
Histogram summaries within each group for body stature, body
mass, age, sex and natinality are "Appendix H" to this
paper.
Letter indexing desk operators comprise males and females of
relatively evenly distributed numbers and represent an
expected demographic distribution found currently in the
Australian work force. The Letter indexing desk operators
are rostered to work shifts distributed through the
twenty-four hour daily cycle, and they work at the desks for
a maximum cumulative period of four hours within any one
shift. The work may be done in one hour or two hour
increments, but subject to work load can be undertaken in a
continuous four hour period.
Steno-Secretaries and key-punch operators comprise males and
females of relatively disproportionate numbers, with female
occupants of the jobs being in the absolute majority. The
distribution of origin of these operators is considered to
be representative of the expected demographic spread
currently being experienced in the Australian workforce
(O.C.E.C, 1987).
The demography of the population studied is described as
follows:-
Experimental Group A
Australian
Asian
European
Other
TOTALS
27
16
2
2
47
Males
19
10
30
Females
8
6
2
1
17

SEATED WORKING POSTURE
PAGE 74
Experimental
Australian
Asian
European
Other
TOTALS
Group B |
31 |
3 |
8 |
5 |
47 |
Males
TABLE 1. Summary Data for Experimental Groups A & B
Showing Nationality Groups.
Steno-Secretaries and key-punch operators work "standard"
office hours of approximately 8.45am to 4.45pm, work
consistently at the one workstation and usually at a
dedicated task of work without job rotation.
The population studied is considered to be a normally
distributed one being closely allied to that described in
"Humanscale" 1/2/3 (1974) and 4/5/6 (1981) (Diffrient et
al), with the data for Experimental Groups A and B being as
follows:
Experimental Group A Experimental Group B
- minimum age 21 years - minimum age 20 years
- maximum age 51 years maximum age 61 years
mean age 31 years
(stand dev. 7.2)
mean age 29 years
(stand dev. 8.1)
- minimum height 1555mm minimum height 1441mm
- maximum height 1938mm - maximum height 1811mm
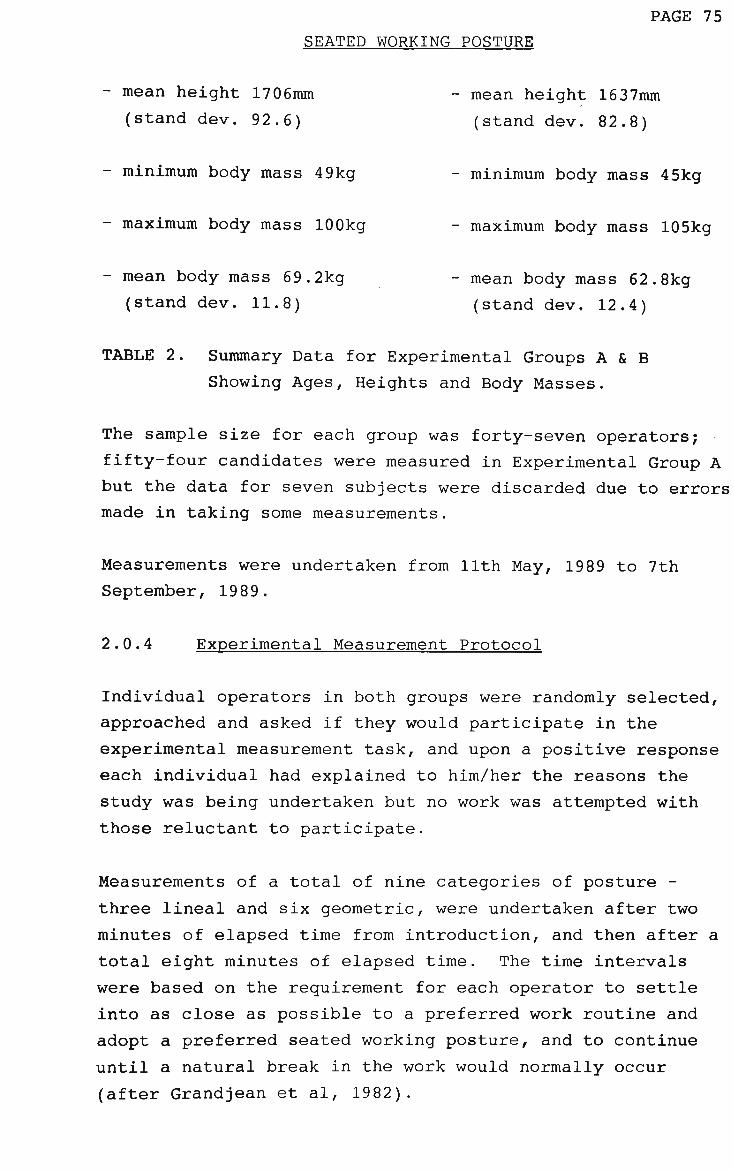
PAGE 75 SEATED WORKING POSTURE
- mean height 17 06mm - mean height 1637mm
(stand dev. 92.6) (stand dev. 82.8)
- minimum body mass 49kg - minimum body mass 45kg
- maximum body mass 100kg - maximum body mass 105kg
- mean body mass 69.2kg - mean body mass 62.8kg
(stand dev. 11.8) (stand dev. 12.4)
TABLE 2. Summary Data for Experimental Groups A & B
Showing Ages, Heights and Body Masses.
The sample size for each group was forty-seven operators;
fifty-four candidates were measured in Experimental Group A
but the data for seven subjects were discarded due to errors
made in taking some measurements.
Measurements were undertaken from 11th May, 1989 to 7th
September, 1989.
2.0.4 Experimental Measurement Protocol
Individual operators in both groups were randomly selected,
approached and asked if they would participate in the
experimental measurement task, and upon a positive response
each individual had explained to him/her the reasons the
study was being undertaken but no work was attempted with
those reluctant to participate.
Measurements of a total of nine categories of posture -
three lineal and six geometric, were undertaken after two
minutes of elapsed time from introduction, and then after a
total eight minutes of elapsed time. The time intervals
were based on the requirement for each operator to settle
into as close as possible to a preferred work routine and
adopt a preferred seated working posture, and to continue
until a natural break in the work would normally occur
(after Grandjean et al, 1982).
PAGE 76 SEATED WORKING POSTURE
2.0.5 Experimental Measurement Technique
Pretest procedures for validating limits of 'no movement'
consisted of taking a total of nine measurements - three
lineal and six geometric, of seated working posture and
retesting immediately. The measurements are described in
following pages Nos. 7 6 & 77. The results of each test and
retest were compared for ten different operators of letter
indexing desks, and the range of repeated measurements for
postural angles was found to be + 2 degrees and + 5mm for
lineal postural dimensions. Grandjean et al (1983, 1984)
reported similar measurement accuracy, when examining
preferred workstation settings for V.D.T. operators.
Angles and distances were measured during subjects normal
seated working activities of data processing. The distances
were measured using a retractable Stanley "Powerlock" steel
tape with a standard stadiometer to establish vertical and
horizontal planes for the intersecting points. The
distances measured were the eye height from the centre line
of the superior oribtal fissure of the eye socket, above the
floor, the shoulder acromion process height above the home
row of keys on the board (or the pen grip position for the
dominant hand) in the vertical plane, and the visual
distance from the centre line of the superior orbital
fissure of the eye socket, to the screen or hard copy
centreline. The viewing angle (eye to screen centreline to
horizontal plane), if required, could therefore be
established from eye height, visual distance, and screen
centre height.
Six postural angles were measured with an oil-damped, level
bubble goniometer which was hand held - a procedure that
provides a general measure of postural angles. Trunk
inclination was measured as the angle formed between the
lateral condyle of the knee, the greater trochanter of the
hip and the shoulder acromion process.
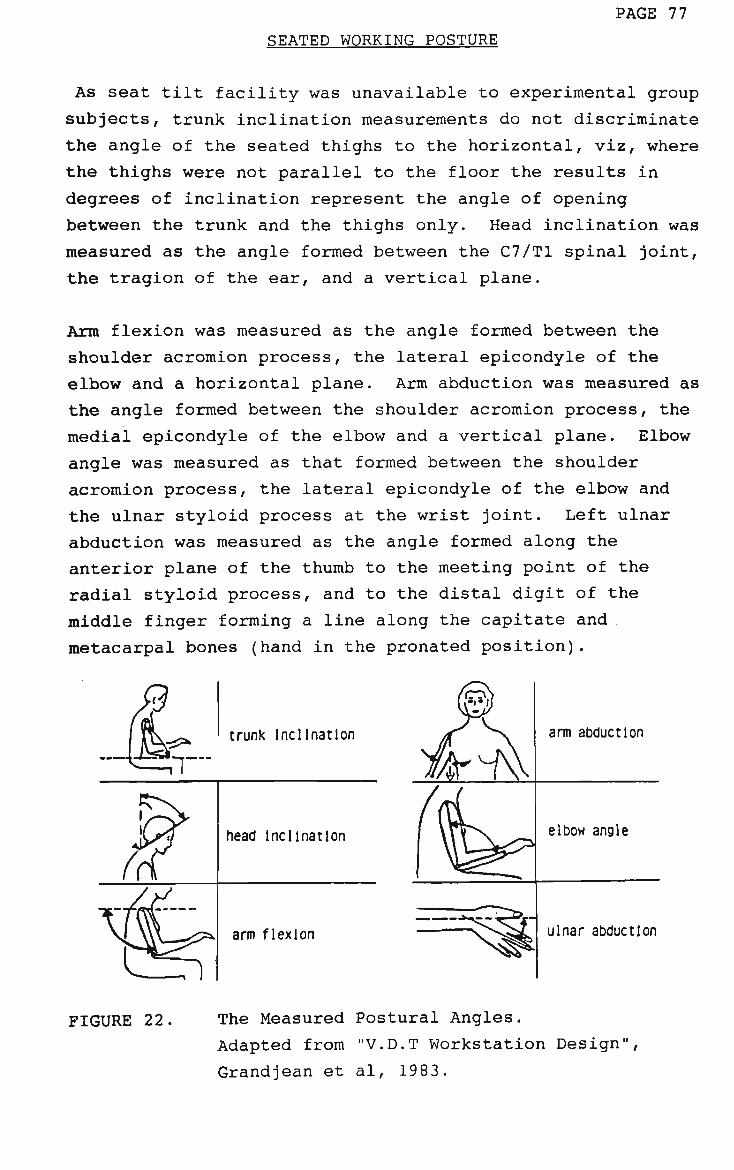
PAGE 77
SEATED WORKING POSTURE
As seat tilt facility was unavailable to experimental group
subjects, trunk inclination measurements do not discriminate
the angle of the seated thighs to the horizontal, viz, where
the thighs were not parallel to the floor the results in
degrees of inclination represent the angle of opening
between the trunk and the thighs only. Head inclination was
measured as the angle formed between the C7/T1 spinal joint,
the tragion of the ear, and a vertical plane.
Arm flexion was measured as the angle formed between the
shoulder acromion process, the lateral epicondyle of the
elbow and a horizontal plane. Arm abduction was measured as
the angle formed between the shoulder acromion process, the
medial epicondyle of the elbow and a vertical plane. Elbow
angle was measured as that formed between the shoulder
acromion process, the lateral epicondyle of the elbow and
the ulnar styloid process at the wrist joint. Left ulnar
abduction was measured as the angle formed along the
anterior plane of the thumb to the meeting point of the
radial styloid process, and to the distal digit of the
middle finger forming a line along the capitate and
metacarpal bones (hand in the pronated position).
arm abduction
ulnar abduction
FIGURE 22. The Measured Postural Angles.
Adapted from "V.D.T Workstation Design",
Grandjean et al, 1983.

SEATED WORKING POSTURE
PAGE 78
A proforma was used to record all data in the field,
individual operators were shown the completed proforma and
results were explained upon request.
The workplace generated proformas are "Appendix I" to this
paper.
2.0.6 Statistical Method
To determine the inter-relationships between the
preferrential seated working posture adopted by data
processors, and the seated working postural model known as
the 'German Square' administered by occupational health and
safety trainers, statistical measurements to establish the
mean, the standard deviation, the variance and a
distribution for a population sampled and found to be
normal, were undertaken for all classifications of the data.
Anthropometric and demographic data - in the terms of body
stature, body mass, sex, age and nationality, were gathered
and analysed to determine the variation across the
workplace. Means, standard deviations, variance, and
arithmetic distributions of the data were measured.
Because the population of data processors randomly sampled
in the field tests equated to a normally distributed
population, "Student's" t distribution (an exact sampling
theory since the results obtained hold for large as well as
small samples, according to Neter, Wasserman & Whitmore in
"Fundamental Statistics for Business and Economics", Ch. 11,
p. 188, 1973) was chosen to analyse the "within" group data
to compare the preferential working postures with that
prescribed by the model, at 2 minutes and 8 minutes
respectively.
SEATED WORKING POSTURE
PAGE 79
The second set of significance tests were applied "within"
group to establish whether or not there was change between
the seated working postures adopted at the 2 and 8 minutes
positions, compared against the static seated working
posture prescribed by the model. The third set of
significance tests were applied "between" groups to test
whether or not experimental Group A data is different to
experimental Group B data.
Complete statistical analyses of t-distribution within and
between groups measurements are "Appendix G" to this paper.

PAGE 80
SEATED WORKING POSTURE
3. RESULTS & DISCUSSION
Complete tabular results for the nine categories of postural
measurements are "Appendix A" to this paper. The results
include statistical analysis within groups for sex and for
nationalities. Complete statistical analysis of
t-distribution within and between groups measurements are
"Appendix G" to this paper. Summaries of these results are
presented within this section of the paper and are
referenced as sub-sections .1 to .10. Discussions follow
each as a sub-set.
The International Organisation for Standardisation (1978)
seated postural model is incomplete in lineal dimensions and
thereby differs from other models and standards that show
identical seated body geometry. Because of a lack of
standardisation for lineal units, "average" eye to floor
height, shoulder acromion process to keyboard home row
height and eye to copy distance data for seated adults has
been adopted from "Humanscale" (1974), and this data has
been used as the model.
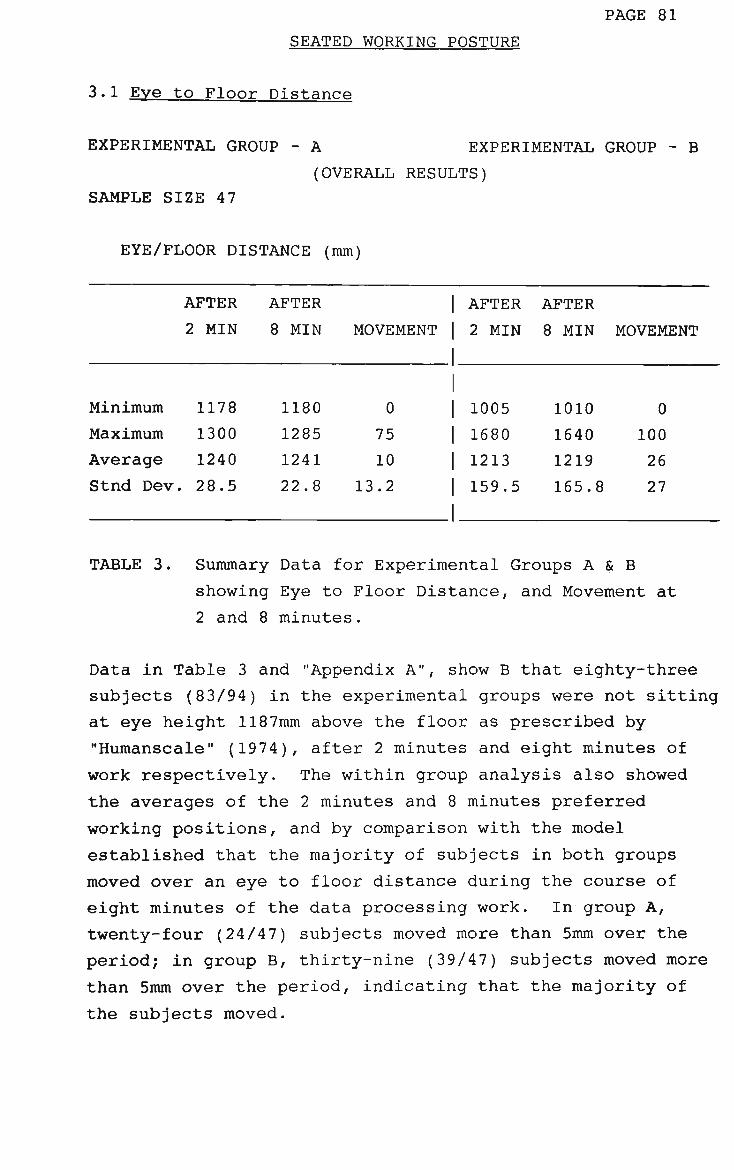
PAGE 81
SEATED WORKING POSTURE
3.1 Eve to Floor Distance
EXPERIMENTAL GROUP - A EXPERIMENTAL GROUP - B
(OVERALL RESULTS)
SAMPLE SIZE 47
EYE/FLOOR DISTANCE (mm)
Minimum
Maximum
Average
Stnd Dev
AFTER
2 MIN
1178
1300
1240
. 28.5
AFTER
8 MIN
1180
1285
1241
22.8
MOVEMENT
0
75
10
13.2
AFTER
2 MIN
1005
1680
1213
159.5
AFTER
8 MIN
1010
1640
1219
165.8
MOVEMENT
0
100
26
27
TABLE 3. Summary Data for Experimental Groups A & B
showing Eye to Floor Distance, and Movement at
2 and 8 minutes.
Data in Table 3 and "Appendix A", show B that eighty-three
subjects (83/94) in the experimental groups were not sitting
at eye height 1187mm above the floor as prescribed by
"Humanscale" (1974), after 2 minutes and eight minutes of
work respectively. The within group analysis also showed
the averages of the 2 minutes and 8 minutes preferred
working positions, and by comparison with the model
established that the majority of subjects in both groups
moved over an eye to floor distance during the course of
eight minutes of the data processing work. In group A,
twenty-four (24/47) subjects moved more than 5mm over the
period; in group B, thirty-nine (39/47) subjects moved more
than 5mm over the period, indicating that the majority of
the subjects moved.
SEATED WORKING POSTURE
PAGE 82
The third t-distribution test was applied to between groups
A and B data, and it established that there are no
statistically significant differences between group A and B
subjects sitting at work after 2 and 8 minutes respectively.
That is, statistically the data for both groups can be
considered as for one group.
3.1.1 Discussion of Eye to Floor Distance Results
The data indicates that some female subjects (n = 4) chose
to sit at an eye height above the floor greater than that
predicted for respective trunk stature and lower limb
length, and individuals explained this preference for seated
working height in terms of the difficulty to adjust the work
surface of the table. Because footresting facilities were
available and seat adjustability was reported to be
relatively easy by such female subjects, these means of
obtaining balanced seated posture (subjective observation)
were utilised.
Grandjean et al (1983) when reporting operator preferred
settings of VDT workstations, for eye to floor height
category from 65 observations for 65 subjects recorded a
mean preference of 1150mm, a standard deviation of 54mm and
a minimum-maximum range of 107 0mm to 127 0mm. These results
are different to those recorded for experimental groups A
and B, but show similarity in that movement occurred and
that the means of the subject groups differ from that
prescribed by the model. The differences cannot be
explained by the data.
Further research into what constitutes intrinsically safe
operator comfort and performance parameters for eye to floor
distance, is required.
The German DIN standard No. 4549 (1981) proposes a desk
level of 720mm for a VDT workstation. According to
Grandjean et al (1983) this proposal is based on
anthropometric considerations of upright-sitting operators,
and as a result has promoted lower than desirable seated eye
heights above floor level for data processing operators.
PAGE 83
SEATED WORKING POSTURE
The eye to floor distance impacts upon viewing position as a
predeterminant of the viewing angle, and also upon other
elements of seated working posture - especially head
inclination. As both hard copy and screen based character
readers were measured in groups A and B, the work of Gould
and Grischowsky (1984, 1986) who made attempts to determine
which factors are critical to speed and accuracy when
reading text on a VDT, are of interest. In 1984 Gould and
Grischowsky compared the same tasks being performed with
hard copy and with a VDT and found that hard copy text
reading was performed about 20% to 30% faster than VDT
reading.
In 1986, Gould and Grischowsky tested the effect of visual
angle as a possible contributor to a suspected decline in
speed and accuracy, using similar tasks. They found for
visual angle within the range 16 to 36 degrees, speed and
accuracy were unaffected. For experimental group A and B
subjects, the viewing angle (eye to reading data centreline
to horizontal plane) was determined from eye to floor
height, visual distance to the reading data, head
inclination, and height above the floor to the hard copy on
screen centre point.
The viewing angles for experimental groups A and B
were calculated as described on page 76 and correspond to
those prescribed for speed and accuracy by Gould and
Grischowsky (1986). The minimum viewing angle recorded was
5 degrees, the maximum 43 degrees and the mean 27 degrees.
By observation and operator feedback during the course of
the experimental measuring it can be concluded that the
viewing angles adopted did not slow down reading speed to
hard copy or to a CRT screen. Gould and Grischowsky (1984,
1986) also concluded that viewing angle does not slow down
the reading speed when people read from a VDT.
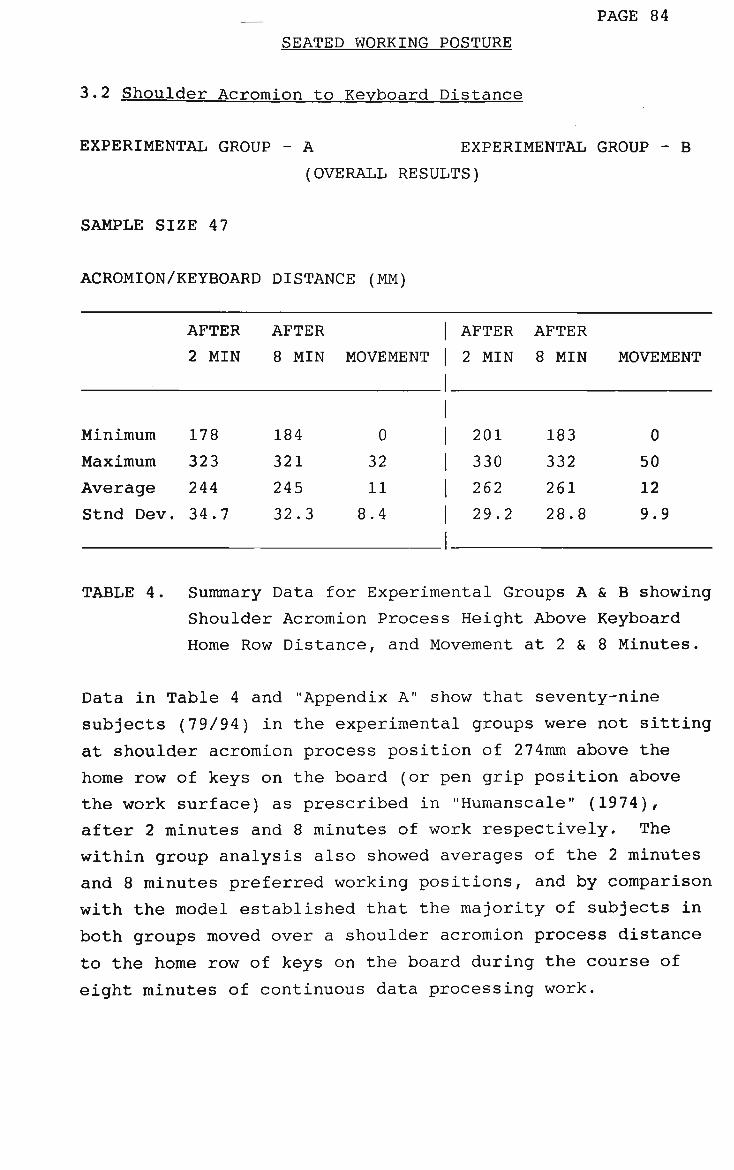
PAGE 84
SEATED WORKING POSTURE
3.2 Shoulder Acromion to Keyboard Distance
EXPERIMENTAL GROUP - A EXPERIMENTAL GROUP - B
(OVERALL RESULTS)
SAMPLE SIZE 47
ACROMION/KEYBOARD DISTANCE (MM)
Minimum
Maximum
Average
Stnd Dev.
AFTER
2 MIN
178
323
244
34.7
AFTER
8 MIN
184
321
245
32.3
MOVEMENT
0
32
11
8.4
AFTER
2 MIN
201
330
262
29.2
AFTER
8 MIN
183
332
261
28.8
MOVEMENT
0
50
12
9.9
TABLE 4. Summary Data for Experimental Groups A & B showing Shoulder Acromion Process Height Above Keyboard
Home Row Distance, and Movement at 2 & 8 Minutes.
Data in Table 4 and "Appendix A" show that seventy-nine
subjects (79/94) in the experimental groups were not sitting
at shoulder acromion process position of 274mm above the
home row of keys on the board (or pen grip position above
the work surface) as prescribed in "Humanscale" (1974),
after 2 minutes and 8 minutes of work respectively. The
within group analysis also showed averages of the 2 minutes
and 8 minutes preferred working positions, and by comparison
with the model established that the majority of subjects in
both groups moved over a shoulder acromion process distance
to the home row of keys on the board during the course of
eight minutes of continuous data processing work.
PAGE 85
SEATED WORKING POSTURE
In group A, thirty-three (33/47) subjects moved more than
5mm over the period; in groups B, thirty-four (34/47)
subjects moved more than 5mm over the period, indicating
that the majority of the subjects moved. The third
t-distribution test was applied to between groups A & B
data, and it established that there are statistically
significant differences between groups A and B subjects
sitting at work after 2 and 8 minutes respectively. That
is, statistically the data for each group cannot be
considered the same.
3.2.1 Discussion of Shoulder Acromion to Keyboard
Distance Results
Observation indicates that some female subjects (N = 3)
chose to alter the shoulder acromion process height above
the keyboard by adjustment of the chair seat height and the
chair backrest column angle, rather than by adjusting the
table worktop. Individuals explained this preference for
altering head, arm and trunk posture as a response to the
difficulty encountered by them in attempting to adjust the
table workshop. Forces applied to table height adjustment
mechanisms were recorded at greater than 200 Newtons - a
rotational force indicated by Humanscale 7/8/9 (1978) to be
excessive for female hands to apply. The changes in seated
body posture for the subjects cited are confirmed by their
individual trunk inclination preferences.
As tactile fatigue has been associated with keyboard profile
and angle (Snyder 1979), it may provide an explanation of
operator movement to shorten or extend the shoulder acromion
process height above the home row of keys on the board.
However, there is little in the literature concerning keying
performance as a function of keyboard slope on keyboard
profile (Knave et al 1983; Nelson, 1987).
PAGE 86
SEATED WORKING POSTURE
Grandjean and co-workers, 1983, when examining preferred
settings by operators of their VDT workstation furniture and
equipment, found from 236 observations and 59 subjects a
mean height of shoulder acromion process above home row of
key to be 510mm, with a standard deviation of 50mm and a
minimum-maximum range of 420mm to 620mm. The measured range
of 200mm in the Grandjean et al (1983) study is beyond the
ranges measured for experimental groups A and B.
Considering that Humanscale 1/2/3 (1974) humeral link data
for "average" stature adult males and females is a range
267mm to 282mm, it is difficult to explain Grandjean and
co-workers results except to say that possibly their
subjects presented an arm posture with elbow angle greater
than 90°. As the anthropometric data published by Grandjean
et al (1983) states that of the 68 subjects a total of 9
were less than 1600mm and a total of 11 were greater than
1750mm in stature, it is assumed that the population was not
normally distributed in that larger than expected trunk
statures may dominate the sample.
By way of some contradiction by earlier work, Grandjean
(1981) in publishing German rules of the "Verwaltungs-
Berufsgenossenschaft", prescribed anthropometric
considerations of upright-sitting operators to establish
work station heights and seated working postures. These
rules are repeated by the German DIN standard No 4549
(1981).
The differences in behaviour established by the
t-distribution between groups A & B test, and the
differences between this and the Grandjean and co-workers
(1983) results cannot be explained by the data. Further
research into what constitutes intrinsically safe operator
comfort and performance parameters for shoulder acromion to
keyboard home row distance, is required.

PAGE 87 SEATED WORKING POSTURE
3.3 Eve to Copy Distance
EXPERIMENTAL GROUP - A EXPERIMENTAL GROUP - B
(OVERALL RESULTS)
SAMPLE SIZE 47
EYE TO COPY DISTANCE (MM)
Minimum
Maximum
Average
Stnd Dev
AFTER
2 MIN
550
787
670
. 50.6
AFTER
8 MIN
552
800
671
52.2
MOVEMENT
0
78
17
18.3
AFTER
2 MIN
478
850
700
77.4
AFTER
8 MIN
488
876
707
87.
MOVEMENT
0
93
26
21.3
TABLE 5. Summary Data for Experimental Groups A & B Showing
Eye to Copy Distance, and Movement at 2 and 8 minutes.
Data in Table 5 and "Appendix A" show that all ninety-four
subjects (94/94) in the experimental groups were not sitting
at eye to copy distance of 460mm as prescribed by
"Humanscale" (1974), after 2 minutes and 8 minutes of work
respectively. The within group analysis also showed the
averages of the 2 minutes and 8 minutes preferred working
positions, and by comparison with the model established that
the majority of subjects in both groups moved over an eye to
copy distance during the course of eight minutes plus of
continuous data processing work. In group A, thirty-one
31/47 subjects moved more than 5mm over the period; in group
B, forty-two (42/47) subjects moved more than 5mm over the
period, indicating that the majority of subjects moved. The
third t-distribution test was applied to between groups A
and B data, and it is established that there are
statistically significant differences between groups A and B
subjects sitting at work after 2 and 8 minutes respectively.
That is, statistically the data for each group cannot be
considered the same.
PAGE 88 SEATED WORKING POSTURE
3.3.1 Discussion of Eve to Copy Distance Results
The extended maximum movements recorded for both groups
experimental subjects (group A-78mm; group B-93mm) may be
explained by preferred shoulder acromion process height
above the home row of keys on the board, and this
relationship to trunk inclination.
The data indicates that a random distribution of subjects
(n = 8) preferred maximal movement of eye to copy from the 2
to the 8 minutes working positions. As only two of these
subjects were older than thirty years of age (C17 - 42 years
and C37-35 years), it is unlikely that age effect in
lengthening preferred focal distance (presbyopia) is the
reason for the change. The recorded movements show that
some subjects were above and some below the model viewing
distance during 8 minutes of seated data processing work.
Individual operators interviewed post measurement taking,
were unable to elucidate reasons for the change in preferred
focal distance and were not primarily aware that they were
changing focal distance during the course of the work.
Some operators in experimental groups A and B wore mono
focal or bi-focal spectacles, and were represented in the
numbers of minimal and maximal movers. The reasons for
changes in eye to copy distances reported for experimental
groups A and B cannot be explained from the data generated
within the study or from the scientific literature reviewed.
The main visual functions when performing data processing
work are:
Accommodation - the ability to bring into sharp
focus characters at different
distances;
PAGE 89 SEATED WORKING POSTURE
Convergence - the ability to co-ordinate the
movement of both eyes so that the
image transfers onto corresponding
retinal areas;
Adaptation - the ability of the retina to adapt
its sensitivity to varying
luminances or colour stimuli
(after Blewett, 1984; Nelson,
1987).
The visual comfort of data processors depends on workstation
lighting and copy quality, the operators eyesight, working
posture and age, as well as physical factors in the
workplace (Blewett 1984; Cakir et al 1979; Howarth and
Instance 1985; Nelson, 1987; Qstberg, 1982; Shahnavaz and
Hedman, 1984). Objective measurements of visual fatigue
have generally been based on the measurement of transient
myopia - a condition frequently reported by VDT operators
(Jaschinski-Kruza, 1984). Subjective measurements have
relied on comfort - index based questionnaires and on
interviews (Gould and Grischowsky 1984).
Kruk and Muter (1984) showed that viewing distance had no
effect on reading speed, which was consistent with the
findings of Morrison (1983).
Vassilieff and Dain (1986) asserted that if the workplace
was designed with the needs of multi focal wearers in mind
then multi focals should present little problem except in a
few specific cases. Provision of height adjustment, swivel
and tilt mechanisms, is relatively easy to achieve (Telecom
Standard, 1985; Nelson, 1987).
PAGE 90
SEATED WORKING POSTURE
Grandjean et al (1983), when examining preferred settings by
operators of their VDT workstation furniture and equipment,
found from 236 observations and 59 subjects a mean visual
distance of 760mm, with a standard deviation of 75mm and a
minimum-maximum range of 610mm to 9 30mm. These results are
different to those recorded for experimental groups A and B,
but show similarity in that movement occurred and that the
means of the subject groups differ markedly from that
prescribed by the model.
Further research into what constitutes intrinsically safe
operator comfort and performance parameters for eye to copy
distance, is required.
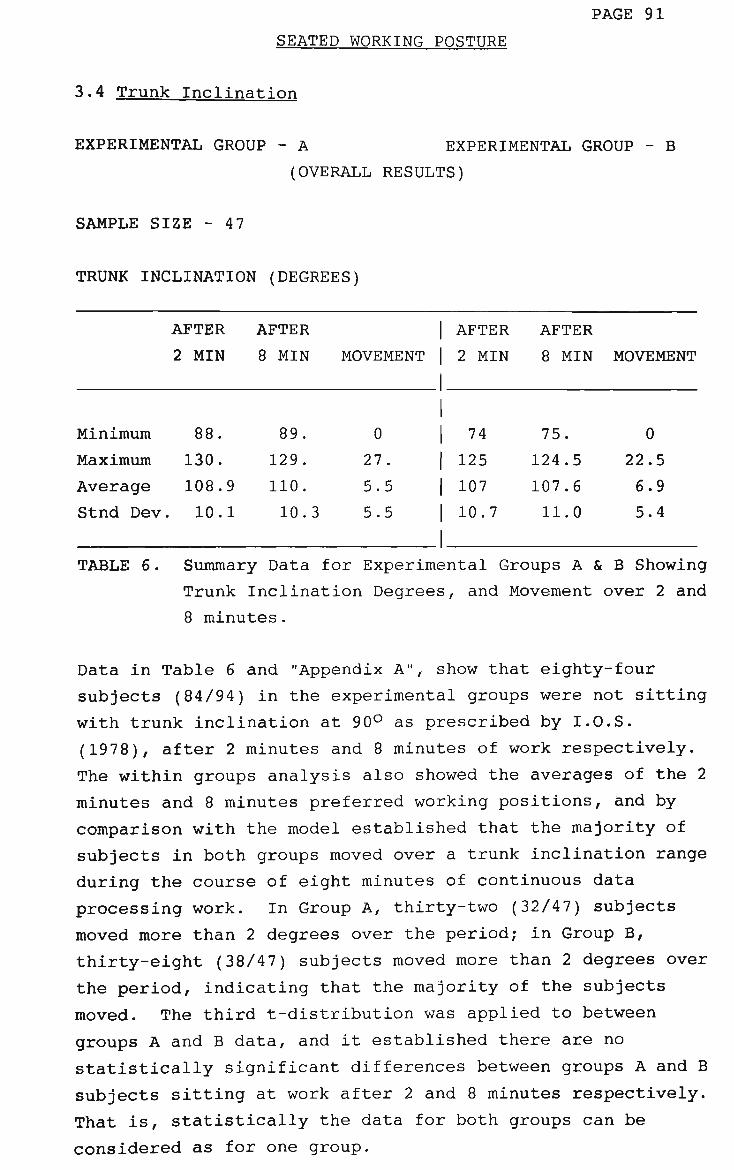
PAGE 91
SEATED WORKING POSTURE
3.4 Trunk Inclination
EXPERIMENTAL GROUP - A EXPERIMENTAL GROUP - B
(OVERALL RESULTS)
SAMPLE SIZE - 47
TRUNK INCLINATION (DEGREES)
Minimum
Maximum
Average
Stnd Dev
AFTER
2 MIN
88.
130.
108.9
. 10.1
AFTER
8 MIN
89.
129.
110.
10.3
MOVEMENT
0
27.
5.5
5.5
AFTER
2 MIN
74
125
107
10.7
AFTER
8 MIN
75.
124.5
107.6
11.0
MOVEMENT
0
22.5
6.9
5.4
TABLE 6. Summary Data for Experimental Groups A & B Showing
Trunk Inclination Degrees, and Movement over 2 and
8 minutes.
Data in Table 6 and "Appendix A", show that eighty-four
subjects (84/94) in the experimental groups were not sitting
with trunk inclination at 90° as prescribed by I.O.S.
(1978), after 2 minutes and 8 minutes of work respectively.
The within groups analysis also showed the averages of the 2
minutes and 8 minutes preferred working positions, and by
comparison with the model established that the majority of
subjects in both groups moved over a trunk inclination range
during the course of eight minutes of continuous data
processing work. In Group A, thirty-two (32/47) subjects
moved more than 2 degrees over the period; in Group B,
thirty-eight (38/47) subjects moved more than 2 degrees over
the period, indicating that the majority of the subjects
moved. The third t-distribution was applied to between
groups A and B data, and it established there are no
statistically significant differences between groups A and B
subjects sitting at work after 2 and 8 minutes respectively.
That is, statistically the data for both groups can be
considered as for one group.
PAGE 92
SEATED WORKING POSTURE
3.4.1 Discussion of Trunk Inclination Results
It is important that only seven subjects in both
experimental groups chose to adopt at least one trunk
inclination of less than 90 degrees during the course of
eight minutes of continuous data processing work.
Observation indicates that one female subject sat with trunk
inclinations of 74 degrees after 2 minutes and 75 degrees
after 8 minutes of work were recorded, the hunched forwards
working, kyphotic, preferential posture adopted by the tall
german female can be attributed to a preference to sit lower
on the chair than prescribed by the model for her trunk and
limb anthropometry. It is important that eighty-seven
subjects in both experimental groups chose at both
measurement intervals to adopt trunk inclinations of greater
than 90°.
Grandjean and co-workers, 1983, when examining preferred
setting heights by operators of their VDT workstation
furniture and equipment, found from 236 observations and 59
subjects a mean trunk inclination to be 104 degrees, with a
standard deviation of 6.7 degrees and a minimum-maximum
range of 91 degrees to 120 degrees. These results are
different to those recorded for experimental groups A and B,
but show similarity in that movement occurred and that the
means of the subject groups differ from that prescribed by
the model.
Grandjean and co-workers, 1981, when performing some
laboratory work with seated VDT operators, found primarily
that the postural elements measured were of the same order
of magnitude as those measured and observed in the field.
Secondly, they found that the body postures were
characterised by a marked trunk inclination that is, a
pronounced backwards leaning. Preference for pronounced
backwards leaning is a feature of the data for experimental
groups A & B.
PAGE 93 SEATED WORKING POSTURE
The ninety-four experimental subjects sat on identical fully
adjustable chairs ("Unomanic" form by Co-Design) for their
work. The chair type has a fixed horizontal seat pan. For
trunk inclination measurements no allowance was made for the
positions preferred by the experimental subjects on the
available seat cushion. Thus, the thigh was not always
presented in the horizontal plane and so the angle presented
as "trunk inclination" is a combination of trunk and thigh
positions about a centroid of the greater trochanter for each hip.
An interesting variation to the experiment would be the
introduction of a seat-tilt version of the fully adjustable
chair, with measurements for trunk inclination being taken
against a fixed horizontal plane and for thigh inclination
taken against a fixed vertical plane.
Illuminance levels in the seated operators hand and eye
working zones impacts especially upon trunk inclination
because changes in torso position can shield or attract
light into the operators primary work zone.
Illuminance readings of operators work stations were not
measured during the course of this study, and no
experimental group subject complained or commented about
their work station lighting. In a field study of 29
experienced operators at a Swedish "Telecom" Enquiry Centre,
Shahnavaz and Hedman (1984) measured changes in visual
accommodation, workplace lighting and screen source
luminance contrasts. The study revealed a low significance
relationship between lighting conditions and the incidence
of postural changes to accommodate vision. Some operators
showed over-visual accommodation - a condition of
short-sighting to the source data, which may produce eye
strain symptoms and may be an explanation of the desire for
some operators to decrease focal distance over time.
Shortening of focal distance will vary seated working
posture.
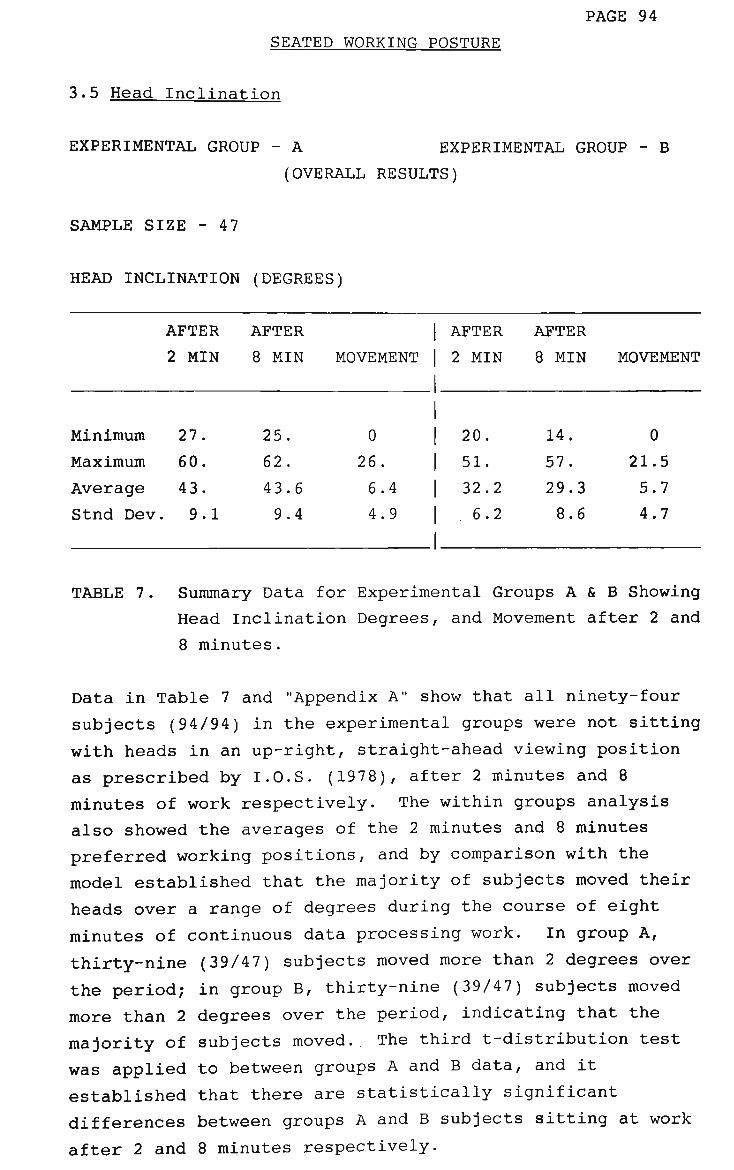
PAGE 94 SEATED WORKING POSTURE
3.5 Head Inclination
EXPERIMENTAL GROUP - A EXPERIMENTAL GROUP - B
(OVERALL RESULTS)
SAMPLE SIZE - 47
HEAD INCLINATION (DEGREES)
Minimum
Maximum
Average
Stnd Dev
AFTER
2 MIN
27.
60.
43.
. 9.1
AFTER
8 MIN
25.
62.
43.6
9.4
MOVEMENT
0
26.
6.4
4.9
AFTER
2 MIN
20.
51.
32.2
6.2
AFTER
8 MIN
14.
57.
29.3
8.6
MOVEMENT
0
21.5
5.7
4.7
TABLE 7. Summary Data for Experimental Groups A & B Showing Head Inclination Degrees, and Movement after 2 and
8 minutes.
Data in Table 7 and "Appendix A" show that all ninety-four
subjects (94/94) in the experimental groups were not sitting
with heads in an up-right, straight-ahead viewing position
as prescribed by I.O.S. (1978), after 2 minutes and 8
minutes of work respectively. The within groups analysis
also showed the averages of the 2 minutes and 8 minutes
preferred working positions, and by comparison with the
model established that the majority of subjects moved their
heads over a range of degrees during the course of eight
minutes of continuous data processing work. In group A,
thirty-nine (39/47) subjects moved more than 2 degrees over
the period; in group B, thirty-nine (39/47) subjects moved
more than 2 degrees over the period, indicating that the
majority of subjects moved. The third t-distribution test
was applied to between groups A and B data, and it
established that there are statistically significant
differences between groups A and B subjects sitting at work
after 2 and 8 minutes respectively.

PAGE 95 SEATED WORKING POSTURE
3.5.1 Discussion of Head Inclination Results
The "German Square" postural model prescribed by the I.O.S.
(1978) document. TC 136/SC7 (1978) gives the geometry of
head inclination as zero with the eyes looking forwards in a
plane ahead at 180° formed parallel to the seated thighs and
at right angles to the upright position of the trunk and
head of the seated subject. The anatomical marks prescribed
for measuring the head inclination are the C7/T1 spinal
joint, the tragion of the ear and an angle formed with a
vertical plane. Because the C7/T1 joint in a normally
distributed population is approximately 90mm to 100mm in a
horizontal plane behind the ear tragion, this means that the
head inclination prescribed by the model should be given a
value of greater than 0 degrees, probably in the range 45°
to 50°. There is insufficient data in "Humanscale" (1978)
or within the scientific literature, to confidently predict
the range or the mean for head inclination. To conduct a
measured survey of head inclination parameters is beyond the
scope of this study. On this basis it is not valid to
compare the model and the measurements for the experimental
groups A and B.
Grandjean and co-workers (1983) when examining preferred
work station furniture and equipment settings by VDT
operators, found from 236 observations and 59 subjects a
mean head inclination of 51 degrees, with a standard
deviation of 6.1 degrees, and a minimum - maximum range of
34 to 65 degrees. The results from this study are different
in range and mean to those measured for experimental groups
A and B, and cannot be explained by the data. The
methodology for measurement used by Grandjean and co-workers
(1983) was identical to that used to measure head
inclinations for subjects in experimental groups A and B.
In another study by Grandjean and co-workers (1982) using
the same methodology for measurement, 68 subject
measurements returned a mean head inclination of 53 degrees.
PAGE 96
SEATED WORKING POSTURE
That head working position is influenced by the working
trunk position is indicated by comparison of the measured
results generated by Grandjean et al (1982, 1983) and by
this study. When a backrest column or the trunk itself was
altered to increase from 90 degrees to approx 110 degrees
subjects exhibit a decrease of the intervertebral disc
pressure and of the electromyographic activity of the back
(Grandjean et al, 1983). Similar results were observed by
Yamaguchi and co-workers (1972), who also advised that an
angle between seat and backrest of 115 to 120 degrees
provided the best condition for relaxation of the spine. In
order for the eyes to then coincide with a near horizontal
viewing plane the head must incline or recline in a small
range of degrees. Comfortable viewing is achieved by eyes
in a cone of vision commencing at approximately 11 degrees
below the datum Frankfurt plane of viewing (the imaginary
line drawn between the ear tragion and the supraorbital
notch of the eye - after Hill and Kroemer, 1986), with
declination increasing to approximately 38 degrees below the
datum. Therefore, this range of comfortable eye movement
is without the necessity to move the cervical vertebral
joints of the neck, and indicates that little head
inclination is necessary by seated data processing operators
who adjust their furniture to meet their preferred postural
range. This was observed during the course of measuring
group A subjects.
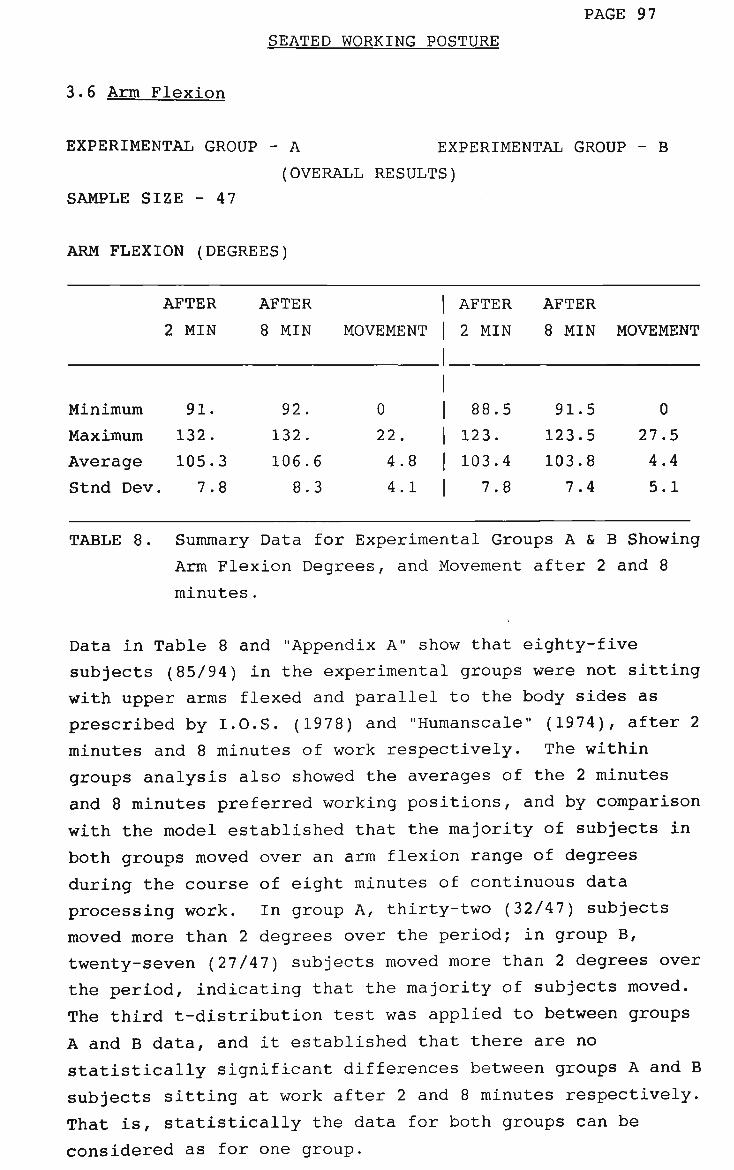
PAGE 97
SEATED WORKING POSTURE
3.6 Arm Flexion
EXPERIMENTAL GROUP - A EXPERIMENTAL GROUP - B
(OVERALL RESULTS)
SAMPLE SIZE - 47
ARM FLEXION (DEGREES)
Minimum
Maximum
Average
Stnd Dev
AFTER
2 MIN
91.
132.
105.3
7.8
AFTER
8 MIN
92.
132.
106.6
8.3
MOVEMENT
0
22.
4.8
4.1
AFTER
2 MIN
88.5
123.
103.4
7.8
AFTER
8 MIN
91.5
123.5
103.8
7.4
MOVEMENT
0
27.5
4.4
5.1
TABLE 8. Summary Data for Experimental Groups A & B Showing
Arm Flexion Degrees, and Movement after 2 and 8
minutes.
Data in Table 8 and "Appendix A" show that eighty-five
subjects (85/94) in the experimental groups were not sitting
with upper arms flexed and parallel to the body sides as
prescribed by I.O.S. (197 8) and "Humanscale" (1974), after 2
minutes and 8 minutes of work respectively. The within
groups analysis also showed the averages of the 2 minutes
and 8 minutes preferred working positions, and by comparison
with the model established that the majority of subjects in
both groups moved over an arm flexion range of degrees
during the course of eight minutes of continuous data
processing work. In group A, thirty-two (32/47) subjects
moved more than 2 degrees over the period; in group B,
twenty-seven (27/47) subjects moved more than 2 degrees over
the period, indicating that the majority of subjects moved.
The third t-distribution test was applied to between groups
A and B data, and it established that there are no
statistically significant differences between groups A and B
subjects sitting at work after 2 and 8 minutes respectively.
That is, statistically the data for both groups can be
considered as for one group.
PAGE 98 SEATED WORKING POSTURE
3.6.1 Discussion of Arm Flexion Results
It is important that only eleven (11) subjects in
experimental groups A (2) and B (9) adopted an upper arm
flexion of 90 degrees or less. This result means that most
subjects preferred to align the upper arm forwards of the
position of the seated body sides.
The result may be attributed to a majority operator
preference for an inclined trunk for performance of seated
work, because in backwards leaning some balance compensation
and arm extension to the hand work position is required.
This positioning is also compatible to the range of viewing
preference demonstrated by the operators. In the findings
of Grandjean and co-workers (1983), it was stated that "the
upper-arm flexion shows as a nearly normal distribution.
The 95% confidence level lies between 103 degrees and 123
degrees. If the upper arms were elevated proportionately to
the backward inclination of the trunk, one would expect a
mean upper-arm flexion of 104 degrees. In fact, subjects
tended to elevate the upper arm to a greater proportionate
degree, their mean upper-arm flexion being 113 degrees".
The upper-arm flexion results of Grandjean et al (1981,
1983) are similar to those recorded for experimental groups
A and B, but show similarity in that movement occurred and
that the means of the subject groups differ from that
prescribed by the model. The differences cannot be
explained by the data.
Further research into what constitutes intrinsically safe
operator comfort and performance parameters for upper-arm
flexion, is required.
Keyboard height, profile and angle may be contributing
factors to upper-arm flexion results. There is little
literature concerning keying performance as a function of
keyboard height, slope or keyboard profile.

PAGE 99
SEATED WORKING POSTURE
There are several references with regard to keyboard angle,
but most of them were written in the 1950-1960 period.
These studies were mainly undertaken on mechanical keyboards
which demanded a different keyboard angle and slope from
modern keyboards (Nelson, 1987).
Cakir et al (1979) states that "to minimise the
physiological loading of the hands and to ensure good keying
performance, the angle of the keyboard should be between 5
degrees to 15 degrees".
Chapanis (1965) showed that subjectively a 10 degree slope
was more comfortable for operators. Keying performance was
not affected by this variation in angle.
The recommended angle for modern keyboards (post 1983)
should be an approximate range of 5 degrees to 11 degrees
the actual angle being determined by its technical aspects,
(Knave et al, 1983; Nelson, 1987).
Keyboards used by experimental group A and B subjects were a
measured angle range of 7.5 degrees to 12 degrees.
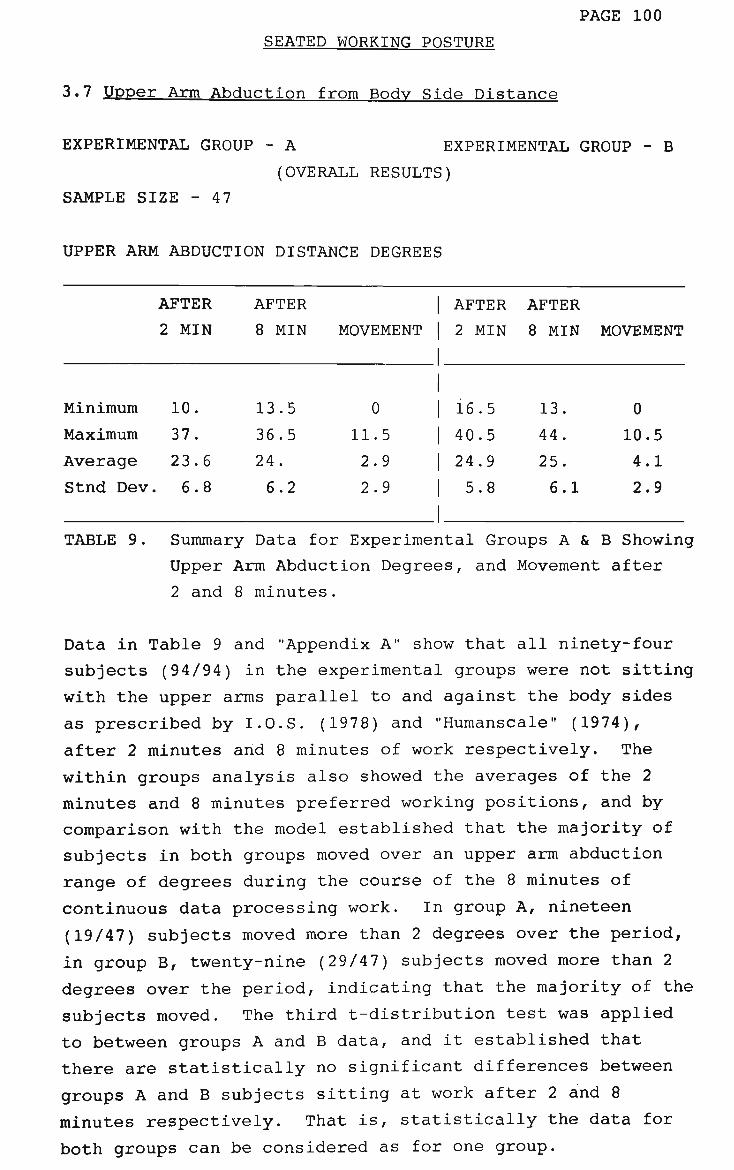
PAGE 100 SEATED WORKING POSTURE
3.7 Upper Arm Abduction from Body Side Distance
EXPERIMENTAL GROUP - A EXPERIMENTAL GROUP - B
(OVERALL RESULTS)
SAMPLE SIZE - 47
UPPER ARM ABDUCTION DISTANCE DEGREES
Minimum
Maximum
Average
Stnd Dev
AFTER
2 MIN
10.
37.
23.6
. 6.8
AFTER
8 MIN
13.5
36.5
24.
6.2
MOVEMENT
0
11.5
2.9
2.9
AFTER
2 MIN
16.5
40.5
24.9
5.8
AFTER
8 MIN
13.
44.
25.
6.1
MOVEMENT
0
10.5
4.1
2.9
TABLE 9. Summary Data for Experimental Groups A & B Showing
Upper Arm Abduction Degrees, and Movement after 2 and 8 minutes.
Data in Table 9 and "Appendix A" show that all ninety-four
subjects (94/94) in the experimental groups were not sitting
with the upper arms parallel to and against the body sides
as prescribed by I.O.S. (1978) and "Humanscale" (1974),
after 2 minutes and 8 minutes of work respectively. The
within groups analysis also showed the averages of the 2
minutes and 8 minutes preferred working positions, and by
comparison with the model established that the majority of
subjects in both groups moved over an upper arm abduction
range of degrees during the course of the 8 minutes of
continuous data processing work. In group A, nineteen
(19/47) subjects moved more than 2 degrees over the period,
in group B, twenty-nine (29/47) subjects moved more than 2
degrees over the period, indicating that the majority of the
subjects moved. The third t-distribution test was applied
to between groups A and B data, and it established that
there are statistically no significant differences between
groups A and B subjects sitting at work after 2 and 8
minutes respectively. That is, statistically the data for
both groups can be considered as for one group.
PAGE 101
SEATED WORKING POSTURE
3.7.1 Discussion of Upper Arm Abduction Results
Grandjean et al (1983) when examining preferred work station
settings by VDT operations, found from 236 observations and
59 subjects a mean preference for upper arm movement away
from the body sides to be 22 degrees, with a standard
deviation of 7.7 degrees and a minimum - maximum range of 11
to 44 degrees. Grandjean et al (1982) in laboratory
experimentation, found for 68 subjects a mean upper arm
abduction of 21 degrees. These results are different to
those recorded for experimental groups A and B, but show
similarity in that movement occurred, and that the means of
the subject groups differ from that prescribed by the model.
The differences cannot be explained by the data.
Grandjean et al (1983) concluded from field studies that the
preferred postures adopted by VDT operators were
characterised by a marked trunk inclination, and an increase
of both the upper-arm flexions and elbow angles. Upper arm
abduction appears to be related to the length of the humeral
link and possibly the seated trunk stature. It also may be
a function of inappropriately low adjustment by individual
operators of the chair seat height. These variables in the
anthropometry and the behaviour of subjects in both
experimental groups, were observed during the measurement
phase of the data collection.
Observation indicates that male subjects (n = Z) of
"average" stature, recorded upper-arm abductions near the
maximum but the eye heights above floor preferences were
less than the averages for the 2 and 8 minutes working
position. Thus, for whole body stature, the two subjects
are sitting inappropriately low and have compromised
relaxed, seated working posture by elevation of the shoulder
joints and the elbow joints. Similarly, observation
indicates that female subjects (n = 3) of "average", "small"
and "tall" stature demonstrate sitting by preference too low
to accommodate their upper arms relaxed by their body sides.

PAGE 102 SEATED WORKING POSTURE
Further research into what constitutes intrinsically safe
operator comfort and performance parameters for upper-arm
abduction from the shoulder acromion process, is required.

PAGE 103 SEATED WORKING POSTURE
3.8 Elbow Angle
EXPERIMENTAL GROUP - A EXPERIMENTAL GROUP - B
(OVERALL RESULTS)
SAMPLE SIZE - 47
ELBOW ANGLE (DEGREES)
Minimum
Maximum
Average
Stnd Dev
AFTER
2 MIN
73.
111.
90.
9.1
AFTER
8 MIN
72.5
110.
90.6
8.6
MOVEMENT
0
12.
3.8
2.9
AFTER
2 MIN
75.
120.5
97.1
10.7
AFTER
8 MIN
79.5
121.5
97.
10.8
MOVEMENT
0
32.
7.1
7.2
TABLE 10. Summary Data for Experimental Groups A & B Showing
Elbow Angle Degrees, and Movements after 2 and 8
minutes.
Data in Table 10 and "Appendix A" show that twenty-four
subjects (24/47) in experimental group A sat and worked with
the elbow joint at 90° of flexion at the two and eight
minutes periods, respectively. However, group B subjects
did not adopt the posture prescribed by the I.O.S. (1978)
model at either the two or eight minutes period, thirty-two
subjects (32/47) sat and worked with elbow joint at less
than 88° or at greater than 92°.
PAGE 104 SEATED WORKING POSTURE
The within groups analysis also showed the averages of the 2
minutes and 8 minutes preferred working positions, and by
comparison with the model established that the majority of
subjects in both groups moved over an elbow angle range
during the course of the eight minutes of the data
processing work.
The third t-distribution test was applied to between groups
A and B data, and it established that there are
statistically significant differences between the elbow
angles adopted by both groups sitting at work after 2
minutes and 8 minutes respectively. That is, statistically
the data for each group cannot be considered the same.
3.8.1 Discussion of Elbow Angle Results
Grandjean et al (1983) when examining preferred work station
settings by VDT operators, found that from 236 observations
and 59 subjects a mean preferences for elbow angle to be 99
degrees, with a standard deviation of 12.3 degrees, and a
minimum - maximum range of 75 degrees to 125 degrees.
Grandjean et al (1982) in laboratory experimentation, found
for 68 subjects a mean elbow angle of 94 degrees. Both sets
of results are different to those recorded for experimental
group A and are similar in range only to those recorded for
experimental group B. However, all data show movement
occurred and the means of three of the subject groups differ
from that prescribed by the model.

PAGE 105
SEATED WORKING POSTURE
Grandjean and co-workers (1983) found that elbow angle was
related to trunk inclination and to upper-arm flexion
(forwards movement from the shoulder joint). Their studies
(1982, 1983) gave results for elbow angle that were not
normally distributed :"... the 95% confidence interval lies
between 87 and 111 degrees, and a clear majority of the
subjects demonstrated angles between 90 and 110 degrees.
Subjects therefore appeared to increase the elbow angle by
about 10 degrees when their upper arms were elevated." The
latter comment refers to their results for upper arm flexion
which were close to a normal distribution. Grandjean et al
(1983) stated "that if the upper arms were elevated
proportionately to the backward inclination of the trunk one
would expect a mean upper-arm flexion of 104 degrees". In
fact, Grandjean et al (1983) found that subjects tended to
elevate the upper arm to a greater proportionate degree.
The German rules of Verwaltungs Berufsgenossenschaft
(authored by Grandjean, 1981) prescribe a hand working
height of 750mm above the floor for keyboards on fixed
workstations. The German DIN Standard No 4549 (1981)
proposed the same hand working height, but prescribed that
the desk must be lowered if keyboards higher than 30mm are
used. Grandjean et al (1983) commented that these
recommendations are based upon anthropometric considerations
applied theoretically to upright sitting VDT operators.
Grandjean et al (1983) conclude that in practice VDT
operators prefer higher keying levels and therefore they do
not keep their forearms in a horizontal plane, but in an
up-right inclination of approximately 14 degrees.
PAGE 106
SEATED WORKING POSTURE
Preferred elbow angles adopted by VDT operators may be
influenced by the tactile feel of the keyboard -
characteristics generally inherent in the physical
construction, which help the operator to determine that a
keystroke has been successfully actioned. (Knave et al,
1983). Unfortunately the predominant research conducted on
mechanical keyboards is not applicable because of the
difference demonstrated by electronic switches in the key
press activation forces, the distances and the direction of
the switch travel. (Nelson, 1987; after Knave et al, 1983).
Further research into what constitutes intrinsically safe
operator comfort and performance parameters for elbow
angles, is required.
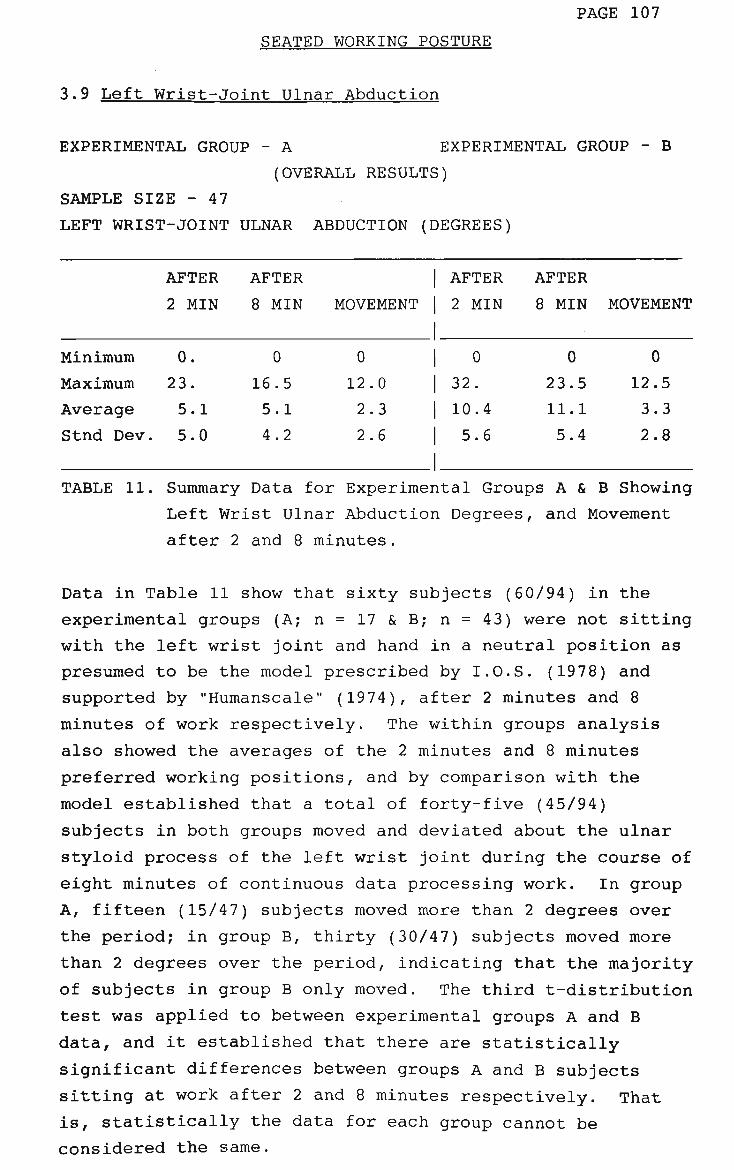
PAGE 107
SEATED WORKING POSTURE
3.9 Left Wrist-Joint Ulnar Abduction
EXPERIMENTAL GROUP - A EXPERIMENTAL GROUP - B
(OVERALL RESULTS)
SAMPLE SIZE - 47
LEFT WRIST-JOINT ULNAR ABDUCTION (DEGREES)
Minimum
Maximum
Average
Stnd Dev.
AFTER
2 MIN
0.
23.
5.1
5.0
AFTER
8 MIN
0
16.5
5.1
4.2
MOVEMENT
0
12.0
2.3
2.6
AFTER
2 MIN
0
32.
10.4
5.6
AFTER
8 MIN
0
23.5
11.1
5.4
MOVEMEN'
0
12.5
3.3
2.8
TABLE 11. Summary Data for Experimental Groups A & B Showing
Left Wrist Ulnar Abduction Degrees, and Movement
after 2 and 8 minutes.
Data in Table 11 show that sixty subjects (60/94) in the
experimental groups (A; n = 17 &B; n = 4 3 ) were not sitting
with the left wrist joint and hand in a neutral position as
presumed to be the model prescribed by I.O.S. (1978) and
supported by "Humanscale" (1974), after 2 minutes and 8
minutes of work respectively. The within groups analysis
also showed the averages of the 2 minutes and 8 minutes
preferred working positions, and by comparison with the
model established that a total of forty-five (45/94)
subjects in both groups moved and deviated about the ulnar
styloid process of the left wrist joint during the course of
eight minutes of continuous data processing work. In group
A, fifteen (15/47) subjects moved more than 2 degrees over
the period; in group B, thirty (30/47) subjects moved more
than 2 degrees over the period, indicating that the majority
of subjects in group B only moved. The third t-distribution
test was applied to between experimental groups A and B
data, and it established that there are statistically
significant differences between groups A and B subjects
sitting at work after 2 and 8 minutes respectively. That
is, statistically the data for each group cannot be
considered the same.
PAGE 108
SEATED WORKING POSTURE
3.9.1 Discussion of Left Wrist-Joint Ulnar Abduction
Results
The postural model prescribed by IOS (1978) presents the
wrist joints, hands and forearms in a straight-line and not
in a neutral or relaxed position to commence keying or
writing work. No value of degrees of deviation or normality
is presented by the model. The presentation of the wrist
joint posture appears to be contrary to the findings of NASA
(1978) in their weightlessness effects and neutral body
anthropometric measurements.
The technique for measuring ulnar abduction as the angle
formed along the anterior plane of the thumb to the meeting
point of the radial styloid process, and to the distal digit
of the middle finger forming a line along the capitate and
metacarpal bones (hand in the pronated position), requires a
value in degrees for neutral position.
There is insufficient data in "Humanscale" (1978) or within
the scientific literature, to confidently predict the range
or the mean for head inclination or left wrist-joint ulnar
abduction for a normally distributed adult population.
The ulnar deviations measured for most subjects within the
two groups were consistently close to the numeric averages
for each group, that is group A approximately 5 degrees and
group B approximately 10.5 degrees. The differences cannot
be explained by the data.
PAGE 109 SEATED WORKING POSTURE
Grandjean et al (1983) when reporting preferred settings of
VDT workstations, for ulnar abduction category from 236
observations and 59 subjects recorded a mean preference of 9
degrees, a standard deviation of 5.5 degrees and a minimum -
maximum range of 0 to 20 degrees. These results are between
those recorded for experimental groups A and B, but the
results cannot be explained by the data. Grandjean et al
(1982, 1983) reported that ulnar abduction results in
laboratory and field studies disclosed less important
changes than the other postural elements of trunk, head,
elbow and upper arm positions.
It is notable that the keyboard used by subjects in
experimental group A was a two-handed, split-field type with
a key top layout based upon the anthropometry of the
pronated hand; experimental group B subjects used an oblong
standard QWERTY layout keyboard.
There is little literature concerning keying performance as
a function of working posture, or of keyboard slope or
keyboard profile and working posture. Current keyboards are
either stepped, sloped or dished and as a consequence of
great variety little information is available about the
relative advantages of such profiles (Nelson, 1987).
Rose (1985) reported that finger operating posture in
keyboard use is compromised with straight key-rows not
matching different finger lengths, and when the hands are at
maximum pronation the fingers present at an angle to the
horizontal. The postural compromise to activate the keys
includes wrist joint ulnar deviation, and forces the
fingers, wrist-joints and forearm muscles into constraint
with a static muscle overlay.
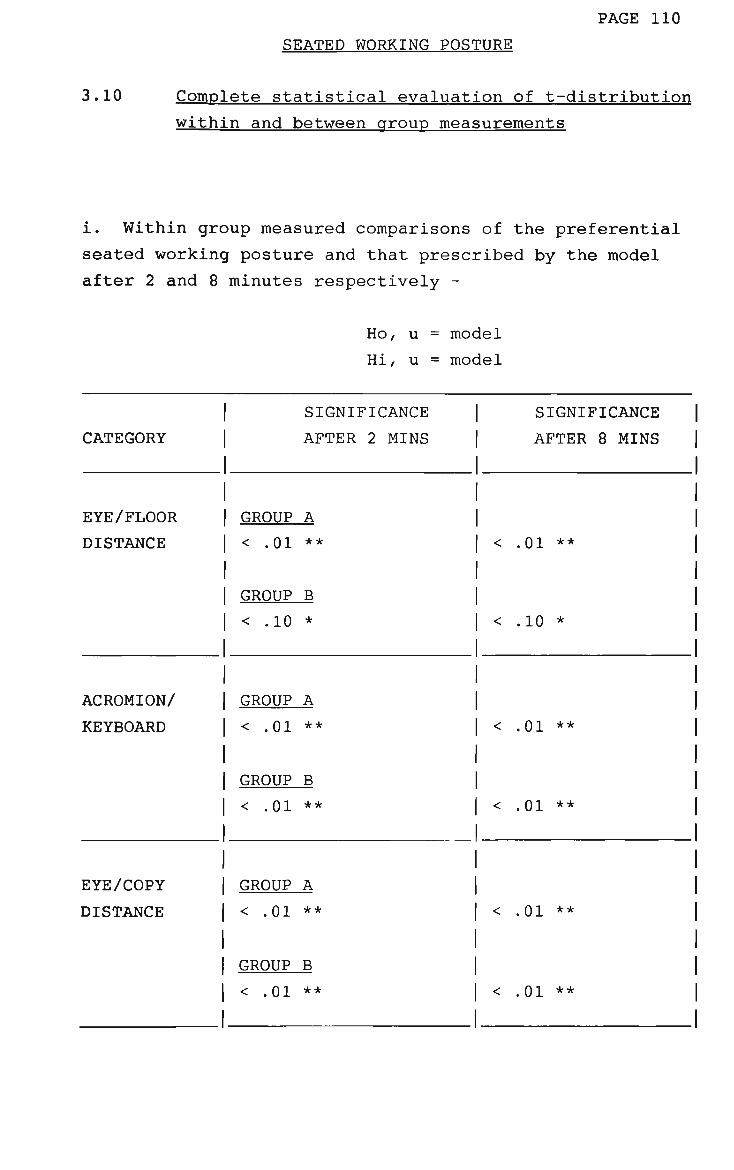
PAGE 110
SEATED WORKING POSTURE
3.10 Complete statistical evaluation of t-distribution
within and between group measurements
i. Within group measured comparisons of the preferential
seated working posture and that prescribed by the model
after 2 and 8 minutes respectively -
Ho, u = model
Hi, u = model
CATEGORY
EYE/FLOOR
DISTANCE
ACROMION/
KEYBOARD
EYE/COPY
DISTANCE
SIGNIFICANCE |
AFTER 2 MINS |
| GROUP A |
< .01 ** |
GROUP B |
< .10 * |
GROUP A |
< .01 ** |
GROUP B |
< .01 ** |
GROUP A |
< .01 ** |
GROUP B 1
SIGNIFICANCE AFTER 8 MINS
< .01 **
10
< .01 **
< .01 **
< .01 **
< .01 ** < .01 **
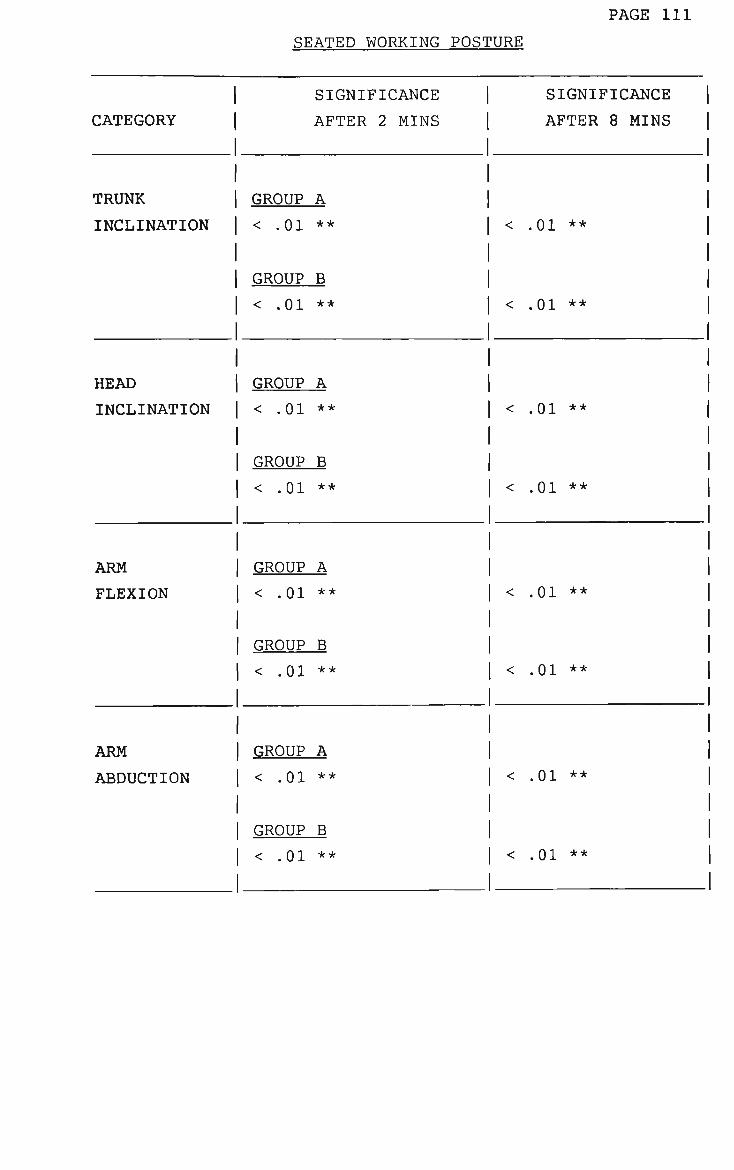
PAGE 111
SEATED WORKING POSTURE
CATEGORY
TRUNK INCLINATION
HEAD INCLINATION
ARM FLEXION
ARM ABDUCTION
SIGNIFICANCE
AFTER
GROUP A
< .01 **
GROUP B
< .01 **
GROUP A
< .01 **
GROUP B
< .01 **
GROUP A
< .01 **
GROUP B
< .01 **
GROUP A
< .01 **
GROUP B
2 MINS
<
<
<
<
<
<
<
SIGNIFICANCE
AFTER 8 MINS
.01 **
.01 **
.01 **
.01 **
.01 **
.01 **
.01 **
< .01 ** < .01 **
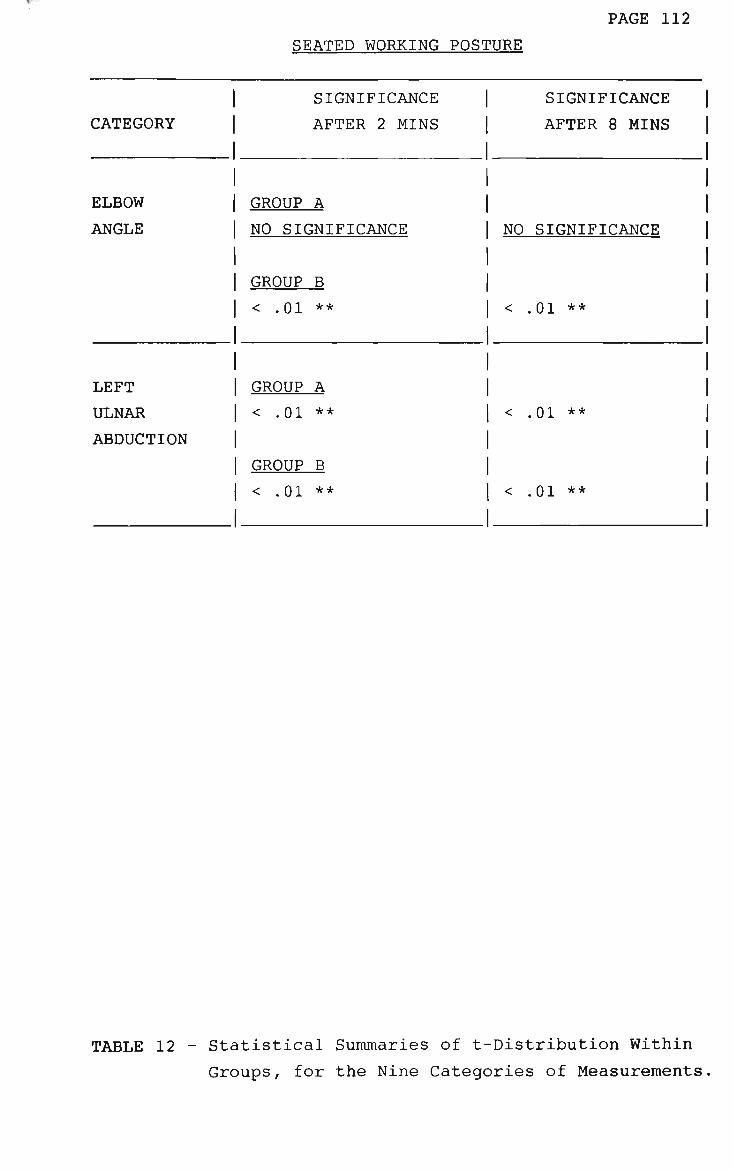
PAGE 112
SEATED WORKING POSTURE
CATEGORY
ELBOW ANGLE
LEFT ULNAR
ABDUCTION
SIGNIFICANCE
AFTER
GROUP A
2 MINS
NO SIGNIFICANCE
GROUP B
< .01 **
GROUP A
< .01 **
GROUP B
< .01 **
SIGNIFICANCE |
AFTER 8 MINS |
NO SIGNIFICANCE |
< .01 ** |
< .01 ** |
< .01 ** |
TABLE 12 - Statistical Summaries of t-Distribution Within
Groups, for the Nine Categories of Measurements
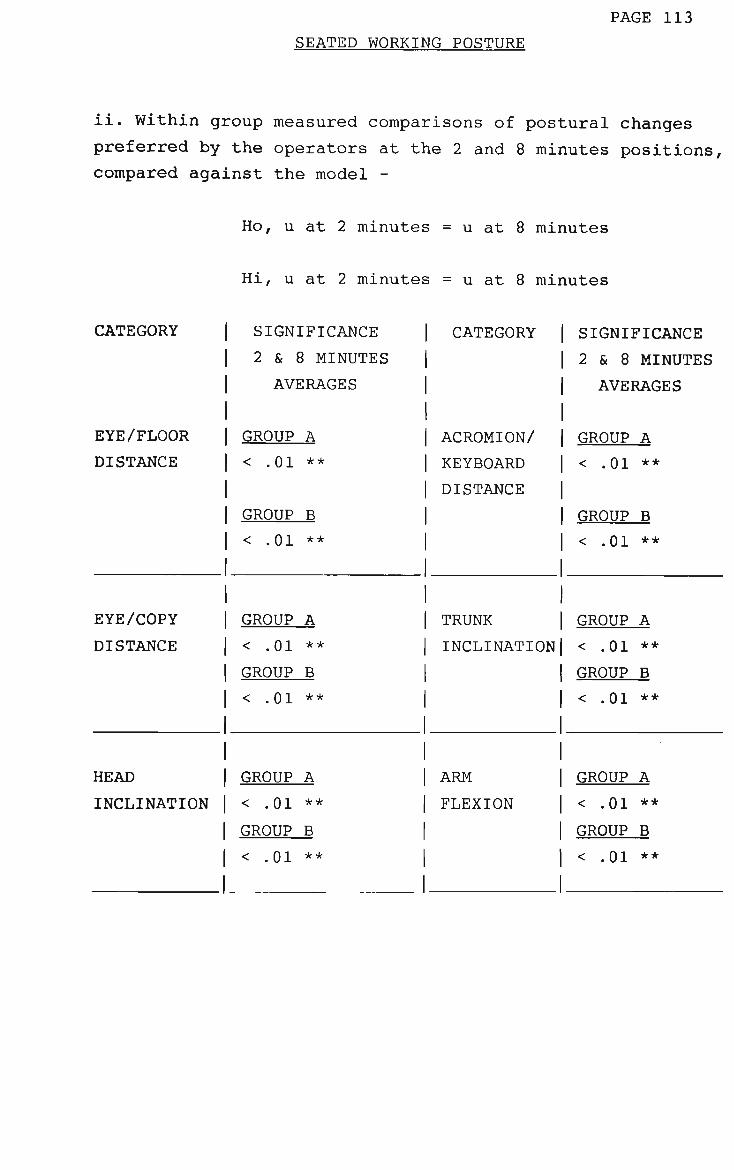
PAGE 113
SEATED WORKING POSTURE
ii. Within group measured comparisons of postural changes
preferred by the operators at the 2 and 8 minutes positions,
compared against the model -
Ho, u at 2 minutes = u at 8 minutes
Hi, u at 2 minutes = u at 8 minutes
CATEGORY
EYE/FLOOR
DISTANCE
EYE/COPY
DISTANCE
HEAD
INCLINATION
| SIGNIFICANCE
( 2 & 1 3 MINUTES
AVERAGES
| GROUP
< .01
| GROUP
< .01
GROUP
< .01
GROUP
< .01
GROUP
< .01
GROUP
A **
B **
A **
B **
A **
B
CATEGORY
ACROMION/
KEYBOARD
DISTANCE
TRUNK
INCLINATION
ARM
FLEXION
SIGNIFICANCE
2 & 8 MINUTES
AVERAGES
GROUP
< .01
GROUP
< .01
GROUP
< .01
GROUP
< .01
GROUP
< .01
GROUP
A **
B **
A **
B **
A **
B
< .01 ** < .01 **

SEATED WORKING POSTURE
PAGE 114
CATEGORY
ARM
ABDUCTION
LEFT ULNAR
ABDUCTION
SIGNIFICANCE |
2 & I ) MINUTES |
AVERAGES
GROUP
< .01
GROUP
< .01
GROUP
< .01
| GROUP
< .01
A | ** 1
B | ** j
A |
** 1 B | ** 1
CATEGORY
ELBOW ANGLE
SIGNIFICANCE
2 & 8 MINUTES
AVERAGES
GROUP A
< .01 **
GROUP B
< .01 **
TABLE 13 - Statistical Summaries of the t-Distribution
Within Groups, for 9 categories of measurements.
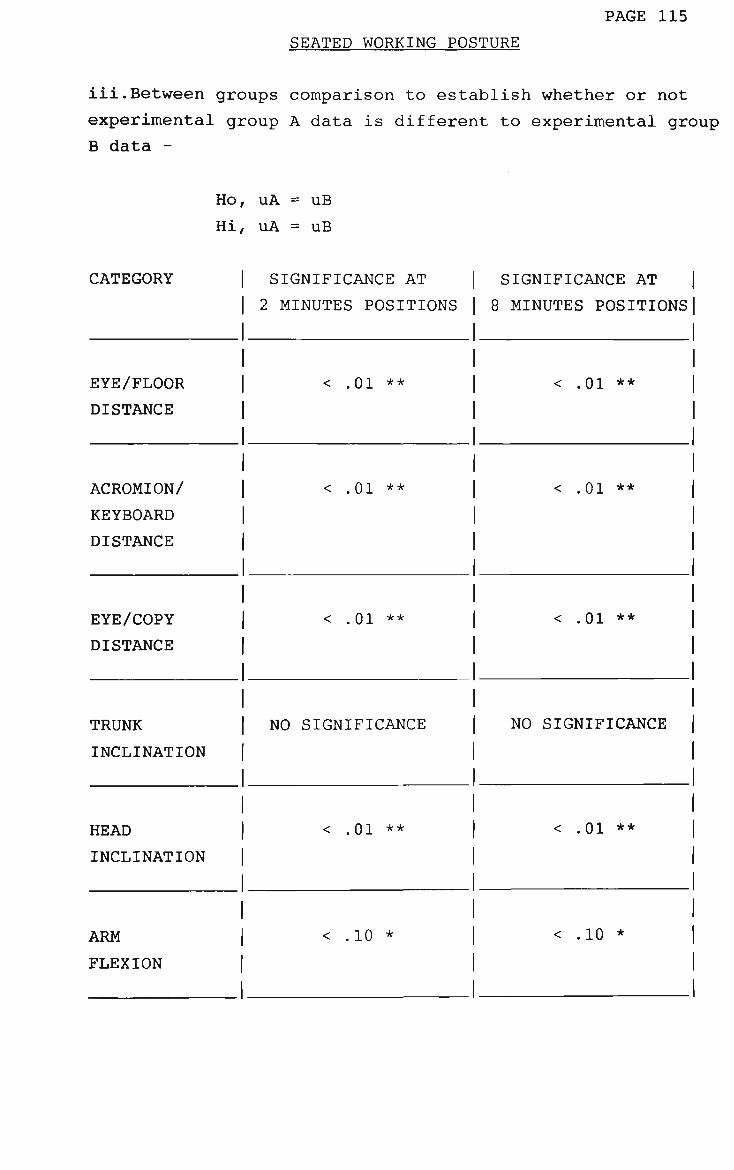
PAGE 115 SEATED WORKING POSTURE
iii.Between groups comparison to establish whether or not
experimental group A data is different to experimental group
B data -
Ho, uA = uB
Hi, uA = uB
CATEGORY
EYE/FLOOR
DISTANCE
ACROMION/
KEYBOARD
DISTANCE
EYE/COPY
DISTANCE
TRUNK
INCLINATION
HEAD
INCLINATION
ARM
FLEXION
SIGNIFICANCE AT
2 MINUTES POSITIONS
< .01 **
< .01 **
< .01 **
NO SIGNIFICANCE
< .01 **
< .10 *
SIGNIFICANCE AT j
8 MINUTES POSITIONS|
NO
<
<
<
.01
.01
.01
** 1
**
** 1
SIGNIFICANCE |
<
<
.01
.10
** 1
* 1
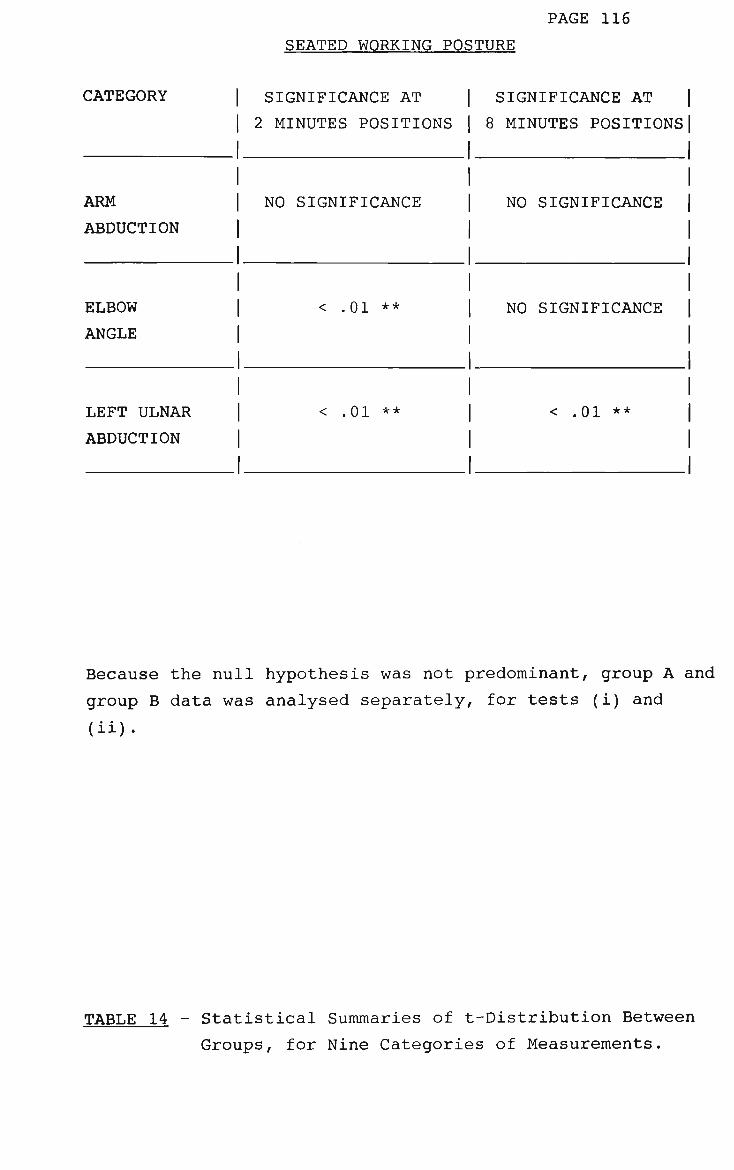
PAGE 116
SEATED WORKING POSTURE
CATEGORY
ARM
ABDUCTION
ELBOW ANGLE
LEFT ULNAR ABDUCTION
SIGNIFICANCE AT j SIGNIFICANCE AT |
2 MINUTES POSITIONS | 8 MINUTES POSITIONS]
NO SIGNIFICANCE | NO SIGNIFICANCE |
< .01 ** | NO SIGNIFICANCE |
< .01 ** | < .01 ** |
Because the null hypothesis was not predominant, group A and
group B data was analysed separately, for tests (i) and
(ii).
TABLE 14 - Statistical Summaries of t-Distribution Between
Groups, for Nine Categories of Measurements.
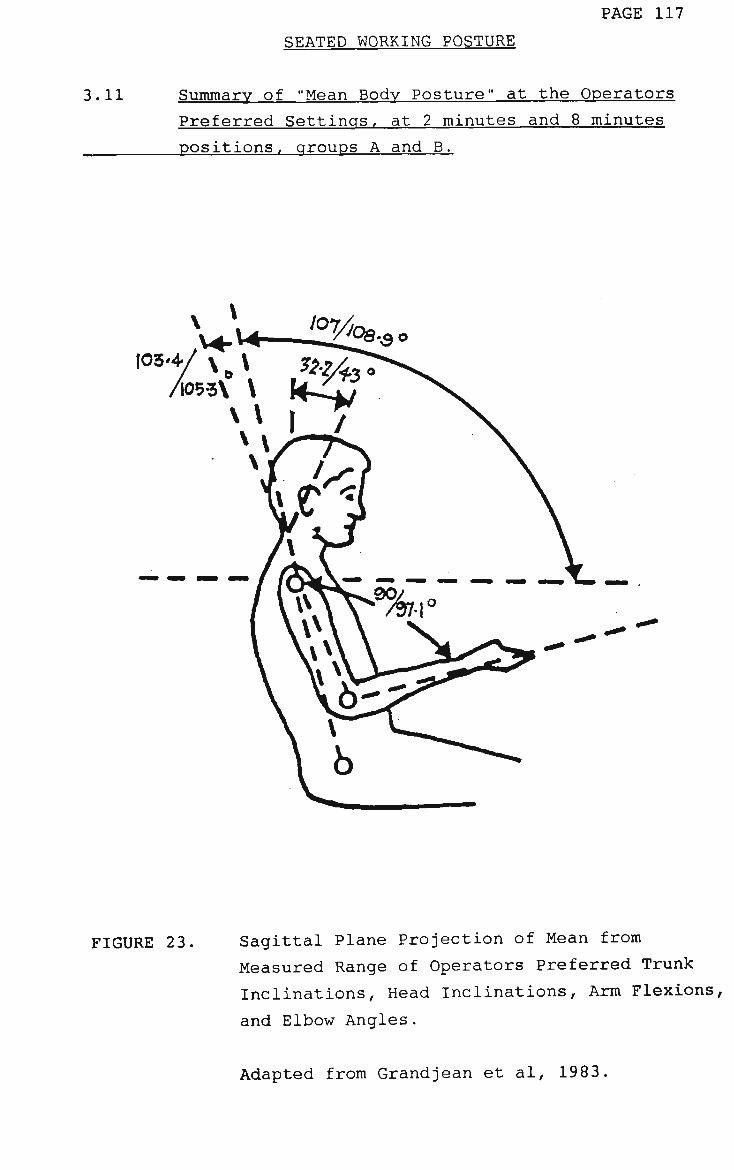
PAGE 117
SEATED WORKING POSTURE
3.11 Summary of "Mean Body Posture" at the Operators
Preferred Settings. at 2 minutes and 8 minutes
positions, groups A and B.
FIGURE 23 Sagittal Plane Projection of Mean from
Measured Range of Operators Preferred Trunk
Inclinations, Head Inclinations, Arm Flexions,
and Elbow Angles.
Adapted from Grandjean et al, 1983.
PAGE 118 SEATED WORKING POSTURE
3•12 Summary Discussion of graphical results for
Nine Categories of Measurement
Histograms for each of the nine categories of measurement
and for each experimental group, are presented in parallel
graphics form to compare behaviour. The bar projections for
each group represent the numerical averages of each
particular working position at the 2 and 8 minutes
measurement points. The histograms are "Appendix B" to the
paper. The histograms clearly show overall similarities in
behaviour between groups, and show absolutely that the
experimental subjects in both groups did not adopt the
training elements of the "German Square" postural model.
Scattergrams for each of the nine categories of measurement
and for each experimental group, are presented as actual
measurements at the 2 and 8 minutes measurement points for
comparative purposes to judge individual movements observed.
The scattergrams include "line of best fit" projections
based on the 2 minutes observation positions and the
measurement tolerances of + 5mm and + 2 degrees. The
scattergrams are "Appendix C" to the paper. The
scattergrams clearly show the consistency and the range of
movement within groups. The movements of individual
subjects over time are contrary to the "sit still" rules of
the "German Square" postural model.
PAGE 119 SEATED WORKING POSTURE
Relationship graphs depicting the three lineal categories of
measurement are shown separately each in single relationship
to all six of the angular measurements. Averages of the 2
and 8 minutes positions have been plotted. Results are
presented separately for each experimental group, and for
clarification "line of best fit" projections follow each of
the graphs. Relationship graphs are "Appendix D" to the
paper. Between groups comparisons indicate similarity in
behaviour over observed time. The preferred seated working
postures adopted by the experimental group subjects do not
correlate closely to the seated postural geometry shown and
described in the "German Square" model.
Relationship graphs comparing subject stature against the
angular measurements of trunk inclinations, head
inclinations, arm flexions and elbow angles, are "Appendix
E" to the paper. Separate graphs have been plotted for
experimental groups A and B and each plot is followed by a
"line of best fit" projection for clarification of the
relationships (if any exists). The relationship projections
associate an increase in subject stature with increase in
head inclination, and slight decrease in trunk inclination
with increase in subject stature. The results of these
relationship tests are inconclusive due to the relatively
small numbers of population sampled and the uniqueness of
the tests. Clearly, the results show that a range of
angular postures are preferred by seated operators
performing data processing work, and these postures are not
closely allied to the trunk upright and ninety degree limbs
geometry position.
Relationship graphs comparing lineal categories of
measurement have been plotted viz, eye to floor heights and
shoulder acromion process heights above the keyboard; eye to
floor heights and eye to copy distances; eye to copy
distances and shoulder acromion process heights above the
keyboard. The relationship graphs are shown as "Appendix F"
to the paper.

PAGE 120 SEATED WORKING POSTURE
The relationships are depicted in linear graphics with "line
of best fit" projections for clarification. All
relationships show a positive association, that is, as one
parameter increases then the others also increase.
The results of these relationship tests are inconclusive due
to the relatively small numbers of population sampled and
the uniqueness of the tests. Clearly, the results show a
linear relationship in seated working postures that do not
follow the upright trunk and ninety degree limbs posture
prescribed by the "German Square" model.
Of interest are the various relationships one to another; a
feature of the data is the consistency of adoption by the
experimental subjects of reclined seated working postures
that differ markedly to those prescribed by the "German
Square" postural model. The postural inter-relationships
are an interesting area of science which require further
investigation, and are not further discussed in the body of
the paper.
PAGE 121 SEATED WORKING POSTURE
4. CONCLUSIONS
There is considerable speculation about the nature of seated
working posture. The opportunities and the restraints the
operators who perform data processing work have imposed on
them during the course of the work, to promote or prevent
fatigue and discomfort, are not scientifically elucidated.
Research interests in the areas of seated working posture
are isolated to small numbers of medical and health
professionals who have concentrated enquiry into
physiological matters of the seated working position.
(Mandal, 1985).
For seated data process work (and all other sedentary
occupations) it is essential that the design of the
workstation and the ancillary equipment incorporates the
best human factors knowledge available. That research
continues and is organised into an holistic approach is
vital to determine what comprises a comfortable and
intrinsically safe seated working posture. The research
must attempt to explain the relationships between the nine
elements of postural position and other elements that may
arise by association, discussed within this paper.
Explanation of any relationship between seated operator
comfort, performance at the task and operator seated
postural preference must also be determined.
Important is the need to ensure that designers,
manufacturers of workstation furniture and ancillary
equipment and the procurers of all such equipment understand
what is meant by 'the best ergonomic features' required to
enhance appropriate seated working posture. This can only
be achieved through scientific research and the promotion
and spread of the knowledge gleaned from the work. This is
a dynamic process changing as knowledge increases.
PAGE 122
SEATED WORKING POSTURE
This study reviewed the scientific literature for seated
working posture and examined the standards that purport to
be based on it and found those standards inadequate in
technical content based on the current body of scientific
knowledge. In an attempt to improve the position, a
research method conducted in the workplace setting was
undertaken to examine and evaluate nine aspects of seated
postural comfort and performance. The study found operators
sat dynamically and adopted very different ranges of
preferred seated body positions to those prescribed by the
"German Square" postural model. These findings confirmed by
the impressions of many observers of seated working posture
(Grandjean et al 1982, 83), indicate that seated data
processor operators do not maintain an up-right trunk
posture.
The null hypothesis that operators prefer to adopt very
different seated postural positions to those prescribed and
administered in training based on the "German Square" seated
postural model, is proved.
Unfortunately, the call for information from the mid 1970's
promoted by the revolution of CRT based information
processing systems, has fostered a generation of standards
that are used internationally to promote an upright trunk,
90 degree limb geometry, looking straight ahead, static,
seated working posture. Such standards culminated in, and
are typified by the International Organisation for
Standardisation document TC 136/SC7, published in 1978.
These documents contain anecdotal and "state-of-the-art"
information which is not based in good scientific
principles.
PAGE 123 SEATED WORKING POSTURE
These documents may or may not specify the requirements for
seated working posture numerically and/or in degrees, or may
use loose terminology such as "the operator must be seated
comfortably" and are accompanied by a sagittal plane sketch
showing the "German Square" geometric elements of a seated
working position. As it is not known scientifically what
constitutes comfortable, and intrinsically safe working
posture, or what significance each of the elements of
posture has, it is preferable to use descriptive terminology
based upon the body of knowledge found in the scientific
literature. The use of numerical data can imply to the
recipient that the data are sound, which may not be the
case. The appropriate judge of seated postural comfort is
likely to be the experienced data processor operator, and
once instructed to consider qualities in the range known for
preferred seated working posture adequate subjective
information maybe fed-back to the researchers. However, it
should be the requirement for objectivity on the part of
those setting standards, that creates the need for further
research to be conducted into comfortable and intrinsically
safe, seated working posture. This has important
implications for the training and supervision of seated
workers.
It is against this background of uncertainty and incomplete
agreement among authorities that comparative data have been
generated in this study by field research and the results
evaluated against the model published by I.O.S. (1978), and
complimented by "Humanscale" (1974). The evaluation
included 9 categories of seated working postural elements
that may contribute to seated working comfort and
performance by data processor operators. It is cautioned
that the ranges measured for some of the categories, viz,
eye to screen distance, shoulder acromion to keyboard home
row height, elbow angle and wrist-joint ulnar abduction, are
wide and misinterpretable. The comparisons between the
model and the experimental results for the head inclination
category are invalid, due to an incorrect anatomical
interpretation by the "German Square" postural
specification, and should not be utilised in practice.

PAGE 124
SEATED WORKING POSTURE
As it can be shown that certain workstation furniture and
equipment design criteria affect seated operator comfort and
performance, then there is an ergonomic and an economic
incentive to produce furniture and equipment that include
scientifically ascertained design criteria. Only with
reliable data from scientific research into what constitutes
a comfortable and intrinsically safe working posture, can
this goal be achieved. Trade unions, employers, users,
buyers and insurers will demand products evolved in this way
and manufacturers will hasten to meet such demand.
At the time of writing, the Standards Association of
Australia published a standard for visual display terminals
(AS 3590.2-1990, "Screen-based workstations Part 2:
Workstation furniture) which included consideration of the
postural aspects required for seated work viewing to a CRT
screen and using a keyboard. The Association relied upon
the opinions, standards and the research that has been
produced in other countries because of the paucity of
research conducted locally. The I.O.S. (1978) "German
Square" postural model was not challenged by this standard
and was embodied without contradiction within the document.

PAGE 125 SEATED WORKING POSTURE
4. BIBLIOGRAPHY
During the investigation into aspects of seated working
posture, many references have been noted which have some
relevance to the thrust of the research.
Because of the numbers of and variation within the
scientific disciplines involved, it is not claimed that the
bibliography is complete. The sources listed are those
which the author has found useful in providing the
substantial background information required for the
investigation and research undertaken in this study.

PAGE 126
SEATED WORKING POSTURE
Aaras, A.:Neck and shoulder pain. In Nelson, M.(Ed): Low Back Pain and Industrial and Social Disablement. Middlesex, Back Pain Association, 1983, pp. 40-44.
Adams, M.A., and Hutton, W.C.: The effect of posture on the role of the apophysial joints in resisting intervertebral compressive forces. The Journal of Bone and Joint Surgery, 62-B:358-362, 1980. As reported in Zacharkow, D., (1988). Adams, M.A., and Hutton, W.C.: Prolapsed intervertebral disc. Spine, 7:184-191, 1982.
Akerblom, B.: Standing and Sitting Posture. Stockholm, Nordiska Bokhandeln, 1948.
Akerblom,B.: Chairs and sitting. In Floyd, W.F., and Welford, A.T.(Eds.):Symposium on Human Factors in Equipment Designs. London, Lewis, 1954, pp.29-35.
Alden, D.G., Daniels, R.W., Kanarick, A.F.: Keyboard design and operation: a review of the major issues. Human Factors, 14:275-293, 1972.
Andersson, B.J.G., Jonsson, B., and Ortengren, R.: Myoelectric activity in individual lumbar erector spinae muscles in sitting. A study with surface and wire electrodes. Scandinavian Journal of Rehbilitation Medicine, Supplement 3:91-108, 1974a. Andersson, B.J.G., and Ortengren, R.: Myoelectric back muscle activity during sitting. Scandinavian Journal of Rehabilitation Medicine, Supplement 3:73-90, 1974b.
Andersson, B.J.G., Ortengren, R. Nachemson, A., and Elfstrom, G.:Lumbar disc pressure and myoelectric back muscle activity during sitting. Part one. Studies on an experimental chair. Scandinavian Journal of Rehabilitation Medicine, 6:104-114, 1974c. Andersson, B.J.G., Ortengren, R., Nachemson, A., and Elfstrom, G.: Lumbar disc pressure and myoelectric back muscle activity during sitting. Part four. Studies on a car driver's seat. Scandinavian Journal of Rehabilitation Medicine, 6:128-133, 1974d. Andersson, B.J.G., and Ortengren, R.:Lumbar disc pressure and myoelectric back muscle activity during sitting. II. Studies on an office chair. Scandinavian Journal of Rehabilitation Medicine, 6:115-121,1974e. Andersson, B.J.G., Ortengren, R., Nachemson, A.L., Elfstrom, G., and Broman, H.: The sitting posture: an electromyographic and discometric study. Orthopedic Clinics of North America, 6:105-120, 1975.
Andersson, B.J.G.: The load on the lumbar spine in sitting postures. In Oborne, D.J., and Levis, J.A. (Eds): Human Factors in Transport Research, vol. 2 London, Academic Pr, 1980, pp.231-239.

PAGE 127 SEATED WORKING POSTURE
Andersson, G.B.J., Murphy, R.W., Ortengren, R., and Nachemson, A.L.: The influence of backrest inclination and lumbar support on lumbar lordosis. Spine, 4:52-58, 1979.
Arndt, R.: Body posture. In Health and Ergonomic Considerations of Visual Display Units - Symposium Proceedings. Denver, March 1-2, 1982, pp.29-44.
Asatekin, M.: Postural and physiological criteria for seating - a review. M.E.T.U. Journal of the Faculty of Architecture, 1:55-83, 1975.
Aveling, J.H.: Posture in Gynecic and Obstetric Practice. Philadelphia, Lindsay and Blakiston, 1879. As reported in Zacharkow, D., (1988).
Avon, G., & Schmitt, L., : Electromyographie Au trapeze dans diverses positions de travail a la machine a ecrire. Ergonomics, 18 : 619-625, 1975. (Abstract in English).
Ayoub, M.M.: Sitting down on the job (properly). Industrial Design, 19:42-45, April 1972.
Ayoub, M.M. : Work place design and posture. Human Factors, 15:265-268, 1973. Babbs, F.W.: A design layout method for relating seating to the occupant and vehicle. Ergonomics, 22:227-234, 1979. Bancroft, J.H.: The Posture of School Children. New York, Macmillan, 1913. As reported in Zacharkow, D., (1988).
Barlow, W.: An investigation into kinaesthesia. The Medical Press and Circular, 215:60-63, 1946. As reported in Zacharkow, D., (1988).
Barlow, W.: The Alexander Technique. New York, Warner, 1980.
Basmajian, J.V.: Surface Anatomy. Baltimore, Williams and Wilkins, 1977.
Basmajian, J.V: Muscles Alive. Their Functions Revealed by Electromyography, 4th ed. Baltimore, Williams and Wilkins, 1978.
Bell Telephone Laboratories: Video Display Terminals: Preliminary Guidelines for Selection, Installation, and Use. Short Hills, Bell Telephone Laboratories, 1983.
Bendix, T.: Seated trunk posture at various seat inclinations, seat heights, and table heights. Human Factors, 26:695-703, 1984.
Bendix, T., and Biering-Sorensen, F.:Posture of the trunk when sitting on forward inclining seats. Scandinavian Journal of Rehabilitation Medicine, 15:197-203, 1983.
Bendix, T., and Hagberg, M.: Trunk posture and load on the trapezius muscle whilst sitting at sloping desks. Ergonomics, 27:873-882, 1984.

PAGE 128 SEATED WORKING POSTURE
Bendix, T., Krohn, L., Jessen, F., and Aaras, A.: Trunk posture and trapezius muscle load while working in standing, supported-standing, and sitting positions. Spine, 10:433-439, 1985b. Bendix, T., Winkel, J., and Jessen, F.: Comparison of office chairs with fixed forwards or backwards inclining, or tiltable seats. European Journal of Applied Physiology, 54:378-385, 1985a. Bennett, H.E.: Some requirements of good school seating. Elementary School of Journal, 23:203-214, 1922. As reported in Zacharkow, D., (1988).
Bennett, H.E.: A study of school posture and seating. Elementary School Journal, 26:50-57, 1925. As reported in Zacharkow, D., (1988).
Bennett, H.E.: School Posture and Seating. Boston, Ginn and Company, 1928. As reported in Zacharkow, D., (1988).
Bennett, L.: Transferring load to flesh, part eight. Stasis and stress. Bulletin of Prosthetics Research, 10-23:202-210, Spring, 1975.
Blewett, V.L., : "Ergonomic Aspects of VDUs, Keyboards and Printers". Unpublished draft, Department of Social Security, Canberra, 1984.
Bowen, W.P.: A Teacher's Course in Physical Training. Ann Arbor, Wahr, 1917. As reported in Zacharkow, D., (1988).
Bowen, W.P.: Applied Anatomy and Kinesiology, 2nd ed. Philadelphia, Lea and Febiger, 1919. As reported in Zacharkow, D., (1988).
Bradford, E.H., and Stone, J.S.: The seating of school children. Transactions of the American Orthopaedic Association , 12:170-183, 1899. As reported in Zacharkow, D., (1988). Branton, P.: The Comfort of Easy Chairs. Stevenage, Hertfordshire, England, The Furniture Industry Research Association, 1966.
Branton, P.: Behaviour, body mechanics and discomfort. In Grandjean, E. (Ed): Proceedings of the Symposium on Sitting Posture. London, Taylor and Francis, 1969, pp.202-213.
Branton,P.: Seating in industry. Applied Ergonomics, 1:159-165, 1970.
Branton, P.: Backshapes of seated persons - how close can the interface be designed? Applied Ergonomics, 15:105-107, 1984.
Branton, P., and Grayson, G.: An evaluation of train seats by observation of sitting behaviour. Ergonomics, 10:35-51, 1967.

PAGE 129 SEATED WORKING POSTURE
Breasted, J.H.: "A History of Egypt". Second Edition, 15th Reprint Published Hodder and Stoughton : Chapter III, p.39, 1930.
Browne, T.J.: Habit and posture, part two. American Physical Education Review, 21:176-189,1916. As reported in Zacharkow, D., (1988).
Bunch, W.H., and Keagy, R.D.: Principles of Orthotic Treatment. Saint Louis, Mosby, 1976. As reported in Zacharkow, D., (1988).
Burandt, U.: Rontgenuntersuchung uber die stellung von becken und wirbelsaule beim sitzen auf vorgeneigten flachen. In Grandjean, E. (Ed.): Proceedings of the Symposium on Sitting Posture. London, Taylor and Francis, 1969, pp.242-250. Burandt, U., and Grandjean, E.: Sitting habits of office employees. Ergonomics, 6:217-228, 1963.
Cakir, A.: Human factors and VDT design. In Kolers, P.A., Wrolstad, M.E., and Bouma, H. (Eds): Processing of Visible Language 2. New York, Plenum Press, 1980, pp. 481-495.
Cakir,A.,Hart, D.J., and Stewart, T.F.M.: Visual Display Terminals. Chichester, Wiley, 1979.
Campbell, D.G.: Posture: a gesture toward life. The Physiotherapy Review, 15:43-47, 1935. As reported in Zacharkow, D., (1988).
Cantoni, S., Colombini, D., Occhipiniti, E., Grieco, A., Frigo, C , and Pedotti, A.: Posture analysis and evaluation at the old and new work place of a telephone company. In Grandjean, E. (Ed): Ergonomics and Health in Modern Offices. London, Taylor and Francis, 1984, pp.456-464. le Carpentier, E.F.: Easy chair dimensions for comfort-a subjective approach. In Grandjean, E. (Ed): Proceedings of the Symposium on Sitting Posture. London, Taylor and Francis, 1969, pp.214-223. Carsloo, S.: How Man Moves. London, Heinemann, 1972.
C.E.N., Comite Europen de Normalisation, Pr EN, AFNOR, Tour Europe CEDEX 7, 92080 Paris, La Defense (1978).
Chaffin, D.B.: Localized muscle fatigue - definition and measurement. Journal of Occupational Medicine, 15:346-354, 1973.
Chaffin, D.B.: Biomechanics of manual materials handling and low-back pain. In Zenz, C. (Ed): Occupational Medicine. Chicago, Year Book, 1975, pp. 443-467.
Chandler, F.A.: Stresses in a curved column. The Journal of Bone and Joint Surgery, 15:214, 1933.

PAGE 130 SEATED WORKING POSTURE
Chapanis, A.: Words, words, words. Human Factors, 7,1-17. 1965.
Chari, V.R., and Kirby, R.L.: Influence of the lower limbs on sitting balance while reaching forward. Archives of Physical Medicine and Rehabilitation, 66:529, 1985.
Chari, V.R., and Kirby, R.L.: Lower-limb influence on sitting balance while reaching forward. Archives of Physical Medicine and Rehabilitation, 67:730-733, 1986.
Coe, J.: Proof and practice: the design of a VDU work-station. In Fisher, A.J., and Croft, P. (Eds): Proceedings of the 17th Annual Conference of the Ergonomics Society of Australia and New Zealand. Sydney, Nov 27-28, pp. 187-197, 1980. Coghill, G.E.: The educational methods of F. Matthias Alexander. In Alexander, F.M.: The Universal Constant in Living. New York, Dutton, pp. xxi-xxviii, 1941.
Cohn, H.: The Hygiene of the Eye in Schools. London, Simpkin, Marshall and Co., 1886. As reported in Zacharkow, D., (1988).
le Corbusier, C.E.J.,. "Towards a new Architecture". 1947
Corlett, E.N.: Human factors in the design of manufacturing systems. Human Factors, 15:105-110, 1973.
Corlett, E.N.: Pain, posture and performance. In Corlett, E.N., and Richardson, J.: Stress, Work Design, and Productivity. Chichester, John Wiley and Sons, 1981, pp. 27-42. Corlett, E.N., and Bishop R.P.: A technique for assessing postural discomfort. Ergonomics, 19:175-182, 1976.
Corlett, E.N., and Eklund, J.A.E.: How does a backrest work? Applied Ergonomics, 15:111-114, 1984.
Corlett, E.N., Eklund, J.A., Houghton, C.S., and Webb, R.: A design for a sit-stand stool. In Coombes, K. (Ed): Proceedings of the Ergonomics Society's Conference 1983. New York, Taylor and Francis, 1983,p. 157. Cotton. F.J.: School furniture for Boston schools. American Physical Education Review, 9:267-284, 1904. As reported in Zacharkow, D., (1988).
Cotton, F.J.: Report on School Furniture. Appendix 6, Boston City Document No. 35, 1905, pp.81-86. As reported in Zacharkow, D., (1988).
Cyriax, J.: The Slipped Disc, 2nd edition. Epping, Gower, 1975.
Dainoff, M.: Some issues surrounding the design of ergonomic office chairs. In Cohen, B.G.F. (Ed): Human Aspects in Office Automation. Amsterdam, Elsevier, 1984, pp.143-151.

PAGE 131 SEATED WORKING POSTURE
Damkot, D.K., Pope, M.H., Lord, J., and Frymoyer, J.W.: The relationship between work history, work environment and low-back pain in men. Spine, 9:395-399, 1984.
Damodaran, L., Simpson, A., and Wilson, P.: Designing Systems for People. Manchester, NCC Publications, 1980.
Danske Arkitekters Landsforbund: Skolemobler. Copenhagen 1981. As reported in Mandal, A.C, (1981).
Darcus, H.D., & Weddell, A.G.M.,: Some anatomical and physiological principles concerned in the design of seats for naval war-weapons. British Medical Bulletin, 5: 31-37, 1947. Dempsey, C.A.: Body support/restraint. Product Engineering, 38:106-115, 1962.
Dempster, W.T.: The anthropometry of body action. Annals of the New York Academy of Sciences, 63:559-585, 1955.
Dickens, C.,. "The Pickwick Papers". 1837.
Diffrient, N.: Design with backbone. Industrial Design, 17:44-47, October 1970.
Diffrient, N., Tilley, A.R., and Bardagjy, J.C.: Humanscale 1/2/3. Cambridge, MIT Pr, 1974.
Diffrient, N., Tilley, A.R., and Harman, D.: Humanscale 4/5/6, 7/8/9. Cambridge, MIT Pr, 1981.
DIN Norm 4549,: Entwurf Juni 1981. Schreibtische. Buromaschinentische und Bildschirmarbeitstische. Berlin : Beuth Verlag. 1981. English translation, 1987.
Dresslar, F.B.: School Hygiene. New York, Macmillan, 1917. As reported in Zacharkow, D., (1988).
Drew, L.C.: Individual Gymnastics, 3rd ed. Philadelphia, Lea and Febiger, 1926.
Dreyfuss, H.: Designing for people. New York. Simon & Schuster. 1955.
Drury, C.G. and Coury, B.G.: A methodology for chiar evaluation. Applied Ergonmics, 13:195-202, 1982.
Drury, C.G., and Francher, M.: Evaluation of a forward-sloping chair. Applied Ergonomics, 16:41-47, 1985.
Eastman, M.C., and Kamon, E.: Posture and subjective evaluation at flat and slanted desks. Human Factors, 18:15-26,1976.
Edwards, R., 1954. "The Dictionary of English Furniture", Vol I (Revised), London.

PAGE 132 SEATED WORKING POSTURE
Ekholm, J., Arborelius, U.P., and Nemeth, G.: The load on the lumbosaccral joint and trunk muscle activity during lifting. Ergonomics, 25:145-161, 1982.
Eklund, J., and Corlett, E.N.: Shrinkage as a measure of the effect of load on the spine. Spine, 9:189-194, 1984.
Eklund, J.A.E., and Corlett, E.N.: Shrinkage - a measure for the evaluation of ergonomic designs. In Brown, I.D., Goldsmith, R., Coombes, K., and Sinclair, M.A.: Ergonomics International 85. Proceedings of the Ninth Congress of the International Ergonomics Association, London, Taylor and Francis, pp.415-417, 1985. Elias, R., Cail, F., Tisserand, M., and Christmann, H.: Investigations in operators working with CRT display terminals: relationships between task content and psychophysiological alterations. In Grandjean, E., and Vigliani, E. (Eds.): Ergonomic Aspects of Visual Display Terminals. London, Taylor and Francis, pp.211-217, 1983. Eliot, S.A.: 1833: Quoted in Hartwell, pp. 195-196, 1895. Encyclopaedia Britannica. 1987. Micropaedia II, Ready Reference: Solovyov - Truck. Pages 67 9-680.
Ferguson, D., and Duncan, J.: Keyboard design and operating posture. Ergonomics, 17:731-744, 1974.
Fiorini, G.T., and McCammond, D.: Forces on lumbo-vertebral facets. Annals of Biomedical Engineering, 4:354-363, 1976.
Floyd, W.F., and Roberts, D.F.: Anatomical and physiological principles in chair and table design. Ergonomics, 2:1-16, 1958.
Floyd, W.F., and Ward J.S.: Posture of schoolchildren and office workers. In Proceedings of Second International Congress on Ergonomics, Dortmund, pp. 351-360, 1964.
Floyd, W.F., and Ward, J.S.: Anthropometric and physiological considerations in school, office and factory seating. In Grandjean, E. (Ed): proceedings, of the Symposium on Sitting Posture. London, Taylor and Francis, pp. 18-25, 1969. Frankel, V.H., & Nordin, M.,: Biomechanics of the Lumbar Spine in Flexion, Extension, Lateral Flexion and Rotation. 1980. (Adapted from White and Panjabi, 1978).
Fries, E.C., and Hellebrandt, F.A.: The influence of pregnancy on the location of the center of gravity, postural stability, and body alignment. American Journal of Obstetrics and Gynecology, 46:374-380, 1943. As reported in Zacharkow, D., (1988).
SEATED WORKING POSTURE PAGE 133
Frymoyer. J.W., and Pope, M.H.: The role of trauma in low back pain : a review. The Journal of Trauma, 18:628-634, 1978.
Garner, J.R.: Proper seating. Industrial Medicine, 5:324-327, 1936. As reported in Zacharkow, D., (1988).
Gloag, John: The Englishmans Chair. George Allen & Unwin Ltd. London 1964.
Goldthwait, J.E.: The relation of posture to human efficiency and the influence of poise upon the support and function of the viscera. The Boston Medical and Surgical Journal, 161:839-848, 1909. Goldthwait, J.E.: The opportunity for the orthopedist in preventive medicine through educational work on posture. The American Journal of Orthopedic Surgery, 14:443-449,1916.
Goldthwait, J.E.: The importance of correct furniture to assit in the best body function, as recognised by the Massachusetts Institute of Technology and Smith College. The Journal of Bone and Joint Surgery, 5:179-184, 1923. Gould, J.D. and Grischowsky, N.,: Doing the same work with hard copy and with CRT computer terminals. Human Factors 26(3): 323-337. 1984.
Gould, J.D. and Grischowsky, N.,: Does visual angle of a line of characters affect reading speed? Human Factors 28(2): 165-173, 1986.
Gracovetsky, S.,. "The Spinal Engine". Published by Springer-Verlag Wein - New York 1988.
Grandjean, E.: Fatigue: its physiological and phychological significance, Ergonomics, 11:427-436, 1968.
Grandjean, E.: Fatigue. American Industrial Hygiene Association Journal, 31:401-411, 1970.
Grandjean, E.: Ergonomics of the Home. London, Taylor and Francis, 1973.
Grandjean, E.: Fitting the Task to the Man, 3rd ed. London, Taylor and Francis, 1980a.
Grandjean, E.: Sitting posture of car drivers from the point of view of ergonomics. In Oborne, D.J., and Levis, J.A. (Eds.): Human Factors in Transport Research, vol 2. London, Academic Pr, 1980b, pp.205-213. Grandjean, E.: Preface. In Grandjean, E. (Ed): Ergonomics and Health in Modern Offices. London, Taylor and Francis, 1984a.
PAGE 134 SEATED WORKING POSTURE
Grandjean, E.: Postural problems at office machine work stations. In Grandjean, E. (Ed.): Ergonomics and Health in Modern Offices. London, Taylor and Francis, 1984b, pp. 445-455.
Grandjean, E.: Postures and the design of VDT workstations. Behaviour and Information Technology, 3:301-311, 1984c.
Grandjean, E., and Hunting, W.: Ergonomics of posture -review of various problems of standing and sitting posture. Applied Ergonomics, 8:135-140, 1977.
Grandjean, E., Hunting. W., Maeda, K., and Laubli, Th.: Constrained postures at office workstations. In Kvalseth, T.O. (Ed.): Ergonomics of Workstation Design. London, Butterworths, 1983b, pp.19-27. Grandjean, E., Hunting, W., and Nishiyama, K.: Preferred VDT workstation settings, body posture and physical impairments. Journal of Human Ergology, 11:45-53, 1982.
Grandjean, E., Hunting, W., and Nishiyama, K.: Preferred VDT workstation settings, body posture and physical impairments. Applied Ergonomics, 15:99-104, 1984.
Grandjean, E., Hunting, W., and Piderman, M.: VDT workstation design: preferred settings and their effects. Human Factors, 25:161-175, 1983a.
Grandjean, E., Hunting, W., Wotzka, G., and Scharer, R.: An ergonomic investigation of multipurpose chairs. Human Factors, 15:247-255, 1973.
Grandjean, E., Nishiyama, K., Hunting, W., and Piderman, M.: A laboratory study on preferred and imposed settings of a VDT workstation. Behaviour and Information Technology, 1:289-304, 1982. Granstrom, B., Kvarnstrom, S., and Tiefenbacher, F.: Electromyography as an aid in the prevention of excessive shoulder strain. Applied Ergonomics 16:49-54, 1985.
Gray, F.E., Hanson, J.A., and Jones, F.P.: Postural aspects of neck muscle tension. Ergonomics, 9:245-256, 1966.
Grieve, D., and Pheasant, S.: Biomechanics. In Singleton, W.T. (Ed): The Body at Work. Cambridge, Cambridge Univ., 1982, pp.71-200.
Hall, E.C.: Seating for transportation. In Shinnick, T., and Hill, G. (Eds): Proceedings of the 20th Annual Conference of the Ergonomics Society of Australia and New Zealand. Adelaide, South Australia, Dec. 1-2, 1983, pp. 191-211. Harmon, D.B.: The Co-ordinated Classroom. Grand Rapids. American Seating Company, 1949. As reported in Zacharkow, D., (1988).

PAGE 135 SEATED WORKING POSTURE
Hartwell, E.M.: The Problem of School Seating. In Annual Report of the Superintendent of Schools, School Document No. 4, Boston, 1895,pp.169-236. As reported in Zacharkow, D., (1988) . Harris, M. and Sons,: "The English Chair". London, 1937.
Helander, M.G. and Rupp, P.A., "An Overview of standardised guideliens for visual display terminals". Applied Ergonomics 15(3): pp. 185-195, 1984.
Helbig, K.: Sitzdruckverteilung beim ungepolsterten sitz. Anthropologischer Anzieger, 36:194-202,1978. As reported in Zacharkow, D. (1988).
Hawley, G.: The Kinesiology of Corrective Exercise. Philadelphia, Lea and Febiger, 1937. As reported in Zacharkow, D., (1988).
Hellebrandt, F.A.: Standing as a geotropic reflex. American Journal of Physiology, 21:471-474, 19 38.
Hennessey, M.: Work posture and kinesiology: an ergonomic checklist. In Adams, A.S., and Stevenson, M.G. (Eds): Proceedings of the 21st Annual Conference of the Ergonmics Society of Australia and New Zealand, Sydney, 1984, pp.147-158. Hertzberg, H.T.E.: Seat comfort. In Hertzberg, H.T.E. (Ed).: Annotated Bibliography of Applied Physical Anthropoligy in Human Engineering. WADC Technical Report 56-30, Wright Air Development Center, Wright-Patterson Air Force Base, Dayton, Ohio, Appendix 1, pp.297-300, 1958. Hertzberg, H.T.E.: "Average" man is a fiction: range of sizes is key to efficient work places. Contract, 11:86-89, 1970. Hertzberg, H.T.E.: The Human Buttocks in Sitting: Pressures, Patterns, and Palliatives. Society of Automotive Engineers, publication no. 720005, 1972.
Hira, D.S.: An ergonomic appraisal of educational desks. Ergonomics, 23:213-221, 1980.
Hockenberry, J.: A systems approach to long term task seating design. In Easterby, R., Kroemer, K.H.E., and Chaffin, D.B. (Eds): Anthropomery and Biomechanics. Theory and Application. New York, Plenum, 1982, pp.225-234. Hooton, E.A.,: A survey in seating: Westport, Greenwood Press, 1945.
PAGE 136 SEATED WORKING POSTURE
Howarth, P.A., and Instance, H.O., The association between visual discomfort and the use of visual display units. Behaviour and Information technology 4(2): 131-149. 1985.
Hunting, W., Grandjean, E., and Maeda, K.: Constrained postures in accounting machine operators. Applied Ergonomics, 11:145-149, 1980.
Hunting, W., Laubli, Th., and Grandjean, E.: Postural and visual loads at VDT workplaces. 1. Constrained postures. Ergonomics, 24:917-931, 1981.
Huskisson, E.C.: Measurement of Pain. The Lancet. Page 1127. 1974.
International Organisation for Standardisation (I.O.S.). Postural Standard TC 136/SC7. Technischer Uberwachungsverein, Rheinland, Koln. 1978.
Jaschiniski-Kruza, W.,: Transient myopia after visual work. Ergonomics 27(11): 1181-1189. 1984.
Jones, F.P., Gray, F.E., Hanson, J.A., and Shoop, J.D.: Neck muscle tension and the postural image. Ergonomics, 4:133-142, 1961.
Kaplan, A.: Selecting a chair for the office. Modern Office Procedures, 26:130, 1981.
Keagy, R.D., Brumlik, J., and Berman, J.J.: Direct electromyography of the psoas major muscle in man. The Journal of Bone and Joint Surgery, 48-A: 1377-1382, 1966.
Keegan, J.L.: Alterations of the lumbar curve related to posture and seating. The Journal of Bone and Joint Surgery, No 3, Vol 35A:589-603, 1953.
Keegan, J.J.: Evaluation and improvement of seats. Industrial Medicine and Surgery, 31:137-148, 1962.
Keegan, J.J: The Medical Problem of Lumbar Spine Flattening in Automobile Seats. Society of Automotive Engineers, Publication 838A, 1964.
Keith, A.: Man's posture: its evolution and disorders. Lecture two. The evolution of the orthograde spine. The British Medical Journal, 1:499-502, 1923a. As reported in Zacharkow, D., (1988). Keith, A.: Man's posture: its evolution and disorders. Lecture four. The adaptations of the abdomen and of its viscera to the orthograde posture. The British Medical Journal, 1:587-590, 1923b. As reported in Zacharkow, D., (1988).
PAGE 137 SEATED WORKING POSTURE
King, G.R.: A study of Relationships Between the Changes in the Position of Body Segments When "Natural" Standing Position Is Altered to "Best" Standing Position. Thesis, Wellesley College, Wellesley, Massachusetts, June 1932. As reported in Zacharkow, D., (1988). Knave, B.G.: The visual display unit. In Ledin, H. (Ed.): Ergonomic Principles in Office Automation, 2nd ed. Bromma, Ericsson Information Systems AB, 1983, pp.11-41.
Kotelmann,L: School Hygiene. Syracuse, Bardeen, 1899. As reported in Zacharkow, D., (1988).
Kottke, F.J.: Evaluation and treatment of low back pain due to mechanical causes. Archives of Physical Medicine and Rehabilitation, 42:426-440,1961.
Kramer, J.: Pressure dependent fluid shifts in the intervertebral disc. Orthopedic Clinics of North America, 8:211-216, 1977.
Kroemer, K.H.E.: Seating in plant and office. American Industrial Hygiene Association Journal, 32:633-652, 1971.
Kroemer, K.H.E., and Hill, S.G.: Preferred line of sight angle. Ergonomics, 29.1129-1134, 1986.
Kroemer, K.H.E., and Robinette, J.C.: Ergonomics in the Design of Office Furniture. A Review of European Literature. Technical Report AMRL-TR-68-80. Aerospace Medical Research Laboratories, Wright-Patterson Air Force Base, Ohio, July 1968. Kroemer, K.H.E., and Robinette, J.C.: Ergonomics in the design of office furniture. Industrial Medicine, 38: 115-125, 1969.
Kruk, R.S. and Muter, P., Reading of continuous text on video screens. Human Factors 26(3) : 339-345. 1984.
Kukkonen, R., Huuhtanen, P., and Hakala, P.: Prevalence of data operators' musculoskeletal symptoms during the workday and work week. Behaviour and Information Technology, 3:347-351, 1984. Kvarnstrom, S: Occurrence of musculoskeletal disorders in a manufacturing industry, with special attention to occupational shoulder disorders. Scandinavian Journal of Rehabilitation Medicine, Supplement 8:1 - 114, 1983. Lander, C, Korbon, G.A., DeGood, D.E., and Rowlingson, J.C.: The Balans chair and its semi-kneeling position: an ergonomic comparison with the conventional sitting position. Spine, 12:269-272, 1987.

SEATED WORKING POSTURE PAGE 138
Leibowitz, J.: For the victims of our culture: the Alexander technique. Dance Scope, 4:32-37, 1967.
Less, M., & Eichkelberg, W.W.B., : Force changes in neck vertebrae and muscles. In Komi, P.V. (ed.): Biomechanics V-A International Series on Biomechanics, vol 1A. Baltimore, Univ. Park, 1976, pp. 530-536. As cited in Zacharkow, D., (1988). Life, M.A., and Pheasant, S.T.: An integrated approach to the study of posture in keyboard operation. Applied Ergonomics, 15: 83-90, 1984.
Lindh, M.: Biomechanics of the lumbar spine. In Frankel, V.H., and Nordin, M. (Eds.): Basic Biomechanics of the Skeletal System. Philadelphia, Lea and Febiger, 1980, pp.255-290. Logie, G., "Furniture From Machines". Section I, Pages 2-3, published George Allen and Unwin Ltd. London, 1947.
Lorenz, A.: Die Heutige Schulbankfrae. Wien, 1888. Condensed translation in Hartwell (1895). As cited by Zaccharkow, D., (1988).
Lundervold, A.: Elecromyographic investigations of position and manner of working in typewriting. Acta Physiologica Scandinavica, 24 (Supplementum 84):1-171, 1951a.
Lundervold, A.: Electromyographic investigations during sedentary work, especially typewriting. The British Journal of Physical Medicine, 14:32-36, 1951b.
Macaulay, M.A. : Seating and visibility. In Giles, J.G. (Ed.): Vehicle Operation and Testing. London, Iliffe, pp. 28-46, 1969.
McConnel, J.K. : The adjustment of Muscular Habits. London, Lewis, 1933. As reported by Zacharkow, D., (1988).
Maeda, K., Hunting, W., and Grandjean, E.: Localized fatigue in accounting machine operators. Journal of Occupational Medicine, 22:810-816, 1980.
Mahlamakis, Rauhala, E., Remes, A., and Hanninen, 0. : Effect of arm supports on EMG activity of trapezius muscles in typists. Acta Physiologica Scandinavica, 126 : 18A, 1986. Makris, P.E., Louizou, C, Markakis, C, Tsakiris, D.A., and Mandalaki, T.: Long lasting sitting position and haemostatis. Thrombosis and Haemostasis, 55:119-121, 1986.
Mandal, A.C: Ugeskr. f. Laeger, 132. Nr 36, 1699-1703, Arbejdsstol med vippesaede (Work chair with tilting seat). Copenhagen, 1970. (In Danish with English abstract).

PAGE 139 SEATED WORKING POSTURE
Mandal, A.C: Work-chair with tilting seat. Ergonomics, 19:157-164, 1976.
Mandal, A.C: The seated man (homo sedens). Applied Ergonomics, 12:19-26, 1981.
Mandal, A.C: The correct height of school furniture. Human Factors, 24:257-269, 1982.
Mandal, A.C: The correct height of school furniture. Physiotherapy, 70:48-53, 1984.
Mandal, A.C,: The Seated Man - Homo Sedens, Dafnia Publications, Denmark. 1985.
Marchant, R.P.: Comparison of polyurethane and latex foams for furniture. Journal of Cellular Plastics, 8:85-89, 1972.
Marriott, I.A., and Stuchly, M.A.: Health aspects of work with visual display terminals. Journal of Occupational Medicine, 28:833-848, 1986.
Meisenbach, R.,: In abstract of discussion. Journal of American Medical Association, 68:329-330, 1915. As cited by Zacharkow, D., (1988).
Menzies Foundation Technical Report No.3. "Research on Health in Human Populations". Editors Leeder, S. and Wigglesworth, E. Published by the Menzies Foundation. East Melbourne 1988. Mierau, D.R., Cassidy, J.D., Hamin, T., and Milne, R.A.: Sacroilac joint dysfunction and low back pain in school aged children. Journal of Manipulative and Physiological Therapeutics, 7:81-84, 1984. Morimoto, S. : Effect of Sitting Posture on Human Body. The Bulletin of Tokyo Medical and Dental University, 20 : 19-34, 1973.
Morrison, R.E.,: Retinal image size and the perceptual span in reading. In Rayner, K. "Eye movements in Reading : Perceptual and Language Processes". Academic Press, New York, pp 31-40. 1983.
Mosher, E.M.: Habitual postures of school children. Educational Review, 4:339-349, 1892. As reported in Zacharkow, D., (1988).
Mosher, E.M.: Hygienic desks for school children. Educational Review, 18:9-14, 1899. As reported in Zacharkow, D., (1988).
Mosher, E.M.: Health and Happiness. New York, Funk and Wagnalls, 1913. As reported in Zacharkow, D., (1988).
Mosher, E.M.: Faulty habits of posture, a cause of enteroptosis. International Journal of Surgery, 27:174-179, 1914. As reported in Zacharkow, D., (1988).

PAGE 140 SEATED WORKING POSTURE
Mosher, E.M.: Habits of posture as related to health and efficiency. International Journal of Surgery, 32:40-45, 1919. As reported in Zacharkow, D., (1988).
Murrell, K.F.H.: Ergonomics, Man in His Working Environment. London, Chapman and Hall, 1965.
NASA (National Aeronautics and Space Administration): Anthropometric Source Book. Volume I: Anthropometry for Designers. NASA Reference Publication 1024, 1978.
Nachemson, A.: Electromyographic studies on the vertebral portion of the psoas muscle. Acta Orthopaedica Scandinavica, 37:177-190, 1966.
Nachemson, A., and Elfstrom, G.: Intravital dynamic pressure measurements in lumbar discs. A study of common movements, maneuvers and exercises. Scandinavian Journal of Rehabilitation Medicine, Supplement 1:1-40, 1970. Nakaseko, M., Grandjean, E., Hunting, W., and Gierer, R.:Studies on ergonomically designed alphanumeric keyboards. Human Factors, 27:175-187, 1985.
National Insttute for Occupational Safety and Health: Potential Health Hazards of Video Display Terminals. Cincinnati, NIOSH Report No. 81-129, June 1981.
Nattali, M.A.,. "The British Museum: Egyptian Antiquities". Vol. II, Page 64. London 184 6.
Nelson, D.S.P.,: Ergonomic and Safety Characteristics of Visual Displays and Keyboards - a research method and technical specification. Ballarat College of Advanced Education. 1987. Neter, J., Wasserman, W. , and Whitmore, G.A. "Fundamental Statistics for Business and Economics". 4th Edition. Published by Allyn and Bacon, Inc., Boston 1973.
Occhipinti, E., Colombini, D., Frigo, C, Pedotti, A., and Grieco, A.: Sitting posture: analysis of lumbar stresses with upper limbs supported. Ergonomics, 28:1333-1346, 1985.
Office of the Commissioner for Employee's Compensation, Annual Report, 1985-86 Australian Government Publishing Service Canberra; pp. 8-9, 21-22. 1987.
Oshima, M.: Optimum conditions of seat design. In Proceedings of the Fourth International Ergonomics Association Congress, Strasbourg, July 6-10, 1970, pp.1-9.

PAGE 141 SEATED WORKING POSTURE
Ostberg, 0.:CRTs pose health problems for operators. International Journal of Occupational Health and Safety, 44:24-26, 46, 50, 52, Nov.-Dec. 1975.
Ostberg, 0.,: Accommodation and visual fatigue in display work. In Grandjean, E. and Vigliani, E. (eds.) "Ergonomic Aspects of VDT's". Taylor and Francis, London, pp. 41-52. 1982. Ostberg, 0,: Work environment issues of Swedish office workers: a union perspective. In Cohen, B.G.F.(Ed): Human Aspects in Office Automation. Amsterdam, Elsevier, 1984, pp.127-141. Oxford, H.W., Anthropometric data for educational chairs, Ergonomics, 12.2. 140-161. 1969.
Paine, R.T. & Soper, A. "The Art and Architecture of Japan". The Pelican History of Art : Published by Penguin Books 1960.
Petrie, Sir W.M.F., 1895. "Egyptian Decorative Art." Second Edition, Chapter III, Pages 89-90. London 1920.
Petrie, Sir W.M.F. "The Revolutions of Civilisation". Third Edition, Published Harper and Brothers. London and New York 1922.
Pope, P.M.: Proposals for the improvement of the unstable postural condition and some cautionary notes. Physiotherapy, 71:129-131, 1985.
Pottier, M., Dubreuil, A., and Moned, H. : Les variations de volume dupied au curs de la station assise prolongee. Le Travail Humain, 30 : 111-122, 1967. As reported in Zacharkow, D. (1988). (Abstract in English). Porter, C: School Hygiene and the Laws of Health. London, Longmans, Green, and Co., 1906. As reported in Zacharkow, D., (1988).
Poulsen, E., and Jorgensen, K.: Back muscle strength, lifting, and stooped working postures. Applied Ergonomics, 2:133-137, 1971.
Pustinger, C, Dainoff, M.J., and Smith, M.: VDT workstation adjustability: effects on worker posture, productivity, and health complaints. In Eberts, R.E., and Eberts, CG. (Eds.): Trends in Ergonomics/Human Factors II. Amsterdam, Elsevier, pp. 445-451, 1985. Rathbone, J.L.: Corrective Physical Education. Saunders, Philadelphia, 1934. As cited by Zacharkow, D., (1988).
Reynolds, E., and Hooton, E.A.: Relation of the pelvis to erect posture. American Journal of Physical Anthropology, 21:253-278, 1936. As reported by Zacharkow, D., (1988).

PAGE 142 SEATED WORKING POSTURE
Ridder, C.A.: Basic Design Measurements for Sitting. Agricultural Experiment Station, University of Arkansas, Fayetteville, Bulletin 616, October 1959.
Riskind, J.H., and Gotay, C.C.: Physical posture: could it have regulatory or feedback effects on motivation and emotion? Motivation and Emotion, 6:273-298, 1982.
Richter, A., "The CRT work environment". Tastrop, Denmark: Teknologisk Institute, Arbejdspsykologi. 1981. (In Danish with English abstract).
Richter, CM.A. , 1926. A History of Greek, Etruscan and Roman Furniture". Pages 45-53. The Metropolitan Museum of Art, New York. Published by Oxford : At the Clarendon Press.
Rohmert, W., and Luczak, H.: Ergonomics in the design and evaluation of a system for "postural video leter coding." Applied Ergonomics, 9:85-95, 1978.
Rose M.J., Development of Ergonomic Keyboards; Proceedings of the A.I.I.E. Conference, Sydney, N.S.W. 1985.
von Rotzler, W.: Ergonomics, Vol 12, No 2, 115-119, 1969.
Rowland, B. "The Art and Architecture of India". The Pelican History of Art : Published by Penguin Books 1953.
Ruhmann, H-P.: Basic data for the design of consoles. In Schmidtke, H. (Ed): Ergonomic Data for Equipment Design. New York, Plenum Press, pp.115-144, 1984.
Salminen, J.J.: The adolescent back. Acta Paediatrica Scandinavica, Supplement 315:1-122, 1984.
Schmidtke, H.: Ergonomic data for the design of body support. In Schmidtke, H. (Ed.): Ergonomic Data for Equipment Design. New York, Plenum Press, 1984, pp.159-178, 1984. Schoberth, H.: Sitzhaltung, Sitzchaden, Sitzmobel. Berlin, Springer-Verlag, 1962. (Abstract in English).
Schoberth, H.: Die wirbelsaule von schulkindern-orthopadische forderungen a schulsitze. In Grandjean, E. (Ed.): Proceedings of the Symposium on Sitting Posture. London, Taylor and Francis, pp. 98-111. Schuldt, K., Ekholm, J., Harms-Ringdahl, K., Nemeth, G., and Arborelius, U.P.: Effects of changes in sitting work posture on static neck and shoulder muscle activity. Ergonomics, 29:1525-1537, 1986.
Schurmeier, H.L.: A consideration of posture and its relation to bodily mechanics. American Medicine, 33:143-150, 1927.

PAGE 143 SEATED WORKING POSTURE
Secrest, D., and Dainoff, M.: Performance changes resulting from ergonomic factors in VDT data entry workstation design In Mital, A. (Ed.): Advances in Ergonomics/Human Factors I. Proceedings of the First Mid-Central Ergonomics/Human Factors Conference. Cincinnati, April 12-14, 1984. Seedhom, B.B., and Terayama, K.: Knee forces during the activity of getting out of a chair with and without the aid of arms. Biomedical Engineering, 11:278-282, 1976.
Shah, J.: The choice of cushion. Science and Practice of Physical Care, 1:61, July 1981. As reported in Zacharkow, D., (1988).
Shahnavaz, H and Hedman, L.,: Visual accommodation changes in VDU operators related to environmental lighting and screen quality. Ergonomics 27(10): 1071-1082. 1984.
Shaw, E.R.: School Hygiene. New York, Macmillan, 1902.
Shipley, P.: Chair comfort for the elderly and infirm. Nursing 20:858-860, 1980.
Shute, S.J., and Starr, S.J.: Effects of adjustable furniture on VDT users. Human Factors, 26:157-170, 1984.
Smith, M.J.: Human factors issues in VDT use: environmental and workstation design considerations. IEEE Computer Graphics and Applications, 4:56-63, November 1984.
Snorreson, E.: Tidsskrift for danske sygehuyse. Nr. 22, 1968. As reported in Mandal, A.C, (1981).
Snyder, H.L.,: The sensitivity of response measures of alpha numeric legibility to variations in dot matrix parameters. Human Factors 21(4) 457-471. 1979.
Spiegel, M.R. "Schaum's outline series", Theory and problems of Statistics". Published by McGraw-Hill. New York 1972.
Springer, T.J.: Selecting the right furniture. The Ergonomics Newsletter, 2:17-19, 1983.
Staffel, F.: Zur hygiene des sitzens. Zentralblatt fur Allgemeine Gesundheitsflege, 3:403-421, 1884. As reported in Zacharkow, D., (1980).
Staffel, F.: Die Menschlichen Haltungstypen und ihre Beziehungen zu den Ruckgratsver-krummungen. Wiesbaden, Bergmann, 1889. Translated in Bonne, A.J.: On the shape of the human vertebral column. Acta Orthopaedica Belgica, 35:567-582, 1969. As reported in Zacharkow, D., (1988). Stafford, G.T.: Preventive and Corrective Physical Education. New York, Barnes, 1928. As reported in Zacharkow, D., (1988).
PAGE 144 SEATED WORKING POSTURE
Standards Association of Australia,: AS3590.2-1990. "Screen based workstations Part 2 : Workstation furniture. Sydney 1990.
Stone, J.S.: School furniture in relation to lateral curvature. American Physical Education Review, 5:142-148, 1900. As reported in Zacharkow, D., (1988).
Strasser, H.: Lehrbuch der Muskel und Gelenkmechanik. Berlin, Springer, 1913. As reported in Zacharkow, D., (1988).
Stuart, J. and Revett, N., (measurers and delineators) 1792. "The Antiquities of Athens" sponsored by the Society of Diletanti, Printed by John Haberkorn, London. Four volumes issued between 1762 and 1814, and a supplement on "Athenian Sepulchral Marbles", in 1830. Swearingen, J.J., Wheelwright, CD., and Garner, J.D.: An Analysis of Sitting Areas and Pressure of Man. Civil Aeromedical Research Institute, Federal Aviation Agency, Aeronautical Center, Oklahoma City, January, 1962. Taylor, H.L.: Results of research on conditions affecting posture. Journal of the American Medical Association, 68:327-330, 1917. As reported in Zacharkow, D., (1988).
Telecom Australia; Screen Based Equipment, Visual Display Terminals (VDT's), Specification TPH 0761/1433, Melbourne. 1985.
Thomas, D.P., and Whitney, R.J.: Postural movements during normal standing in man. Journal of Anatomy, 93:524-539, 1959.
Thomas, L.C, and Golthwait, J.E.: Body Mechanics and Health. Boston, Houghton Mifflin, 1922.
Tichauer, E.R.: The Biomechanical Basis of Ergonomics. New York, Wiley, 1978.
Travell, J.: Chairs are a personal thing. House Beautiful, 97:190-193, 262-266, 269, 1955.
Travell, J.: Mechanical headache. Headache, 7:23-29, 1967.
Travers, P.H., and Stanton, B.A.: Office workers and video display terminals: physical, psychological and ergonomic factors. Occupational Health Nursing 32:586-591, 1984.
Troup, J.D.G.: Back pain and car-seat comfort. Applied Ergonomics, 3:90-91, 1972.
U.S.A. Military Standard 1472B (US MIL-STND-1472B, 1974, "Human engineering design criteria for military systems, equipment and facilities) U.S. Gov't Printing Office, Washington D.C

PAGE 145 SEATED WORKING POSTURE
U.S.A. Military Standard 1280 (US MIL-STND-1280, 1969, "Military Standard Keyboard Arrangements") U.S. Gov't Printing Office, Washington D.C
Vassilieff, A., and Dain, S., Bifocal wearing and VDU operation: a review and graphical analysis. Applied Ergonomics 17(2): 82-86. 1986.
Verwaltungs - Berufsgenossenschaft. Sicherheitsregeln fur Bildschirm - Arbeitsplatze in Byrobereich. Hamburg: Authored by Grandjean, E., 1981. Reported in Grandjean et al : VDT Workstation Design. Human Factors 25: 161-175, 1983a. Vulcan, A.P., King, A.I., and Nakamura, G.S.,: Effects on bending of the vertebral column during + G2 acceleration. Aerospace Medicine, 41: 294-300, 1970.
Wachsler, R.A., and Learner, D.B.: An analysis of some factors influencing seat comfort. Ergonomics, 3:315-320, 1960.
Wagenhauser, F.J.: Epidemiology of postural disorders in young people. In Fehr, K. , Huskisson, E.C, and Wilhelmi, E. (Eds.): Rheumatological Research and the Fight Against Rheumatic Diseases in Switzerland. Basel, Eular, 1978. Ward Joan., Floyd, W.F.: Ergonomics, Vol 12, No 2, 132-139. 1969.
Watkin, B.: Are you sitting comforably? Health and Safety at Work, 5:29-30, June 1983.
Weissner, P., 1977. Risk, Reciprocity and Social Influences on! Kuang San Economics. From Leacock, E. and Lee, R., Editors, Published in Politics and History in Band Societies, pages 61-84. Cambridge University Press, 1982. Westgaard, R.H., and Aaras, A.: Postural muscle strain as a causal factor in the development of musculo-skeletal illnesses. Applied Ergonomics, 15:162-174, 1984.
White, A.A. , and Panjabi, M.M.: Clinical Biomechanics of the Spine. Philadelphia, Lippincott, 1978.
Whiteman, D., Standards Association of Australia. Personal communication, 1990.
Whitney, R.J.: The stability provided by the feet during manoeuvres whilst standing. Journal of Anatomy, 96:103-111, 1962.
Winkel, J.: Swelling of the lower leg in sedentary work - a pilot study. Journal of Human Ergology, 10:139-149, 1981.
PAGE 146 SEATED WORKING POSTURE
Winkel, J., and Jorgensen, K.: Evaluation of foot swelling and lower-limb temperatures in relation to leg activity during long-term seated office work. Ergonomics, 29:313-328, 1986. Wotzka, C, Grandjean, E., Burandt, U. , Kretzschmar, H. , and Leonhard, T.: Investigations for the development of an auditorium seat. In Grandjean, E. (Ed.): Proceedings of the Symposium on Sitting Posture. London, Taylor and Francis, pp.68-83, 1969. Wright, T.,: A History of Domestic Matters and Sentiments in England. 1862. As referenced in Gloag, J., (1964).
Yamaguchi, Y., Umezawa, F., and Ishinada, Y.: Sitting posture: an electromyographic study on healthy and notalgic people. Journal of Japanese Orthopaedic Association, 46:277-282, 1972. Zacharkow, D.: Wheelchair Posture and Pressure Sores. Springfield, Thomas, 1984.
Zacharkow, D.: Effect of posture and distribution of pressure in the prevention of pressure sores. In Lee, B.Y. (Ed.): Chronic Ulcers of the Skin. New York, McGraw-Hill, pp. 197-202, 1985. Zacharkow, D. "Posture : Sitting, Standing, Chair Design and Exercise". Published by Charles C. Thomas. Illinois 1988.

SEATED WORKING POSTURE
A Research Thesis with Experimental Methodology and Literature Review
SUBMITTED BY:-
DAVID STANTON PATRICK NELSON for MASTERS DEGREE IN APPLIED SCIENCE 1990
This research thesis is submitted in partial satisfaction of the requirement for the Masters Degree in Applied Science, Ballarat University College, Mt Helen, Victoria
MELBOURNE, JUNE, 1990
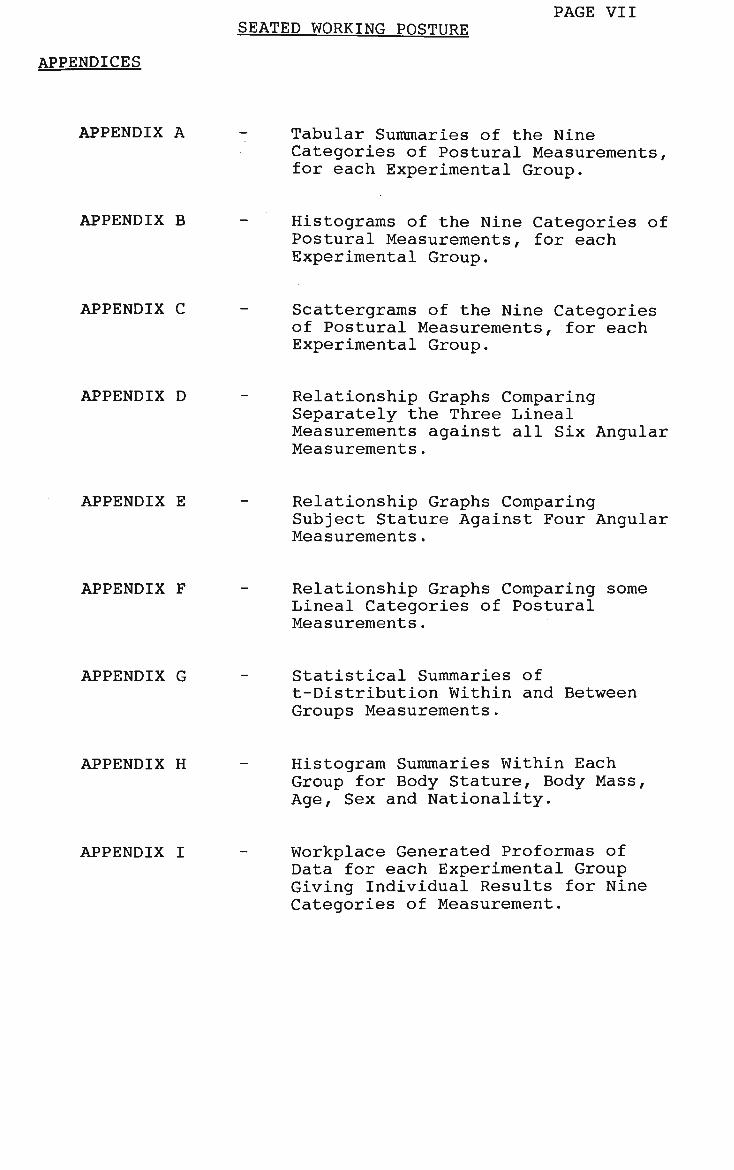
APPENDICES
SEATED WORKING POSTURE PAGE VII
APPENDIX A Tabular Summaries of the Nine Categories of Postural Measurements, for each Experimental Group.
APPENDIX B Histograms of the Nine Categories of Postural Measurements, for each Experimental Group.
APPENDIX C Scattergrams of the Nine Categories of Postural Measurements, for each Experimental Group.
APPENDIX D Relationship Graphs Comparing Separately the Three Lineal Measurements against all Six Angular Measurements.
APPENDIX E Relationship Graphs Comparing Subject Stature Against Four Angular Measurements.
APPENDIX F Relationship Graphs Comparing some Lineal Categories of Postural Measurements.
APPENDIX G Statistical Summaries of t-Distribution Within and Between Groups Measurements.
APPENDIX H Histogram Summaries Within Each Group for Body Stature, Body Mass, Age, Sex and Nationality.
APPENDIX I Workplace Generated Proformas of Data for each Experimental Group Giving Individual Results for Nine Categories of Measurement.

PAGE VIII SEATED WORKING POSTURE
Separate Tabular Summaries for Experimental Groups A and B, showing the results for:-
eye to floor measurements;
shoulder acromion to keyboard home row heights;
eye to copy distances;
trunk inclinations;
head inclinations;
upper arm flexions from the shoulder joints;
arm abductions from the body sides;
elbow angles;
left wrist-joint ulnar abductions.

DATA BASE EXPERIMENTAL GROUP - A
(TABLES)

EXPERIMENTAL GROUP -SAMPLE SIZE
CODE
El E2 E3 E4 E5 E6 E7 E8 E9 E10 Ell E12 E13 E14 E15 E16 E17 E18 E19 E21 E22 E26 E27 E28 E29 E30 E31 E32 E33 E34 E35 E36 E37 E38 E39 E40 E41 E42 E43 E44 E45 E46 E47 E48 E49 E52 E54
: ORIGIN
AUST AUST AUST AUST AUST AUST AUST AUST AUST AUST AUST AUST ABOR AUST AUST AUST S.AM AUST ASIA AUST ENGL VIET AUST AUST AUST VIET AUST AUST AUST ASIA ASIA AUST ASIA AUST ASIA ASIA ASIA AUST POL I CHIN CHIN VIET CHIN CHIN PHIL VIET AUST
MINIMUM
MAXIMUM
AVERAGE
STD DEV
' - 47
r SEX
M M M M F F M F M M F F M M M M F M M M F F M M M M M M F F F F M M M M M F F F M F F M M M M
AGE
23 22 22 28 21 30 27 26 28 29 26 21 25 32 25 26 42 36 32 45 35 42 32 27 26 35 30 39 25 28 35 29 45 38 36 30 33 30 26 25 28 29 29 50 23 31 51
21
51
31
7.2
A (OVERALL)
HGHT
1880 1810 1810 1759 1645 1708 1880 1568 1798 1836 1696 1630 1734 1734 1683 1640 1570 1747 1600 1938 1683 1620 1759 1734 1785 1720 1816 1874 1606 1581 1555 1606 1700 1747 1750 1650 1610 1658 1747 1680 1606 1580 1630 1665 1730 1740 1700
1555
1938
1706
92.6
MASS
85.0 80.0 77.0 79.0 76.3 60.5 74.7 61.0 76.0 89.0 60.0 64.0 61.0 67.0 60.0 65.5 70.0 100.0 50.0 75.0 67.0 60.0 89.0 60.0 62.0 74.0 80.0 66.0 69.0 60.0 49.0 89.0 70.0 86.0 64.0 64.0 52.0 60.0 86.0 74.0 66.0 ! 51.0 ! 59.0 ! 53.0 ! 62.0 ! 86 .0 ! 65.0 !
49.0 !
100.0 !
69.2 !
11.8 !
! EYE/FLOOR DISTANCE
! 2 MIN
! 1220 ! 1257 ! 1238 ! 1226 ! 1208 ! 1248 ! 1267 ! 1240 ! 1282 ! 1270 ! 1253 ! 1261 ! 1284 ! 1258 ! 1252 ! 1245 ! 1241 ! 1252 ! 1208 ! 1300 ! 1290 ! 1238 ! 1248 ! 1258 ! 1291 ! 1278 ! 1218 ! 1228
1184 1220 1250 1240 1215 1260 1220 1210 1230 1200 1178 1210 1243 1190 1220 1248 1212 1222 1269
1178
1300
1240
28.5
8 MIN
1230 1245 1244 1222 1218 1245 1268 1241 1282 1279 1249 1259 1265 1249 1256 1248 1244 1247 1224 1285 1285 1252 1248 1248 1242 1270 1212 1230 1259 1235 1250 1245 1212 1260 1220 1207 1240 1200 1180 1210 1218 1206 1230 1238 1243 1232 1260
1180
1285
1241
22.8
MOVEMEN
10 12 6 4 10 3 1 1 0 9 4 2 19 9 4 3 3 5 16 15 5 14 0 10 49 8 6 2
75 15 0 5 3 0 0 3 10 0 2 0
25 16 10 10 31 10 9
0
75
10
13.2
VARIANCE *° pe^7« 1q9 ! 810 519 173
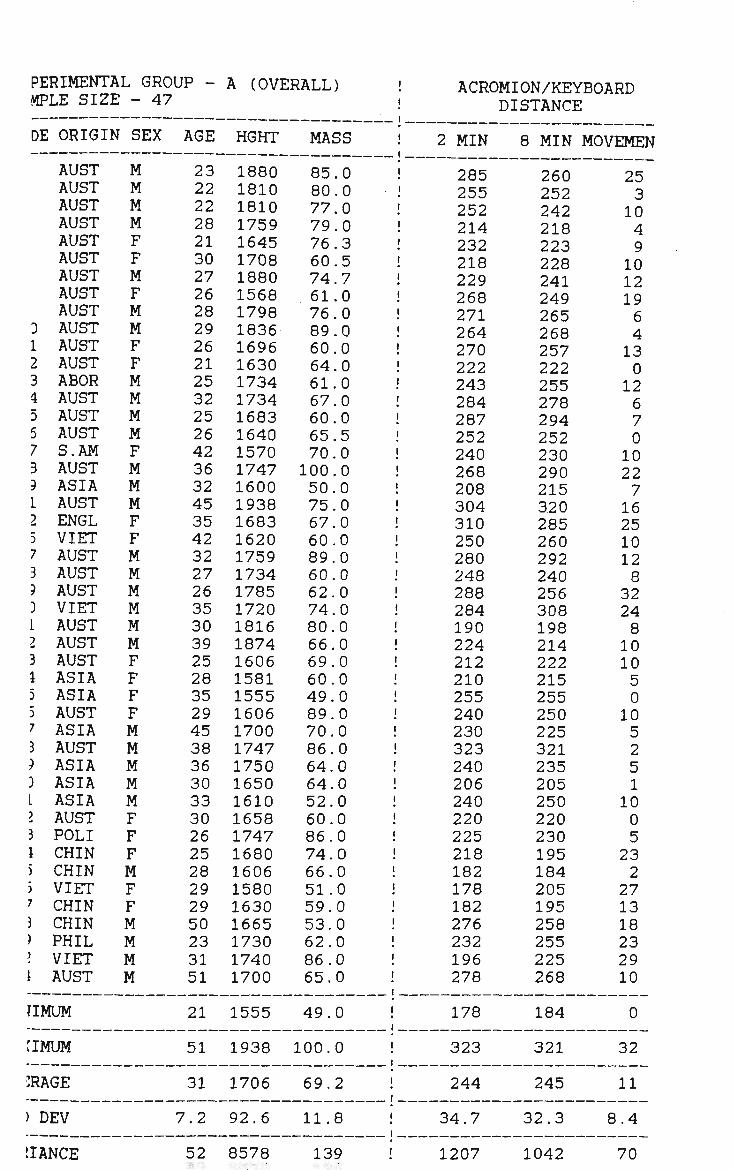
PERIMENTAL GROUP -KPLE SIZE - 47
DE ORIGIN SEX
AUST AUST AUST AUST AUST AUST AUST AUST AUST
D AUST L AUST 2 AUST 3 ABOR 4 AUST 5 AUST 5 AUST 7 S.AM 3 AUST 5 ASIA 1 AUST 2 ENGL 5 VIET 7 AUST 3 AUST ? AUST 3 VIET L AUST 2 AUST 3 AUST 1 ASIA 5 ASIA 5 AUST 7 ASIA 3 AUST ) ASIA ) ASIA L ASIA I AUST 3 POLI 1 CHIN 5 CHIN 5 VIET 7 CHIN 5 CHIN > PHIL I VIET 1 AUST
1IMUM
:IMUM
:RAGE
) DEV
M M M M F F M F M M F F M M M M F M M M F F M M M M M M F F F F M M M M M F F F M F F M M M M
AGE
23 22 22 28 21 30 27 26 28 29 26 21 25 32 25 26 42 36 32 45 35 42 32 27 26 35 30 39 25 28 35 29 45 38 36 30 33 30 26 25 28 29 29 50 23 31 51
21
51
31
7.2
A (OVERALL)
HGHT
1880 1810 1810 1759 1645 1708 1880 1568 1798 1836 1696 1630 1734 1734 1683 1640 1570 1747 1600 1938 1683 1620 1759 1734 1785 1720 1816 1874 1606 1581 1555 1606 1700 1747 1750 1650 1610 1658 1747 1680 1606 1580 1630 1665 1730 1740 1700
1555
1938
1706
92.6
MASS
85.0 80.0 77.0 79.0 76.3 60.5 74.7 61.0 76.0 89.0 60.0 64.0 61.0 67.0 60.0 65.5 70.0 100.0 50.0 75.0 67.0 60.0 89.0 60.0 62.0 74.0 80.0 66.0 69.0 60.0 49.0 89.0 70.0 86.0 64.0 64.0 52.0 60.0 86.0 ! 74.0 66.0 ! 51.0 ! 59.0 J 53.0 ! 62.0 ! 86.0 ! 65.0 !
49.0 !
100.0 !
69.2 !
11.8 !
! ACROMION/KEYBOARD
! 2 MIN
! 285 .' 255 ! 252 ! 214 ! 232 ! 218 ! 229 ! 268 ! 271 ! 264 ! 270 ! 222 ! 243 ! 284 ! 287 ! 252 ! 240 ! 268 ! 208 ! 304 ! 310 ! 250 ! 280 ! 248 ! 288 ! 284
190 ! 224
212 210 255 240 230 323 240 206 240 220 225 218 182 178 182 276 232 196 278
178
323
244
34.7
DISTANCE
8 MIN .
260 252 242 218 223 228 241 249 265 268 257 222 255 278 294 252 230 290 215 320 285 260 292 240 256 308 198 214 222 215 255 250 225 321 235 205 250 220 230 195 184 205 195 258 255 225 268
184
321
245
32.3
MOVEMEN
25 3 10 4 9 10 12 19 6 4 13 0 12 6 7 0 10 22 7 16 25 10 12 8 32 24 8 10 10 5 0 10 5 2 5 1
10 0 5
23 2
27 13 18 23 29 10
0
32
11
8.4
tIANCE 52 8578 139 ! 1207 1042 70
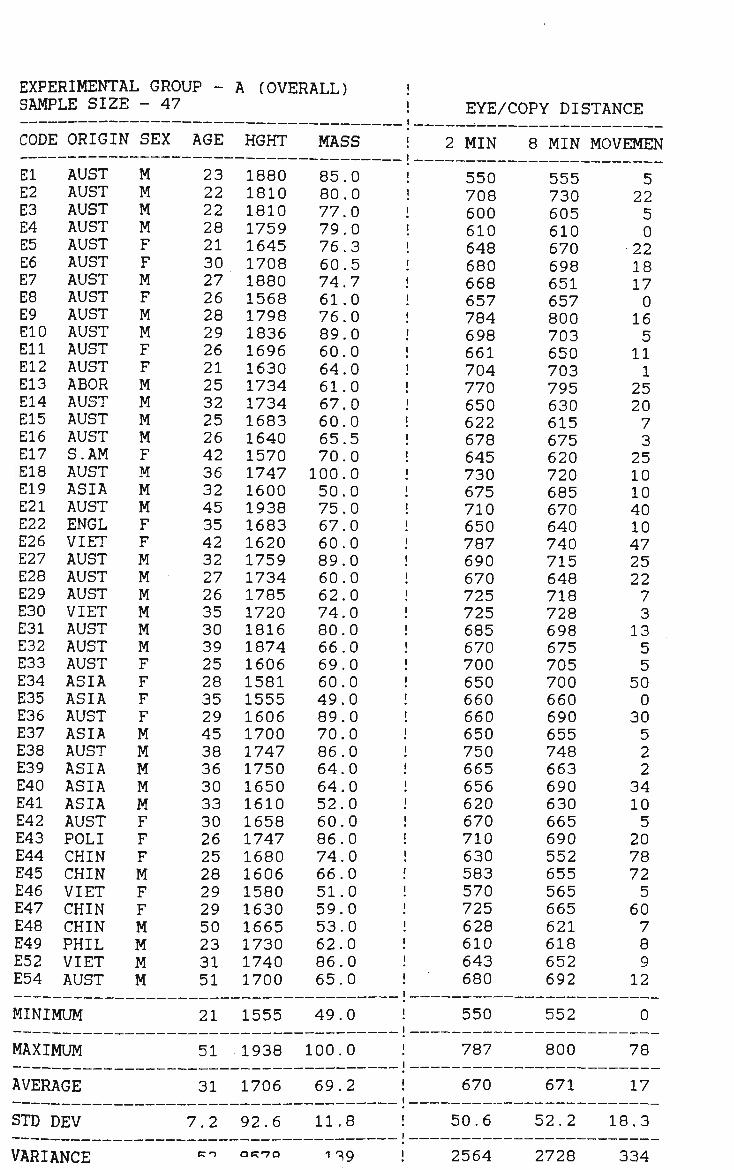
EXPERIMENTAL GROUP -SAMPLE SIZE
CODE
El E2 E3 E4 E5 E6 E7 E8 E9 E10 Ell E12 E13 E14 E15 E16 E17 El 8 E19 E21 E22 E26 E27 E28 E29 E30 E31 E32 E33 E34 E35 E36 E37 E38 E39 E40 E41 E42 E43 E44 E45 E46 E47 E48 E49 E52 E54
ORIGIN
AUST AUST AUST AUST AUST AUST AUST AUST AUST AUST AUST AUST ABOR AUST AUST AUST S.AM AUST ASIA AUST ENGL VIET AUST AUST AUST VIET AUST AUST AUST ASIA ASIA AUST ASIA AUST ASIA ASIA ASIA AUST POL I CHIN CHIN VIET CHIN CHIN PHIL VIET AUST
MINIMUM
MAXIMUM
AVERAGE
STD DEV
- 47
SEX
M M M M F F M F M M F F M M M M F M M M F F M M M M M M F F F F M M M M M F F F M F F M M M M
AGE
23 22 22 28 21 30 27 26 28 29 26 21 25 32 25 26 42 36 32 45 35 42 32 27 26 35 30 39 25 28 35 29 45 38 36 30 33 30 26 25 28 29 29 50 23 31 51
21
51
31
7.2
A (OVERALL)
HGHT
1880 1810 1810 1759 1645 1708 1880 1568 1798 1836 1696 1630 1734 1734 1683 1640 1570 1747 1600 1938 1683 1620 1759 1734 1785 1720 1816 1874 1606 1581 1555 1606 1700 1747 1750 1650 1610 1658 1747 1680 1606 1580 1630 1665 1730 1740 1700
1555
1938
1706
92.6
MASS
85.0 80.0 77.0 79.0 76.3 60.5 74.7 61.0 76.0 89.0 60.0 64.0 61.0 67.0 60.0 65.5 70.0 100.0 50.0 75.0 67.0 60.0 89.0 60.0 62.0 74.0 80.0 66.0 69.0 60.0 49.0 89.0 70.0 86.0 64.0 64.0 52.0 60.0 86.0 74.0 66.0 51.0 59.0 ! 53.0 62.0 ! 86.0 ! 65.0 !
49.0 !
100.0 !
69.2 !
11.8 !
! EYE/COPY DISTANCE
! 2 MIN
! 550 ! 708 ! 600 ! 610 ! 648 ! 680 ! 668 ! 657 ! 784 ! 698 ! 661 ! 704 ! 770 1 650 ! 622 ! 678 ! 645 ! 730 ! 675 ! 710 ! 650 ! 787
690 ! 670 ! 725
725 685
! 670 700 650 660 660 650 750 665 656 620 670 710 630 583 570 725 628 610 643 680
550
787
670
50.6
8 MIN
555 730 605 610 670 698 651 657 800 703 650 703 795 630 615 675 620 720 685 670 640 740 715 648 718 728 698 675 705 700 660 690 655 748 663 690 630 665 690 552 655 565 665 621 618 652 692
552
800
671
52.2
MOVEMEN
5 22 5 0
22 18 17 0 16 5 11 1
25 20 7 3 25 10 10 40 10 47 25 22 7 3 13 5 5
50 0
30 5 2 2
34 10 5 20 78 72 5 60 7 8 9 12
0
78
17
18.3
VARIANCE Kn OKr7a 139 ! 2564 2728 334
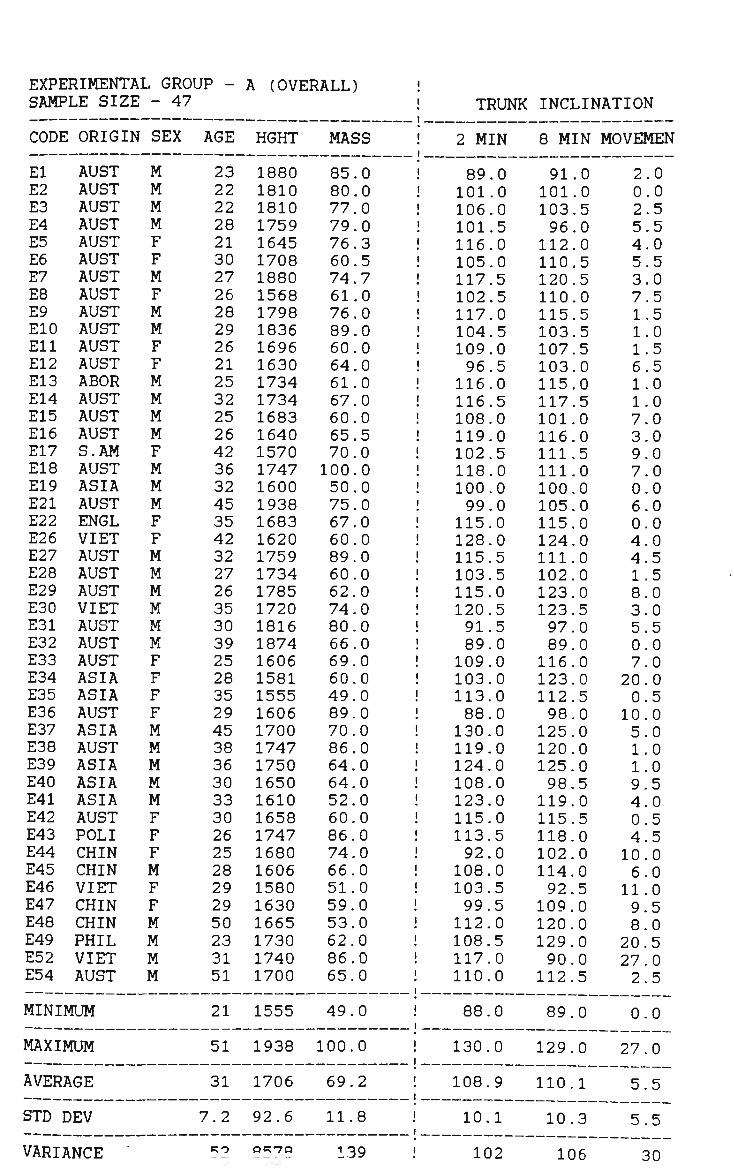
EXPERIMENTAL GROUP -SAMPLE SIZE
CODE
El E2 E3 E4 E5 E6 E7 E8 E9 E10 Ell E12 El 3 E14 E15 E16 E17 E18 E19 E21 E22 E26 E27 E28 E29 E30 E31 E32 E33 E34 E35 E36 E37 E38 E39 E40 E41 E42 E43 E44 E45 E46 E47 E48 E49 E52 E54
ORIGIN
AUST AUST AUST AUST AUST AUST AUST AUST AUST AUST AUST AUST ABOR AUST AUST AUST S.AM AUST ASIA AUST ENGL VIET AUST AUST AUST VIET AUST AUST AUST ASIA ASIA AUST ASIA AUST ASIA ASIA ASIA AUST POL I CHIN CHIN VIET CHIN CHIN PHIL VIET AUST
MINIMUM
MAXIMUM
AVERAGE
STD DEV
VARIANCE
- 47
SEX
M M M M F F M F M M F F M M M M F M M M F F M M M M M M F F F F M M M M M F F F M F F M M M M
AGE
23 22 22 28 21 30 27 26 28 29 26 21 25 32 25 26 42 36 32 45 35 42 32 27 26 35 30 39 25 28 35 29 45 38 36 30 33 30 26 25 28 29 29 50 23 31 51
21
51
31
7.2
e;o
A (OVERALL)
HGHT
1880 1810 1810 1759 1645 1708 1880 1568 1798 1836 1696 1630 1734 1734 1683 1640 1570 1747 1600 1938 1683 1620 1759 1734 1785 1720 1816 1874 1606 1581 1555 1606 1700 1747 1750 1650 1610 1658 1747 1680 1606 1580 1630 1665 1730 1740 1700
1555
1938
1706
92.6
D R 7 Q
MASS
85.0 80.0 77.0 79.0 76.3 60.5 74.7 61.0 76.0 89.0 60.0 64.0 61.0 67.0 60.0 65.5 70.0 100.0 50.0 75.0 67.0 60.0 89.0 60.0 62.0 74.0 80.0 66.0 69.0 60.0 49.0 89.0 70.0 86.0 64.0 64.0 52.0 60.0 86.0 74.0 66.0 51.0 59.0 ! 53.0 62.0 ! 86.0 ! 65.0 !
49.0 !
100.0 !
69.2 !
11.8 !
139 !
! TRUNK
! 2 MIN
! 89.0 ! 101.0 ! 106.0 ! 101.5 ! 116.0 ! 105.0 ! 117.5 ! 102.5 ! 117.0 ! 104.5 ! 109.0 ! 96.5 ! 116.0 ! 116.5 ! 108.0 ! 119.0
102.5 ! 118.0 ! 100.0 ! 99.0 ! 115.0 ! 128.0
115.5 103.5 115.0 120.5 91.5 89.0 109.0 103.0 113.0 88.0 130.0 119.0 124.0 108.0 123.0 115.0 113.5 92.0
108.0 103.5 99.5 112.0 108.5 117.0 110.0
88.0
130.0
108.9
10.1
102
INCLINATION
8 MIN
91.0 101.0 103.5 96.0 112.0 110.5 120.5 110.0 115.5 103.5 107.5 103.0 115.0 117.5 101.0 116.0 111.5 111.0 100.0 105.0 115.0 124.0 111.0 102.0 123.0 123.5 97.0 89.0 116.0 123.0 112.5 98.0
125.0 120.0 125.0 98.5 119.0 115.5 118.0 102.0 114.0 92.5 109.0 120.0 129.0 90.0 112.5
89.0
129.0
110.1
10.3
106
MOVEMEN
2.0 0.0 2.5 5.5 4.0 5.5 3.0 7.5 1.5 1.0 1.5 6.5 1.0 1.0 7.0 3.0 9.0 7.0 0.0 6.0 0.0 4.0 4.5 1.5 8.0 3.0 5.5 0.0 7.0 20.0 0.5 10.0 5.0 1.0 1.0 9.5 4.0 0.5 4.5 10.0 6.0 11.0 9.5 8.0 20.5 27.0 2.5
0.0
27.0
5.5
5.5
30
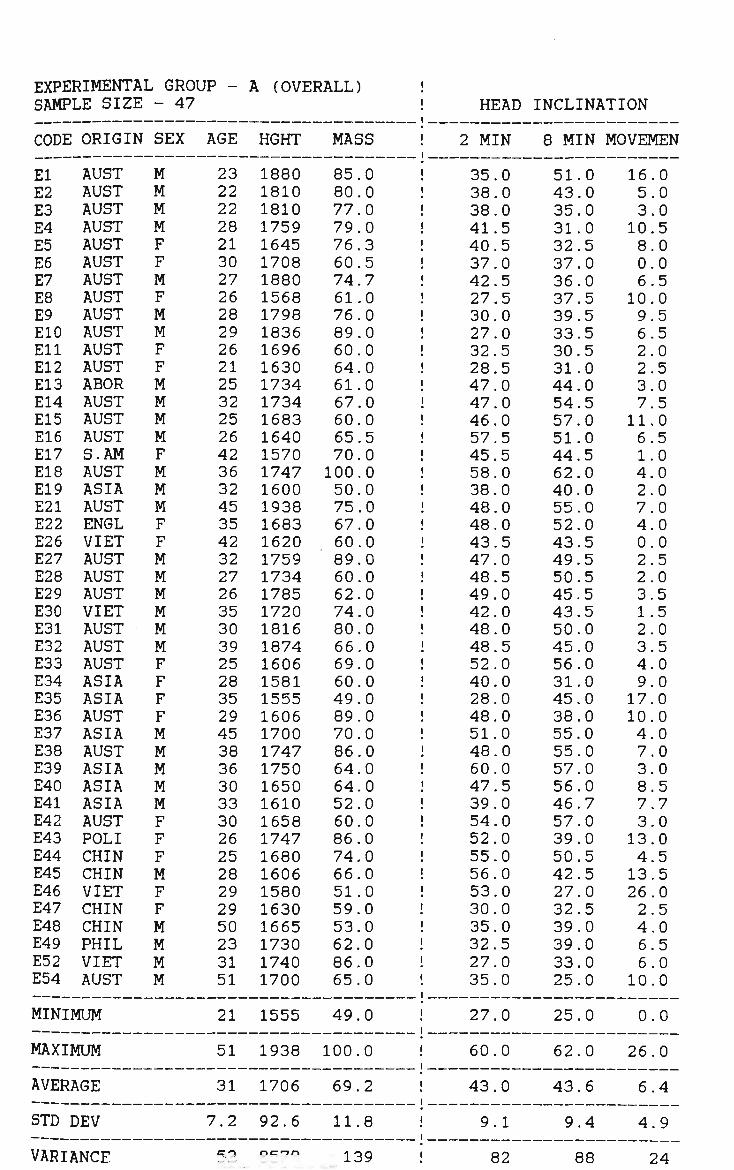
EXPERIMENTAL GROUP -SAMPLE SIZE
CODE
El E2 E3 E4 E5 E6 E7 E8 E9 E10 Ell El 2 E13 E14 E15 E16 E17 E18 E19 E21 E22 E26 E27 E28 E29 E30 E31 E32 E33 E34 E35 E36 E37 E38 E39 E40 E41 E42 E43 E44 E45 E46 E47 E48 E49 E52 E54
ORIGIN
AUST AUST AUST AUST AUST AUST AUST AUST AUST AUST AUST AUST ABOR AUST AUST AUST S.AM AUST ASIA AUST ENGL VIET AUST AUST AUST VIET AUST AUST AUST ASIA ASIA AUST ASIA AUST ASIA ASIA ASIA AUST POL I CHIN CHIN VIET CHIN CHIN PHIL VIET AUST
MINIMUM
MAXIMUM
AVERAGE
STD ] DEV
VARIANCE
- 47
SEX
M M M M F F M F M M F F M M M M F M M M F F M M M M M M F F F F M M M M M F F F M F F M M M M
AGE
23 22 22 28 21 30 27 26 28 29 26 21 25 32 25 26 42 36 32 45 35 42 32 27 26 35 30 39 25 28 35 29 45 38 36 30 33 30 26 25 28 29 29 50 23 31 51
21
51
31
7.2
ero
A (OVERALL)
HGHT
1880 1810 1810 1759 1645 1708 1880 1568 1798 1836 1696 1630 1734 1734 1683 1640 1570 1747 1600 1938 1683 1620 1759 1734 1785 1720 1816 1874 1606 1581 1555 1606 1700 1747 1750 1650 1610 1658 1747 1680 1606 1580 1630 1665 1730 1740 1700
1555
1938
1706
92.6
r> er *n o
MASS
85.0 80.0 77.0 79.0 76.3 60.5 74.7 61.0 76.0 89.0 60.0 64.0 61.0 67.0 60.0 65.5 70.0 100.0 50.0 75.0 67.0 60.0 89.0 60.0 62.0 74.0 80.0 66.0 69.0 60.0 49.0 89.0 70.0 86.0 64.0 64.0 52.0 60.0 86.0 74.0 66.0 51.0 59.0 53.0 62.0 86.0 65.0
49.0
100.0
69.2 !
11.8
139
HEAD
2 MIN
35.0 38.0 38.0 41.5 40.5 37.0 42.5 27.5 30.0 27.0 32.5 28.5 47.0 47.0 46.0 57.5 45.5 58.0 38.0 48.0 48.0 43.5 47.0 48.5 49.0 42.0 48.0 48.5 52.0 40.0 28.0 48.0 51.0 48.0 60.0 47.5 39.0 54.0 52.0 55.0 56.0 53.0 30.0 35.0 32.5 27.0 35.0
27.0
60.0
43.0
9.1
82
INCLINATION
8 MIN
51.0 43.0 35.0 31.0 32.5 37.0 36.0 37.5 39.5 33.5 30.5 31.0 44.0 54.5 57.0 51.0 44.5 62.0 40.0 55.0 52.0 43.5 49.5 50.5 45.5 43.5 50.0 45.0 56.0 31.0 45.0 38.0 55.0 55.0 57.0 56.0 46.7 57.0 39.0 50.5 42.5 27.0 32.5 39.0 39.0 33.0 25.0
25.0
62.0
43.6
9.4
88
MOVEMEN
16.0 5.0 3.0 10.5 8.0 0.0 6.5 10.0 9.5 6.5 2.0 2.5 3.0 7.5 11.0 6.5 1.0 4.0 2.0 7.0 4.0 0.0 2.5 2.0 3.5 1.5 2.0 3.5 4.0 9.0 17.0 10.0 4.0 7.0 3.0 8.5 7.7 3.0 13.0 4.5 13.5 26.0 2.5 4.0 6.5 6.0 10.0
0.0
26.0
6.4
4.9
24
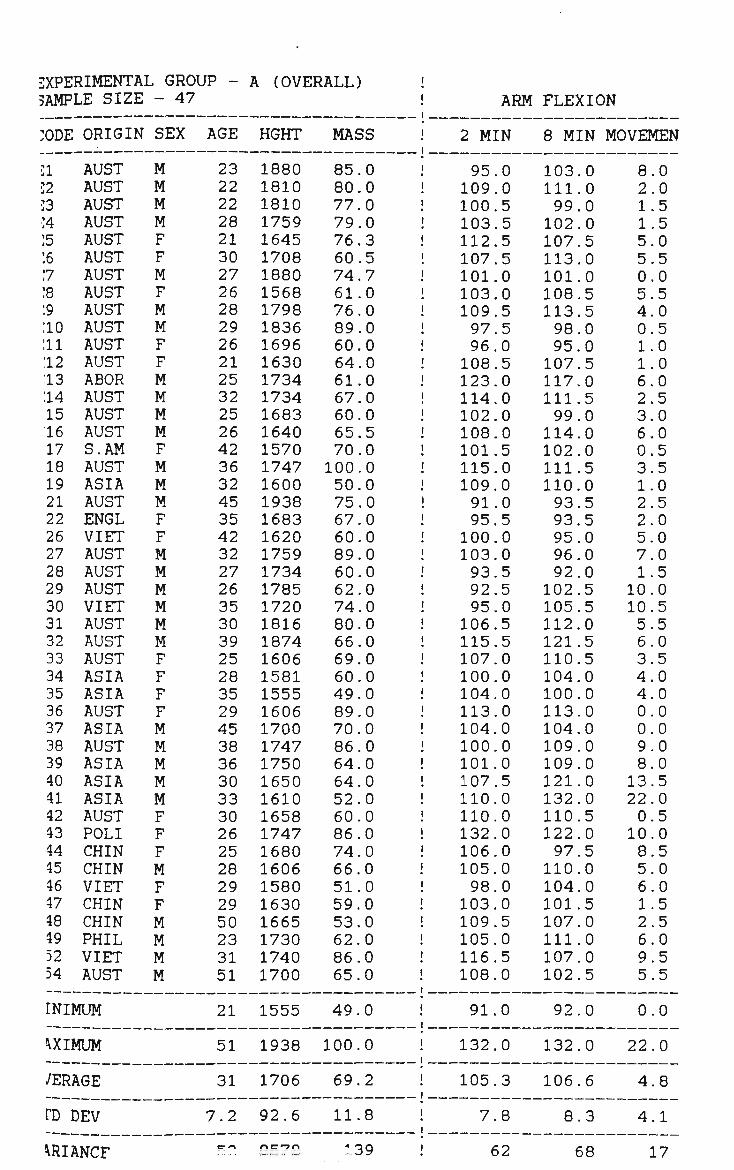
EXPERIMENTAL GROUP -SAMPLE SIZE
:ODE
21 22 !3 14 15 16 7 18 :9 10 111 112 13 14 15 16 17 18 19 21 22 26 27 28 29 30 31 32 33 34 35 36 37 38 39 40 41 42 43 44 45 46 47 48 49 52 54
ORIGIN
AUST AUST AUST AUST AUST AUST AUST AUST AUST AUST AUST AUST ABOR AUST AUST AUST S.AM AUST ASIA AUST ENGL VIET AUST AUST AUST VIET AUST AUST AUST ASIA ASIA AUST ASIA AUST ASIA ASIA ASIA AUST POL I CHIN CHIN VIET CHIN CHIN PHIL VIET AUST
[NIMUM
\XIMUM
/ERAGE
n> ] DEV
\RIANCF
- 47
SEX
M M M M F F M F M M F F M M M M F M M M F F M M M M M M F F F F M M M M M F F F M F F M M M M
AGE
23 22 22 28 21 30 27 26 28 29 26 21 25 32 25 26 42 36 32 45 35 42 32 27 26 35 30 39 25 28 35 29 45 38 36 30 33 30 26 25 28 29 29 50 23 31 51
21
51
31
7.2
tar *"\
A (OVERALL)
HGHT
1880 1810 1810 1759 1645 1708 1880 1568 1798 1836 1696 1630 1734 1734 1683 1640 1570 1747 1600 1938 1683 1620 1759 1734 1785 1720 1816 1874 1606 1581 1555 1606 1700 1747 1750 1650 1610 1658 1747 1680 1606 1580 1630 1665 1730 1740 1700
1555
1938
1706
92.6
ncr^n
MASS
85.0 80.0 77.0 79.0 76.3 60.5 74.7 61.0 76.0 89.0 60.0 64.0 61.0 67.0 60.0 65.5 70.0 100.0 50.0 75.0 67.0 60.0 89.0 60.0 62.0 74.0 80.0 66.0 69.0 60.0 49.0 89.0 70.0 86.0 64.0 64.0 52.0 60.0 86.0 74.0 66.0 51.0 59.0 53.0 62.0 86.0 65.0
49.0
100.0
69.2
11.8
139
ARM
2 MIN
95.0 109.0 100.5 103.5 112.5 107.5 101.0 103.0 109.5 97.5 96.0 108.5 123.0 114.0 102.0 108.0 101.5 115.0 109.0
! 91.0 95.5 100.0 103.0 93.5 92.5 95.0
106.5 115.5 107.0 100.0 104.0 113.0 104.0 100.0 101.0 107.5 110.0 110.0 132.0 106.0 105.0 98.0
103.0 109.5 105.0 116.5 108.0
91.0
132.0
105.3
7.8
62
FLEXION
8 MIN MOVEMEN
103.0 111.0 99.0 102.0 107.5 113.0 101.0 108.5 113.5 98.0 95.0 107.5 117.0 111.5 99.0 114.0 102.0 111.5 110.0 93.5 93.5 95.0 96.0 92.0 102.5 105.5 112.0 121.5 110.5 104.0 100.0 113.0 104.0 109.0 109.0 121.0 132.0 110.5 122.0 97.5 110.0 104.0 101.5 107.0 111.0 107.0 102.5
92.0
132.0
106.6
8.3
68
8.0 2.0 1.5 1.5 5.0 5.5 0.0 5.5 4.0 0.5 1.0 1.0 6.0 2.5 3.0 6.0 0.5 3.5 1.0 2.5 2.0 5.0 7.0 1.5
10.0 10.5 5.5 6.0 3.5 4.0 4.0 0.0 0.0 9.0 8.0 13.5 22.0 0.5 10.0 8.5 5.0 6.0 1.5 2.5 6.0 9.5 5.5
0.0
22.0
4.8
4.1
17
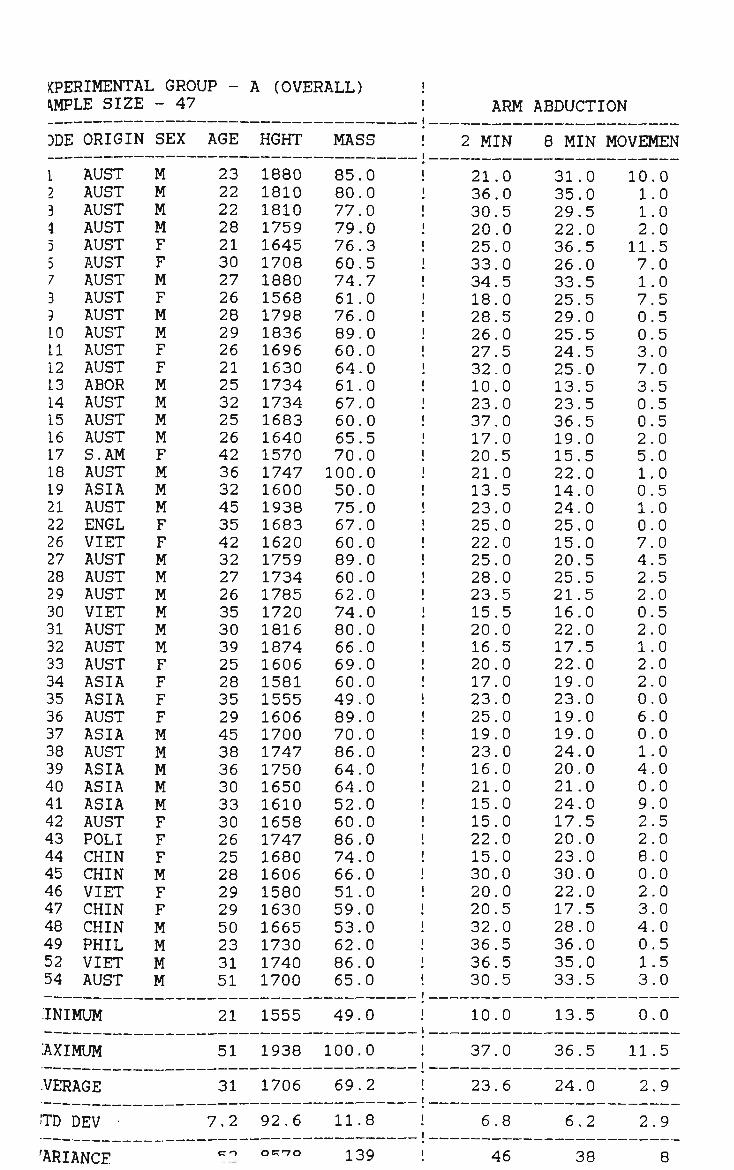
KPERIMENTAL GROUP -\MPLE SIZE
DDE
I I 3 4 5 5 7 3 5 10 LI 12 13 14 L5 L6 17 18 19 21 22 26 27 28 29 30 31 32 33 34 35 36 37 38 39 40 41 42 43 44 45 46 47 48 49 52 54
ORIGIN
AUST AUST AUST AUST AUST AUST AUST AUST AUST AUST AUST AUST ABOR AUST AUST AUST S.AM AUST ASIA AUST ENGL VIET AUST AUST AUST VIET AUST AUST AUST ASIA ASIA AUST ASIA AUST ASIA ASIA ASIA AUST POL I CHIN CHIN VIET CHIN CHIN PHIL VIET AUST
INIMUM
AXIMUM
VERAGE
TD ] DEV
ARIANCE
- 47
SEX
M M M M F F M F M M F F M M M M F M M M F F M M M M M M F F F F M M M M M F F F M F F M M M M
AGE
23 22 22 28 21 30 27 26 28 29 26 21 25 32 25 26 42 36 32 45 35 42 32 27 26 35 30 39 25 28 35 29 45 38 36 30 33 30 26 25 28 29 29 50 23 31 51
21
51
31
7.2
C O
A (OVERALL)
HGHT
1880 1810 1810 1759 1645 1708 1880 1568 1798 1836 1696 1630 1734 1734 1683 1640 1570 1747 1600 1938 1683 1620 1759 1734 1785 1720 1816 1874 1606 1581 1555 1606 1700 1747 1750 1650 1610 1658 1747 1680 1606 1580 1630 1665 1730 1740 1700
1555
1938
1706
92.6
O K 7 0
MASS
85.0 80.0 77.0 79.0 76.3 60.5 74.7 61.0 76.0 89.0 60.0 64.0 61.0 67.0 60.0 65.5 70,0 100.0 50.0 75.0 67.0 60.0 89.0 60.0 62.0 74.0 80.0 66.0 69.0 60.0 49.0 89.0 70.0 86.0 64.0 64.0 52.0 60.0 86.0 74.0 66.0 51.0 59.0 53.0 62.0 86.0 65.0
49.0
100.0
69.2
11.8
139
ARM
2 MIN
21.0 36.0 30.5 20.0 25.0 33.0 34.5 18.0 28.5 26.0 27.5 32.0 10.0 23.0 37.0 17.0 20.5 21.0 13.5 23.0 25.0 22.0 25.0 28.0 23.5 15.5 20.0 16.5 20.0 17.0 23.0 25.0 19.0 23.0 16.0 21.0 15.0 15.0 22.0 15.0 30.0 20.0 20.5 32.0 36.5 36.5 30.5
10.0
37.0
23.6
6.8
46
ABDUCTION
8 MIN
31.0 35.0 29.5 22.0 36.5 26.0 33.5 25.5 29.0 25.5 24.5 25.0 13.5 23.5 36.5 19.0 15.5 22.0 14.0 24.0 25.0 15.0 20.5 25.5 21.5 16.0 22.0 17.5 22.0 19.0 23.0 19.0 19.0 24.0 20.0 21.0 24.0 17.5 20.0 23.0 30.0 22.0 17.5 28.0 36.0 35.0 33.5
13.5
36.5
24.0
6.2
38
MOVEMEN
10.0 1.0 1.0 2.0
11.5 7.0 1.0 7.5 0.5 0.5 3.0 7.0 3.5 0.5 0.5 2.0 5.0 1.0 0.5 1.0 0.0 7.0 4.5 2.5 2.0 0.5 2.0 1.0 2.0 2.0 0.0 6.0 0.0 1.0 4.0 0.0 9.0 2.5 2.0 8.0 0.0 2.0 3.0 4.0 0.5 1.5 3.0
0.0
11.5
2.9
2.9
8
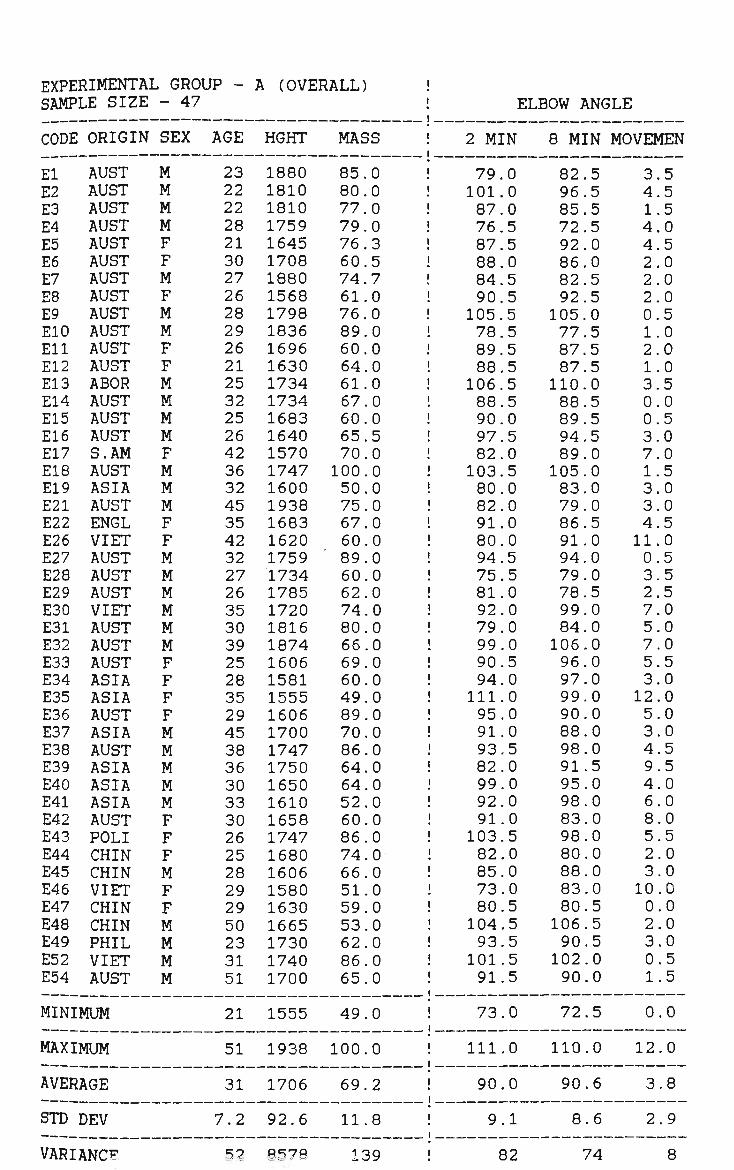
EXPERIMENTAL GROUP -SAMPLE SIZE
CODE
El E2 E3 E4 E5 E6 E7 E8 E9 E10 Ell E12 E13 E14 E15 E16 E17 E18 E19 E21 E22 E26 E27 E28 E29 E30 E31 E32 E33 E34 E35 E36 E37 E38 E39 E40 E41 E42 E43 E44 E45 E46 E47 E48 E49 E52 E54
ORIGIN
AUST AUST AUST AUST AUST AUST AUST AUST AUST AUST AUST AUST ABOR AUST AUST AUST S.AM AUST ASIA AUST ENGL VIET AUST AUST AUST VIET AUST AUST AUST ASIA ASIA AUST ASIA AUST ASIA ASIA ASIA AUST POL I CHIN CHIN VIET CHIN CHIN PHIL VIET AUST
MINIMUM
MAXIMUM
AVERAGE
STD DEV
VARIANCE
- 47
SEX
M M M M F F M F M M F F M M M M F M M M F F M M M M M M F F F F M M M M M F F F M F F M M M M
AGE
23 22 22 28 21 30 27 26 28 29 26 21 25 32 25 26 42 36 32 45 35 42 32 27 26 35 30 39 25 28 35 29 45 38 36 30 33 30 26 25 28 29 29 50 23 31 51
21
51
31
7.2
52
A (OVERALL)
HGHT
1880 1810 1810 1759 1645 1708 1880 1568 1798 1836 1696 1630 1734 1734 1683 1640 1570 1747 1600 1938 1683 1620 1759 1734 1785 1720 1816 1874 1606 1581 1555 1606 1700 1747 1750 1650 1610 1658 1747 1680 1606 1580 1630 1665 1730 1740 1700
1555
1938
1706
92.6
8578
MASS
85.0 80.0 77.0 79.0 76.3 60.5 74.7 61.0 76.0 89.0 60.0 64.0 61.0 67.0 60.0 65.5 70.0 100.0 50.0 75.0 67.0 60.0 89.0 60.0 62.0 74.0 80.0 66.0 69.0 60.0 49.0 89.0 70.0 86.0 64.0 64.0 52.0 60.0 86.0 74.0 66.0 51.0 59.0 53.0 62.0 86.0 65.0
49.0
100.0
69.2
11.8
139
ELBOW ANGLE
2 MIN
79.0 101.0 87.0 76.5 87.5 88.0 84.5 90.5
105.5 78.5 89.5 88.5 106.5 88.5 90.0 97.5 82.0 103.5 80.0 82.0 91.0 80.0 94.5 75.5 81.0 92.0 79.0 99.0 90.5 94.0 111.0
! 95.0 91.0
! 93.5 82.0
! 99.0 92.0
! 91.0 103.5
! 82.0 85.0
! 73.0 ! 80.5 ! 104.5
93.5 101.5
! 91.5
73.0
111.0
90.0
9.1
82
8 MIN
82.5 96.5 85.5 72.5 92.0 86.0 82.5 92.5 105.0 77.5 87.5 87.5 110.0 88.5 89.5 94.5 89.0 105.0 83.0 79.0 86.5 91.0 94.0 79.0 78.5 99.0 84.0 106.0 96.0 97.0 99.0 90.0 88.0 98.0 91.5 95.0 98.0 83.0 98.0 80.0 88.0 83.0 80.5 106.5 90.5 102.0 90.0
72.5
110.0
90.6
8.6
74
MOVEMEN
3.5 4.5 1.5 4.0 4.5 2.0 2.0 2.0 0.5 1.0 2.0 1.0 3.5 0.0 0.5 3.0 7.0 1.5 3.0 3.0 4.5 11.0 0.5 3.5 2.5 7.0 5.0 7.0 5.5 3.0 12.0 5.0 3.0 4.5 9.5 4.0 6.0 8.0 5.5 2.0 3.0 10.0 0.0 2.0 3.0 0.5 1.5
0.0
12.0
3.8
2.9
8

EXPERIMENTAL GROUP -SAMPLE SIZE
CODE
El E2 E3 E4 E5 E6 E7 E8 E9 E10 Ell E12 E13 E14 E15 E16 E17 E18 E19 E21 E22 E26 E27 E28 E29 E30 E31 E32 E33 E34 E35 E36 E37 E38 E39 E40 E41 E42 E43 E44 E45 E46 E47 E48 E49 E52 E54
ORIGIN
AUST AUST AUST AUST AUST AUST AUST AUST AUST AUST AUST AUST ABOR AUST AUST AUST S.AM AUST ASIA AUST ENGL VIET AUST AUST AUST VIET AUST AUST AUST ASIA ASIA AUST ASIA AUST ASIA ASIA ASIA AUST POL I CHIN CHIN VIET CHIN CHIN PHIL VIET AUST
MINIMUM
MAXIMUM
AVERAGE
STD ] DEV
VARIANCE
- 47
SEX
M M M M F F M F M M F F M M M M F M M M F F M M M M M M F F F F M M M M M F F F M F F M M M M
AGE
23 22 22 28 21 30 27 26 28 29 26 21 25 32 25 26 42 36 32 45 35 42 32 27 26 35 30 39 25 28 35 29 45 38 36 30 33 30 26 25 28 29 29 50 23 31 51
21
51
31
7.2
5>{&
A (OVERALL)
HGHT
1880 1810 1810 1759 1645 1708 1880 1568 1798 1836 1696 1630 1734 1734 1683 1640 1570 1747 1600 1938 1683 1620 1759 1734 1785 1720 1816 1874 1606 1581 1555 1606 1700 1747 1750 1650 1610 1658 1747 1680 1606 1580 1630 1665 1730 1740 1700
1555
1938
1706
92.6
Q C 7 Q
MASS
85.0 80.0 77.0 79.0 76.3 60.5 74.7 61.0 76.0 89.0 60.0 64.0 61.0 67.0 60.0 65.5 70.0 100.0 50.0 75.0 67.0 60.0 89.0 60.0 62.0 74.0 80.0 66.0 69.0 60.0 49.0 89.0 70.0 86.0 64.0 64.0 52.0 60.0 86.0 74.0 66.0 51.0 59.0 53.0 62.0 86.0 65.0
49.0
100.0
69.2
11.8
139
LEFT ULNAR ABDUCTION
2 MIN
10.0 4.0 3.5 6.5 3.5 4.0 5.5 3.0 6.5 5.0 5.5 4.0 0.0 0.5 5.5 18.0 4.0 0.0 0.0 2.0 19.5 5.0 8.5 1.5 5.0 0.0 10.5 3.0 1.5 8.0 0.0 5.0 0.0 4.0 0.0 0.0 0.0 1.0 2.0 8.0 8.5 8.0 6.5 8.0 9.0 1.5
23.0
0.0
23.0
5.1
5.0
25
8 MIN
9.0 6.5 2.0 6.0 2.5 5.0 12.0 5.0 4.5 6.5 7.0 2.0 0.5 0.0 2.5 16.5 10.0 0.0 0.0 2.5 7.5 4.0 5.5 7.0 4.5 4.0 5.0 3.0 1.5
12.0 0.0 10.0 0.0 4.0 0.0 2.5 0.0 2.0 0.0 6.0 9.0 6.5 12.0 13.0 7.0 1.5
12.5
0.0
16.5
5.1
4.2
17
MOVEMEN
1.0 2.5 1.5 0.5 1.0 1.0 6.5 2.0 2.0 1.5 1.5 2.0 0.5 0.5 3.0 1.5 6.0 0.0 0.0 0.5 12.0 1.0 3.0 5.5 0.5 4.0 5.5 0.0 0.0 4.0 0.0 5.0 0.0 0.0 0.0 2.5 0.0 1.0 2.0 2.0 0.5 1.5 5.5 5.0 2.0 0.0 10.5
0.0
12.0
2.3
2.6
7

DATA BASE EXPERIMENTAL GROUP - B
(TABLES)

EXPERIMENTAL GROUP -SAMPLE SIZE
CODE
CI C2 C3 C4 C5 C6 C7 C8 C9 CIO Cll C12 C13 C14 C15 C16 C17 C18 C19 C20 C21 C22 C23 C24 C25 C26 C27 C28 C29 C30 C31 C32 C33 C34 C35 C36 C37 C38 C39 C40 C41 C42 C43 C44 C45 C46 C47
' ORIGIN
MAUR NEWZ AUST AUST ITAL ITAL ITAL AUST ITAL AUST AUST AUST AUST AUST AUST AUST AUST AUST PHIL AUST AUST AUST AUST YUGO AUST AUST ENGL GERM AUST INDI AUST PHIL AUST MAUR AUST AUST AUST AUST AUST AUST CANA MAUR AUST AUST YUGO AUST AUST
MINIMUM
MAXIMUM
AVERAGE
STD DEV
- 47
SEX
F F F F F F F F F F F F F F F M F F F M F F F F F F F F F F F F F F F F F F F F M F F F F F F
AGE
25 22 20 31 25 21 28 28 27 34 26 25 28 20 47 25 42 21 25 20 61 46 24 20 22 41 23 26 31 36 21 25 32 36 34 29 35 30 28 28 27 26 28 24 22 25 24
20
61
29
8.1
B (OVERALL)
HGHT
1632 1811 1630 1581 1568 1734 1606 1708 1594 1683 1734 1626 1575 1524 1689 1778 1676 1524 1524 1755 1702 1530 1680 1607 1647 1670 1630 1721 1632 1607 1747 1441 1670 1607 1581 1683 1632 1710 1658 1581 1811 1479 1632 1479 1623 1623 1619
1441
1811
1637
82.8
MASS
59.0 60.5 60.5 60.5 82.0 92.0 50.0 91.0 70.0 72.0 68.0 55.0 70.0 53.8 61.0
.105.0 82.3 54.0 45.0 63.0 60.2 45.5 76.0 56.0 57.0 64.0 47.7 63.5 56.0 52.0 70.0 45.0 60.5 51.0 64.0 59.0 65.0 68.0 56.0 70.0 73.0 ! 50.0 ! 55.0 i 56.0 ! 58.0 ! 60.0 ! 57.0 !
45.0 !
105.0 !
62.8 !
12.4 !
! EYE/FLOOR DISTANCE
! 2 MIN
! 1540 ! 1540 ! 1528 ! 1112 ! 1680 ! 1558 ! 1228 ! 1558 ! 1160 ! 1450 ! 1400 ! 1448 ! 1110 ! 1145 ! 1115 ! 1178
1132 ! 1090
1060 ! 1115
1182 ! 1162
1220 1166 1173 1193 1140 1110 1164 1115 1180 1100 1160 1102 1080 1118 1132 1178 1005 1150 1140 1092 1152 1112 1155 1180 1182
1005
1680
1213
159.5
8 MIN
1600 1580 1520 1118 1580 1640 1248 1550 1110 1445 1448 1548 1110 1170 1132 1128 1145 1100 1055 1138 1168 1170 1188 1155 1182 1187 1140 1110 1180 1138 1192 1094 1172 1175 1010 1152 1140 1152 1090 1153 1138 1092 1165 1080 1181 1161 1172
1010
1640
1219
165.8
MOVEMEN
60 40 8 6
100 82 20 8 50 5
48 100 0 25 17 50 13 10 5 23 14 8 32 11 9 6 0 0
16 23 12 6
12 73 70 34 8 26 85 3 2 0 13 32 26 19 10
0
100
26
27.0
VARIANCE CR cac.A 153 25433 27492 728
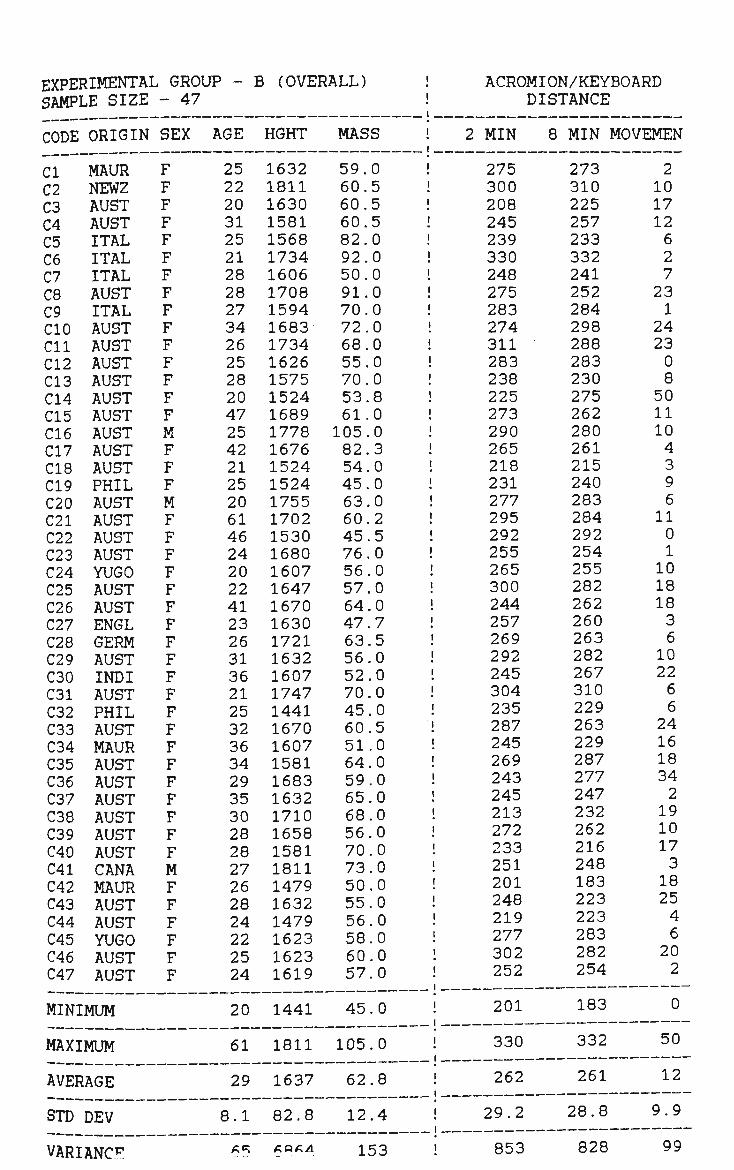
EXPEI OMENTA] SAMPLE SIZE
CODE
CI C2 C3 C4 C5 C6 C7 C8 C9 CIO Cll C12 C13 C14 C15 C16 C17 C18 C19 C20 C21 C22 C23 C24 C25 C26 C27 C28 C29 C30 C31 C32 C33 C34 C35 C36 C37 C38 C39 C40 C41 C42 C43 C44 C45 C46 C47
ORIGIN
MAUR NEWZ AUST AUST ITAL ITAL ITAL AUST ITAL AUST AUST AUST AUST AUST AUST AUST AUST AUST PHIL AUST AUST AUST AUST YUGO AUST AUST ENGL GERM AUST INDI AUST PHIL AUST MAUR AUST AUST AUST AUST AUST AUST CANA MAUR AUST AUST YUGO AUST AUST
MINIMUM
MAXIMUM
AVERAGE
STD DEV
. GROUP - B (OVERALL) ! - 47
SEX
F F F F F F F F F F F F F F F M F F F M F F F F F F F F F F F F F F F F F F F F M F F F F F F
AGE
25 22 20 31 25 21 28 28 27 34 26 25 28 20 47 25 42 21 25 20 61 46 24 20 22 41 23 26 31 36 21 25 32 36 34 29 35 30 28 28 27 26 28 24 22 25 24
20
61
29
8.1
HGHT
1632 1811 1630 1581 1568 1734 1606 1708 1594 1683 1734 1626 1575 1524 1689 1778 1676 1524 1524 1755 1702 1530 1680 1607 1647 1670 1630 1721 1632 1607 1747 1441 1670 1607 1581 1683 1632 1710 1658 1581 1811 1479 1632 1479 1623 1623 1619
1441
1811
1637
82.8
MASS !
59.0 ! 60.5 •! 60.5 ! 60.5 ! 82.0 ! 92.0 ! 50.0 ! 91.0 ! 70.0 ! 72.0 ! 68.0 ! 55.0 ! 70.0 ! 53.8 ! 61.0 ! 105.0 82.3 54.0 45.0 63.0 60.2 45.5 76.0 56.0 57.0 64.0 47.7 63.5 56.0 52.0 70.0 45.0 60.5 51.0 64.0 59.0 65.0 68.0 56.0 70.0 73.0 50.0 55.0 56.0 58.0 60.0 57.0
45.0
105.0
62.8
12.4
ACROMION/KEYBOARD DISTANCE
2 MIN
275 300 208 245 239 330 248 275 283 274 311 283 238 225 273 290 265 218 231 277 295 292 255 265 300 244 257
! 269 ! 292 ! 245 ! 304 ! 235 ! 287 ! 245 ! 269 ! 243 ! 245 ! 213 ! 272 ! 233 ! 251 ! 201 ! 248 ! 219 ! 277 ! 302 ! 252
! 201
! 330
! 262
! 29.2
8 MIN MOVEMEN
273 310 225 257 233 332 241 252 284 298 288 283 230 275 262 280 261 215 240 283 284 292 254 255 282 262 260 263 282 267 310 229 263 229 287 277 247 232 262 216 248 183 223 223 283 282 254
183
332
261
28.8
2 10 17 12 6 2 7 23 1
24 23 0 8 50 11 10 4 3 9 6 11 0 1 10 18 18 3 6 10 22 6 6 24 16 18 34 2 19 10 17 3 18 25 4 6 20 2
0
50
12
9.9
VARIANCE 65 A?*^ 153 ! 853 828 99
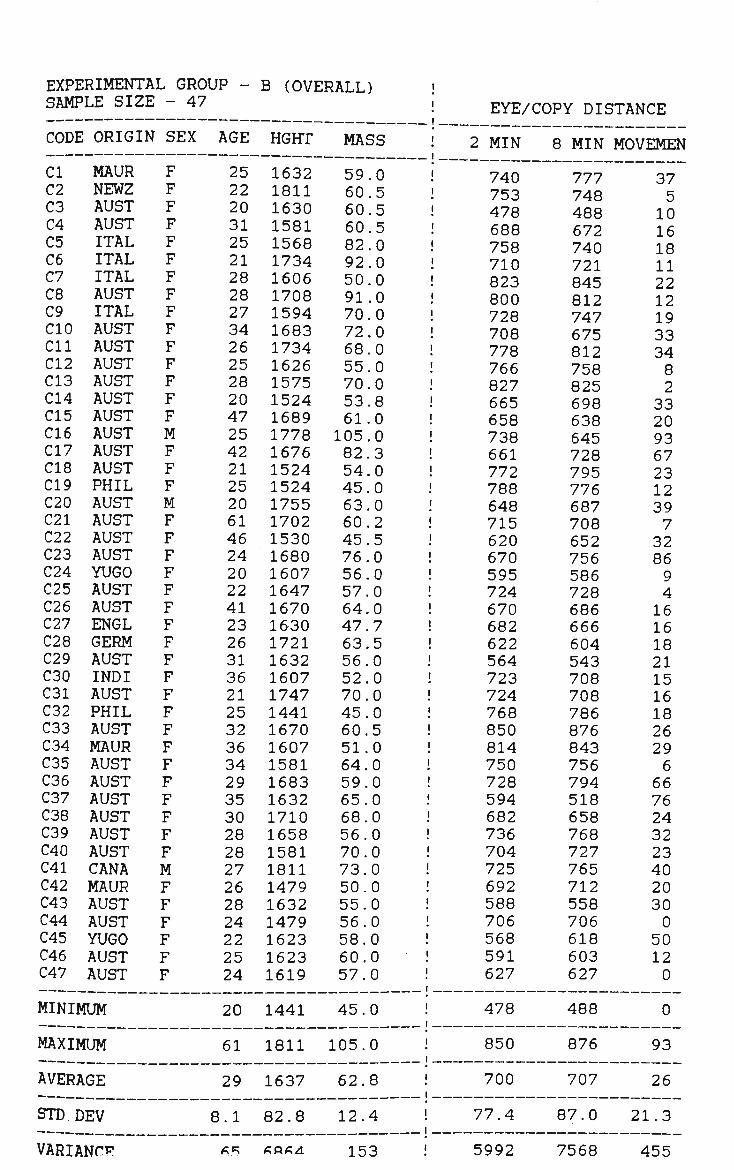
EXPERIMENTAL GROUP -SAMPLE SIZE
CODE ORIGIh
CI C2 C3 C4 C5 C6 C7 C8 C9 CIO Cll C12 C13 C14 C15 C16 C17 C18 C19 C20 C21 C22 C23 C24 C25 C26 C27 C28 C29 C30 C31 C32 C33 C34 C35 C36 C37 C38 C39 C40 C41 C42 C43 C44 C45 C46 C47
MAUR NEWZ AUST AUST ITAL ITAL ITAL AUST ITAL AUST AUST AUST AUST AUST AUST AUST AUST AUST PHIL AUST AUST AUST AUST YUGO AUST AUST ENGL GERM AUST INDI AUST PHIL AUST MAUR AUST AUST AUST AUST AUST AUST CANA MAUR AUST AUST YUGO AUST AUST
MINIMUM
MAXIMUM
AVERAGE
STD DEV
: - 47
f SEX
F F F F F F F F F F F F F F F M F F F M F F F F F F F F F F F F F F F F F F F F M F F F F F F
AGE
25 22 20 31 25 21 28 28 27 34 26 25 28 20 47 25 42 21 25 20 61 46 24 20 22 41 23 26 31 36 21 25 32 36 34 29 35 30 28 28 27 26 28 24 22 25 24
20
61
29
8.1
B (OVERALL)
HGHT
1632 1811 1630 1581 1568 1734 1606 1708 1594 1683 1734 1626 1575 1524 1689 1778 1676 1524 1524 1755 1702 1530 1680 1607 1647 1670 1630 1721 1632 1607 1747 1441 1670 1607 1581 1683 1632 1710 1658 1581 1811 1479 1632 1479 1623 1623 1619
1441
1811
1637
82.8
MASS
59.0 60.5 60.5 60.5 82.0 92.0 50.0 91.0 70.0 72.0 68.0 55.0 70.0 53.8 61.0 105.0 82.3 54.0 45.0 63.0 60.2 45.5 76.0 56.0 57.0 64.0 47.7 63.5 56.0 52.0 70.0 45.0 60.5 51.0 64.0 59.0 65.0 ! 68.0 ! 56.0 ! 70.0 ! 73.0 ! 50.0 ! 55.0 ! 56.0 ! 58.0 ! 60.0 ! 57.0 !
45.0 !
105.0 !
62.8 !
12.4 !
! EYE/COPY DISTANCE
! 2 MIN
! 740 ! 753 ! 478 ! 688 ! 758 ! 710 ! 823 ! 800 ! 728 ! 708 ! 778 ! 766 ! 827 ! 665 ! 658 ! 738 ! 661 ! 772 ! 788 ! 648
715 ! 620
670 595 724 670 682 622 564 723 724 768 850 814 750 728 594 682 736 704 725 692 588 706 568 591 627
478
850
700
77.4
8 MIN
777 748 488 672 740 721 845 812 747 675 812 758 825 698 638 645 728 795 776 687 708 652 756 586 728 686 666 604 543 708 708 786 876 843 756 794 518 658 768 727 765 712 558 706 618 603 627
488
876
707
87.0
MOVEMEN
37 5 10 16 18 11 22 12 19 33 34 8 2
33 20 93 67 23 12 39 7 32 86 9 4 16 16 18 21 15 16 18 26 29 6 66 76 24 32 23 40 20 30 0
50 12 0
0
93
26
21.3
VARIANCE *5 «««^ 153 ! 5992 7568 455
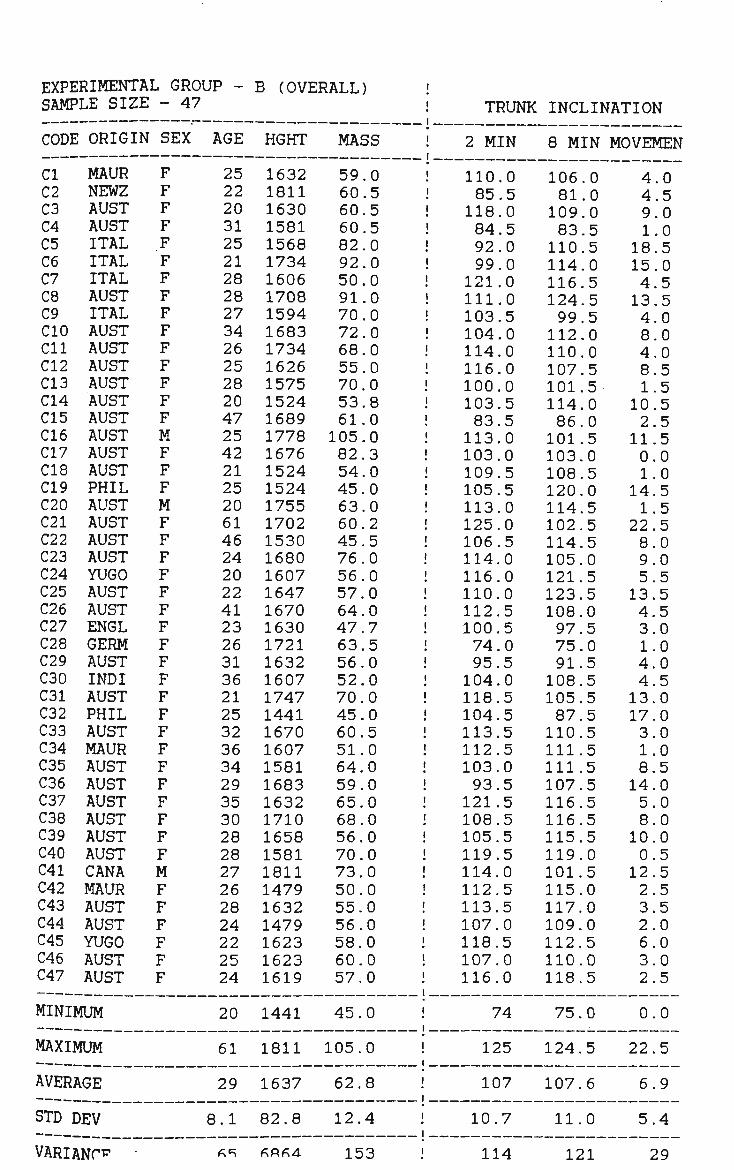
EXPERIMENTAL GROUP -SAMPLE SIZE
CODE
CI C2 C3 C4 C5 C6 C7 C8 C9 CIO Cll C12 C13 C14 C15 C16 C17 C18 C19 C20 C21 C22 C23 C24 C25 C26 C27 C28 C29 C30 C31 C32 C33 C34 C35 C36 C37 C38 C39 C40 C41 C42 C43 C44 C45 C46 C47
: ORIGIN
MAUR NEWZ AUST AUST ITAL ITAL ITAL AUST ITAL AUST AUST AUST AUST AUST AUST AUST AUST AUST PHIL AUST AUST AUST AUST YUGO AUST AUST ENGL GERM AUST INDI AUST PHIL AUST MAUR AUST AUST AUST AUST AUST AUST CANA MAUR AUST AUST YUGO AUST AUST
MINIMUM
MAXIMUM
AVERAGE
STD DEV
VARIANCE
- 47
SEX
F F F F F F F F F F F F F F F M F F F M F F F F F F F F F F F F F F F F F F F F M F F F F F F
AGE
25 22 20 31 25 21 28 28 27 34 26 25 28 20 47 25 42 21 25 20 61 46 24 20 22 41 23 26 31 36 21 25 32 36 34 29 35 30 28 28 27 26 28 24 22 25 24
20
61
29
8.1
«R
B (OVERALL)
HGHT
1632 1811 1630 1581 1568 1734 1606 1708 1594 1683 1734 1626 1575 1524 1689 1778 1676 1524 1524 1755 1702 1530 1680 1607 1647 1670 1630 1721 1632 1607 1747 1441 1670 1607 1581 1683 1632 1710 1658 1581 1811 1479 1632 1479 1623 1623 1619
1441
1811
1637
82.8
£A£4
MASS
59.0 60.5 60.5 60.5 82.0 92.0 50.0 91.0 70.0 72.0 68.0 55.0 70.0 53.8 61.0 105.0 82.3 54.0 45.0 63.0 60.2 45.5 76.0 56.0 57.0 64.0 47.7 63.5 56.0 52.0 70.0 45.0 60.5 51.0 64.0 59.0 65.0 68.0 56.0 70.0 73.0 ! 50.0 55.0 ! 56.0 ! 58.0 ! 60.0 ! 57.0 !
45.0 !
105.0 !
62.8 !
12.4 !
153 !
! TRUNK
! 2 MIN
! 110.0 ! 85.5 ! 118.0 ! 84.5 ! 92.0 ! 99.0 ! 121.0 ! 111.0 ! 103.5 ! 104.0 ! 114.0 ! 116.0 ! 100.0 ! 103.5 i 83.5 ! 113.0 ! 103.0 ! 109.5 ! 105.5 ! 113.0 ! 125.0 ! 106.5
114.0 116.0 110.0 112.5 100.5 74.0 95.5 104.0 118.5 104.5 113.5 112.5 103.0 93.5 121.5 108.5 105.5 119.5 114.0 112.5 113.5 107.0 118.5 107.0 116.0
74
125
107
10.7
114
INCLINATION
8 MIN
106.0 81.0 109.0 83.5 110.5 114.0 116.5 124.5 99.5 112.0 110.0 107.5 101.5 114.0 86.0 101.5 103.0 108.5 120.0 114.5 102.5 114.5 105.0 121.5 123.5 108.0 97.5 75.0 91.5 108.5 105.5 87.5 110.5 111.5 111.5 107.5 116.5 116.5 115.5 119.0 101.5 115.0 117.0 109.0 112.5 110.0 118.5
75.0
124.5
107.6
11.0
121
MOVEMEN
4.0 4.5 9.0 1.0
18.5 15.0 4.5 13.5 4.0 8.0 4.0 8.5 1.5
10.5 2.5 11.5 0.0 1.0
14.5 1.5
22.5 8.0 9.0 5.5 13.5 4.5 3.0 1.0 4.0 4.5 13.0 17.0 3.0 1.0 8.5 14.0 5.0 8.0 10.0 0.5 12.5 2.5 3.5 2.0 6.0 3.0 2.5
0.0
22.5
6.9
5.4
29
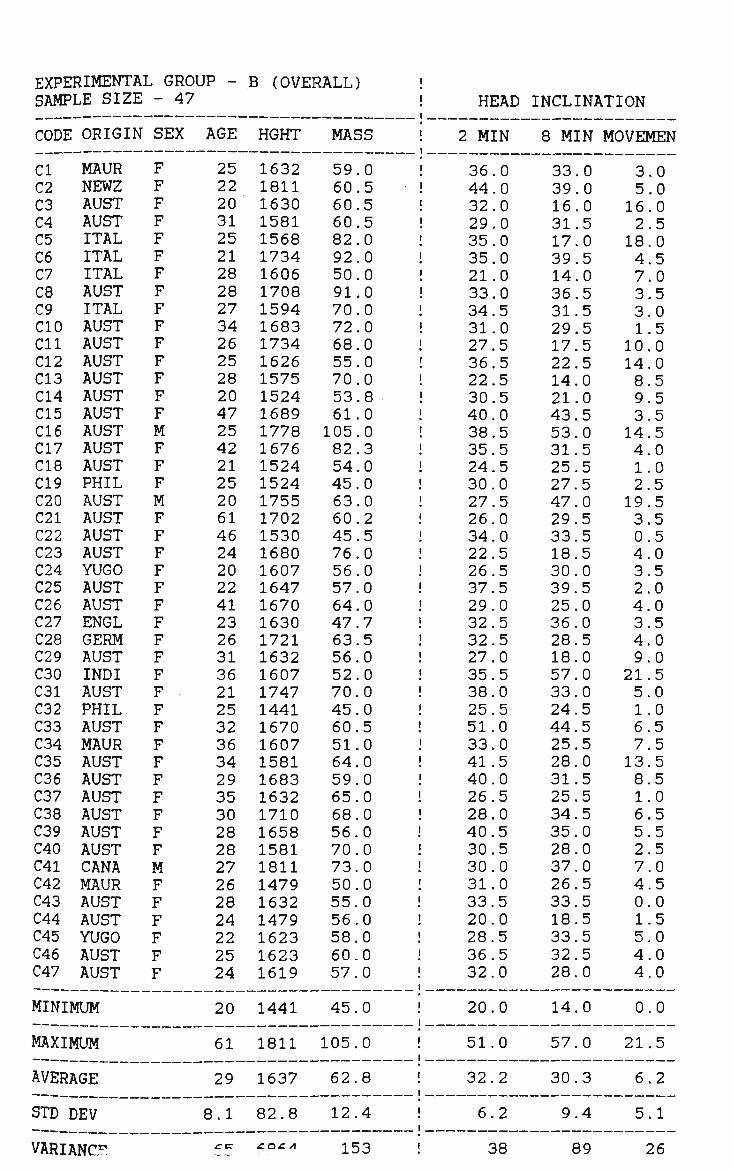
EXPERIMENTAL GROUP -SAMPLE SIZE
CODE
CI C2 C3 C4 C5 C6 C7 C8 C9 CIO Cll C12 C13 C14 C15 C16 C17 C18 C19 C20 C21 C22 C23 C24 C25 C26 C27 C28 C29 C30 C31 C32 C33 C34 C35 C36 C37 C38 C39 C40 C41 C42 C43 C44 C45 C46 C47
ORIGIN
MAUR NEWZ AUST AUST ITAL ITAL ITAL AUST ITAL AUST AUST AUST AUST AUST AUST AUST AUST AUST PHIL AUST AUST AUST AUST YUGO AUST AUST ENGL GERM AUST INDI AUST PHIL AUST MAUR AUST AUST AUST AUST AUST AUST CANA MAUR AUST AUST YUGO AUST AUST
MINIMUM
MAXIMUM
AVERAGE
STD ] DEV
- 47
SEX
F F F F F F F F F F F F F F F M F F F M F F F F F F F F F F F F F F F F F F F F M F F F F F F
AGE
25 22 20 31 25 21 28 28 27 34 26 25 28 20 47 25 42 21 25 20 61 46 24 20 22 41 23 26 31 36 21 25 32 36 34 29 35 30 28 28 27 26 28 24 22 25 24
20
61
29
8.1
B (OVERALL)
HGHT
1632 1811 1630 1581 1568 1734 1606 1708 1594 1683 1734 1626 1575 1524 1689 1778 1676 1524 1524 1755 1702 1530 1680 1607 1647 1670 1630 1721 1632 1607 1747 1441 1670 1607 1581 1683 1632 1710 1658 1581 1811 1479 1632 1479 1623 1623 1619
1441
1811
1637
82.8
MASS
59.0 60.5 60.5 60.5 82.0 92.0 50.0 91.0 70.0 72.0 68.0 55.0 70.0 53.8 61.0 105.0 82.3 54.0 45.0 63.0 60.2 45.5 76.0 56.0 57.0 64.0 47.7 63.5 56.0 52.0 70.0 45.0 60.5 51.0 64.0 59.0 65.0 68.0 56.0 70.0 73.0 50.0 55.0 56.0 58.0 60.0 57.0 !
45.0
105.0 !
62.8 !
12.4 !
HEAD
2 MIN
! 36.0 ! 44.0
32.0 ! 29.0
35.0 35.0 21.0
! 33.0 34.5 31.0 27.5 36.5 22.5 30.5 40.0 38.5 35.5 24.5 30.0 27.5 26.0 34.0 22.5 26.5 37.5 29.0 32.5 32.5 27.0 35.5 38.0 25.5 51.0 33.0 41.5 40.0 26.5 28.0 40.5 30.5 30.0 31.0 33.5 20.0 28.5 36.5 32.0
20.0
51.0
32.2
6.2
INCLINATION
8 MIN
33.0 39.0 16.0 31.5 17.0 39.5 14.0 36.5 31.5 29.5 17.5 22.5 14.0 21.0 43.5 53.0 31.5 25.5 27.5 47.0 29.5 33.5 18.5 30.0 39.5 25.0 36.0 28.5 18.0 57.0 33.0 24.5 44.5 25.5 28.0 31.5 25.5 34.5 35.0 28.0 37.0 26.5 33.5 18.5 33.5 32.5 28.0
14.0
57.0
30.3
9.4
MOVEMEN
3.0 5.0 16.0 2.5
18.0 4.5 7.0 3.5 3.0 1.5
10.0 14.0 8.5 9.5 3.5 14.5 4.0 1.0 2.5 19.5 3.5 0.5 4.0 3.5 2.0 4.0 3.5 4.0 9.0 21.5 5.0 1.0 6.5 7.5 13.5 8.5 1.0 6.5 5.5 2.5 7.0 4.5 0.0 1.5 5.0 4.0 4.0
0.0
21.5
6.2
5.1
VARIANCE f* coeiA 153 38 89 26
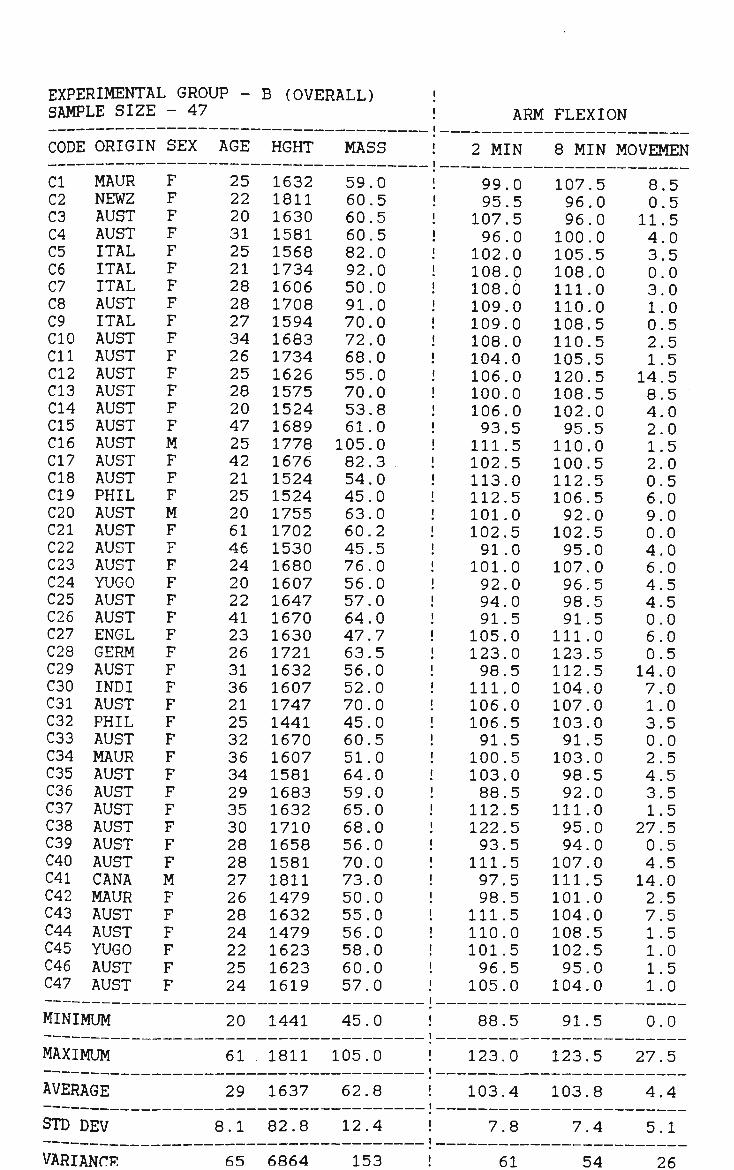
EXPERIMENTAL GROUP - B (OVERALL) SAMPLE SIZE - 47 ARM FLEXION
CODE
CI C2 C3 C4 C5 C6 C7 C8 C9 CIO Cll C12 C13 C14 C15 C16 C17 C18 C19 C20 C21 C22 C23 C24 C25 C26 C27 C28 C29 C30 C31 C32 C33 C34 C35 C36 C37 C38 C39 C40 C41 C42 C43 C44 C45 C46 C47
ORIGIN
MAUR NEWZ AUST AUST ITAL ITAL ITAL AUST ITAL AUST AUST AUST AUST AUST AUST AUST AUST AUST PHIL AUST AUST AUST AUST YUGO AUST AUST ENGL GERM AUST INDI AUST PHIL AUST MAUR AUST AUST AUST AUST AUST AUST CANA MAUR AUST AUST YUGO AUST AUST
MINIMUM
MAXIMUM
AVERAGE
STD DEV
SEX
F F F F F F F F F F F F F F F M F F F M F F F F F F F F F F F F F F F F F F F F M F F F F F F
AGE
25 22 20 31 25 21 28 28 27 34 26 25 28 20 47 25 42 21 25 20 61 46 24 20 22 41 23 26 31 36 21 25 32 36 34 29 35 30 28 28 27 26 28 24 22 25 24
20
61
29
8.1
HGHT
1632 1811 1630 1581 1568 1734 1606 1708 1594 1683 1734 1626 1575 1524 1689 1778 1676 1524 1524 1755 1702 1530 1680 1607 1647 1670 1630 1721 1632 1607 1747 1441 1670 1607 1581 1683 1632 1710 1658 1581 1811 1479 1632 1479 1623 1623 1619
1441
1811
1637
82.8
MASS
59.0 60.5 60.5 60.5 82.0 92.0 50.0 91.0 70.0 72.0 68.0 55.0 70.0 53.8 61.0 105.0 82.3 54.0 45.0 63.0 60.2 45.5 76.0 56.0 57.0 64.0 47.7 63.5 56.0 52.0 70.0 45.0 60.5 51.0 64.0 59.0 65.0 68.0 56.0 70.0 73.0 ! 50.0 ! 55.0 ! 56.0 58.0 ! 60.0 ! 57.0 !
45.0 !
105.0 !
62.8 !
12.4 !
! 2 MIN
! 99.0 ! 95.5 ! 107.5 ! 96.0 ! 102.0 ! 108.0 ! 108.6 ! 109.0 ! 109.0 ! 108.0 ! 104.0 ! 106.0 ! 100.0 ! 106.0 ! 93.5 ! 111.5 ! 102.5 ! 113.0
112.5 ! 101.0
102.5 ! 91.0
101.0 92.0 94.0 91.5 105.0 123.0 98.5 111.0 106.0 106.5 91.5 100.5 103.0 88.5 112.5 122.5 93.5 111.5 97.5 98.5
111.5 110.0 101.5 96.5 105.0
88.5
123.0
103.4
7.8
8 MIN
107.5 96.0 96.0 100.0 105.5 108.0 111.0 110.0 108.5 110.5 105.5 120.5 108.5 102.0 95.5 110.0 100.5 112.5 106.5 92.0 102.5 95.0 107.0 96,5 98.5 91.5 111.0 123.5 112.5 104.0 107.0 103.0 91.5 103.0 98.5 92.0
111.0 95.0 94.0 107.0 111.5 101.0 104.0 108.5 102.5 95.0 104.0
91.5
123.5
103.8
7.4
MOVEMEN
8.5 0.5 11.5 4.0 3.5 0.0 3.0 1.0 0.5 2.5 1.5 14.5 8.5 4.0 2.0 1.5 2.0 0.5 6.0 9.0 0.0 4.0 6.0 4.5 4.5 0.0 6.0 0.5 14.0 7.0 1.0 3.5 0.0 2.5 4.5 3.5 1.5
27.5 0.5 4.5 14.0 2.5 7.5 1.5 1.0 1.5 1.0
0.0
27.5
4.4
5.1
VARIANCE 65 6864 153 61 54 26
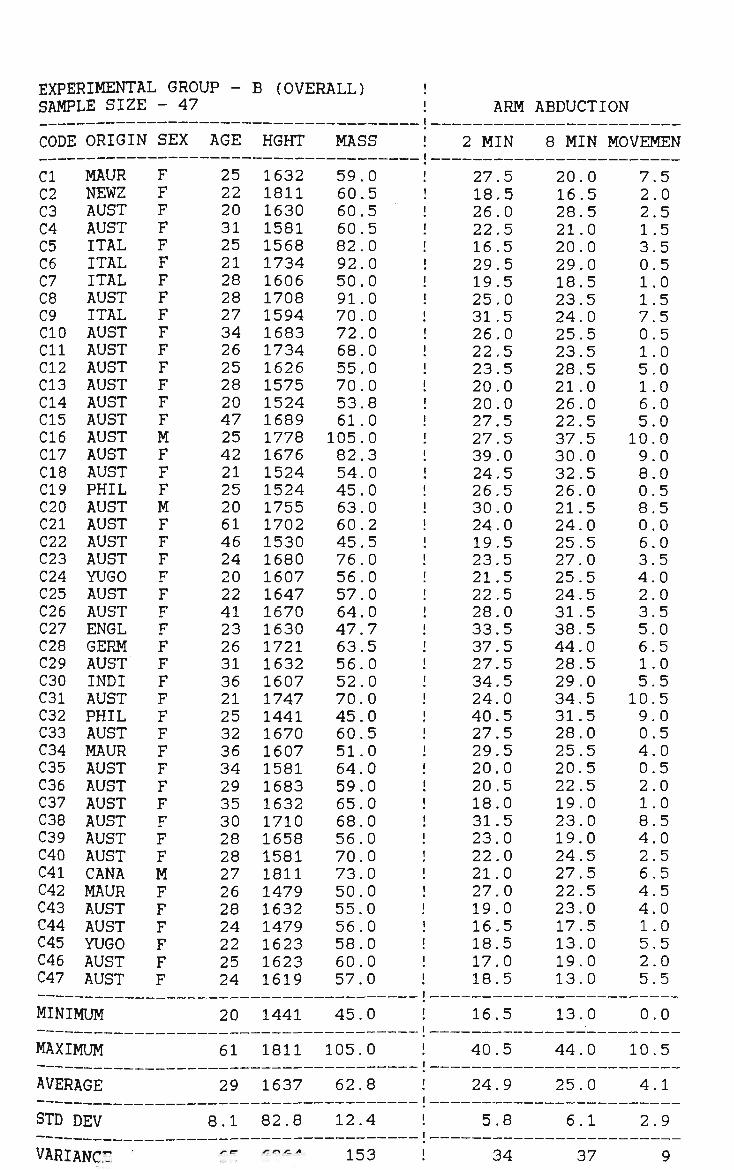
EXPERIMENTAL GROUP -SAMPLE SIZE
CODE
CI C2 C3 C4 C5 C6 C7 C8 C9 CIO Cll C12 C13 C14 C15 C16 C17 C18 C19 C20 C21 C22 C23 C24 C25 C26 C27 C28 C29 C30 C31 C32 C33 C34 C35 C36 C37 C38 C39 C40 C41 C42 C43 C44 C45 C46 C47
ORIGIN
MAUR NEWZ AUST AUST ITAL ITAL ITAL AUST ITAL AUST AUST AUST AUST AUST AUST AUST AUST AUST PHIL AUST AUST AUST AUST YUGO AUST AUST ENGL GERM AUST INDI AUST PHIL AUST MAUR AUST AUST AUST AUST AUST AUST CANA MAUR AUST AUST YUGO AUST AUST
MINIMUM
MAXIMUM
AVERAGE
STD ] DEV
VARIANCE
- 47
SEX
F F F F F F F F F F F F F F F M F F F M F F F F F F F F F F F F F F F F F F F F M F F F F F F
AGE
25 22 20 31 25 21 28 28 27 34 26 25 28 20 47 25 42 21 25 20 61 46 24 20 22 41 23 26 31 36 21 25 32 36 34 29 35 30 28 28 27 26 28 24 22 25 24
20
61
29
8.1
y" <="
B (OVERALL)
HGHT
1632 1811 1630 1581 1568 1734 1606 1708 1594 1683 1734 1626 1575 1524 1689 1778 1676 1524 1524 1755 1702 1530 1680 1607 1647 1670 1630 1721 1632 1607 1747 1441 1670 1607 1581 1683 1632 1710 1658 1581 1811 1479 1632 1479 1623 1623 1619
1441
1811
1637
82.8
y-.rv- ;..A-.-.
MASS
59.0 60.5 60.5 60.5 82.0 92.0 50.0 91.0 70.0 72.0 68.0 55.0 70.0 53.8 61.0 105.0 82.3 54.0 45.0 63.0 60.2 45.5 76.0 56.0 57.0 64.0 47.7 63.5 56.0 52.0 70.0 45.0 60.5 51.0 64.0 59.0 65.0 68.0 56.0 70.0 73.0 50.0 55.0 56.0 58.0 60.0 57.0
45.0
105.0
62.8
12.4
153
ARM
2 MIN
27.5 ! 18.5
26.0 22.5 16.5 29.5 19.5 25.0 31.5 26.0 22.5 23.5 20.0 20.0 27.5 27.5 39.0 24.5 26.5 30.0 24.0 19.5 23.5 21.5 22.5 28.0 33.5 37.5 27.5 34.5 24.0 40.5 27.5 29.5 20.0 20.5 18.0 31.5 23.0 22.0 21.0 27.0 19.0 16.5 18.5 17.0 18.5
16.5
40.5
24.9
5.8
34
ABDUCTION
8 MIN
20.0 16.5 28.5 21.0 20.0 29.0 18.5 23.5 24.0 25.5 23.5 28.5 21.0 26.0 22.5 37.5 30.0 32.5 26.0 21.5 24.0 25.5 27.0 25.5 24.5 31.5 38.5 44.0 28.5 29.0 34.5 31.5 28.0 25.5 20.5 22.5 19.0 23.0 19.0 24.5 27.5 22.5 23.0 17.5 13.0 19.0 13.0
13.0
44.0
25.0
6.1
37
MOVEMEN
7.5 2.0 2.5 1.5 3.5 0.5 1.0 1.5 7.5 0.5 1.0 5.0 1.0 6.0 5.0 10.0 9.0 8.0 0.5 8.5 0.0 6.0 3.5 4.0 2.0 3.5 5.0 6.5 1.0 5.5 10.5 9.0 0.5 4.0 0.5 2.0 1.0 8.5 4.0 2.5 6.5 4.5 4.0 1.0 5.5 2.0 5.5
0.0
10.5
4.1
2.9
9
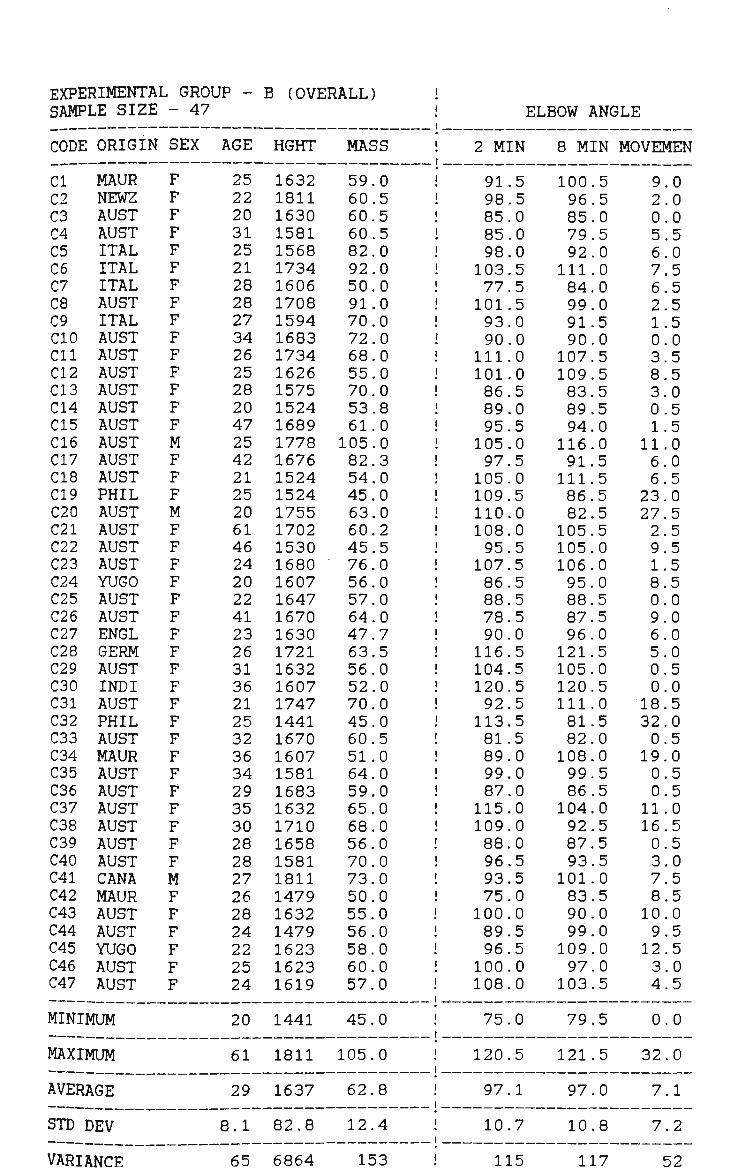
EXPERIMENTAL GROUP -SAMPLE SIZE
CODE
CI C2 C3 C4 C5 C6 C7 C8 C9 CIO Cll C12 C13 C14 C15 C16 C17 C18 C19 C20 C21 C22 C23 C24 C25 C26 C27 C28 C29 C30 C31 C32 C33 C34 C35 C36 C37 C38 C39 C40 C41 C42 C43 C44 C45 C46 C47
ORIGIN
MAUR NEWZ AUST AUST ITAL ITAL ITAL AUST ITAL AUST AUST AUST AUST AUST AUST AUST AUST AUST PHIL AUST AUST AUST AUST YUGO AUST AUST ENGL GERM AUST INDI AUST PHIL AUST MAUR AUST AUST AUST AUST AUST AUST CANA MAUR AUST AUST YUGO AUST AUST
MINIMUM
MAXIMUM
AVERAGE
STD ] DEV
- 47
SEX
F F F F F F F F F F F F F F F M F F F M F F F F F F F F F F F F F F F F F F F F M F F F F F F
AGE
25 22 20 31 25 21 28 28 27 34 26 25 28 20 47 25 42 21 25 20 61 46 24 20 22 41 23 26 31 36 21 25 32 36 34 29 35 30 28 28 27 26 28 24 22 25 24
20
61
29
8.1
B (OVERALL)
HGHT
1632 1811 1630 1581 1568 1734 1606 1708 1594 1683 1734 1626 1575 1524 1689 1778 1676 1524 1524 1755 1702 1530 1680 1607 1647 1670 1630 1721 1632 1607 1747 1441 1670 1607 1581 1683 1632 1710 1658 1581 1811 1479 1632 1479 1623 1623 1619
1441
1811
1637
82.8
MASS
59.0 60.5 60.5 60.5 82.0 92.0 50.0 91.0 70.0 72.0 68.0 55.0 70.0 53.8 61.0 105.0 82.3 54.0 45.0 63.0 60.2 45.5 76.0 56.0 57.0 64.0 47.7 63.5 56.0 52.0 70.0 45.0 60.5 51.0 64.0 59.0 65.0 68.0 56.0 70.0 73.0 50.0 55.0 56.0 58.0 60.0 57.0
45.0
105.0
62.8
12.4
ELBOW ANGLE
2 MIN
91.5 98.5 85.0 85.0 98.0 103.5 77.5 101.5 93.0 90.0 111.0 101.0 86.5 89.0 95.5 105.0 97.5 105.0 109.5 110.0 108.0 95.5
107.5 86.5 88.5 78.5 90.0 116.5 104.5 120.5 92.5 113.5 81.5 89.0 99.0 87.0 115.0 109.0 88.0 96.5 93.5 75.0 100.0 89.5 96.5 100.0 108.0
75.0
120.5
97.1
10.7
8 MIN
100.5 96.5 85.0 79.5 92.0 111.0 84.0 99.0 91.5 90.0 107.5 109.5 83.5 89.5 94.0 116.0 91.5 111.5 86.5 82.5 105.5 105.0 106.0 95.0 88.5 87.5 96.0 121.5 105.0 120.5 111.0 81.5 82.0 108.0 99.5 86.5 104.0 92.5 87.5 93.5 101.0 83.5 90.0 99.0 109.0 97.0 103.5
79.5
121.5
97.0
10.8
MOVEMEN
9.0 2.0 0.0 5.5 6.0 7.5 6.5 2.5 1.5 0.0 3.5 8.5 3.0 0.5 1.5 11.0 6.0 6.5
23.0 27.5 2.5 9.5 1.5 8.5 0.0 9.0 6.0 5.0 0.5 0.0 18.5 32.0 0.5 19.0 0.5 0.5 11.0 16.5 0.5 3.0 7.5 8.5 10.0 9.5 12.5 3.0 4.5
0.0
32.0
7.1
7.2
VARIANCE 65 6864 153 115 117 52
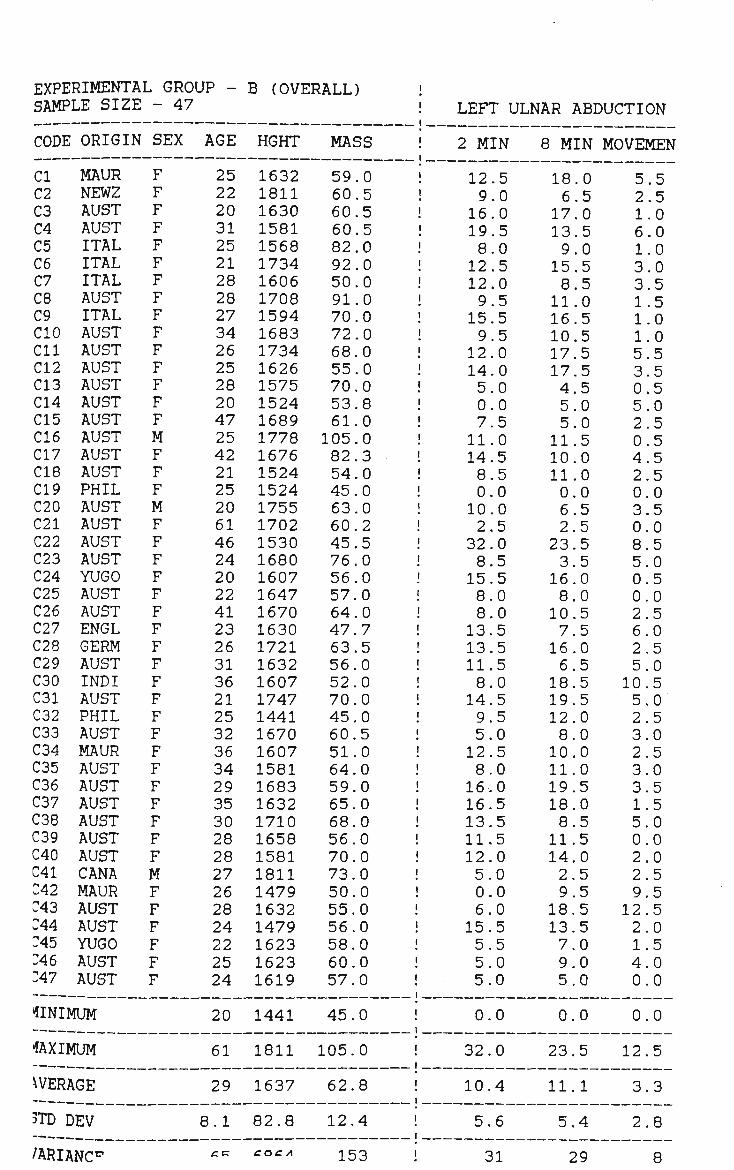
EXPERIMENTAL GROUP - B (OVERALL) SAMPLE SIZE - 47 LEFT ULNAR ABDUCTION
CODE
CI C2 C3 C4 C5 C6 C7 C8 C9 CIO Cll C12 C13 C14 C15 C16 C17 C18 C19 C20 C21 C22 C23 C24 C25 C26 C27 C28 C29 C30 C31 C32 C33 C34 C35 C36 C37 C38 C39 C40 C41 C42 C43 344 :45 :46 :47
ORIGIN
MAUR NEWZ AUST AUST ITAL ITAL ITAL AUST ITAL AUST AUST AUST AUST AUST AUST AUST AUST AUST PHIL AUST AUST AUST AUST YUGO AUST AUST ENGL GERM AUST INDI AUST PHIL AUST MAUR AUST AUST AUST AUST AUST AUST CANA MAUR AUST AUST YUGO AUST AUST
MINIMUM
4AXIMUM
AVERAGE
5TD DEV
'ARIANC*
SEX
F F F F F F F F F F F F F F F M F F F M F F F F F F F F F F F F F F F F F F F F M F F F F F F
AGE
25 22 20 31 25 21 28 28 27 34 26 25 28 20 47 25 42 21 25 20 61 46 24 20 22 41 23 26 31 36 21 25 32 36 34 29 35 30 28 28 27 26 28 24 22 25 24
20
61
29
8.1
CL K
HGHT
1632 1811 1630 1581 1568 1734 1606 1708 1594 1683 1734 1626 1575 1524 1689 1778 1676 1524 1524 1755 1702 1530 1680 1607 1647 1670 1630 1721 1632 1607 1747 1441 1670 1607 1581 1683 1632 1710 1658 1581 1811 1479 1632 1479 1623 1623 1619
1441
1811
1637
82.8
cac.A
MASS
59.0 60.5 60.5 60.5 82.0 92.0 50.0 91.0 70.0 72.0 68.0 55.0 70.0 53.8 61.0 105.0 82.3 54.0 45.0 63.0 60.2 45.5 76.0 56.0 57.0 64.0 47.7 63.5 56.0 52.0 70.0 45.0 60.5 51.0 64.0 59.0 65.0 68.0 56.0 ! 70.0 73.0 ! 50.0 55.0 ! 56.0 ! 58.0 ! 60.0 ! 57.0 !
45.0 !
105.0 !
62.8 !
12.4 !
153 !
! 2 MIN
! 12.5 ! 9.0 ! 16.0 ! 19.5 ! 8.0 ! 12.5 ! 12.0 ! 9.5 ! 15.5 ! 9.5 ! 12.0 ! 14.0 ! 5.0 ! 0.0 ! 7.5 ! 11.0
14.5 ! 8.5
0.0 i 10.0
2.5 32.0 8.5 15.5 8.0 8.0 13.5 13.5 11.5 8.0 14.5 9.5 5.0 12.5 8.0 16.0 16.5 13.5 11.5 12.0 5.0 0.0 6.0 15.5 5.5 5.0 5.0
0.0
32.0
10.4
5.6
31
8 MIN
18.0 6.5 17.0 13.5 9.0 15.5 8.5 11.0 16.5 10.5 17.5 17.5 4.5 5.0 5.0 11.5 10.0 11.0 0.0 6.5 2.5
23.5 3.5 16.0 8.0 10.5 7.5 16.0 6.5 18.5 19.5 12.0 8.0 10.0 11.0 19.5 18.0 8.5 11.5 14.0 2.5 9.5 18.5 13.5 7.0 9.0 5.0
0.0
23.5
11.1
5.4
29
MOVEMEN
5.5 2.5 1.0 6.0 1.0 3.0 3.5 1.5 1.0 1.0 5.5 3.5 0.5 5.0 2.5 0.5 4.5 2.5 0.0 3.5 0.0 8.5 5.0 0.5 0.0 2.5 6.0 2.5 5.0 10.5 5.0 2.5 3.0 2.5 3.0 3.5 1.5 5.0 0.0 2.0 2.5 9.5
12.5 2.0 1.5 4.0 0.0
0.0
12.5
3.3
2.8
8
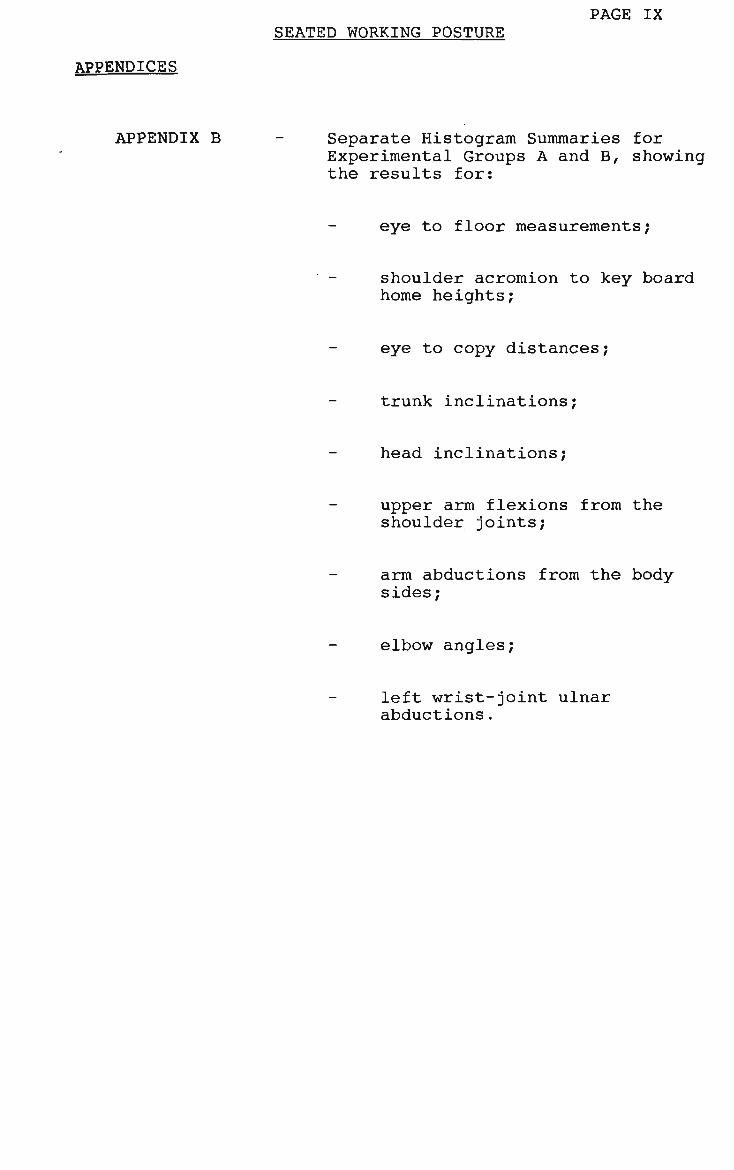
PAGE IX SEATED WORKING POSTURE
B - Separate Histogram Summaries for Experimental Groups A and B, showing the results for:
eye to floor measurements;
shoulder acromion to key board home heights;
eye to copy distances;
trunk inclinations;
head inclinations;
upper arm flexions from the shoulder joints;
arm abductions from the body sides;
elbow angles;
left wrist-joint ulnar abductions.

AVERAGE POSITIONS
(GRAPHS)
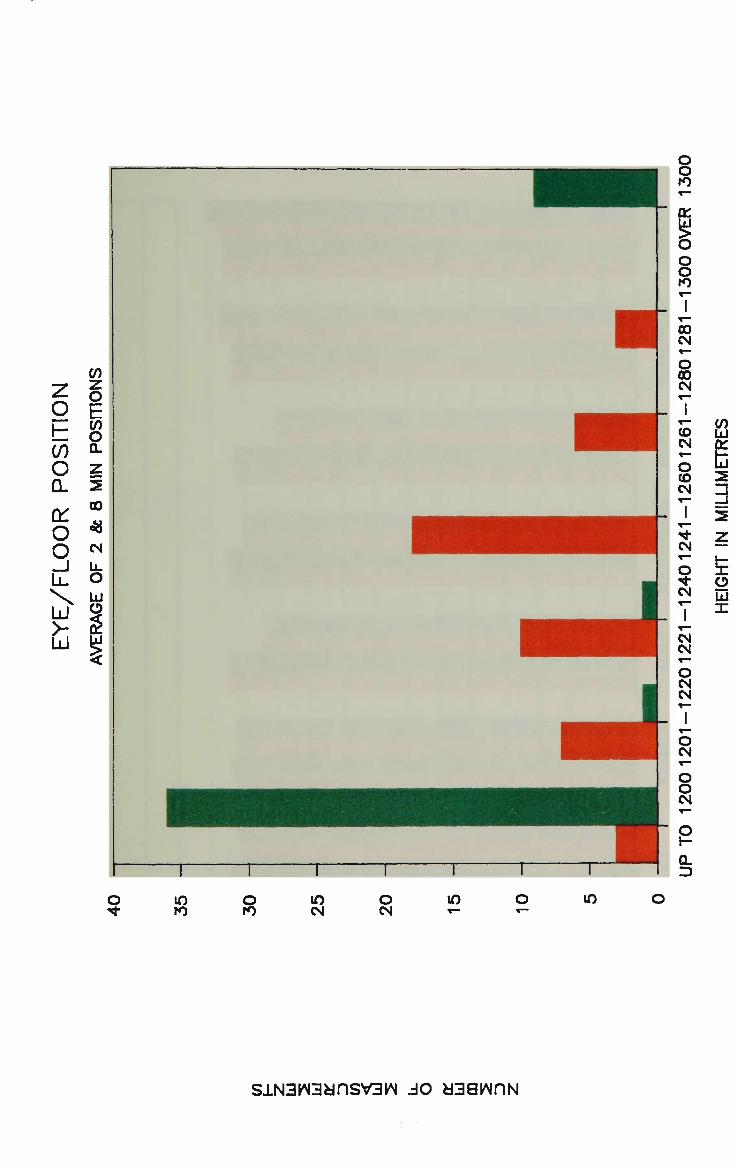
o in o to CM
o CM
to in
s±N3W3ansv3w JO aaawnN
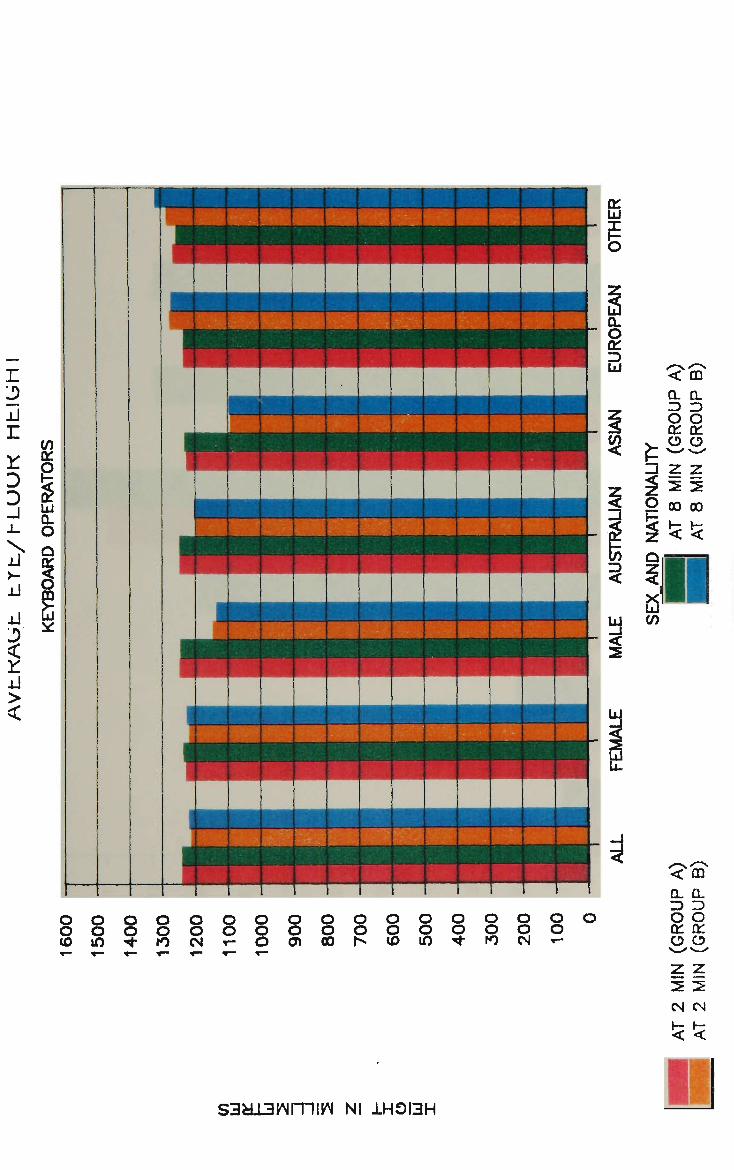
V) DC
I UJ Q_
O Q
i
I 1
1 j
1
1 1 1
11 6s • • ;•- " • • - .
| I
Iii
o o o o o o o o to in ^ n
o o CM
O O T—
o o o
o o 0>
o o 00
o o h>
o o (£>
o o m
o o **
o o to
o o CM
o o *—
< m
O O 0C QL
O O
<fm Q_ Z> O a:
Z
Q. 3 O a: o z:
5 2 CM h-<
CM 1— <
s3a±3wmiw Nl 1H0I3H
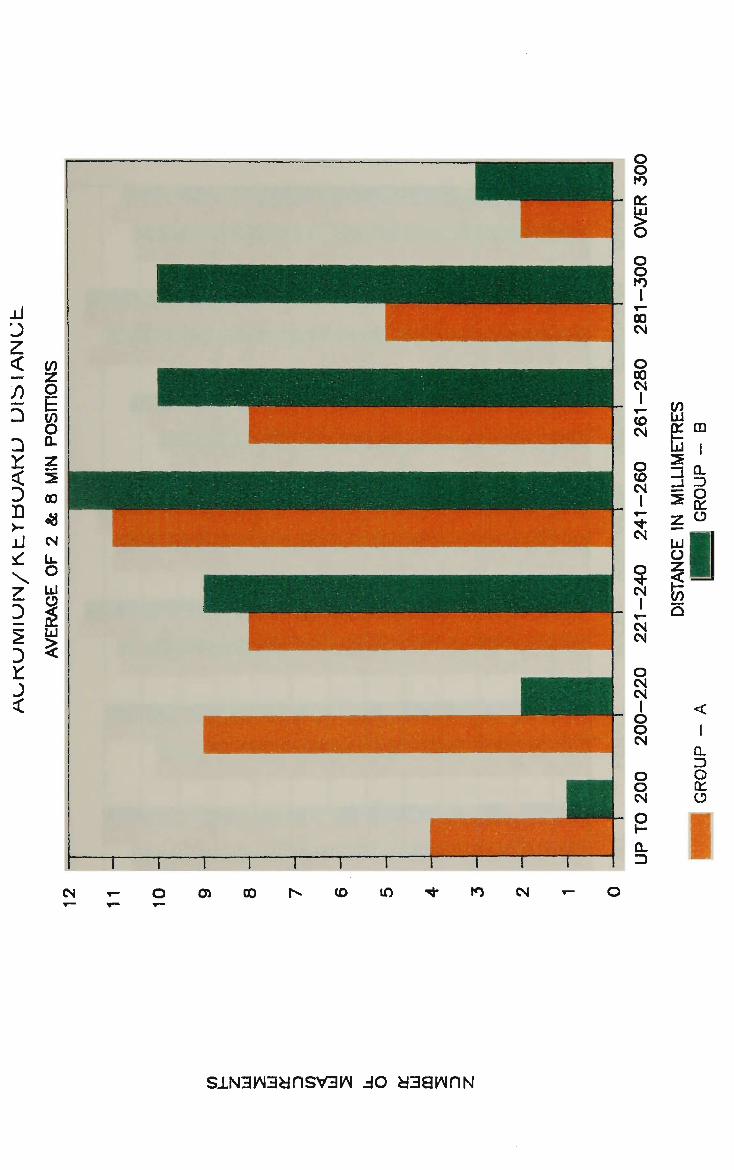
LU
b 3a =i o
01 ; z o
O 1
0. O a:
I
S±N3*N3ariSV3W JO asawnN
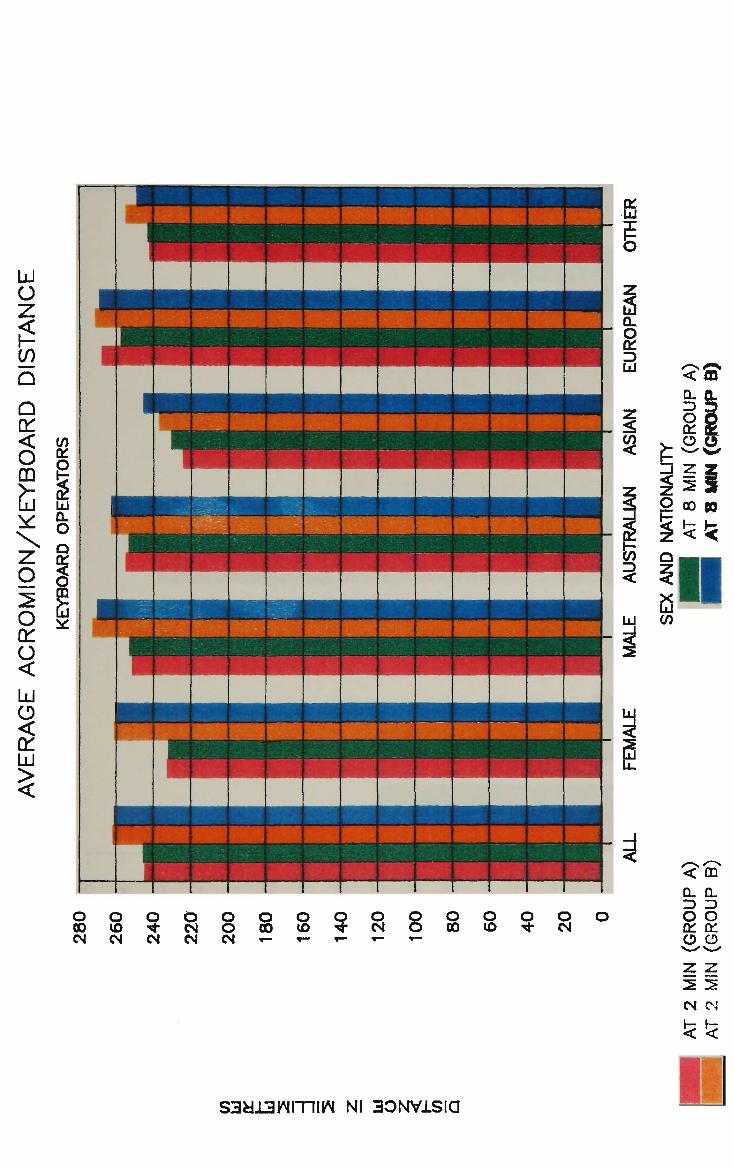
U
o z if)
a <
o m
\
z g o on o <
LU
o <
a:
o o oo to CM CM
S3&L3WIT™ Nl 30NV1SIQ
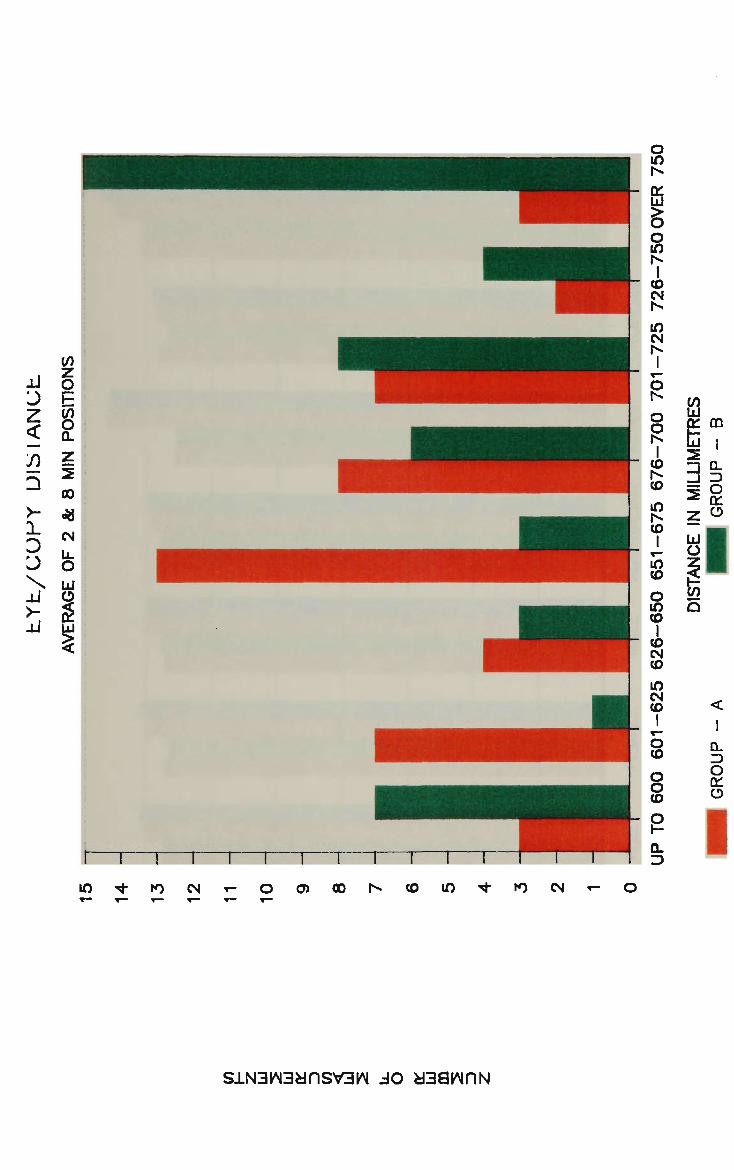
Al 'J 7 <
f) n >-
1. 0 \ Al >-Al
V) z o F to o 0-z 2 DO «a CM Lu
O LU 9 £ § <
o in
6 S o m
1 (0 CM N
m I CM
O V) LU m
-J 3
LU|
o
to
0. 3
o O
in ro CM »- 0) oo <o in to CM T-
siN3W3ansv3N JO asawnN
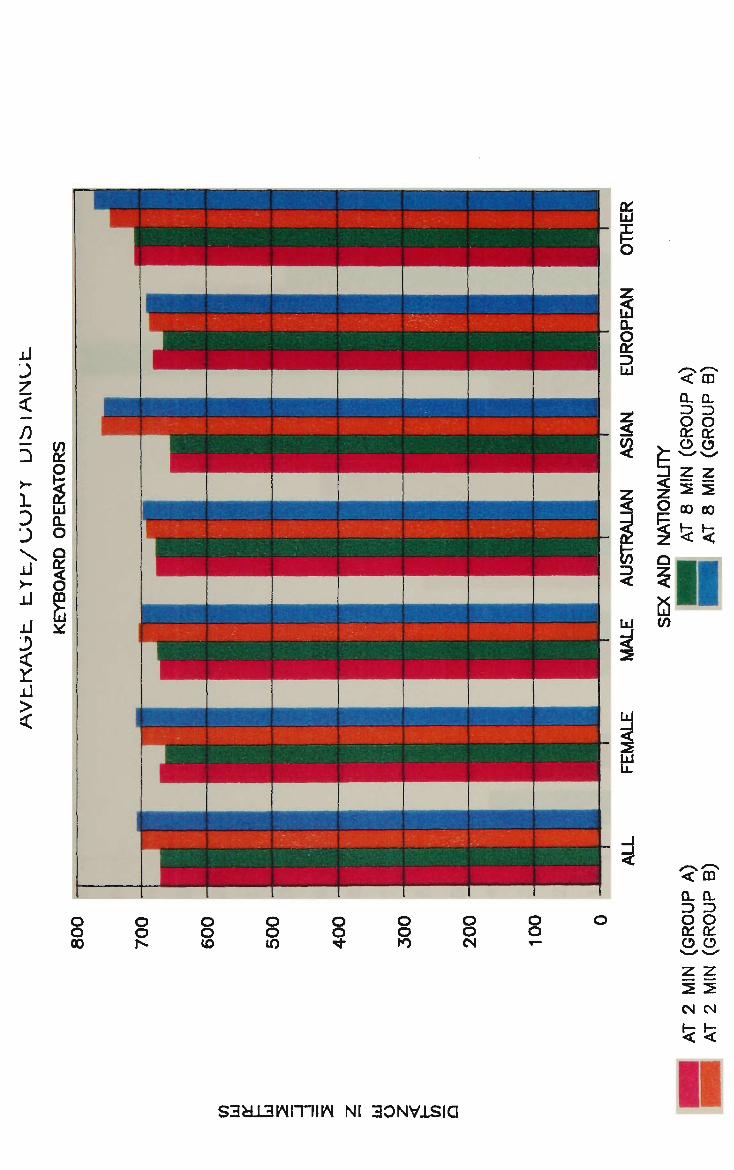
ssauwrniN NI SONVISIQ 11
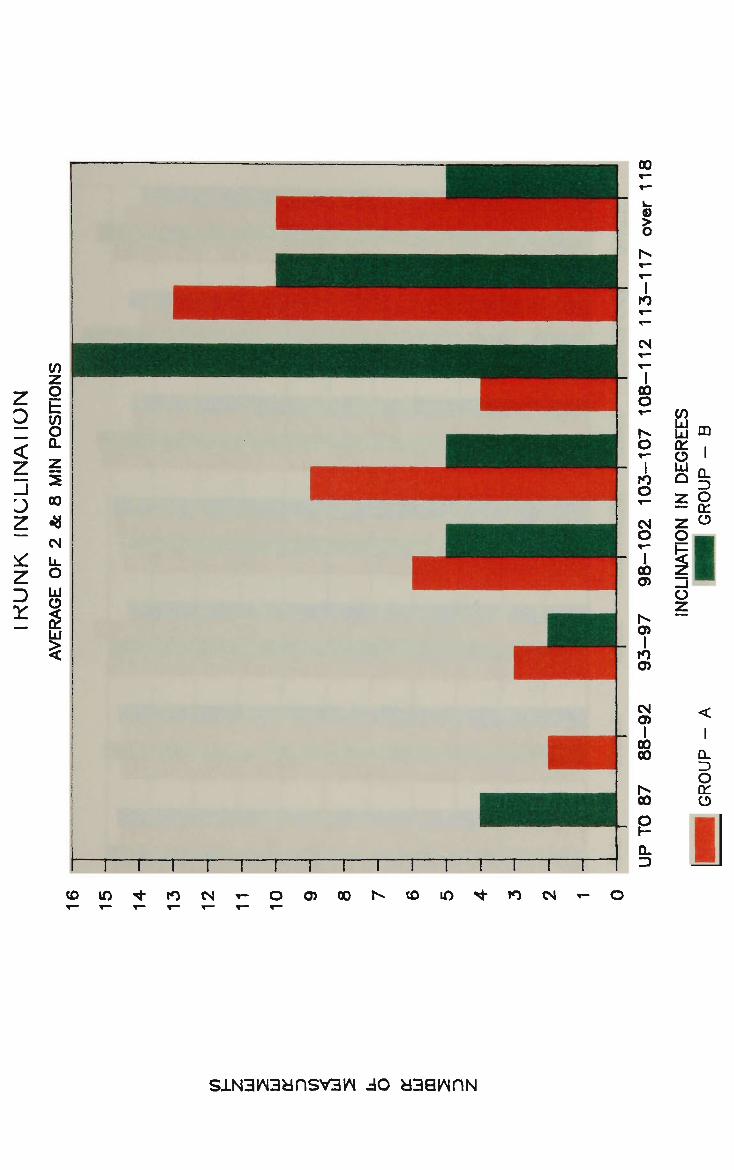
00
8
to
CM
1 00 o T— N o T~ 1 ro o CM O T~
1 00 CD
h* i i to 0)
CM 0)
i 1 oo 00
CO LU LU C£ O LU Q Z "™"
z o F Zi o z 1 • ' • •
m
i o_ 3 O Ul O ^_
|
<
1 LL 3 O
1 — I — I — f CO lO "t to CN
1 1 1 1 1 1 1 1—T OOlOONtOin^tOCM
oo
p D. 3
0C
I *- o
SAN3^3anSV3W JO asawriN

S33a03d Nl NOLLVNI10NI
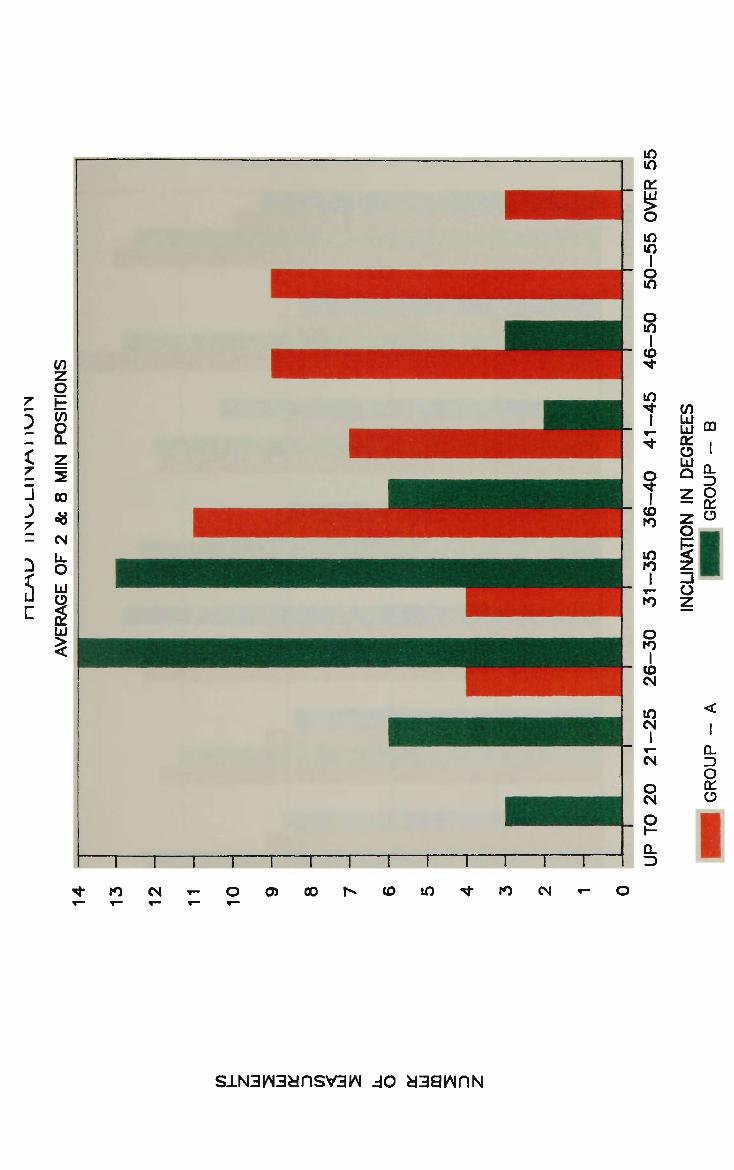
CO LU _
Lu no S i z o — Q£ Z C3 O F O
z
<
I
3
o O
S±N3*N3UnSV3N JO d38^nN
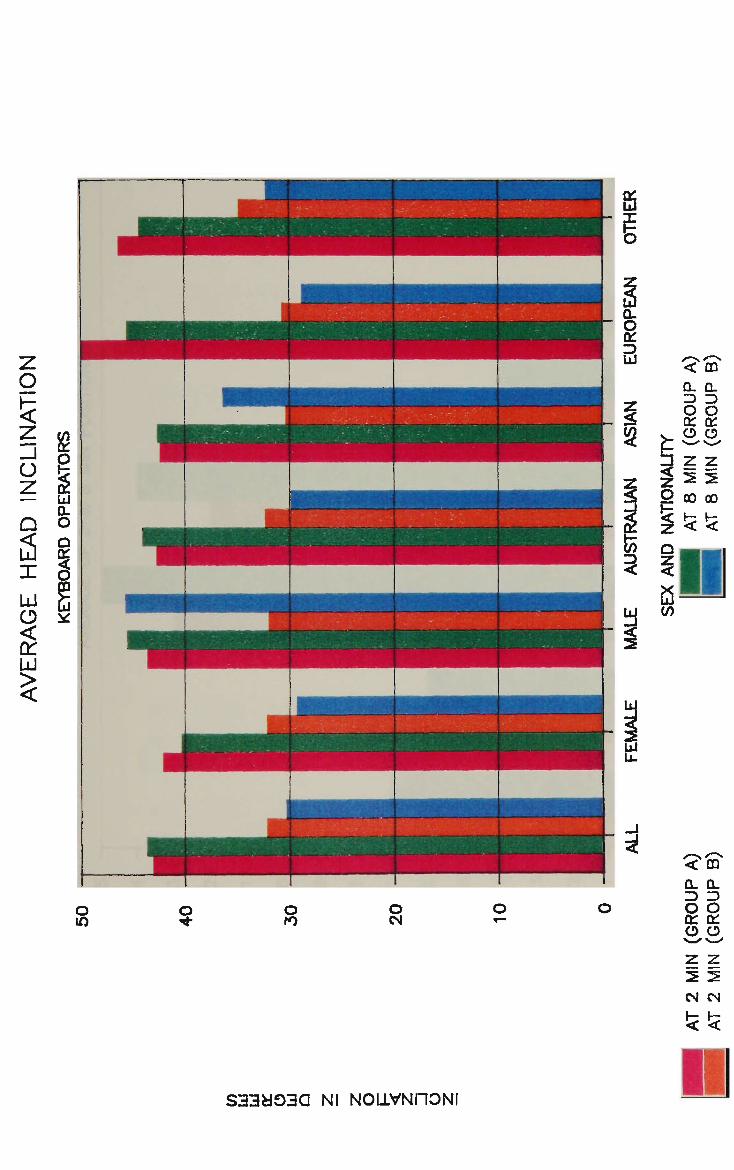
o m
? o to
o CM
Q:
LU
i
0. o a:
3 9
I 3 a
*
< m Q_ 3
OL 3
O O a: o **-?
z
01 o «w»
z 2 2 CM H <
CM H-<
S33d03a Nl N0LLVNI10NI 1
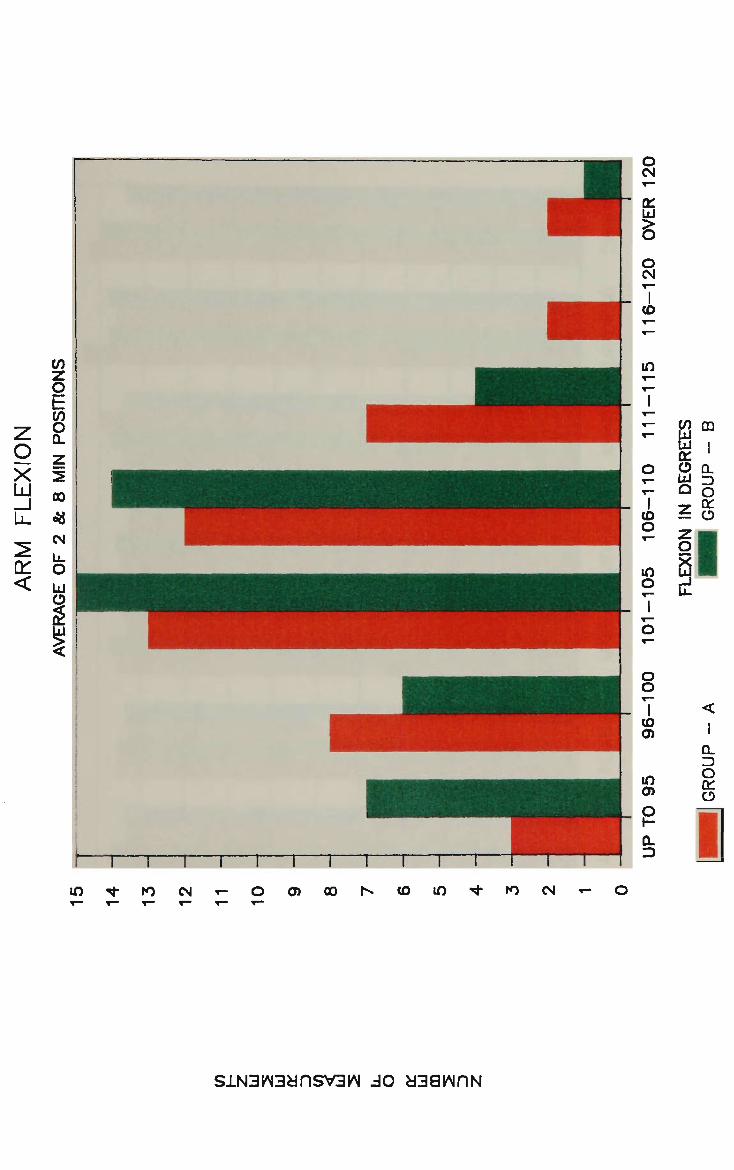
z o X IAI
LL.
2 on <
CO z o b CO o Q_ z 2 00
*
CM Ii O LU <2 & LU > <
SlN3l^3dnSV3kN JO usawriN
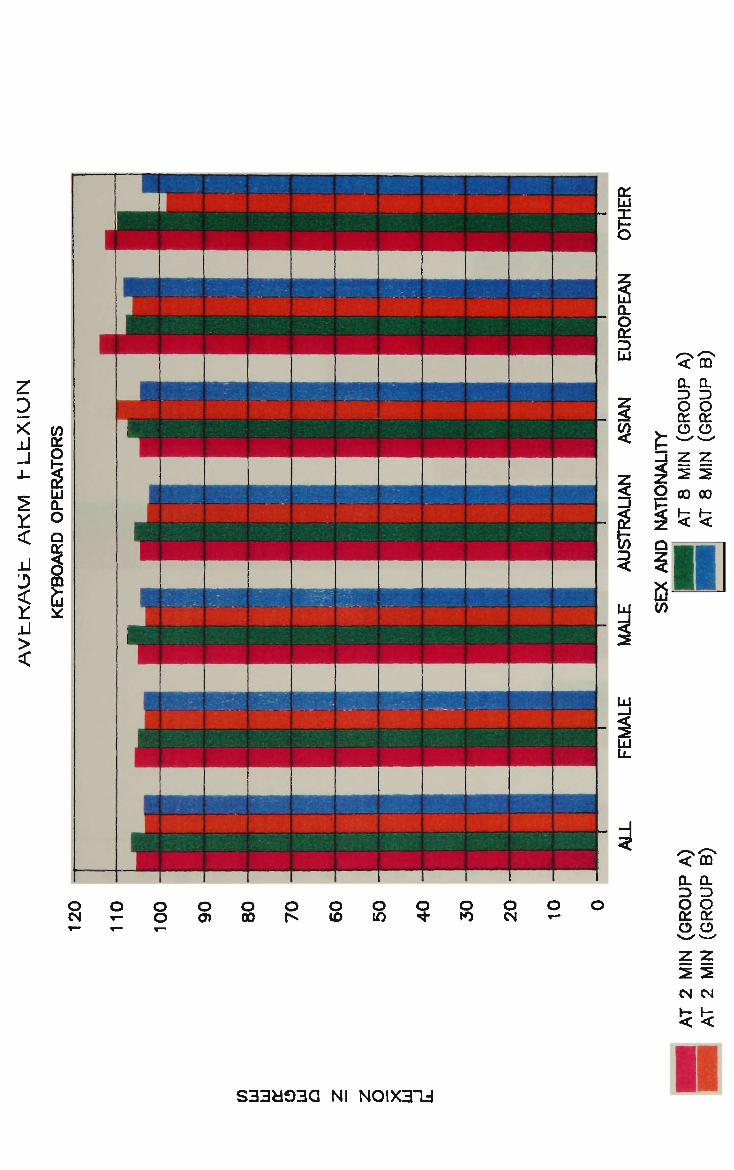
z. 0 K AI
r <
(0
I LU 0. O Q or
<
Y. Al >
Lu
• • • -
^B
]
" -V
ffl^^HH
^
fcj':-.-'-x, .' •.'.':
•H^^H
1 { H U H
; * • • • • • •
j
H
JH
..
| - HI
f ; •
j
. * i *
^^^H HHH
•
mmmm
• • ; • ; ; . • . • .
-
LU
I Q. O QL 3 LU
8 fc
5 S
a <
< CO
Q_ 0.
3 3 O O o o z z 2 2 00 00
h- H < <
3 25
LU CO
o CM O T— o
o o O) o 00 o N o CO o in ? o to o CM o T~
0_ 0-
3 3 O O QL 01
O O z z
S33H03Q Ni NOIX3TJ
CM CM
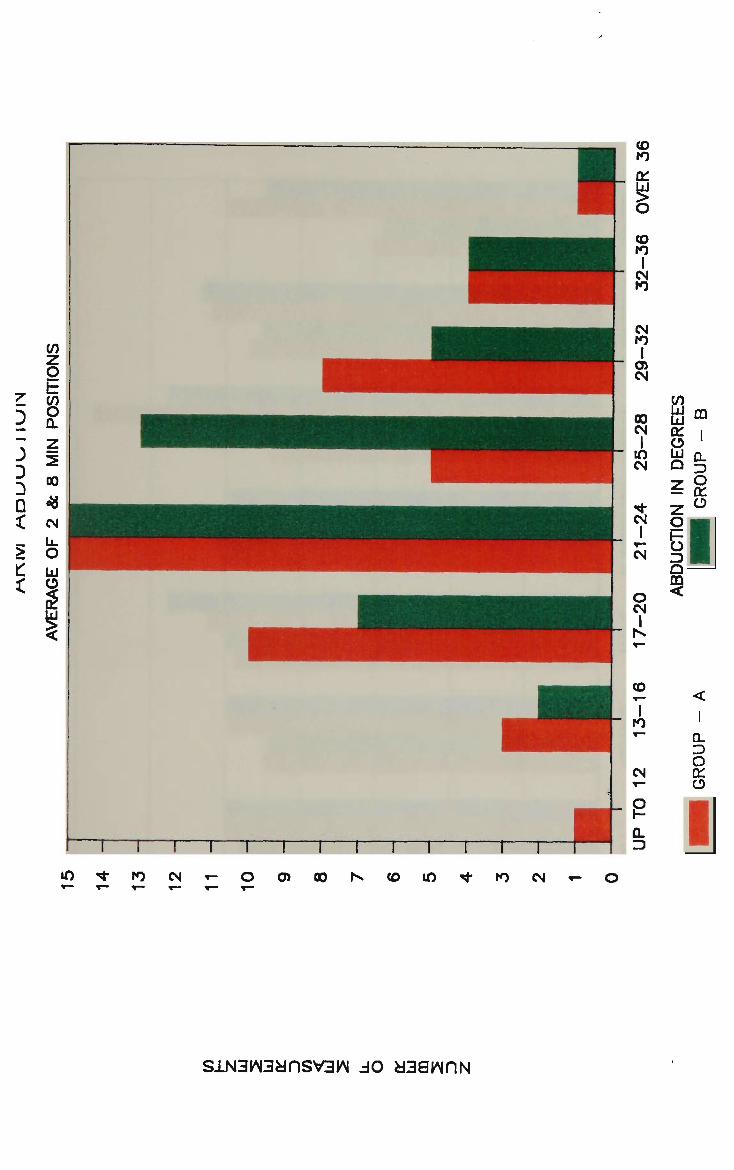
a: i
o l Q 3
Z ° = 01
o
z Ol
g 3 Q
3
I
<
I
0_ 3 O CU O
1
s±N3hi3ansv3kN JO asawnN
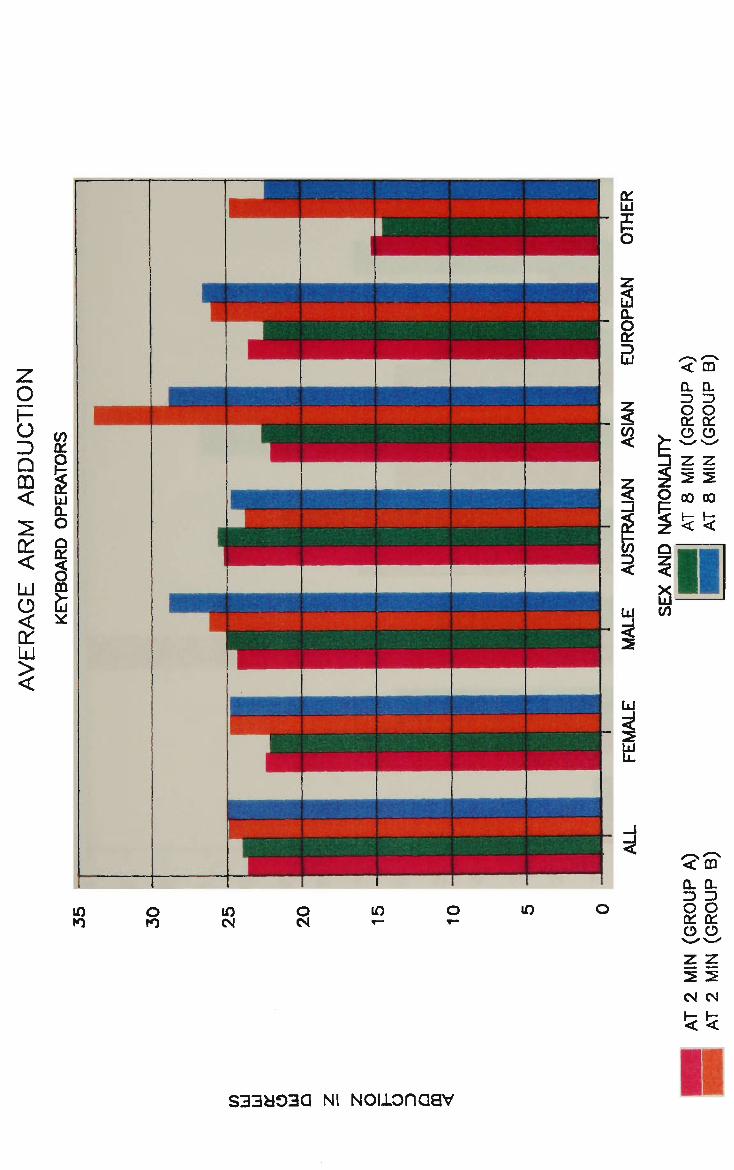
z z 2 2 CM CM
< <
S33H03Q NI NOi±onaav I I
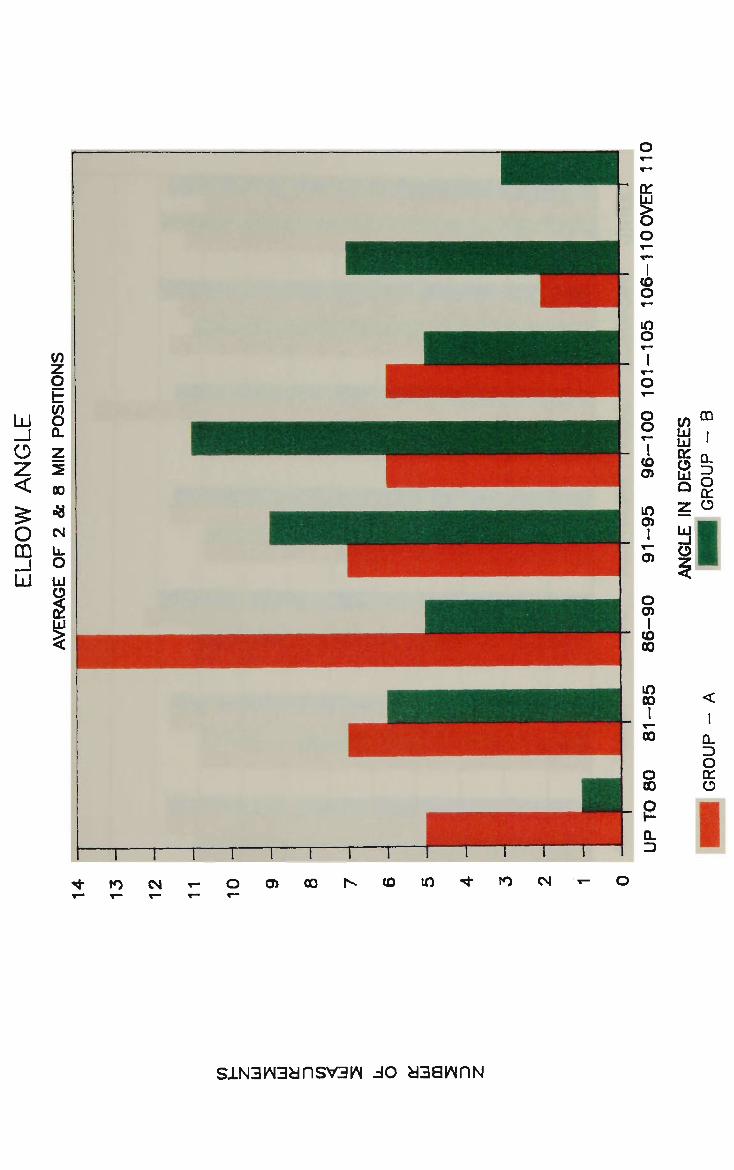
CO m
LU | LU ' K CL LU 2
z o LU — I
o I
CL 3 O 01
o
I tO CM T- O o> 00 CO in tO CM •*- o
siN3kN3ynsv3n JO asawnN
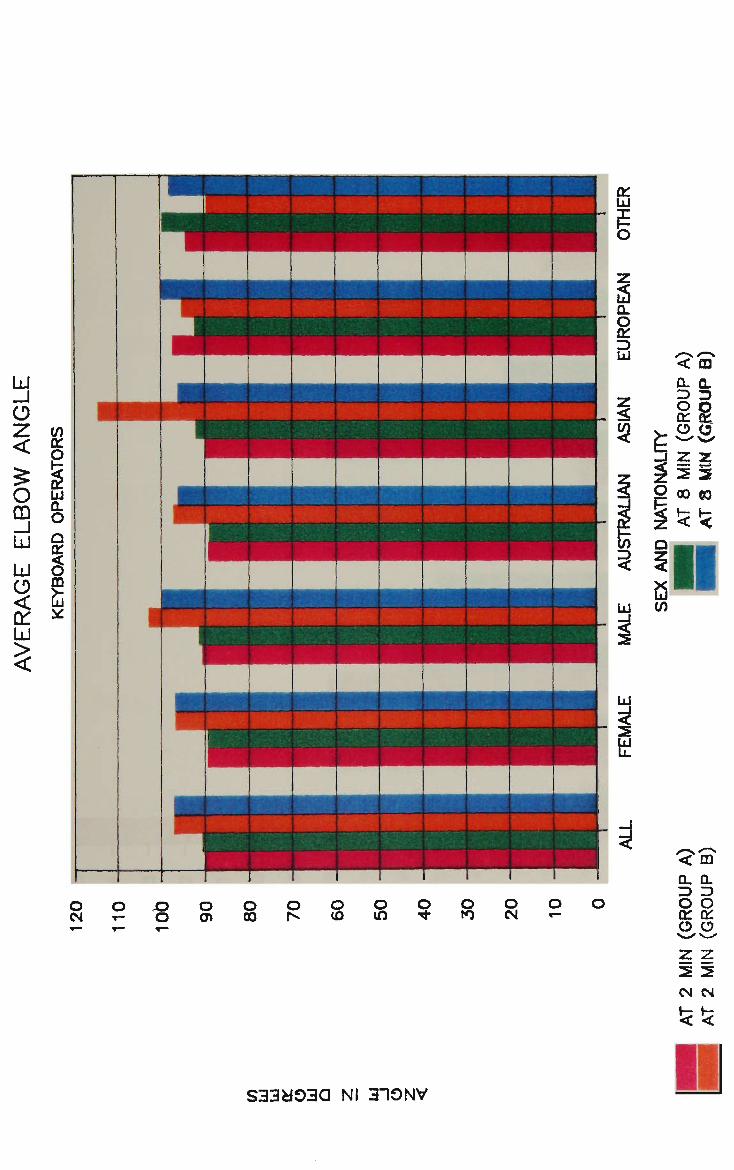
_J
o z <
o CD _ l IAJ IAI
O <
on LAI
CO 01
I LU £L
O Q
I s
O O - O O O O Q Q O O
c M - r - o o i o o r ^ i o w ^ f r t o o o CM r-
_! <!
/-~s < Q_ 3 O 01 O N ^
z
m a. 3 0 01 0
z 2 2 CM \~ <
CM t-<
S33d03a Nl 310NV
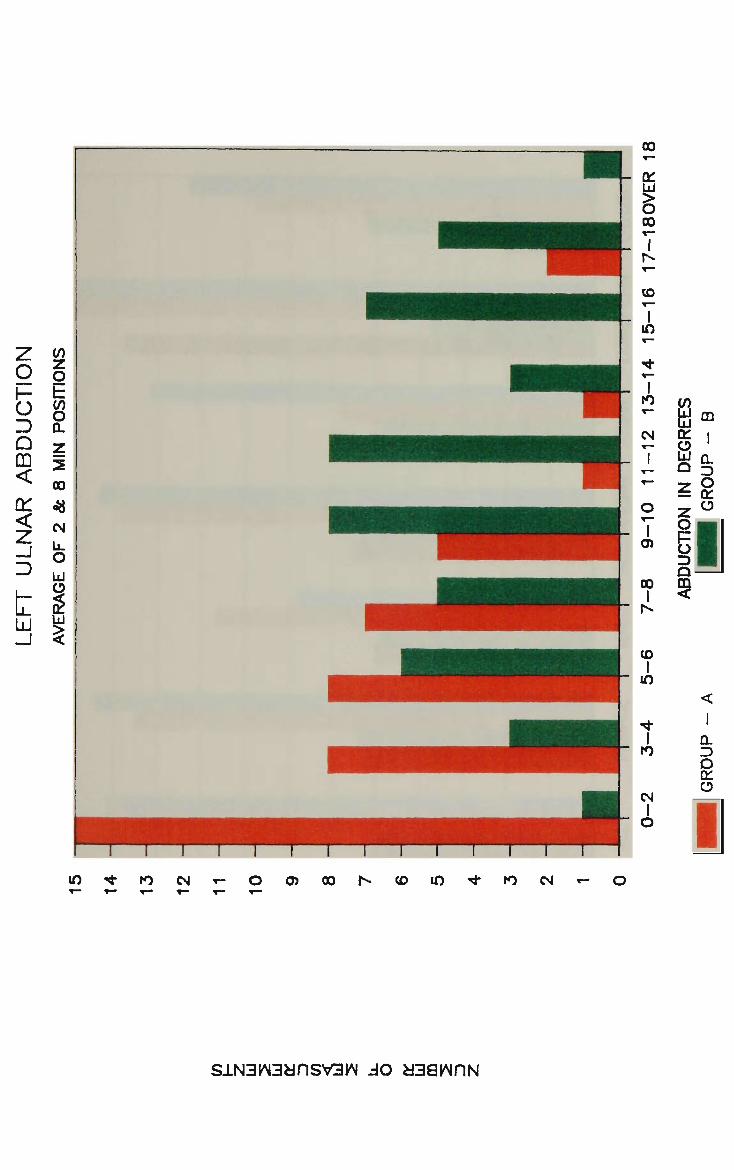
00
or
% 00
CO
I m
T to
CM
T
o
T OJ
00
I
CO
I in
I to
CM
I o
CO LU m LU "-1
^ I O '
Q 3
Z o = 01
Z° o g 3
I! 9
0. 3 D 01 CD
1 m to CM T- O) oo co in to CM
SAN3W3ansv3>N J O ysawnisi

CM T- O O O O N U D i n T j - t O C M
0. 0. 3 3 § 01
o o 5 2 CM CM
S33d03a NI Nononaav
Sc
i <
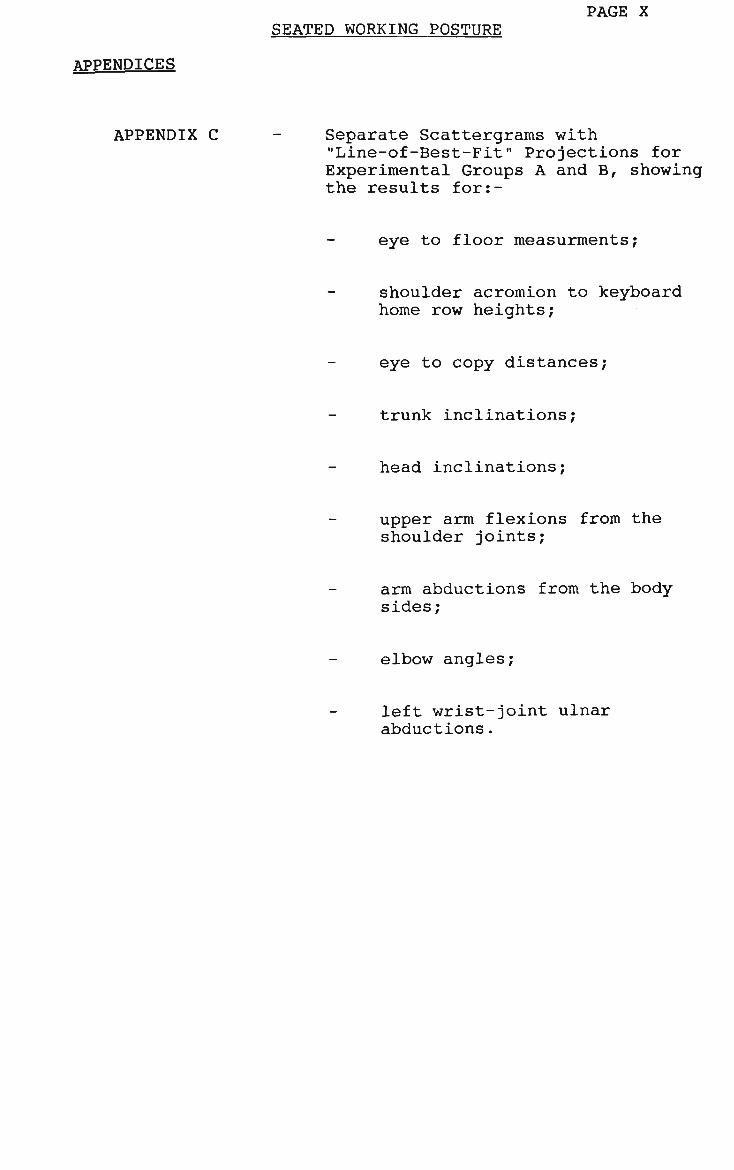
PAGE X SEATED WORKING POSTURE
Separate Scattergrams with "Line-of-Best-Fit" Projections for Experimental Groups A and B, showing the results for:-
eye to floor measurments;
shoulder acromion to keyboard home row heights;
eye to copy distances;
trunk inclinations;
head inclinations;
upper arm flexions from the shoulder joints;
arm abductions from the body sides;
elbow angles;
left wrist-joint ulnar abductions.

2 MIN AND 8 MIN POSITIONS GROUP - A
(GRAPHS)

r-
z LAI
2 LAI >
O 2 on o o _l L L \ IAI
<
1 Q. 3 O rr o i* Z LU 2 01 LU
CM
(WW) SNIH 9 IV 1H0I3H aOO"lJ/3A3
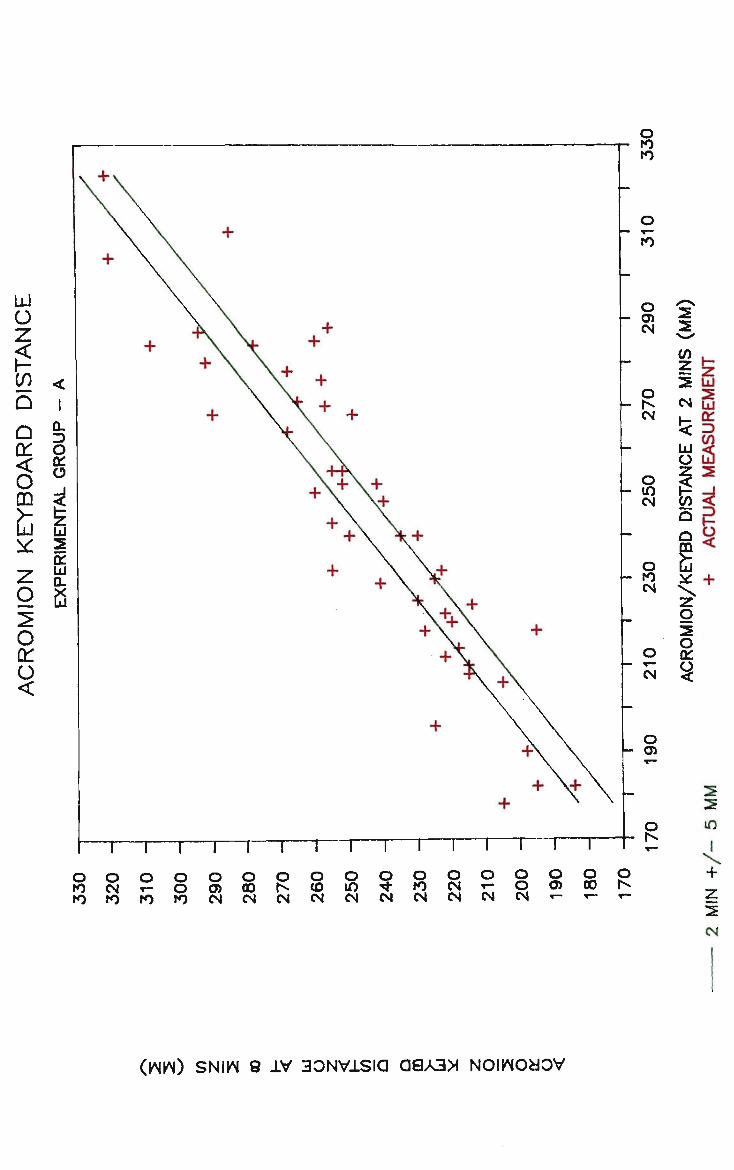
lAl
o z < r-{/)
Q
Q
on <
o CO £ *:
z o 2 o Q:
o <
<
i Q.
3 O 01
g LU 2 01 LU QL X LU
O to to
o CM to
O
to
O O IO
o 0) CM
O 00 CM
O Is-CM
O (0 CM
o m CM
o ««-CM
O to CM
o o o o o o CM «- O 0> 00 Is* CM CM CM r- t- •-
2
m I + z 2 CM
(WIN) SNW 8 XV 30NVXSIQ Q8A3>< NOIWOdOV
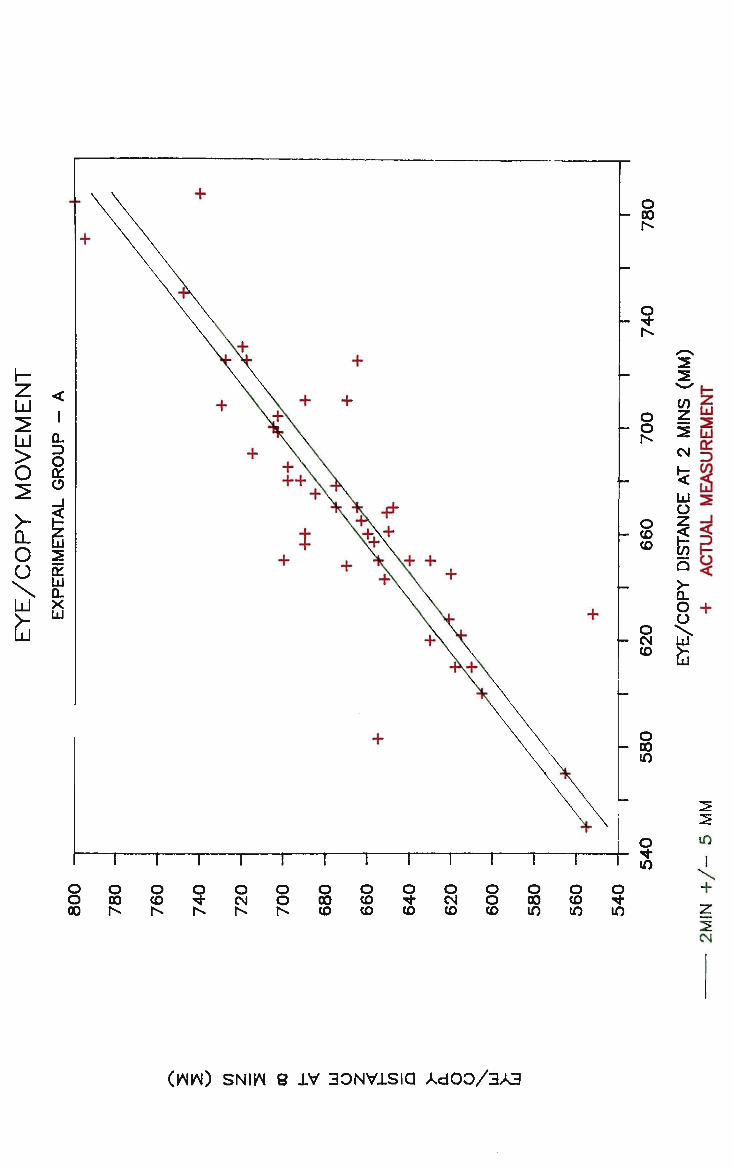
o o 00
o 00
o CO
o o CM
O O
o oo CO
o CO
co
o CO
o CM CO
o o CO
o 00 in
o CO
m
9 in
+ z 2 CM
(WW) SNIW 8 XV 30NVXSIQ AdOO/3A3
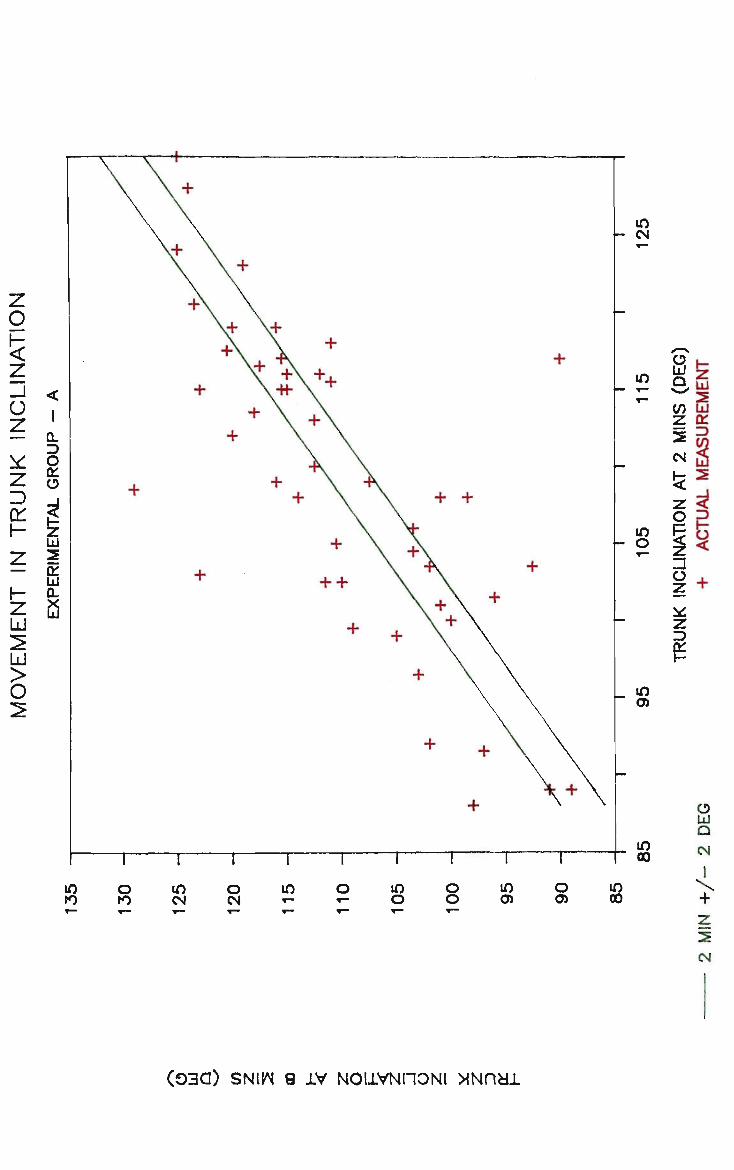
m to
o to
m CM
o CM
in m o
o o
m o
o o>
m oo
2 CN
(03C3) SNIW 9 XV N01XVNI10NI XNn&L
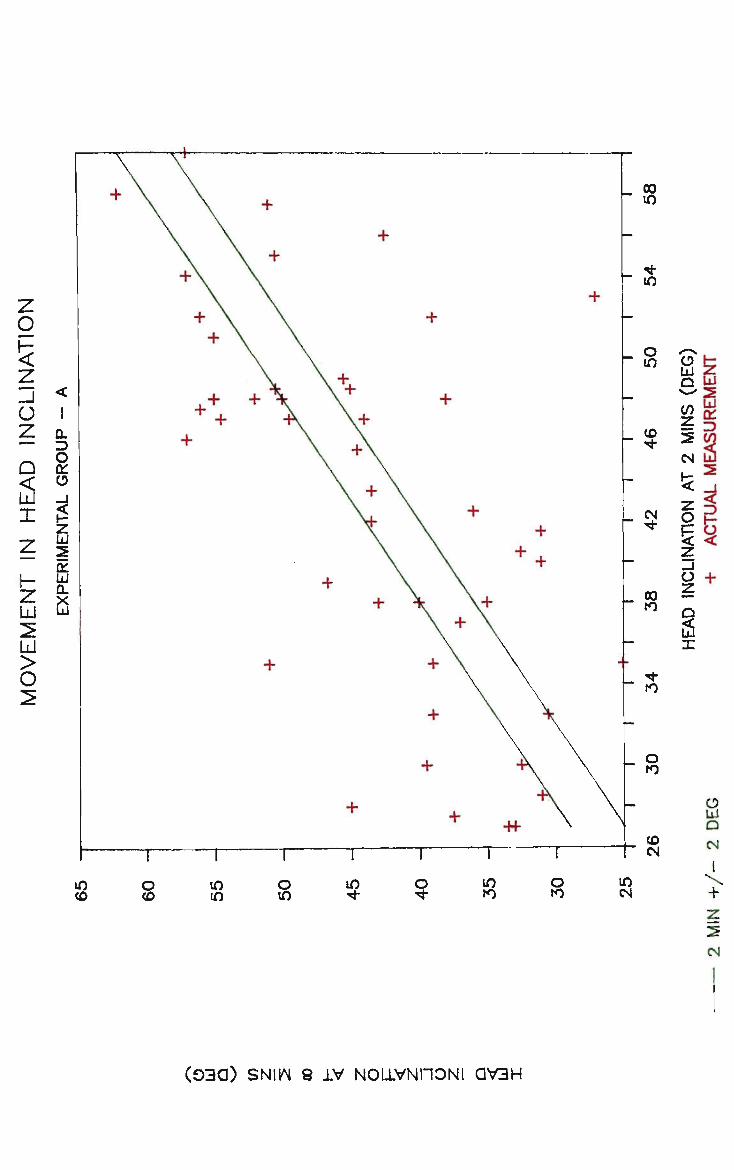
z o b <
z _J
o z "~"
Q
£ X
z H z UJ 2 LAI >
O
<
1 0. 3 O 01 o _l
s z LU 2 CU LU 0-
2
m CO
o CO
m m
o m
"2 o in to
o to
m CM +
z 2 CM
(030) SNIW 8 XV NOLLVtSinONI QV3H

m to
o to
m CM
o m CM «-
to
o o o
m o in
oo + Z 2 CN
(03Q) SNIW 8 XV NOIX31J WdV
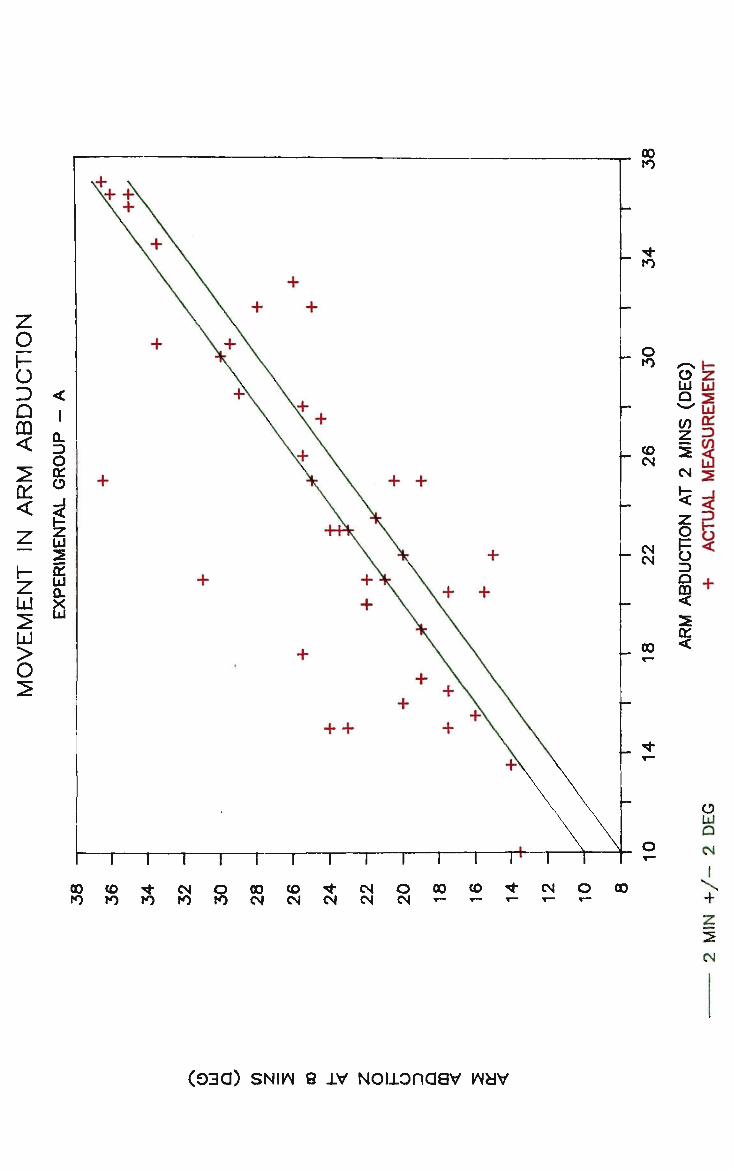
00
ro
to
o to
CO CM
CM CM
- oo
_ **
00 to
co 10
"* to
CM ro o to
00 CM
CO CM -+ CM
CM CM
O CM
OO CO CN 00
O Z LU LU w LU CO *
z
*=*
3 Q 4.
CU <
o LU
a CM
+ z 2 CN
(03a) SNIW 8 xv Noixonaav wav

m
o o
o 0)
o oo
s m o
o o
o t Q ^ N-* 2
LU
CO 2 3 CM §
3 LU
m o>
o 05
m oo
o oo
m o
O LU Q IN
I +
2 CM
(03Q) SNIW 8 XV 310NV M08"13
t
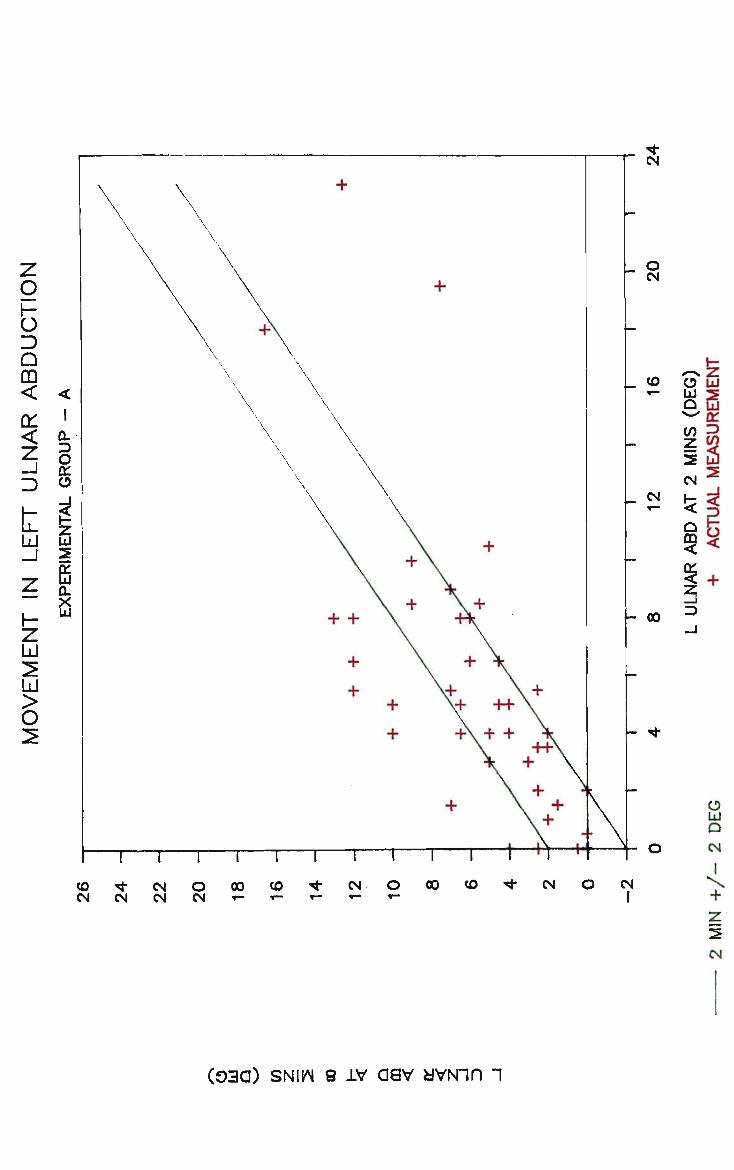
CM
O CM
_ <o
CM *
T- < D
- 00
- •«•
z 2 CM
(03d) SNIW 8 xv aav avNin "i

2 MIN AND 8 MIN POSITIONS GROUP - B
(GRAPHS)
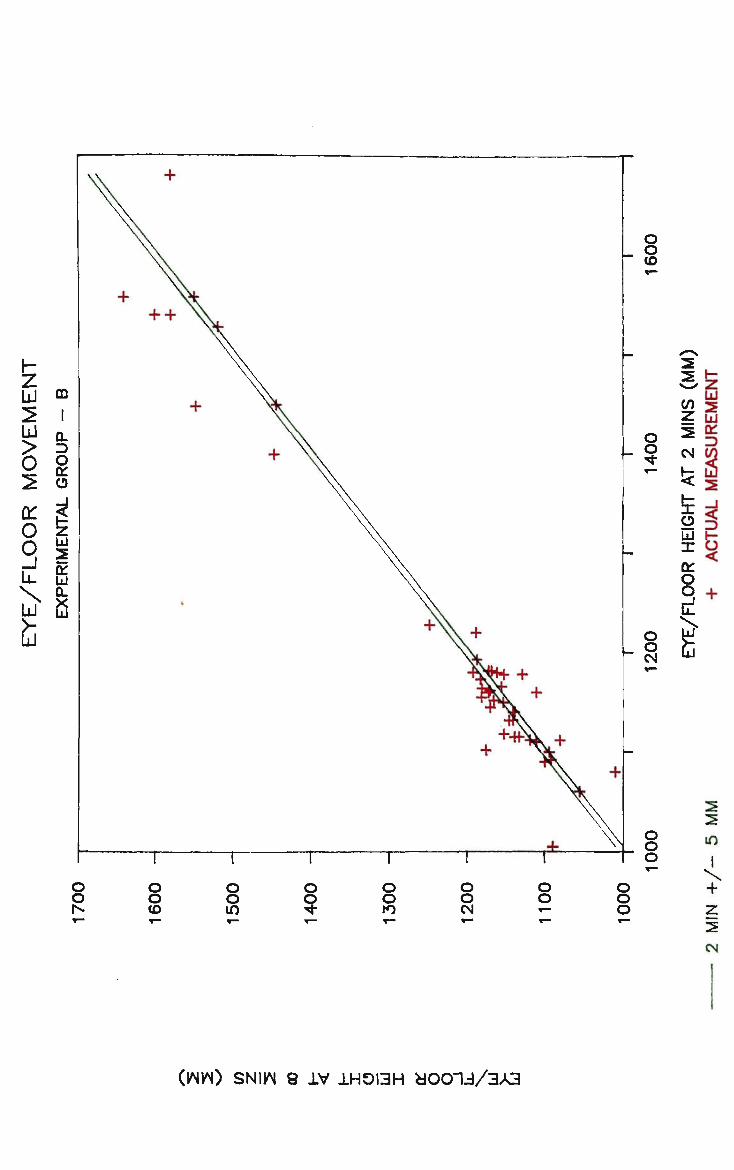
o o CO
o o
o o CM
O O o o
o O O CO
O O in
o o
o o to
o o CM
O O
o o o
+ z 2 CM
(WW) SNIW 8 XV XH0I3H d001J/3A3
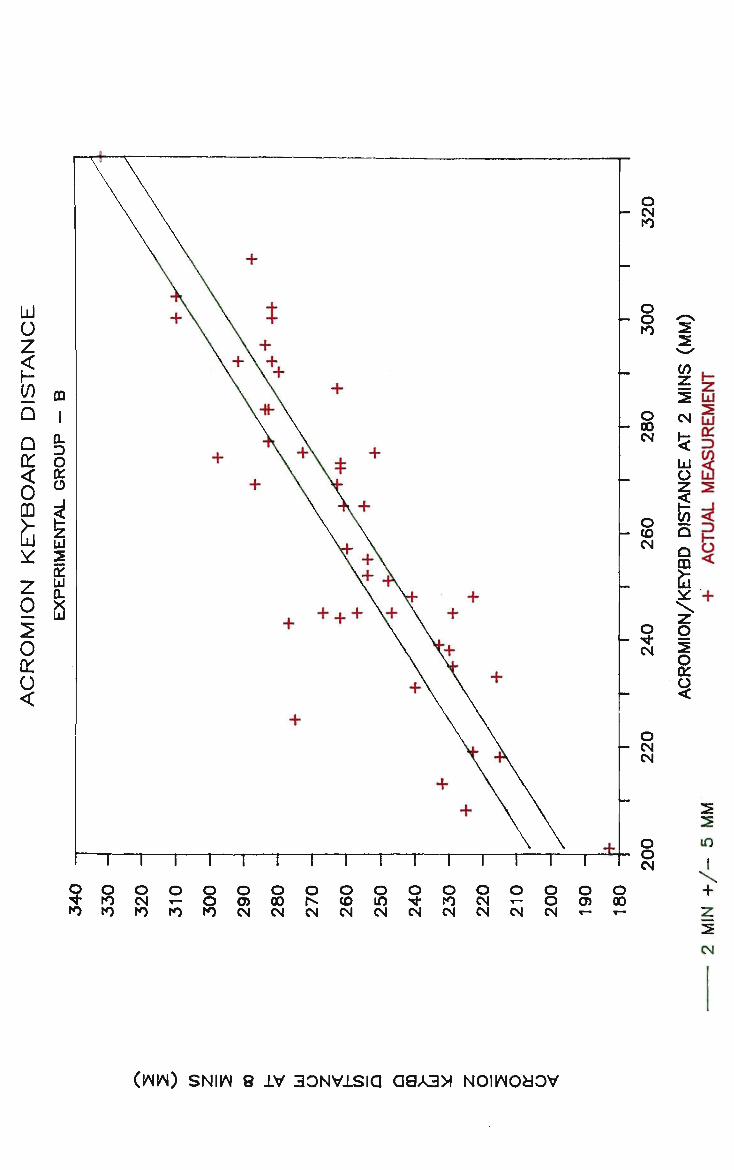
to o to to
o o CM -«-tO to
o o to
o 0) CM
O 00 CM
O
CM
O CO CM
O
m CM
9 CM
O to CM
O O CM -r-CM CM
O O O O O) 00 CM T- r-
2 CM
(WW) SNIW 8 XV 30NVXSIQ 0.3*3* NOIWOfclOV
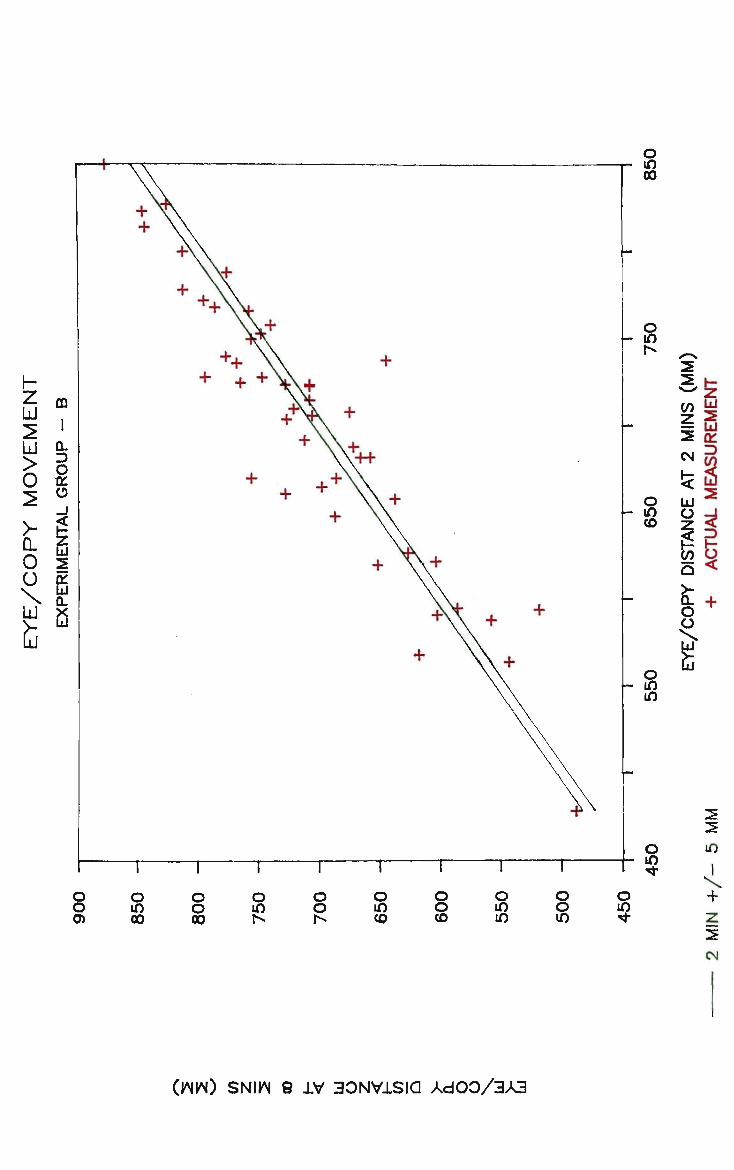
s oo
8 0)
o m
o m CO
8 m
o m
o m 00
o o oo
o in r
o m co
o o co
o m in
o o in
o m
+ z 2 CN
(WW) SNIW 8 XV 30NVXSIQ Ad00/3A3
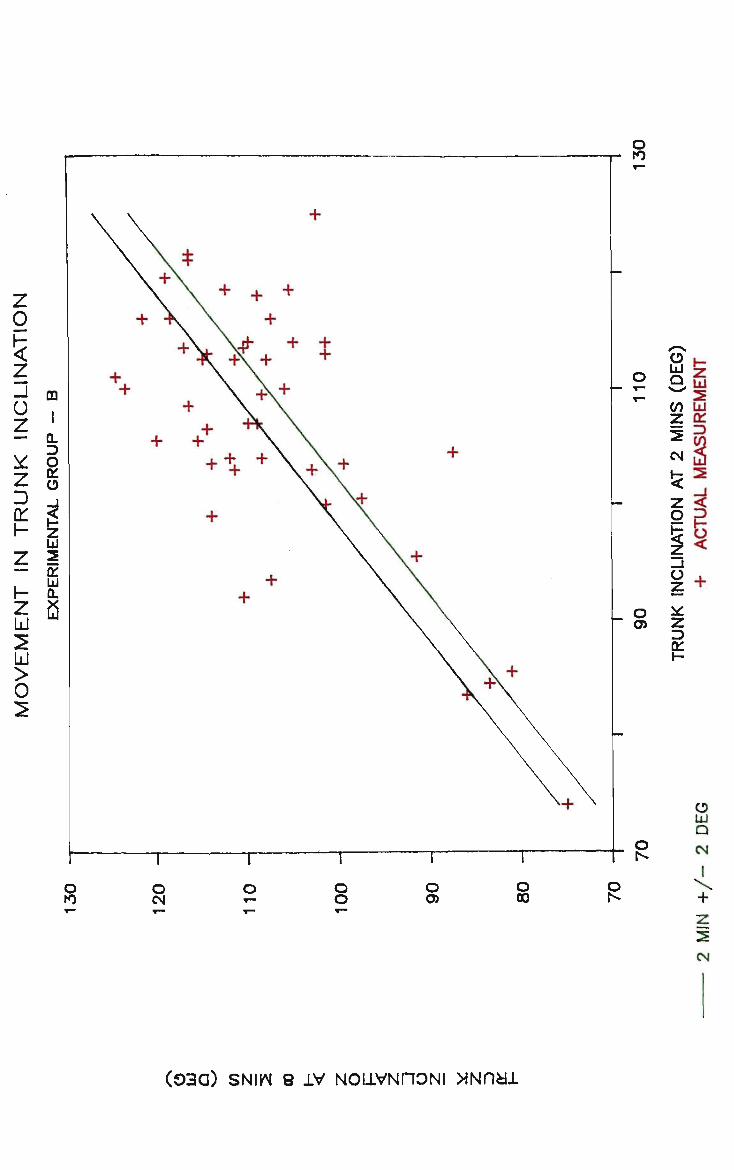
o to
o 0)
o
O to
o CM
O O
o o>
o 00
o + z 2 CM
(03G) SNIW 8 XV NOlXVNnONl NOHX
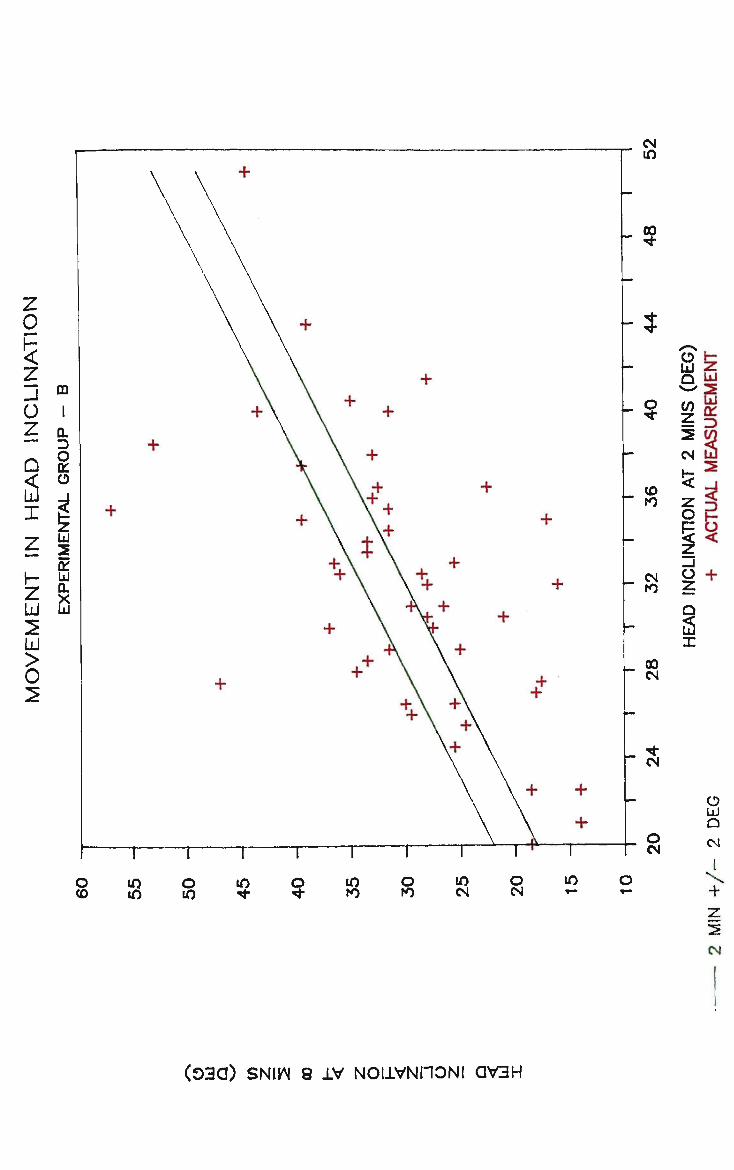
z 0 h <
z -J 0 z —
Q
2 I
z h-z 111 2 bJ > 0
m I 0. 3 O o
1 u 2 01 LU 0. X LU
o CO
m in
o m
m 9 to o to
in CM
o CM
m + z 2 CM
(030) SNIW 8 XV NOIXVNI10NI QV3H

in CM
m
m o
m 0)
S5 LU LU Q 2 *~s LU CO *
z ^ 2 <tj CM 2
5*
EXION
ACTU
* +
2 01 <
in
oo
C5 LU Q CM
+
CM
(03Q) SNIW 8 XV NOIX31J WdV
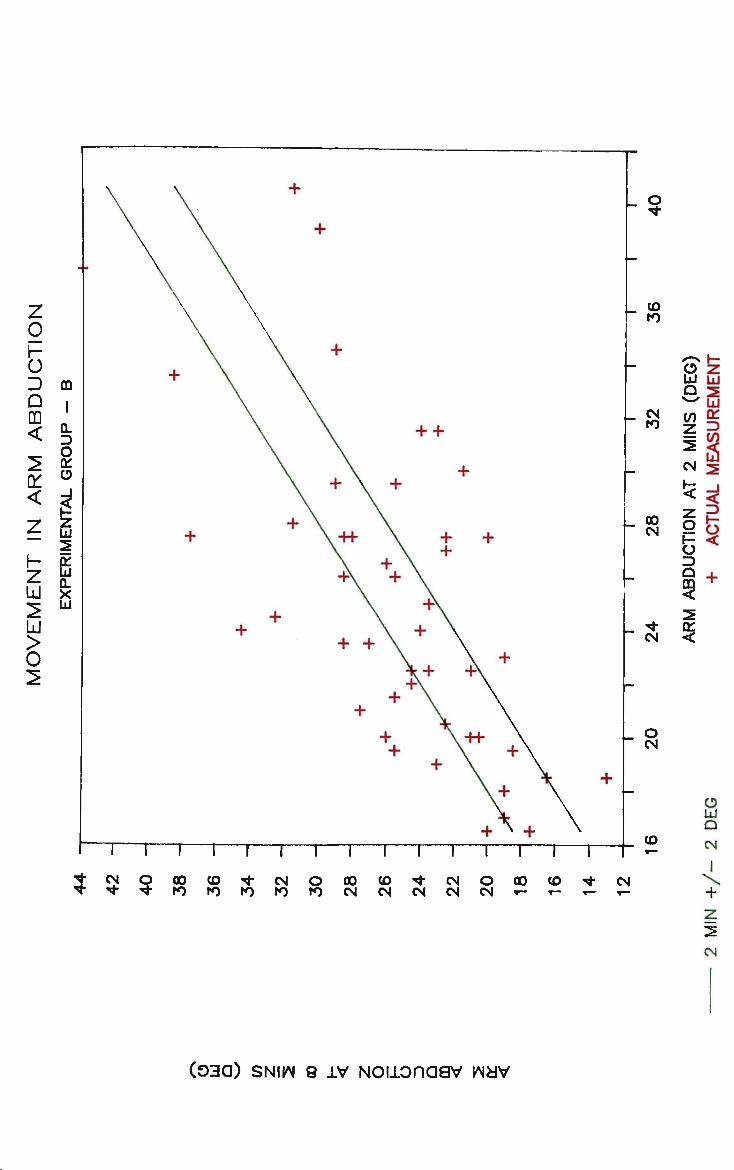
_ o
CO to
CM to
00 CM
CM
O CM
CO
* C M O O O C O ^ C M O O O C O ^ C M O O O C O ^ C M ^ • ^ l O t O t O f O I O C M C M C M C M C M r - ^ - ^ ^ -
2 CM
(03a) SNIW 8 xv Noixonaav wav

m CM
m
in
o
m en
oo
m
o to
o CM
O O
O 0>
O 00
o + z 2 CN
(03CJ) SNIW 8 XV 310NV M0B13
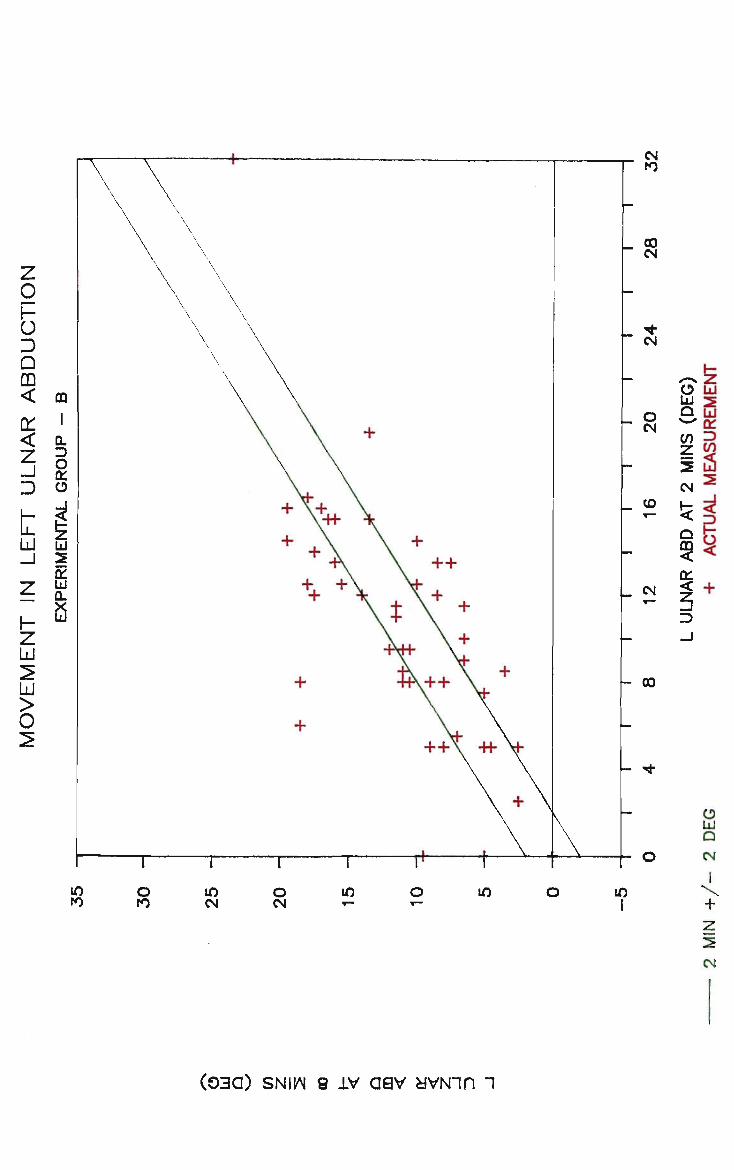
+ z CM
(03a) SNIW e xv aav avNin i

PAGE XI SEATED WORKING POSTURE
D - Separate Relationship Graphs from Experimental Groups A and B Including "Line fo Best Fit" Projections, showing the results for:-
eye to floor measurements;
shoulder acromion to keyboard home row heights;
eye to copy distances;
projected separately each against the angular measurements for:-
trunk inclinations;
head inclinations;
upper arm flexions from the shoulder joints;
arm abductions from the body sides;
elbow angles;
left wrist-joint ulnar abductions.

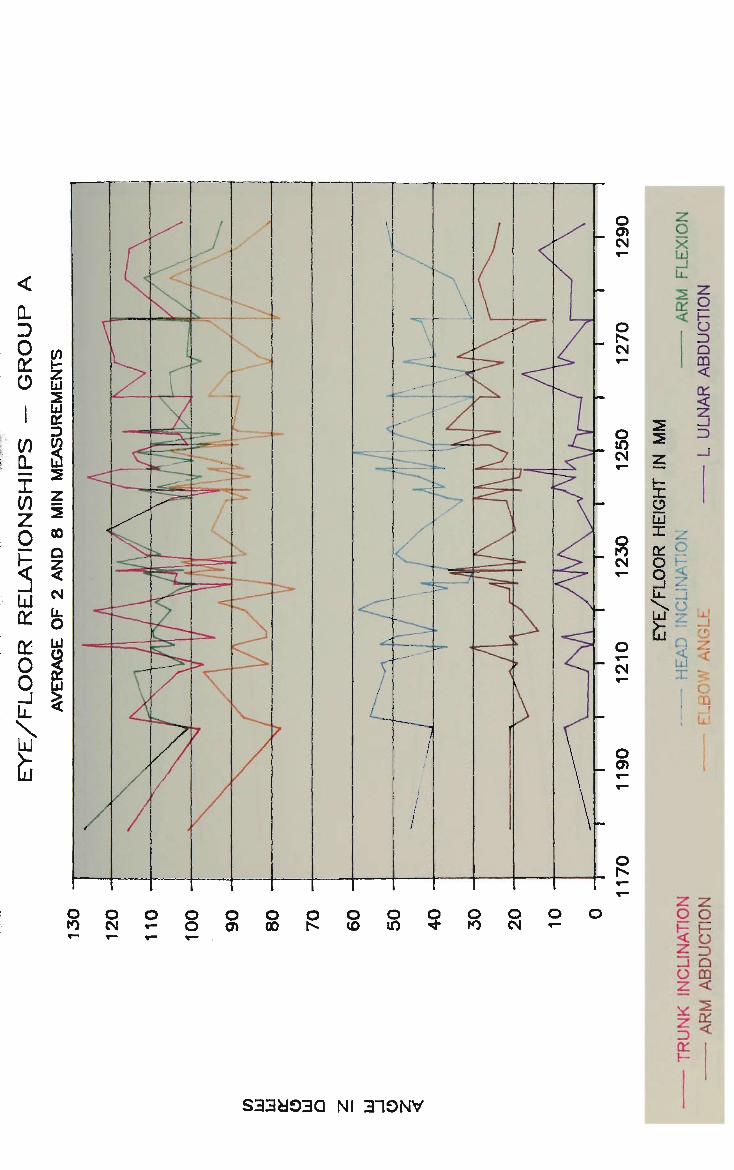
o CM
o Is* CM
o m CM
o to CM
o CM
O 0)
O Is-
g x LU
01 < CJ
3 Q DQ < 01 <
z
t-X LU
01 °
o o V. LU •
Q
LU
a < CD
LU
o o o o o o o •0 CM «- O O) 00 h»
O O Q O O O co m xF to CM «- < o
2 3 .J Q O CD Z < z 3 01
S33d03Q Nl 310NV
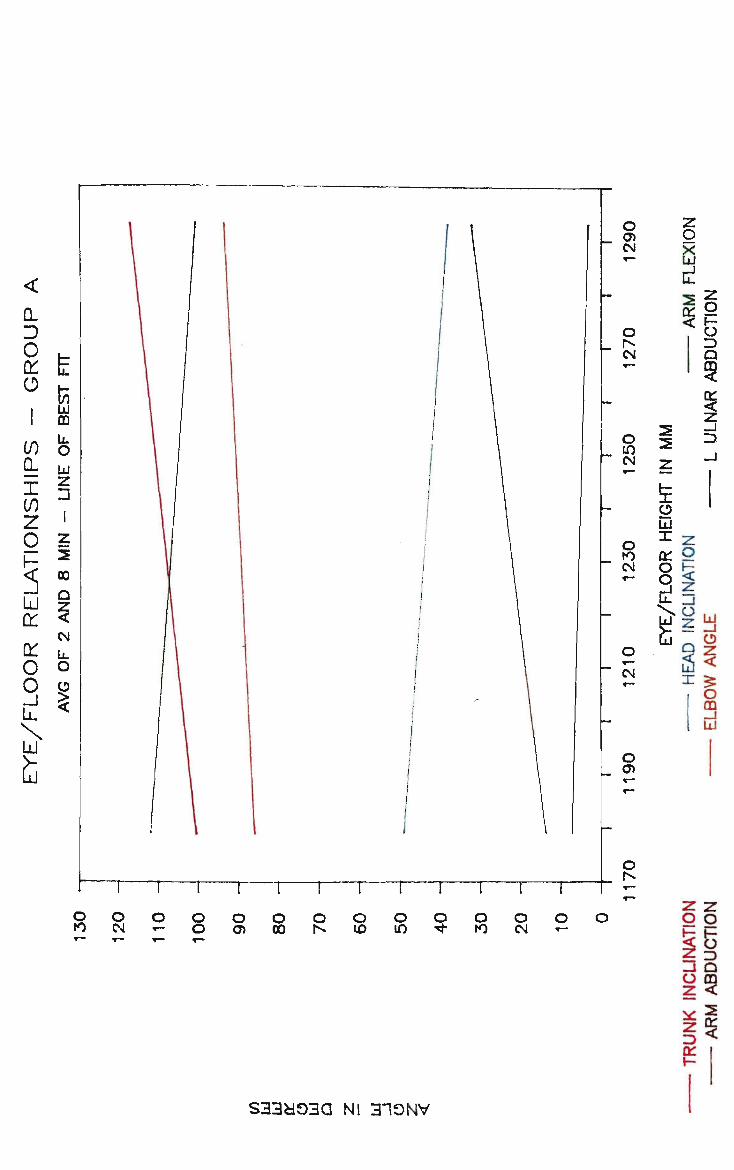
D 0
O i
if) 0. I If) z o h-
5 LU a: on 0 0 lA
X LU
LT
to LU m o LU z
!
Z 2 CD Q
z <
CN Ii. O ^
$
o to
o O) CM
o CM
o to CM
o CM
o 01
o
o CM o t— o o
o 0) o 00 o N
o CO o m
g * o to
o CM
z o X LU
is <c3 3 Q 3 I
m ** *! z
o LU = Z
01 9 O h: Q 3 £§y
o CD _ J LU
z z o o
gg JE 3 _i a
|9 ^ 01
i< 01
S33a03Q Nl 310NV
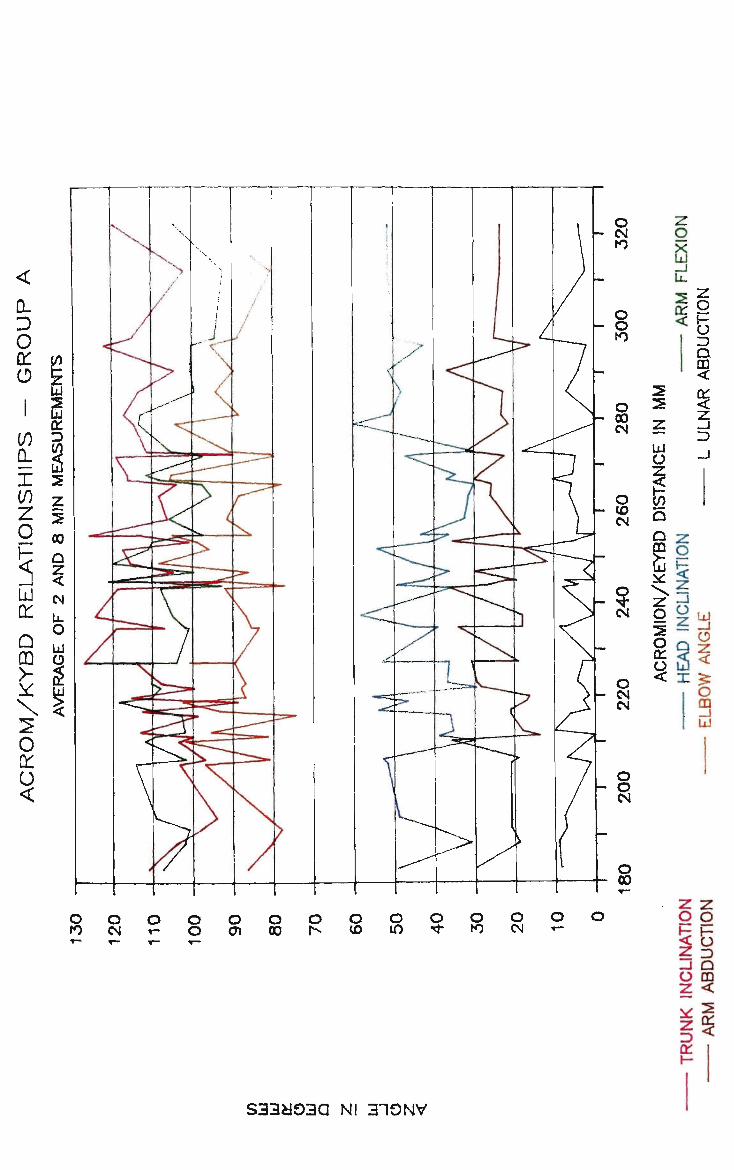
o to
o CM
O O v O
o 0)
o 00
o o CO
o m
o o to
o o CM r-
2 2
LU
o
a a m
2
< &
3 Q
3 01
<
z -J 3
Z
z -1 O ^ UJ 5 — -J
< X £
o CD _J LU
z z o o
g5 ib 3 -I Q O CD Z <
id
z 3 01 I-
3
S33a03d Nl 310NV
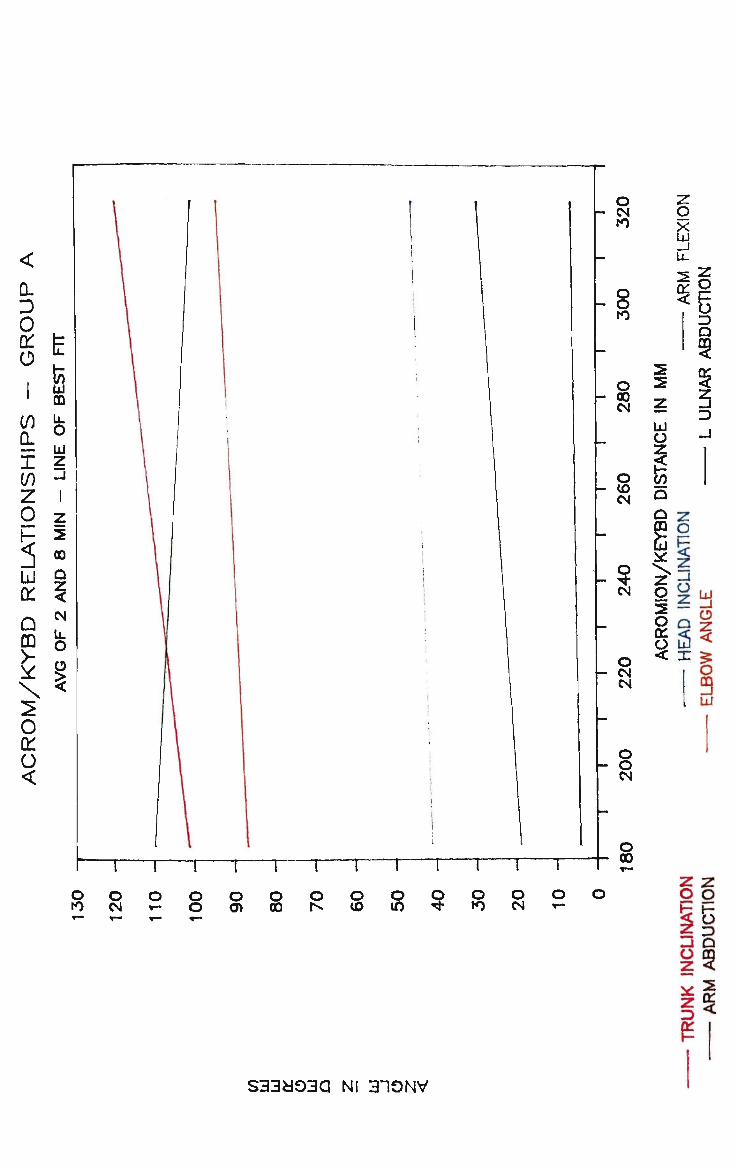
8
O h CM
to
O h O
IO
O h 00
CM
O CO CM
9 CM
O CM CM
8 o i—r T — r o o
o 0>
o oo
R Q CO
i — r
8 9 o to
o CM
T o
CM
o 00
z o X
y u_ 2 z 3
Q
3 2 2
LU O
3
-J
5
P g
z g 2 O 01
a
o z Q
5 X
LU _l
O
z <
o CO LU
z o
Al O
z 3
Z g h-
O 3 O
9 2
3 S33a03d Nl 310NV

o 00 Is-
o
s
o CM CO
O 00
m
9 m
o 10
o CM
o o o
o en
o 00
o N
o CO
O m
o * •
o to
o CM
X LU
or <
2 O 2
LU O
g o 3 Q CD < Ct < Z -J 3
to O Q CO £ O
o
z g fe
z _ i
o LU
a
z g fe
z
LU
Q Z <
3: 5
o CD _J LU
Z
g 3 Q
O CD
z < z 3 01
01 <
533*030 Nl 310NV
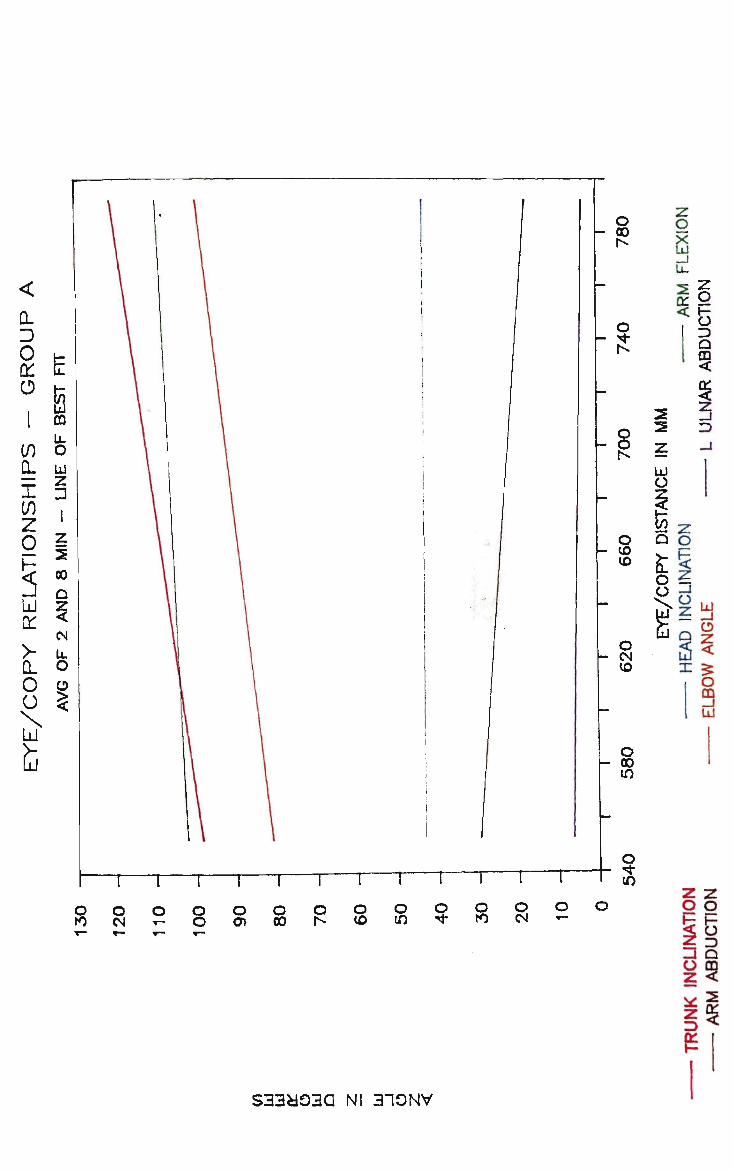
D 0
on o l CO CL •— X in z 0 h-5 LU
> •
Q_ 0 0 \ LU
E B DO U-O LU 7 n i i
z >
00 Q
I CM U. 0 o $
fc
o to
o CM O - o
o o 0>
O CO o
Is-o CO o
in
n o z z 3
Q
3 2
9
S33M03Q Nl 310NV
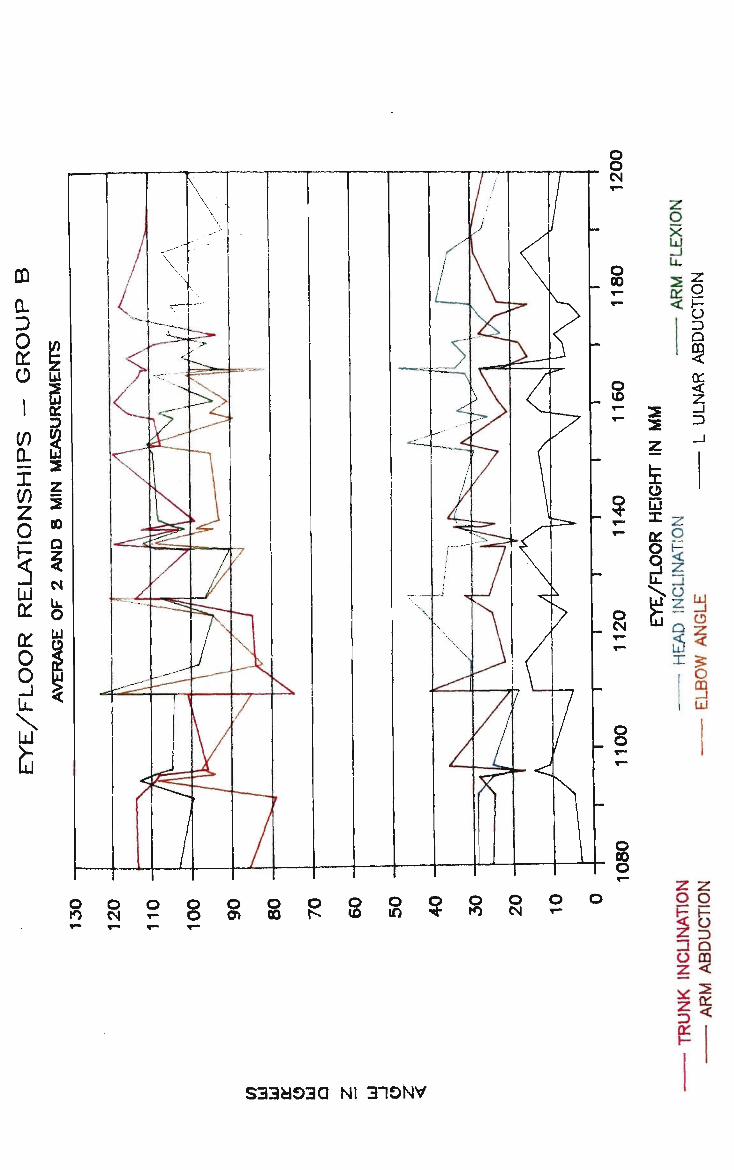
z§ 3 <' 01 \-
S33d03a Nl 31GNV
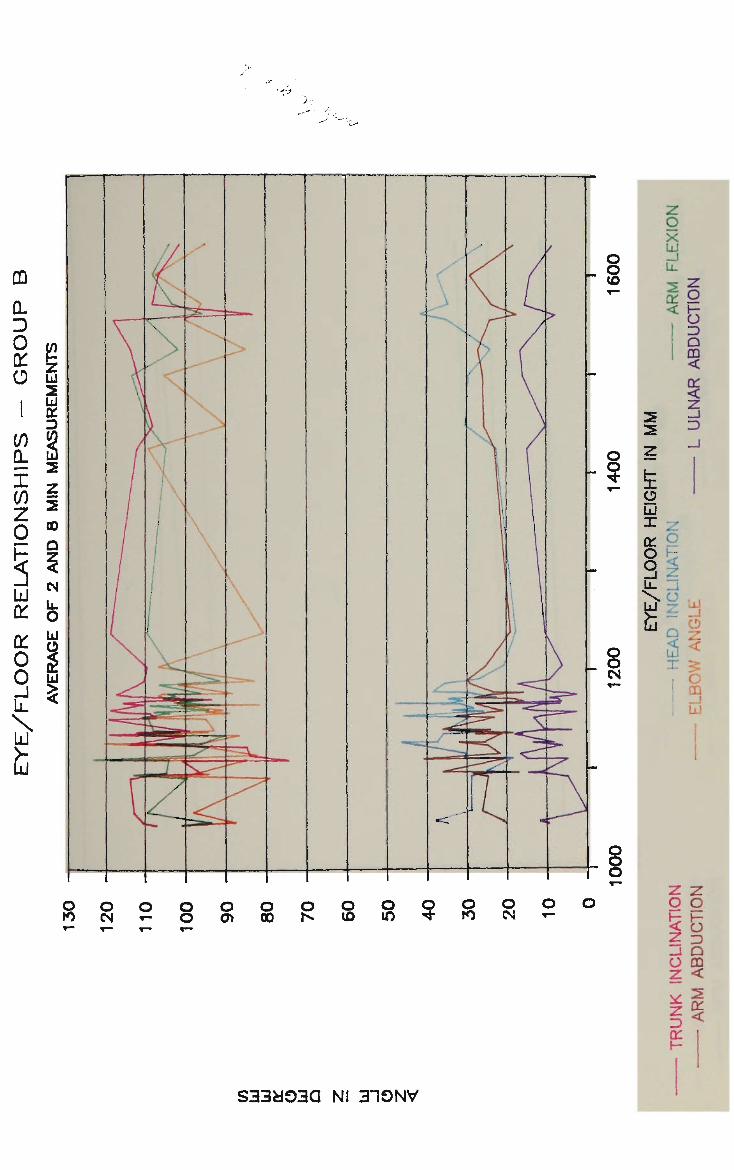
2 o »0 CM
o o
o 0>
o 00
o O CO
o m
§ o to
o o CM r-
S33a03d Nl 310NV
o o CO
O
?
o o CM r—
o o o T~
2 2 Z
fe O LU X 01 o 3 u. s g
z o X LU _) L_
is < H: . O ^ Q CD <
01 < z 3 _l
Z o H <
Z _j
o . .
D IN
NGLE
$ < x 5
CO Li J
UNK INCLINATION
ARM ABDUCTION
01 h

m CL D 0 Q :
o i !
if) CL X in z o h-
S LU £
a: o 0 L A
X LU
L_
E t; LU CD Li.
O LU Z l
1 z 2 CO
n z <
CM Lu o ^
$
o to
o CM
i — i — i — i — i — r i — r o o
o o (O
o o
o o CM
o o o o
0) o 00
o o CO
o in
? o to
o CM
_l
u. 2 z
oip
<6 3 Q CD <
01 <
z
2 z fe
S LU =»= Z
01 S
P Q
iS X
UJ -J
z <
o CD _J LU
Z
o
o
z o F o 3 Q
S33d03Q NI 310NV
z 3 01 H
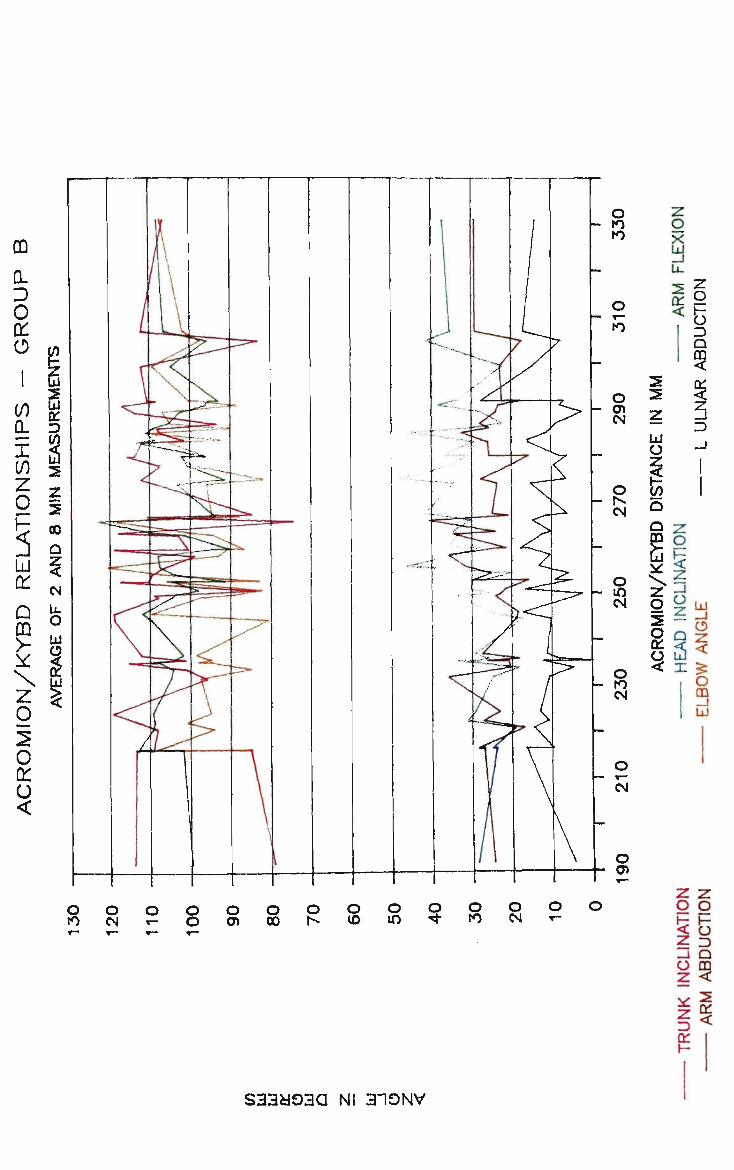
o o tO CM
O O 00
O O CO
O Q O O m ^ to CM
g o «£ 3 _i Q O CD
fe
Z 3 01 H
<
S33«03Q Nl 310NV
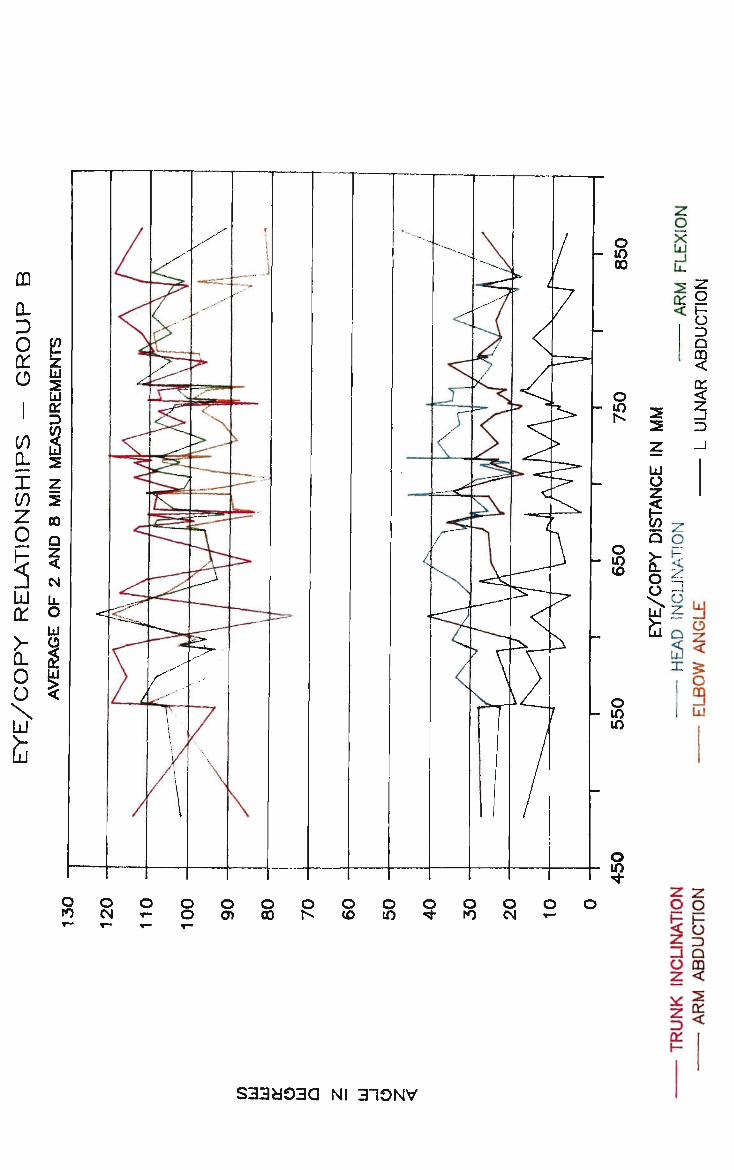
01 3 01 h-
S33d03Q Nl 310NV
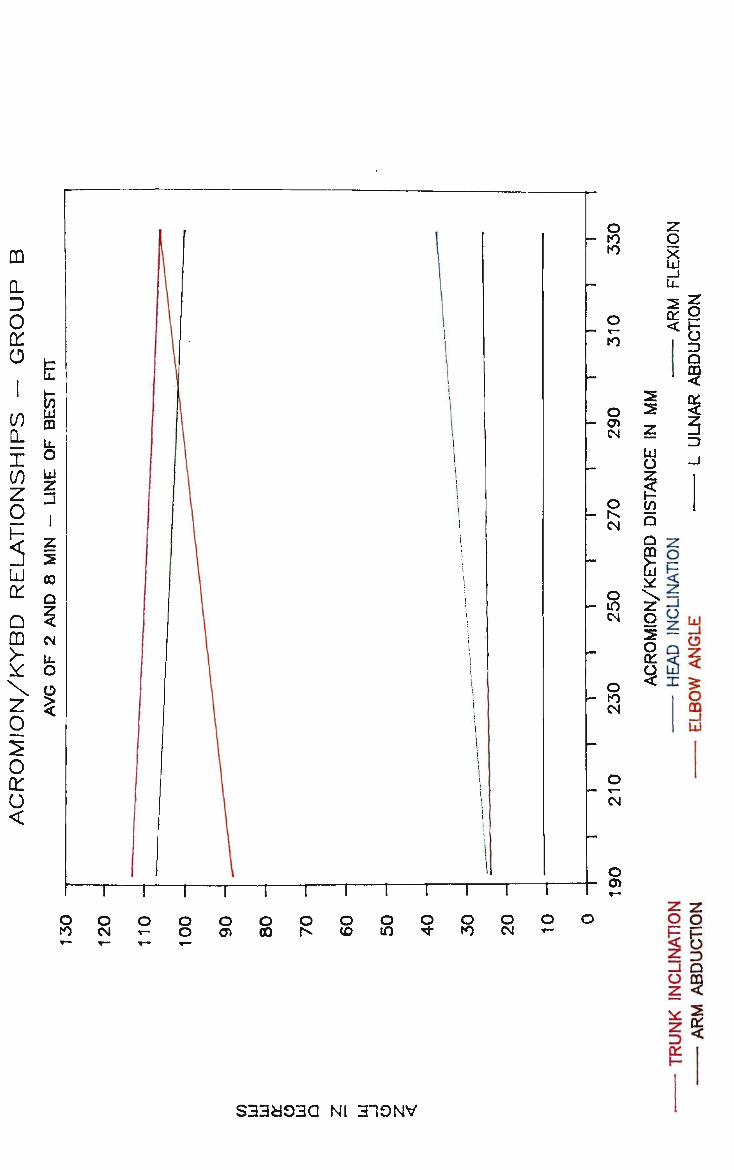
1
CO Q. I CO
z 0 1-5 LU on G DQ > ^
X z
s LU
m A o LU
Z n i
z 2 OO Q
z < CM IJ
0 g £
o h to
to
o to
i—r T — r
o 01 CM
o CM
O 10 CM
O to CM
o T-
CM
O 0)
o to
o CM
o o
o en
o 00
o Is*
o co
o in
o <*
o to
o CM
S^LU
g Z g
£ 3 -l Q O CD Z < z 3 Ql
2
9
S33803Q Nl 313NV

m 0. D en u-LU
A
5: £ X 3 CO i 0
s LU £
>-
0. 0 o X LU
z 2 OO
G
z < CM A O
s *
3 01
9
S33M33Q Ni 310NV

PAGE XII SEATED WORKING POSTURE
|DTft(ftTrtCES
APPENDIX E - Separate Relationship Graphs for Experimental Groups A and B Including "Line of Best Fit" Projects Showing the Results for Subject Stature Compared Against Angular Measurements for:-
trunk inclinations;
head inclinations;
arm flexions;
elbow angles.

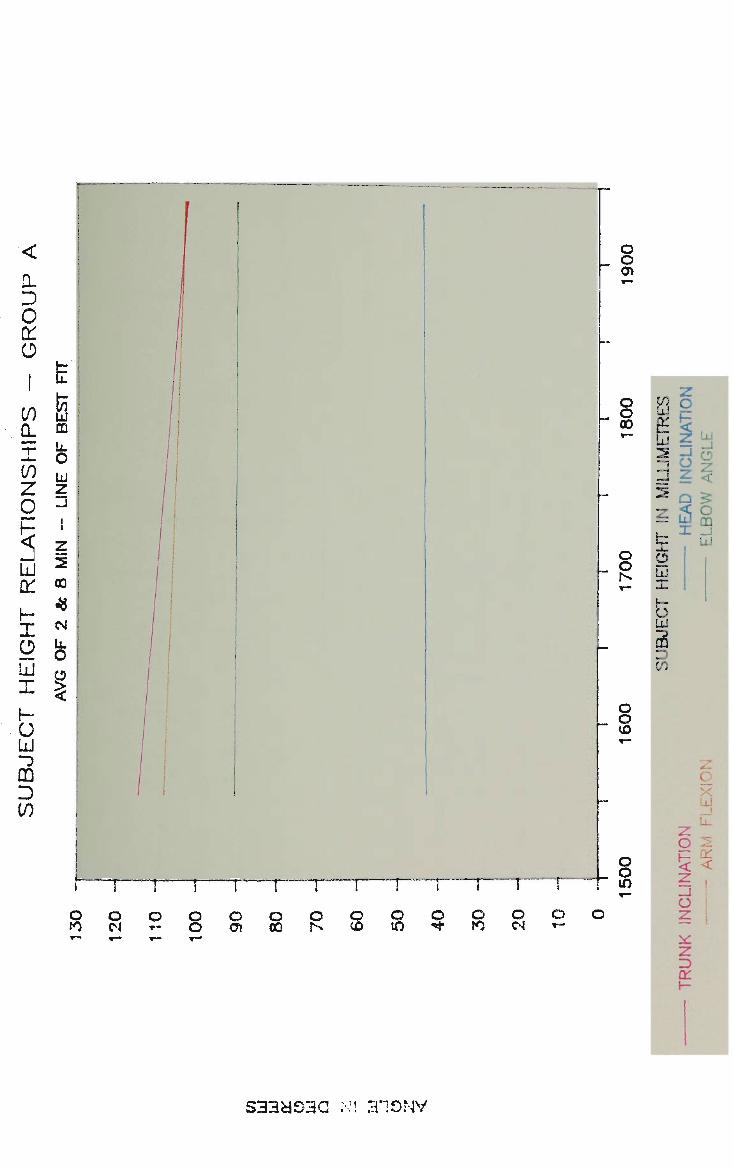
2 -J
3
5 fi
LU _J O
z <
O . QD X _J
UJ
O LU X
LU
a :/
v.
x
z g z _ i
o z 3 CU
CU <
saaaoaa :M 310W
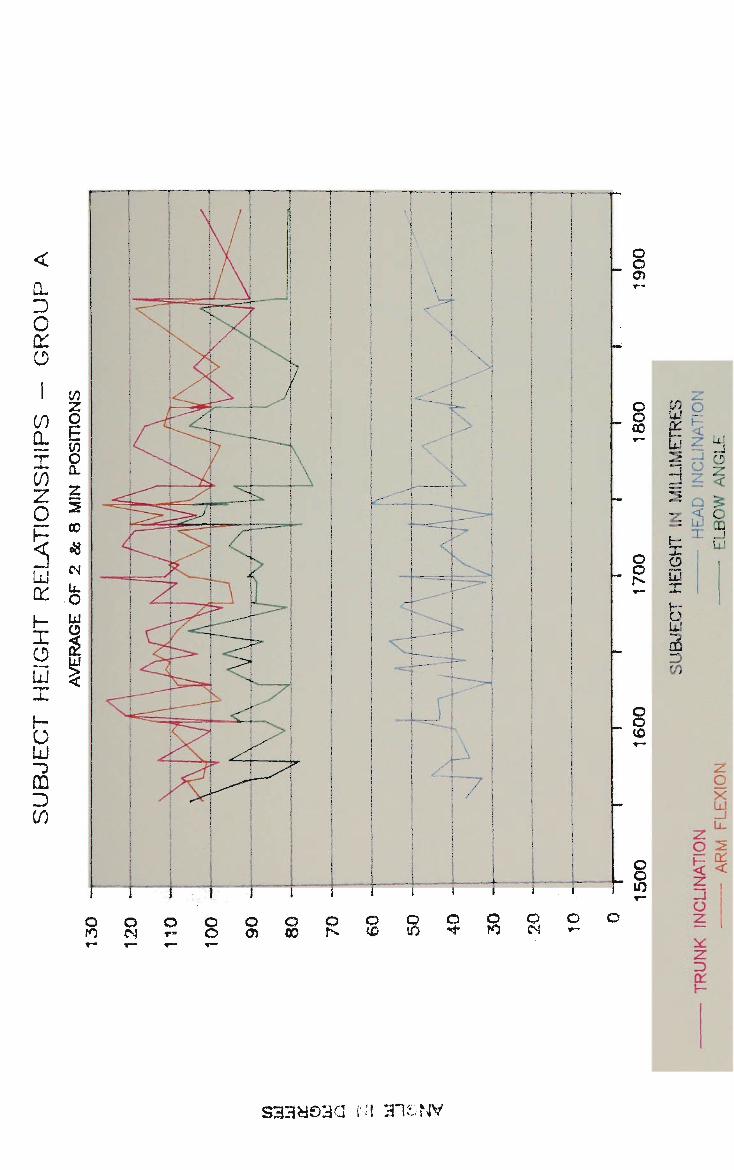
o ro
O CM
O Tw
o o
o en
o 00
o N
© «0
O Ui o o
to o CM
3 01
s33«oaa ru HI&NV
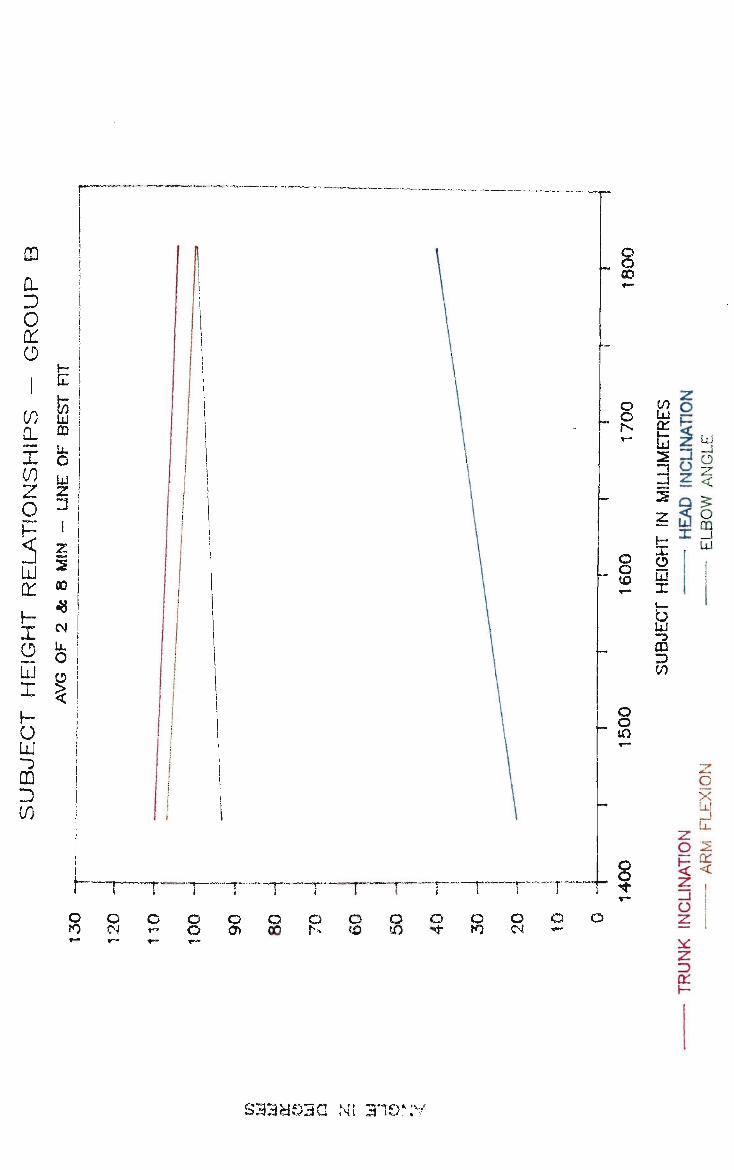
a. D O
a: a
x CO
z g
o LU
m D CO
A
if) s CL m |
O |
LU
on B
h- * X CD X
LI j
z I 13 i
z 2
CM A O
5 <
o to
o o 00
I — r o CM
o o o
T'"~T
o o>
o 00
[
o © «0
o to
T~~~T
o to
o <N
o
O CO 5 LU
2
=d 2
Z
8 i tO AJ
£- X U
LU -3 CD 3 CO O
O in
o o *
z o n o z a iS
UJ -J
o z < «=:
o en _J LU
g fe
X LJJ
_J A
01 <
o z itl
z 3 01
S 3 3 & S 3 G Nl 3"!£>r;v

DQ
CL D
O on o V)
a. if)
z o LU
X
o LU X
b LU CD
n CM *- 8 § o 8 0 o © o % % OJ ^
© © o z z 01 I-
533*930 Nl 310NV
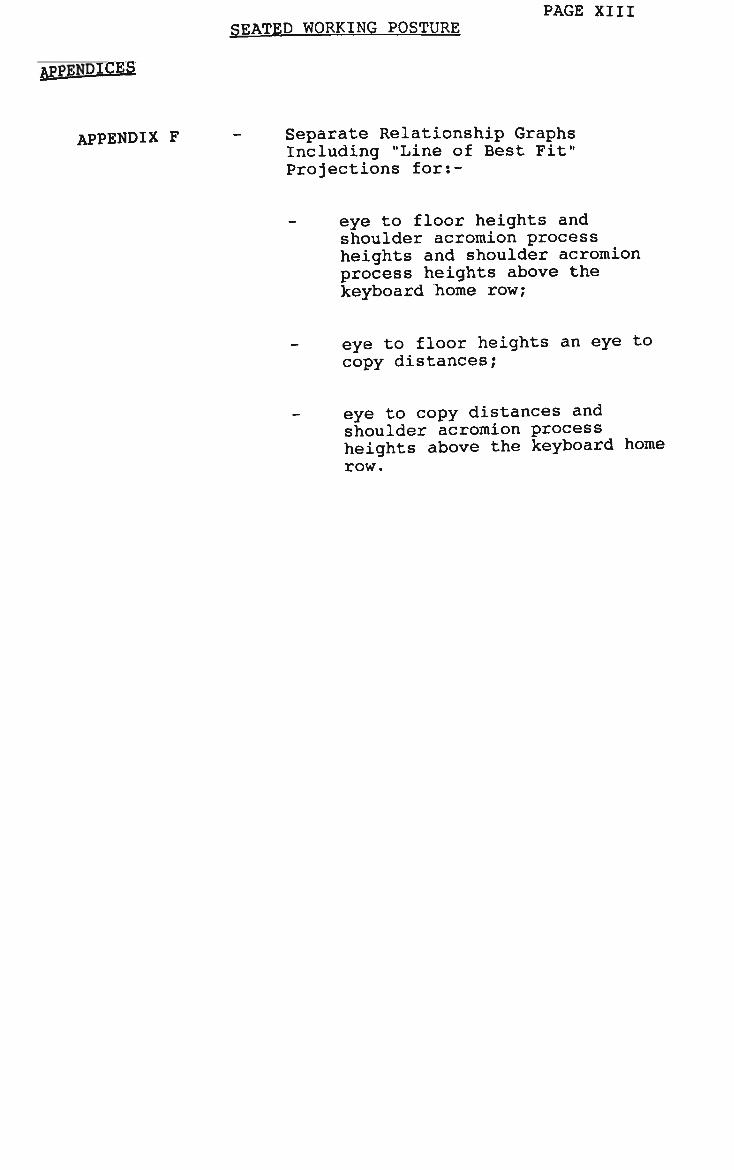
PAGE XIII ciEATED WORKING POSTURE
Separate Relationship Graphs Including "Line of Best Fit" Projections for:-
eye to floor heights and shoulder acromion process heights and shoulder acromion process heights above the keyboard home row;
eye to floor heights an eye to copy distances;
eye to copy distances and shoulder acromion process heights above the keyboard home row.

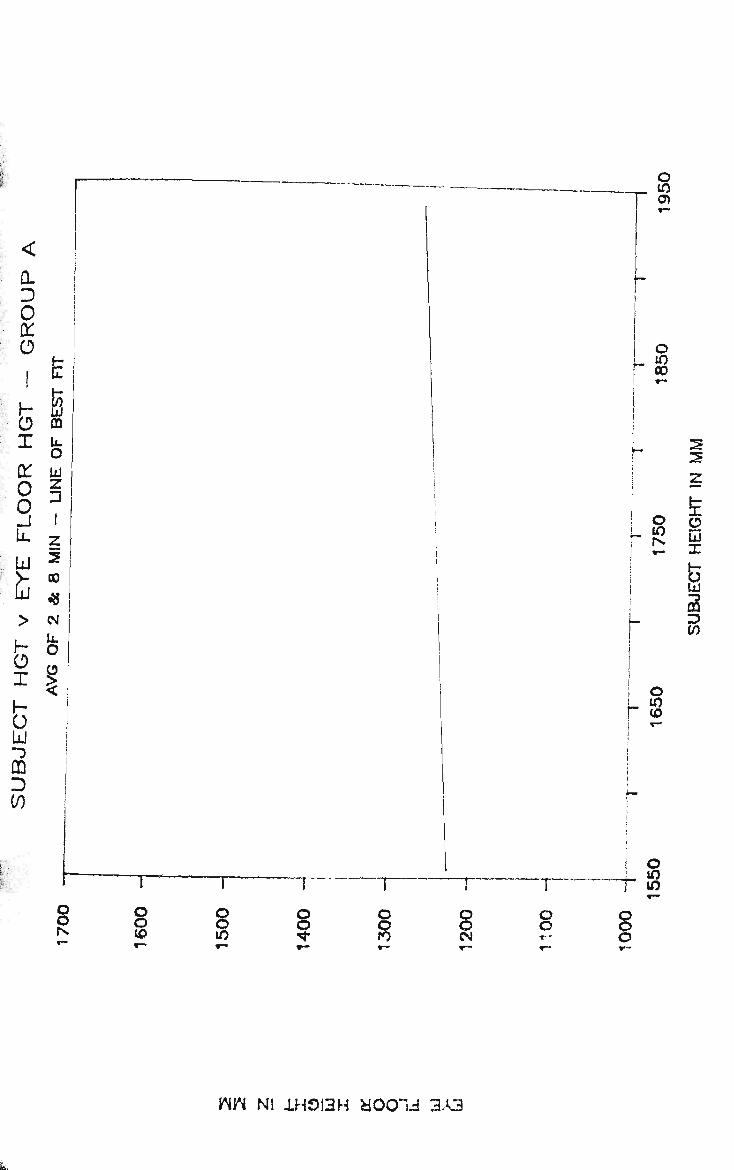
Q. D O
on o r~ hi
O CO x fe
on UJ
o § 0 ,
U. LU
z 2 00
CM
j~ 0 X u. 0 LU "3
m D CO
A o 1 <
o O)
© 10 00
^ 1
!
i I i * - •
i
j
h i i i
i r
o
o CO
2
z
fe e> LU X
g 3 CO
o o N
o o CO
T
o o m
o
?
T
o o to
— j - »o w
o o CN
© ©
o o o
h.
nn NS 1H0I3H a o o u 3-A3

<
a. D 0 on 0
! •
h-0 X
on 0 0 LL
LU fc
>
r-0 X h 0 LU "3 CD D W
w z o E to o a. z 2 CO 3 CM It 0 LU O i £ 5C
s CO
o o m
o o
8 to
o o CM
o o
o o ©
WW Nl 1H0I3H HOOId 3A3
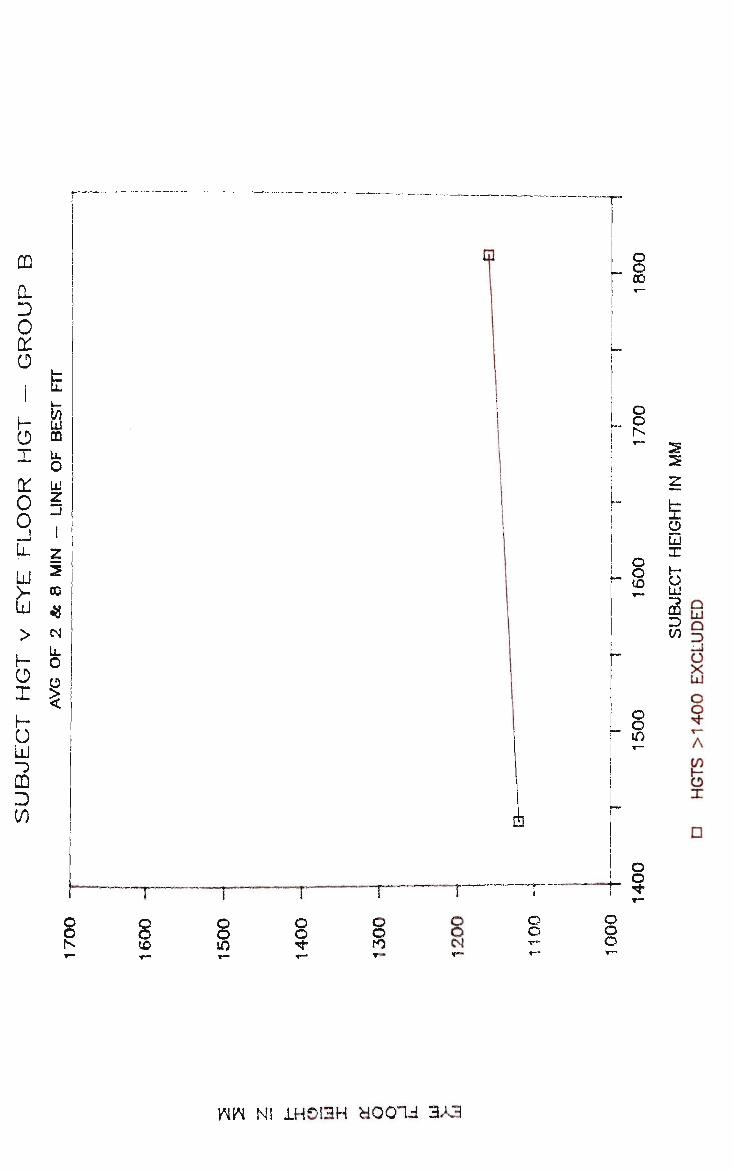
o - o
00
2 2
o o to
o o m
o A
x A CD LJ
w 3 -J
O X A
O O M"
A O X
""T~ T o
o o CO
o o m
o
9 to o o CN
o o
o o o
D
Vm NI 1H0I3H HQQId 3XB

0. D O on o H CD X
on o o LA
O X h-
o LU "3
CD =5 00
2 2
fe
s LU X
H CD 3 CO
O O
o o CO
o o m
o o to
o o CM
o o
o o o
WW Nl 1H913H dOOId 3A3

o 0) CM
o Is-CM *•"
o m CM « - •
o to CM T-"
o V"
CM
2 2 Z
A O 5 fc5 n 01 o o _J A
g
o Oi
o
o o 0)
00 o o Is-
o o CO
o o m
o o
o o to
o o CM
WW N! 30NV1SIQ AdOO 3A3
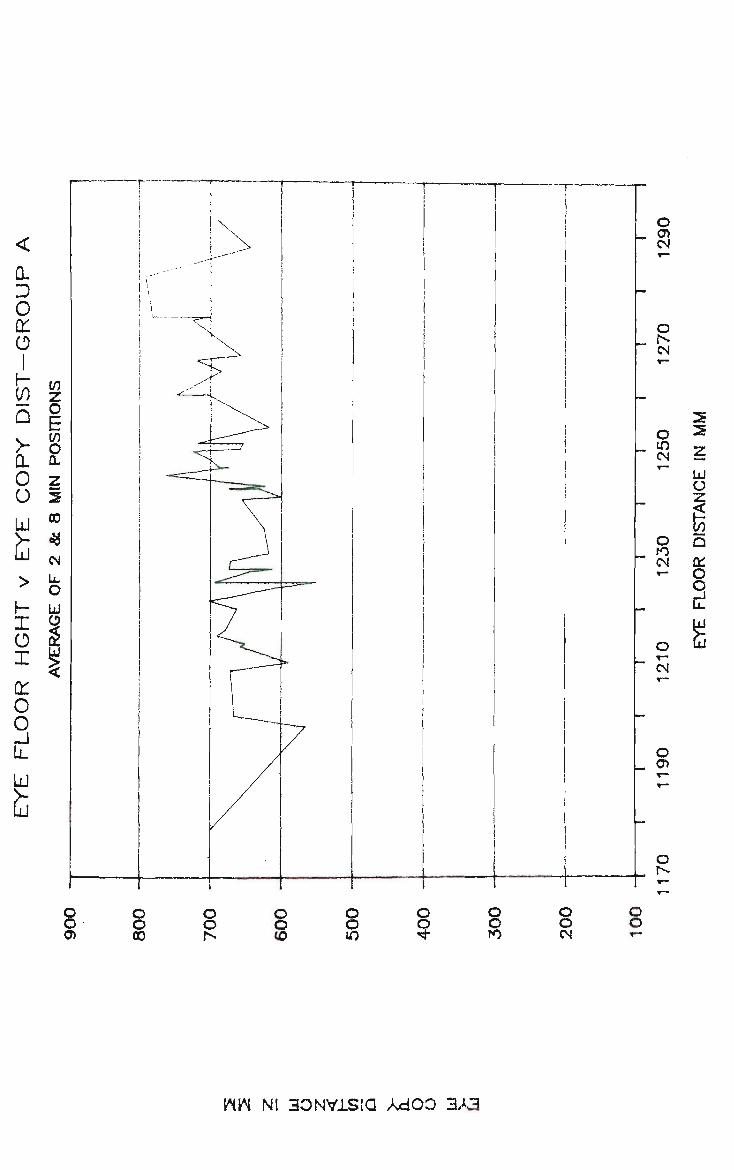
o 0> CM
O Is-CM
O
m CM
o to CM
A
u
to
01
o Q
o CM
o <7)
o Is*
CD
O O OO
©
o o o CO
o o m
o
9 o o to
o o CM
O
o
WW Ni SONVlSta AdOO 3A3
o o to
2 2
O
o A O
fe Q 01 O
§
o o CM
T o o o
CD 00 in o
? to o o CM
O O
WW N! 30NV1SIQ AdOD 3A3
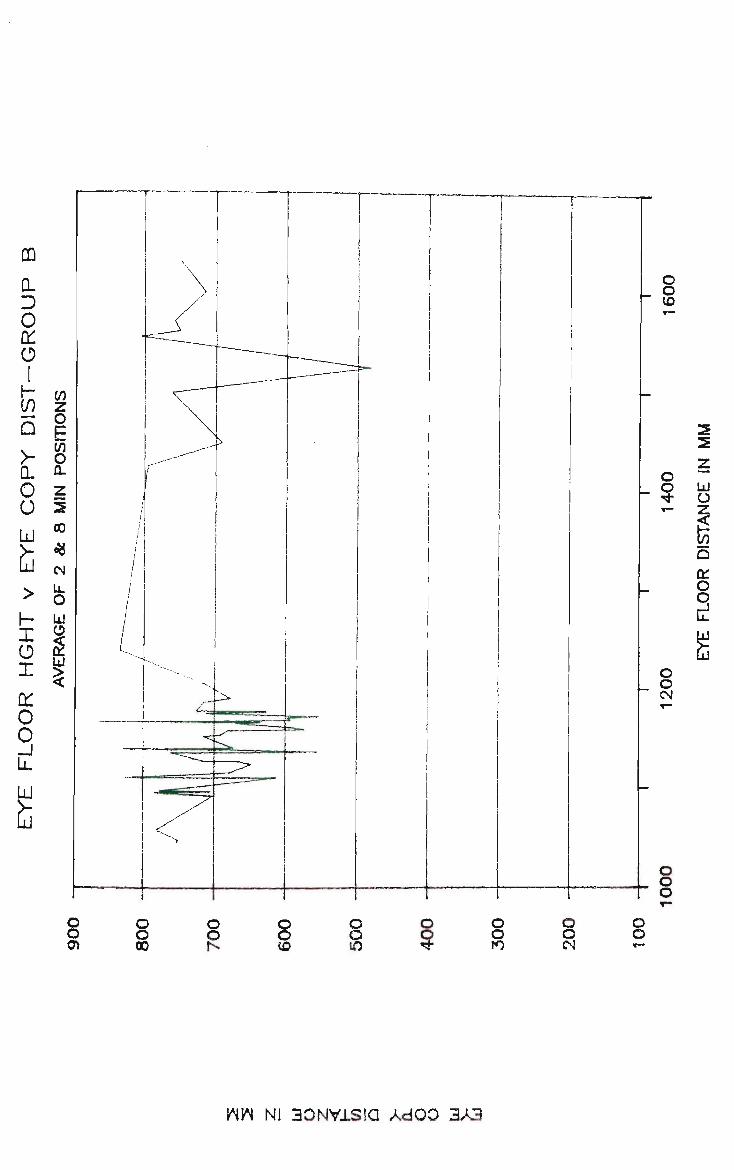
A U
fe
© 01
o
o o CD
o o oo
o o N
O o CO
© o in 9 8
to
O
o CN
O O
WW N! 30NV1SIQ AdOO 3A3
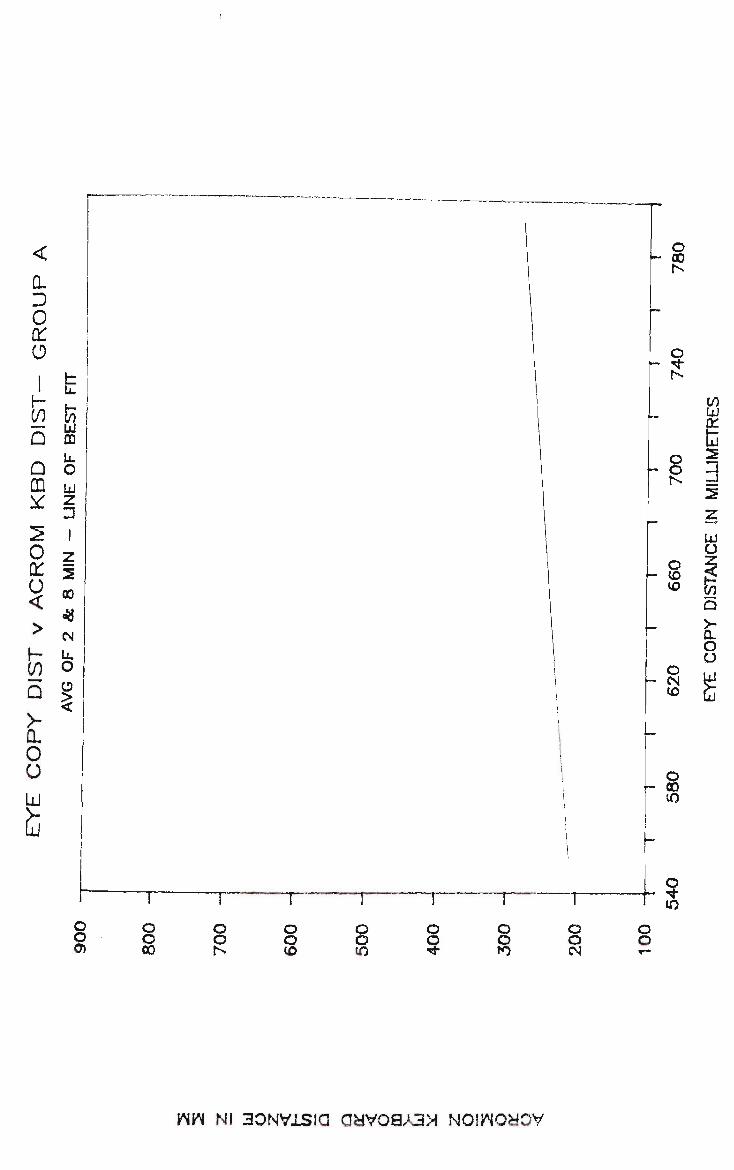
Q.
D 0 on o
Q m
Q fe CD Y
2 0 E o <
>
h co Q
y CL 0 0
LU
ii
A Z n i z 2
oo 3 CM A O
§ <
o o CD
o o 00
o o Is-
o o CO
o o m
o o to
o o CM
O o T~
WW Nl 30NV1SIQ a&VOaA3>l NOIWO&OV
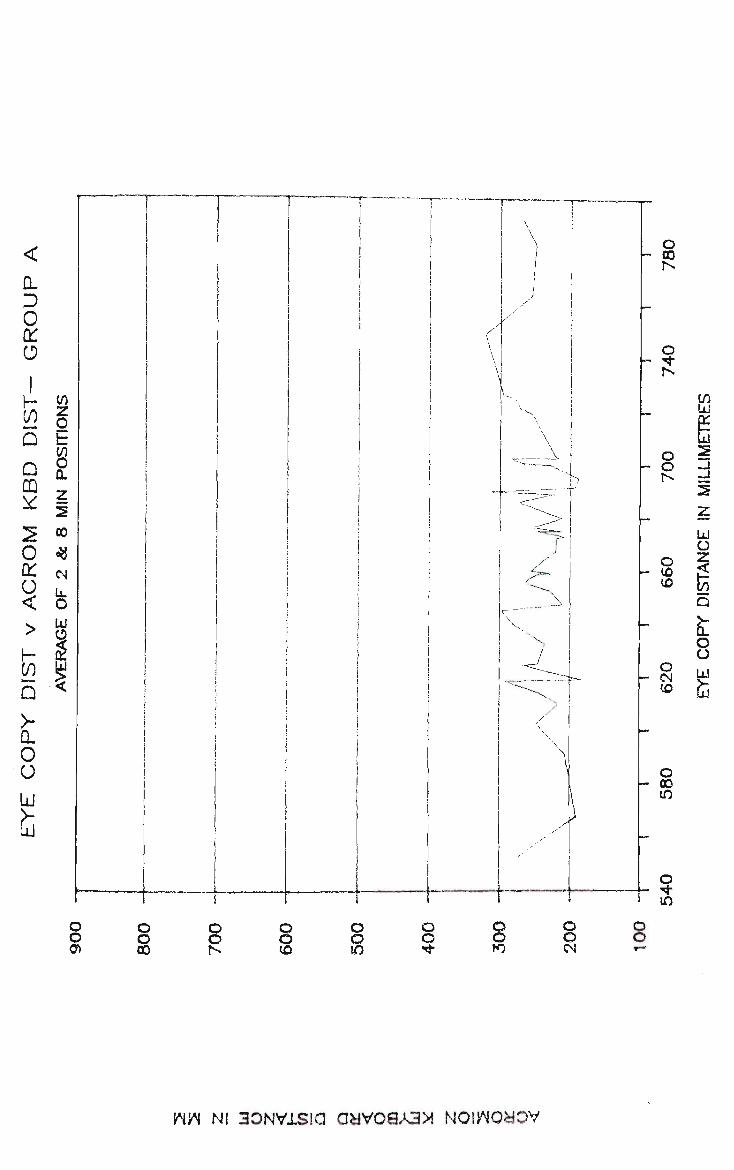
o o CD
O O 00
o CO
© ©
o o
o o to
o o CN
O
o
WW Nl 3ONV1SI0 aaV08A3X NOIWO^OV
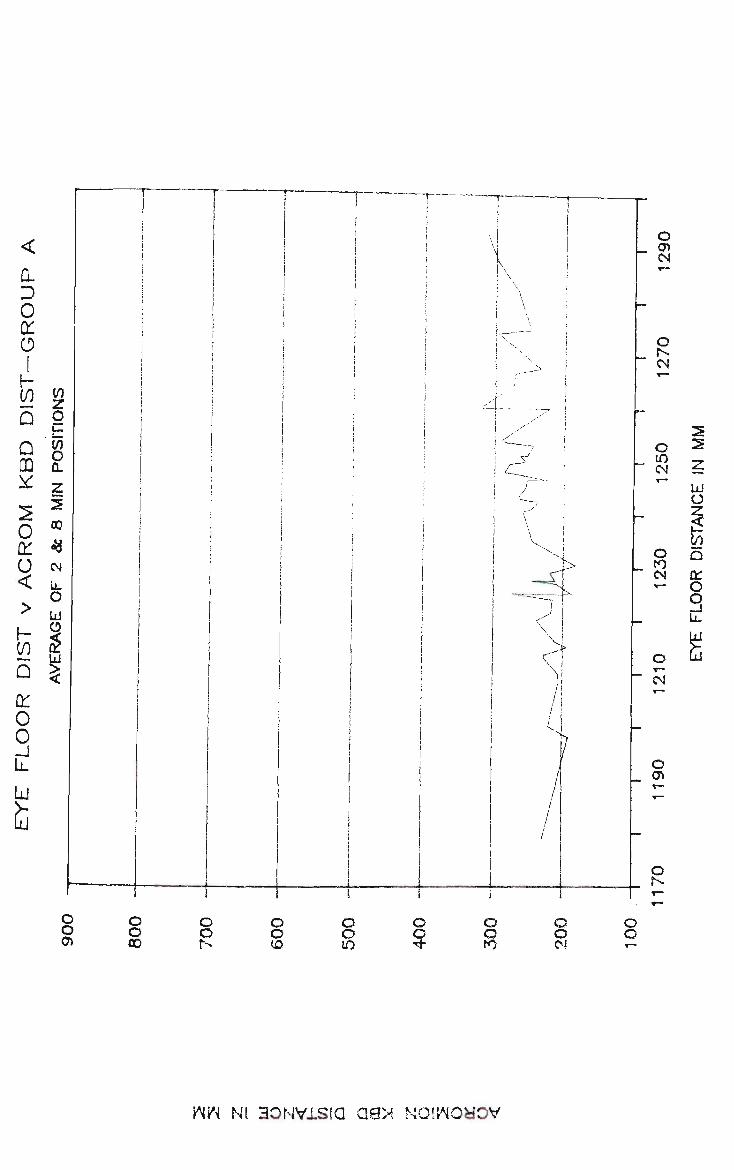
Q.
D 0 on o
h co Q on 0 0 J LL
LU
b
w S 0 2
b
HI g * z
^ 2 o " LT 4 0 CM
! i
i
1
A
A
-T"
! \
o - CD
CM
O
CM
O O CD
O O 00
O
o ©
o CO
o o 10
o o •"fr
o o to
© © CM
o o T~
WW N! 30NV1SIQ QByA NOlWOyOV

o CD CN
O
<N
2
O 2 CM f= 1—
A U
O rO CN
p in
01
o
S A O
CM
O CD
O Is-
o o CD
O O 00
o o N
o o (0 LO
© O
o o to
8 CN
o o
ww NI 30Nvisia aex NOiwoyov
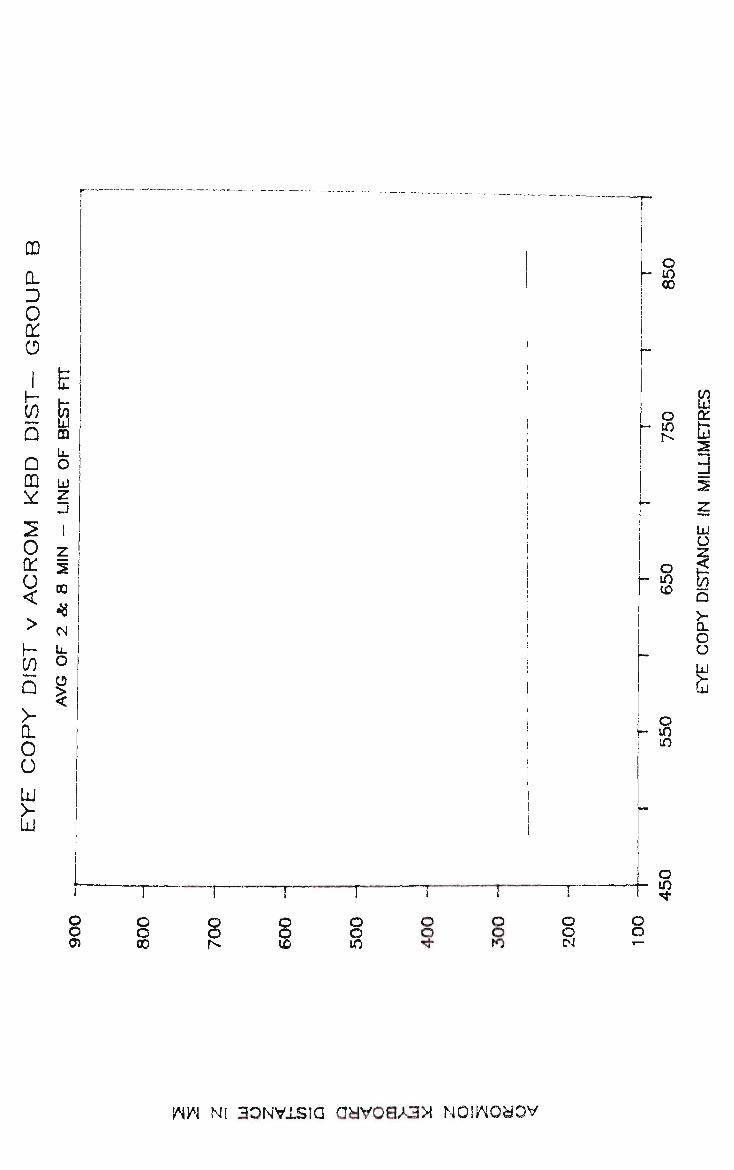
CD
0. D 0 on 0 l £ co b ~ A
A Q o CD A v z 2 1 0 z K 2
< :
> CM
H A CO ° 5 5
< >-0. 0 0
LU
b
i i !
\
1
\ 1
1
o - m
00 !
i
~
O 01
"15 £ 2
d 2 Z
A
650
DISTANC
O o
LU
o - m in
I ~T—•—T~"—~~r~~ r~~—r—~—~r~ r~ — OOQO©0©©0
o o o o o o o o o C D O O N C O i n ^ f O C N T -
WW NI 30NV1SIQ ddVOSASM NOlWOdOV
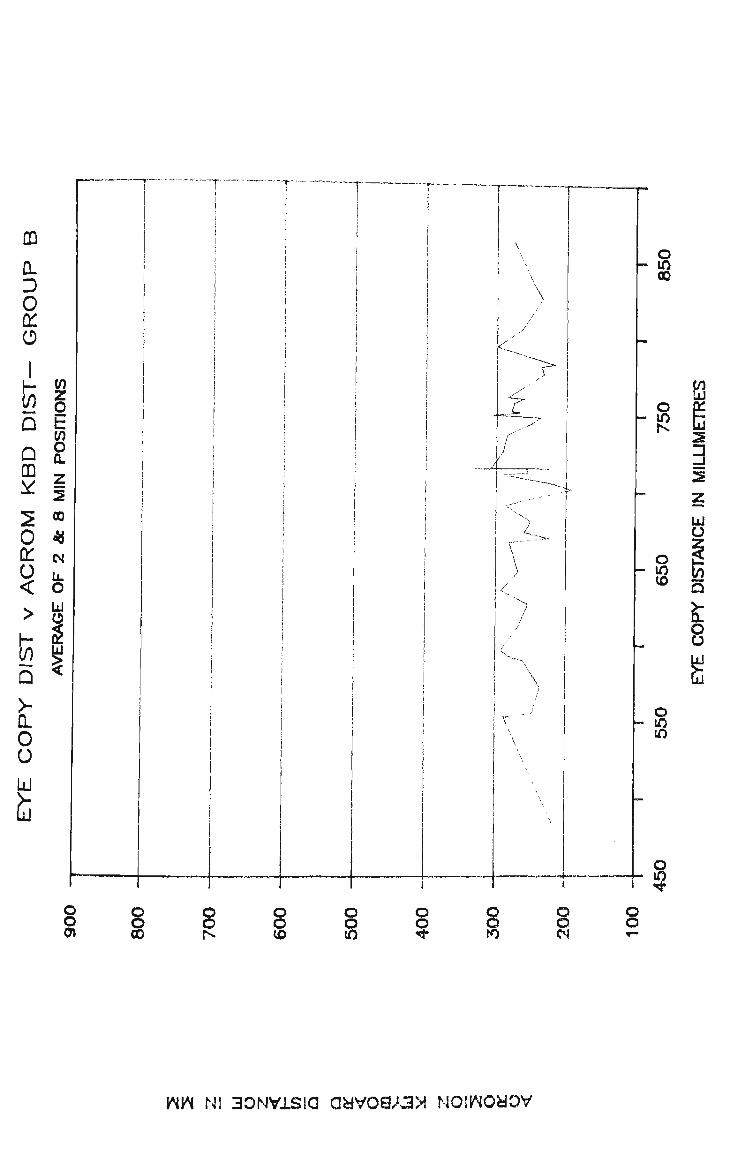
CD
Q. D 0 on 0
1
to Q Q CD
2 0 on 0 <
>
h CO Q >-
a. 0 0
10
z o b to o a. z 2 OO
*
CM lL O A <2 &
% <
LU
fa
o o CD
O in
oo \
k
JF o
A O Z
© fj
o in
m
o
o o 00
o o N
o o CO
o o m
© Q « « • to
8 © CM
O
WW Nl 30NV1S1CJ adV08A3>i NOIWOdOV

o o to
o o
2 2 A O
5 01
o
o o CM
o o o
CD 00 o o
o o CO
m o
9 o o to
o o CM
o o
WW N! 30NV1SIQ Q&X NOIWOdDV
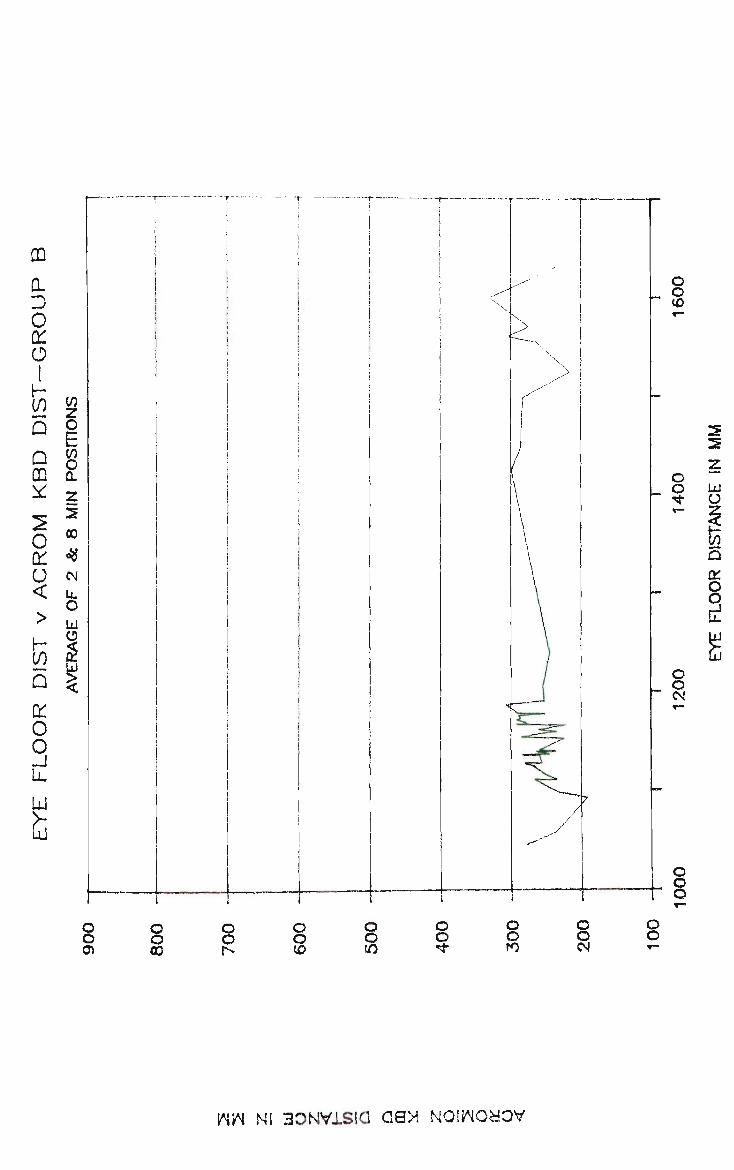
If)
n Q CD ^
2 0 on o <
>
in a
to
z 0 fc=
8 A Z 2
uu <*
CM A O A
I %
o o CO
o o
A U
fe
01
o
o o CM
O O O
O O CD
O O 00
o o Is-
©
o CO
o o m
o o
o o to
o o CM
o o
ww NI 30NVisia as* Noiwoaov
PAGE XIV SEATED WORKING POSTURE
Statistical Summaries of t-Distribution Within and Between Groups, for the Nine Categories of Measurements.
The three Data Sets are:-
comparison of the preferential seated working posture and that prescribed by the model after 2 and 8 minutes, respectively;
Ho, u = model
HI, u = model
comparison of postural changes preferred by operators at the 2 and 8 minutes positions, compared against the seated working posture prescribed by the model;
Ho, u at 2 minutes = u at 8 minutes
HI, u at 2 minutes = u at 8 minutes
test of significance between groups to establish whether or not experimental group A data is different to experimental group B data.
Ho, u A = u B
HI, u A = u B
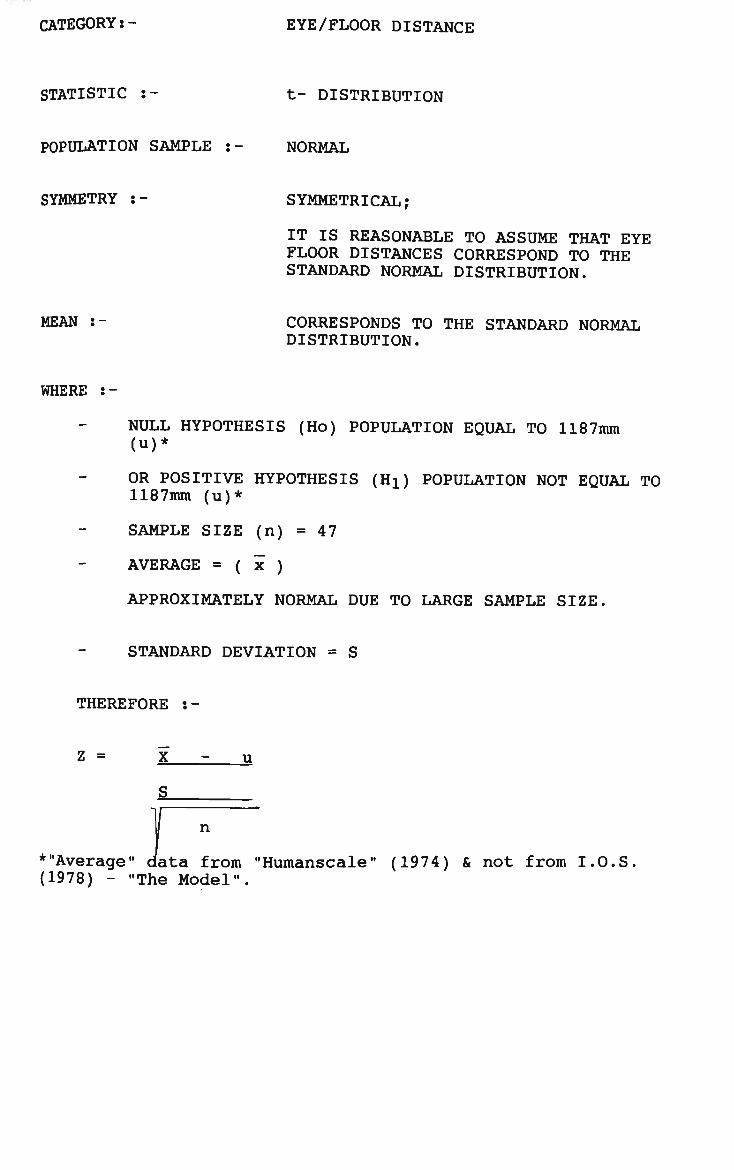
CATEGORY:- EYE/FLOOR DISTANCE
STATISTIC :- t- DISTRIBUTION
POPULATION SAMPLE :- NORMAL
SYMMETRY :- SYMMETRICAL;
IT IS REASONABLE TO ASSUME THAT EYE FLOOR DISTANCES CORRESPOND TO THE STANDARD NORMAL DISTRIBUTION.
MEAN :- CORRESPONDS TO THE STANDARD NORMAL DISTRIBUTION.
WHERE :-
NULL HYPOTHESIS (Ho) POPULATION EQUAL TO 1187mm (u)*
OR POSITIVE HYPOTHESIS (Hi) POPULATION NOT EQUAL TO 1187mm (u)*
SAMPLE SIZE (n) = 47
AVERAGE = ( x )
APPROXIMATELY NORMAL DUE TO LARGE SAMPLE SIZE.
STANDARD DEVIATION = S
THEREFORE :-
z = X - u
S
* "Average" data from "Humanscale" (1974) & not from I.O.S. (1978) - "The Model".
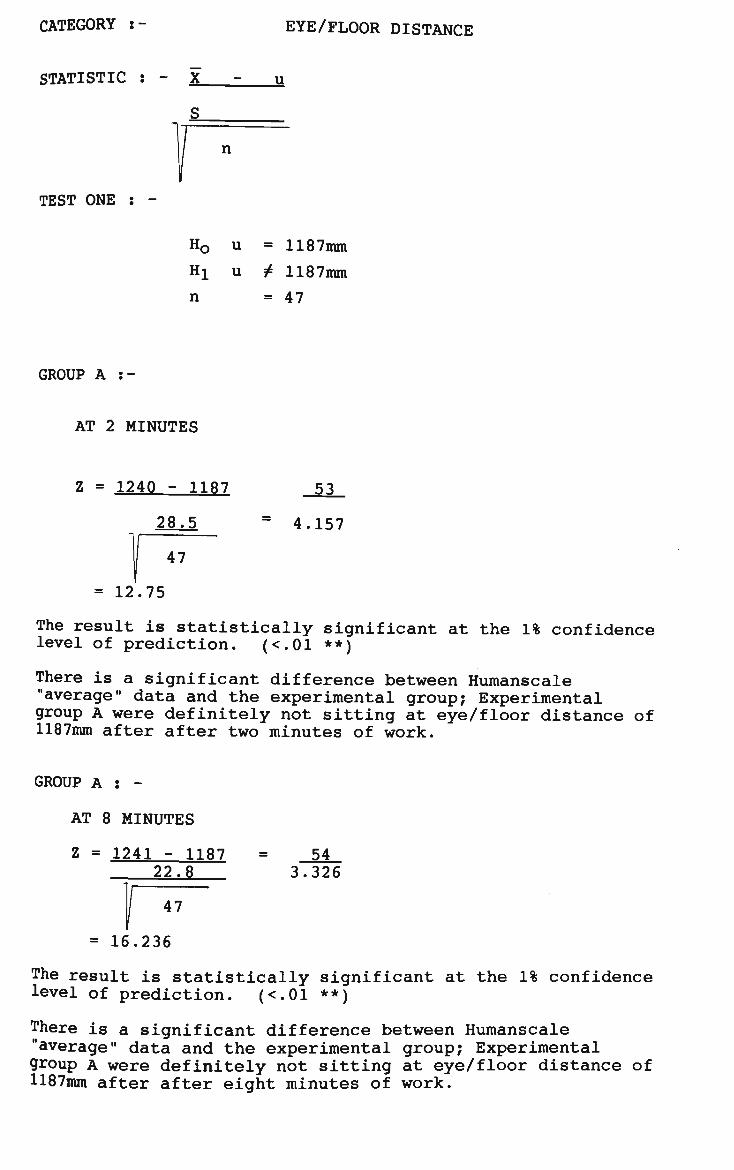
CATEGORY :- EYE/FLOOR DISTANCE
STATISTIC : - X
S
r TEST ONE : -
H0 u = 1187mm
Hi u t 1187mm
n =47
GROUP A :-
AT 2 MINUTES
Z = 1240 - 1187 53
28.5 = 4.157
= 12.75
The result is statistically significant at the 1% confidence level of prediction. (<.01 **)
There is a significant difference between Humanscale "average" data and the experimental group; Experimental group A were definitely not sitting at eye/floor distance of 1187mm after after two minutes of work.
GROUP A : -
AT 8 MINUTES
Z = 1241 - 1187 22.8
P^ = 16.236
The result is statistically significant at the 1% confidence level of prediction. (<.01 **) There is a significant difference between Humanscale "average" data and the experimental group; Experimental group A were definitely not sitting at eye/floor distance of 1187mm after after eight minutes of work.
54 3.326
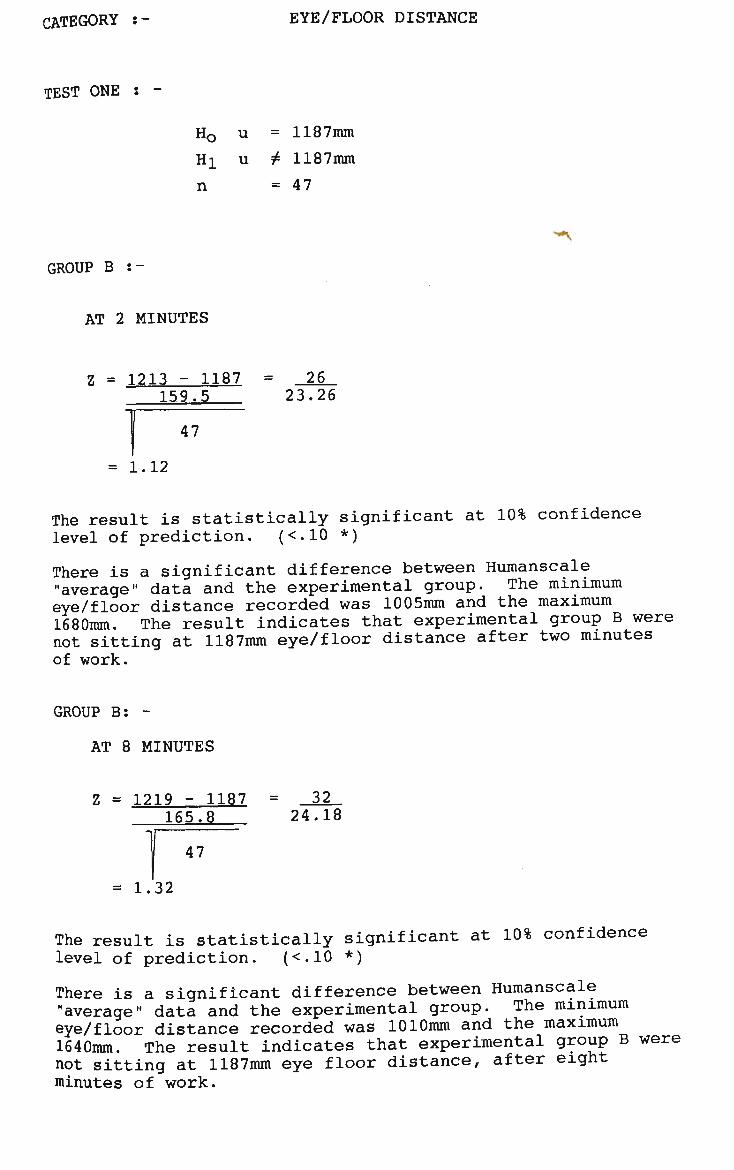
CATEGORY :- EYE/FLOOR DISTANCE
ONE : -
Ho
Hi n
u
u
= 1187mm
± 1187mm
= 47
GROUP B :-
AT 2 MINUTES
Z = 1213 - 1187 = 26 159.5 23.26
47
= 1.12
The result is statistically significant at 10% confidence level of prediction. (<.10 *)
There is a significant difference between Humanscale "average" data and the experimental group. The minimum eye/floor distance recorded was 1005mm and the maximum 1680mm. The result indicates that experimental group B were not sitting at 1187mm eye/floor distance after two minutes of work.
GROUP B: -
AT 8 MINUTES
= 1219 - 1187 = 32 165.8 24.18
47
= 1.32
The result is statistically significant at 10% confidence level of prediction. (<.10 *)
There is a significant difference between Humanscale "average" data and the experimental group. The minimum eye/floor distance recorded was 1010mm and the maximum 1640mm. The result indicates that experimental group B were not sitting at 1187mm eye floor distance, after eight minutes of work.
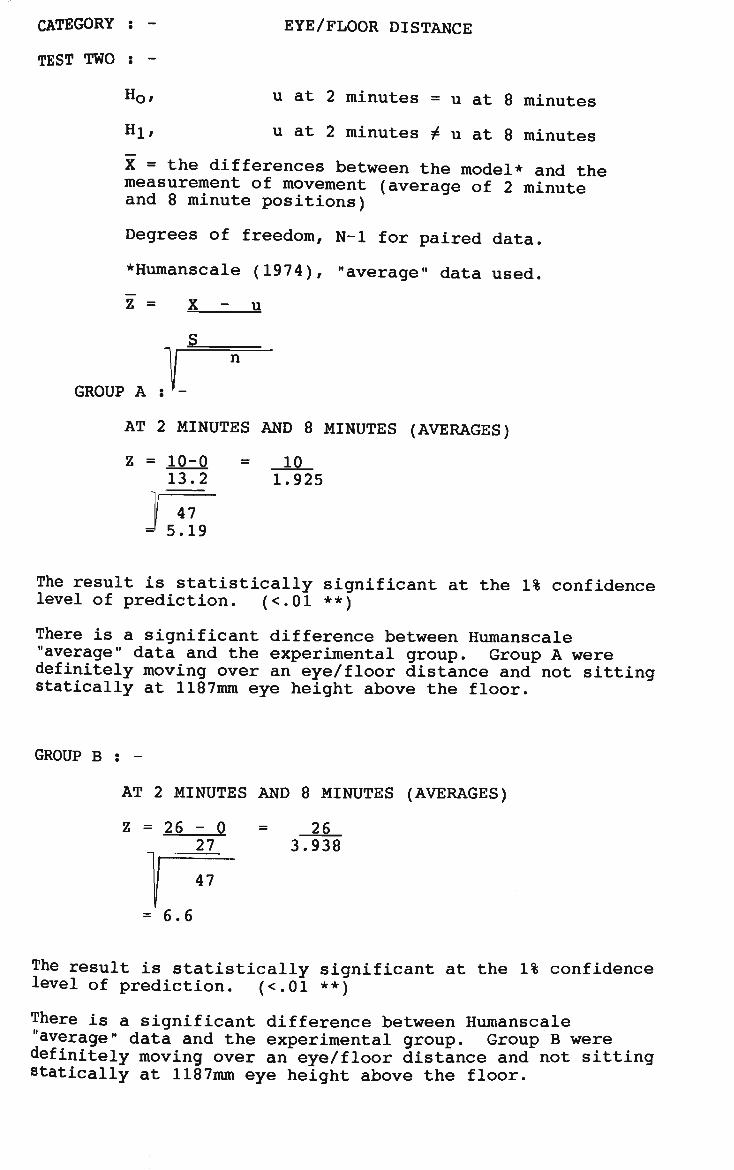
CATEGORY : - EYE/FLOOR DISTANCE
TEST TWO : -
H0f u at 2 minutes = u at 8 minutes
Hl» u at 2 minutes ^ u at 8 minutes
X = the differences between the model* and the measurement of movement (average of 2 minute and 8 minute positions)
Degrees of freedom, N-l for paired data.
•Humanscale (1974), "average" data used.
Z = X - u
S.
GROUP A : '-
AT 2 MINUTES AND 8 MINUTES (AVERAGES)
Z = 10-0 = 10 13.2 1.925
47 5.19
The result is statistically significant at the 1% confidence level of prediction. (<.01 **)
There is a significant difference between Humanscale "average" data and the experimental group. Group A were definitely moving over an eye/floor distance and not sitting statically at 1187mm eye height above the floor.
GROUP B : -
AT 2 MINUTES AND 8 MINUTES (AVERAGES)
26 3.938
The result is statistically significant at the 1% confidence level of prediction. (<.01 **)
There is a significant difference between Humanscale "average" data and the experimental group. Group B were definitely moving over an eye/floor distance and not sitting statically at 1187mm eye height above the floor.
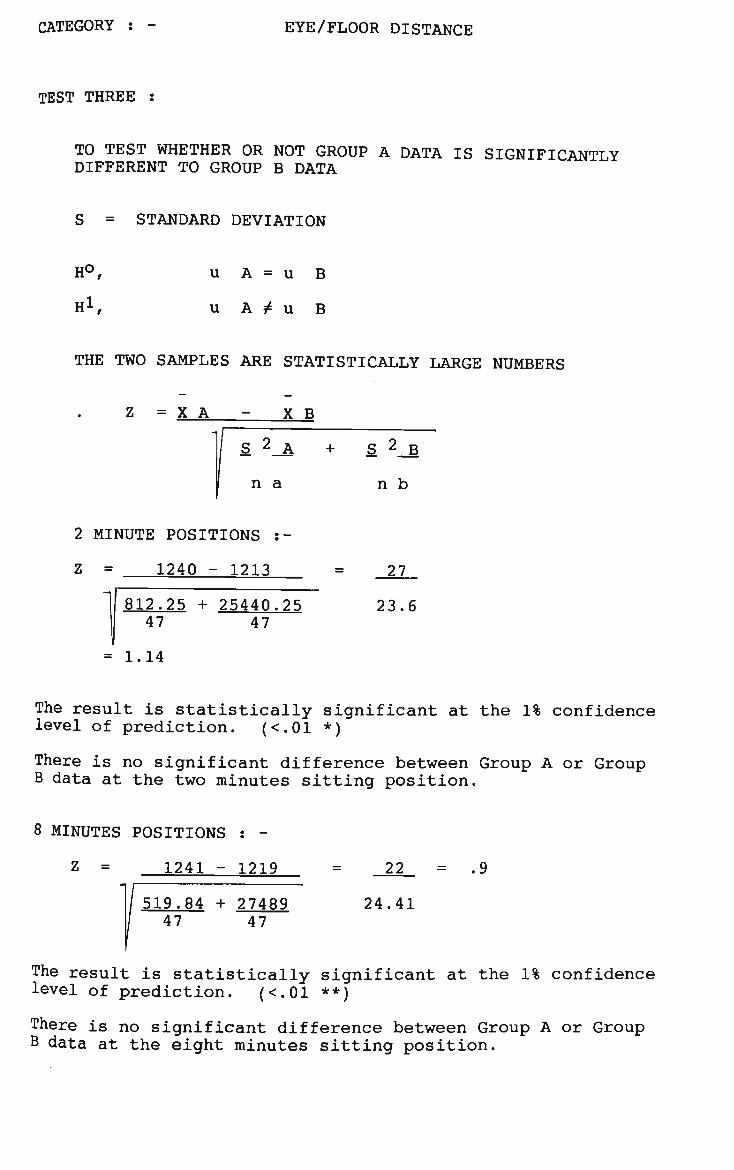
CATEGORY : - EYE/FLOOR DISTANCE
TEST THREE :
TO TEST WHETHER OR NOT GROUP A DATA IS SIGNIFICANTLY DIFFERENT TO GROUP B DATA
S = STANDARD DEVIATION
H°,
Hi,
u A = u B
u A ^ u B
THE TWO SAMPLES ARE STATISTICALLY LARGE NUMBERS
Z = X A X B
S 2_A + S 2 B
n a n b
2 MINUTE POSITIONS :-
Z = 1240 - 1213
812.25 + 25440.25 47 47
= 1.14
27
23.6
The result is statistically significant at the 1% confidence level of prediction. (<.01 *)
There is no significant difference between Group A or Group B data at the two minutes sitting position.
8 MINUTES POSITIONS : -
Z = 1241 - 1219
519.84 + 27489 47 47
22 = .9
24.41
The result is statistically significant at the 1% confidence level of prediction. (<.01 **)
There is no significant difference between Group A or Group B data at the eight minutes sitting position.
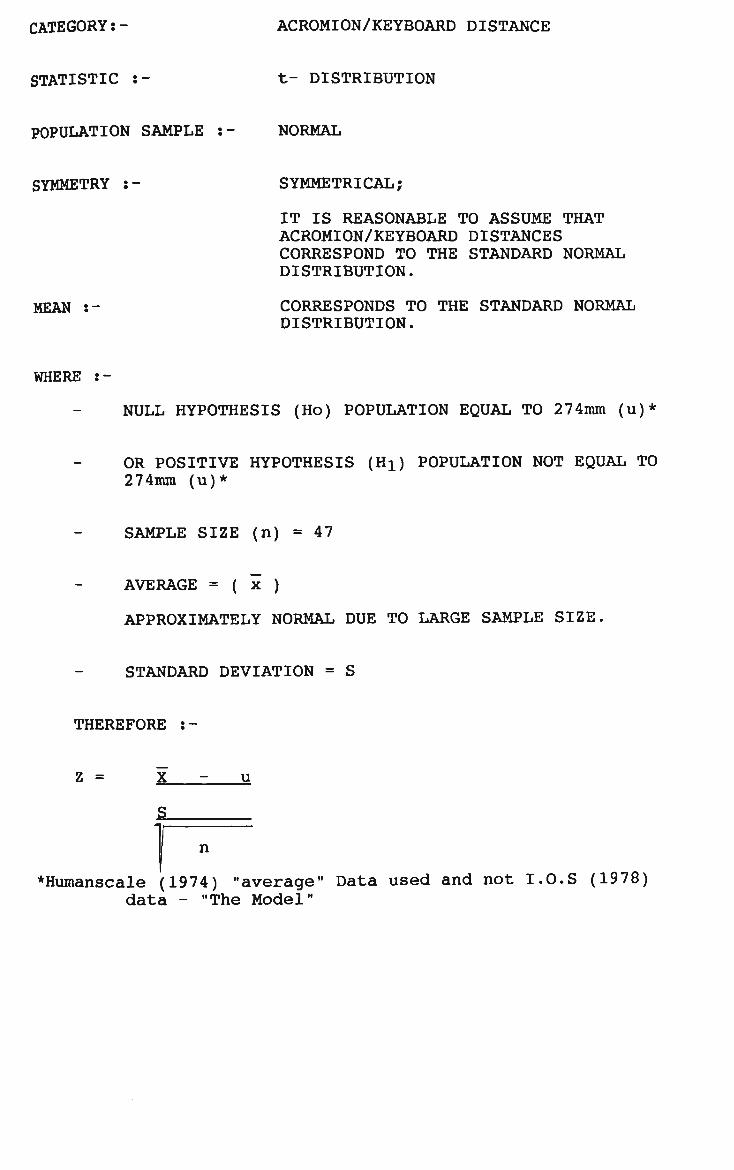
CATEGORY:- ACROMION/KEYBOARD DISTANCE
STATISTIC :- t- DISTRIBUTION
POPULATION SAMPLE t- NORMAL
SYMMETRY :- SYMMETRICAL;
IT IS REASONABLE TO ASSUME THAT ACROMION/KEYBOARD DISTANCES CORRESPOND TO THE STANDARD NORMAL DISTRIBUTION.
MEAN :- CORRESPONDS TO THE STANDARD NORMAL DISTRIBUTION.
WHERE :-
NULL HYPOTHESIS (Ho) POPULATION EQUAL TO 274mm (u)*
OR POSITIVE HYPOTHESIS (Hi) POPULATION NOT EQUAL TO 274mm (u)*
SAMPLE SIZE (n) = 47
AVERAGE = ( x )
APPROXIMATELY NORMAL DUE TO LARGE SAMPLE SIZE.
STANDARD DEVIATION = S
THEREFORE z-
Z = X - u
5
*Humanscale (1974) "average" Data used and not I.O.S (1978) data - "The Model"
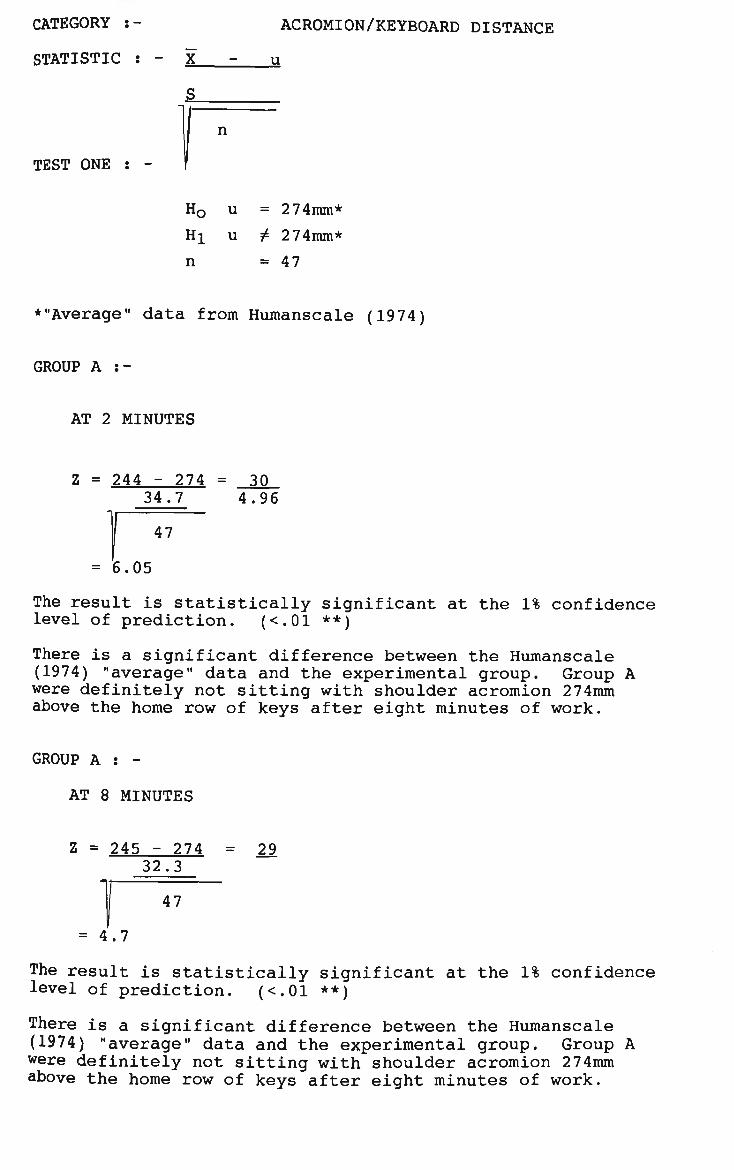
CATEGORY :- ACROMION/KEYBOARD DISTANCE
STATISTIC : - X - u
S
TEST ONE : - f
H0 u = 274mm*
Hi u ^ 274mm*
n =47
•"Average" data from Humanscale (1974)
GROUP A :-
AT 2 MINUTES
Z = 244 - 274 = 30 34.7 4.96
= 6.05
The result is statistically significant at the 1% confidence level of prediction. (<.01 **)
There is a significant difference between the Humanscale (1974) "average" data and the experimental group. Group A were definitely not sitting with shoulder acromion 274mm above the home row of keys after eight minutes of work.
GROUP A : -
AT 8 MINUTES
Z = 245 - 274 = 29 32.3
= 4.7
The result is statistically significant at the 1% confidence level of prediction. (<.01 **)
There is a significant difference between the Humanscale (1974) "average" data and the experimental group. Group A were definitely not sitting with shoulder acromion 274mm above the home row of keys after eight minutes of work.
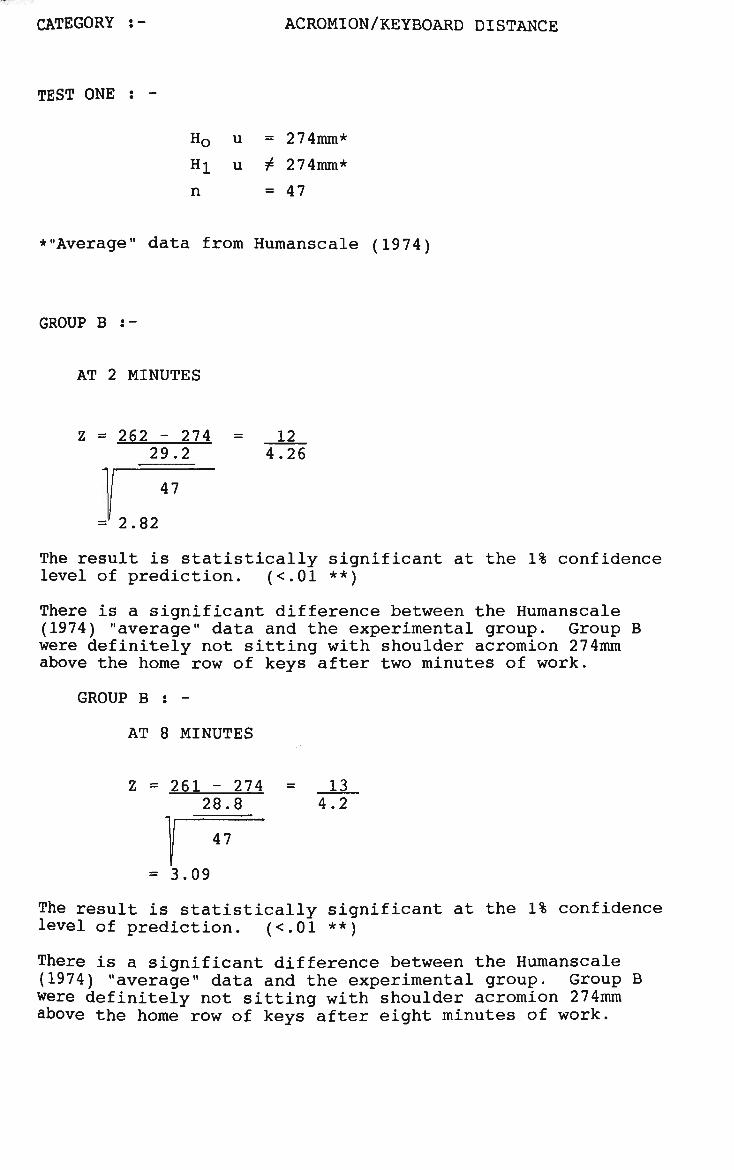
CATEGORY :- ACROMION/KEYBOARD DISTANCE
TEST ONE : -
H0 u = 274mm*
Hi u ^ 274mm*
n =47
•"Average" data from Humanscale (1974)
GROUP B :-
AT 2 MINUTES
Z = 262 - 274 29.2
=? 2.82
The result is statistically significant at the 1% confidence level of prediction. (<.01 **)
There is a significant difference between the Humanscale (1974) "average" data and the experimental group. Group B were definitely not sitting with shoulder acromion 274mm above the home row of keys after two minutes of work. GROUP B : -
AT 8 MINUTES
Z = 261 - 274 = _13 28.8 4.2
= 3.09
The result is statistically significant at the 1% confidence level of prediction. (<.01 **)
There is a significant difference between the Humanscale (1974) "average" data and the experimental group. Group B were definitely not sitting with shoulder acromion 274mm above the home row of keys after eight minutes of work.
= 12 4.26
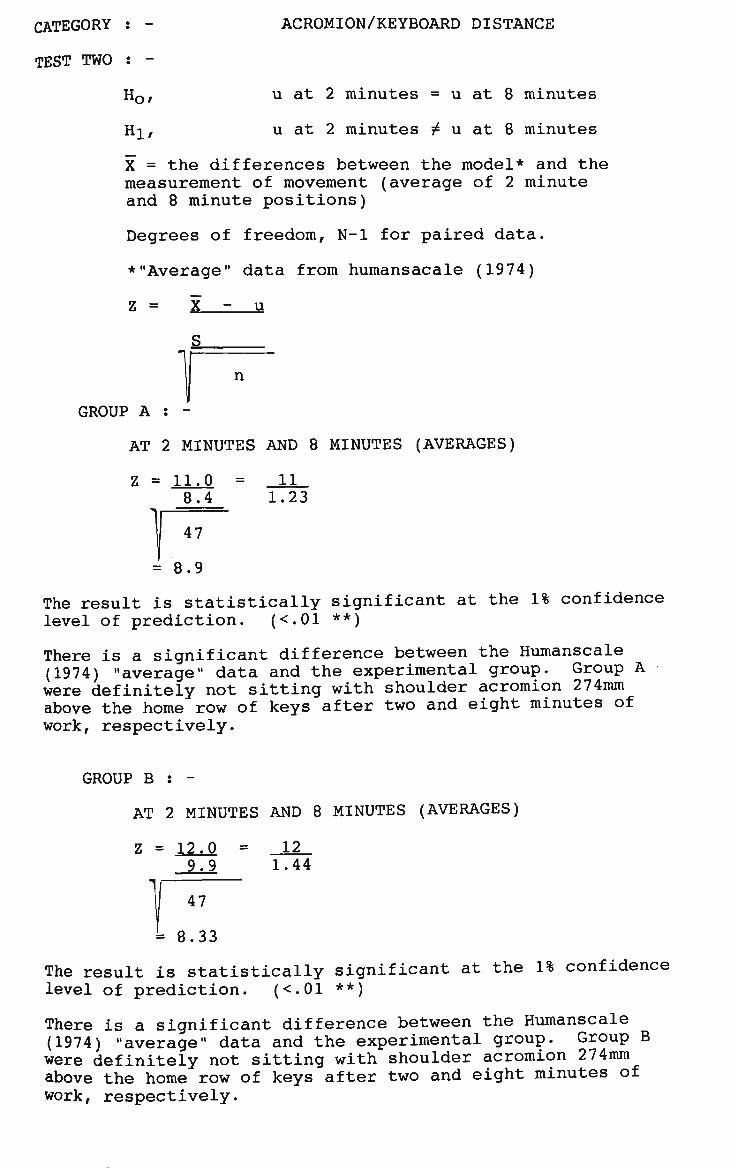
CATEGORY : - ACROMION/KEYBOARD DISTANCE
TEST TWO : -
H0, u at 2 minutes = u at 8 minutes
Hi, u at 2 minutes ^ u at 8 minutes
X = the differences between the model* and the measurement of movement (average of 2 minute and 8 minute positions)
Degrees of freedom, N-l for paired data.
•"Average" data from humansacale (1974)
Z = X - u
S
GROUP A : -
AT 2 MINUTES AND 8 MINUTES (AVERAGES)
Z = 11.0 = 11 8.4 1.23
= 8.9
The result is statistically significant at the 1% confidence level of prediction. (<.01 **)
There is a significant difference between the Humanscale (1974) "average" data and the experimental group. Group A were definitely not sitting with shoulder acromion 274mm above the home row of keys after two and eight minutes of work, respectively.
GROUP B : -
AT 2 MINUTES AND 8 MINUTES (AVERAGES)
Z = 12.0 = 12 9.9 1.44
= 8.33
The result is statistically significant at the 1% confidence level of prediction. (<.01 **)
There is a significant difference between the Humanscale (1974) "average" data and the experimental group. Group B were definitely not sitting with shoulder acromion 274mm above the home row of keys after two and eight minutes of work, respectively.
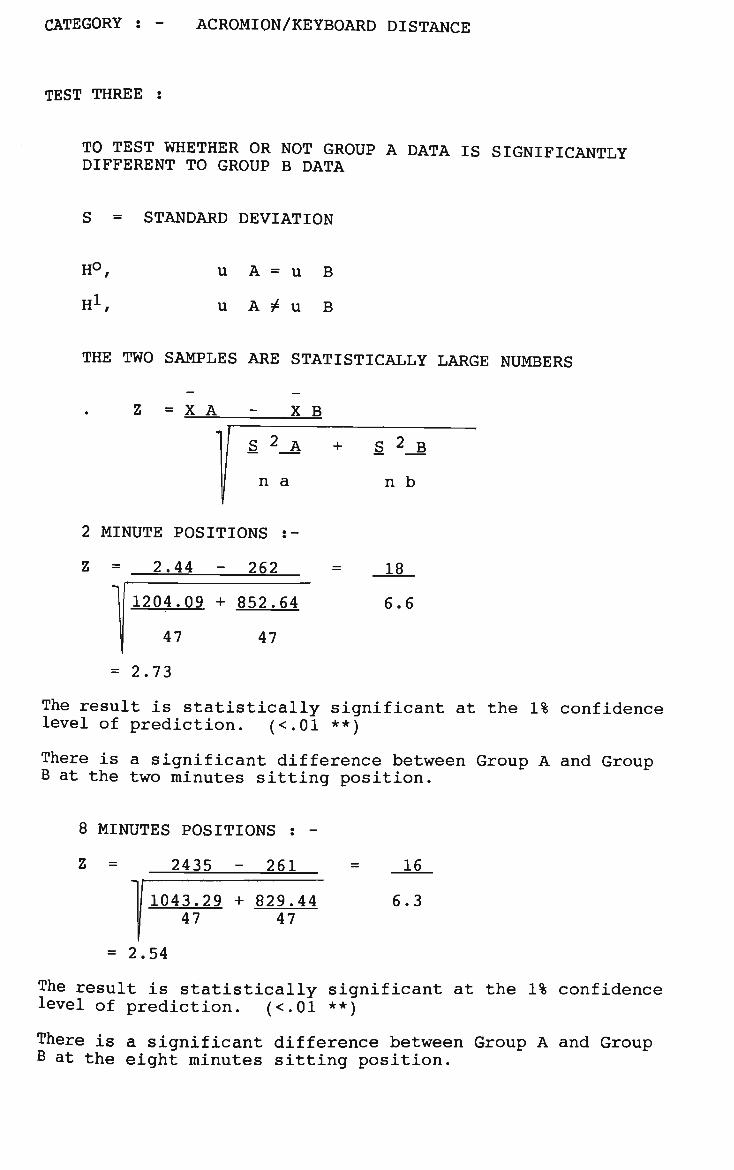
CATEGORY : - ACROMION/KEYBOARD DISTANCE
TEST THREE :
TO TEST WHETHER OR NOT GROUP A DATA IS SIGNIFICANTLY DIFFERENT TO GROUP B DATA
S = STANDARD DEVIATION
H°,
Hi,
u
u
A = u
A 5* u
B
B
THE TWO SAMPLES ARE STATISTICALLY LARGE NUMBERS
Z = X A X B
S 2_A + S 2 B
n a n b
2 MINUTE POSITIONS :-
Z = 2.44 - 262
1204.09 + 852.64
47
18
6.6
47
= 2.73
The result is statistically significant at the 1% confidence level of prediction. (<.01 **)
There is a significant difference between Group A and Group B at the two minutes sitting position.
8 MINUTES POSITIONS :
Z = 2435 - 261
1043.29 + 829.44 47 47
16
6.3
= 2.54
The result is statistically significant at the 1% confidence level of prediction. (<.01 **)
There is a significant difference between Group A and Group B at the eight minutes sitting position.

CATEGORY:- EYE/COPY DISTANCE
STATISTIC :- t- DISTRIBUTION
POPULATION SAMPLE t- NORMAL
SYMMETRY :- SYMMETRICAL;
IT IS REASONABLE TO ASSUME THAT EYE/COPY DISTANCES CORRESPOND TO THE STANDARD NORMAL DISTRIBUTION.
MEAN :- CORRESPONDS TO THE STANDARD NORMAL DISTRIBUTION.
DEGREES OF FREEDOM :- N - 1 FOR PAIRED DATA
WHERE :-
NULL HYPOTHESIS (Ho) POPULATION EQUAL TO 460mm (u)*
OR POSITIVE HYPOTHESIS (Hi) POPULATION NOT EQUAL TO 460mm (u)*
SAMPLE SIZE (n) = 47
AVERAGE = ( x )
APPROXIMATELY NORMAL DUE TO LARGE SAMPLE SIZE.
STANDARD DEVIATION = S
THEREFORE :-
Z = X - u
S.
p-*Humanscale (1974) "average" data and not from I.O.S. (1978) - "The Model"

CATEGORY :- EYE/COPY DISTANCE
STATISTIC : - X - u
n
ONE : -
Ho
Hi n
u
u
= 460mm
± 460mm
= 47
GROUP A :-
AT 2 MINUTES
Z = 670 - 460 = 210
-, 50.6 7.38
= 28.45
The result is statistically significant at the 1% confidence level of prediction. (<.01 **)
There is a significant difference between the Humanscale (1974) "average" data and the experimental group. Group A were definitely not sitting at viewing distance to copy/screen of 460mm after two minutes of work.
GROUP A : -
AT 8 MINUTES
Z = 671 - 460 = 211 52.2 7.61 47
= 2*7.73
The result is statistically significant at the 1% confidence level of prediction. (<.01 **)
There is a significant difference between the Humanscale (1974) "average" data and the experimental group. Group A were definitely not sitting at viewing distance to copy/screen of 460mm after eight minutes of work.

CATEGORY :- EYE/COPY DISTANCE
TEST ONE : -
H0 u = 460mm
Hi u ^ 460mm
n =47
GROUP B :-
AT 2 MINUTES
Z = 700 - 460
, 77.4
= 21.26
The result is statistically significant at the 1% confidence level of prediction. (<.01 **)
There is a significant difference between the Humanscale (1974) "average" data and the experimental group. Group B were definitely not sitting at viewing distance to copy/screen of 460mm after two minutes of work.
GROUP B : -
AT 8 MINUTES
Z = 707 - 469
., 87.0
= '19.46
The result is statistically significant at the 1% confidence level of prediction. (<.01 **)
There is a significant difference between the Humanscale (1974) "average" data and the experimental group. Group B were definitely not sitting at viewing distance to copy/screen of 460mm after eight minutes of work.
240 11.29
= 247
12.69
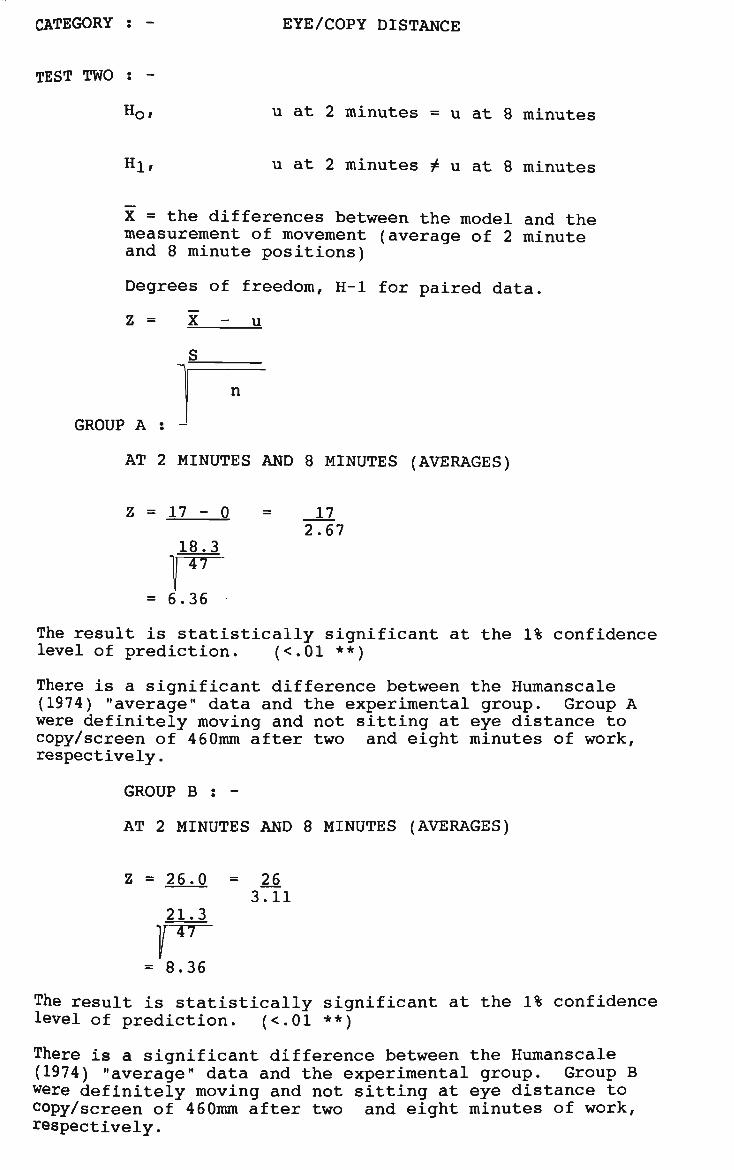
CATEGORY : - EYE/COPY DISTANCE
TEST TWO : -
HQr u at 2 minutes = u at 8 minutes
Hi, u at 2 minutes / u at 8 minutes
X = the differences between the model and the measurement of movement (average of 2 minute and 8 minute positions)
Degrees of freedom, H-l for paired data.
Z = X - u
S
n
GROUP A : -'
AT 2 MINUTES AND 8 MINUTES (AVERAGES)
Z = 1 7 - 0 = 17 2.67
18.3
•pr~ = 6.36
The result is statistically significant at the 1% confidence level of prediction. (<.01 **)
There is a significant difference between the Humanscale (1974) "average" data and the experimental group. Group A were definitely moving and not sitting at eye distance to copy/screen of 460mm after two and eight minutes of work, respectively. GROUP B : -
AT 2 MINUTES AND 8 MINUTES (AVERAGES)
Z = 26.0 = 26 3.11
21.3
= 8.36
The result is statistically significant at the 1% confidence level of prediction. (<.01 **)
There is a significant difference between the Humanscale (1974) "average" data and the experimental group. Group B were definitely moving and not sitting at eye distance to copy/screen of 460mm after two and eight minutes of work, respectively.
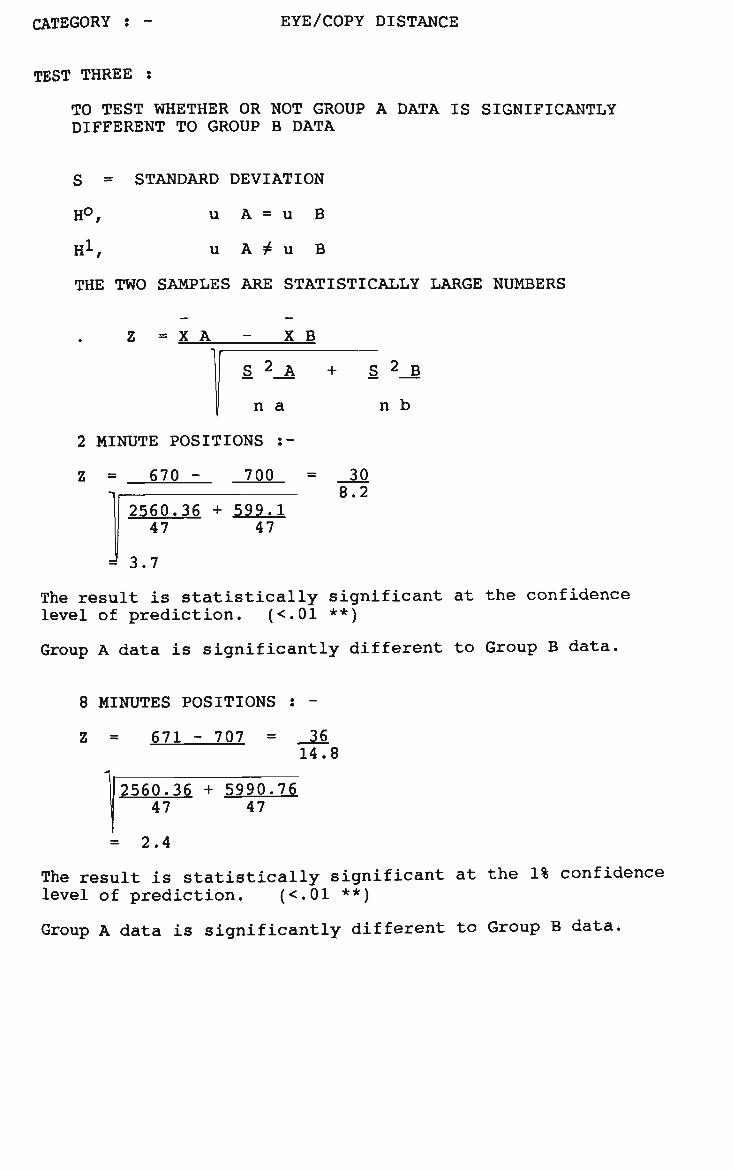
CATEGORY : - EYE/COPY DISTANCE
TEST THREE :
TO TEST WHETHER OR NOT GROUP A DATA IS SIGNIFICANTLY DIFFERENT TO GROUP B DATA
S = STANDARD DEVIATION
H°, u A = u B
H1, u A ^ u B
THE TWO SAMPLES ARE STATISTICALLY LARGE NUMBERS
Z » X A - X B
S 2^A
n a
+ S_ 2_B
n b
2 MINUTE POSITIONS i-
Z = 670 - 700 = _30 -, 8.2 2560.36 + 599.1 47 47
= 3.7
The result is statistically significant at the confidence level of prediction. (<.01 **)
Group A data is significantly different to Group B data.
8 MINUTES POSITIONS : -
Z = 671 - 707 = _36 14.8
1^2560.36 + 5990.76 47 47
= 2.4
The result is statistically significant at the 1% confidence level of prediction. (<.01 **)
Group A data is significantly different to Group B data.
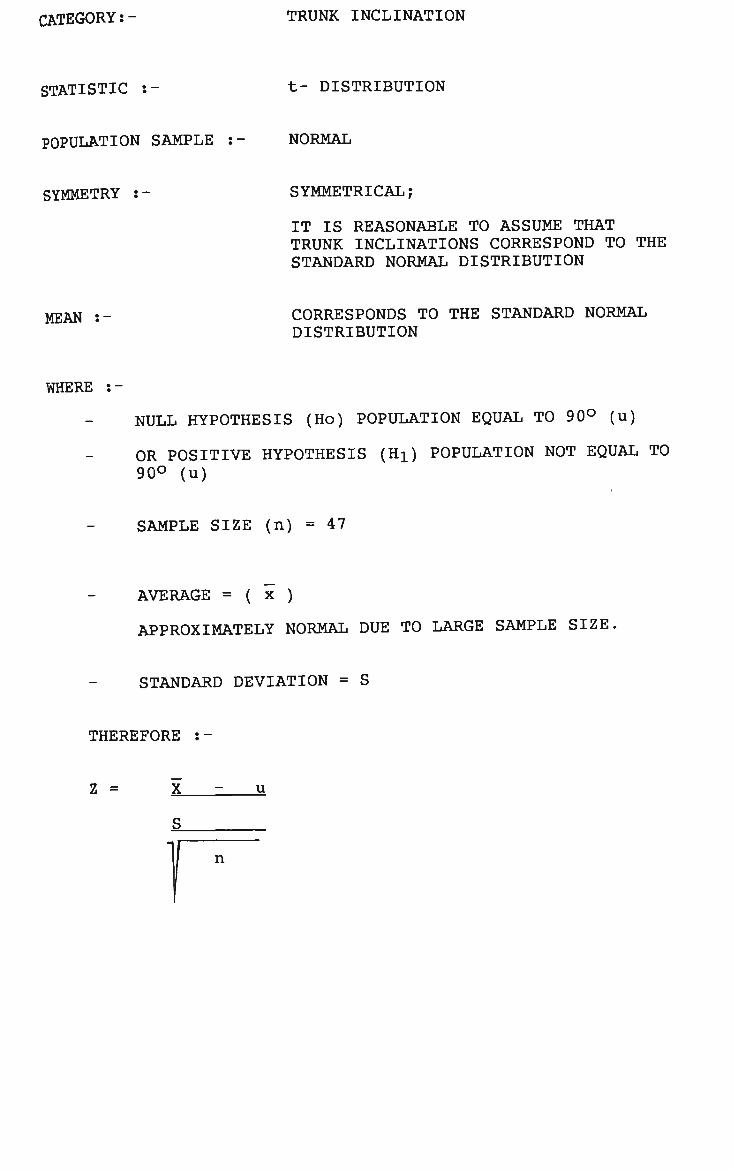
CATEGORY: - TRUNK INCLINATION
STATISTIC : t- DISTRIBUTION
POPULATION SAMPLE NORMAL
SYMMETRY :- SYMMETRICAL;
IT IS REASONABLE TO ASSUME THAT TRUNK INCLINATIONS CORRESPOND TO THE STANDARD NORMAL DISTRIBUTION
MEAN :- CORRESPONDS TO THE STANDARD NORMAL DISTRIBUTION
WHERE :-
NULL HYPOTHESIS (Ho) POPULATION EQUAL TO 90° (u)
OR POSITIVE HYPOTHESIS (H^ POPULATION NOT EQUAL TO 90° (u)
SAMPLE SIZE (n) = 47
AVERAGE = ( x )
APPROXIMATELY NORMAL DUE TO LARGE SAMPLE SIZE
STANDARD DEVIATION = S
THEREFORE :-
Z = u
n
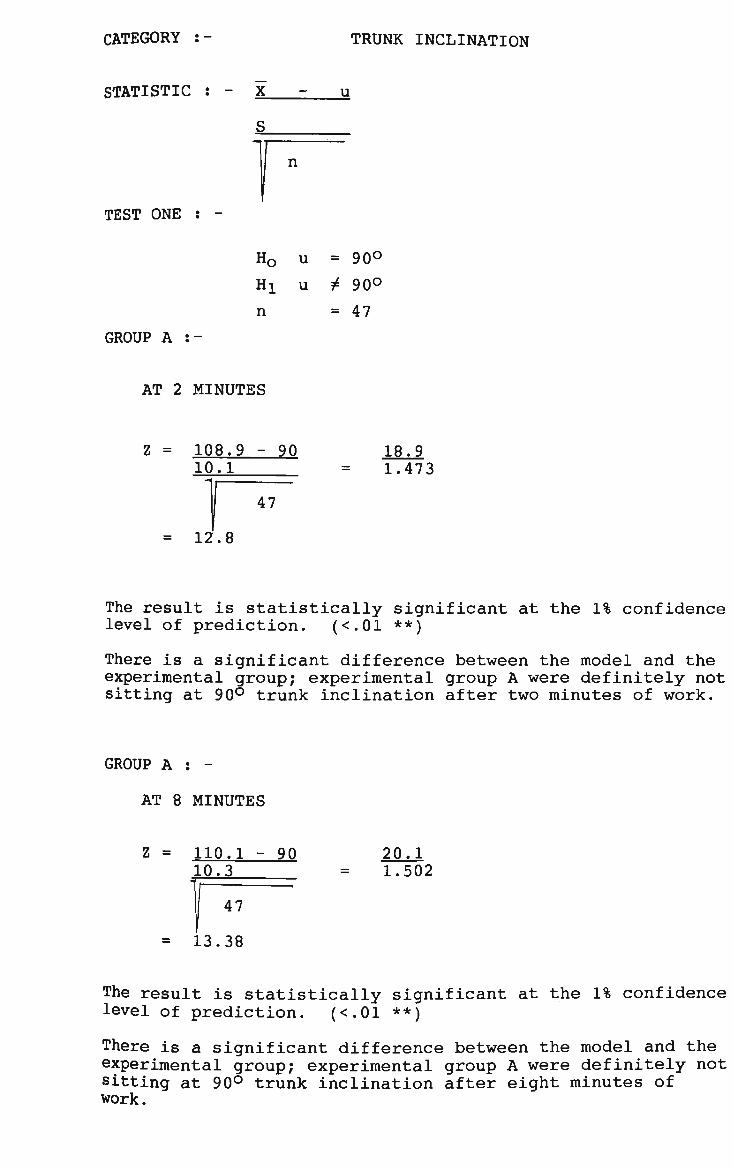
CATEGORY :- TRUNK INCLINATION
STATISTIC : - X - u
S
TEST ONE : -
H0 u = 90°
Hi u ± 90°
n =47
GROUP A :-
AT 2 MINUTES
Z = 108.9 - 90 10.1
p^ = 12.8
The result is statistically significant at the 1% confidence level of prediction. (<.01 **)
There is a significant difference between the model and the experimental group; experimental group A were definitely not sitting at 90° trunk inclination after two minutes of work.
GROUP A : -
AT 8 MINUTES
z = H0.1 ~ 90 10.3
= 13.38
The result is statistically significant at the 1% confidence level of prediction. (<.01 **)
There is a significant difference between the model and the experimental group; experimental group A were definitely not sitting at 90° trunk inclination after eight minutes of work.
18.9 1.473
20.1 1.502
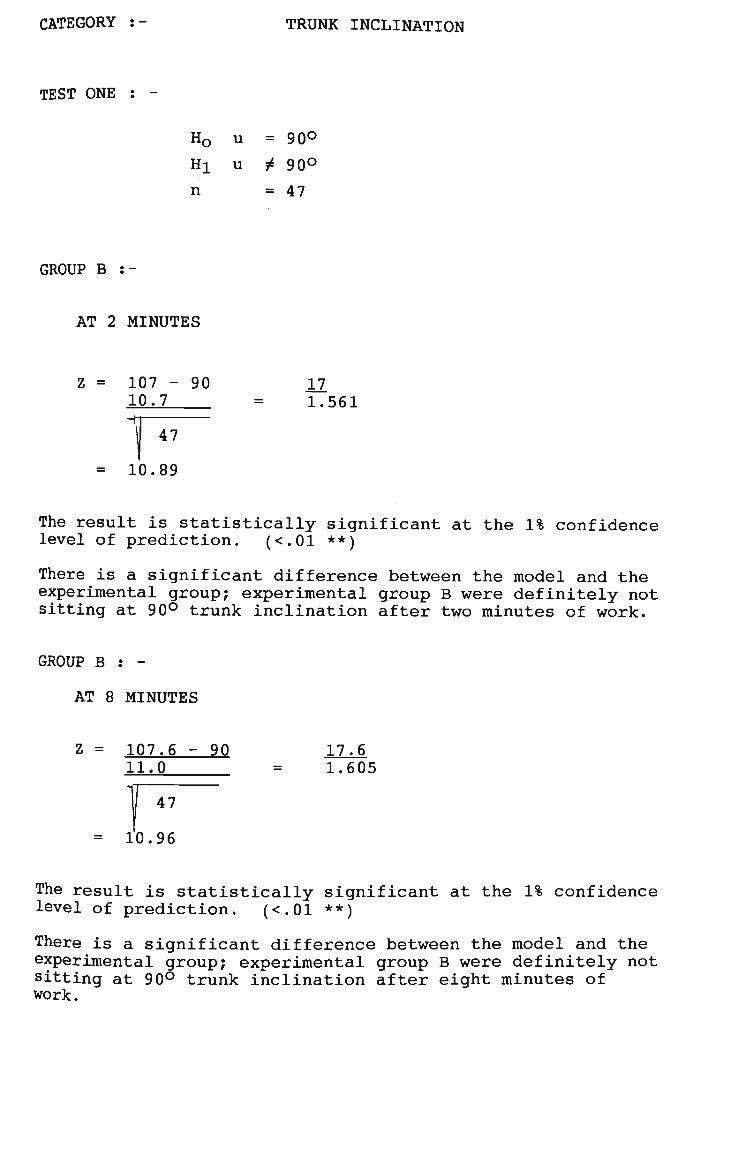
CATEGORY :- TRUNK INCLINATION
TEST ONE : -
Ho
Hi n
u
u
= 90°
± 90° = 47
GROUP B :-
AT 2 MINUTES
Z = 107 - 90 12 10.7 = 1.561
The result is statistically significant at the 1% confidence level of prediction. (<.01 **)
There is a significant difference between the model and the experimental group; experimental group B were definitely not sitting at 90° trunk inclination after two minutes of work.
ROUP B
AT 8
Z =
=
• — •
MINUTES
107.6 - 90 11.0
| 47
10.96
17.6 1.605
The result is statistically significant at the 1% confidence level of prediction. (<.01 **)
There is a significant difference between the model and the experimental group; experimental group B were definitely not sitting at 90° trunk inclination after eight minutes of work.
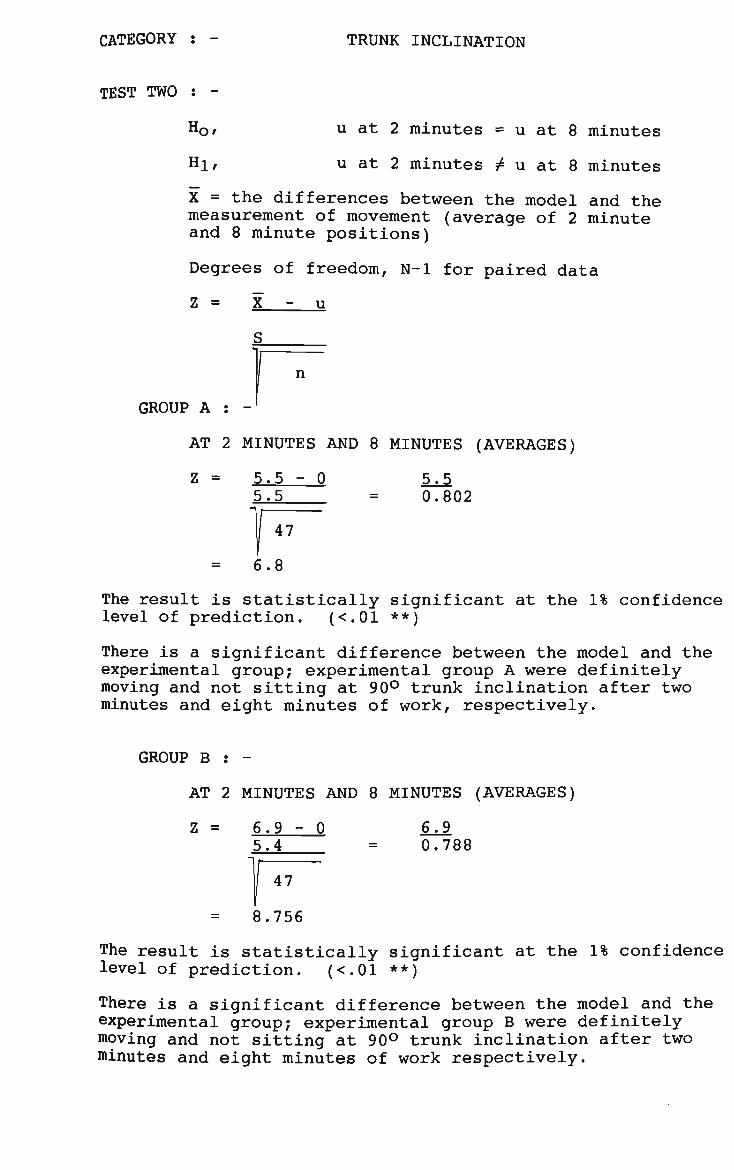
I
CATEGORY : - TRUNK INCLINATION
TEST TWO : -
H0/ u at 2 minutes = u at 8 minutes
Hi, u at 2 minutes ± u at 8 minutes
X = the differences between the model and the measurement of movement (average of 2 minute and 8 minute positions)
Degrees of freedom, N-l for paired data
Z = X - u
S
n
GROUP A : -
AT 2 MINUTES AND 8 MINUTES (AVERAGES)
Z = 5.5 - 0 5.5 5.5 = 0.802
47
6.8
The result is statistically significant at the 1% confidence level of prediction. (<.01 **)
There is a significant difference between the model and the experimental group; experimental group A were definitely moving and not sitting at 90° trunk inclination after two minutes and eight minutes of work, respectively.
GROUP B : -
AT 2 MINUTES AND 8 MINUTES (AVERAGES)
Z = 6.9 - 0 6.9 5.4 = 0.788
47
8.756
The result is statistically significant at the 1% confidence level of prediction. (<.01 **)
There is a significant difference between the model and the experimental group; experimental group B were definitely moving and not sitting at 90° trunk inclination after two minutes and eight minutes of work respectively.

CATEGORY : - TRUNK INCLINATION
TEST THREE :
TO TEST WHETHER OR NOT GROUP A DATA IS SIGNIFICANTLY DIFFERENT TO GROUP B DATA
S = STANDARD DEVIATION
Hor
Hi/
u
u
A = u
A ^ u
B
B
THE TWO SAMPLES ARE STATISTICALLY LARGE NUMBERS
Z = X A X B
S 2^A +
n a
2 MINUTE POSITIONS :-
Z = 108.9 - 107
102 47
114 47
= '89
S 2_B
n b
1.9
2.143
The result is close to the mean expectancy of a normally distributed population.
There is no significant difference between Group A or Group B data at the two minutes sitting position.
8 MINUTES POSITIONS : -
110.1
1 106.09 47
-
+
107.6
122 47
= 2.5 4.853
= .52
The result is close to the mean expectancy of a normally distributed population.
There is no significant difference between Group A or Group B data at the eight minutes sitting positions.
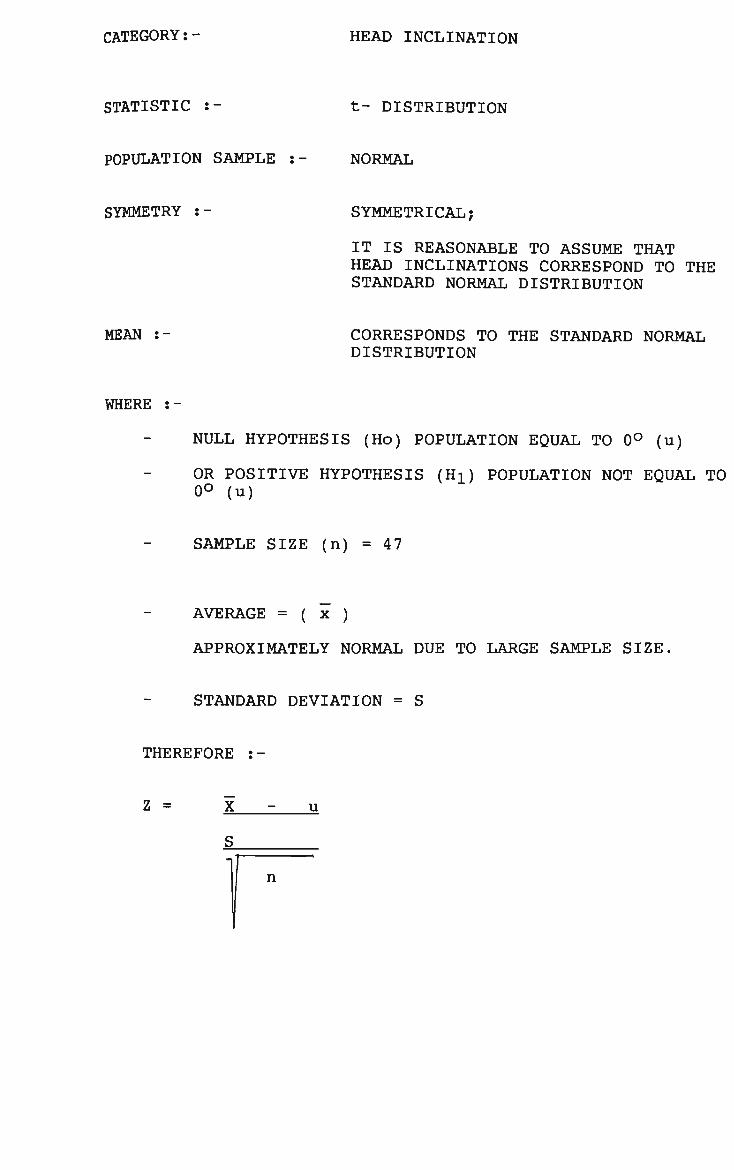
CATEGORY:- HEAD INCLINATION
STATISTIC :- t- DISTRIBUTION
POPULATION SAMPLE :- NORMAL
SYMMETRY :- SYMMETRICAL;
IT IS REASONABLE TO ASSUME THAT HEAD INCLINATIONS CORRESPOND TO THE STANDARD NORMAL DISTRIBUTION
MEAN :- CORRESPONDS TO THE STANDARD NORMAL DISTRIBUTION
WHERE :-
NULL HYPOTHESIS (Ho) POPULATION EQUAL TO 0° (u)
OR POSITIVE HYPOTHESIS (Hi) POPULATION NOT EQUAL TO 0° (u)
SAMPLE SIZE (n) = 47
AVERAGE = ( x )
APPROXIMATELY NORMAL DUE TO LARGE SAMPLE SIZE.
STANDARD DEVIATION = S
THEREFORE :-
Z = X - u
S
n
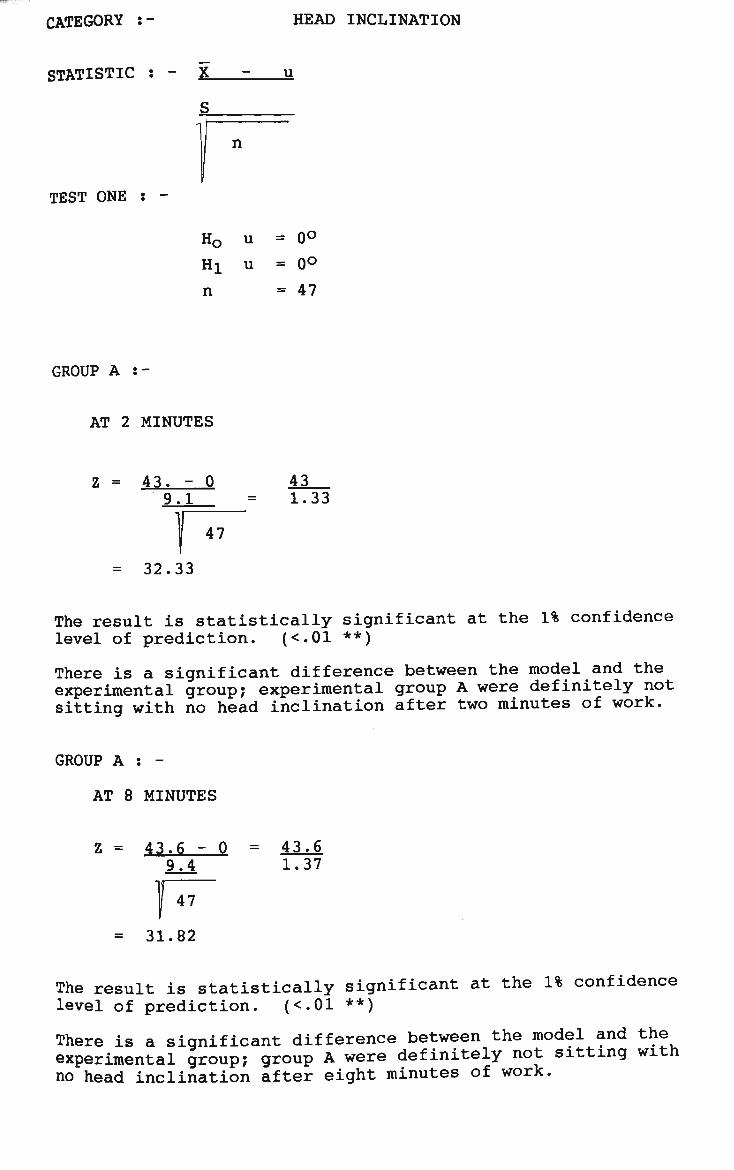
CATEGORY :
STATISTIC - X
HEAD INCLINATION
u
n
TEST ONE : -
Hf
GROUP A :-
AT 2 MINUTES
Z = 43. - 0 9.1
T 47 = 32.33
u = 0° Hi u = 0°
n =47
43 1.33
The result is statistically significant at the 1% confidence level of prediction. (<.01 **)
There is a significant difference between the model and the experimental group; experimental group A were definitely not sitting with no head inclination after two minutes of work.
GROUP A : -
AT 8 MINUTES
Z = 43.6-0 = 9.4
| 47
= 31.82
= 43.6 1.37
The result is statistically significant at the 1% confidence level of prediction. (<.01 **)
There is a significant difference between the model and the experimental group; group A were definitely not sitting with no head inclination after eight minutes of work.
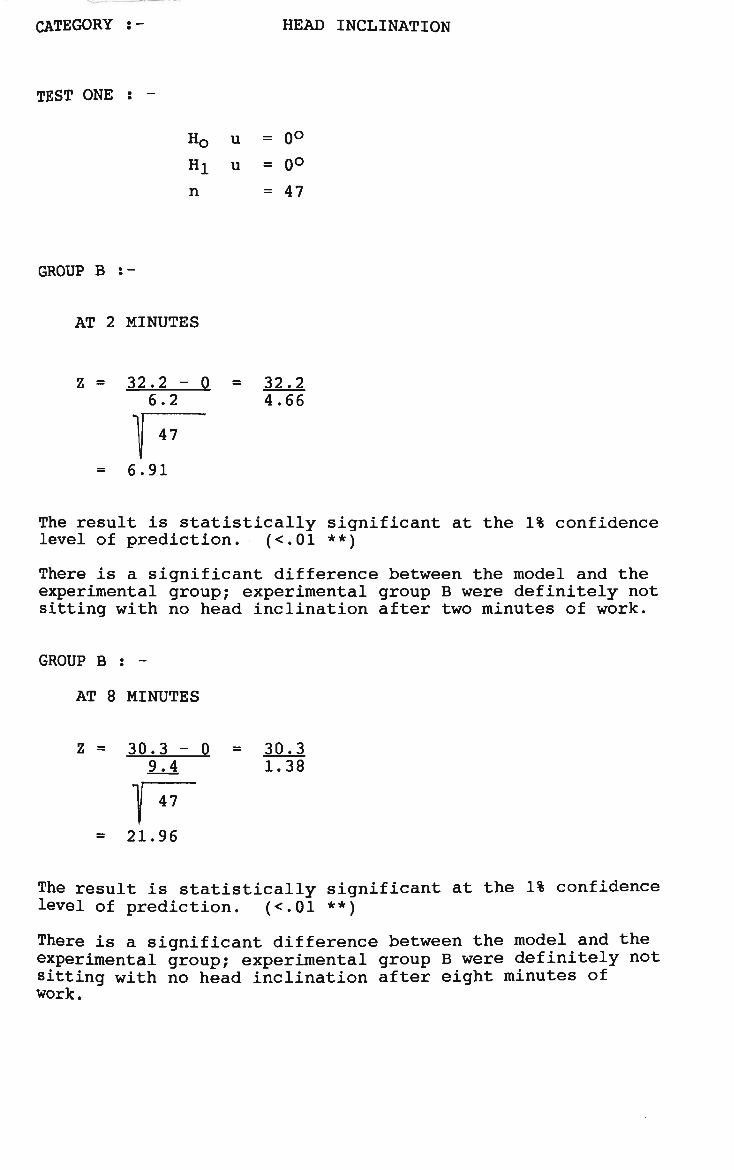
CATEGORY :- HEAD INCLINATION
TEST ONE : -
H0 u = 0°
Hi u = 0°
n =47
GROUP B :-
AT 2 MINUTES
Z = 32.2 - 0 6.2
P~ = 6.91
The result is statistically significant at the 1% confidence level of prediction. (<.01 **)
There is a significant difference between the model and the experimental group; experimental group B were definitely not sitting with no head inclination after two minutes of work.
GROUP B : -
AT 8 MINUTES
Z = 30.3 - 0 9.4
p~ = 21.96
The result is statistically significant at the 1% confidence level of prediction. (<.01 **)
There is a significant difference between the model and the experimental group; experimental group B were definitely not sitting with no head inclination after eight minutes of work.
= 32.2 4.66
= 30.3 1.38
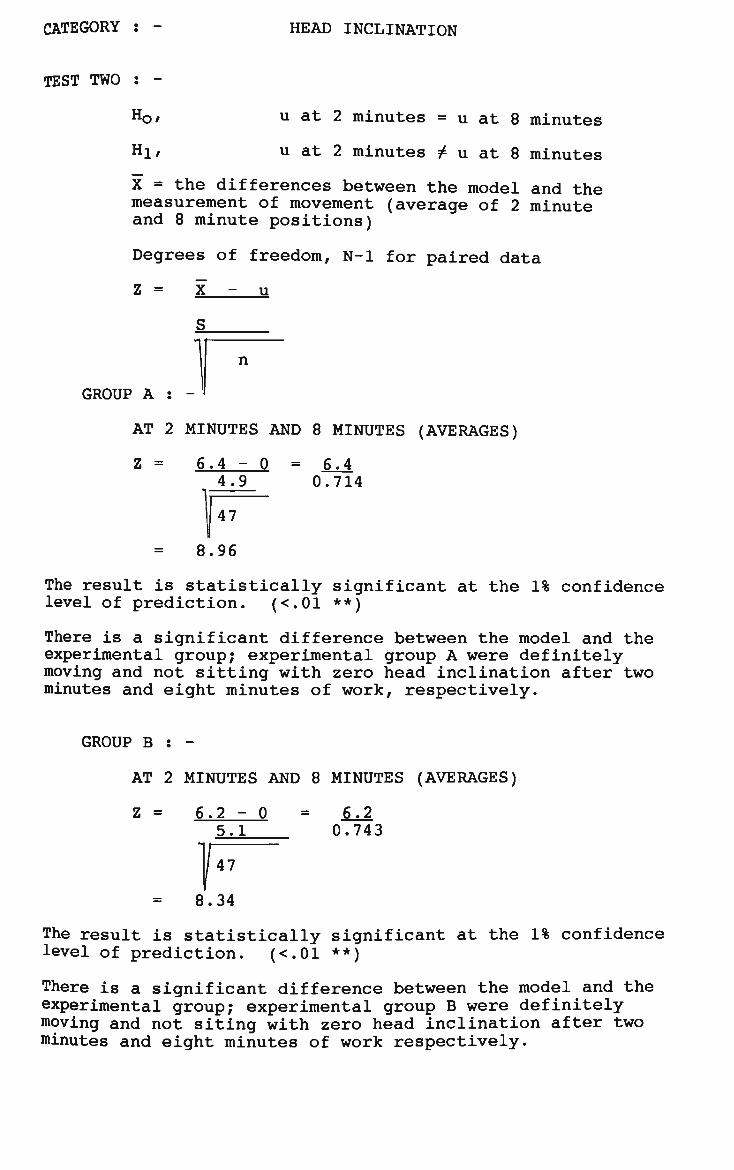
CATEGORY : - HEAD INCLINATION
TEST TWO : -
Ho/ u at 2 minutes = u at 8 minutes
Hl, u at 2 minutes # u at 8 minutes
X = the differences between the model and the measurement of movement (average of 2 minute and 8 minute positions)
Degrees of freedom, N-l for paired data
Z = X - u
S
n
GROUP A : -
AT 2 MINUTES AND 8 MINUTES (AVERAGES)
Z = 6.4 - 0 = 6_s_4 4.9 0.714
47
8.96
The result is statistically significant at the 1% confidence level of prediction. (<.01 **)
There is a significant difference between the model and the experimental group; experimental group A were definitely moving and not sitting with zero head inclination after two minutes and eight minutes of work, respectively.
GROUP B : -
AT 2 MINUTES AND 8 MINUTES (AVERAGES)
Z = 6.2 - 0 = 6.2 5.1 0.743
47
8.34
The result is statistically significant at the 1% confidence level of prediction. (<.01 **)
There is a significant difference between the model and the experimental group; experimental group B were definitely moving and not siting with zero head inclination after two minutes and eight minutes of work respectively.
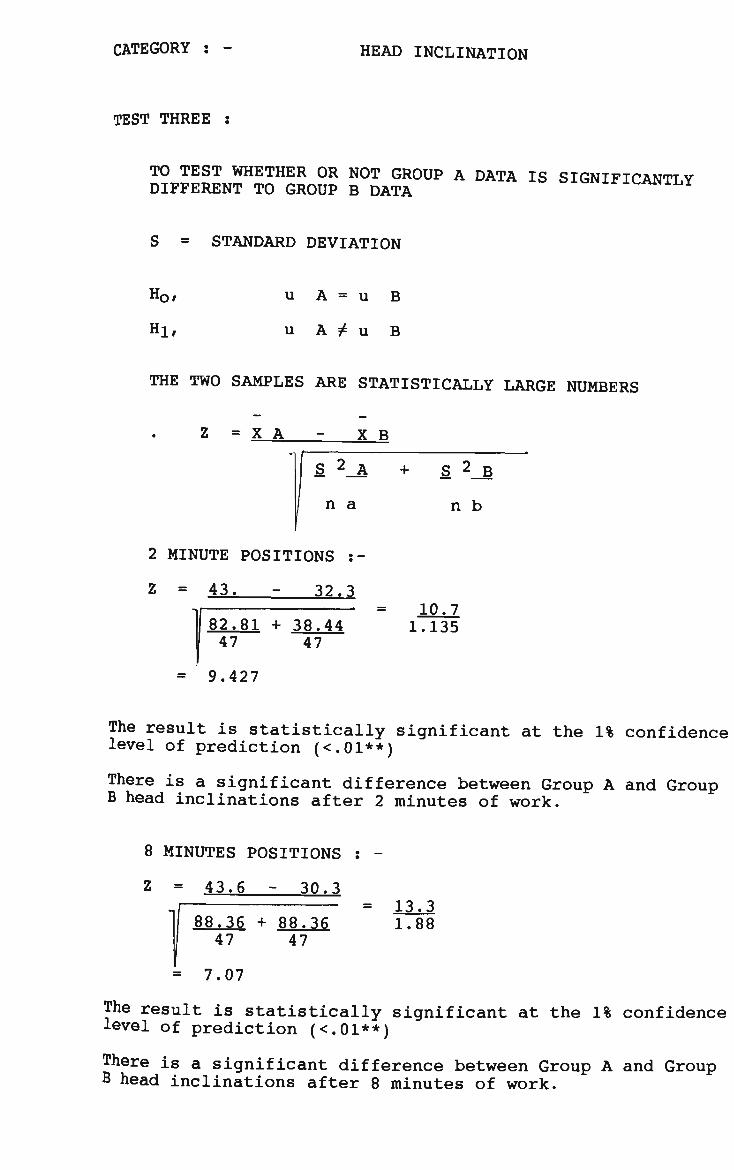
CATEGORY : - HEAD INCLINATION
TEST THREE :
TO TEST WHETHER OR NOT GROUP A DATA IS SIGNIFICANTLY DIFFERENT TO GROUP B DATA JA-AMXIJX
S = STANDARD DEVIATION
Ho/
Hi,
u
u
A = u
A ^ u
B
B
THE TWO SAMPLES ARE STATISTICALLY LARGE NUMBERS
Z = X A X B
S 2_A + S 2__B
n a n b
2 MINUTE POSITIONS :•
Z = 43. - 32.3
82.81 + 38.44 47 47
10.7 1.135
= 9.427
The result is statistically significant at the 1% confidence level of prediction (<.01**)
There is a significant difference between Group A and Group B head inclinations after 2 minutes of work.
8 MINUTES POSITIONS : -
Z = 43.6 - 30.3
1 88.36 + 88.36 ' 47 47
= 7.07
= 13.3 1.88
The result is statistically significant at the 1% confidence level of prediction (<.01**)
There is a significant difference between Group A and Group B head inclinations after 8 minutes of work.

CATEGORY:- ARM FLEXION
STATISTIC :- t- DISTRIBUTION
POPULATION SAMPLE :- NORMAL
SYMMETRY :- SYMMETRICAL;
IT IS REASONABLE TO ASSUME THAT ARM FLEXIONS CORRESPOND TO THE STANDARD NORMAL DISTRIBUTION.
MEAN :- CORRESPONDS TO THE STANDARD NORMAL DISTRIBUTION.
WHERE :-
NULL HYPOTHESIS (Ho) POPULATION EQUAL TO 90° (u)
OR POSITIVE HYPOTHESIS (Hi) POPULATION NOT EQUAL TO
90° (u)
SAMPLE SIZE (n) = 47
AVERAGE = ( x )
APPROXIMATELY NORMAL DUE TO LARGE SAMPLE SIZE.
STANDARD DEVIATION = S
THEREFORE :-
Z = X - u
S
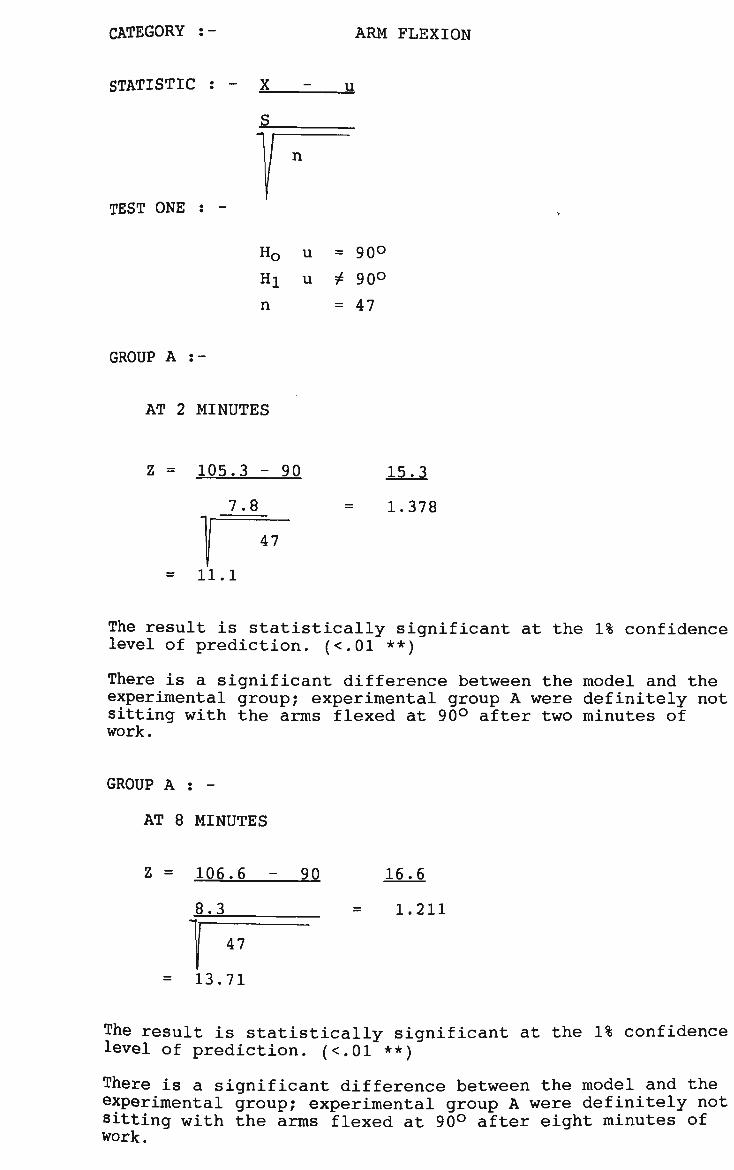
CATEGORY :- ARM FLEXION
STATISTIC : - X_ u
n
TEST ONE : -
H0 u = 90°
Hi u + 90°
n =47
GROUP A :-
AT 2 MINUTES
z = 105.3 -
7.8
90 15.3
1.378
47
= 11.1
The result is statistically significant at the 1% confidence level of prediction. (<.01 **)
There is a significant difference between the model and the experimental group; experimental group A were definitely not sitting with the arms flexed at 90° after two minutes of work.
GROUP A : -
AT 8 MINUTES
Z = 106.6 -
=
8.3
| ,7
1 13.71
90 16.6
1.211
The result is statistically significant at the 1% confidence level of prediction. (<.01 **)
There is a significant difference between the model and the experimental group; experimental group A were definitely not sitting with the arms flexed at 90° after eight minutes of work.
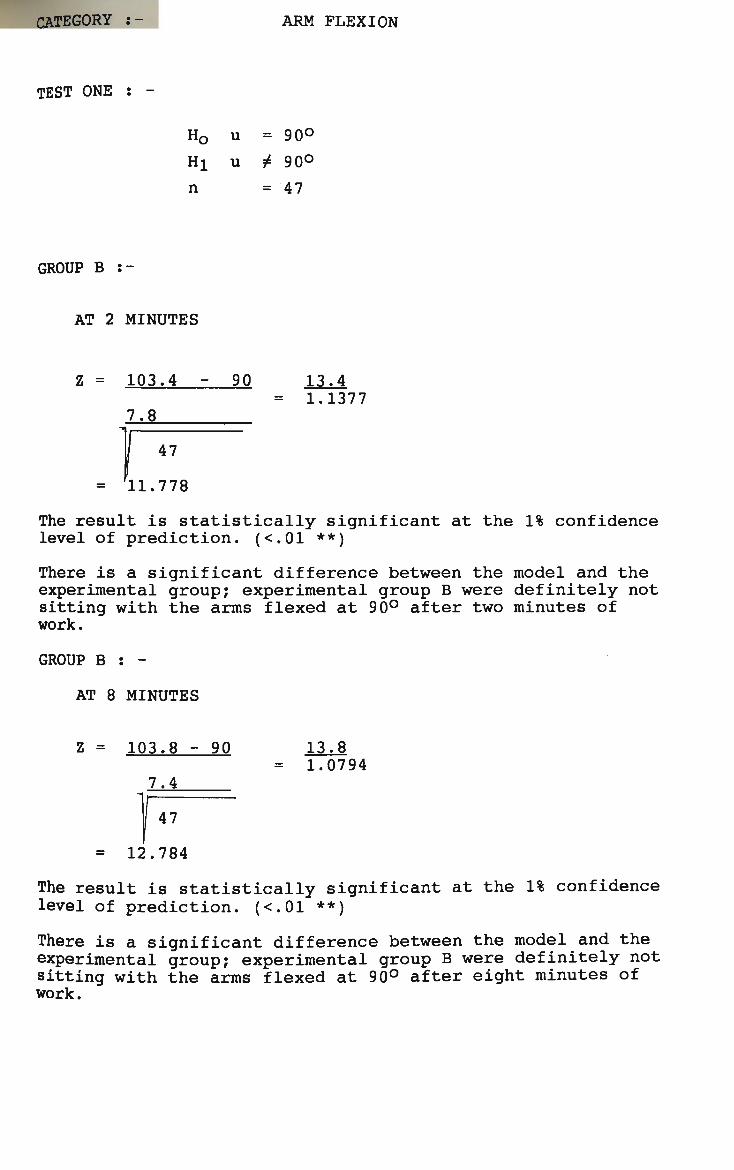
CATEGORY :- ARM FLEXION
TEST ONE : -
Ho
Hi n
u
u
= 90°
± 90°
= 47
GROUP B :
AT 2 MINUTES
103.4 -
7.8
j . , 11.778
90 13.4 = 1.1377
The result is statistically significant at the 1% confidence level of prediction. (<.01 **)
There is a significant difference between the model and the experimental group; experimental group B were definitely not sitting with the arms flexed at 90° after two minutes of work.
GROUP B
AT 8
Z =
=
• — •
MINUTES
103.8 - 90
U
7.4 .
(47
.784
13.8 = 1.0794
The result is statistically significant at the 1% confidence level of prediction. (<.01 **)
There is a significant difference between the model and the experimental group; experimental group B were definitely not sitting with the arms flexed at 90° after eight minutes of work.
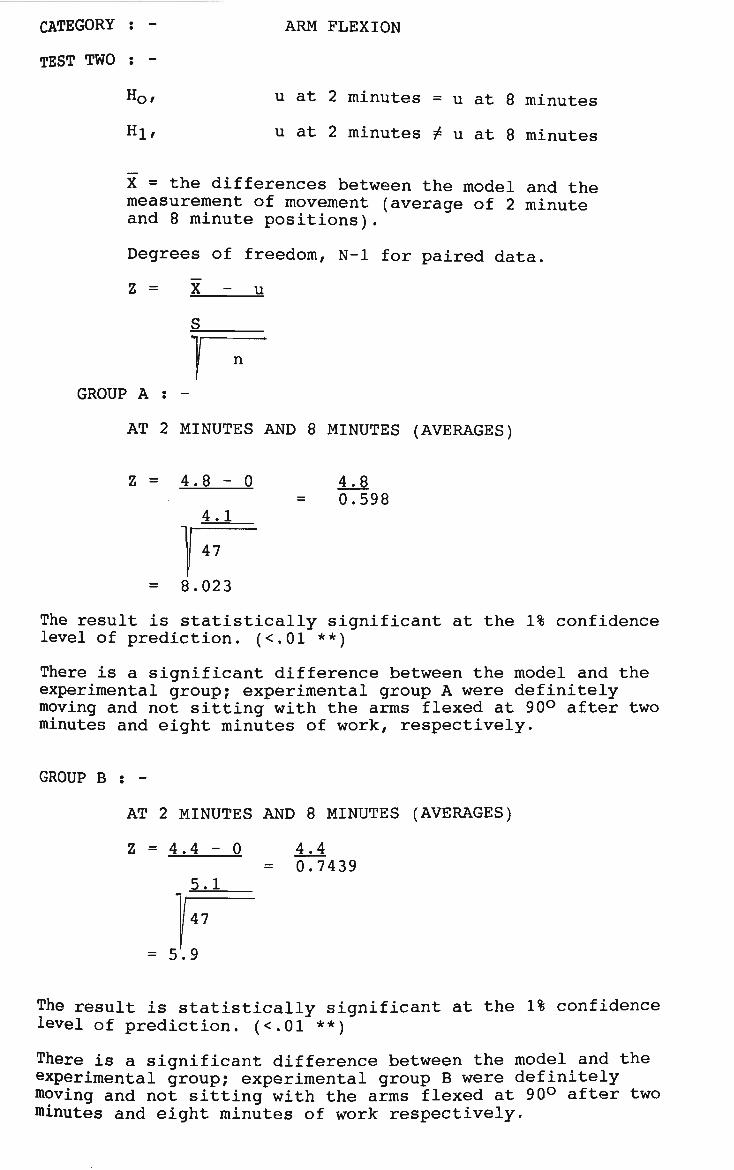
CATEGORY : - ARM FLEXION
TEST TWO : -
HQ,
Hi,
u at 2 minutes = u at 8 minutes
u at 2 minutes ^ u at 8 minutes
X = the differences between the model and the measurement of movement (average of 2 minute and 8 minute positions).
Degrees of freedom, N-l for paired data.
Z = X - u
T n
GROUP A : -
AT 2 MINUTES AND 8 MINUTES (AVERAGES)
z = 4
t
. 8 - 0
4.1
47
.023
4.8 0.598
The result is statistically significant at the 1% confidence level of prediction. (<.01 **)
There is a significant difference between the model and the experimental group; experimental group A were definitely moving and not sitting with the arms flexed at 90° after two minutes and eight minutes of work, respectively.
GROUP B : -
AT 2 MINUTES AND 8 MINUTES (AVERAGES)
Z = 4.4 - 0
5.1
4.4 = 0.7439
47
= 5.9
The result is statistically significant at the 1% confidence level of prediction. (<.01 **)
There is a significant difference between the model and the experimental group; experimental group B were definitely moving and not sitting with the arms flexed at 90° after two minutes and eight minutes of work respectively.

CATETORY : - ARM FLEXION
TEST THREE :
TO TEST WHETHER OR NOT GROUP A DATA IS SIGNIFICANTLY DIFFERENT TO GROUP B DATA
S = STANDARD DEVIATION
H°, u A = u B
H1, u A ^ u B
THE TWO SAMPLES ARE STATISTICALLY LARGE NUMBERS
Z = X A - X B
I S 2_^A + S 2_B
I n a n b
2 MINUTE POSITIONS :-
Z = 105.3 - 103.4
60.84 + 60.84 47 47
1.18
There is no significant difference between Group A or Group B data at the two minute sitting positions. (<.10 *)
8 MINUTES POSITIONS : -
Z = 106.6 - 103.8 2.8 v = 1.622 68.89 + 54.76 47 47
1.73
There is no significant difference between Group A or Group B data at the eight minute sitting positions. (<.10 *)
1.9 1.609
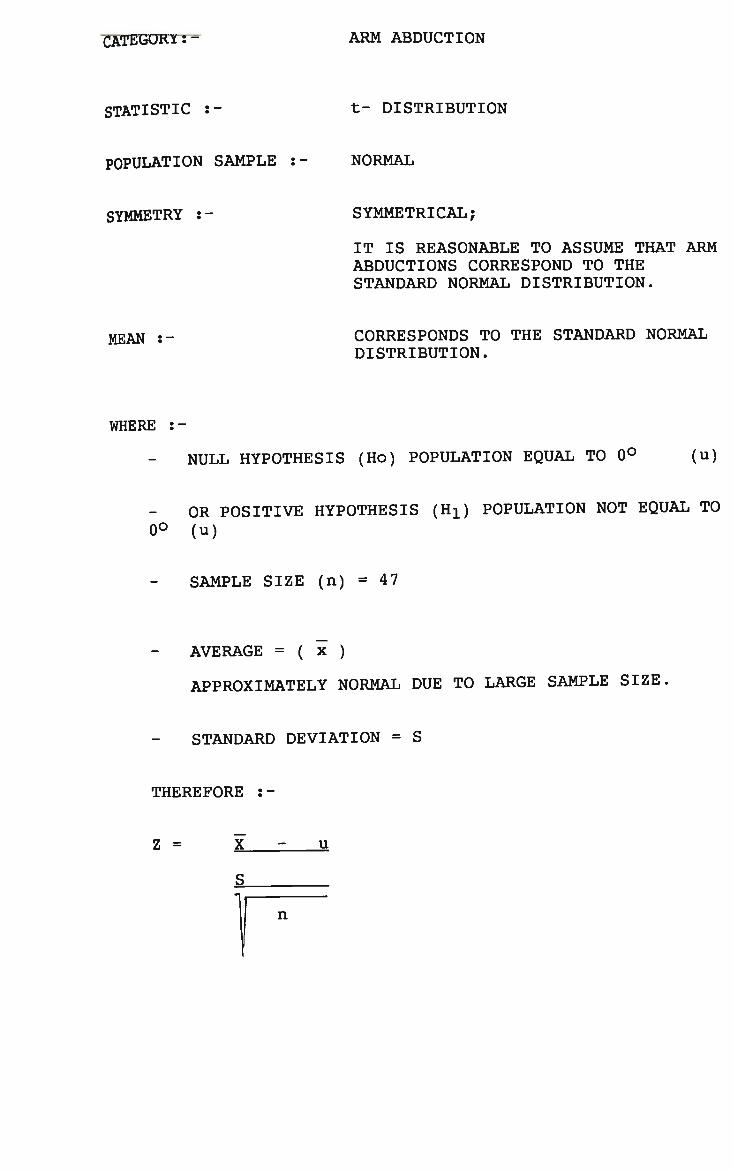
CATEGUKY: ARM ABDUCTION
STATISTIC :-
POPULATION SAMPLE
SYMMETRY :-
t- DISTRIBUTION
NORMAL
SYMMETRICAL;
IT IS REASONABLE TO ASSUME THAT ARM ABDUCTIONS CORRESPOND TO THE STANDARD NORMAL DISTRIBUTION.
MEAN :- CORRESPONDS TO THE STANDARD NORMAL DISTRIBUTION.
WHERE :-
NULL HYPOTHESIS (Ho) POPULATION EQUAL TO 0° (u)
OR POSITIVE HYPOTHESIS (Hi) POPULATION NOT EQUAL TO 0° (u)
SAMPLE SIZE (n) = 47
AVERAGE = ( x )
APPROXIMATELY NORMAL DUE TO LARGE SAMPLE SIZE
STANDARD DEVIATION = S
THEREFORE :-
Z = u
n
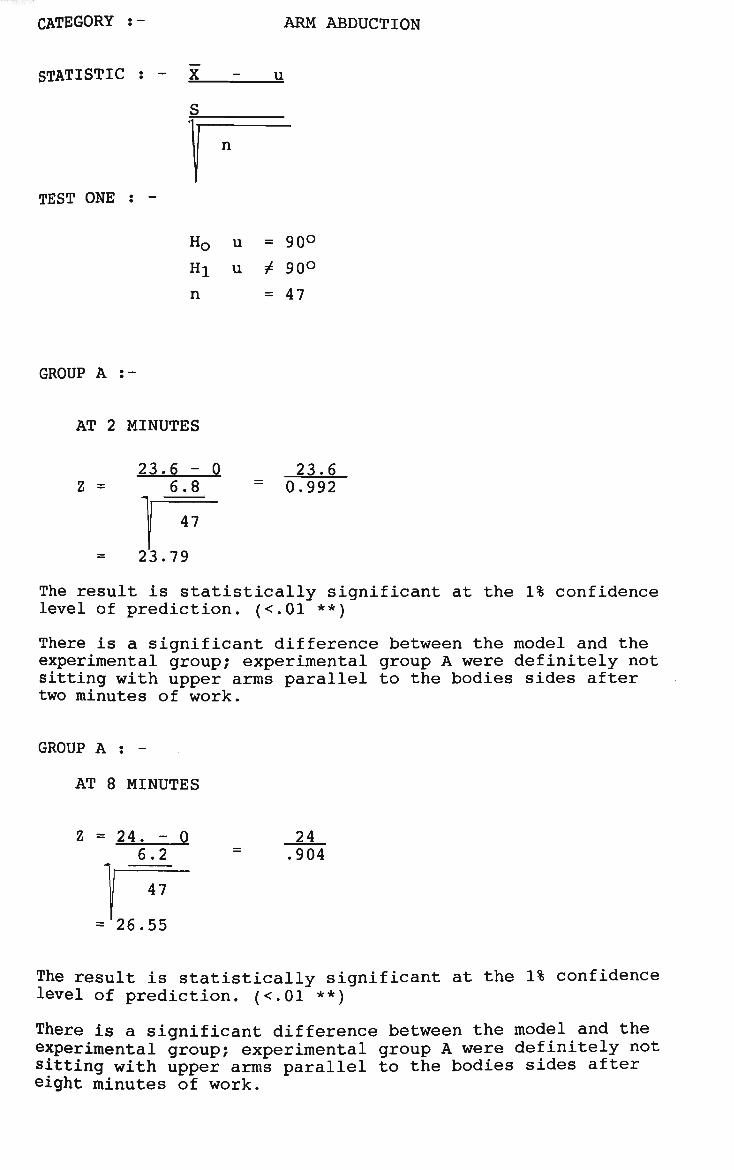
CATEGORY :- ARM ABDUCTION
STATISTIC - X u
TEST ONE
GROUP A :-
n
Ho
Hi n
u
u = 90° ± 90° = 47
AT 2 MINUTES
23.6 0 Z = 6.8
23.6 0.992
47
23.79
The result is statistically significant at the 1% confidence level of prediction. (<.01 **)
There is a significant difference between the model and the experimental group; experimental group A were definitely not sitting with upper arms parallel to the bodies sides after two minutes of work.
GROUP A ; -
AT 8 MINUTES
24 .904
The result is statistically significant at the 1% confidence level of prediction. (<.01 **)
There is a significant difference between the model and the experimental group; experimental group A were definitely not sitting with upper arms parallel to the bodies sides after eight minutes of work.

CATEGORY :- ARM ABDUCTION
X - u
S
r~ H0 u = 90° Hi u ^ 90° n =47
GROUP B :-
AT 2 MINUTES
Z = 24.9 - 0 5.8
p = 29.43
The result is statistically significant at the 1% confidence level of prediction. (<.01 **)
There is a significant difference between the model and the experimental group; experimental group B were definitely not sitting with upper arms parallel to the bodies sides after two minutes of work.
GROUP B : -
AT 8 MINUTES
Z = 25.0 25 6.1 = 0.889
'nr = 28.12
The result is statistically significant at the 1% confidence level of prediction. (<.01 **)
There is a significant difference between the model and the experimental group; experimental group B were definitely not sitting with upper arms parallel to the bodies sides after eight minutes of work.
STATISTIC : -
TEST ONE : -
24.9 .846
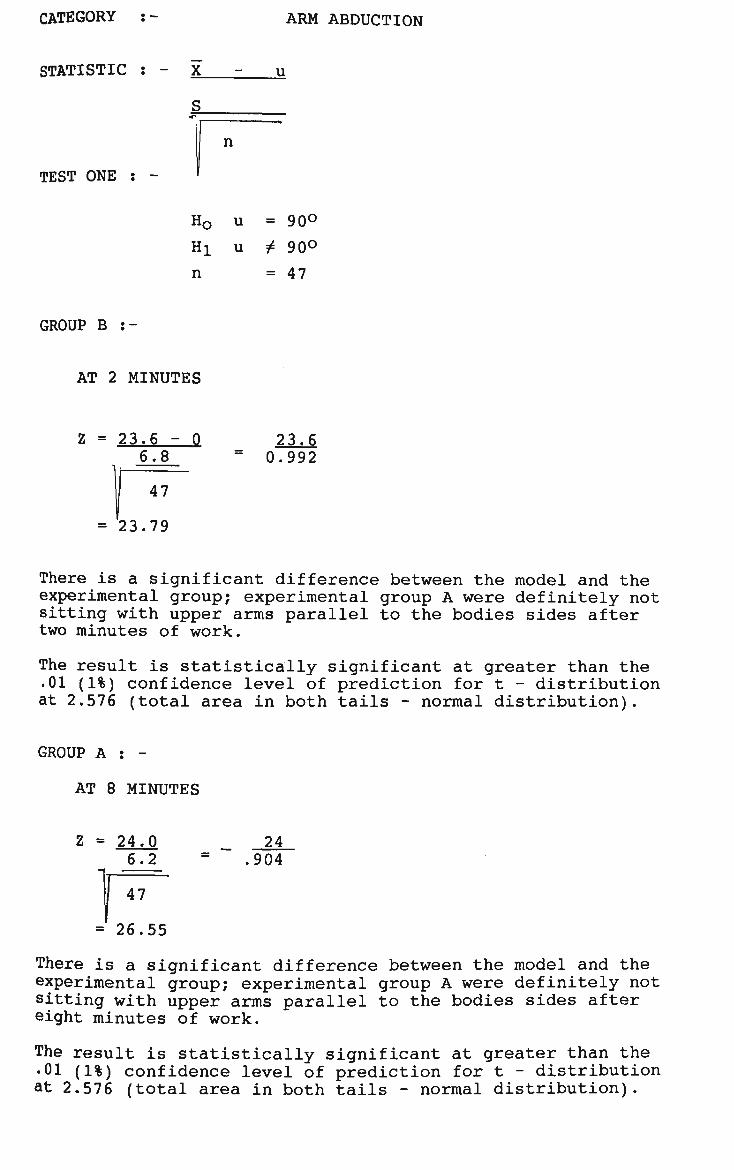
CATEGORY : - ARM ABDUCTION
STATISTIC - X u
TEST ONE
n
GROUP B :-
Hr u = 90°
Hi u ± 90°
n =47
AT 2 MINUTES
z = 23.6 -6.8
1" 23.79
0 23.6 = 0.992
There is a significant difference between the model and the experimental group; experimental group A were definitely not sitting with upper arms parallel to the bodies sides after two minutes of work. The result is statistically significant at greater than the .01 (1%) confidence level of prediction for t - distribution at 2.576 (total area in both tails - normal distribution).
rp A * •
AT 8 MINUTES
Z =
=
24.0 6.2
1 47
26.55
24 .904
There is a significant difference between the model and the experimental group; experimental group A were definitely not sitting with upper arms parallel to the bodies sides after eight minutes of work. The result is statistically significant at greater than the •01 (1%) confidence level of prediction for t - distribution at 2.576 (total area in both tails - normal distribution).
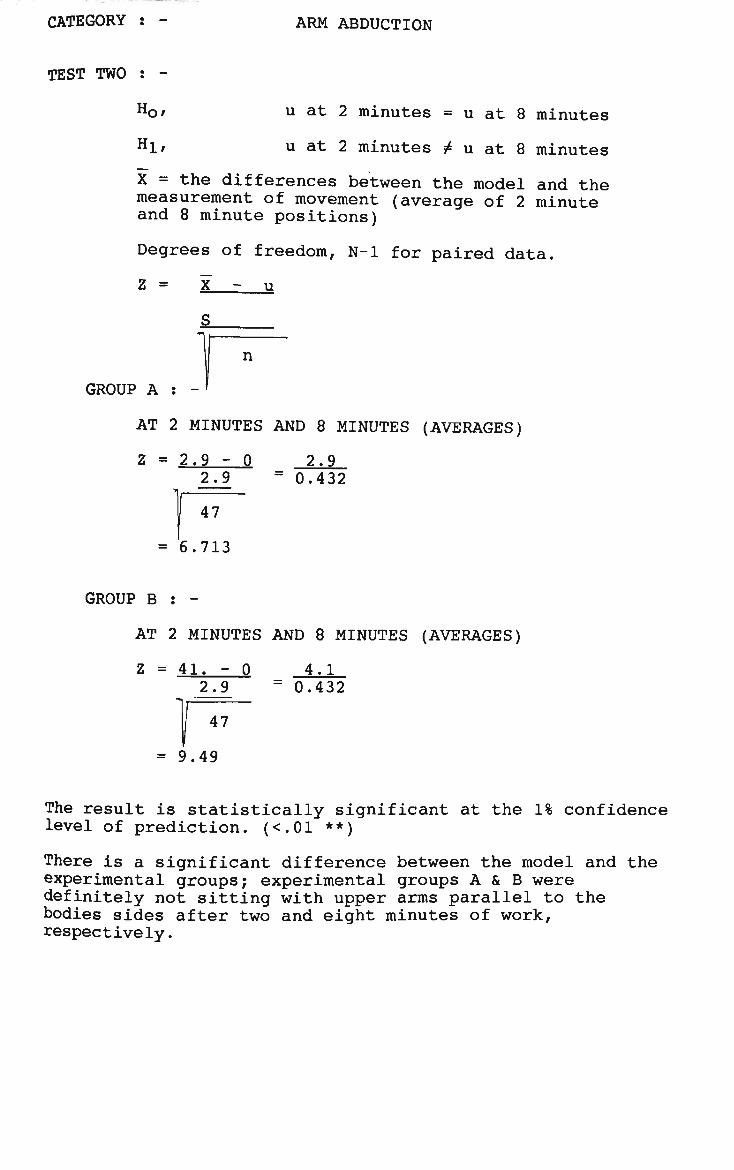
CATEGORY : - ARM ABDUCTION
TEST TWO
H Of
Hi
u at 2 minutes = u at 8 minutes
u at 2 minutes ^ u at 8 minutes
X = the differences between the model and the measurement of movement (average of 2 minute and 8 minute positions)
Degrees of freedom, N-l for paired data.
Z = X - u
n
GROUP A : -
AT 2 MINUTES AND 8 MINUTES (AVERAGES)
>l
2.9 - 0 2.9
1 47 6.713
2.9 = 0.432
GROUP B : -
AT 2 MINUTES AND 8 MINUTES (AVERAGES)
Z = 41. - 0 4.1 2.9 = 0.432
47
= 9.49
The result is statistically significant at the 1% confidence level of prediction. (<.01 **)
There is a significant difference between the model and the experimental groups; experimental groups A & B were definitely not sitting with upper arms parallel to the bodies sides after two and eight minutes of work, respectively.
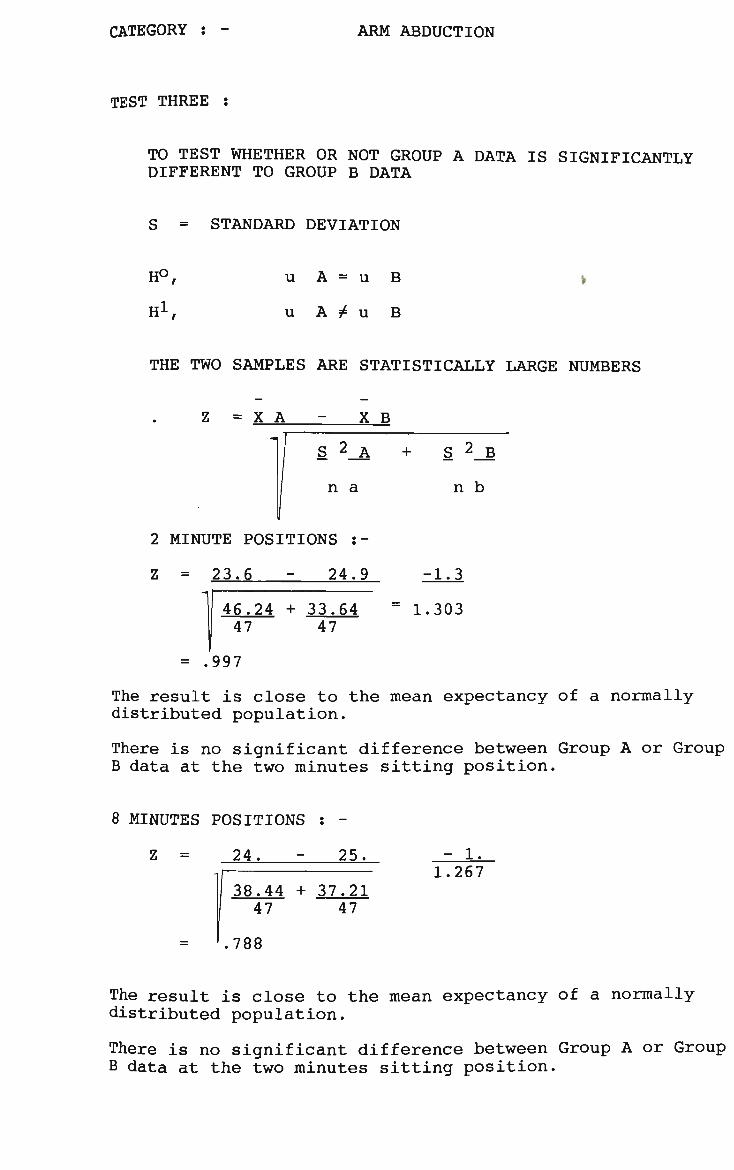
CATEGORY : - ARM ABDUCTION
TEST THREE :
TO TEST WHETHER OR NOT GROUP A DATA IS SIGNIFICANTLY DIFFERENT TO GROUP B DATA
S = STANDARD DEVIATION
H°,
Hi,
u A = u B
u A $ u B
THE TWO SAMPLES ARE STATISTICALLY LARGE NUMBERS
Z = X A X B
S 2^A + S 2_B
n a n b
2 MINUTE POSITIONS :-
Z = 23.6 - 24.9 -1.3
46.24 + 33.64 = 1.303 47 47
= .997
The result is close to the mean expectancy of a normally distributed population.
There is no significant difference between Group A or Group B data at the two minutes sitting position.
8 MINUTES POSITIONS : -
Z = 24. - 25. - 1. 1.267
38.44 + 37.21 47 47
.788
The result is close to the mean expectancy of a normally distributed population.
There is no significant difference between Group A or Group B data at the two minutes sitting position.
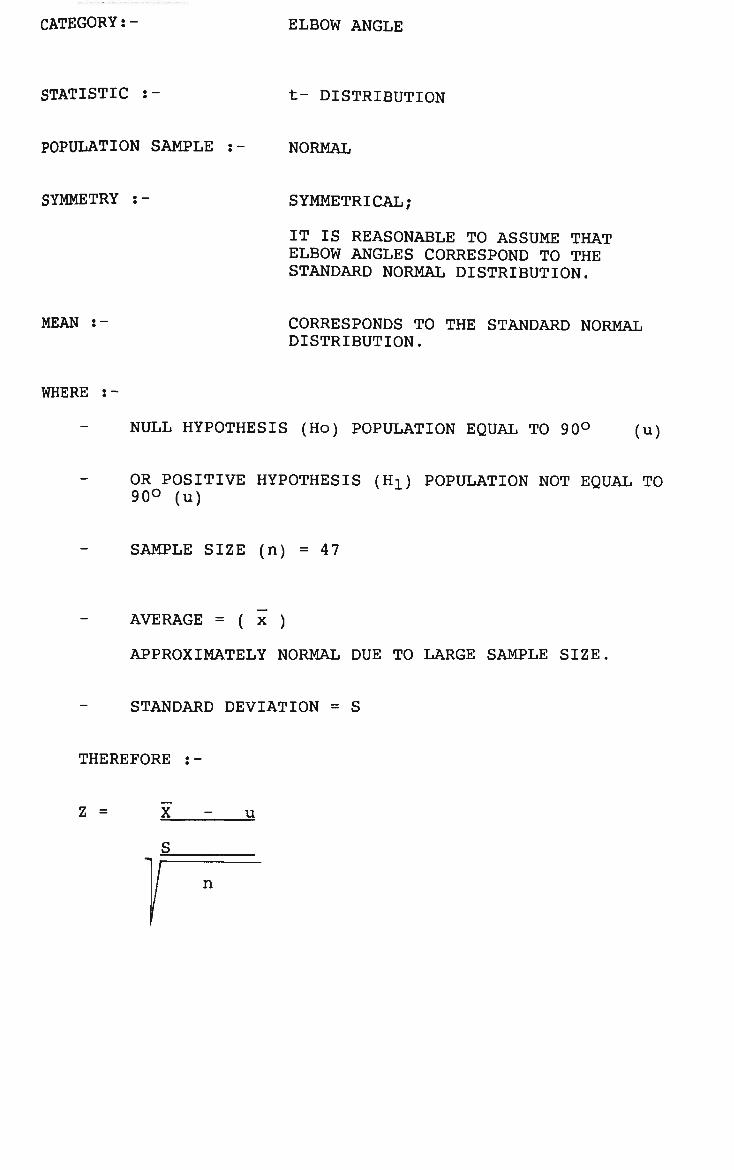
CATEGORY:- ELBOW ANGLE
STATISTIC :- t- DISTRIBUTION
POPULATION SAMPLE : NORMAL
SYMMETRY :- SYMMETRICAL;
IT IS REASONABLE TO ASSUME THAT ELBOW ANGLES CORRESPOND TO THE STANDARD NORMAL DISTRIBUTION.
MEAN :- CORRESPONDS TO THE STANDARD NORMAL DISTRIBUTION.
WHERE :
NULL HYPOTHESIS (Ho) POPULATION EQUAL TO 90° (u)
OR POSITIVE HYPOTHESIS (Hi) POPULATION NOT EQUAL TO 90° (u)
SAMPLE SIZE (n) = 47
AVERAGE = ( x )
APPROXIMATELY NORMAL DUE TO LARGE SAMPLE SIZE
STANDARD DEVIATION = S
THEREFORE :-
Z = u
n
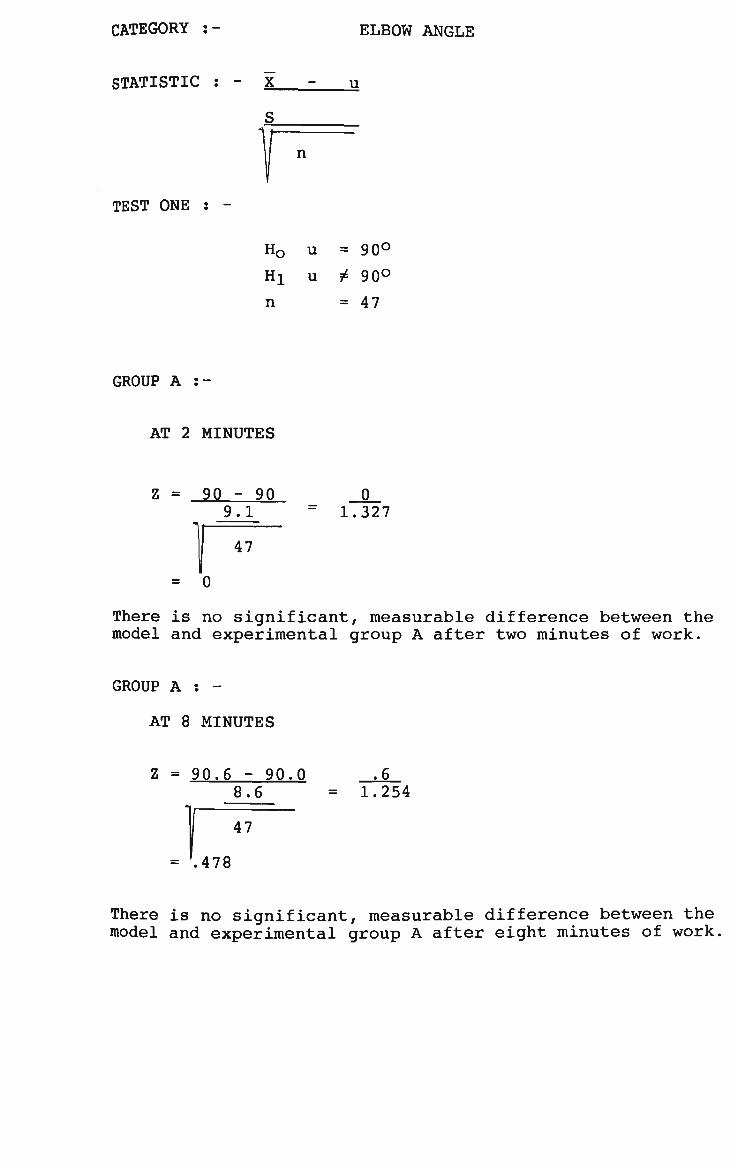
CATEGORY :- ELBOW ANGLE
STATISTIC - X u
n
TEST ONE : -
Hr
GROUP A :-
AT 2 MINUTES
Z = 90 - 90 9.1
47
= 0
u = 90°
Hi u ^ 90°
n =47
0 = 1.327
There is no significant, measurable difference between the model and experimental group A after two minutes of work.
GROUP A : -
AT 8 MINUTES
Z = 90.6 - 90.0 8.6
.6 = 1.254
47
= .478
There is no significant, measurable difference between the model and experimental group A after eight minutes of work.

CATEGORY :- ELBOW ANGLE
TEST ONE : -
H0 u = 90°
Hi u ^ 90°
n =47
GROUP B :-
AT 2 MINUTES
Z = 97.1 - 90 16.7
= 4.55
The result is statistically significant at the 1% confidence level of prediction. (<.01 **)
The result is diametrically opposed to that recorded for Group A after two minutes of work.
There is a significant, measurable difference between the model and experimental group. Group B were definitely not sitting with the elbow joint flexed at 90° after two minutes of work.
GROUP B : -
AT 8 MINUTES
Z = 97.0 - 90 7.0 10.8 = 1.575
47
= 4.444
The result is statistically significant at the 1% confidence level of prediction. (<.01 **)
The result is diametrically opposed to that recorded for Group A after two minutes of work.
There is a significant, measurable difference between the model and experimental group B were definitely not sitting with the elbow joint flexed at 90° after eight minutes of work.
7.1 = 1.561
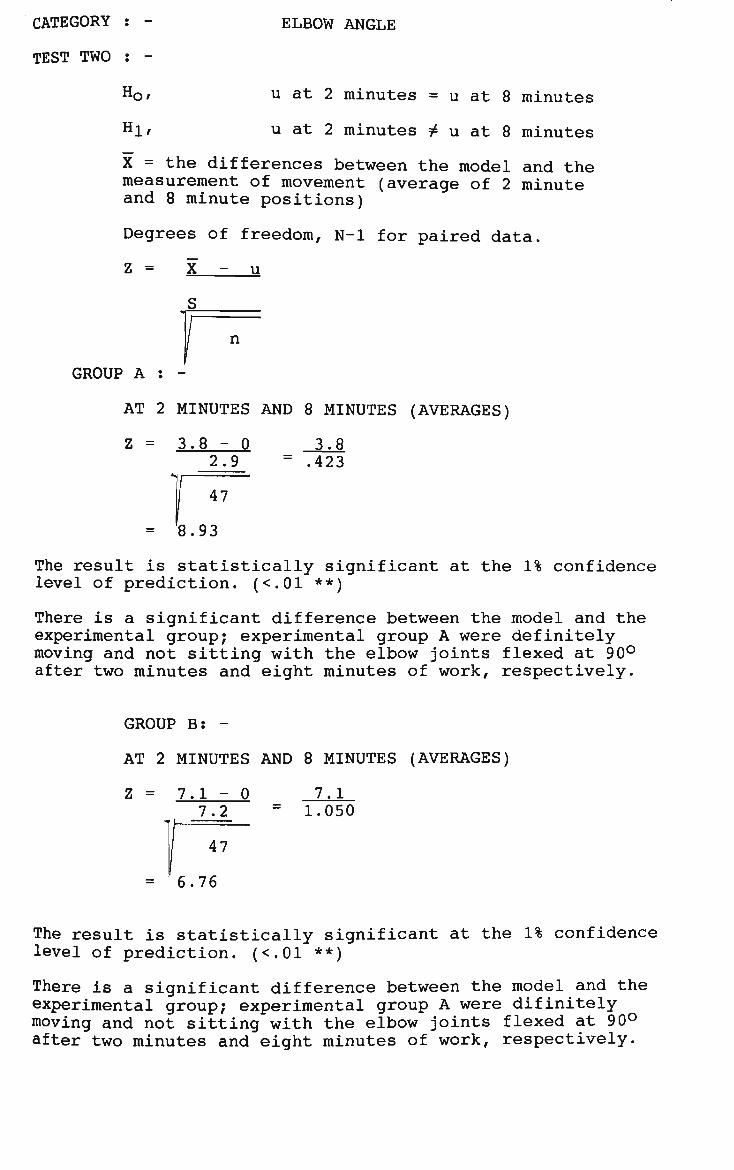
CATEGORY : - ELBOW ANGLE
TEST TWO : -
Ho/ u at 2 minutes = u at 8 minutes
Hl# u at 2 minutes ± u at 8 minutes
X = the differences between the model and the measurement of movement (average of 2 minute and 8 minute positions)
Degrees of freedom, N-l for paired data.
Z = X - u
S
GROUP A : -
AT 2 MINUTES AND 8 MINUTES (AVERAGES)
Z = 3.8 - 0 3.8 2.9 = .423
= 8.93
The result is statistically significant at the 1% confidence level of prediction. (<.01 **)
There is a significant difference between the model and the experimental group; experimental group A were definitely moving and not sitting with the elbow joints flexed at 90° after two minutes and eight minutes of work, respectively.
GROUP B: -
AT 2 MINUTES AND 8 MINUTES (AVERAGES)
Z = 7.1 - 0 7.1 7.2 = 1.050
pr = 6.76
The result is statistically significant at the 1% confidence level of prediction. (<.01 **)
There is a significant difference between the model and the experimental group; experimental group A were difinitely moving and not sitting with the elbow joints flexed at 90° after two minutes and eight minutes of work, respectively.
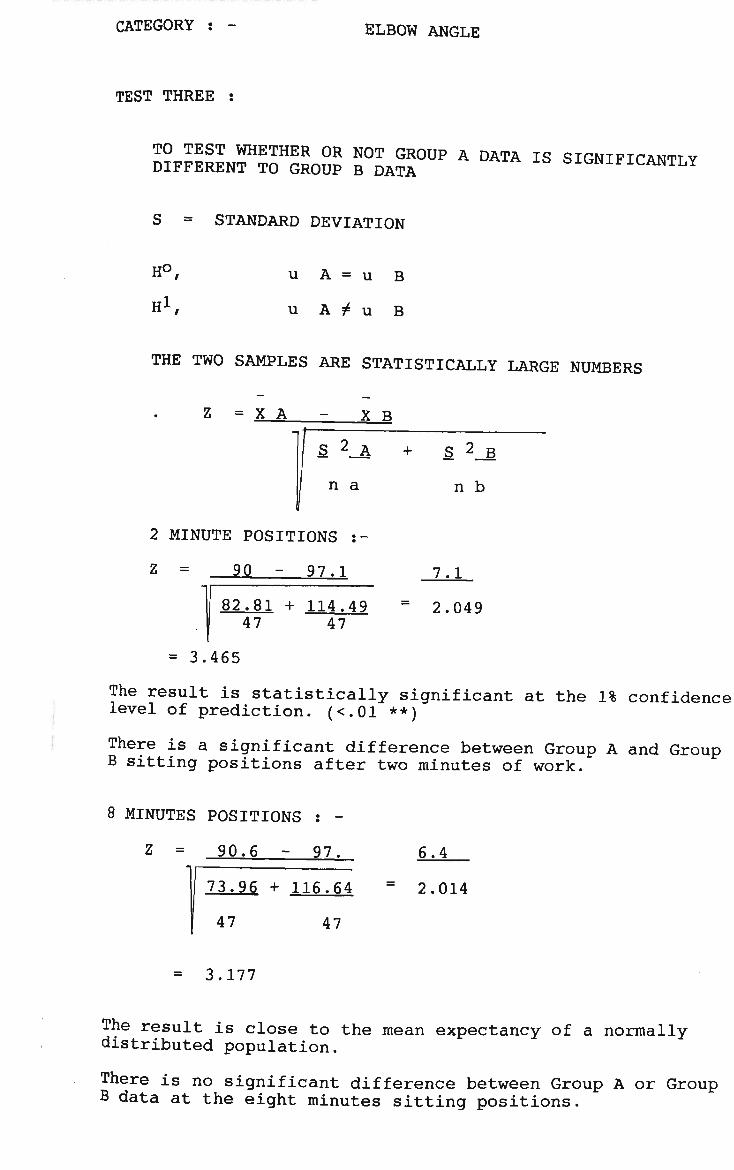
CATEGORY : ELBOW ANGLE
TEST THREE :
TO TEST WHETHER OR NOT GROUP A DATA IS SIGNIFICANTLY DIFFERENT TO GROUP B DATA ^ ^ 1 * XLANTLY
S = STANDARD DEVIATION
H°,
Hi,
u
u
A = u
A ^ u
B
B
THE TWO SAMPLES ARE STATISTICALLY LARGE NUMBERS
Z = X A X B
S 2^A + £ 2_B
n a n b
2 MINUTE POSITIONS :-
Z = 90 - 97.1
82.81 + 114.49 47 47
7.1
2.049
= 3.465
The result is statistically significant at the 1% confidence level of prediction. (<.01 **)
There is a significant difference between Group A and Group B sitting positions after two minutes of work.
8 MINUTES POSITIONS : -
z = 90.6 - 97.
73.96 + 116.64
47 47
6.4
2.014
= 3.177
The result is close to the mean expectancy of a normally distributed population.
There is no significant difference between Group A or Group B data at the eight minutes sitting positions.
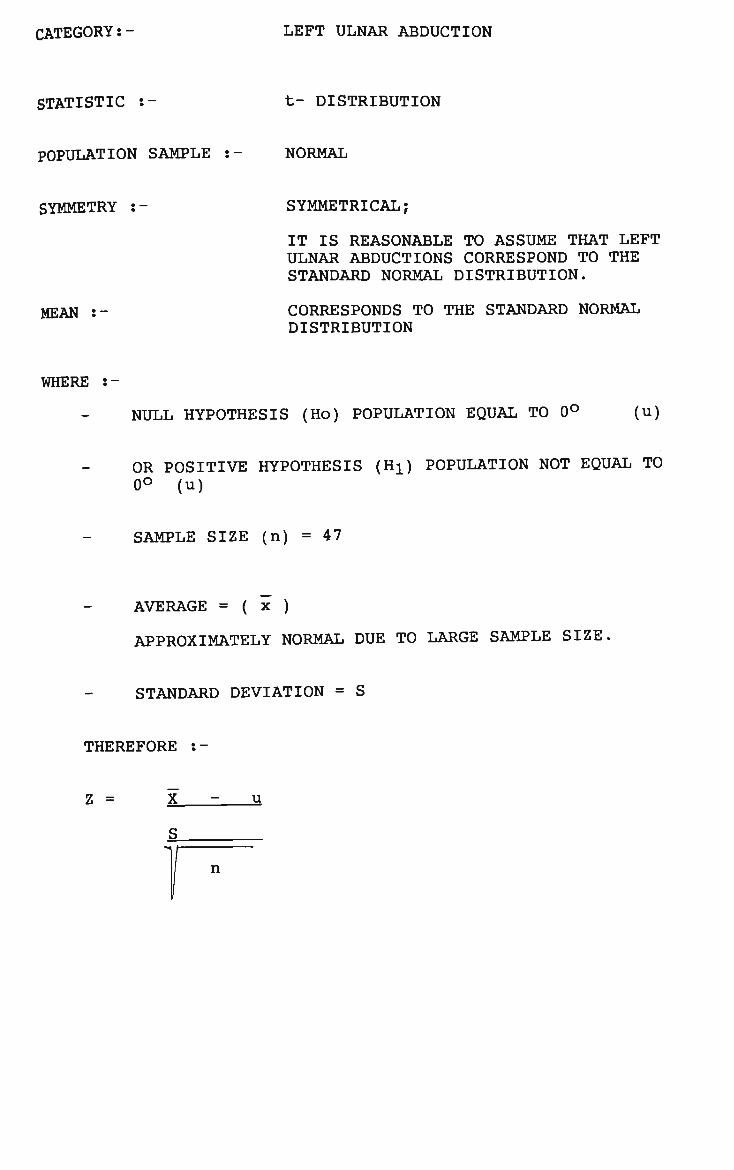
CATEGORY:- LEFT ULNAR ABDUCTION
STATISTIC :- t- DISTRIBUTION
POPULATION SAMPLE :- NORMAL
SYMMETRY :- SYMMETRICAL;
IT IS REASONABLE TO ASSUME THAT LEFT ULNAR ABDUCTIONS CORRESPOND TO THE STANDARD NORMAL DISTRIBUTION.
MEAN :- CORRESPONDS TO THE STANDARD NORMAL DISTRIBUTION
WHERE :-
NULL HYPOTHESIS (Ho) POPULATION EQUAL TO 0° (u)
OR POSITIVE HYPOTHESIS (Hi) POPULATION NOT EQUAL TO 0° (u)
SAMPLE SIZE (n) = 47
AVERAGE = ( x )
APPROXIMATELY NORMAL DUE TO LARGE SAMPLE SIZE.
STANDARD DEVIATION = S
THEREFORE :-
Z = X - u
S.
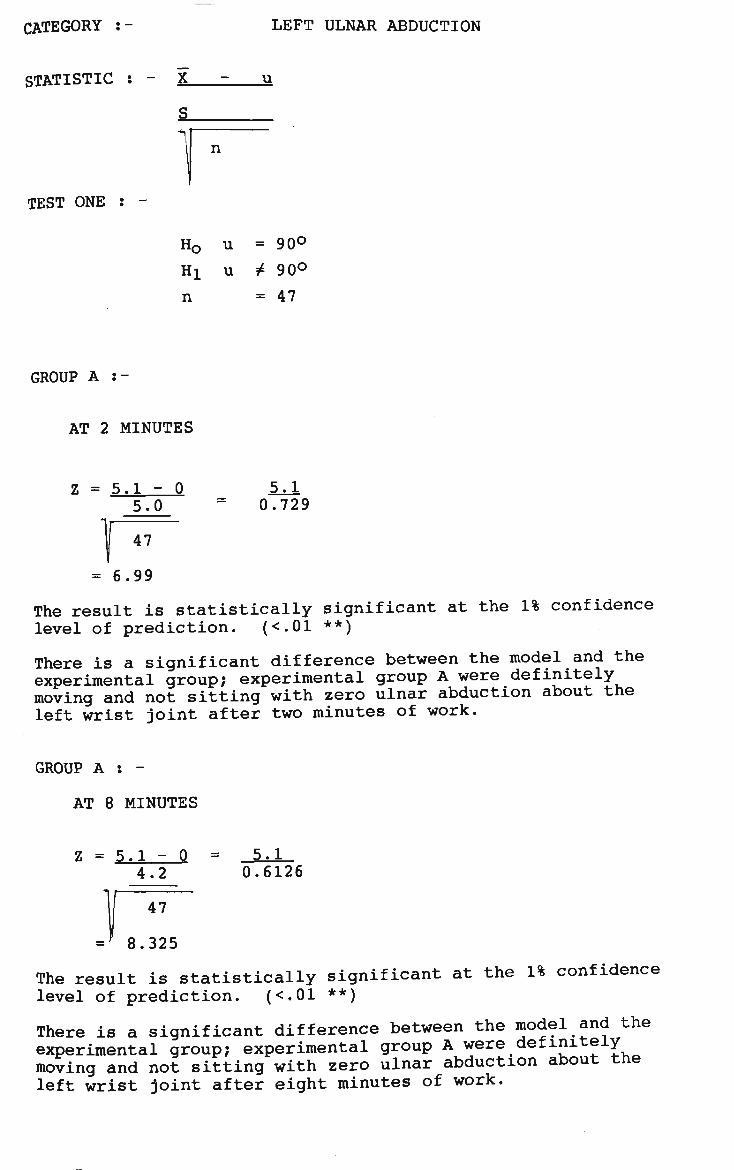
CATEGORY :- LEFT ULNAR ABDUCTION
STATISTIC : - X_ u
n
TEST ONE : -
H0 u = 90°
Hi u * 90°
n =47
GROUP A i-
AT 2 MINUTES
Z = 5.1 - 0 5.0
5.1 0.729
| 4 7
= 6.99
The result is statistically significant at the 1% confidence level of prediction. (<.01 **)
There is a significant difference between the model and the experimental group; experimental group A were definitely moving and not sitting with zero ulnar abduction about the left wrist joint after two minutes of work.
GROUP A : -
AT 8 MINUTES
Z = 5.1 - 0 4.2
5.1 0.6126
47
= ' 8.325
The result is statistically significant at the 1% confidence level of prediction. (<.01 **)
There is a significant difference between the model and the experimental group; experimental group A were definitely moving and not sitting with zero ulnar abduction about the left wrist joint after eight minutes of work.
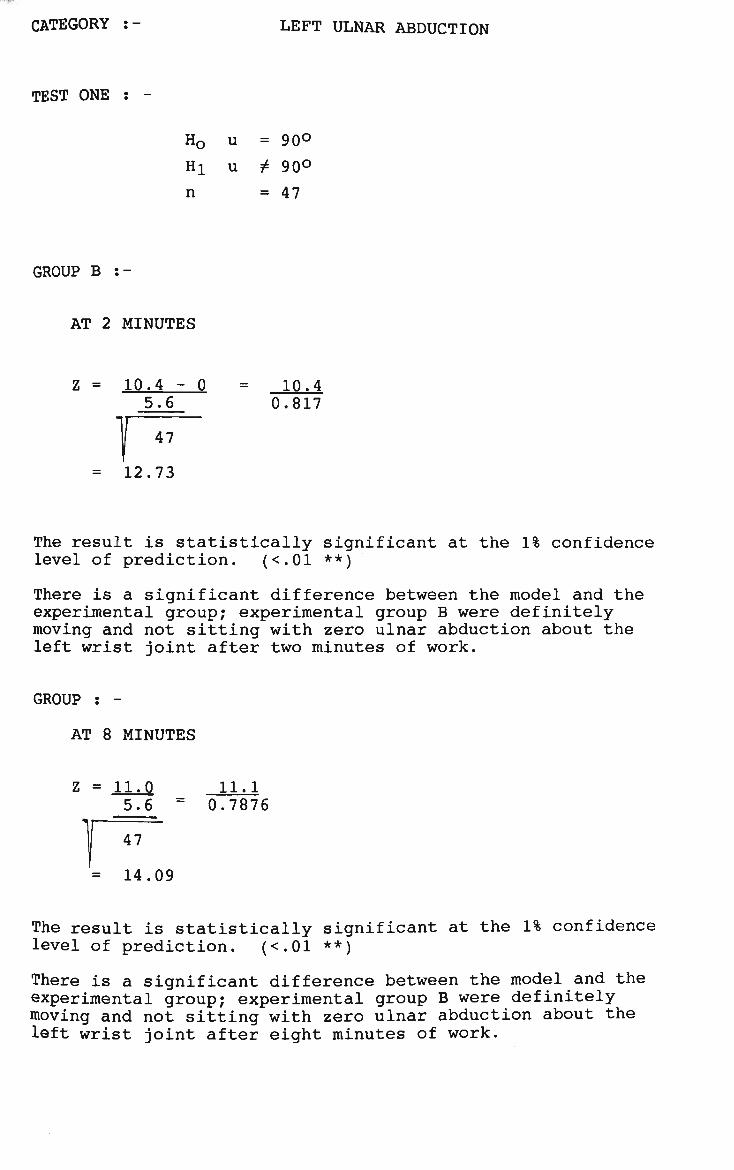
CATEGORY :- LEFT ULNAR ABDUCTION
TEST ONE : -
H0 u = 90°
Hi u * 90°
n =47
GROUP B :-
AT 2 MINUTES
Z = 10.4 - 0 = 10.4 5.6 0.817
P~ = 12.73
The result is statistically significant at the 1% confidence level of prediction. (<.01 **)
There is a significant difference between the model and the experimental group; experimental group B were definitely moving and not sitting with zero ulnar abduction about the left wrist joint after two minutes of work.
GROUP : -
AT 8 MINUTES
Z = 11.0 11.1 5.6 = 0.7876
p" = 14.09 The result is statistically significant at the 1% confidence
level of prediction. (<.01 **)
There is a significant difference between the model and the experimental group; experimental group B were definitely moving and not sitting with zero ulnar abduction about the left wrist joint after eight minutes of work.
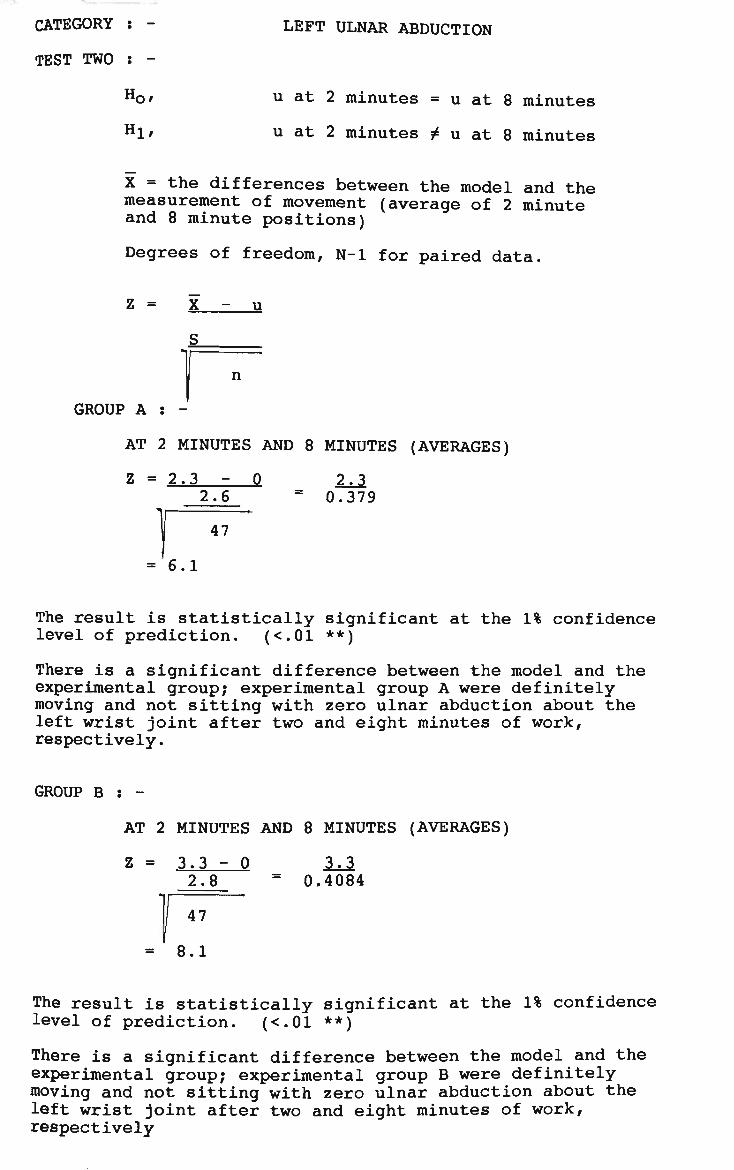
CATEGORY : - LEFT ULNAR ABDUCTION
TEST TWO : -
Ho* u at 2 minutes = u at 8 minutes
Hlf u at 2 minutes / u at 8 minutes
X = the differences between the model and the measurement of movement (average of 2 minute and 8 minute positions)
Degrees of freedom, N-l for paired data.
z = X - u
S
I n
GROUP A : -
AT 2 MINUTES AND 8 MINUTES (AVERAGES)
Z = 2.3 - 0 2.3 2.6 = 0.379
p~ = 6.1 The result is statistically significant at the 1% confidence
level of prediction. (<.01 **)
There is a significant difference between the model and the experimental group; experimental group A were definitely moving and not sitting with zero ulnar abduction about the left wrist joint after two and eight minutes of work, respectively.
GROUP B : -
AT 2 MINUTES AND 8 MINUTES (AVERAGES)
Z = 3.3 - 0 3.3 2.8 = 0.4084
= 8.1
The result is statistically significant at the 1% confidence level of prediction. (<.01 **)
There is a significant difference between the model and the experimental group; experimental group B were definitely moving and not sitting with zero ulnar abduction about the left wrist joint after two and eight minutes of work, respectively
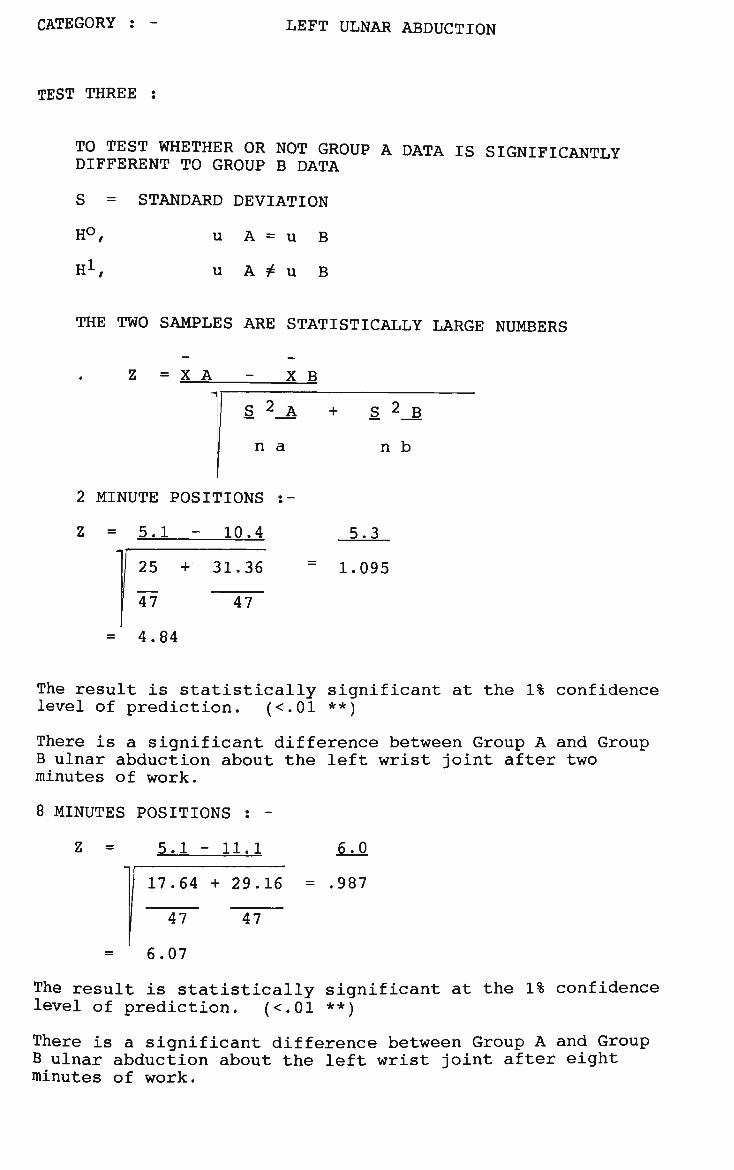
CATEGORY : - LEFT ULNAR ABDUCTION
TEST THREE :
TO TEST WHETHER OR NOT GROUP A DATA IS SIGNIFICANTLY DIFFERENT TO GROUP B DATA
S = STANDARD DEVIATION
H°, u A = u B
H- u A + u B
THE TWO SAMPLES ARE STATISTICALLY LARGE NUMBERS
Z = X A X B
S_ 2^A + S 2_B
n a n b
2 MINUTE POSITIONS :-
Z = 5.1 - 10.4
25 +• 31.36
47 47~
= 4.84
5.3
1.095
The result is statistically significant at the 1% confidence level of prediction. (<.01 **)
There is a significant difference between Group A and Group B ulnar abduction about the left wrist joint after two minutes of work.
8 MINUTES POSITIONS : •
Z = 5.1 - 11.1 6.0
17.64 + 29.16 = .987
47
6.07
47
The result is statistically significant at the 1% confidence level of prediction. (<.01 **)
There is a significant difference between Group A and Group B ulnar abduction about the left wrist joint after eight minutes of work.

PAGE XV SEATED WORKING POSTURE
H - Separate Histogram Summaries for Experimental Groups A and B, showing the Results for:-
body stature;
body mass;
age;
sex;
nationality.

AVERAGES BY SEX AND NATIONALITY
(GRAPHS)

HEIGHT DISTRIBUTION (MILLIMETRES)
1401 1451 1501 1551 i/,01 1651 1701 1751 1 S01 1851 1901 TO TO TO TO TO TO TO TO TO TO To" 1450 15UU 1550 1600 1650 1700 1750 1800 1850 1900 1950 TOT MIN MAX
1 27 1568 193S 0 31 1479 1778
1 58 1479 1938
0 16 1555 1750 0 3 1441 1607
AUSTRALIAN w GROUP A
r-oup B —
Sub Total
A8IAN GROUP A GROUP B
—
Bub Total
EUROPEAN GROUP A GROUP B
Sub Total
r)TF~
G...JUP A GROUP B
0 0
— 0
i)
i
i
o 0
0
o 0
f")
1
•i
I
f~)
o
0
0 0
0
0 1
0 •~p
• - '
o 1
1
o 0
.0
0 0
1 4
b
4 0
/L
0 I-)
*-\
1 0
£"'
8
13
1
6
Cj
4
4
0 7
4 8
12
"T
0 •--
3
i
o
1
0 0
5 5
—
10
4 0
4
1 >-\
'—'
1 0
4 "j£
6
C)
o
0
0 (")
Q
0
0
4 3 0 0
4 3
0 0 0 0
0 0
0 0 0 0
0 0
0 0 2 0
0 19 1441 1750
0 2 1683 1747 0 8 1568 1734
0 10 1568 1747
0 2 1570 1734 0 5 1479 1811
Sub Total O 1 0 1 2 0 1 0 2 0 0 7 1479 1811
SUMMARY
GROUP A 0 0 0 6 10 8 11 4 4 3 1 47 1555 1938 0
4
4
6
6
12
10
15
TCJ
8
8
16
11
7
18
5R0UP B 1 3 4 6 15 8 7 2 2 0 0 47 1441 1811
OVERALL 1 3 4 12 25 16 18 6 6 3 1 94 1441 1938
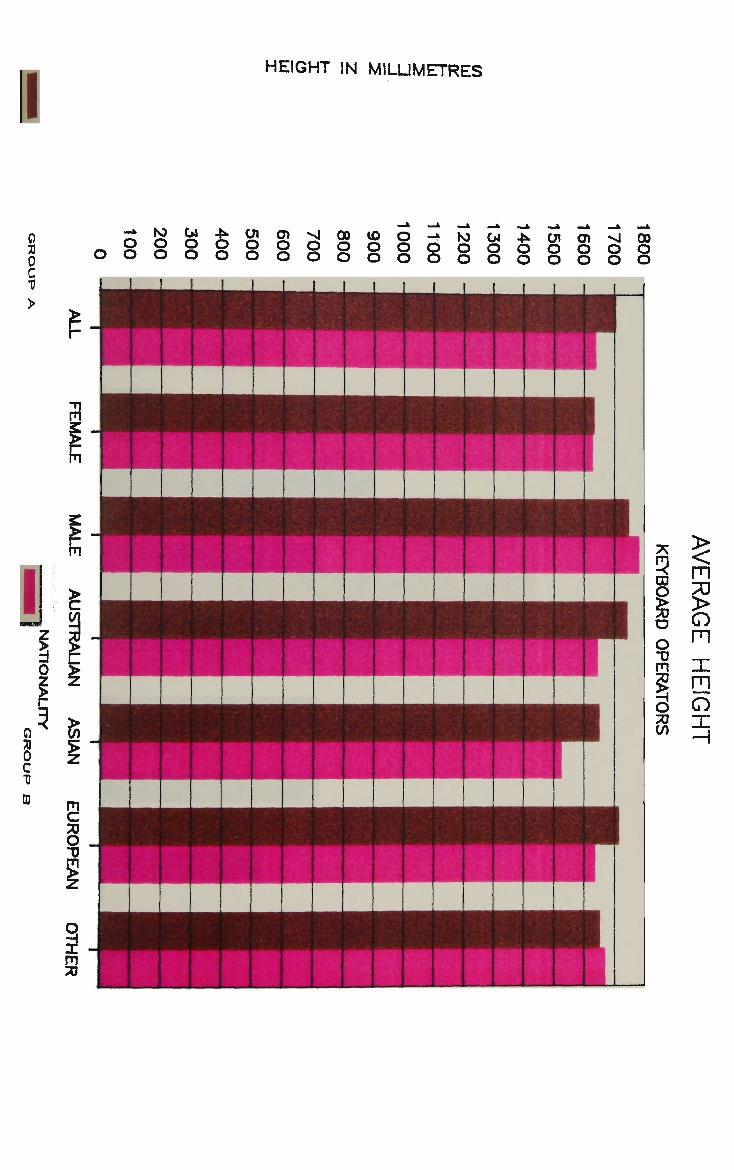
HEIGHT IN MILLIMETRES
0
0
c TJ
o o o o o o o o o o o o o o o o o o o
0
0
c "0 D
H a 1 11 |J m
£ c
ll 6 J 5] m I I
c o J 1 3 1
2
30
_ _ l _ _ j _ . _ I I l i I i i i i i i i i i [
[
1 1 1 I 1
B^H^M^HI {
^ ^ ^ 1
F J
r f i ^ ^ ^ ^ j j
HHHMHi 1 HI • ! H R
HI
!
|
ififef'fe'4; *-%T;i H 93
HBIi Hi i MMMi l
1 1
gfi BSHHI
;
H Mi
-i"-''-'Vii'' iHpii'"i fffrf>*f\. - t- • i"\'- -* *'*-; '•B-t'^.j'+I^i- J 4 •" V
j
i
— „, -l I _ , « — — i 1 .
CD O
5 o -u m
i 73 in
m >
m X m o T H
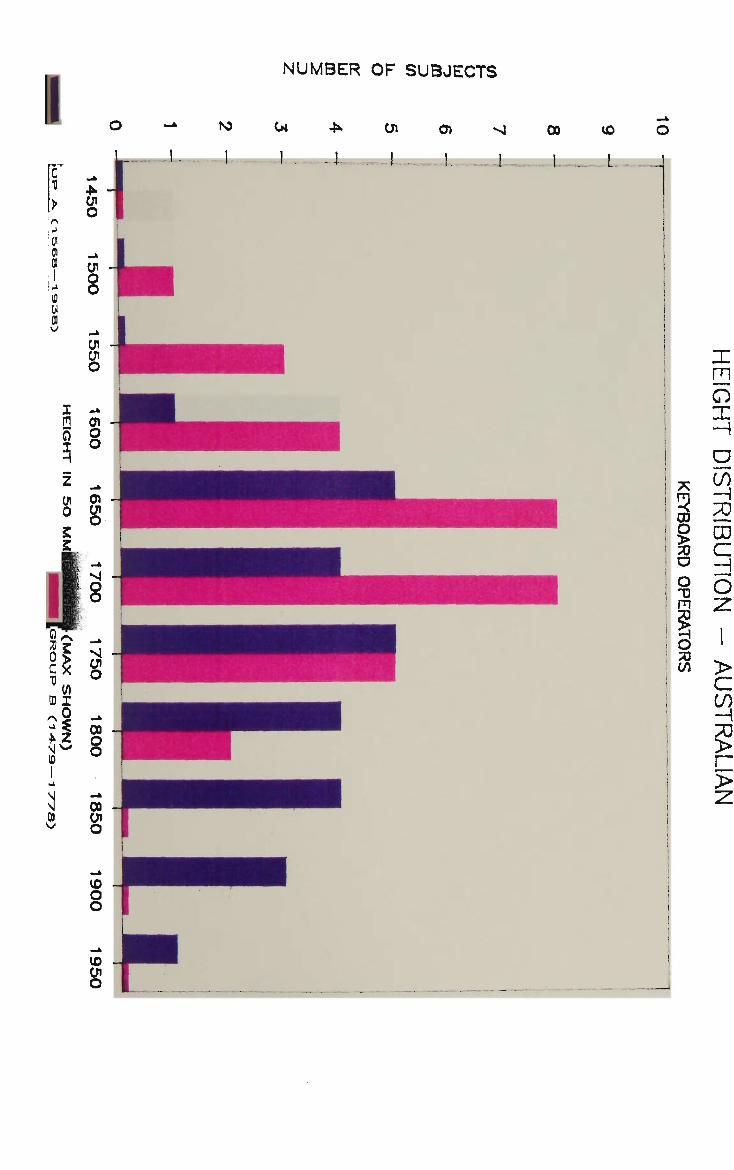
NUMBER OF SUBJECTS
O 73 O
i
O "0
m o
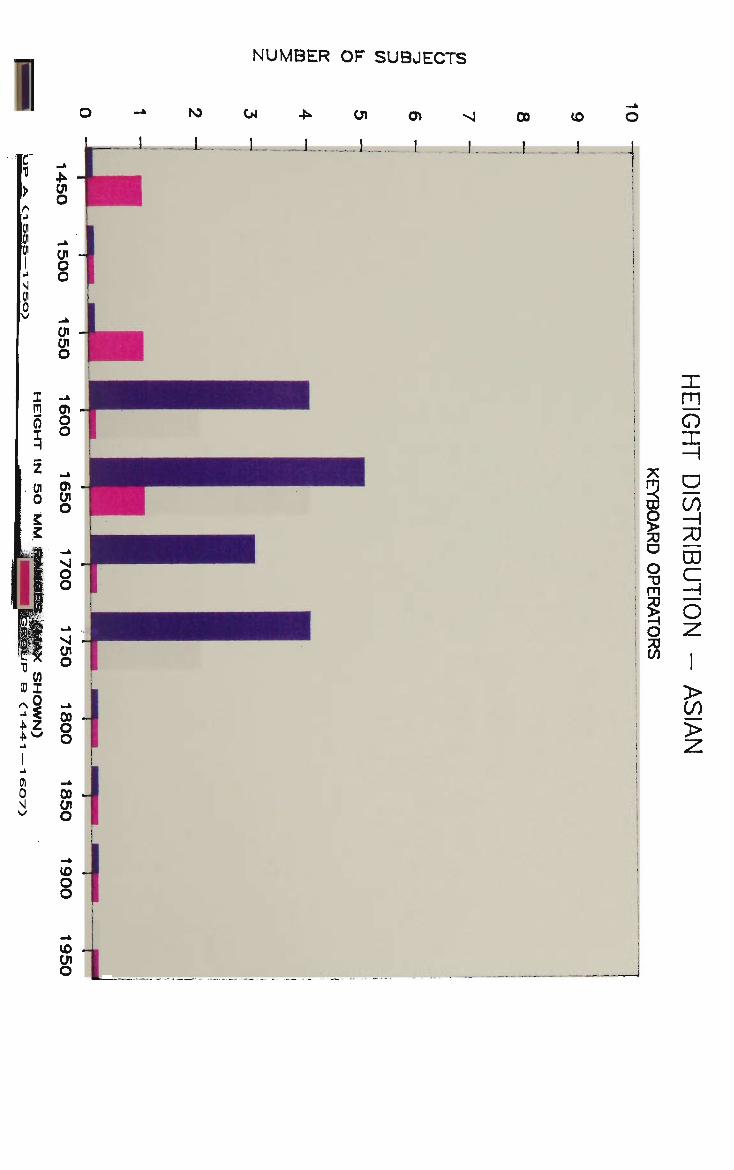
NUMBER OF SUBJECTS
oo (£>
X
m o X H
m O g CO CO o m —I
1 o - i O 73 W
:
>
CO >
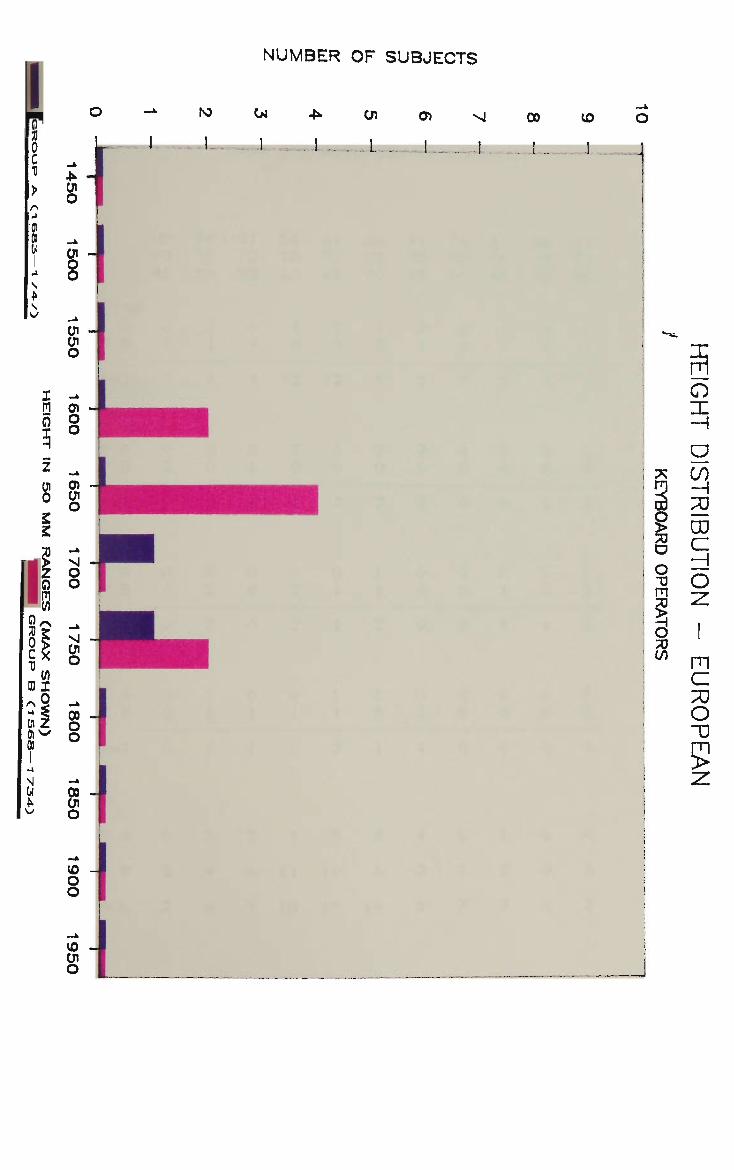
NUMBER OF SUBJECTS
00 to
o X •H
O CO
H CTJ
C o =!
a 9 m c o
5
9 73 O
H O 73 CO
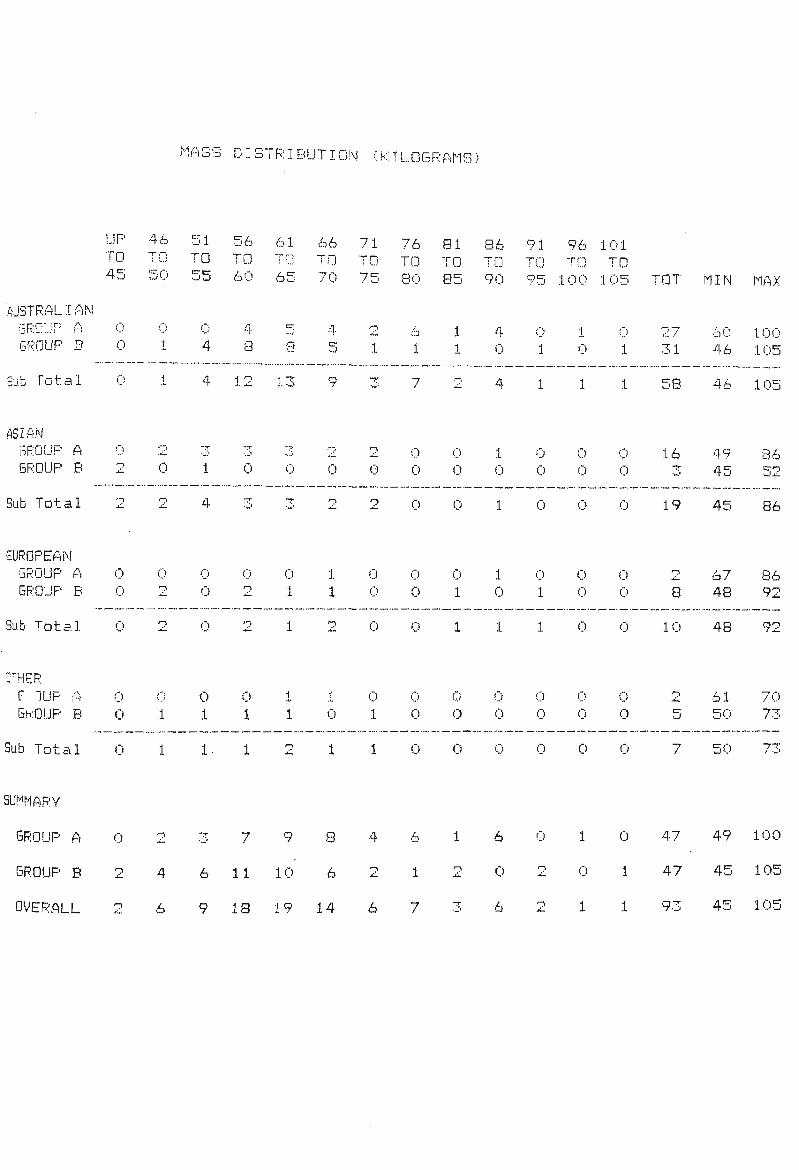
MASb DISTRIBUTION (KILOGRAMS)
AUSTRAL I AN GROUP A GROUP B
Sub Total
UP TO 45
i' J
0
( j
'1 L.
46 Tf"j
5 '-"•'
;""-. l
j
51 TO 55
r j
4
4
1 56 61 66 71 76 81 86 91 96 101 TO TO ! 0 TO TO TO TO TO TO TO 60 65 70 75 80 85 90 95 100 105 TOT MIN MAX
fa
1 1 1
4 o
0 1
1 0
( )
1 Zl 31
60 46
100 105 8 8 5 1
12 13 9 3 - 2 4 1 1 1 58 46 10=
ASIAN GROUP A 0 2 3 3 3 2 2 0 0 1 0 0 0 16 49 GROUP B 2 0 1 0 0 0 0 0 0 0 0 0 0 3 4 J
OS)
Sub Total 2 2 4 3 3 2 2 0 0 1 0 0 0 19 45 86
EUROPEAN bROUP A GROUP B
0 0
\J f-t
o 0
1 }
>n o 1
1 1
0 A
0 0
0 1
1 0
0 1
0 0
0
o n
8 67 48
86 92
Sub Total 0 2 0 2 1 2 0 0 1 1 1 0 0 10 48 92
OTHER F ")UP A 0 0 0 0 1 1 0 0 0 0 0 0 0 2 61 70 GKOUP B 0 1 1 1 1 0 1 0 0 0 0 0 0 5 50 73
Sub Total 0 1 1 1 2 1 1 0 0 0 0 0 0 7 50 73
SUMMARY
1 6 0 1 0 47 49 100
2 0 2 0 1 47 45 105
GROUP A
GROUP B
OVERALL
0
•?
>—\
o
4
6
T
6
9
7
11
18
9
10
1 O
1 *7
s
6
14
4
r~>
6
6
1
7 1 93 45 10J •_i

NUMBER OF SUBJECTS
01 O) Nj
~l ~L___ I
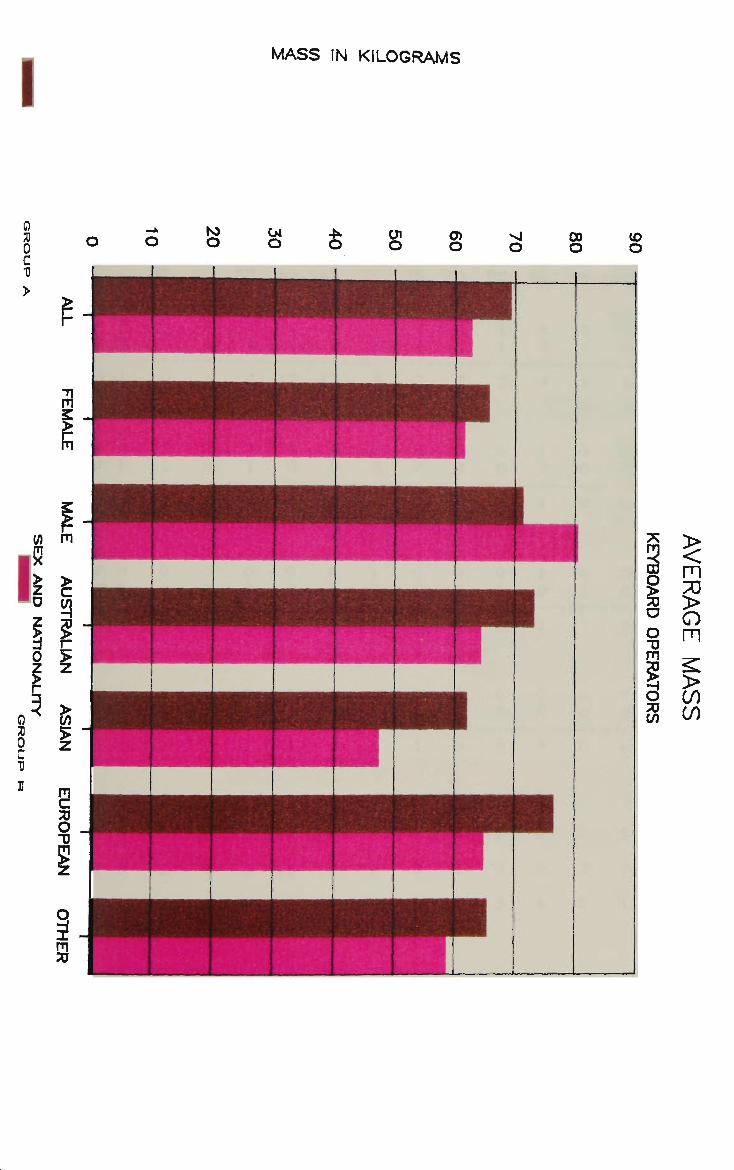
I MASS IN KILOGRAMS
ID
o
X
5 CD
1 U o
o A3
£ m 73 >
o m > CO CO

1ASS DISTRIBUTION (KILOGRAMS)
UP 46 51 56 61 66 71 76 81 86 91 96 101 TO TO TO TO TO TO TO JO TO TO TO TO TO 45 50 55 60 65 70 75 80 85 90 95 100 105 TOT MIN MAX
542614010 27 60 100 3 5 1 1 1 0 1 0 1 31 46 105
Sub Total 1 41213 9 3 7 2 4 1 1 1 58 46 105
ASIAN GROUP A 0 2 3 3 3 2 2 0 0 1 0 0 0 16 49 86
AUSTRAL: !jKuur
GROUP
r .AKI 1. :--liM
A 'r\
( )
0 „ .
0 1
0 4
. ,
.& 8
0 0
o 0
1 0
0 0
0 0
o 0 e n GROUP B Z 0 1 0 0 0 0 0 0 0 0 0 0 3 45
Sub Total 2 2 4 3 3 2 2 0 0 1 0 0 0 19 45 86
EUROPEAN GROUP A 0 0 0 0 0 1 0 0 0 1 0 0 GROUP B 0 2 0 2 1 1 0 0 1 0 1 0
Sub Total 0 2 0 2 12 0 0 1110 0
0 0 0 0 0 0 0 0 0 0
0 o Q
fy
8
10
67 48
48
86 92
92
OTHER F 1UP A GKOUP B
0 0
/•*-,
1 0 1
0 1
1
1
1
0 o 1
Sub Total 0 1 1 1 2 1 1 0 0 0 0 O O
0 2 0 5
0 7
61 70 50 73
50 73
SUMMARY
GROUP A
GROUP B
OVERALL
0
o
*~>
2
4
6
7.
6
9
7
11
18
9
10
19
3
6
14
4
'">
6
£}
1
7
u
0
1
0
1
o
1
1
47
47
93
49
45
45
100
105
105
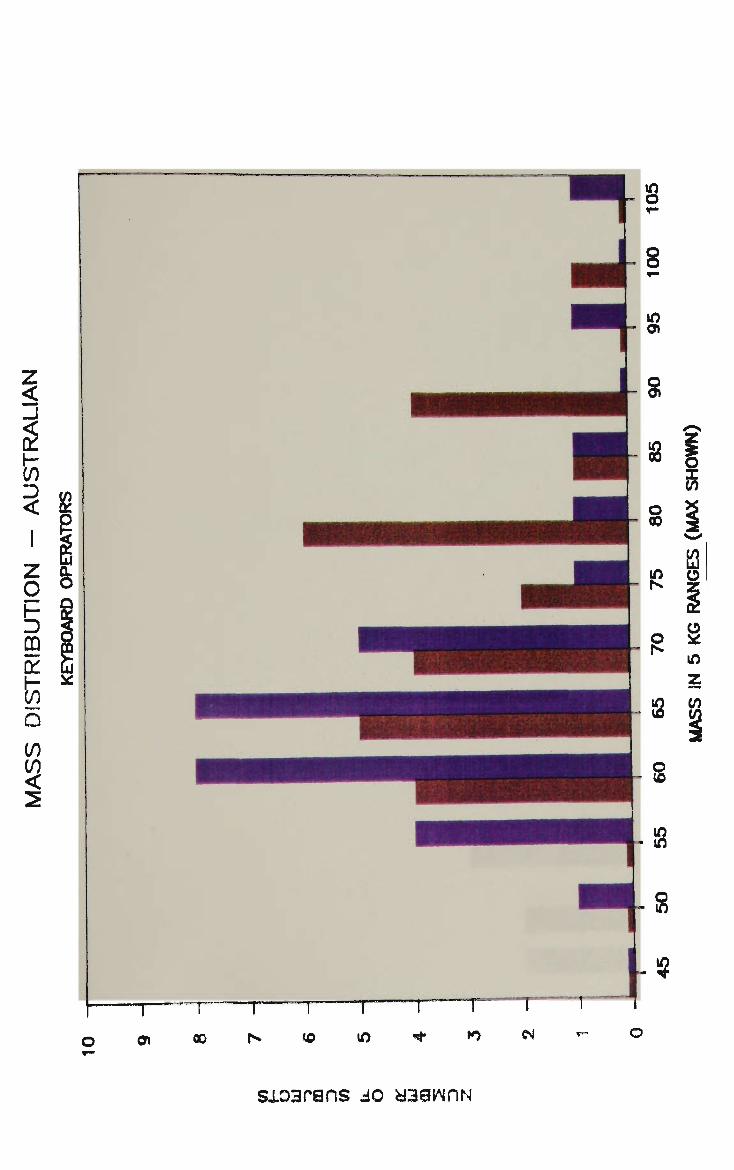
z <
if)
< l • i
LU z 0 h-D CD on h-co Q
in in <
2
Q. O
§
i 5 *
8
8
01
s
s
o 00
K
g
12
o <0
in
o X
\y
12
z (/>
8
$
sioarans JO aaawriN
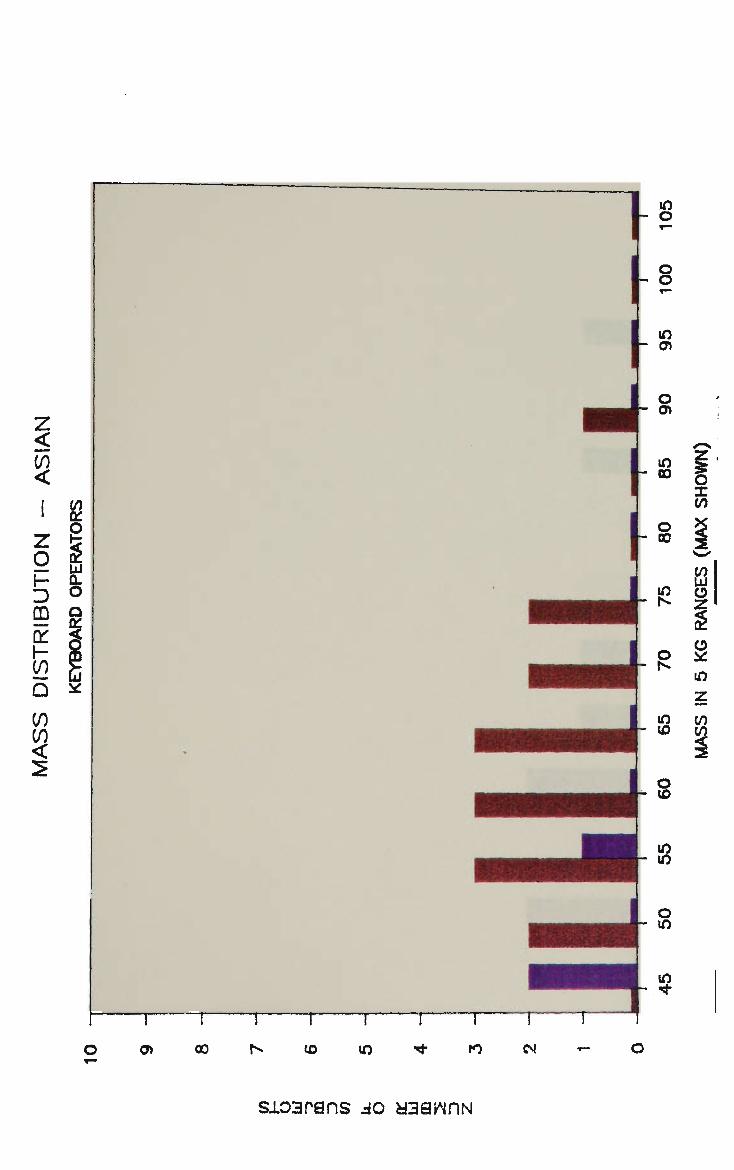
o
o o
m 01
o 01
|- oo
o fr- 00 8
!P §- N
••>
Z ,
s X Crt X 5 «w to LU C!) z s
o i<:
10 to t/5
o (O
0> oo 10
sio3rans do aaawnN
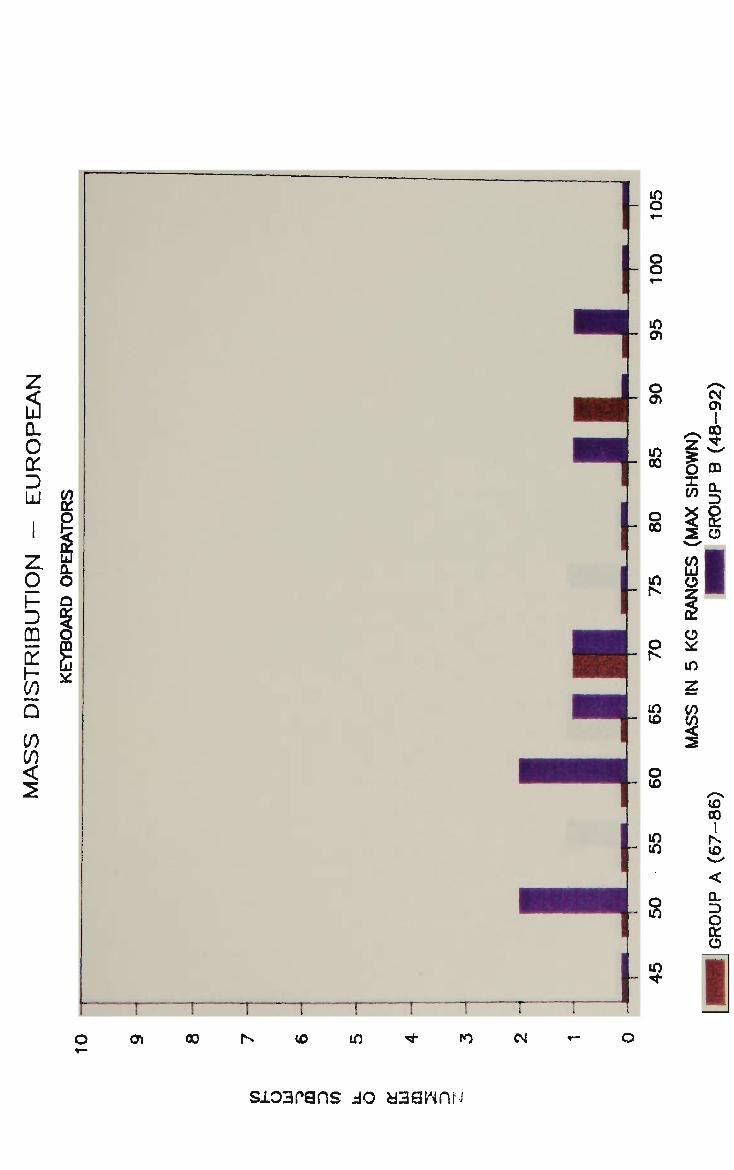
Ol
T OD
T <o in
o *—
o o v-
m Ol
o 01
in oo
o 00
m N
O N
m <o
o (O
£ m
o m
m «t-
<N 01
OWN)
B (48-
» $ X o < a: 2 O ^-^
[2 o 5™ £ o x: m z w </J
/~*» (O 00 I i (O x ^
<
DL
D O ce o •
1 CM
sioarans do uaawnN
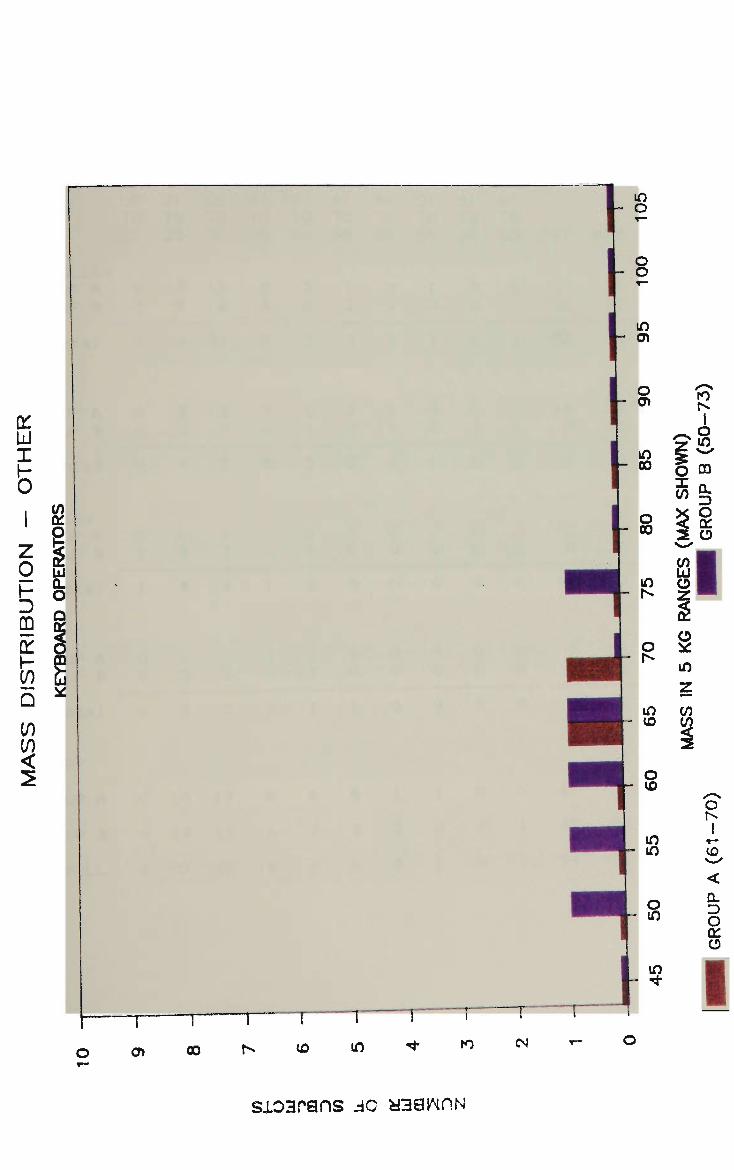
in
o T—
o o T~
m 01
o 01
in 00
o oo
m N
o h»
m (O
o <o
in in
o m
m • < *
1
OWN)
B (50
5& $8 2 O «w.<
en LU o z 1 " i o *:
m z (/)
^"N
o r>* 1
T—
10 V_^
<
O ttl O •
1 sioarans JC aaawn.N
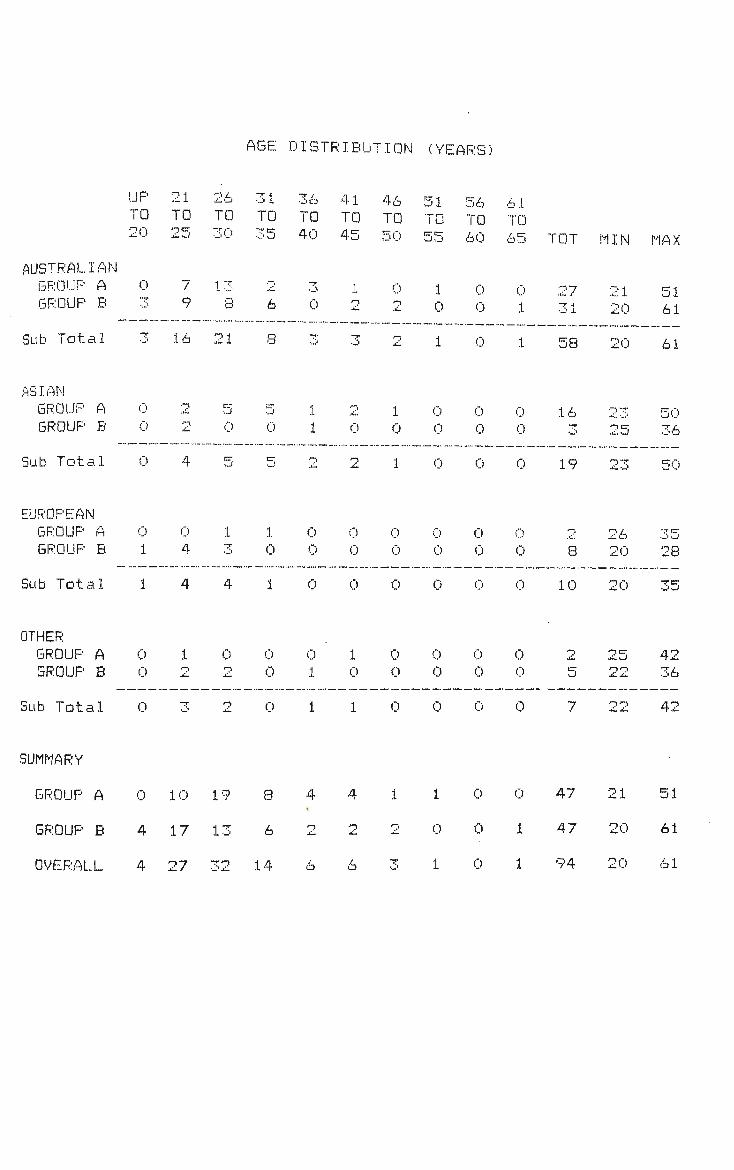
AGE DISTRIBUTION (YEARS)
AUSTRALIAN GROUP A GROUP B
Sub Total
ASIAN GROUP A GROUP B
• -
Sub Total
EUROPEAN GROUP A GROUP B
-
Sub Total
OTHER GROUP A GROUP B
UP TO 20
0
• - '
0 0
Q
Q 1
1
0 0
21 TO 25
7 9
16
•->
4
0 4
4
1 o
Z6 TO 30
4 "~ .1 -..':•
8
21
5 0
cr
—j.
4
o ry
31 TO
6
8
0
cr
1 0
1
o 0
TO 40
0
3
1 1
o
o 0
0
0 1
41 TO 45
1
"* "*"* ~"* ***"
0
'->
0 0
0
1 0
46 TO 50
0
™ — — •
2
1 0 —
1
0
o
0
0 o
51 TO 55
1 0
— . — ~ -
1
0
o
0
o 0
0
0 0
cr / • J O
TO 60
0 0 , — 0
0 0
0
0 0
0
0 0
6.1 TO 65
0 1
1
0 0
0
0 0
0
0 0
TOT
27 O 1
58
16
19
•-,
8
10
<-i
5
MIN
21 20
— _. 20
•C \.J
„ — * .
/-- j - ^ .
26 20
20
25 «">«-j
x. .
MAX
51 61
__ 61
50 36
50
35 28
35
42 36
Sub Total 0 3 2 0 1 1 0 0 0 0 7 22 42
SUMMARY
GROUP A 0 10 19 8 4 4 1 1 0
GROUP B 4 17 13 6 2 2 2 0 0
OVERALL 4 27 32 14 6 6 3 1 0
0
1
1
47
47
94
21
20
20
51
61
61
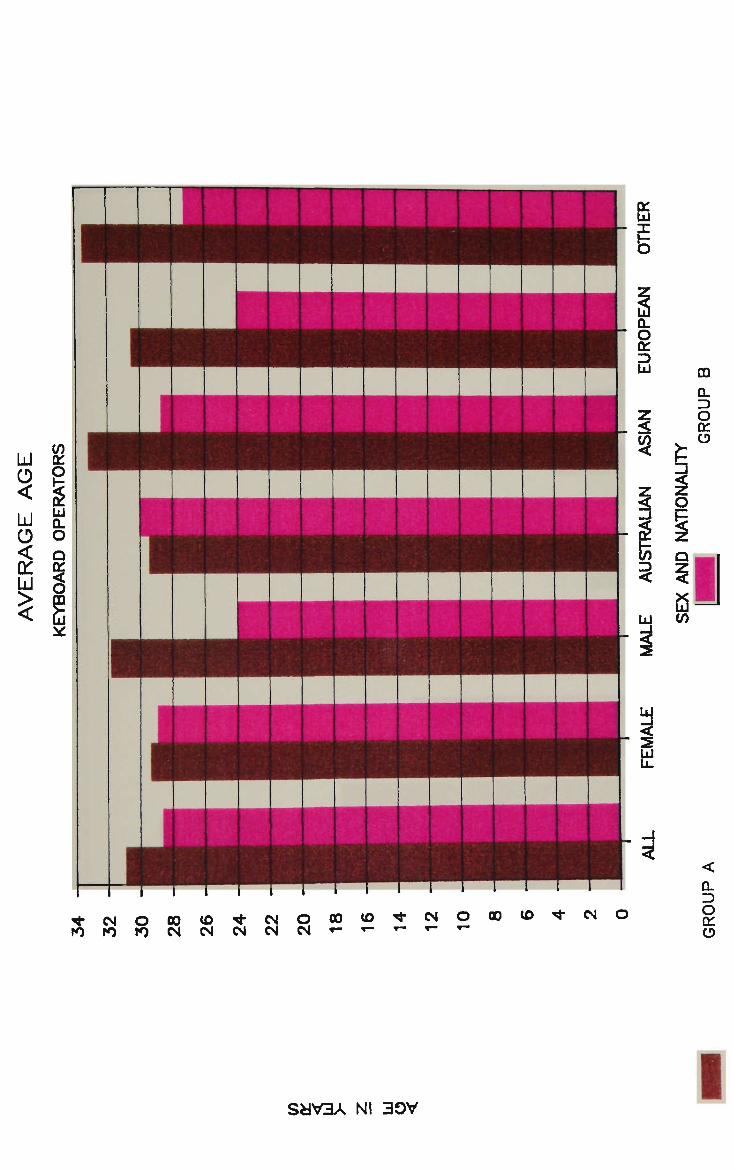
Id O <
LU O <
or. hi > <
on g s LU 0. O D a: ft
hi *:
CD
0.
O DC O
g
V) 1
^ - 0 4 O C 0 t O ' < f ' 0 4 O 0 0 < O , < * - N O I O n i O N C M N N N ' - T - T - r ' "
00 <0 "* C*4 O
CL D O ct:
o
SyV3A Nl 30V
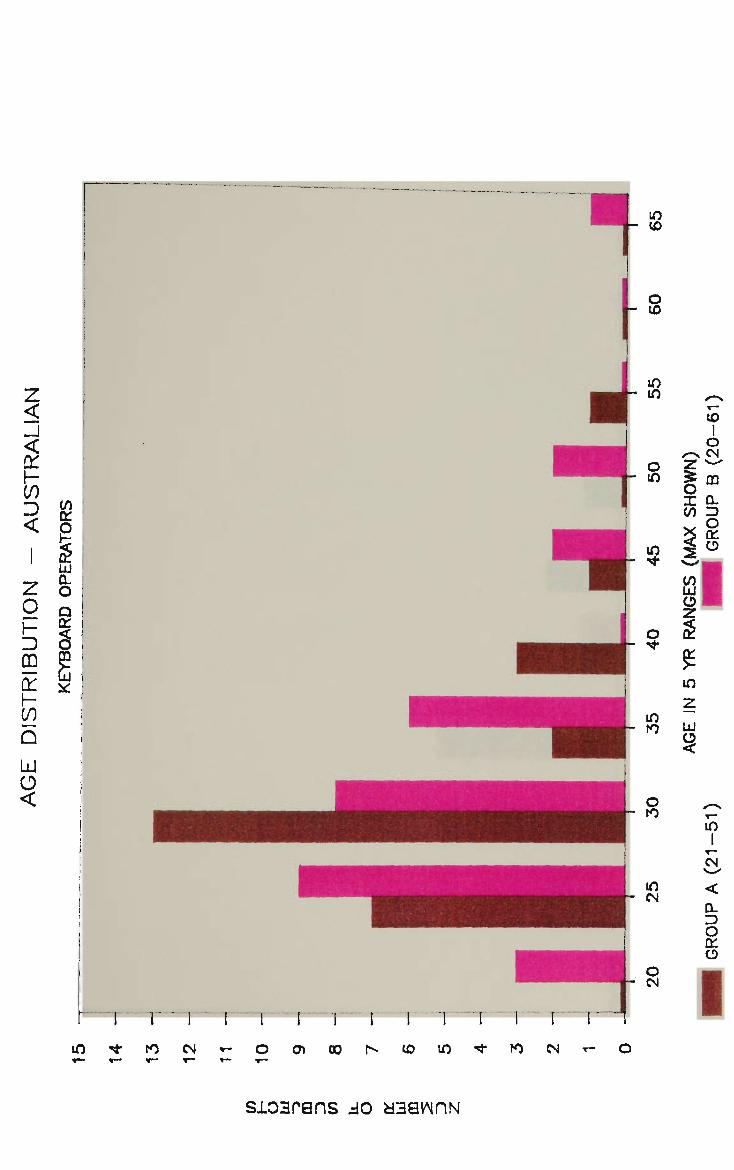
z < -J <
on H CO => <
1 z o h--J CD
on h-co Q UJ
o <
1
or o \~
§ LU
O Q or < i m i
*
i
i
i
j J
m
m <o
10
m m
o m
m
o
m to
o
in CM
o CM
(0
1
o <-s CM Z ^ 5 CO
o X 0-S CD LU
o z I
10
LU
8
in
CM
0-
o or CD
I tO CN
sioarans JO asawnN
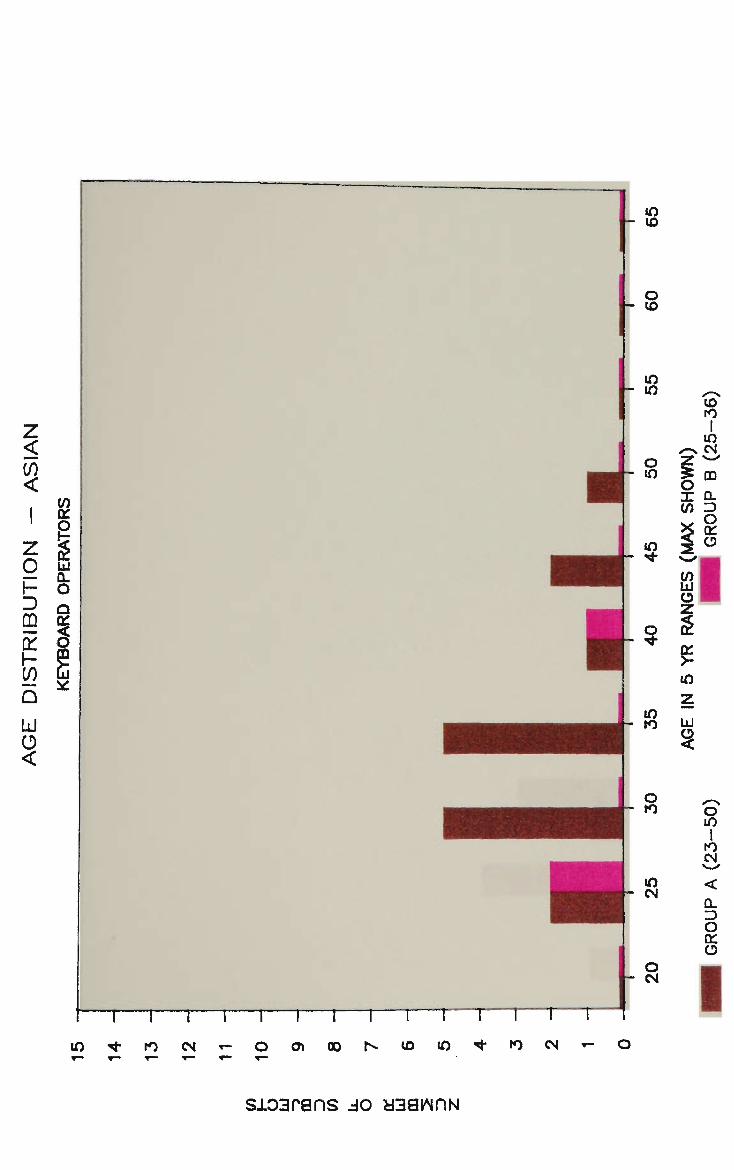
m 10
o to
m m
o m
m
o
10 rO !
m ^ CM
X 0-(n ID xy O ^ CD
LU CD Z I
or >-05
m ro
LU
m
T i r tO CN
O to
m CN
o CM
O
m I to CM
Q_ ID O
or CD
I 01 oo
sioarans JO yaawnN
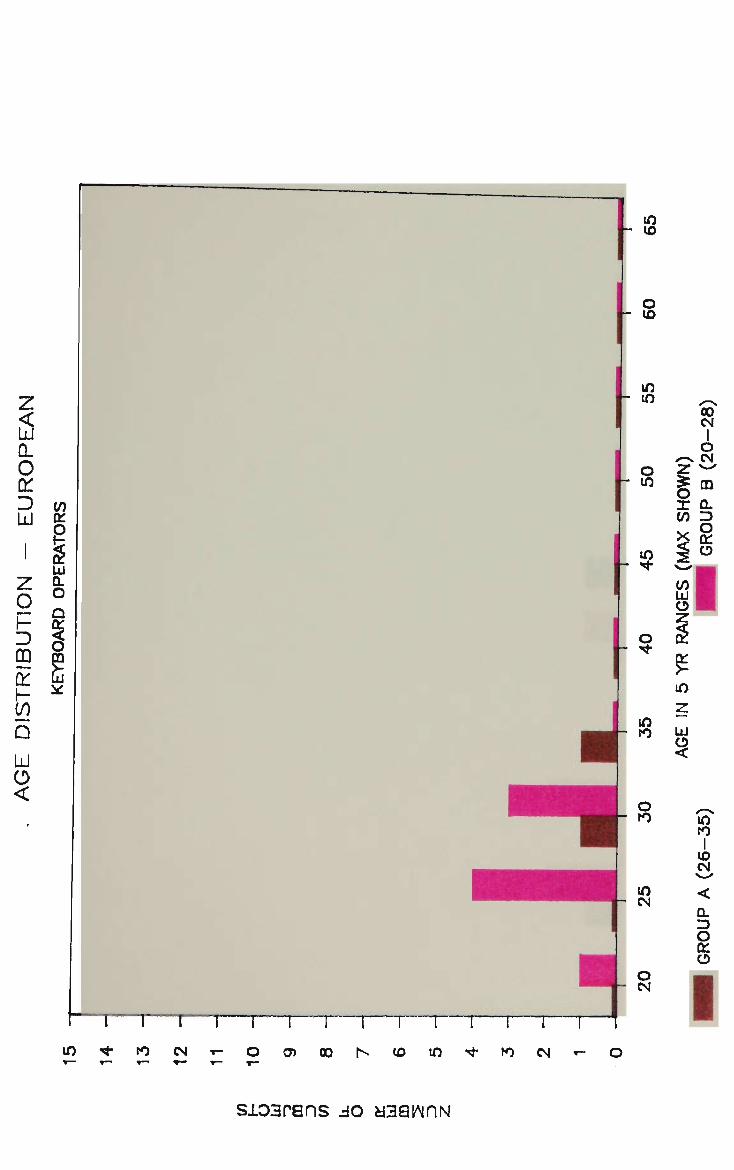
z <
a. o on w g I §
LU
Z o-
£ ° CC LU
ft * CO Q LU
O <
m i i—r «*• to CM
sioarans JO asawnN
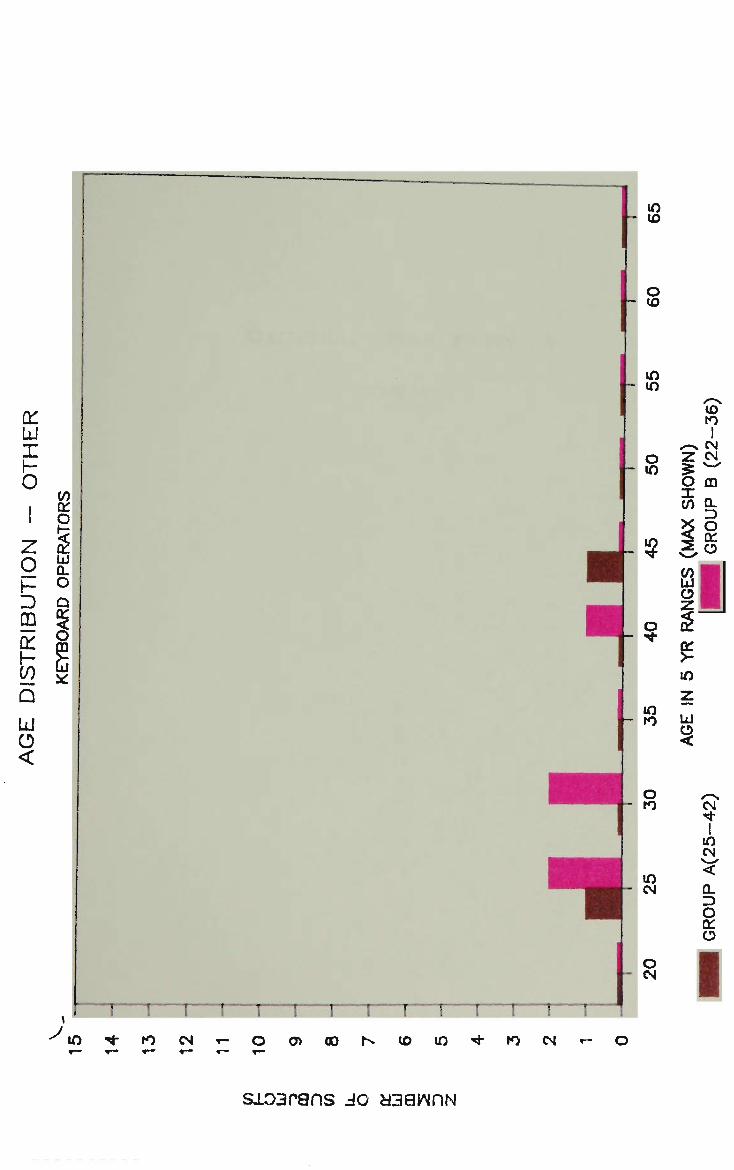
on LU
x O
z g
m on i -
co Q LU O <
sioarans JO aaawnN

STATISTICAL SUMMARY BY SEX - A
(TABLES)
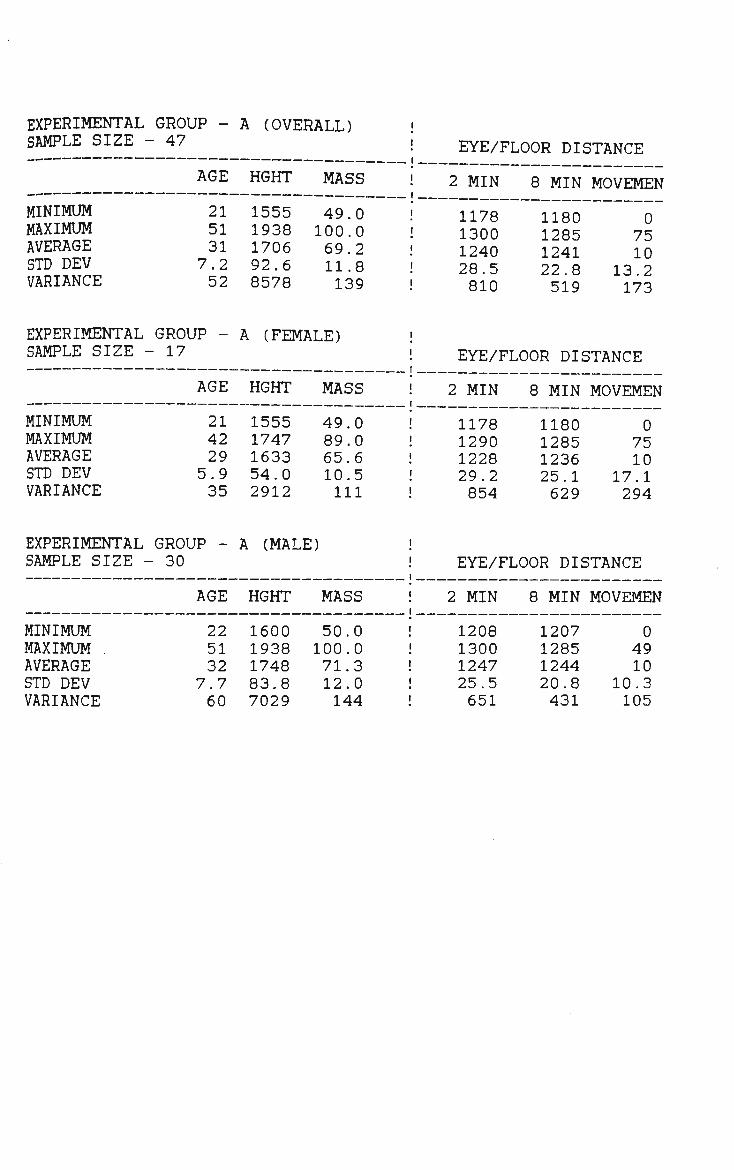
EXPERIMENTAL GROUP -SAMPLE SIZE - 47
AGE
MINIMUM 21 MAXIMUM 51 AVERAGE 31 STD DEV 7.2 VARIANCE 52
A (OVERALL)
HGHT
1555 1938 1706 92.6 8578
MASS
49.0 100.0 69.2 11.8 139
EYE/FLOOR DISTANCE
2 MIN
1178 1300 1240 28.5 810
8 MIN
1180 1285 1241 22.8 519
MOVEMEN
0 75 10
13.2 173
EXPERIMENTAL GROUP -SAMPLE SIZE - 17
AGE
MINIMUM 21 MAXIMUM 42 AVERAGE 29 STD DEV 5.9 VARIANCE 35
A (FEMALE)
HGHT
1555 1747 1633 54.0 2912
MASS
49.0 89.0 65.6 10.5 111
EYE/FLOOR DISTANCE
2 MIN
1178 1290 1228 29.2 854
8 MIN
1180 1285 1236 25.1 629
MOVEMEN
0 75 10
17.1 294
EXPERIMENTAL GROUP -SAMPLE SIZE - 30
AGE
MINIMUM 22 MAXIMUM 51 AVERAGE 32 STD DEV 7.7 VARIANCE 60
A (MALE)
HGHT
1600 1938 1748 83.8 7029
MASS
50.0 100.0 71.3 12.0 144
EYE/FLOOR DISTANCE
2 MIN
1208 1300 1247 25.5 651
8 MIN
1207 1285 1244 20.8 431
MOVEMEN
0 49 10
10.3 105
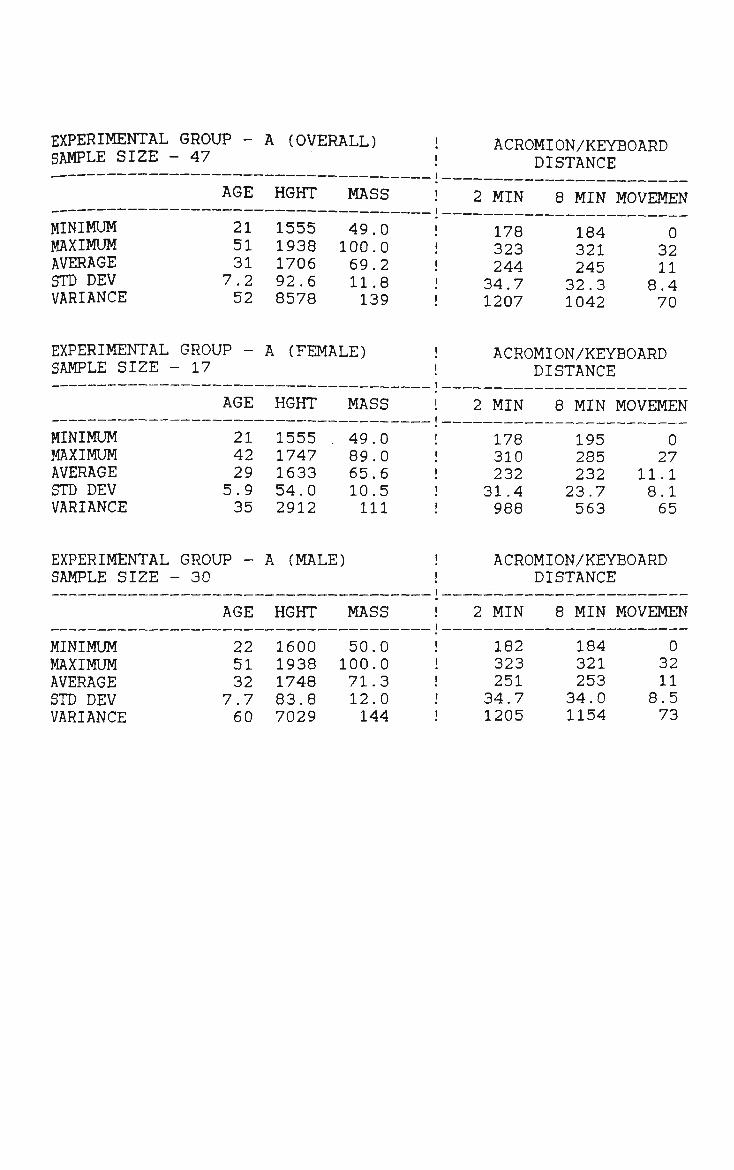
EXPERIMENTAL GROUP -SAMPLE SIZE - 47
AGE
MINIMUM 21 MAXIMUM 51 AVERAGE 31 STD DEV 7.2 VARIANCE 52
A (OVERALL)
HGHT
1555 1938 1706 92.6 8578
MASS
49.0 100.0 69.2 11.8 139
! ACROMION/KEYBOARD ! DISTANCE
! 2 MIN
! 178 ! 323 ! 244 ! 34.7 i 1207
8 MIN MOVEMEN
184 0 321 32 245 11 32.3 8.4 1042 70
EXPERIMENTAL GROUP -SAMPLE SIZE - 17
AGE
MINIMUM 21 MAXIMUM 42 AVERAGE 29 STD DEV 5.9 VARIANCE 35
A (FEMALE)
HGHT MASS
1555 . 49.0 1747 89.0 1633 65.6 54.0 10.5 2912 111
ACROMION/KEYBOARD DISTANCE
2 MIN
178 310 232
31.4 988
8 MIN ]
195 285 232 23.7 563
MOVEMEN
0 27
11.1 8.1 65
EXPERIMENTAL GROUP -SAMPLE SIZE - 30
AGE
MINIMUM 22 MAXIMUM 51 AVERAGE 32 STD DEV 7.7 VARIANCE 60
A (MALE)
HGHT
1600 1938 1748 83.8 7029
MASS
50.0 100.0 71.3 12.0 144
ACROMION/KEYBOARD DISTANCE
2 MIN
182 323 251 34.7 1205
8 MIN MOVEMEN
184 0 321 32 253 11 34.0 8.5 1154 73
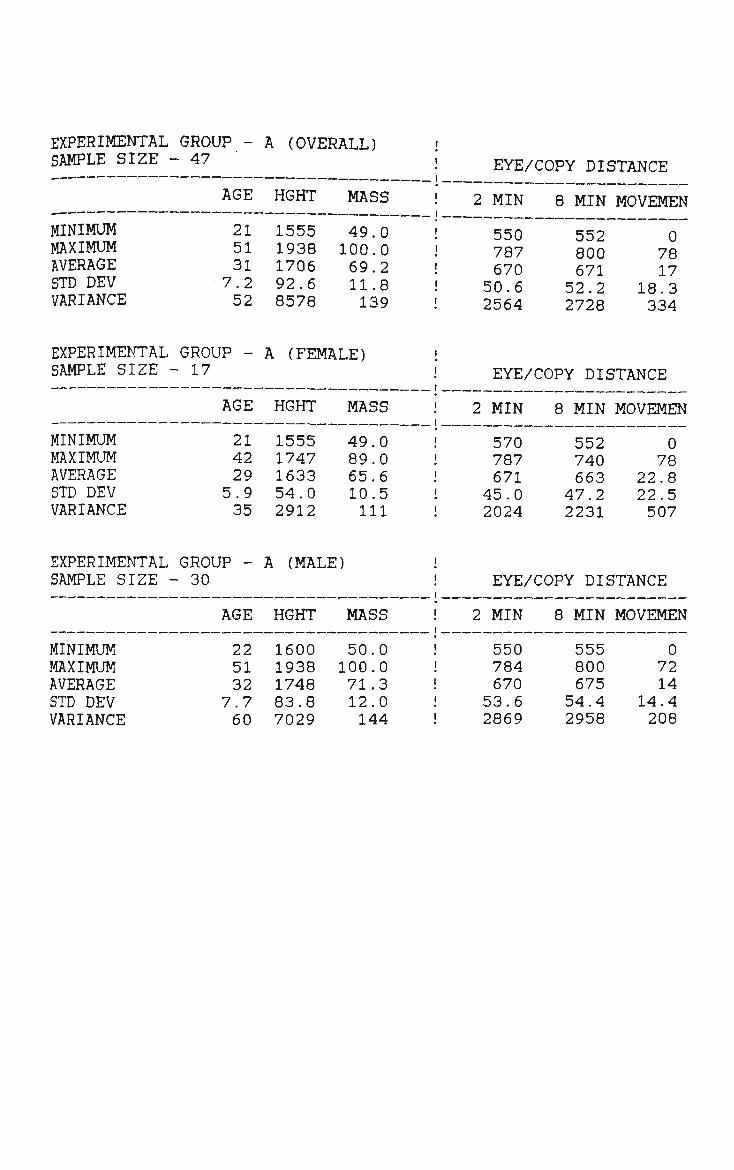
EXPERIMENTAL GROUP -SAMPLE SIZE - 47
AGE
MINIMUM 21 MAXIMUM 51 AVERAGE 31 STD DEV 7 . 2 VARIANCE 52
A (OVERALL)
HGHT
1555 1938 1706 92.6 8578
MASS
49.0 100.0 69.2 11.8 139
EYE/COPY DISTANCE
2 MIN
550 787 670
50.6 2564
8 MIN
552 800 671
52.2 2728
MOVEMEN
0 78 17
18.3 334
EXPERIMENTAL GROUP -SAMPLE SIZE - 17
AGE
MINIMUM 21 MAXIMUM 42 AVERAGE 29 STD DEV 5.9 VARIANCE 35
A (FEMALE)
HGHT
1555 1747 1633 54.0 2912
MASS
49.0 89.0 65.6 10.5 111
EYE/COPY DISTANCE
2 MIN
570 787 671
45.0 2024
8 MIN
552 740 663
47.2 2231
MOVEMEN
0 78
22.8 22.5 507
EXPERIMENTAL GROUP -SAMPLE SIZE - 30
AGE
MINIMUM 22 MAXIMUM 51 AVERAGE 32 STD DEV 7.7 VARIANCE 60
A (MALE)
HGHT
1600 1938 1748 83.8 7029
MASS
50.0 100.0 71.3 12.0 144
EYE/COPY DISTANCE
2 MIN
550 784 670 53.6 2869
8 MIN
555 800 675 54.4 2958
MOVEMEN
0 72 14
14.4 208
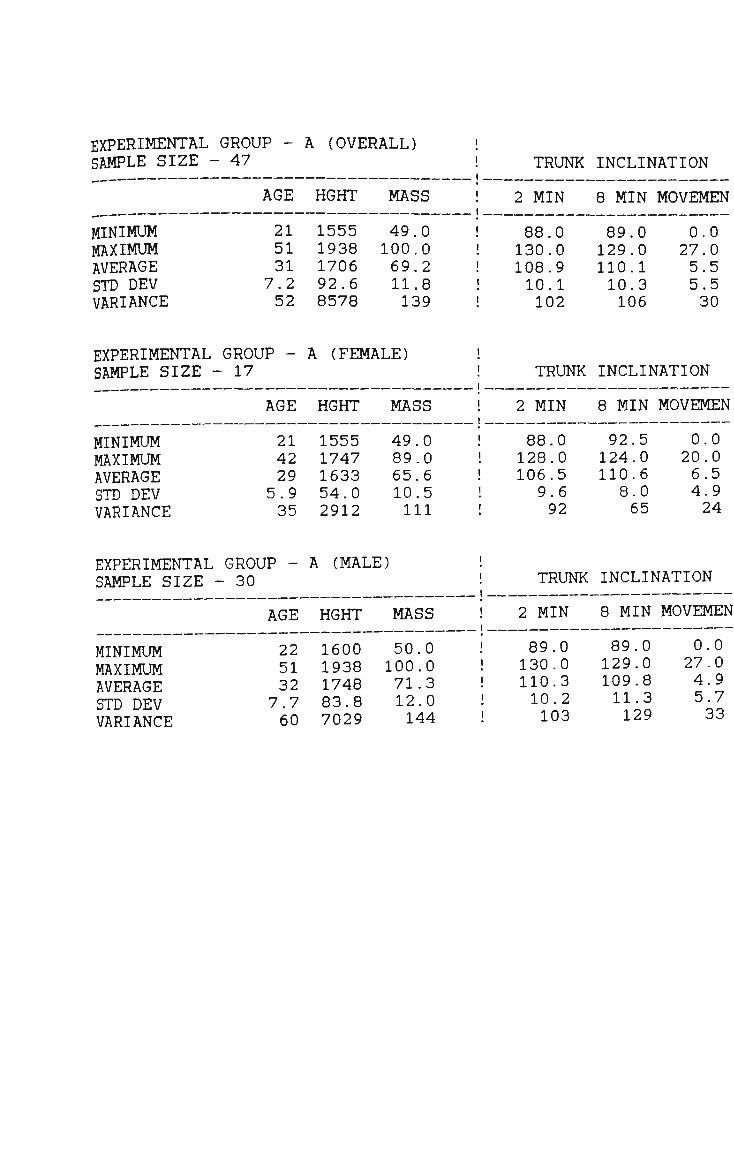
EXPERIMENTAL GROUP - A (OVERALL) SAMPLE SIZE - 47 TRUNK INCLINATION
2 MIN 8 MIN MOVEMEN AGE HGHT MASS
MINIMUM MAXIMUM AVERAGE STD DEV VARIANCE
21 51 31
7.2 52
1555 1938 1706 92.6 8578
49.0 100.0 69.2 11.8 139
88.0 130.0 108.9 10.1 102
89.0 129.0 110.1 10.3 106
0.0 27.0 5.5 5.5 30
EXPERIMENTAL GROUP -SAMPLE SIZE - 17
AGE
MINIMUM 21 MAXIMUM 42 AVERAGE 29 STD DEV 5.9 VARIANCE 35
A (FEMALE)
HGHT
1555 1747 1633 54.0 2912
MASS
49.0 89.0 65.6 10.5 111
TRUNK
2 MIN
88.0 128.0 106.5
9.6 92
INCLINATION
8 MIN
92.5 124.0 110.6 8.0 65
MOVEMEN
0.0 20.0 6.5 4.9 24
EXPERIMENTAL GROUP - A (MALE) SAMPLE SIZE - 30 TRUNK INCLINATION
2 MIN 8 MIN MOVEMEN AGE HGHT MASS
MINIMUM MAXIMUM AVERAGE STD DEV VARIANCE
22 51 32
7.7 60
1600 1938 1748 83.8 7029
50.0 100.0 71.3 12.0 144
89.0 130.0 110.3 10.2 103
89.0 129.0 109.8 11.3 129
0.0 27.0 4.9 5.7 33

EXPERIMENTAL GROUP -SAMPLE SIZE - 47
AGE
MINIMUM 21 MAXIMUM 51 AVERAGE 31 STD DEV 7.2 VARIANCE 52
A (OVERALL)
HGHT
1555 1938 1706 92.6 8578
MASS
49.0 100.0 69.2 11.8 139
HEAD
2 MIN
27.0 60.0 43.0 9.1 82
INCLINATION
8 MIN
25.0 62.0 43.6 9.4 88
MOVEMEN
0.0 26.0 6.4 4.9 24
EXPERIMENTAL ( SAMPLE SIZE -
MINIMUM MAXIMUM AVERAGE STD DEV VARIANCE
3ROUP -17
AGE
21 42 29
5.9 35
A (FEMALE)
HGHT
1555 1747 1633 54.0 2912
MASS
49.0 89.0 65.6 10.5 111
HEAD
2 MIN
27.5 55.0 42.1 9.6
! 93
INCLINATION
8 MIN
27.0 57.0 40.3 9.1 83
MOVEMEN
0.0 26.0 6.9 6.7 45
EXPERIMENTAL GROUP -SAMPLE SIZE - 30
AGE
MINIMUM 22 MAXIMUM 51 AVERAGE 32 STD DEV 7.7 VARIANCE 60
A (MALE)
HGHT
1600 1938 1748 83.8 7029
MASS
50.0 100.0 71.3 12.0 144
HEAD
2 MIN
27.0 60.0 43.6 8.7 76
INCLINATION
8 MIN
25.0 62.0 45.5 9.0 81
MOVEMEN
1.5 16.0 6.1 3.5 13
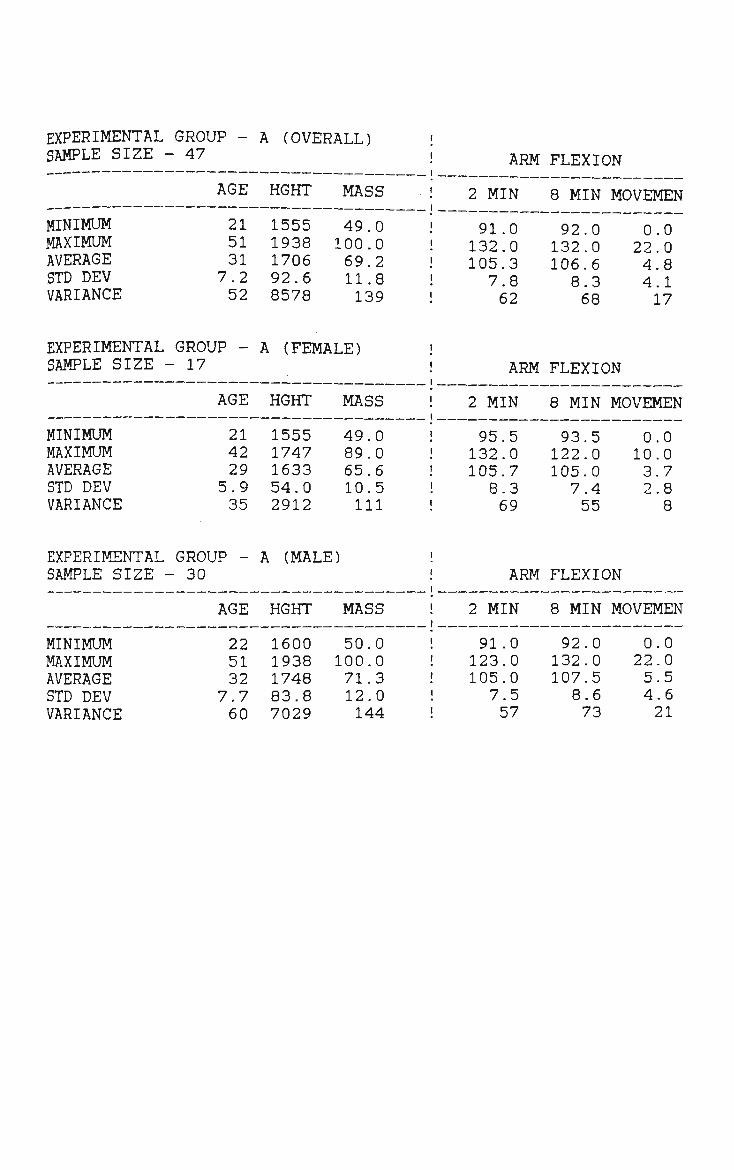
EXPERIMENTAL GROUP -SAMPLE SIZE - 47
AGE
MINIMUM 21 MAXIMUM 51 AVERAGE 31 STD DEV 7.2 VARIANCE 52
A (OVERALL)
HGHT
1555 1938 1706 92.6 8578
MASS
49.0 100.0 69.2 11.8 139
ARM
2 MIN
91.0 132.0 105.3 7.8 62
FLEXION
8 MIN
92.0 132.0 106.6 8.3 68
MOVEMEN
0.0 22.0 4.8 4.1 17
EXPERIMENTAL GROUP -SAMPLE SIZE - 17
AGE
MINIMUM 21 MAXIMUM 42 AVERAGE 29 STD DEV 5.9 VARIANCE 35
A (FEMALE)
HGHT
1555 1747 1633 54.0 2912
MASS
49.0 89.0 65.6 10.5 111
ARM
2 MIN
95.5 132.0 105.7 8.3 69
FLEXION
8 MIN
93.5 122.0 105.0 7.4 55
MOVEMEN
0.0 10.0 3.7 2.8 8
EXPERIMENTAL GROUP -SAMPLE SIZE - 30
AGE
MINIMUM 22 MAXIMUM 51 AVERAGE 32 STD DEV 7.7 VARIANCE 60
A (MALE)
HGHT
1600 1938 1748 83.8 7029
MASS
50.0 100.0 71.3 12.0 144
ARM
2 MIN
91.0 123.0 105.0 7.5 57
FLEXION
8 MIN
92.0 132.0 107.5 8.6 73
MOVEMEN
0.0 22.0 5.5 4.6 21

EXPERIMENTAL SAMPLE SIZE
MINIMUM MAXIMUM AVERAGE STD DEV VARIANCE
GROUP -- 47
AGE
21 51 31
7.2 52
A (OVERALL)
HGHT
1555 1938 1706 92.6 8578
MASS
49.0 100.0 69.2 11.8 139
ARM
2 MIN
10.0 37.0 23.6 6.8 46
ABDUCTION
8 MIN
13.5 36.5 24.0 6.2 38
MOVEMEN
0.0 11.5 2.9 2.9 8
EXPERIMENTAL GROUP -SAMPLE SIZE - 17
AGE
MINIMUM 21 MAXIMUM 42 AVERAGE 29 STD DEV 5.9 VARIANCE 35
A (FEMALE)
HGHT
1555 1747 1633 54.0 2912
MASS
49.0 89.0 65.6 10.5 111
ARM
2 MIN
15.0 33.0 22.4 5.0 25
ABDUCTION
8 MIN
15.0 36.5 22.1 5.0 25
MOVEMEN
0.0 11.5 4.4 3.1 10
EXPERIMENTAL GROUP -SAMPLE SIZE - 30
AGE
MINIMUM 22 MAXIMUM 51 AVERAGE 32 STD DEV 7.7 VARIANCE 60
A (MALE)
HGHT
1600 1938 1748 83.8 7029
MASS
50.0 100.0 71.3 12.0 144
ARM
2 MIN
10.0 37.0 24.3 7.5 56
ABDUCTION
8 MIN
13.5 36.5 25.1 6.5 42
MOVEMEN
0.0 10.0 2.0 2.4
6
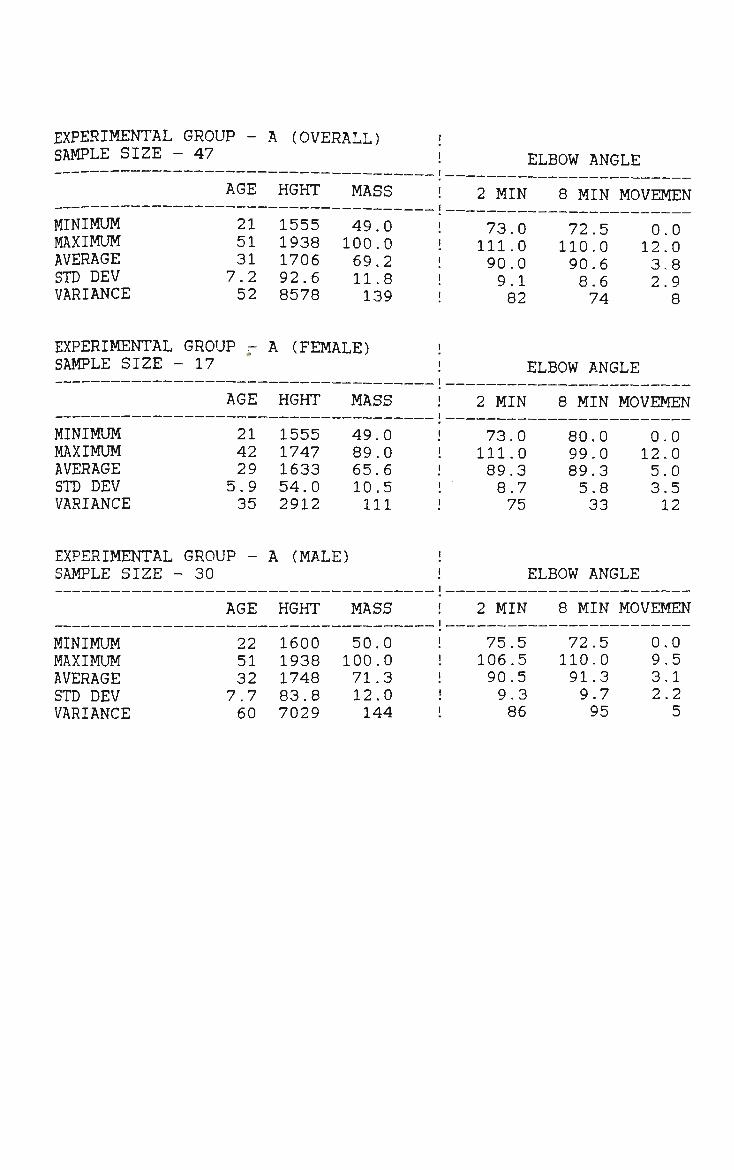
EXPERIMENTAL GROUP - A (OVERALL) ' Si^—_!£?Ll_JL __ ! ELB0W ANGLE
AGE HGHT MASS ! 2 MIN 8 MIN MOVEMEN
MINIMUM 21 MAXIMUM 51 AVERAGE 31 STD DEV 7.2 VARIANCE 52
MINIMUM 21 MAXIMUM 42 AVERAGE 29 STD DEV 5.9 VARIANCE 35
MINIMUM 22 MAXIMUM 51 AVERAGE 32 STD DEV 7.7 VARIANCE 60
1555 1938 1706 92.6 8578
49.0 100.0 69.2 11.8 139
1555 49.0 1747 89.0 1633 65.6 54.0 10.5 2912 111
1600 50.0 1938 100.0 1748 71.3 83.8 12.0 7029 144
73.0 111.0 90.0 9.1 82
72.5 110.0 90.6 8.6 74
0 12 3 2
0 0 8 9 8
73.0 111.0 89.3 8.7 75
80.0 99.0 89.3 5.8 33
0.0 12.0 5.0 3.5 12
75.5 106.5 90.5 9.3 86
72.5 110.0 91.3 9.7 95
0 9 3 2
0 .5 1 .2 5
EXPERIMENTAL GROUP - A (FEMALE) SAMPLE SIZE - 17
AGE HGHT MASS
ELBOW ANGLE
2 MIN 8 MIN MOVEMEN
EXPERIMENTAL SAMPLE SIZE
GROUP - A (MALE) - 30
AGE HGHT MASS
ELBOW ANGLE
2 MIN 8 MIN MOVEMEN

EXPERIMENTAL GROUP -SAMPLE SIZE - 47
AGE
MINIMUM 21 MAXIMUM 51 AVERAGE 31 STD DEV 7.2 VARIANCE 52
A (OVERALL)
HGHT
1555 1938 1706 92.6 8578
MASS
49.0 100.0 69.2 11.8 139
LEFT ULNAR ABDUCTION
2 MIN
0.0 23.0 5.1 5.0 25
8 MIN
0.0 16.5 5.1 4.2 17
MOVEMEN
0.0 12.0 2.3 2.6 7
EXPERIMENTAL GROUP -SAMPLE SIZE - 17
AGE
MINIMUM 21 MAXIMUM 42 AVERAGE 29 STD DEV 5.9 VARIANCE 35
A (FEMALE)
HGHT
1555 1747 1633 54.0 2912
MASS
49.0 89.0 65.6 10.5 111
LEFT ULNAR ABDUCTION
2 MIN
0.0 19.5 5.2 4.3 18
8 MIN
0.0 12.0 5.5 3.8 14
MOVEMEN
0.0 12.0 2.8 2.9 8
EXPERIMENTAL GROUP -SAMPLE SIZE - 30
AGE
MINIMUM 22 MAXIMUM 51 AVERAGE 32 STD DEV 7.7 VARIANCE 60
A (MALE)
HGHT
1600 1938 1748 83.8 7029
MASS
50.0 100.0 71.3 12.0 144
LEFT ULNAR ABDUCTION
2 MIN
0.0 23.0 5.0 5.4 29
8 MIN
0.0 16.5 4.9 4.3 19
MOVEMEN
0.0 10.5 2.0 2.4 6

STATISTICAL SUMMARY BY SEX - B
(TABLES)
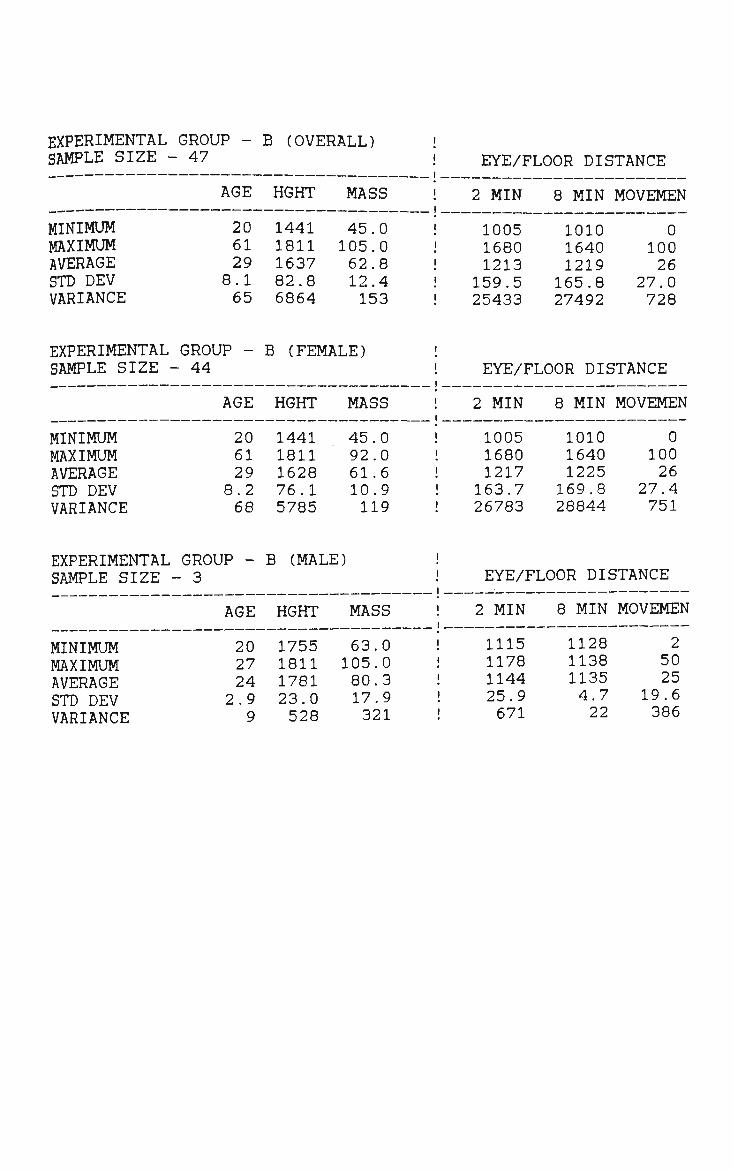
EXPERIMENTAL GROUP -SAMPLE SIZE - 47
AGE
MINIMUM 20 MAXIMUM 61 AVERAGE 29 STD DEV 8.1 VARIANCE 65
B (OVERALL)
HGHT
1441 1811 1637 82.8 6864
MASS
45.0 105.0 62.8 12.4 153
EYE/FLOOR DISTANCE
2 MIN
1005 1680 1213 159.5 25433
8 MIN
1010 1640 1219 165.8 27492
MOVEMEN
0 100 26
27.0 728
EXPERIMENTAL GROUP -SAMPLE SIZE - 44
AGE
MINIMUM 20 MAXIMUM 61 AVERAGE 29 STD DEV 8.2 VARIANCE 68
B (FEMALE)
HGHT MASS
1441 45.0 1811 92.0 1628 61.6 76.1 10.9 5785 119
EYE/FLOOR DISTANCE
2 MIN
1005 1680 1217 163.7 26783
8 MIN
1010 1640 1225 169.8 28844
MOVEMEN
0 100 26
27.4 751
EXPERIMENTAL GROUP -SAMPLE SIZE - 3
AGE
MINIMUM 20 MAXIMUM 27 AVERAGE 24 STD DEV 2.9 VARIANCE 9
B (MALE)
HGHT
1755 1811 1781 23.0 528
MASS
63.0 105.0 80.3 17.9 321
EYE/FLOOR DISTANCE
2 MIN
1115 1178 1144 25.9 671
8 MIN
1128 1138 1135 4.7 22
MOVEMEN
2 50 25
19.6 386
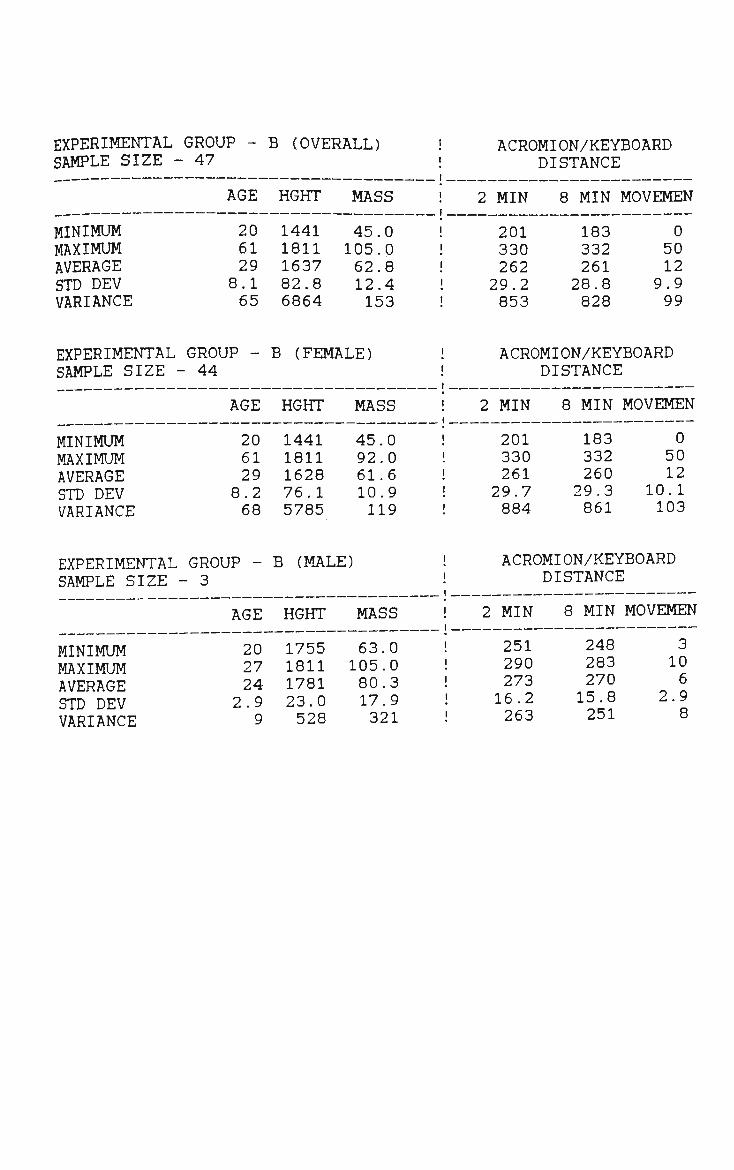
EXPERIMENTAL GROUP -SAMPLE SIZE - 47
AGE
MINIMUM 20 MAXIMUM 61 AVERAGE 29 STD DEV 8.1 VARIANCE 65
EXPERIMENTAL GROUP -SAMPLE SIZE - 44
AGE
MINIMUM 20 MAXIMUM 61 AVERAGE 29 STD DEV 8.2 VARIANCE 68
EXPERIMENTAL GROUP -SAMPLE SIZE - 3
AGE
MINIMUM 20 MAXIMUM 27 AVERAGE 24 STD DEV 2.9 VARIANCE 9
B (OVERALL) !
HGHT MASS !
1441 45.0 ! 1811 105.0 ! 1637 62.8 ! 82.8 12.4 ! 6864 153 !
B (FEMALE)
HGHT MASS
1441 45.0 1811 92.0 1628 61.6 76.1 10.9 5785 119
B (MALE)
HGHT
1755 1811 1781 23.0 528
MASS
63.0 105.0 80.3 17.9 321
ACROMION/KEYBOARD DISTANCE
2 MIN 8 MIN MOVEMEN
201 183 0 330 332 50 262 261 12 29.2 28.8 9.9 853 828 99
ACROMION/KEYBOARD DISTANCE
2 MIN 8 MIN MOVEMEN
201 183 0 330 332 50 261 260 12
! 29.7 29.3 10.1 884 861 103
! ACROMION/KEYBOARD ! DISTANCE
! 2 MIN
! 251 ! 290 ! 273 ! 16.2 ! 263
8 MIN MOVEMEN
248 3 283 10 270 6 15.8 2.9 251 8
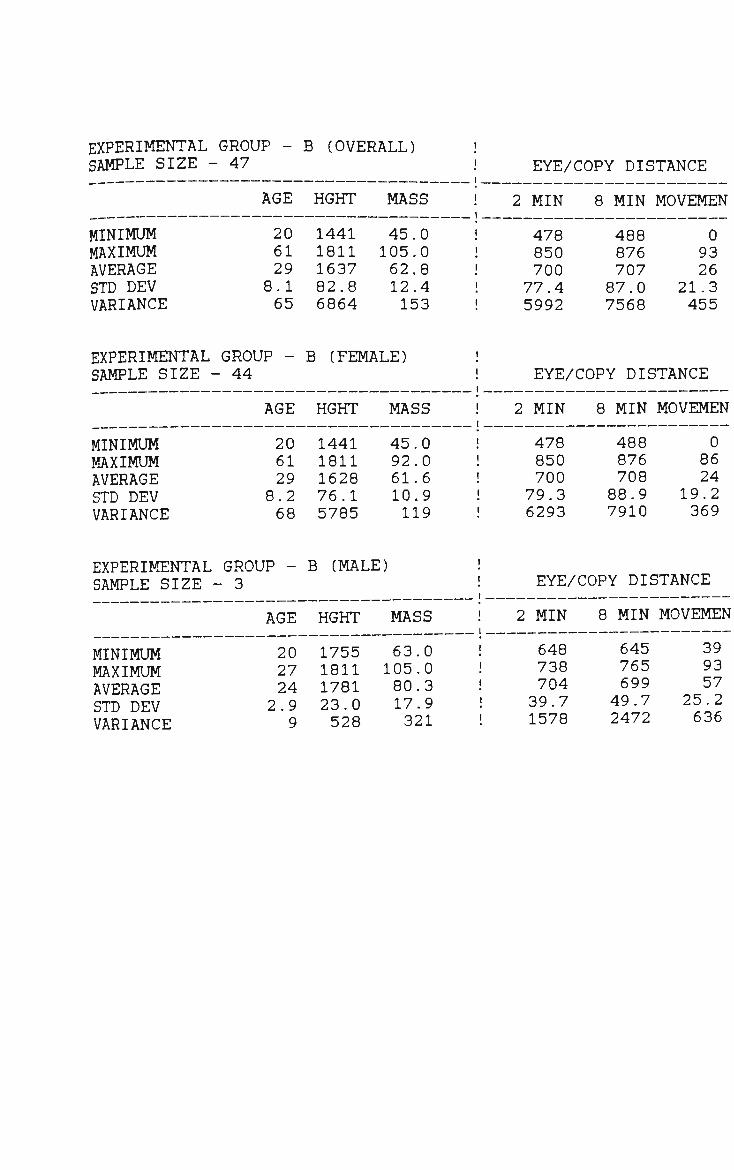
EXPERIMENTAL GROUP -SAMPLE SIZE - 47
AGE
MINIMUM 20 MAXIMUM 61 AVERAGE 29 STD DEV 8.1 VARIANCE 65
B (OVERALL)
HGHT
1441 1811 1637 82.8 6864
MASS
45.0 105.0 62.8 12.4 153
EYE/COPY DISTANCE
2 MIN
478 850 700 77.4 5992
8 MIN
488 876 707 87.0 7568
MOVEMEN
0 93 26
21.3 455
EXPERIMENTAL GROUP -SAMPLE SIZE - 44
AGE
MINIMUM 20 MAXIMUM 61 AVERAGE 29 STD DEV 8.2 VARIANCE 68
B (FEMALE)
HGHT
1441 1811 1628 76.1 5785
MASS
45.0 92.0 61.6 10.9 119
EYE/COPY DISTANCE
2 MIN
478 850 700 79.3 6293
8 MIN
488 876 708 88.9 7910
MOVEMEN
0 86 24
19.2 369
EXPERIMENTAL GROUP -SAMPLE SIZE - 3
AGE
MINIMUM 20 MAXIMUM 27 AVERAGE 24 STD DEV 2.9 VARIANCE 9
B (MALE) !
HGHT
1755 1811 1781 23.0 528
MASS
63.0 105.0 80.3 17.9 321
EYE/COPY DISTANCE
2 MIN
648 738 704 39.7 1578
8 MIN
645 765 699
49.7 2472
MOVEMEN
39 93 57
25.2 636
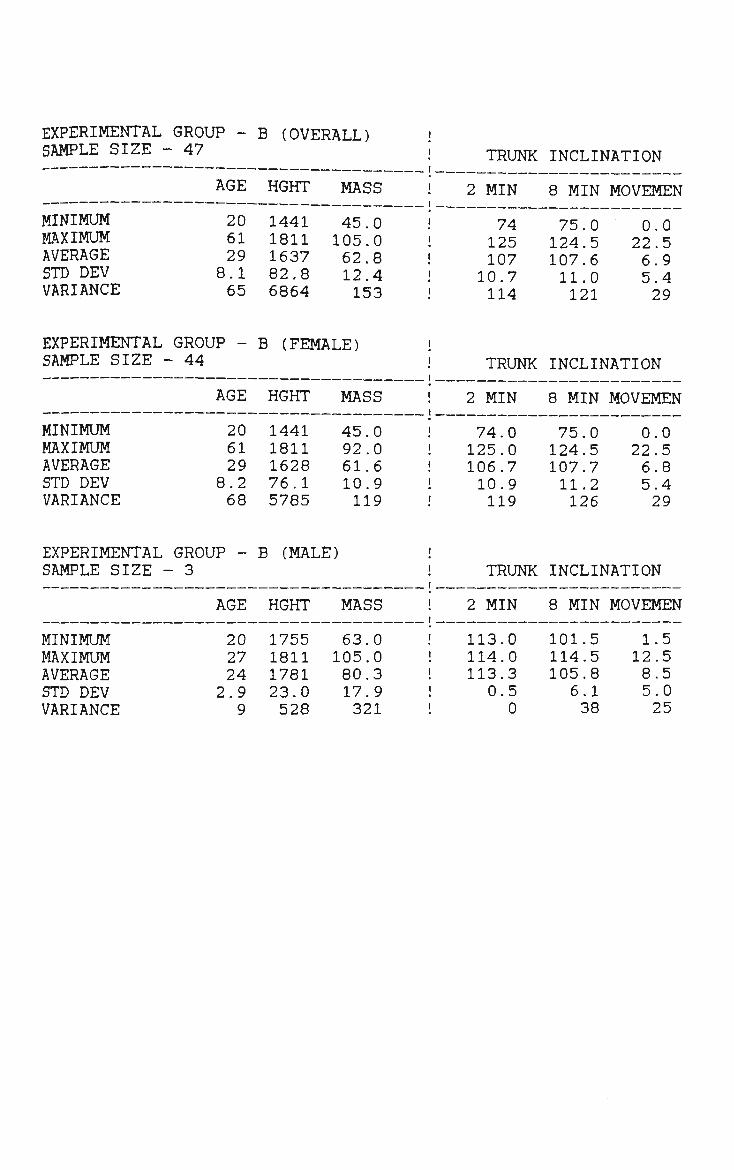
EXPERIMENTAL GROUP -SAMPLE SIZE - 47
AGE
MINIMUM 20 MAXIMUM 61 AVERAGE 29 STD DEV 8.1 VARIANCE 65
B (OVERALL)
HGHT
1441 1811 1637 82.8 6864
MASS
45.0 105.0 62.8 12.4 153
TRUNK
2 MIN
74 125 107 10.7 114
INCLINATION
8 MIN
75.0 124.5 107.6 11.0 121
MOVEMEN
0.0 22.5 6.9 5.4 29
EXPERIMENTAL GROUP -SAMPLE SIZE - 44
AGE
MINIMUM 20 MAXIMUM 61 AVERAGE 29 STD DEV 8.2 VARIANCE 68
B (FEMALE)
HGHT
1441 1811 1628 76.1 5785
MASS
45.0 92.0 61.6 10.9 119
TRUNK
2 MIN
74.0 125.0 106.7 10.9 119
INCLINATION
8 MIN
75.0 124.5 107.7 11.2 126
MOVEMEN
0.0 22.5 6.8 5.4 29
EXPERIMENTAL GROUP SAMPLE SIZE - 3
B (MALE) TRUNK INCLINATION
2 MIN 8 MIN MOVEMEN AGE HGHT MASS
MINIMUM MAXIMUM AVERAGE STD DEV VARIANCE
20 27 24 .9 9
1755 1811 1781 23.0 528
63.0 105.0 80.3 17.9 321
113 114 113
0
0 0 3 5 0
101.5 114.5 105.8 6.1 38
1.5 12.5 8.5 5.0 25
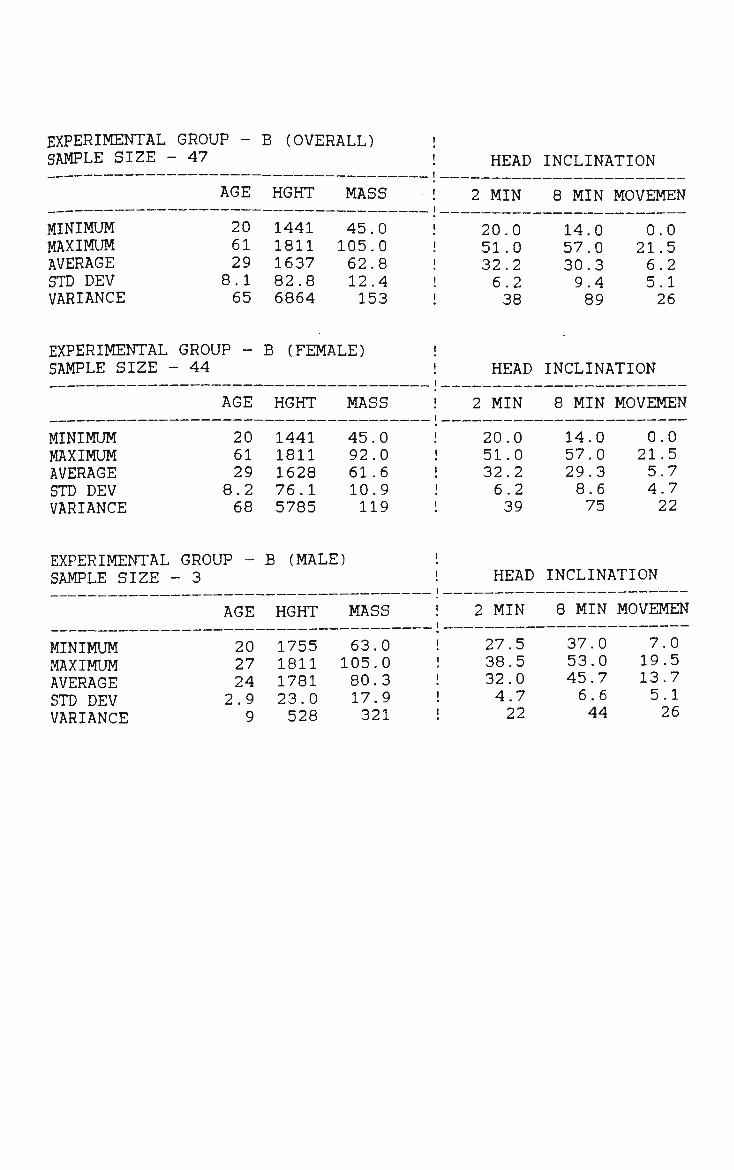
EXPERIMENTAL GROUP -SAMPLE SIZE - 47
AGE
MINIMUM 20 MAXIMUM 61 AVERAGE 29 STD DEV 8 .1 VARIANCE 65
EXPERIMENTAL GROUP -SAMPLE SIZE - 44
AGE
MINIMUM 20 MAXIMUM 61 AVERAGE 29 STD DEV 8.2 VARIANCE 68
B (OVERALL)
HGHT MASS !
1441 45.0 1811 105.0 1637 62.8 82.8 12.4 6864 153
B (FEMALE)
HGHT
1441 1811 1628 76.1 5785
MASS
45.0 92.0 61.6 10.9 119
HEAD
2 MIN
20.0 51.0 32.2 6.2 38
HEAD
2 MIN
20.0 ! 51.0 ! 32.2 ! 6.2 ! 39
INCLINATION
8 MIN MOVEMEN
14.0 0.0 57.0 21.5 30.3 6.2 9.4 5.1 89 26
INCLINATION
8 MIN
14.0 57.0 29.3 8.6 75
MOVEMEN
0.0 21.5 5.7 4.7 22
EXPERIMENTAL GROUP -SAMPLE SIZE - 3
AGE
MINIMUM 20 MAXIMUM 27 AVERAGE 24 STD DEV 2.9 VARIANCE 9
B (MALE)
HGHT
1755 1811 1781 23.0 528
MASS
63.0 105.0 80.3 17.9 321
HEAD
2 MIN
27.5 38.5 32.0 4.7 22
INCLINATION
8 MIN
37.0 53.0 45.7 6.6 44
MOVEMEN
7.0 19.5 13.7 5.1 26
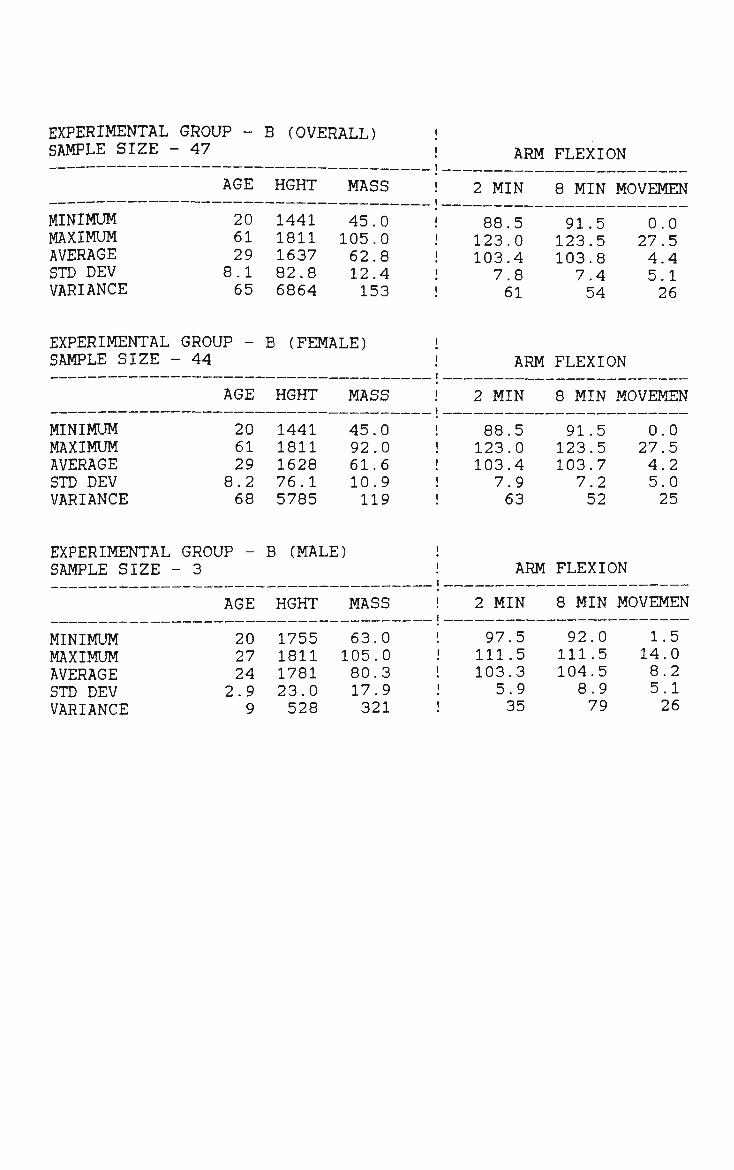
EXPERIMENTAL GROUP -SAMPLE SIZE - 47
AGE
MINIMUM 20 MAXIMUM 61 AVERAGE 29 STD DEV 8.1 VARIANCE 65
EXPERIMENTAL GROUP -SAMPLE SIZE - 44
AGE
MINIMUM 20 MAXIMUM 61 AVERAGE 29 STD DEV 8.2 VARIANCE 68
B (OVERALL)
HGHT MASS
1441 45.0 1811 105.0 1637 62.8 82.8 12.4 6864 153
B (FEMALE)
HGHT
1441 1811 1628 76.1 5785
MASS
45.0 92.0 61.6 10.9 119
ARM
2 MIN
88.5 123.0 103.4 7.8 61
ARM
2 MIN
88.5 123.0 103.4 7.9 63
FLEXION
8 MIN MOVEMEN
91.5 123.5 103.8 7.4 54
FLEXION
8 MIN
91.5 123.5 103.7 7.2 52
0.0 27.5 4.4 5.1 26
MOVEMEN
0.0 27.5 4.2 5.0 25
EXPERIMENTAL GROUP -SAMPLE SIZE - 3
AGE
MINIMUM 20 MAXIMUM 27 AVERAGE 24 STD DEV 2.9 VARIANCE 9
B (MALE)
HGHT
1755 1811 1781 23.0 528
MASS
63.0 105.0 80.3 17.9 321
ARM
2 MIN
97.5 111.5 103.3 5.9 35
FLEXION
8 MIN
92.0 111.5 104.5 8.9 79
MOVEMEN
1.5 14.0 8.2 5.1 26
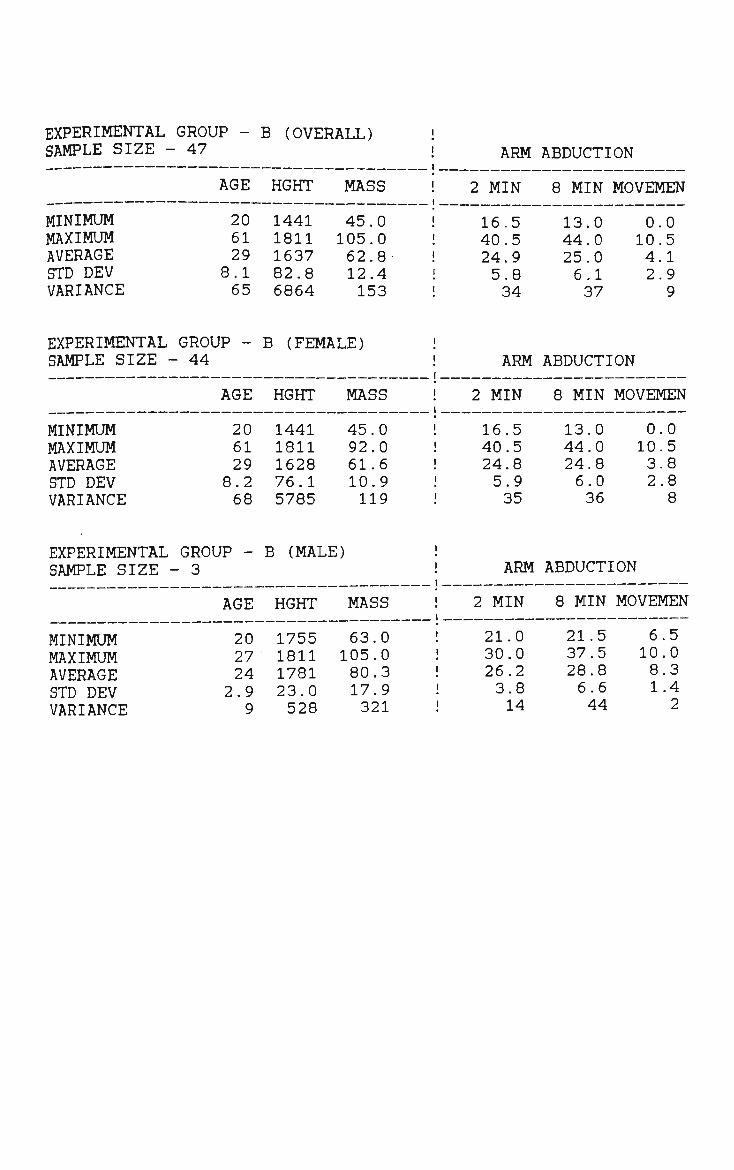
EXPERIMENTAL GROUP -SAMPLE SIZE - 47
AGE
MINIMUM 20 MAXIMUM 61 AVERAGE 29 STD DEV 8.1 VARIANCE 65
B (OVERALL)
HGHT
1441 1811 1637 82.8 6864
MASS
45.0 105.0 62.8 12.4 153
ARM
2 MIN
16.5 40.5 24.9 5.8 34
ABDUCTION
8 MIN
13.0 44.0 25.0 6.1 37
MOVEMEN
0.0 10.5 4.1 2.9 9
EXPERIMENTAL GROUP -SAMPLE SIZE - 44
AGE
MINIMUM 20 MAXIMUM 61 AVERAGE 29 STD DEV 8.2 VARIANCE 68
B (FEMALE)
HGHT
1441 1811 1628 76.1 5785
MASS
45.0 92.0 61.6 10.9 119
ARM
2 MIN
16.5 40.5 24.8 5.9 35
ABDUCTION
8 MIN
13.0 44.0 24.8 6.0 36
MOVEMEN
0.0 10.5 3.8 2.8 8
EXPERIMENTAL GROUP SAMPLE SIZE - 3
B (MALE) ARM ABDUCTION
2 MIN 8 MIN MOVEMEN AGE HGHT MASS
MINIMUM MAXIMUM AVERAGE STD DEV VARIANCE
20 27 24 2.9
9
1755 1811 1781 23.0 528
63.0 105.0 80.3 17.9 321
21.0 30.0 26.2 3.8 14
21.5 37.5 28.8 6.6 44
6.5 10.0 8.3 1.4
2
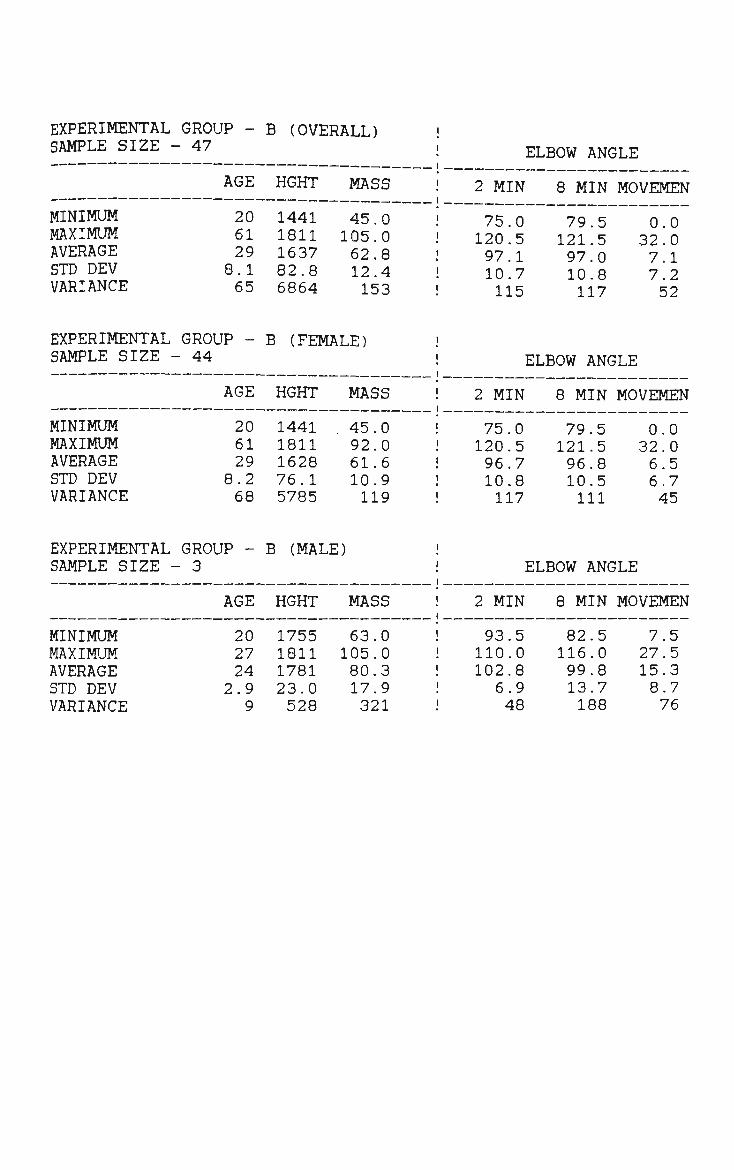
EXPERIMENTAL GROUP - B (OVERALL) SAMPLE SIZE - 47 ELBOW ANGLE
2 MIN 8 MIN MOVEMEN AGE HGHT MASS
MINIMUM MAXIMUM AVERAGE STD DEV VARIANCE
20 61 29 8.1 65
1441 1811 1637 82.8 6864
45.0 105.0 62.8 12.4 153
75.0 20.5 97.1 10.7 115
79.5 121.5 97.0 10.8 117
0.0 32.0 7.1 7.2 52
EXPERIMENTAL SAMPLE SIZE -
MINIMUM MAXIMUM AVERAGE STD DEV VARIANCE
GROUP -- 44
AGE
20 61 29
8.2 68
B (FEMALE)
HGHT
1441 1811 1628 76.1 5785
MASS
45.0 92.0 61.6 10.9 119
ELBOW ANGLE
2 MIN
75.0 120.5 96.7 10.8 117
8 MIN
79.5 121.5 96.8 10.5 111
MOVEMEN
0.0 32.0 6.5 6.7 45
EXPERIMENTAL GROUP - B SAMPLE SIZE - 3
(MALE) ELBOW ANGLE
2 MIN 8 MIN MOVEMEN AGE HGHT MASS
MINIMUM MAXIMUM AVERAGE STD DEV VARIANCE
20 1755 63.0 27 1811 105.0 24 1781 80.3 2.9 23.0 17.9 9 528 321
93.5 110.0 102.8 6.9 48
82.5 116.0 99.8 13.7 188
7.5 27.5 15.3 8.7 76
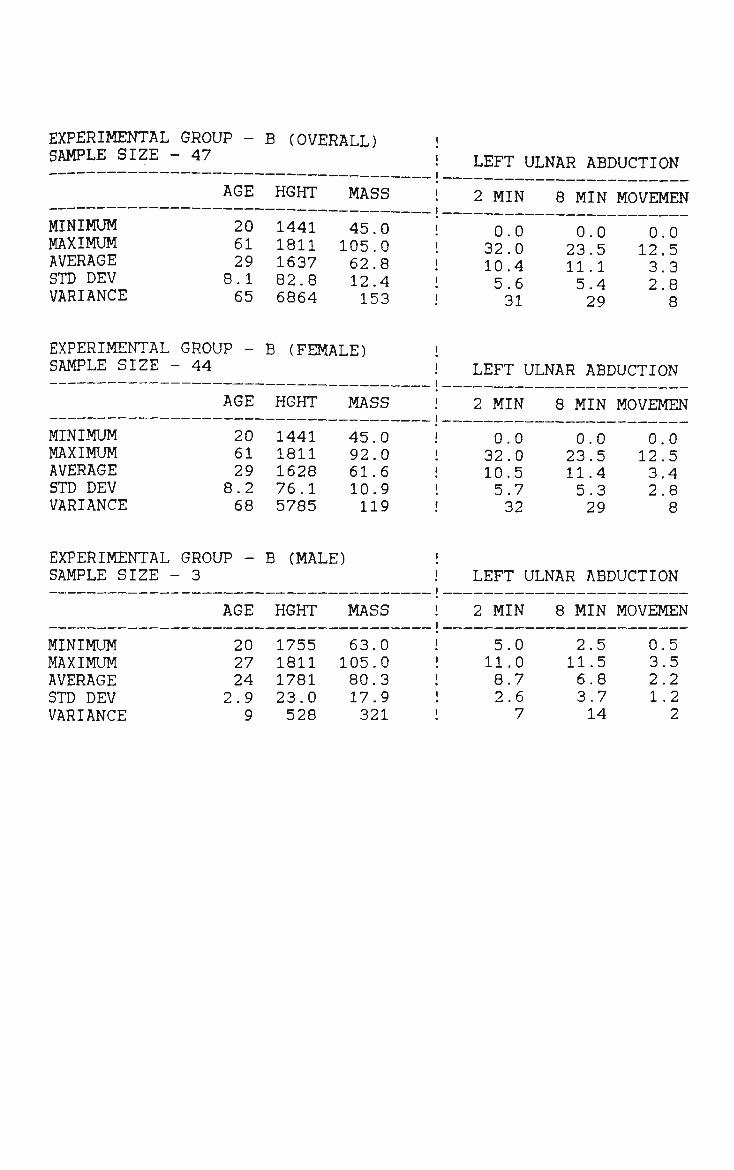
EXPERIMENTAL GROUP SAMPLE SIZE - 47
B (OVERALL) LEFT ULNAR ABDUCTION
2 MIN 8 MIN MOVEMEN AGE HGHT MASS
MINIMUM MAXIMUM AVERAGE STD DEV VARIANCE
20 61 29
8.1 65
1441 1811 1637 82.8 6864
45.0 105.0 62.8 12.4 153
0.0 32.0 10.4 5.6 31
0.0 23.5 11.1 5.4 29
0.0 12.5 3.3 2.8 8
EXPERIMENTAL GROUP -SAMPLE SIZE - 44
AGE
MINIMUM 20 MAXIMUM 61 AVERAGE 29 STD DEV 8.2 VARIANCE 68
B (FEMALE)
HGHT
1441 1811 1628 76.1 5785
MASS
45.0 92.0 61.6 10.9 119
LEFT ULNAR ABDUCTION
2 MIN
0.0 32.0 10.5 5.7 32
8 MIN
0.0 23.5 11.4 5.3 29
MOVEMEN
0.0 12.5 3.4 2.8 8
EXPERIMENTAL GROUP - B (MALE) SAMPLE SIZE - 3 LEFT ULNAR ABDUCTION
2 MIN 8 MIN MOVEMEN AGE HGHT MASS
MINIMUM MAXIMUM AVERAGE STD DEV VARIANCE
20 27 24 .9 9
1755 1811 1781 23.0 528
63.0 105.0 80.3 17.9 321
5.0 11.0 8.7 2.6 7
2.5 11.5 6.8 3.7 14
0.5 3.5 2.2 1.2 2

STATISTICAL SUMMARY BY NATIONALITY - A
(TABLES)
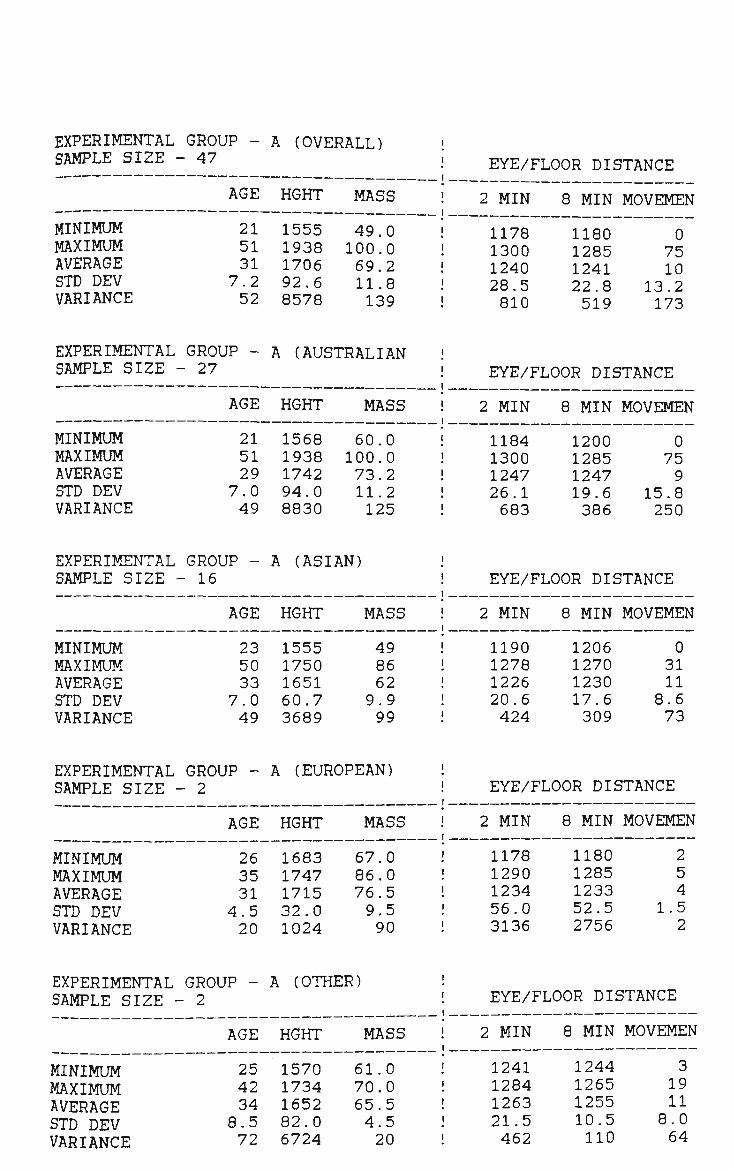
EXPERIMENTAL GROUP -SAMPLE SIZE - 47
AGE
MINIMUM 21 MAXIMUM 51 AVERAGE 31 STD DEV 7.2 VARIANCE 52
A (OVERALL)
HGHT
1555 1938 1706 92.6 8578
MASS
49.0 100.0 69.2 11.8 139
EYE/FLOOR DISTANCE
2 MIN
1178 1300 1240 28.5 810
8 MIN
1180 1285 1241 22.8 519
MOVEMEN
0 75 10
13.2 173
EXPERIMENTAL GROUP - A (AUSTRALIAN SAMPLE SIZE - 27 EYE/FLOOR DISTANCE
2 MIN 8 MIN MOVEMEN AGE HGHT MASS
MINIMUM MAXIMUM AVERAGE STD DEV VARIANCE
21 51 29
7.0 49
1568 1938 1742 94.0 8830
60.0 100.0 73.2 11.2 125
1184 1300 1247 26.1 683
1200 1285 1247 19.6 386
0 75 9
15.8 250
EXPERIMENTAL GROUP -SAMPLE SIZE - 16
AGE
MINIMUM 23 MAXIMUM 50 AVERAGE 33 STD DEV 7.0 VARIANCE 49
A (ASIAN)
HGHT
1555 1750 1651 60.7 3689
MASS
49 86 62 9.9 99
EYE/FLOOR DISTANCE
2 MIN
1190 1278 1226 20.6 424
8 MIN MOVEMEN
1206 0 1270 31 1230 11 17.6 8.6 309 73
EXPERIMENTAL GROUP -SAMPLE SIZE - 2
AGE
MINIMUM 26 MAXIMUM 35 AVERAGE 31 STD DEV 4.5 VARIANCE 20
A (EUROPEAN)
HGHT
1683 1747 1715 32.0 1024
MASS
67.0 86.0 76.5 9.5 90
EYE/FLOOR DISTANCE
2 MIN
1178 1290 1234 56.0 3136
8 MIN MOVEMEN
1180 2 1285 5 1233 4 52.5 1.5 2756 2
EXPERIMENTAL GROUP -SAMPLE SIZE - 2
AGE
MINIMUM 25 MAXIMUM 42 AVERAGE 34 STD DEV 8.5 VARIANCE 72
A (OTHER)
HGHT
1570 1734 1652 82.0 6724
MASS
61.0 70.0 65.5 4.5 20
EYE/FLOOR DISTANCE
2 MIN
1241 1284 1263 21.5 462
8 MIN MOVEMEN
1244 3 1265 19 1255 11 10.5 8.0 110 64
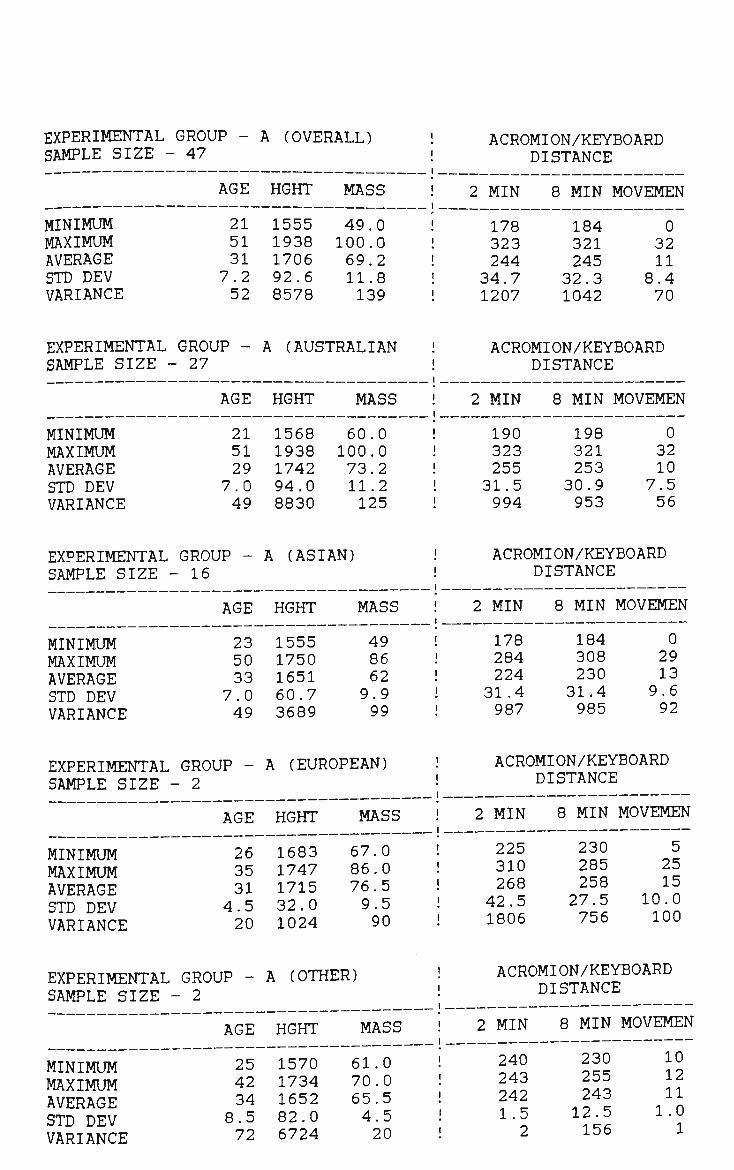
EXPERIMENTAL GROUP -SAMPLE SIZE - 47
AGE
MINIMUM 21 MAXIMUM 51 AVERAGE 31 STD DEV 7.2 VARIANCE 52
A (OVERALL)
HGHT
1555 1938 1706 92.6 8578
MASS
49.0 100.0 69.2 11.8 139
ACROMION/KEYBOARD DISTANCE
2 MIN
178 323 244
34.7 1207
8 MIN MOVEMEN
184 0 321 32 245 11
32.3 8.4 1042 70
EXPERIMENTAL GROUP -SAMPLE SIZE - 27
AGE
MINIMUM 21 MAXIMUM 51 AVERAGE 29 STD DEV 7.0 VARIANCE 49
A (AUSTRALIAN
HGHT
1568 1938 1742 94.0 8830
MASS
60.0 100.0 73.2 11.2 125
ACROMION/KEYBOARD DISTANCE
2 MIN
190 323 255
! 31.5 994
8 MIN MOVEMEN
198 0 321 32 253 10
30.9 7.5 953 56
EXPERIMENTAL SAMPLE SIZE -
MINIMUM MAXIMUM AVERAGE STD DEV VARIANCE
GROUP -- 16
AGE
23 50 33
7.0 49
A (ASIAN)
HGHT
1555 1750 1651 60.7 3689
MASS
49 86 62 9.9 99
ACROMION/KEYBOARD DISTANCE
2 MIN
178 284 224 31.4 987
8 MIN MOVEMEN
184 0 308 29 230 13 31.4 9.6 985 92
EXPERIMENTAL GROUP -SAMPLE SIZE - 2
AGE
MINIMUM 26 MAXIMUM 35 AVERAGE 31 STD DEV 4.5 VARIANCE 20
A (EUROPEAN)
HGHT
1683 1747 1715 32.0 1024
MASS
67.0 86.0 76.5 9.5 90
ACROMION/KEYBOARD DISTANCE
2 MIN
225 310 268
42.5 1806
8 MIN
230 285 258
27.5 756
MOVEMEN
5 25 15
10.0 100
EXPERIMENTAL GROUP -SAMPLE SIZE - 2
AGE
MINIMUM 25 MAXIMUM 42 AVERAGE 34 STD DEV 8.5 VARIANCE 72
A (OTHER)
HGHT
1570 1734 1652 82.0 6724
MASS
61.0 70.0 65.5 4.5 20
ACROMION/KEYBOARD DISTANCE
2 MIN
240 243 242 1.5
2
8 MIN MOVEMEN
230 10 255 12 243 11 12.5 1.0 156 1
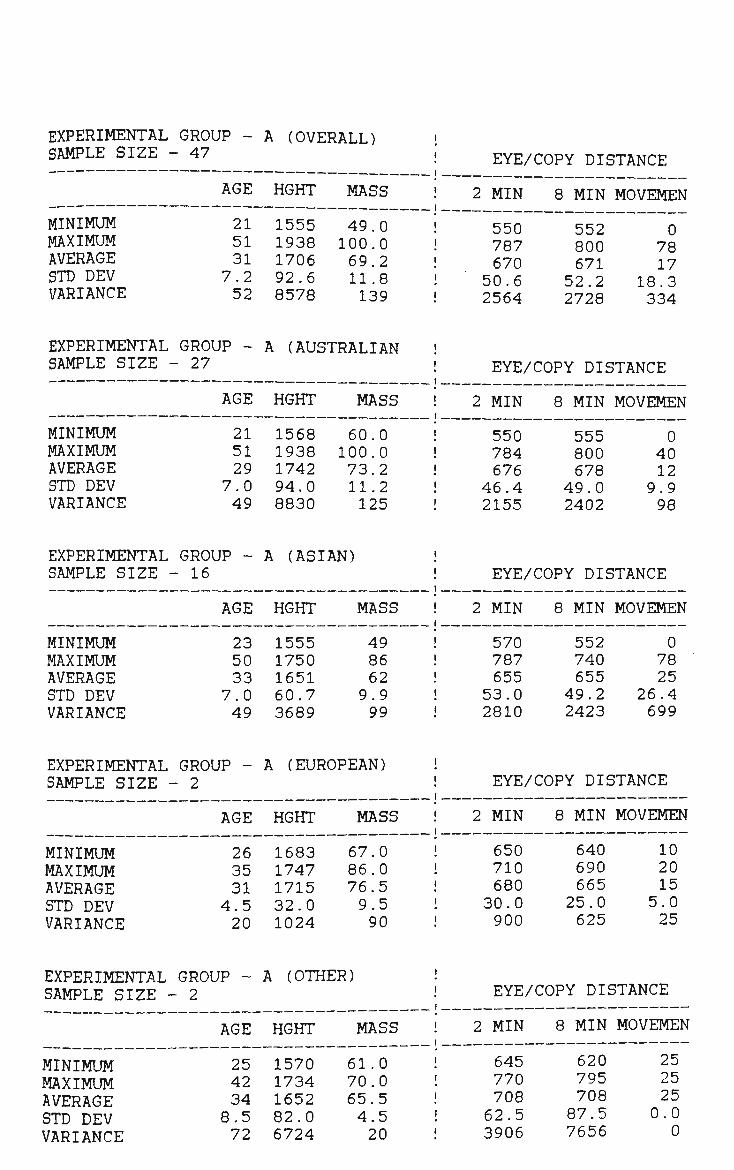
EXPERIMENTAL GROUP -SAMPLE SIZE - 47
AGE
MINIMUM 21 MAXIMUM 51 AVERAGE 31 STD DEV 7.2 VARIANCE 52
A (OVERALL)
HGHT
1555 1938 1706 92.6 8578
MASS
49.0 100.0 69.2 11.8 139
EYE/COPY DISTANCE
2 MIN
550 787 670 50.6 2564
8 MIN
552 800 671
52.2 2728
MOVEMEN
0 78 17
18.3 334
EXPERIMENTAL GROUP - A (AUSTRALIAN SAMPLE SIZE - 27 EYE/COPY DISTANCE
2 MIN 8 MIN MOVEMEN AGE HGHT MASS
MINIMUM MAXIMUM AVERAGE STD DEV VARIANCE
21 51 29
7.0 49
1568 1938 1742 94.0 8830
60.0 100.0 73.2 11.2 125
550 784 676
46.4 2155
555 800 678
49.0 2402
0 40 12
9.9 98
EXPERIMENTAL SAMPLE SIZE -
MINIMUM MAXIMUM AVERAGE STD DEV VARIANCE
GROUP -- 16
AGE
23 50 33
7.0 49
A (ASIAN)
HGHT
1555 1750 1651 60.7 3689
MASS
49 86 62
9.9 99
EYE/COPY DISTANCE
2 MIN
570 787 655 53.0 2810
8 MIN
552 740 655
49.2 2423
MOVEMEN
0 78 25
26.4 699
EXPERIMENTAL GROUP -SAMPLE SIZE - 2
AGE
MINIMUM 26 MAXIMUM 35 AVERAGE 31 STD DEV 4.5 VARIANCE 20
A (EUROPEAN)
HGHT
1683 1747 1715 32.0 1024
MASS
67.0 86.0 76.5 9.5 90
EYE/COPY DISTANCE
2 MIN
650 710 680
30.0 900
8 MIN MOVEMEN
640 10 690 20 665 15 25.0 5.0 625 25
EXPERIMENTAL GROUP -SAMPLE SIZE - 2
AGE
MINIMUM 25 MAXIMUM 42 AVERAGE 34 STD DEV 8.5 VARIANCE 72
A (OTHER)
HGHT
1570 1734 1652 82.0 6724
MASS
61.0 70.0 65.5 4.5 20
EYE/COPY DISTANCE
2 MIN
645 770 708 62.5 3906
8 MIN MOVEMEN
620 25 795 25 708 25 87.5 0.0 7656 0

EXPERIMENTAL SAMPLE SIZE -
MINIMUM MAXIMUM AVERAGE STD DEV VARIANCE
GROUP -- 47
AGE
21 51 31 7.2 52
A (OVERALL)
HGHT
1555 1938 1706 92.6 8578
MASS
49.0 100.0 69.2 11.8 139
TRUNK
2 MIN
88.0 130.0 108.9 10.1 102
INCLINATION
8 MIN
89.0 129.0 110.1 10.3 106
MOVEMEN
0.0 27.0 5.5 5.5 30
EXPERIMENTAL SAMPLE SIZE -
MINIMUM MAXIMUM AVERAGE STD DEV VARIANCE
GROUP -- 27
AGE
21 51 29 7.0 49
A (AUSTRALIAN
HGHT
1568 1938 1742 94.0 8830
MASS
60.0 100.0 73.2 11.2 125
TRUNK
2 MIN
88.0 119.0 106.7 9.7 94
INCLINATION
8 MIN
89.0 123.0 107.7 8.9 79
MOVEMEN
0.0 10.0 3.9 2.8 8
EXPERIMENTAL GROUP -SAMPLE SIZE - 16
AGE
MINIMUM 23 MAXIMUM 50 AVERAGE 33 STD DEV 7.0 VARIANCE 49
A (ASIAN]
HGHT
1555 1750 1651 60.7 3689
MASS
49 86 62 9.9 99
TRUNK
2 MIN
92.0 130.0 111.9 10.7 115
INCLINATION
8 MIN
90.0 129.0 112.9 12.3 152
MOVEMEN
0.0 27.0 8.7 7.5 57
EXPERIMENTAL GROUP -SAMPLE SIZE - 2
AGE
MINIMUM 26 MAXIMUM 35 AVERAGE 31 STD DEV 4.5 VARIANCE 20
A (EUROPEAN)
HGHT
1683 1747 1715 32.0 1024
MASS
67.0 86.0 76.5 9.5 90
TRUNK
2 MIN
113.5 115.0 114.3 0.8
1
INCLINATION
8 MIN MOVEMEN
115.0 0.0 118.0 4.5 116.5 2.3 1.5 2.3 2 5
EXPERIMENTAL GROUP - A (OTHER) SAMPLE SIZE - 2 TRUNK INCLINATION
2 MIN 8 MIN MOVEMEN AGE
25 42 34 8.5 72
HGHT
1570 1734 1652 82.0 6724
MAS
61.0 70.0 65.5 4.5 20
MINIMUM MAXIMUM AVERAGE STD DEV VARIANCE
102.5 116.0 109.3 6.8 46
111 115 113
1
.5
.0
.3
.8 3
1.0 9.0 5.0 4.0 16
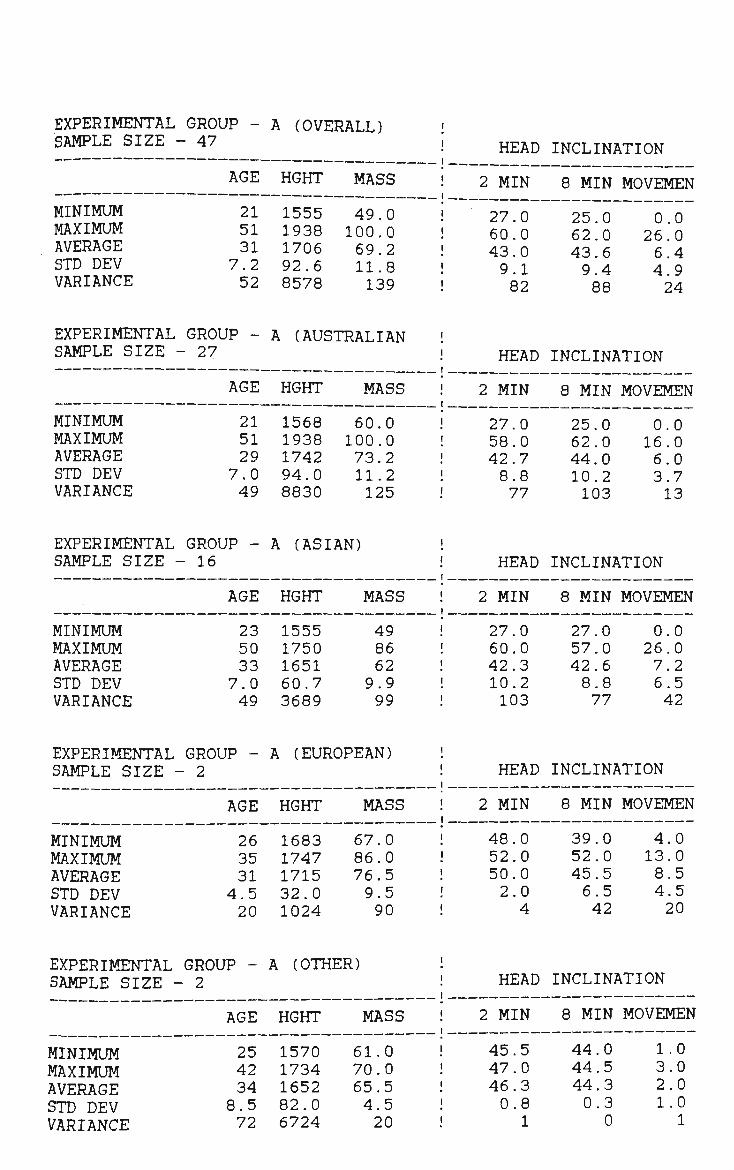
EXPERIMENTAL GROUP -SAMPLE SIZE - 47
AGE
MINIMUM 21 MAXIMUM 51 AVERAGE 31 STD DEV 7.2 VARIANCE 52
A (OVERALL)
HGHT
1555 1938 1706 92.6 8578
MASS
49.0 100.0 69.2 11.8 139
HEAD
2 MIN
27.0 60.0 43.0 9.1 82
INCLINATION
8 MIN
25.0 62.0 43.6 9.4 88
MOVEMEN
0.0 26.0 6.4 4.9 24
EXPERIMENTAL GROUP -SAMPLE SIZE - 27
AGE
MINIMUM 21 MAXIMUM 51 AVERAGE 29 STD DEV 7.0 VARIANCE 49
A (AUSTRALIAN
HGHT
1568 1938 1742 94.0 8830
MASS
60.0 100.0 73.2 11.2 125
HEAD
2 MIN
27.0 58.0 42.7 8.8 77
INCLINATION
8 MIN
25.0 62.0 44.0 10.2 103
MOVEMEN
0.0 16.0 6.0 3.7 13
EXPERIMENTAL GROUP -SAMPLE SIZE - 16
AGE
MINIMUM 23 MAXIMUM 50 AVERAGE 33 STD DEV 7.0 VARIANCE 49
A (ASIAN)
HGHT
1555 1750 1651 60.7 3689
MASS
49 86 62 9.9 99
HEAD
2 MIN
27.0 60.0 42.3 10.2 103
INCLINATION
8 MIN
27.0 57.0 42.6 8.8 77
MOVEMEN
0.0 26.0 7.2 6.5 42
EXPERIMENTAL GROUP -SAMPLE SIZE - 2
AGE
MINIMUM 26 MAXIMUM 35 AVERAGE 31 STD DEV 4.5 VARIANCE 20
A (EUROPEAN)
HGHT
1683 1747 1715 32.0 1024
MASS
67.0 86.0 76.5 9.5 90
HEAD
2 MIN
48.0 52.0 50.0 2.0 4
INCLINATION
8 MIN
39.0 52.0 45.5 6.5 42
MOVEMEN
4.0 13.0 8.5 4.5 20
EXPERIMENTAL GROUP -SAMPLE SIZE - 2
AGE
MINIMUM 25 MAXIMUM 42 AVERAGE 34 STD DEV 8.5 VARIANCE 72
A (OTHER)
HGHT
1570 1734 1652 82.0 6724
MASS
61.0 70.0 65.5 4.5 20
HEAD
2 MIN
45.5 47.0 46.3 0.8
1
INCLINATION
8 MIN MOVEMEN
44.0 1.0 44.5 3.0 44.3 2.0 0.3 1.0
0 1
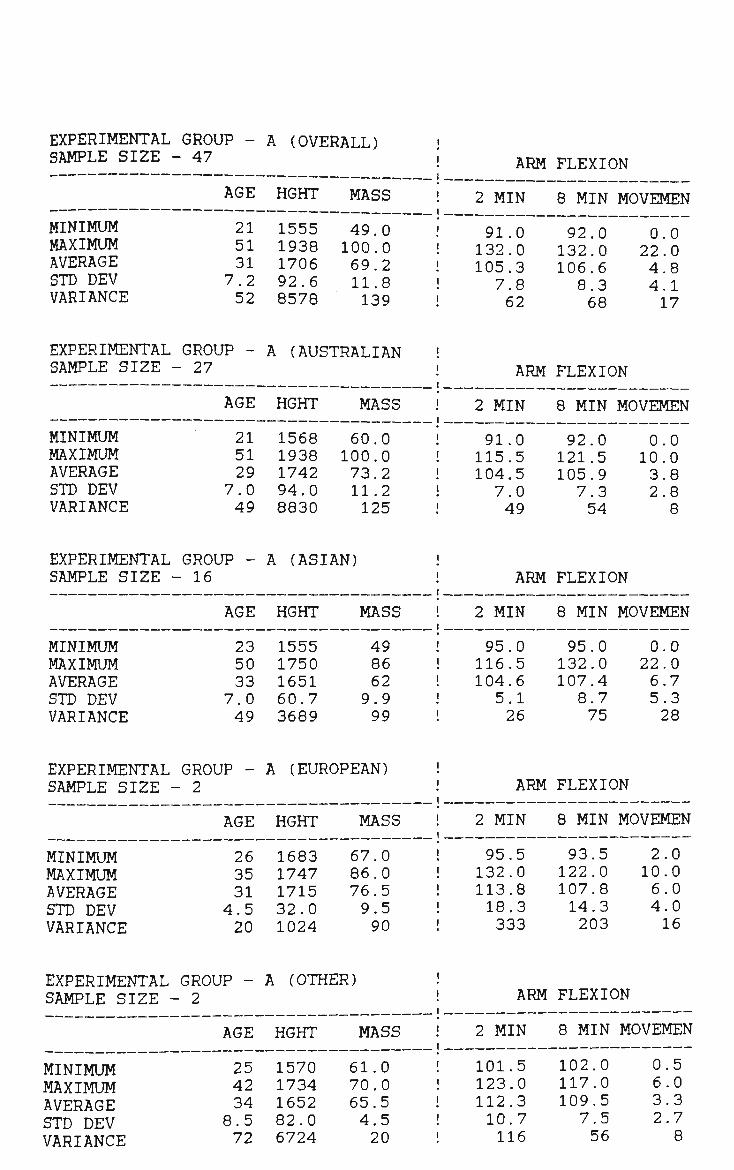
EXPERIMENTAL GROUP - A (OVERALL) SAMPLE SIZE - 47 ARM FLEXION
2 MIN 8 MIN MOVEMEN AGE HGHT MASS
MINIMUM MAXIMUM AVERAGE STD DEV VARIANCE
21 51 31 7.2 52
1555 1938 1706 92.6 8578
49.0 100.0 69.2 11.8 139
91.0 132.0 105.3 7.8 62
92.0 132.0 106.6 8.3 68
0.0 22.0 4.8 4.1 17
EXPERIMENTAL GROUP -SAMPLE SIZE - 27
AGE
MINIMUM 21 MAXIMUM 51 AVERAGE 29 STD DEV 7.0 VARIANCE 49
A (AUSTRALIAN
HGHT
1568 1938 1742 94.0 8830
MASS
60.0 100.0 73.2 11.2 125
ARM
2 MIN
91.0 115.5 104.5 7.0 49
FLEXION
8 MIN
92.0 121.5 105.9 7.3 54
MOVEMEN
0.0 10.0 3.8 2.8 8
EXPERIMENTAL GROUP -SAMPLE SIZE - 16
AGE
MINIMUM 23 MAXIMUM 50 AVERAGE 33 STD DEV 7.0 VARIANCE 49
A (ASIAN)
HGHT
1555 1750 1651 60.7 3689
MASS
49 86 62 9.9 99
ARM
2 MIN
95.0 116.5 104.6 5.1 26
FLEXION
8 MIN
95.0 132.0 107.4 8.7 75
MOVEMEN
0.0 22.0 6.7 5.3 28
EXPERIMENTAL GROUP -SAMPLE SIZE - 2
AGE
MINIMUM 26 MAXIMUM 35 AVERAGE 31 STD DEV 4.5 VARIANCE 20
A (EUROPEAN)
HGHT
1683 1747 1715 32.0 1024
MASS
67.0 86.0 76.5 9.5 90
ARM
2 MIN
95.5 132.0 113.8 18.3 333
FLEXION
8 MIN
93.5 122.0 107.8 14.3 203
MOVEMEN
2.0 10.0 6.0 4.0 16
EXPERIMENTAL GROUP -SAMPLE SIZE - 2
AGE
MINIMUM 25 MAXIMUM 42 AVERAGE 34 STD DEV 8.5 VARIANCE 72
A (OTHER)
HGHT
1570 1734 1652 82.0 6724
MASS
61.0 70.0 65.5 4.5 20
ARM
2 MIN
101.5 123.0 112.3 10.7 116
FLEXION
8 MIN MOVEMEN
102.0 0.5 117.0 6.0 109.5 3.3 7.5 2.7 56 8
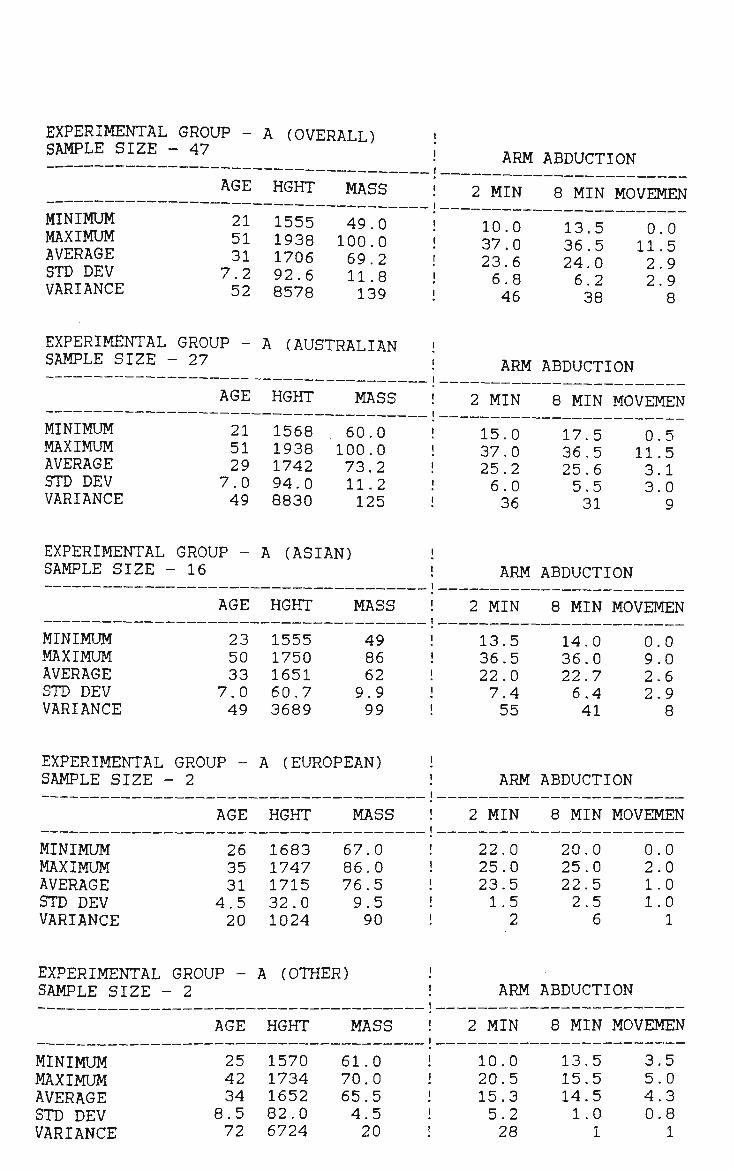
EXPERIMENTAL SAMPLE SIZE
MINIMUM MAXIMUM AVERAGE STD DEV VARIANCE
. GROUP -- 47
AGE
21 51 31 7.2 52
A (OVERALL)
HGHT
1555 1938 1706 92.6 8578
MASS
49.0 100.0 69.2 11.8 139
ARM
2 MIN
10.0 37.0 23.6 6.8 46
ABDUCTION
8 MIN
13.5 36.5 24.0 6.2 38
MOVEMEN
0.0 11.5 2.9 2.9 8
EXPERIMENTAL GROUP -SAMPLE SIZE - 27
AGE
MINIMUM 21 MAXIMUM 51 AVERAGE 29 STD DEV 7.0 VARIANCE 49
A (AUSTRALIAN
HGHT MASS
1568 60.0 1938 100.0 1742 73.2 94.0 11.2 8830 125
ARM
2 MIN
15.0 37.0 25.2 6.0 36
ABDUCTION
8 MIN
17.5 36.5 25.6 5.5 31
MOVEMEN
0.5 11.5 3.1 3.0
9
EXPERIMENTAL GROUP -SAMPLE SIZE - 16
AGE
MINIMUM 23 MAXIMUM 50 AVERAGE 33 STD DEV 7.0 VARIANCE 49
A (ASIAN)
HGHT
1555 1750 1651 60.7 3689
MASS
49 86 62 9.9 99
ARM
2 MIN
13.5 36.5 22.0 7.4 55
ABDUCTION
8 MIN MOVEMEN
14.0 0.0 36.0 9.0 22.7 2.6 6.4 2.9 41 8
EXPERIMENTAL GROUP -SAMPLE SIZE - 2
AGE
MINIMUM 26 MAXIMUM 35 AVERAGE 31 STD DEV 4.5 VARIANCE 20
A (EUROPEAN)
HGHT
1683 1747 1715 32.0 1024
MASS
67.0 86.0 76.5 9.5 90
ARM
2 MIN
22.0 25.0 23.5 1.5 2
ABDUCTION
8 MIN MOVEMEN
20.0 0.0 25.0 2.0 22.5 1.0 2.5 1.0
6 1
EXPERIMENTAL GROUP - A SAMPLE SIZE - 2
(OTHER) ARM ABDUCTION
2 MIN 8 MIN MOVEMEN AGE HGHT MASS
MINIMUM MAXIMUM AVERAGE STD DEV VARIANCE
25 42 34 8.5 72
1570 1734 1652 82.0 6724
61.0 70.0 65.5 4.5 20
10.0 20.5 15.3 5.2 28
13.5 15.5 14.5 1.0 1
3.5 5.0 4.3 0.8 1
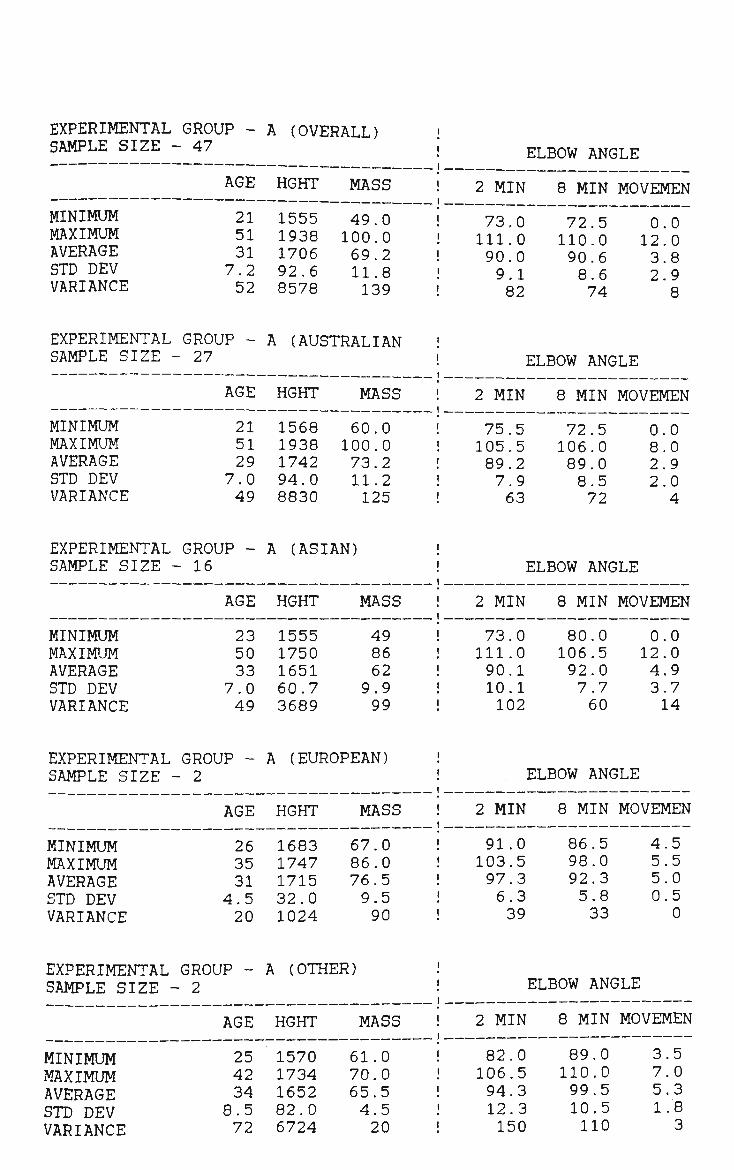
EXPERIMENTAL GROUP -SAMPLE SIZE - 47
AGE
MINIMUM 21 MAXIMUM 51 AVERAGE 31 STD DEV 7.2 VARIANCE 52
A (OVERALL)
HGHT
1555 1938 1706 92.6 8578
MASS
49.0 100.0 69.2 11.8 139
ELBOW ANGLE
2 MIN
73.0 111.0 90.0 9.1 82
8 MIN
72.5 110.0 90.6 8.6 74
MOVEMEN
0.0 12.0 3.8 2.9 8
EXPERIMENTAL GROUP SAMPLE SIZE - 27
A (AUSTRALIAN ELBOW ANGLE
2 MIN 8 MIN MOVEMEN AGE HGHT MASS
MINIMUM MAXIMUM AVERAGE STD DEV VARIANCE
21 51 29 7.0 49
1568 1938 1742 94.0 8830
60.0 100.0 73.2 11.2 125
75.5 105.5 89.2 7.9 63
72.5 106.0 89.0 8.5 72
0 8 2 2
0 0 9 .0 4
EXPERIMENTAL SAMPLE SIZE
MINIMUM MAXIMUM AVERAGE STD DEV VARIANCE
. GROUP -- 16
AGE
23 50 33 7.0 49
A (ASIAN)
HGHT
1555 1750 1651 60.7 3689
MASS
49 86 62 9.9 99
ELBOW ANGLE
2 MIN
73.0 111.0 90.1 10.1 102
8 MIN
80.0 106.5 92.0 7.7 60
MOVEMEN
0.0 12.0 4.9 3.7 14
EXPERIMENTAL GROUP - A (EUROPEAN) SAMPLE SIZE - 2 ELBOW ANGLE
2 MIN 8 MIN MOVEMEN AGE
26 35 31
4.5 20
HGHT
1683 1747 1715 32.0 1024
MAS
67.0 86.0 76.5 9.5 90
MINIMUM MAXIMUM AVERAGE STD DEV VARIANCE
91.0 03.5 97.3 6.3 39
86.5 98.0 92.3 5.8 33
4 5 5 0
5 5 0 5 0
EXPERIMENTAL GROUP -SAMPLE SIZE - 2
AGE
MINIMUM 25 MAXIMUM 42 AVERAGE 34 STD DEV 8.5 VARIANCE 72
A (OTHER)
HGHT
1570 1734 1652 82.0 6724
MASS
61.0 70.0 65.5 4.5 20
ELBOW ANGLE
2 MIN
82.0 106.5 94.3 12.3 150
8 MIN MOVEMEN
89.0 3.5 110.0 7.0 99.5 5.3 10.5 1.8 110 3

EXPERIMENTAL SAMPLE SIZE -
MINIMUM
MAXIMUM AVERAGE STD DEV VARIANCE
GROUP -- 47
AGE
21 51 31
7.2 52
A (OVERALL)
HGHT
1555 1938 1706 92.6 8578
MASS
49.0 100.0 69.2 11.8 139
LEFT ULNAR ABDUCTION
2 MIN
0.0 23.0 5.1 5.0 25
8 MIN
0.0 16.5 5 1 4 2 17
MOVEMEN
0 12 2 2
n n 3 6 7
EXPERIMENTAL GROUP -SAMPLE SIZE - 27
AGE
MINIMUM 21 MAXIMUM 51 AVERAGE 29 STD DEV 7.0 VARIANCE 49
A (AUSTRALIAN
HGHT
1568 1938 1742 94.0 8830
MASS
60.0 100.0 73.2 11.2 125
LEFT ULNAR ABDUCTION
2 MIN
0.0 23.0 5.6 5.0 25
8 MIN
0.0 16.5 5.4 3.9 15
MOVEMEN
0.0 10.5 2.2 2.4
6
EXPERIMENTAL GROUP -SAMPLE SIZE - 16
AGE
MINIMUM 23 MAXIMUM 50 AVERAGE 33 STD DEV 7.0 VARIANCE 49
A (ASIAN)
HGHT
1555 1750 1651 60.7 3689
MASS
49 86 62 9.9 99
LEFT ULNAR ABDUCTION
2 MIN
0.0 9.0 3.9 3.8 15
8 MIN MOVEMEN
0.0 0.0 13.0 5.5 4.8 1.8 4.5 1.9 21 4
EXPERIMENTAL GROUP -SAMPLE SIZE - 2
AGE
MINIMUM 26 MAXIMUM 35 AVERAGE 31 STD DEV 4.5 VARIANCE 20
A (EUROPEAN)
HGHT
1683 1747 1715 32.0 1024
MASS
67.0 86.0 76.5 9.5 90
LEFT ULNAR ABDUCTION
2 MIN
2.0 19.5 10.8 8.8 77
8 MIN
0.0 7.5 3.8 3.8 14
MOVEMEN
2.0 12.0 7.0 5.0 25
EXPERIMENTAL GROUP - A (OTHER) SAMPLE SIZE - 2 LEFT ULNAR ABDUCTION
2 MIN 8 MIN MOVEMEN AGE HGHT MASS
MINIMUM MAXIMUM AVERAGE STD DEV VARIANCE
25 42 34 8.5 72
1570 1734 1652 82.0 6724
61.0 70.0 65.5 4.5 20
0.0 4.0 2.0 2.0 4
0.5 10.0 5.3 4.8 23
0.5 6.0 3.3 2.7
8

STATISTICAL SUMMARY BY NATIONALITY - B
(TABLES)
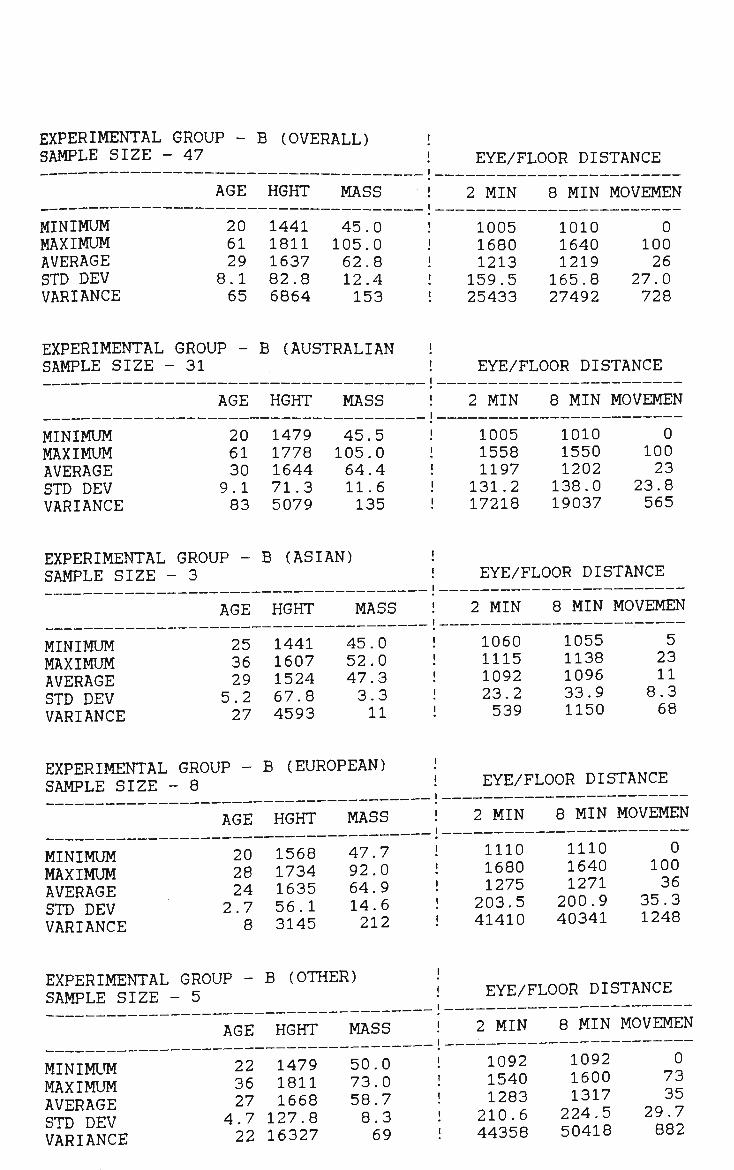
EXPERIMENTAL GROUP -SAMPLE SIZE - 47
AGE
MINIMUM 20 MAXIMUM 61 AVERAGE 29 STD DEV 8.1 VARIANCE 65
B (OVERALL)
HGHT
1441 1811 1637 82.8 6864
MASS
45.0 105.0 62.8 12.4 153
EYE/FLOOR DISTANCE
2 MIN
1005 1680 1213 159.5 25433
8 MIN
1010 1640 1219 165.8 27492
MOVEMEN
0 100 26
27.0 728
EXPERIMENTAL GROUP -SAMPLE SIZE - 31
AGE
MINIMUM 20 MAXIMUM 61 AVERAGE 30 STD DEV 9.1 VARIANCE 83
B (AUSTRALIAN
HGHT
1479 1778 1644 71.3 5079
MASS
45.5 105.0 64.4 11.6 135
EYE/FLOOR DISTANCE
2 MIN
1005 1558 1197
! 131.2 ! 17218
8 MIN
1010 1550 1202 138.0 19037
MOVEMEN
0 100 23
23.8 565
EXPERIMENTAL GROUP -SAMPLE SIZE - 3
AGE
MINIMUM 25 MAXIMUM 36 AVERAGE 29 STD DEV 5.2 VARIANCE 27
B (ASIAN)
HGHT
1441 1607 1524 67.8 4593
MASS
45.0 52.0 47.3 3.3 11
EYE/FLOOR DISTANCE
2 MIN
1060 1115 1092
! 23.2 ! 539
8 MIN
1055 1138 1096 33.9 1150
MOVEMEN
5 23 11
8.3 68
EXPERIMENTAL SAMPLE SIZE -
MINIMUM MAXIMUM AVERAGE STD DEV VARIANCE
GROUP -- 8
AGE
20 28 24
2.7 8
B (EUROPEAN)
HGHT
1568 1734 1635 56.1 3145
MASS
47.7 92.0 64.9 14.6 212
EYE/FLOOR DISTANCE
2 MIN
1110 1680 1275
! 203.5 ! 41410
8 MIN
1110 1640 1271 200.9 40341
MOVEMEN
0 100 36
35.3 1248
EXPERIMENTAL GROUP -SAMPLE SIZE - 5
AGE
MINIMUM 22 MAXIMUM 36 AVERAGE 27 STD DEV 4.7 VARIANCE 22
B (OTHER)
HGHT
1479 1811 1668
127.8 16327
MASS
50.0 73.0 58.7 8.3 69
EYE/FLOOR DISTANCE
2 MIN
1092 1540 1283
210.6 44358
8 MIN
1092 1600 1317
224.5 50418
MOVEMEN
0 73 35
29.7 882

EXPERIMENTAL GROUP -SAMPLE SIZE - 47
AGE
MINIMUM 20 MAXIMUM 61 AVERAGE 29 STD DEV 8.1 VARIANCE 65
B (OVERALL)
HGHT
1441 1811 1637 82.8 6864
MASS
45.0 105.0 62.8 12.4 153
ACROMION/KEYBOARD DISTANCE
2 MIN
201 330 262 29.2 853
8 MIN MOVEMEN
183 0 332 50 261 12
28.8 9.9 828 99
EXPERIMENTAL GROUP -SAMPLE SIZE - 31
AGE
MINIMUM 20 MAXIMUM 61 AVERAGE 30 STD DEV 9.1 VARIANCE 83
B (AUSTRALIAN
HGHT
1479 1778 1644 71.3 5079
MASS
45.5 105.0 64.4 11.6 135
ACROMION/KEYBOARD DISTANCE
2 MIN
208 311 263 29.1 846
8 MIN MOVEMEN
215 310 263 25.5 652
0 50 14
10.9 120
EXPERIMENTAL GROUP -SAMPLE SIZE - 3
AGE
MINIMUM 25 MAXIMUM 36 AVERAGE 29 STD DEV 5.2 VARIANCE 27
B (ASIAN)
HGHT
1441 1607 1524 67.8 4593
MASS
45.0 52.0 47.3 3.3 11
ACROMION/KEYBOARD DISTANCE
2 MIN
231 245 237 5.9 35
8 MIN MOVEMEN
229 6 267 22 245 12 16.0 6.9 255 48
EXPERIMENTAL GROUP SAMPLE SIZE - 8
B (EUROPEAN) ACROMION/KEYBOARD DISTANCE
AGE HGHT MASS 2 MIN 8 MIN MOVEMEN
MINIMUM MAXIMUM AVERAGE STD DEV VARIANCE
20 1568 47.7 28 1734 92.0 24 1635 64.9
2.7 56.1 14.6 8 3145 212
239 330 271 26.1 681
233 332 269 29.1 848
1 10 5
2.8 8
EXPERIMENTAL GROUP -SAMPLE SIZE - 5
AGE
MINIMUM 22 MAXIMUM 36 AVERAGE 27 STD DEV 4.7 VARIANCE 22
B (OTHER)
HGHT
1479 1811 1668
127.8 16327
MASS
50.0 73.0 58.7 8.3 69
ACROMION/KEYBOARD DISTANCE
2 MIN
201 300 254
33.0 1091
8 MIN MOVEMEN
183 2 310 18 249 10
42.6 6.5 1811 43
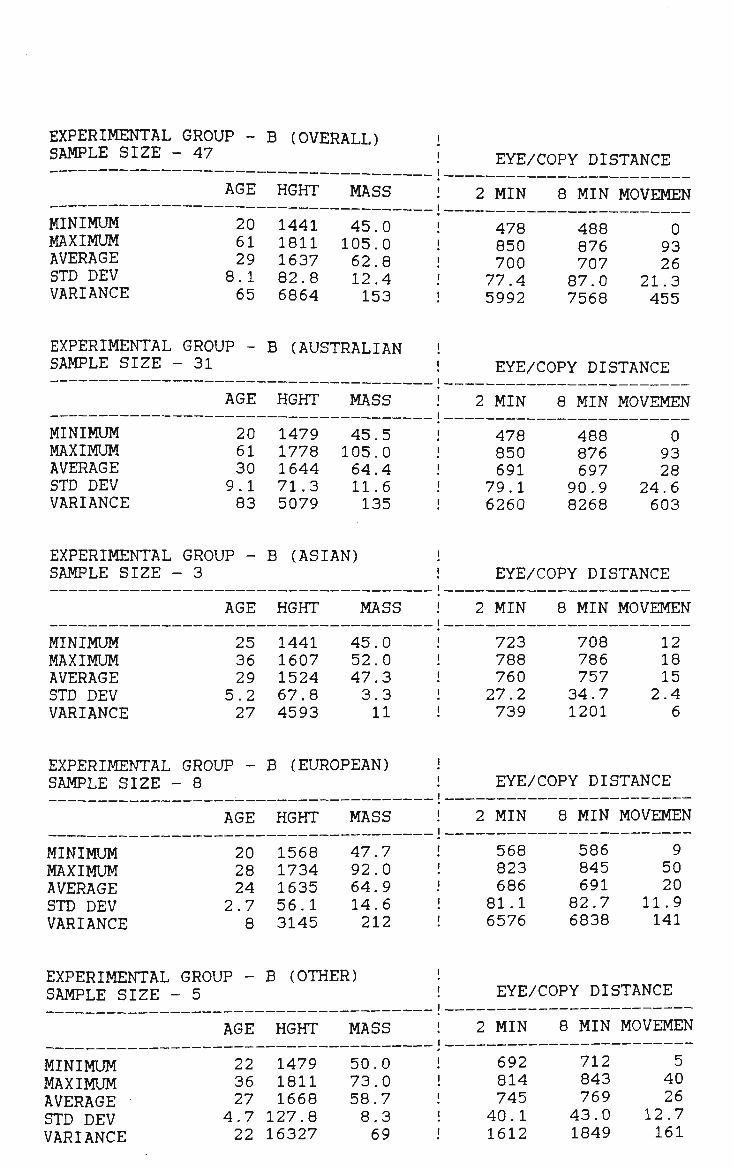
EXPERIMENTAL SAMPLE SIZE
MINIMUM MAXIMUM AVERAGE STD DEV VARIANCE
. GROUP -- 47
AGE
20 61 29
8.1 65
B (OVERALL)
HGHT
1441 1811 1637 82.8 6864
MASS
45.0 105.0 62.8 12.4 153
EYE/COPY DISTANCE
2 MIN
478 850 700 77.4 5992
8 MIN
488 876 707 87.0 7568
MOVEMEN
0 93 26
21.3 455
EXPERIMENTAL GROUP - B (AUSTRALIAN SAMPLE SIZE - 31 EYE/COPY DISTANCE
2 MIN 8 MIN MOVEMEN AGE HGHT MASS
MINIMUM MAXIMUM AVERAGE STD DEV VARIANCE
20 61 30 9.1 83
1479 1778 1644 71.3 5079
45.5 105.0 64.4 11.6 135
478 850 691
79.1 6260
488 876 697 90.9 8268
0 93 28
24.6 603
EXPERIMENTAL GROUP -SAMPLE SIZE - 3
AGE
MINIMUM 25 MAXIMUM 36 AVERAGE 29 STD DEV 5.2 VARIANCE 27
B (ASIAN)
HGHT
1441 1607 1524 67.8 4593
MASS
45.0 52.0 47.3 3.3 11
EYE/COPY DISTANCE
2 MIN
723 788 760 27.2 739
8 MIN MOVEMEN
708 12 786 18 757 15 34.7 2.4 1201 6
EXPERIMENTAL GROUP -SAMPLE SIZE - 8
AGE
MINIMUM 20 MAXIMUM 28 AVERAGE 24 STD DEV 2.7 VARIANCE 8
B (EUROPEAN)
HGHT
1568 1734 1635 56.1 3145
MASS
47.7 92.0 64.9 14.6 212
EYE/COPY DISTANCE
2 MIN
568 823 686 81.1 6576
8 MIN
586 845 691
82.7 6838
MOVEMEN
9 50 20
11.9 141
EXPERIMENTAL SAMPLE SIZE -
MINIMUM MAXIMUM AVERAGE STD DEV VARIANCE
GROUP -- 5
AGE
22 36 27
4.7 22
B (OTHER)
HGHT
1479 1811 1668
127.8 16327
MASS
50.0 73.0 58.7 8.3 69
EYE/COPY DISTANCE
2 MIN
692 814 745
40.1 1612
8 MIN
712 843 769
43.0 1849
MOVEMEN
5 40 26
12.7 161

EXPERIMENTAL SAMPLE SIZE -
MINIMUM MAXIMUM AVERAGE STD DEV VARIANCE
GROUP -- 47
AGE
20 61 29
8.1 65
B (OVERALL)
HGHT
1441 1811 1637 82.8 6864
MASS
45.0 105.0 62.8 12.4 153
TRUNK
2 MIN
74 125 107 10.7 114
INCLINATION
8 MIN
75 0 124.5 107.6 11 0 121
MOVEMEN
0 0 22 5 6 9 5 4 29
EXPERIMENTAL GROUP -SAMPLE SIZE - 31
AGE
MINIMUM 20 MAXIMUM 61 AVERAGE 30 STD DEV 9.1 VARIANCE 83
B (AUSTRALIAN
HGHT MASS
1479 45.5 1778 105.0 1644 64.4 71.3 11.6 5079 135
TRUNK
2 MIN
83.5 125.0 108.5 9.6 91
INCLINATION
8 MIN
83.5 124.5 109.0 9.3 86
MOVEMEN
0.0 22.5 6.7 5.2 27
EXPERIMENTAL GROUP -SAMPLE SIZE - 3
MINIMUM MAXIMUM AVERAGE STD DEV VARIANCE
AGE
25 36 29
5.2 27
B (ASIAN)
HGHT
1441 1607 1524 67.8 4593
MASS
45.0 52.0 47.3 3.3 11
TRUNK
2 MIN
104.0 105.5 104.7 0.6 0
INCLINATION
8 MIN
87.5 120.0 105.3 13.5 181
MOVEMEN
4.5 17.0 12.0 5.4 29
EXPERIMENTAL GROUP -SAMPLE SIZE - 8
AGE
MINIMUM 20 MAXIMUM 28 AVERAGE 24 STD DEV 2.7 VARIANCE 8
B (EUROPEAN)
HGHT
1568 1734 1635 56.1 3145
MASS
47.7 92.0 64.9 14.6 212
TRUNK
2 MIN
74.0 121.0 103.1 14.7 215
INCLINATION
8 MIN
75.0 121.5 105.9 13.9 194
MOVEMEN
1.0 18.5 7.2 5.8 33
EXPERIMENTAL GROUP -SAMPLE SIZE - 5
AGE
MINIMUM 22 MAXIMUM 36 AVERAGE 27 STD DEV 4.7 VARIANCE 22
B (OTHER)
HGHT
1479 1811 1668
127.8 16327
MASS
50.0 73.0 58.7 8.3 69
TRUNK
2 MIN
85.5 114.0 106.9 10.8 116
INCLINATION
8 MIN
81.0 115.0 103.0 11.9 142
MOVEMEN
1.0 12.5 4.9 4.0 16

EXPERIMENTAL SAMPLE SIZE -
MINIMUM MAXIMUM AVERAGE STD DEV VARIANCE
GROUP -- 47
AGE
20 61 29 8.1 65
B (OVERALL)
HGHT
1441 1811 1637 82.8 6864
MASS
45.0 105.0 62.8 12.4 153
HEAD
2 MIN
20 51 32 6
0 0 .2 .2 38
INCLINATION
8 MIN
14 57 30 9
0 n 3 4 89
MOVEMEN
0 21 6 5
0 5 2 1
26
EXPERIMENTAL GROUP -SAMPLE SIZE - 31
AGE
MINIMUM 20 MAXIMUM 61 AVERAGE 30 STD DEV 9.1 VARIANCE 83
B (AUSTRALIAN
HGHT
1479 1778 1644 71.3 5079
MASS
45.5 105.0 64.4 11.6 135
HEAD
2 MIN
20.0 51.0 32.3 6.6 44
INCLINATION
8 MIN
14.0 53.0 29.9 9.3 86
MOVEMEN
0.0 19.5 6.1 5.0 25
EXPERIMENTAL GROUP -SAMPLE SIZE - 3
AGE
MINIMUM 25 MAXIMUM 36 AVERAGE 29 STD DEV 5.2 VARIANCE 27
B (ASIAN)
HGHT
1441 1607 1524 67.8 4593
MASS
45.0 52.0 47.3 3.3 11
HEAD
2 MIN
25.5 35.5 30.3 4.1 17
INCLINATION
8 MIN
24.5 57.0 36.3 14.7 215
MOVEMEN
1.0 21.5 8.3 9.3 87
EXPERIMENTAL GROUP - B (EUROPEAN) SAMPLE SIZE - 8 HEAD INCLINATION
2 MIN 8 MIN MOVEMEN AGE HGHT MASS
MINIMUM MAXIMUM AVERAGE STD DEV VARIANCE
20 28 24 2.7 8
1568 1734 1635 56.1 3145
47.7 92.0 64.9 14.6 212
21.0 35.0 30.7 4.7 22
14.0 39.5 28.8 8.3 69
3.0 18.0 6.1 4.7 22
EXPERIMENTAL GROUP -SAMPLE SIZE - 5
AGE
MINIMUM 22 MAXIMUM 36 AVERAGE 27 STD DEV 4.7 VARIANCE 22
B (OTHER)
HGHT
1479 1811 1668
127.8 16327
MASS
50.0 73.0 58.7 8.3 69
HEAD
2 MIN
30.0 44.0 34.8 5.0 25
INCLINATION
8 MIN MOVEMEN
25.5 3.0 39.0 7.5 32.2 5.4 5.4 1.7 29 3

EXPERIMENTAL GROUP -SAMPLE SIZE - 47
AGE
MINIMUM 20 MAXIMUM 61 AVERAGE 29 STD DEV 8.1 VARIANCE 65
B (OVERALL)
HGHT
1441 1811 1637 82.8 6864
MASS
45.0 105.0 62.8 12.4 153
ARM
2 MIN
88.5 123.0 103.4 7.8 61
FLEXION
8 MIN
91.5 123.5 103.8 7.4 54
MOVEMEN
0.0 27.5 4.4 5.1 26
EXPERIMENTAL SAMPLE SIZE
MINIMUM MAXIMUM AVERAGE STD DEV VARIANCE
GROUP -- 31
AGE
20 61 30 9.1 83
B (AUSTRALIAN
HGHT
1479 1778 1644 71.3 5079
MASS
45.5 105.0 64.4 11.6 135
ARM
2 MIN
88.5 122.5 102.9 7.9 63
FLEXION
8 MIN
91.5 120.5 102.5 7.5 57
MOVEMEN
0.0 27.5 4.7 5.7 32
EXPERIMENTAL GROUP -SAMPLE SIZE - 3
AGE
MINIMUM 25 MAXIMUM 36 AVERAGE 29 STD DEV 5.2 VARIANCE 27
B (ASIAN)
HGHT
1441 1607 1524 67.8 4593
MASS
45.0 52.0 47.3 3.3 11
ARM
2 MIN
106.5 112.5 110.0 2.5 7
FLEXION
8 MIN MOVEMEN
103.0 3.5 106.5 7.0 104.5 5.5 1.5 1.5 2 2
EXPERIMENTAL GROUP -SAMPLE SIZE - 8
AGE
MINIMUM 20 MAXIMUM 28 AVERAGE 24 STD DEV 2.7 VARIANCE 8
B (EUROPEAN)
HGHT
1568 1734 1635 56.1 3145
MASS
47.7 92.0 64.9 14.6 212
ARM
2 MIN
92.0 123.0 106.1 8.2 67
FLEXION
8 MIN MOVEMEN
96.5 0.0 123.5 6.0 108.3 2.4 7.3 2.1 53 4
EXPERIMENTAL GROUP - B (OTHER) SAMPLE SIZE - 5 ARM FLEXION
2 MIN 8 MIN MOVEMEN AGE HGHT MASS
MINIMUM MAXIMUM AVERAGE STD DEV VARIANCE
22 36 27
4.7 22
1479 1811 1668
127.8 16327
50.0 73.0 58.7 8.3 69
95.5 100.5 98.2 1.7 3
96.0 111.5 103.8 5.3 28
0.5 14.0 5.6 5.0 25
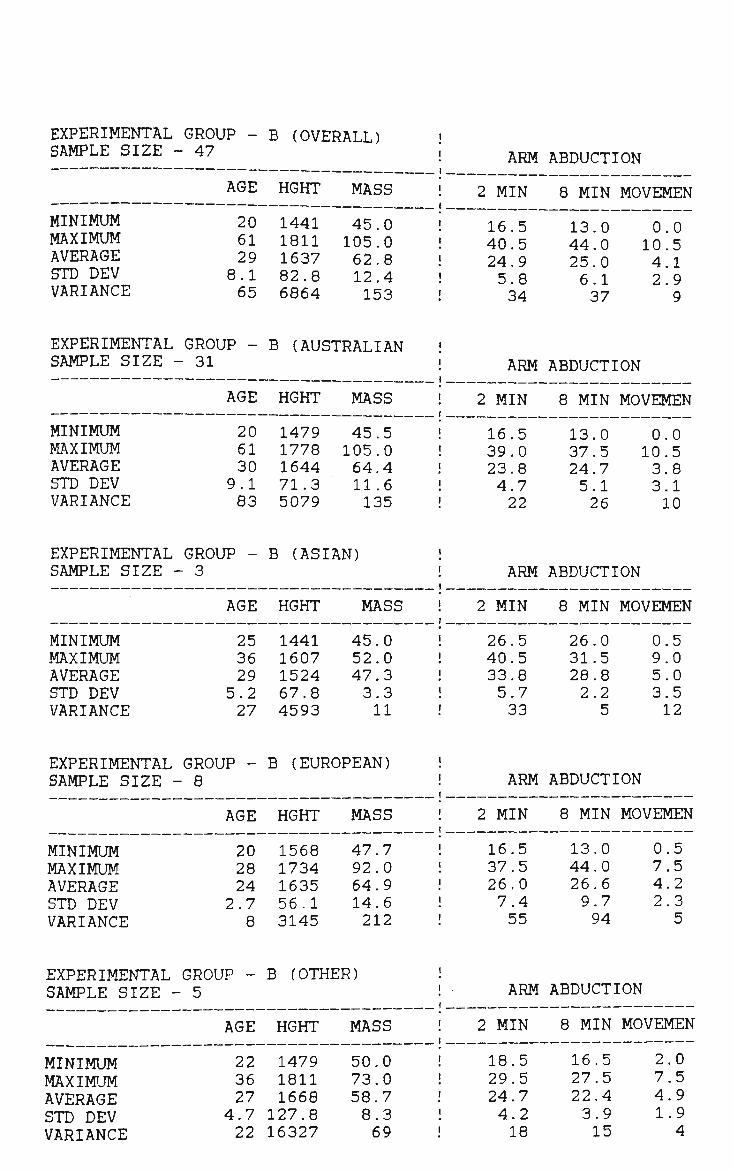
EXPERIMENTAL GROUP -SAMPLE SIZE - 47
AGE
MINIMUM 20 MAXIMUM 61 AVERAGE 29 STD DEV 8.1 VARIANCE 65
B (OVERALL)
HGHT
1441 1811 1637 82.8 6864
MASS
45.0 105.0 62.8 12.4 153
ARM
2 MIN
16.5 40.5 24.9 5.8 34
ABDUCTION
8 MIN
13.0 44.0 25.0 6.1 37
MOVEMEN
0.0 10.5 4.1 2.9
9
EXPERIMENTAL GROUP -SAMPLE SIZE - 31
AGE
MINIMUM 20 MAXIMUM 61 AVERAGE 30 STD DEV 9.1 VARIANCE 83
B (AUSTRALIAN
HGHT
1479 1778 1644 71.3 5079
MASS
45.5 105.0 64.4 11.6 135
ARM
2 MIN
16.5 39.0 23.8 4.7 22
ABDUCTION
8 MIN
13.0 37.5 24.7 5.1 26
MOVEMEN
0.0 10.5 3.8 3.1 10
EXPERIMENTAL SAMPLE SIZE -
MINIMUM MAXIMUM AVERAGE STD DEV VARIANCE
GROUP -- 3
AGE
25 36 29
5.2 27
B (ASIAN)
HGHT
1441 1607 1524 67.8 4593
MASS
45.0 52.0 47.3 3.3 11
ARM
2 MIN
26.5 40.5 33.8 5.7 33
ABDUCTION
8 MIN MOVEMEN
26.0 0.5 31.5 9.0 28.8 5.0 2.2 3.5 5 12
EXPERIMENTAL GROUP -SAMPLE SIZE - 8
AGE
MINIMUM 20 MAXIMUM 28 AVERAGE 24 STD DEV 2.7 VARIANCE 8
B (EUROPEAN)
HGHT
1568 1734 1635 56.1 3145
MASS
47.7 92.0 64.9 14.6 212
ARM
2 MIN
16.5 37.5 26.0 7.4 55
ABDUCTION
8 MIN MOVEMEN
13.0 0.5 44.0 7.5 26.6 4.2 9.7 2.3 94 5
EXPERIMENTAL GROUP -SAMPLE SIZE - 5
AGE
MINIMUM 22 MAXIMUM 36 AVERAGE 27 STD DEV 4.7 VARIANCE 22
B (OTHER)
HGHT
1479 1811 1668 127.8 16327
MASS
50.0 73.0 58.7 8.3 69
ARM
2 MIN
18.5 29.5 24.7 4.2 18
ABDUCTION
8 MIN MOVEMEN
16.5 2.0 27.5 7.5 22.4 4.9 3.9 1.9 15 4
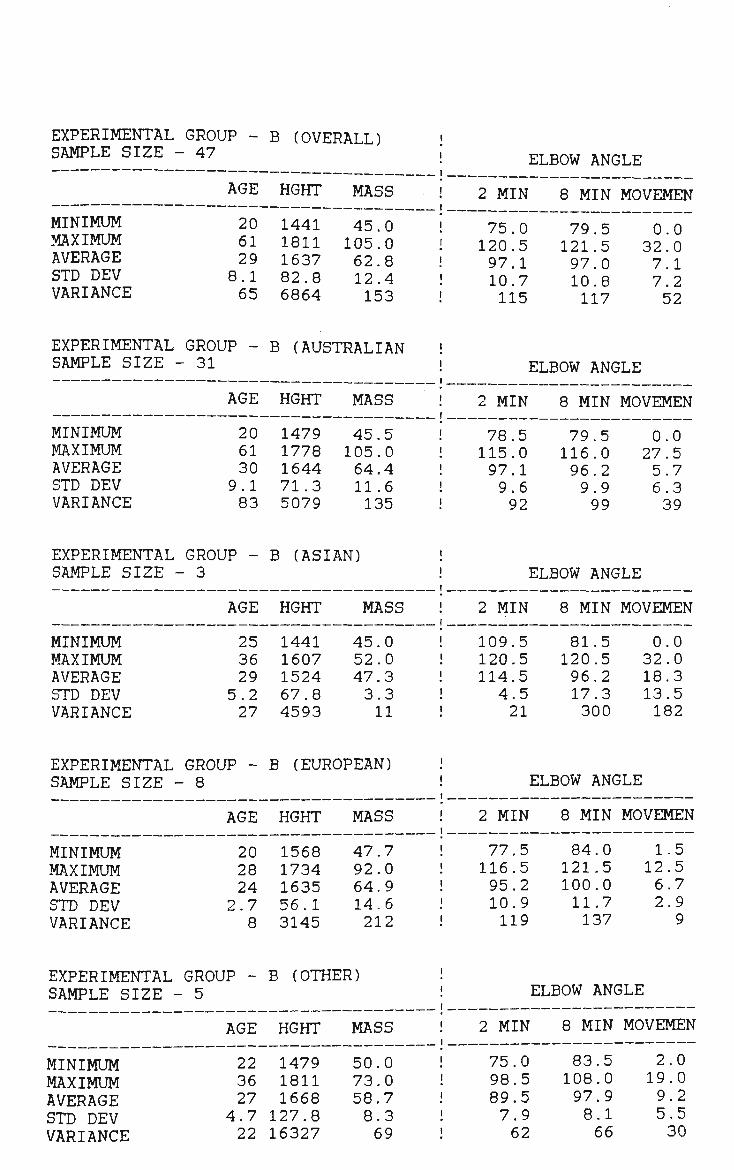
EXPERIMENTAL GROUP -SAMPLE SIZE - 47
AGE
MINIMUM 20 MAXIMUM 61 AVERAGE 29 STD DEV 8.1 VARIANCE 65
B (OVERALL)
HGHT
1441 1811 1637 82.8 6864
MASS
45.0 105.0 62.8 12.4 153
ELBOW ANGLE
2 MIN
75.0 120.5 97.1 10.7 115
8 MIN
79.5 121.5 97.0 10.8 117
MOVEMEN
0.0 32.0 7.1 7.2 52
EXPERIMENTAL GROUP SAMPLE SIZE - 31
B (AUSTRALIAN ELBOW ANGLE
8 MIN MOVEMEN AGE HGHT MASS 2 MIN
MINIMUM MAXIMUM AVERAGE STD DEV VARIANCE
20 61 30
9.1 83
1479 1778 1644 71.3 5079
45.5 105.0 64.4 11.6 135
78.5 115.0 97.1 9.6 92
79.5 116.0 96.2 9.9 99
0.0 27.5 5.7 6.3 39
EXPERIMENTAL GROUP -SAMPLE SIZE - 3
AGE
MINIMUM 25 MAXIMUM 36 AVERAGE 29 STD DEV 5.2 VARIANCE 27
B (ASIAN)
HGHT
1441 1607 1524 67.8 4593
MASS
45.0 52.0 47.3 3.3 11
ELBOW ANGLE
2 MIN
109.5 120.5 114.5 4.5 21
8 MIN
81.5 120.5 96.2 17.3 300
MOVEMEN
0.0 32.0 18.3 13.5 182
EXPERIMENTAL GROUP -SAMPLE SIZE - 8
AGE
MINIMUM 20 MAXIMUM 28 AVERAGE 24 STD DEV 2.7 VARIANCE 8
B (EUROPEAN)
HGHT
1568 1734 1635 56.1 3145
MASS
47.7 92.0 64.9 14.6 212
ELBOW ANGLE
2 MIN
77.5 116.5 95.2 10.9 119
8 MIN
84.0 121.5 100.0 11.7 137
MOVEMEN
1.5 12.5 6.7 2.9
9
EXPERIMENTAL GROUP -SAMPLE SIZE - 5
AGE
MINIMUM 22 MAXIMUM 36 AVERAGE 27 STD DEV 4.7 VARIANCE 22
B (OTHER)
HGHT
1479 1811 1668
127.8 16327
MASS
50.0 73.0 58.7 8.3 69
ELBOW ANGLE
2 MIN
75.0 98.5 89.5 7.9 62
8 MIN
83.5 108.0 97.9 8.1 66
MOVEMEN
2.0 19.0 9.2 5.5 30
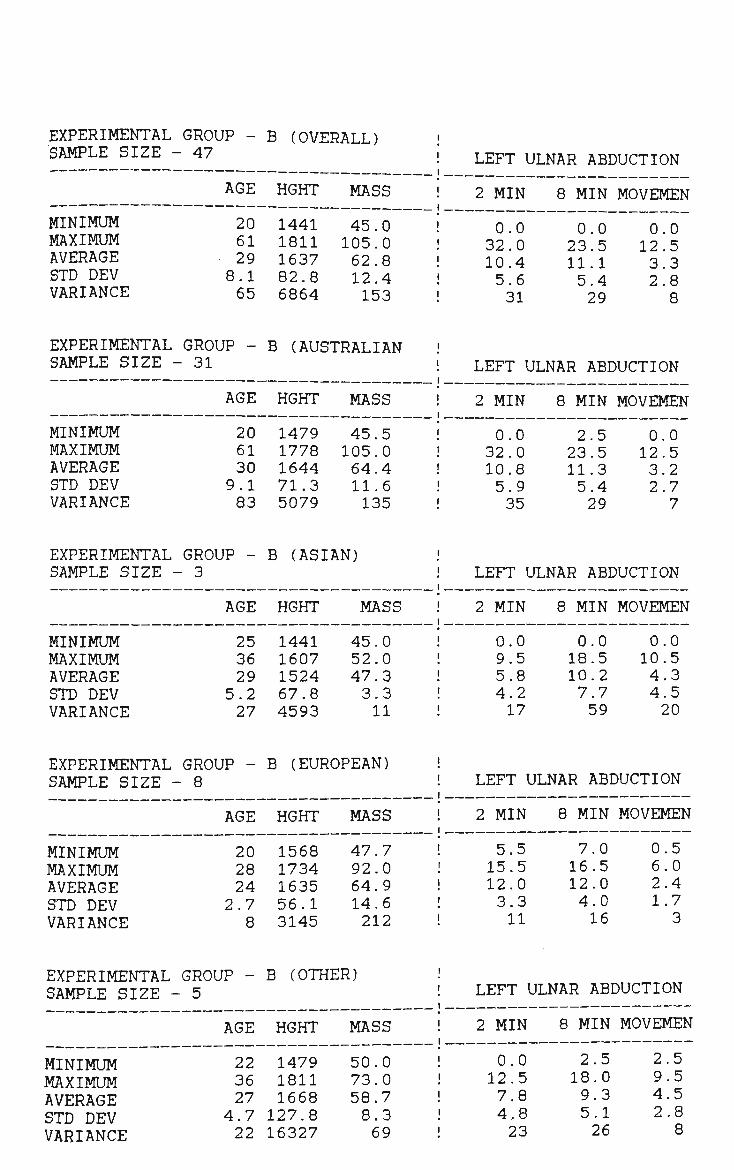
EXPERIMENTAL GROUP -SAMPLE SIZE - 47
AGE
MINIMUM 20 MAXIMUM 61 AVERAGE 29 STD DEV 8.1 VARIANCE 65
B (OVERALL)
HGHT
1441 1811 1637 82.8 6864
MASS
45.0 105.0 62.8 12.4 153
LEFT ULNAR ABDUCTION
2 MIN
0.0 32.0 10.4 5.6 31
8 MIN
0.0 23.5 11.1 5.4 29
MOVEMEN
0.0 12.5 3.3 2.8 8
EXPERIMENTAL GROUP -SAMPLE SIZE - 31
AGE
MINIMUM 20 MAXIMUM 61 AVERAGE 30 STD DEV 9.1 VARIANCE 83
B (AUSTRALIAN
HGHT
1479 1778 1644 71.3 5079
MASS
45.5 105.0 64.4 11.6 135
LEFT ULNAR ABDUCTION
2 MIN
0.0 32.0 10.8 5.9 35
8 MIN
2.5 23.5 11.3 5.4 29
MOVEMEN
0.0 12.5 3.2 2.7 7
EXPERIMENTAL GROUP -SAMPLE SIZE - 3
AGE
MINIMUM 25 MAXIMUM 36 AVERAGE 29 STD DEV 5.2 VARIANCE 27
B (ASIAN)
HGHT
1441 1607 1524 67.8 4593
MASS
45.0 52.0 47.3 3.3 11
LEFT ULNAR ABDUCTION
2 MIN
0.0 9.5 5.8 4.2 17
8 MIN
0.0 18.5 10.2 7.7 59
MOVEMEN
0.0 10.5 4.3 4.5 20
EXPERIMENTAL GROUP -SAMPLE SIZE - 8
AGE
MINIMUM 20 MAXIMUM 28 AVERAGE 24 STD DEV 2.7 VARIANCE 8
B (EUROPEAN)
HGHT
1568 1734 1635 56.1 3145
MASS
47.7 92.0 64.9 14.6 212
LEFT ULNAR ABDUCTION
2 MIN
5.5 15.5 12.0 3.3 11
8 MIN MOVEMEN
7.0 0.5 16.5 6.0 12.0 2.4 4.0 1.7 16 3
EXPERIMENTAL GROUP -SAMPLE SIZE - 5
AGE
MINIMUM 22 MAXIMUM 36 AVERAGE 27 STD DEV 4.7 VARIANCE 22
B (OTHER)
HGHT
1479 1811 1668
127.8 16327
MASS
50.0 73.0 58.7 8.3 69
LEFT ULNAR ABDUCTION
2 MIN
0.0 12.5 7.8 4.8 23
8 MIN MOVEMEN
2.5 2.5 18.0 9.5 9.3 4.5 5.1 2.8 26 8

STATISTICAL SUMMARY COMBINED
(TABLES)
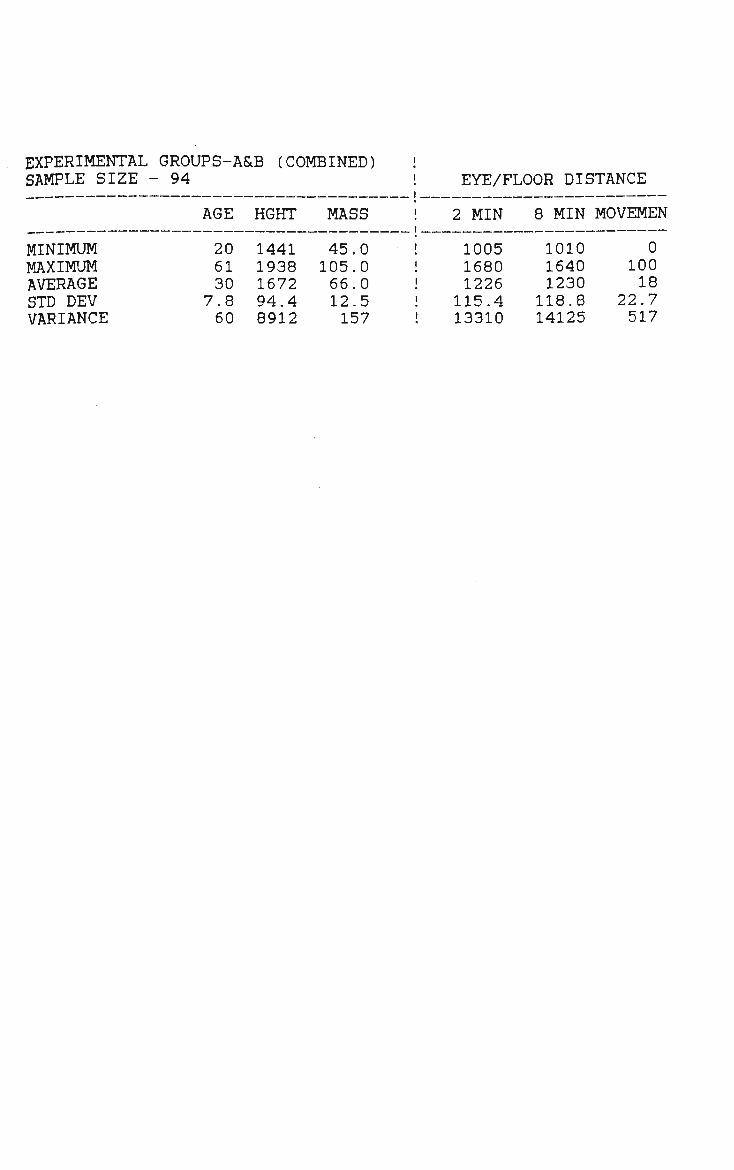
EXPERIMENTAL GROUPS-A&B (COMBINED) ! SAMPLE SIZE - 94 ! EYE/FLOOR DISTANCE
MINIMUM MAXIMUM AVERAGE STD DEV VARIANCE
AGE
20 61 30
7.8 60
HGHT
1441 1938 1672 94.4 8912
MASS
45.0 105.0 66.0 12.5 157
2 MIN
1005 1680 1226 115.4
! 13310
8 MIN
1010 1640 1230 118.8 14125
MOVEMEN
0 100 18
22.7 517
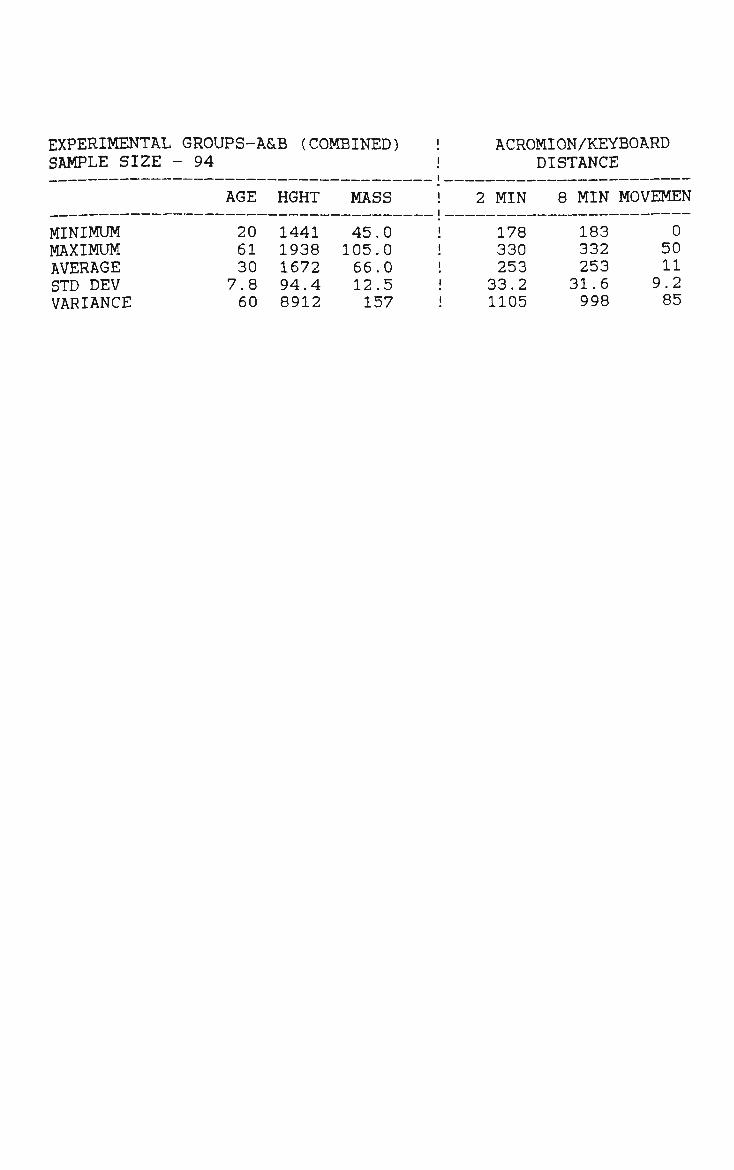
EXPERIMENTAL GROUPS-A&B (COMBINED) SAMPLE SIZE - 94
ACROMION/KEYBOARD DISTANCE
MINIMUM MAXIMUM AVERAGE STD DEV VARIANCE
AGE
20 61 30
7.8 60
HGHT
1441 1938 1672 94.4 8912
MASS
45.0 105.0 66.0 12.5 157
2 MIN
178 330 253
33.2 ! 1105
8 MIN
183 332 253 31.6 998
MOVEMEN
0 50 11
9.2 85
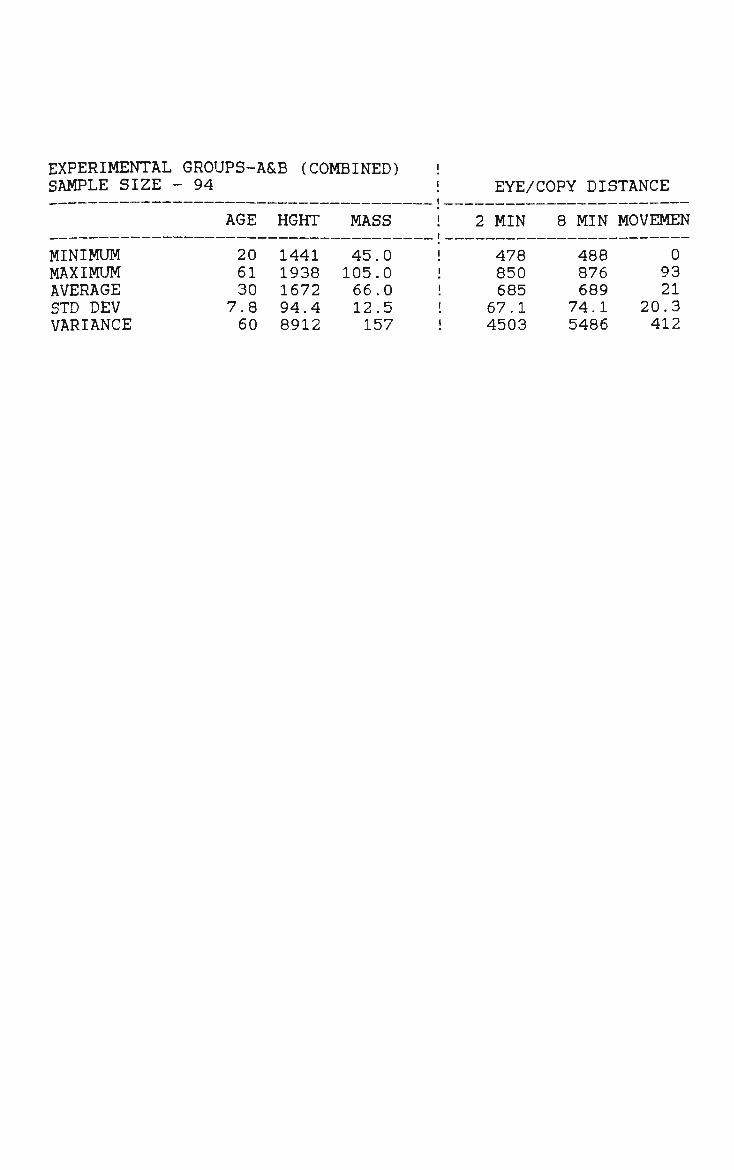
EXPERIMENTAL GROUPS-A&B (COMBINED) SAMPLE SIZE - 94 EYE/COPY DISTANCE
MINIMUM MAXIMUM AVERAGE STD DEV VARIANCE
AGE
20 61 30
7.8 60
HGHT
1441 1938 1672 94.4 8912
MASS
45.0 105.0 66.0 12.5 157
2 MIN
478 850 685 67.1
! 4503
8 MIN
488 876 689
74.1 5486
MOVEMEN
0 93 21
20.3 412
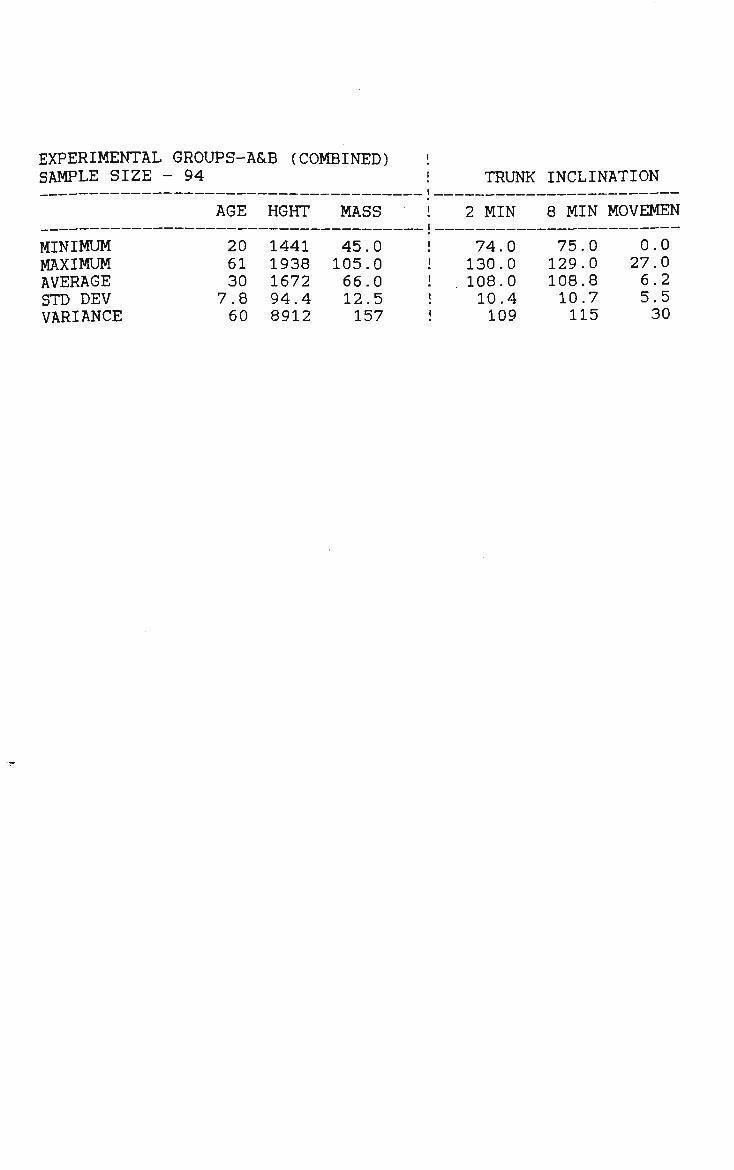
EXPERIMENTAL GROUPS-A&B (COMBINED) SAMPLE SIZE - 94 TRUNK INCLINATION
MINIMUM MAXIMUM AVERAGE STD DEV VARIANCE
AGE
20 61 30
7.8 60
HGHT
1441 1938 1672 94.4 8912
MASS
45.0 105.0 66.0 12.5 157
2 MIN
74.0 130.0 108.0
! 10.4 i 109
8 MIN
75.0 129.0 108.8 10.7 115
MOVEMEN
0.0 27.0 6.2 5.5 30
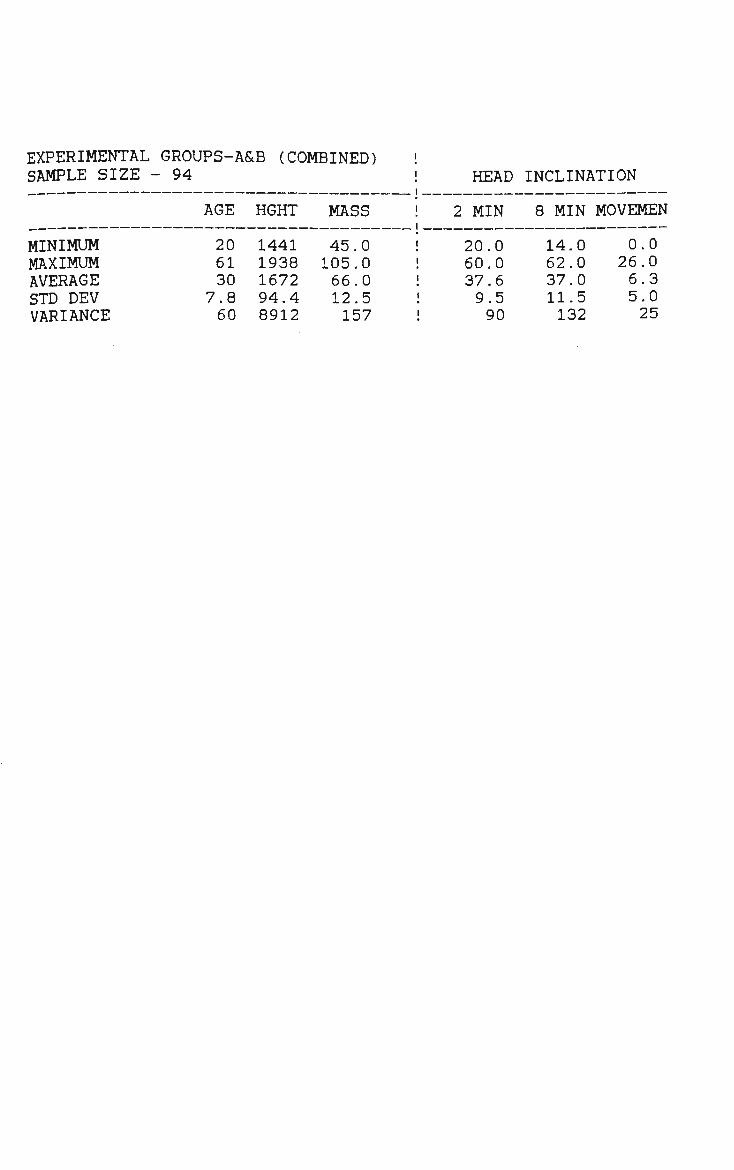
EXPERIMENTAL GROUPS-A&B (COMBINED) SAMPLE SIZE - 94 HEAD INCLINATION
MINIMUM MAXIMUM AVERAGE STD DEV VARIANCE
AGE
20 61 30 7.8 60
HGHT
1441 1938 1672 94.4 8912
MASS
45.0 105.0 66.0 12.5 157
2 MIN
20.0 60.0 37.6
! 9.5 ! 90
8 MIN
14.0 62.0 37.0 11.5 132
MOVEMEN
0.0 26.0 6.3 5.0 25

EXPERIMENTAL GROUPS-A&B (COMBINED) SAMPLE SIZE - 94 ARM FLEXION
MINIMUM MAXIMUM AVERAGE STD DEV VARIANCE
AGE
20 61 30
7.8 60
HGHT
1441 1938 1672 94.4 8912
MASS
45.0 105.0 66.0 12.5 157
2 MIN
88.5 132.0 104.3
! 7.9 ! 62
8 MIN
91.5 132.0 105.2 8.0 63
MOVEMEN
0.0 27.5 4.6 4.6 21
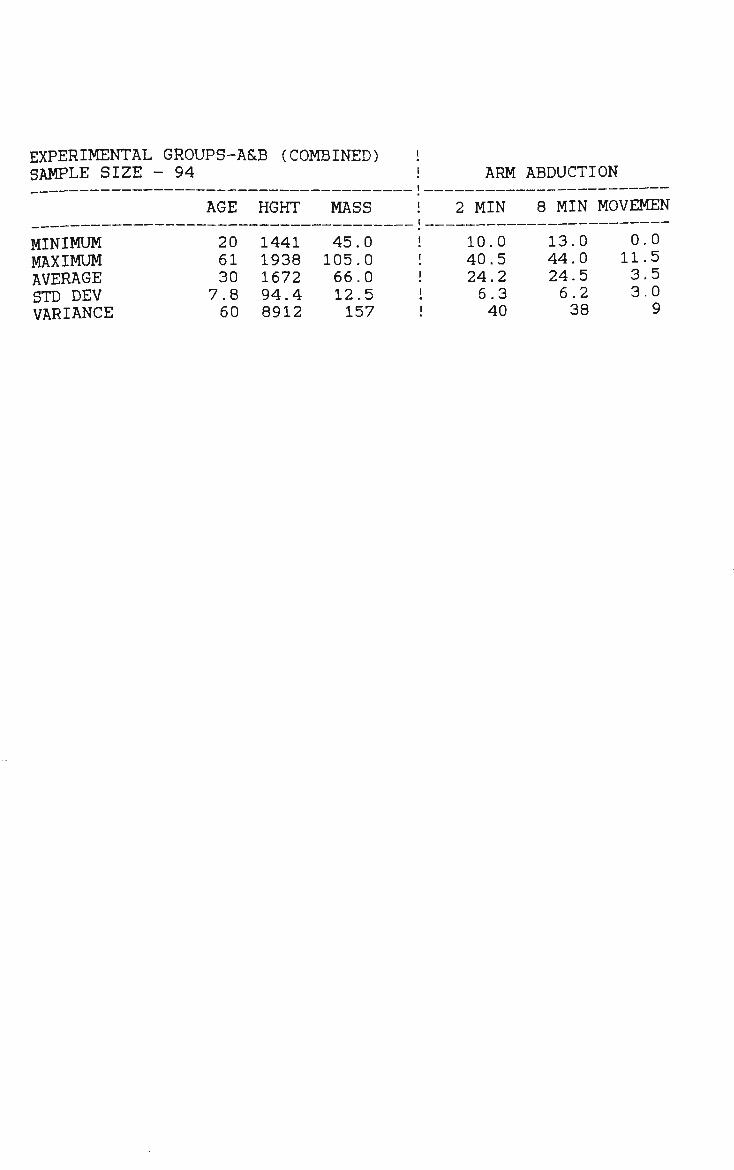
EXPERIMENTAL GROUPS-A&B (COMBINED) SAMPLE SIZE - 94 ARM ABDUCTION
AGE
MINIMUM 20 MAXIMUM 61 AVERAGE 30 STD DEV 7.8 VARIANCE 60
HGHT
1441 1938 1672 94.4 8912
MASS !
45.0 ! 105.0 ! 66.0 ! 12.5 I 157 !
2 MIN 8 MIN MOVEMEN
10.0 13.0 0.0 40.5 44.0 11.5 24.2 24.5 3.5 6.3 6.2 3.0 40 38 9

EXPERIMENTAL GROUPS-A&B (COMBINED) ! SAMPLE SIZE - 94 ! ELBOW ANGLE
AGE HGHT MASS ! 2 MIN 8 MIN MOVEMEN
MINIMUM 20 MAXIMUM 61 AVERAGE 30 STD DEV 7.8 VARIANCE 60
1441 1938 1672 94.4 8912
45.0 ! 105.0 ! 66.0 ! 12.5 ! 157 !
73.0 120.5 93.6 10.5 111
72.5 121.5 93.8 10.3 105
0.0 32.0 5.4 5.7 33
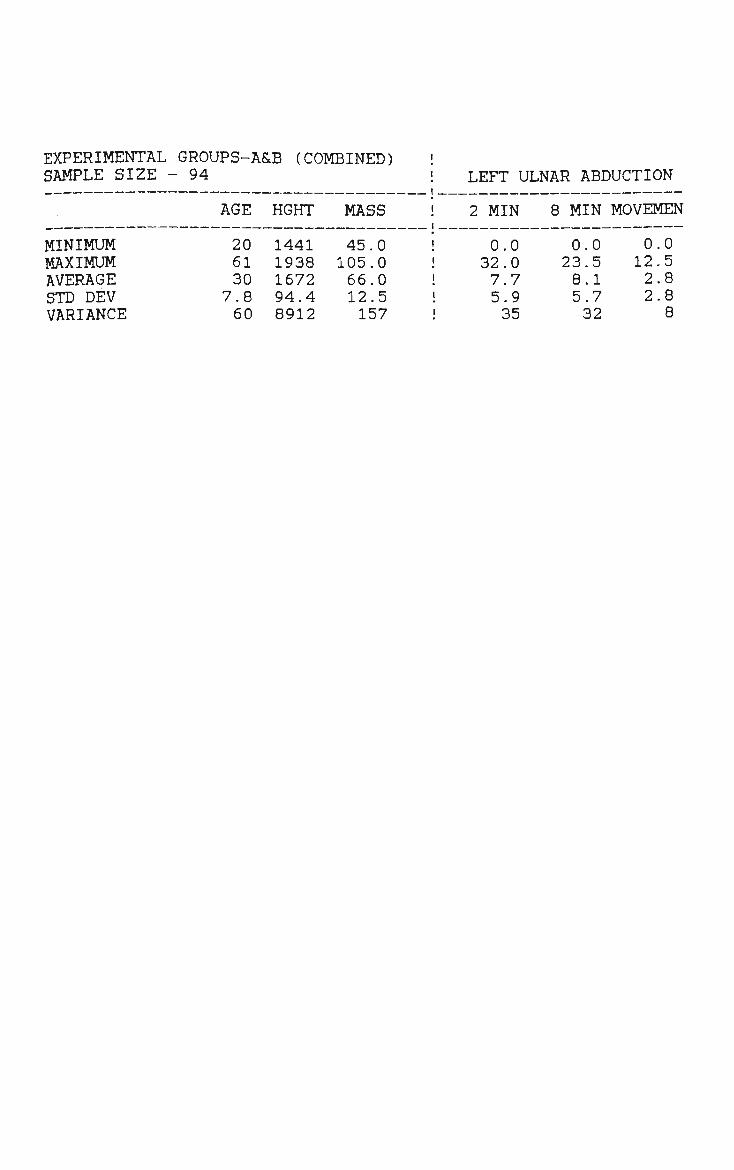
EXPERIMENTAL GROUPS-A&B (COMBINED) SAMPLE SIZE - 94 LEFT ULNAR ABDUCTION
MINIMUM MAXIMUM AVERAGE STD DEV VARIANCE
AGE
20 61 30
7.8 60
HGHT
1441 1938 1672 94.4 8912
MASS
45.0 105.0 66.0 12.5 157
2 MIN
0.0 32.0 7.7
! 5.9 ! 35
8 MIN
0.0 23.5 8.1 5.7 32
MOVEMEN
0.0 12.5 2.8 2.8 8
Copyright © 2022 FDOKUMEN