A Plug Assembly Line: An Assessment of Workstation Design and Working Posture
20
1 A Plug Assembly Line: An Assessment of Workstation Design and Working Posture Adi Saptari, Seri Rahayu Kamat, Wan Hasrulnizzam Wan Mahmood, Isa Halim Faculty of Manufacturing Engineering, Kolej Universiti Teknikal Kebangsaan Malaysia e-mail: [email protected] I. Introduction Workstation design is one of the major areas in which human factors or Ergonomics professional can help improve the fit between human, machine and environment. Good design of workstation considering the human factor anthrophometry data to make workstation that is comfortable and support productivity improvement. Productivity in assembly line determined by many variables, among others: a. Skill of the workers; b. Design of equipment or tools; c. Design of workstation; and d. Design of assembly process. Productivity improvement can be made by upgrading or enhancing by controlling variables, which contribute to the productivity. In most industry, assembly line job environments such as workstation design including working position such as: standing or sitting, the use of tools such as jig and the height of working table are influencing workers’ performance. Meanwhile, working posture such as: position of body: arm and wrist, neck, trunk and leg determine comfortability and safe posture while working. These aspects also play a significant role in productivity. Most job environment in industry applies standing or seated work. Standing workstations are usually applies when job requires workers to do activities that need frequents movements, handle heavy or large objects or exert large forces. Whereas seated workstation is chosen usually for long-term duration job. A seated workstation allows better controlled on arm movements provides a stronger sense and balance. Standing posture, however prolonged standing could be stressful that put excessive load to the body and may lead to body accumulation in the legs (Wickens et.al. 2004). Additional tool, such as jig, is designed to help workers’ performance to do the job easier, faster and more comfortable. However, jig may also hinder some workers in doing their job, if the design of the jig is not suitable to the workers. Design of jig should such that help worker in performing their job and more productive. Table height of an assembly line may contribute to performance of workers when position is either standing or sitting. There are researches regarding the types of works and the height ideally for workers. Grandjean, 1988, has made exploration work surface height for different kinds of jobs. He proposed precision work for men should be set at 100-110 cm, Light work around 90-95 cm and Heavier work around 75-90 cm. Workers who have experience backaches, neck aches, and shoulder pains at work can be traced that the height of a work surface can lead to such aches and pain. If a work surface
-
Upload
independent -
Category
Documents
-
view
0 -
download
0
Transcript of A Plug Assembly Line: An Assessment of Workstation Design and Working Posture

1
A Plug Assembly Line: An Assessment of Workstation Design and
Working Posture
Adi Saptari, Seri Rahayu Kamat, Wan Hasrulnizzam Wan Mahmood, Isa Halim
Faculty of Manufacturing Engineering, Kolej Universiti Teknikal Kebangsaan Malaysia
e-mail: [email protected]
I. Introduction Workstation design is one of the major areas in which human factors or Ergonomics
professional can help improve the fit between human, machine and environment. Good
design of workstation considering the human factor anthrophometry data to make
workstation that is comfortable and support productivity improvement.
Productivity in assembly line determined by many variables, among others:
a. Skill of the workers;
b. Design of equipment or tools;
c. Design of workstation; and
d. Design of assembly process.
Productivity improvement can be made by upgrading or enhancing by controlling
variables, which contribute to the productivity. In most industry, assembly line job
environments such as workstation design including working position such as: standing or
sitting, the use of tools such as jig and the height of working table are influencing
workers’ performance. Meanwhile, working posture such as: position of body: arm and
wrist, neck, trunk and leg determine comfortability and safe posture while working.
These aspects also play a significant role in productivity.
Most job environment in industry applies standing or seated work. Standing workstations
are usually applies when job requires workers to do activities that need frequents
movements, handle heavy or large objects or exert large forces. Whereas seated
workstation is chosen usually for long-term duration job. A seated workstation allows
better controlled on arm movements provides a stronger sense and balance. Standing
posture, however prolonged standing could be stressful that put excessive load to the
body and may lead to body accumulation in the legs (Wickens et.al. 2004).
Additional tool, such as jig, is designed to help workers’ performance to do the job easier,
faster and more comfortable. However, jig may also hinder some workers in doing their
job, if the design of the jig is not suitable to the workers. Design of jig should such that
help worker in performing their job and more productive.
Table height of an assembly line may contribute to performance of workers when
position is either standing or sitting. There are researches regarding the types of works
and the height ideally for workers. Grandjean, 1988, has made exploration work surface
height for different kinds of jobs. He proposed precision work for men should be set at
100-110 cm, Light work around 90-95 cm and Heavier work around 75-90 cm.
Workers who have experience backaches, neck aches, and shoulder pains at work can be
traced that the height of a work surface can lead to such aches and pain. If a work surface
2
is too low, the back of worker bend over the certain degree. Surface work means in this
research is the height of the top surface of the table to the floor. On the other hand if
worker work surface too high, the shoulder must be raised so that worker can perform the
job, this will trigger shoulder and neck discomfort (Sanders, 1993).
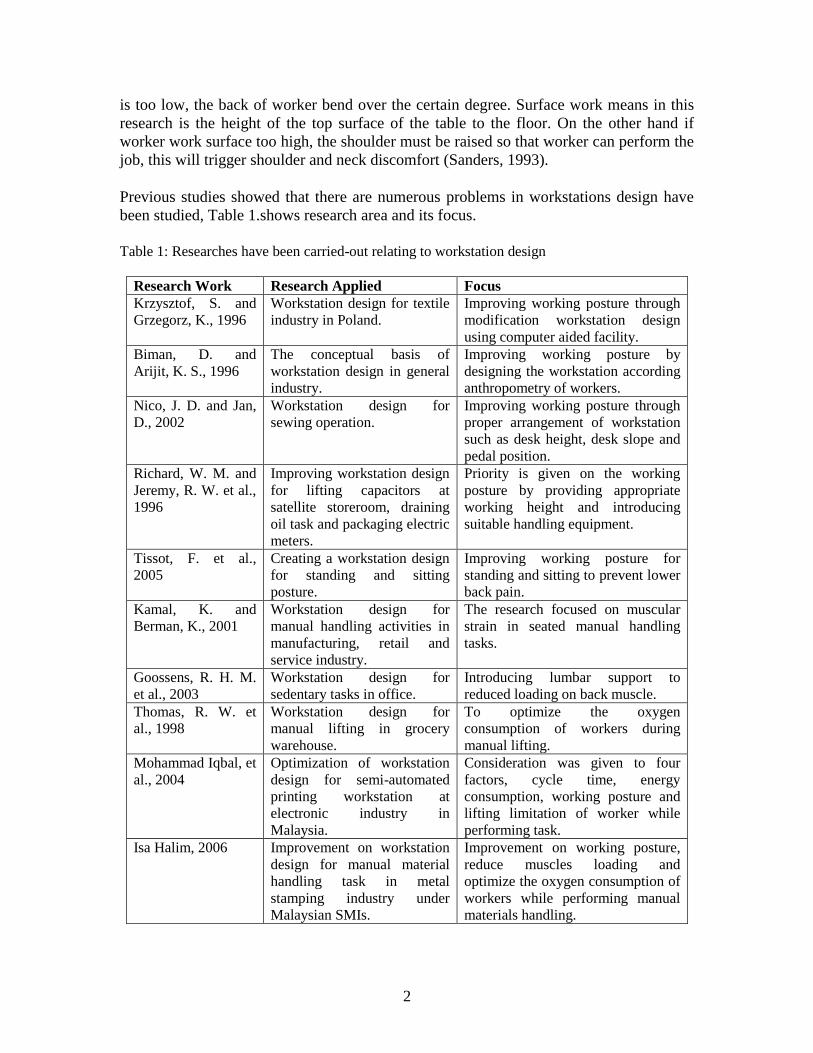
Previous studies showed that there are numerous problems in workstations design have
been studied, Table 1.shows research area and its focus.
Table 1: Researches have been carried-out relating to workstation design
Research Work Research Applied Focus
Krzysztof, S. and
Grzegorz, K., 1996
Workstation design for textile
industry in Poland.
Improving working posture through
modification workstation design
using computer aided facility.
Biman, D. and
Arijit, K. S., 1996
The conceptual basis of
workstation design in general
industry.
Improving working posture by
designing the workstation according
anthropometry of workers.
Nico, J. D. and Jan,
D., 2002
Workstation design for
sewing operation.
Improving working posture through
proper arrangement of workstation
such as desk height, desk slope and
pedal position.
Richard, W. M. and
Jeremy, R. W. et al.,
1996
Improving workstation design
for lifting capacitors at
satellite storeroom, draining
oil task and packaging electric
meters.
Priority is given on the working
posture by providing appropriate
working height and introducing
suitable handling equipment.
Tissot, F. et al.,
2005
Creating a workstation design
for standing and sitting
posture.
Improving working posture for
standing and sitting to prevent lower
back pain.
Kamal, K. and
Berman, K., 2001
Workstation design for
manual handling activities in
manufacturing, retail and
service industry.
The research focused on muscular
strain in seated manual handling
tasks.
Goossens, R. H. M.
et al., 2003
Workstation design for
sedentary tasks in office.
Introducing lumbar support to
reduced loading on back muscle.
Thomas, R. W. et
al., 1998
Workstation design for
manual lifting in grocery
warehouse.
To optimize the oxygen
consumption of workers during
manual lifting.
Mohammad Iqbal, et
al., 2004
Optimization of workstation
design for semi-automated
printing workstation at
electronic industry in
Malaysia.
Consideration was given to four
factors, cycle time, energy
consumption, working posture and
lifting limitation of worker while
performing task.
Isa Halim, 2006 Improvement on workstation
design for manual material
handling task in metal
stamping industry under
Malaysian SMIs.
Improvement on working posture,
reduce muscles loading and
optimize the oxygen consumption of
workers while performing manual
materials handling.
3
II. Objective The objective of this research is to explore:
i. The effect of different workstation design i.e. different height of the table and
different position of the worker standing or sitting to the response time;
ii. The effect of using jig and without jig in assembly line to the response time;
iii. Analyze working posture for different workstation designs.
This experiment will analyze how different design of workstation will contribute to
variety of workers’ productivity. A special designed jig is also analyzed whether
contribute to better productivity. Last but not least, working posture for different design
of workstation also is investigated. The latter is to study whether the working posture is
safe. The research uses an assembly line for small scale industry particularly in electrical
appliances industry. A plug product is used for the purpose of this research.
III. Method
3.1 Design of Experiment
There are three factors to be tested to see the effect of each factor in the productivity in
this case the time needed to finish the job (assembly time). These factors are: 1) Table
height; 2) Position of subjects, standing or sitting; and 3) Tools, using Jig and without Jig.
For table height we applied to different height i.e. 91 cm and 103 cm. These sets were
based on literatures on working environment needed for light work and precision work
based on study recommended by Grandjean, 1988.
The design of experiment for this particular setting is 2x2x2 (23). Each factor has two
level sets, Table height is set either 91 cm or 103 cm, Tools use Jig or without Jig, and
Position either standing or sitting.
3.2 Subjects
Two subjects participated in these experiments. They were chosen based on their past
performance, they have been showing a constant quality of work during their period of
jobs, both of them are still young age around 28 years old. The average height is 170 cm.
They were trained first before doing the experiment begins, so that they were familiar
with the equipment. They have been using this equipment, so is not something new for
them to use.
3.3 Experiment Task
Every subject performs 288 experiments i.e. produce 288 plugs. Number of experiments
for each different level and set (Table, Tool, and Position) are 36 experiments. There are
8 different ways of doing the experiments. Every plug has 7 components. The process of
assemble has been designed such that the sequence of picking the components follows
the order.
The response time, time needed to finish the assembly, is recorded by using stopwatch.
The first data recorded is when subject has done certain amount of experiments such that
the subject already comfortable in doing his job, and the time also shows a constant rate.

4
3.4 Tools:
List of tools used for this research as follows:
1) Screw driver powered by air pressure. This Screw driver can be operated to move
clock wise and anti clock wise;
2) A stop watch to record assembly time of a plug;
3) Digital camera to record the working posture;
4) CATIA software;
5) A pen and table paper to document the response time.
6) Adjusted table height.
7) A chair for subject to seat while working;
8) A jig designed to accommodate four plugs at a time, see Figure 1;
9) Compartments, for holding the components of a plug. There are 7 compartments
holding 7 type of components;
10) A compartment or bag to collect finished product.
Figure 1: Design of Jig
3.5 Image Capturing
A digital camera was utilized to capture the working posture of subjects while they
performing the task. The digital camera is set at the appropriate distance so that the
images of subjects can be captured clearly, as shown in Figure 2. Two angles of view:
both side and front views of images were captured. The objective of image capturing is to
obtain the magnitudes of working posture such as neck angle, trunk angle and the angle
of other body parts.
5
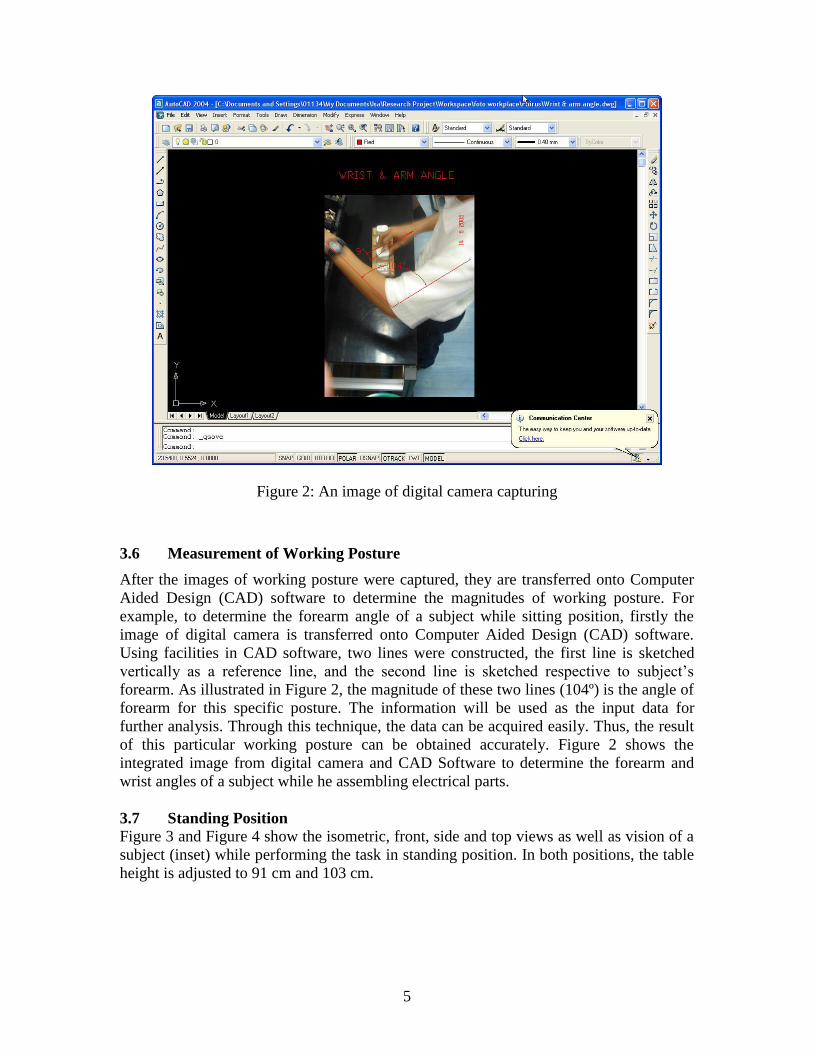
Figure 2: An image of digital camera capturing
3.6 Measurement of Working Posture
After the images of working posture were captured, they are transferred onto Computer
Aided Design (CAD) software to determine the magnitudes of working posture. For
example, to determine the forearm angle of a subject while sitting position, firstly the
image of digital camera is transferred onto Computer Aided Design (CAD) software.
Using facilities in CAD software, two lines were constructed, the first line is sketched
vertically as a reference line, and the second line is sketched respective to subject’s
forearm. As illustrated in Figure 2, the magnitude of these two lines (104º) is the angle of
forearm for this specific posture. The information will be used as the input data for
further analysis. Through this technique, the data can be acquired easily. Thus, the result
of this particular working posture can be obtained accurately. Figure 2 shows the
integrated image from digital camera and CAD Software to determine the forearm and
wrist angles of a subject while he assembling electrical parts.
3.7 Standing Position
Figure 3 and Figure 4 show the isometric, front, side and top views as well as vision of a
subject (inset) while performing the task in standing position. In both positions, the table
height is adjusted to 91 cm and 103 cm.

6
Figure 3: Standing position, isometric view (left) and front view (right)
Figure 4: Standing position, side view (left) and top view (right)
3.8 Sitting Position
Figure 5 and Figure 6 illustrate the isometric, front, side and top views as well as vision
(inset) of a subject performing the task in sitting position. The table height is adjusted to
91 cm and 103 cm in both positions.
Figure 5: Sitting position, isometric view (left) and front view (right)

7
Figure 6: Sitting position, side view (left) and top view (right)
IV. Results
There are two categories of results for this research:
1) Analysis of statistics regarding different setting of workstation design as: Table,
Tools, and Position. The purpose of this assessment to verify which factors
contribute significantly to the productivity.
2) Analysis of working posture. This evaluation is more to observe whether the
working posture of the subject while doing different sets of workstation design are
safe.
4.1 Workstation Design Analysis
The First test is to verify whether two subjects have different quality of work, or
performance. This is necessary to make sure the inferences made from the results may
work for both subjects. The t test and Analysis of Variance (ANOVA) for single factor
were conducted to see any significant different between two subjects. Both tests show
that there is not any significant different between two subjects mean performance and
also the variance. T Stat (0.5438) < T Critical one tail 1.65 or t critical two tail (1.968),
see Table 2. Analysis of Variance of single factor to observe whether there is a significant
different between two subjects also shows the same result, no significant different of two
subjects, F test (0.292) < F critical (3.857), see Table 3.
Table 4 shows result of different setting workstation design for subject # 1. It points up
that different sets present a range of mean and standard deviation. First assessment of the
results may conclude that position of subject either standing or sitting (assuming other
factors Table and Tools in the same set) does not provide significant different. For
example at position Table 91 cm and No Jig, standing and sitting provides 30.69 sec and
30.24, while with jig standing and sitting gives 27.09 sec and 23.62 sec. First evaluation
shows the present of tool gives significant different to the assembly time. For instance the
average of using No Jig and Jig 30.46 sec compare to 25.35 sec. for Table set 91 cm, and

8
35.06 sec compare to 26.67 sec for Table 103 cm. While different set of Table i.e. Table
91 cm and 103 cm provides mean 27.91 sec compare to 30.86 sec.
Table 2: t-Test: Paired Two Sample Means
Subject#2 Subject#1
Mean 29.66451 29.38656
Variance 30.38457 45.73449
Observations 288 288
Pearson Correlation 0.011985 Hypothesized Mean Difference 0
Df 287
t Stat 0.543854
P(T<=t) one-tail 0.293482
t Critical one-tail 1.65018
P(T<=t) two-tail 0.586964
t Critical two-tail 1.968264
Table 3: Anova: Single Factor
SUMMARY
Groups Count Sum Average Variance
Subject#2 288 8543.38 29.66451 30.38457
Subject#1 288 8463.33 29.38656 45.73449
ANOVA
Source of Variation SS Df MS F P-value F crit
Between Groups 11.125 1 11.125 0.292305 0.588957 3.85771
Within Groups 21846.17 574 38.05953
Total 21857.3 575
Table 4 Descriptive statistics of Results Subject #1
F-1 f-2 F-3 F-4 F-5 F-6 F-7 F-8 All
Mean 30.69 30.24 27.09 23.62 38.07 32.05 26.00 27.33 29.39
Standard Error 1.19 1.25 0.39 0.27 1.29 0.95 0.75 0.36 0.40
Median 29.01 27.82 27.35 24.03 37.84 31.78 27.21 26.94 27.81
Standard Deviation 7.12 7.47 2.33 1.61 7.73 5.68 4.52 2.19 6.76
Sample Variance 50.71 55.85 5.44 2.61 59.76 32.28 20.40 4.79 45.73
Kurtosis 5.11 1.70 0.19 -0.75 -1.08 1.75 1.68 -0.70 2.54
Skewness 1.91 1.34 0.70 -0.51 0.15 0.95 -1.40 -0.51 1.41
Range 36.45 30.49 8.27 5.16 27.57 28.94 16.20 6.99 42.54
Minimum 21.19 20.97 23.78 20.54 24.26 21.12 15.10 23.14 15.10
Maximum 57.64 51.46 32.05 25.70 51.83 50.06 31.30 30.13 57.64
Sum 1104.99 1088.70 975.40 850.16 1370.49 1153.85 935.90 983.84 8463.33
Count 36.00 36.00 36.00 36.00 36.00 36.00 36.00 36.00 288.00
Confidence Level(95.0%) 2.41 2.53 0.79 0.55 2.62 1.92 1.53 0.74 0.78

9
For subject # 2, the results are rather different compare to subject # 1. For example the
Mean for various setting of table and without jig, standing and sitting position provides
22.88 sec compare to 25.55 sec. While using jig, standing and sitting provides 35.52 sec
compare to 27.41 sec. These two results show non consistent for position, on the first set
sitting is slower compare to the second one, this may be due to using jig and no jig.
Further investigation should be carried on which factors contribute more in reducing or
increasing assembly time.
Table 5 shows descriptive statistics results of Subject #2. It shows more consistent in
terms of assembly time, it can be seen from the standard of deviation, there are not much
different.
Table 5 Descriptive statistics of Results Subject #2
A-1 A-2 A-3 A-4 A-5 A-6 A-7 A-8 All
Mean 22.88 25.88 32.52 27.41 31.61 29.68 31.90 35.42 29.66
Standard Error 0.61 0.61 0.82 0.51 0.92 0.88 0.43 0.36 0.32
Median 22.44 25.55 31.43 26.27 30.70 28.97 32.35 35.93 29.36
Standard Deviation 3.67 3.65 4.91 3.04 5.53 5.31 2.58 2.19 5.51
Sample Variance 13.49 13.33 24.07 9.25 30.61 28.17 6.65 4.79 30.38
Kurtosis -0.38 -0.57 -0.42 -0.81 1.07 2.18 -1.26 -0.96 0.17
Skewness 0.04 -0.16 0.97 0.87 0.94 1.00 -0.08 0.31 0.22
Range 14.68 14.26 14.53 8.59 25.04 26.09 7.30 7.01 32.10
Minimum 15.39 18.19 27.29 24.70 22.45 19.46 28.42 32.35 15.39
Maximum 30.07 32.45 41.82 33.29 47.49 45.55 35.72 39.36 47.49
Sum 823.83 931.60 1170.88 986.84 1138.05 1068.54 1148.48 1275.16 8543.38
Count 36.00 36.00 36.00 36.00 36.00 36.00 36.00 36.00 288.00
Confidence Level(95.0%) 1.24 1.24 1.66 1.03 1.87 1.80 0.87 0.74 0.64
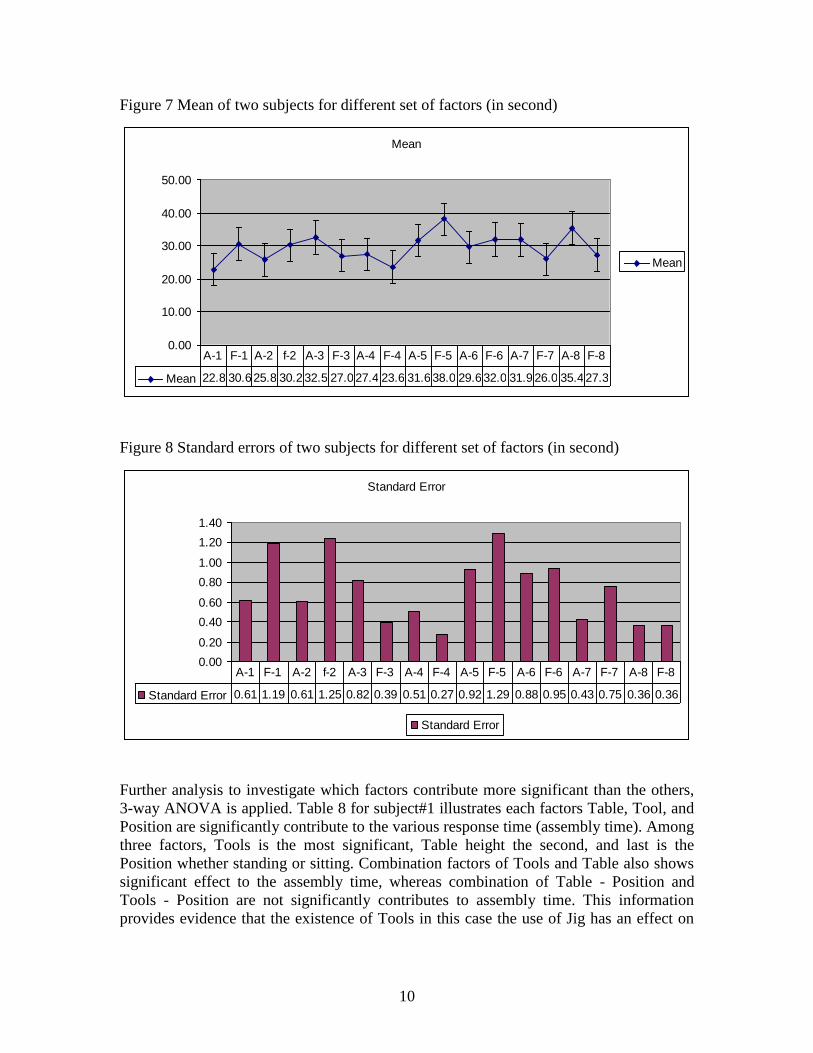
Figure 7 and Figure 8 illustrates the mean and standard deviation for every set of
workstation design for each subjects. Subject #1 (F) and subject#2 (A), the Mean for each
set of workstation design is not much significant, however most of the standard deviation
for subject #2 (A) are less than Subjects# 1, it shows more consistent in assembly time.
Further investigation is to observe whether there is a significant different among the
setting of experiments, Analysis of Variance (ANOVA) for with single factor for first
subject (Subject #1) and also subject #2 were used. The F Test for both subjects show
there exist a significant different among the setting of the experiments, meaning different
position, the height of table and the use of Jig and no Jig, contribute to significant
different to the response time (assembly time). Table 6 and 7 shows the ANOVA analysis
for single factor of subject t#1 and #2.
10
Figure 7 Mean of two subjects for different set of factors (in second)
Mean
0.00
10.00
20.00
30.00
40.00
50.00
Mean
Mean 22.8 30.625.8 30.2 32.5 27.027.4 23.6 31.638.0 29.632.0 31.9 26.0 35.427.3
A-1 F-1 A-2 f-2 A-3 F-3 A-4 F-4 A-5 F-5 A-6 F-6 A-7 F-7 A-8 F-8
Figure 8 Standard errors of two subjects for different set of factors (in second)
Standard Error
0.00
0.20
0.40
0.60
0.80
1.00
1.20
1.40
Standard Error
Standard Error 0.61 1.19 0.61 1.25 0.82 0.39 0.51 0.27 0.92 1.29 0.88 0.95 0.43 0.75 0.36 0.36
A-1 F-1 A-2 f-2 A-3 F-3 A-4 F-4 A-5 F-5 A-6 F-6 A-7 F-7 A-8 F-8
Further analysis to investigate which factors contribute more significant than the others,
3-way ANOVA is applied. Table 8 for subject#1 illustrates each factors Table, Tool, and
Position are significantly contribute to the various response time (assembly time). Among
three factors, Tools is the most significant, Table height the second, and last is the
Position whether standing or sitting. Combination factors of Tools and Table also shows
significant effect to the assembly time, whereas combination of Table - Position and
Tools - Position are not significantly contributes to assembly time. This information
provides evidence that the existence of Tools in this case the use of Jig has an effect on

11
assembly time. It means also the design of Jig is help the workers’ productivity. Subject
#2 has slightly different results compare to #1.
Table 6 ANOVA of Single Factor for Subject#1
Anova: Single Factor combination of Table-Tools and Position
Subject # 1
SUMMARY
Groups Count Sum Average Variance
F-1 36 1104.99 30.69417 50.7076
F-2 36 1088.7 30.24167 55.84857
F-3 36 975.4 27.09444 5.4411
F-4 36 850.16 23.61556 2.607043
F-5 36 1370.49 38.06917 59.76303
F-6 36 1153.85 32.05139 32.28432
F-7 36 935.9 25.99722 20.39859
F-8 36 983.84 27.32889 4.785222
ANOVA
Source of Variation SS Df MS F
P-value F crit
Between Groups 5011.557 7 715.9367 24.70499 3.81E-
26 2.042359
Within Groups 8114.241 280 28.97943
Total 13125.8 287
Table 7: Anova: Single Factor
Subject #2
SUMMARY
Groups Count Sum Average Variance
A-1 36 823.83 22.88417 13.48785
A-2 36 931.6 25.87778 13.32894
A-3 36 1170.88 32.52444 24.0651
A-4 36 986.84 27.41222 9.248635
A-5 36 1138.05 31.6125 30.60869
A-6 36 1068.54 29.68167 28.17377
A-7 36 1148.48 31.90222 6.646349
A-8 36 1275.16 35.42111 4.788833
ANOVA
Source of Variation SS Df MS F P-value F crit
Between Groups 4158.187 7 594.0267 36.45785 4.69E-
36 2.042358
Within Groups 4562.186 280 16.29352
Total 8720.373 287

12
Table 8: 3 way ANOVA for Assembly of Electric tool
Subject # 1
Source Df SS MS F Stat F-crit
Table 1 626.67 626.67 21.62 3.87441
Tool 1 3285.43 3285.43 113.37 3.87441
Position 1 334.18 334.18 11.53 3.87441
Tab-tool 1 194.16 194.16 6.70 3.87441
Tab-pos 1 2.56 2.56 0.09 3.87441
tool-pos 1 84.10 84.10 2.90 3.87441
3-way 1 484.46 484.46 16.72 3.87441
Error 280 8114.24 28.98
Total 287 13125.80
Table 9 illustrates 3 way ANOVA results for Subject # 2, Table height is the most
significant factor effect to the assembly time, while Tools (with Jig and without Jig) is the
second factor, and position (standing or sitting) does not contribute significantly the
assembly time. Second subject has relatively shorter than the first subject. That might be
the reason the height of table does has an effect to the response time. The combination
Table and Tool have significantly effect to the assembly time, this may be understood
since both factors are significant. However, the other two combinations i.e. Table-
Position, and Tools-Position combinations do not significantly contribute to results.
Table 9: 3 way ANOVA for Assembly Time
Subject # 2
Source df SS MS F Stat F-crit
Table 1 1785.43 1785.43 109.58 3.87441
Tool 1 1331.88 1331.88 81.74 3.87441
Position 1 1.27 1.27 0.08 3.87441
Tab-tool 1 119.15 119.15 7.31 3.87441
Tab-pos 1 61.83 61.83 3.79 3.87441
tool-pos 1 31.75 31.75 1.95 3.87441
3-way 1 826.89 826.89 50.75 3.87441
Error 280 4562.19 16.29
Totals 287 8720.37
As mention earlier there are 8 different positions of working, every position was analyzed
to determine whether the posture is safe or exposed to hazards. RULA Software was used
as a tool to generate the results. According to RULA Software, the lowest of RULA score
indicates that the particular working posture is safe. The results of every working posture
adopted by the subjects in various condition of workstation are presented in the following
sections.

13
4.2 Analyses of Working Posture
In a workstation, a subject may perform a task in various working posture. Sometimes the
working posture is safe to the subject and sometimes it can be exposed to the hazards.
Improper workstation design will expose to occupational hazards associated with
awkward working posture. For example, if the working height is not properly adjusted or
positioned too low, subject needs to perform the task in bending posture. Marras, W. S.
(2000) identified that the awkward working postures such as bending, twisting and static
are the main contributors to occupational hazards associated lower back pain in variety of
industries. Therefore, the attention on working posture has to be given priority to ensure
it is safe to the subject. There are various tools that have been introduced to analyze
working posture; one of the common tools is RULA analysis (McAtamney, L. and
Corlett, E. N., 1993). RULA analysis may be an effective tool that can be used in the
current research.
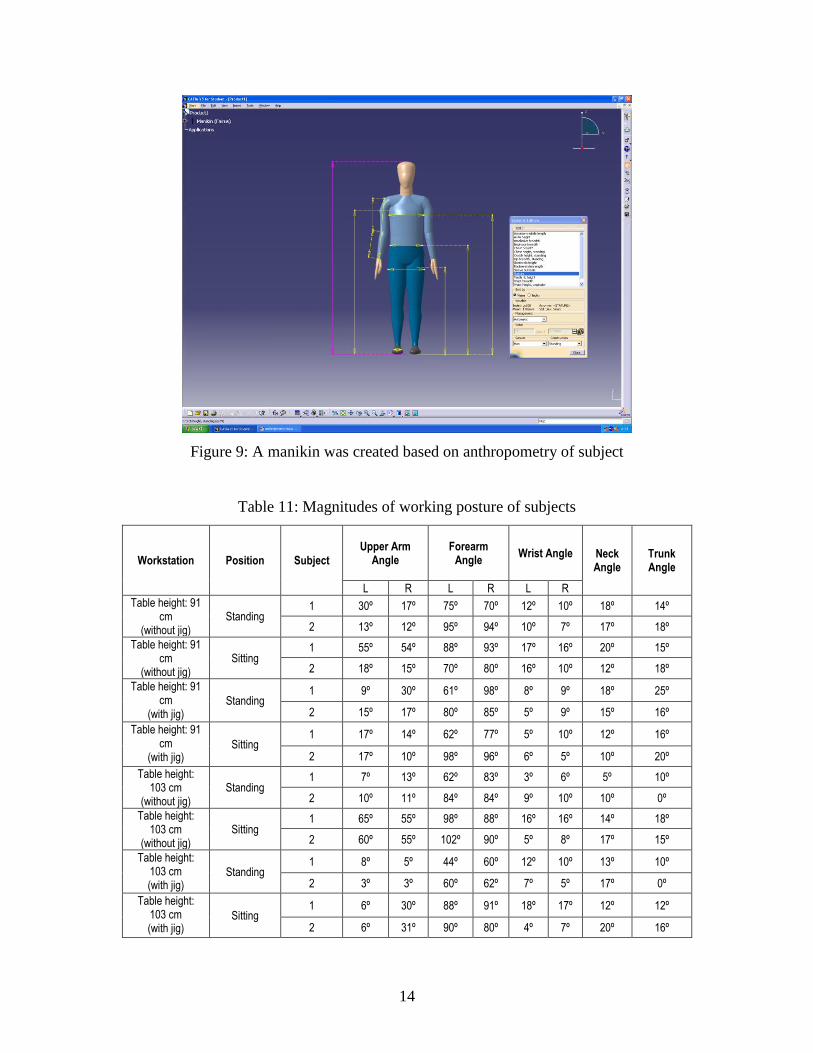
Before the posture of a subject being analyzed, the researchers have to consider the
condition of workstation and anthropometry of subjects. The workstation was designed
using CATIA Part Design according to the actual dimensions of real workstation.
Meanwhile, the researchers were measured the anthropometry of subjects using an
antropolometer. The specific dimensions of subjects’ anthropometry, as shown in Table
10 were adapted to create a manikin in RULA Software as shown in Figure 9.
Consequently the drawing of workstation is transferred into RULA Software and the
created manikin was positioned at the workstation. This is done by referring to the real
situation to ensure RULA Software generates an accurate result. The orientation of
subjects is set based on magnitudes of working posture such as neck angle, trunk angle of
the subjects, as shown in Table 11. A complete analysis of working posture using RULA
Software is shown in Figure 10.
Table 10: Anthropometry data for the subjects
Body parts Subject 1 Subject 2
Stature 1702 mm 1721 mm
Axilla 1270 mm 1280 mm
Chest (standing) 1230 mm 1240 mm
Waist (standing) 956 mm 970 mm
Crotch (standing) 764 mm 750 mm
Acromion-radiale length 300 mm 290 mm
Radiale-stylion length 250 mm 240 mm
Chest breadth 320 mm 290 mm
Waist breadth 290 mm 264 mm
Hip breadth (standing) 340 mm 324 mm
Elbow height (standing) 1050 mm 1050 mm
Elbow height (sitting) 900 mm 800 mm
14
Figure 9: A manikin was created based on anthropometry of subject
Table 11: Magnitudes of working posture of subjects
Workstation Position Subject
Upper Arm Angle
Forearm
Angle
Wrist Angle Neck Angle
Trunk Angle
L R L R L R
Table height: 91 cm
(without jig) Standing
1 30º 17º 75º 70º 12º 10º 18º 14º
2 13º 12º 95º 94º 10º 7º 17º 18º
Table height: 91 cm
(without jig) Sitting
1 55º 54º 88º 93º 17º 16º 20º 15º
2 18º 15º 70º 80º 16º 10º 12º 18º
Table height: 91 cm
(with jig) Standing
1 9º 30º 61º 98º 8º 9º 18º 25º
2 15º 17º 80º 85º 5º 9º 15º 16º
Table height: 91 cm
(with jig) Sitting
1 17º 14º 62º 77º 5º 10º 12º 16º
2 17º 10º 98º 96º 6º 5º 10º 20º
Table height: 103 cm
(without jig) Standing
1 7º 13º 62º 83º 3º 6º 5º 10º
2 10º 11º 84º 84º 9º 10º 10º 0º
Table height: 103 cm
(without jig) Sitting
1 65º 55º 98º 88º 16º 16º 14º 18º
2 60º 55º 102º 90º 5º 8º 17º 15º
Table height: 103 cm (with jig)
Standing 1 8º 5º 44º 60º 12º 10º 13º 10º
2 3º 3º 60º 62º 7º 5º 17º 0º
Table height: 103 cm (with jig)
Sitting 1 6º 30º 88º 91º 18º 17º 12º 12º
2 6º 31º 90º 80º 4º 7º 20º 16º
15
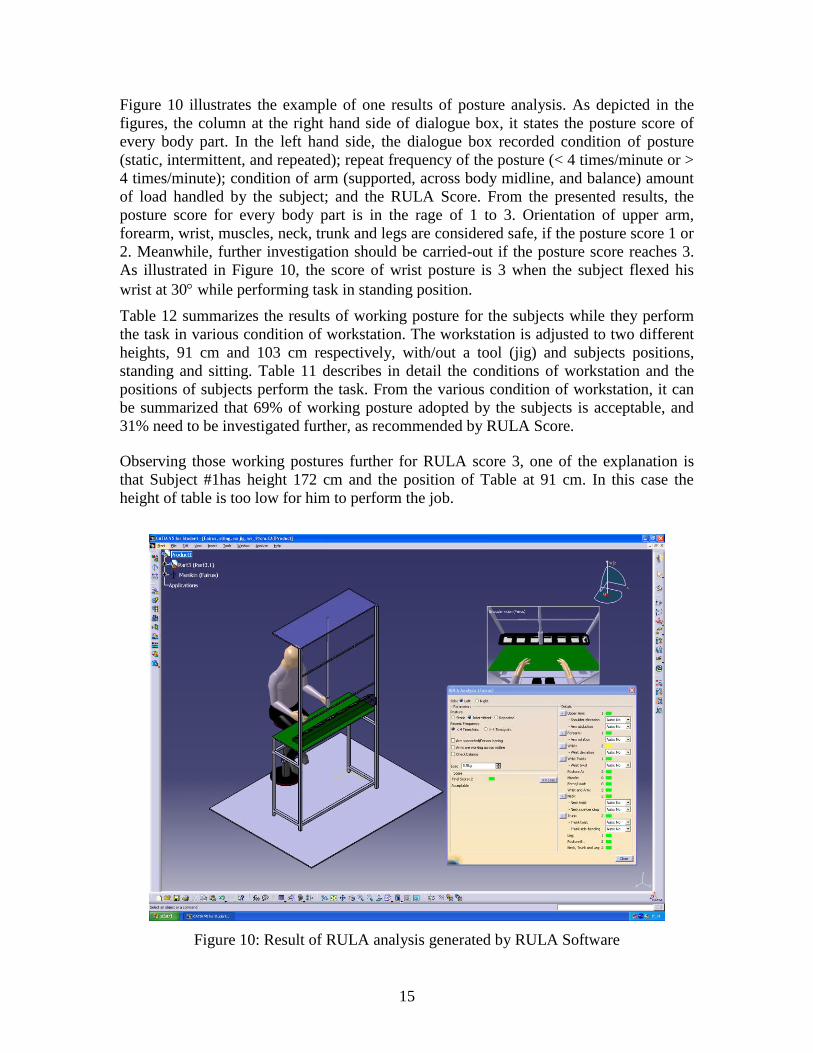
Figure 10 illustrates the example of one results of posture analysis. As depicted in the
figures, the column at the right hand side of dialogue box, it states the posture score of
every body part. In the left hand side, the dialogue box recorded condition of posture
(static, intermittent, and repeated); repeat frequency of the posture (< 4 times/minute or >
4 times/minute); condition of arm (supported, across body midline, and balance) amount
of load handled by the subject; and the RULA Score. From the presented results, the
posture score for every body part is in the rage of 1 to 3. Orientation of upper arm,
forearm, wrist, muscles, neck, trunk and legs are considered safe, if the posture score 1 or
2. Meanwhile, further investigation should be carried-out if the posture score reaches 3.
As illustrated in Figure 10, the score of wrist posture is 3 when the subject flexed his
wrist at 30 while performing task in standing position.
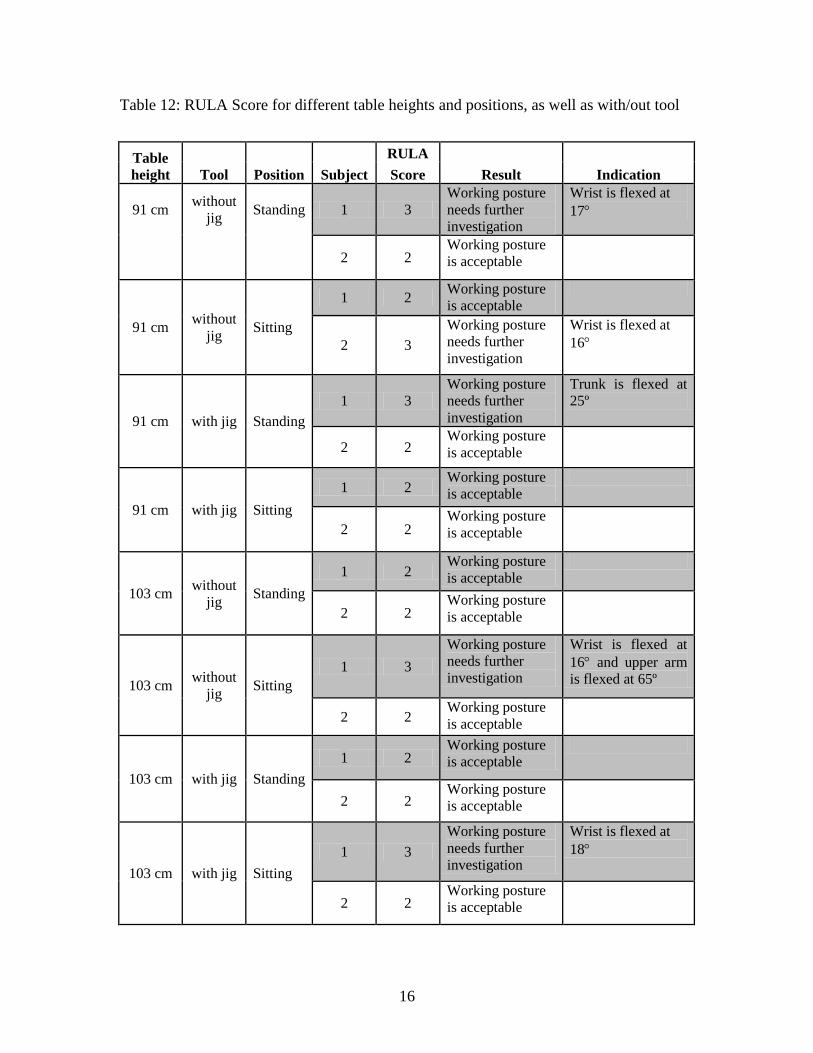
Table 12 summarizes the results of working posture for the subjects while they perform
the task in various condition of workstation. The workstation is adjusted to two different
heights, 91 cm and 103 cm respectively, with/out a tool (jig) and subjects positions,
standing and sitting. Table 11 describes in detail the conditions of workstation and the
positions of subjects perform the task. From the various condition of workstation, it can
be summarized that 69% of working posture adopted by the subjects is acceptable, and
31% need to be investigated further, as recommended by RULA Score.
Observing those working postures further for RULA score 3, one of the explanation is
that Subject #1has height 172 cm and the position of Table at 91 cm. In this case the
height of table is too low for him to perform the job.
Figure 10: Result of RULA analysis generated by RULA Software
16
Table 12: RULA Score for different table heights and positions, as well as with/out tool
Table
height Tool Position Subject
RULA
Result Indication Score
91 cm without
jig Standing 1 3
Working posture
needs further
investigation
Wrist is flexed at
17
2 2 Working posture
is acceptable
91 cm without
jig Sitting
1 2 Working posture
is acceptable
2 3
Working posture
needs further
investigation
Wrist is flexed at
16
91 cm with jig Standing
1 3
Working posture
needs further
investigation
Trunk is flexed at
25º
2 2 Working posture
is acceptable
91 cm with jig Sitting
1 2 Working posture
is acceptable
2 2 Working posture
is acceptable
103 cm without
jig Standing
1 2 Working posture
is acceptable
2 2 Working posture
is acceptable
103 cm without
jig Sitting
1 3
Working posture
needs further
investigation
Wrist is flexed at
16 and upper arm
is flexed at 65º
2 2 Working posture
is acceptable
103 cm with jig Standing
1 2 Working posture
is acceptable
2 2 Working posture
is acceptable
103 cm with jig Sitting
1 3
Working posture
needs further
investigation
Wrist is flexed at
18
2 2 Working posture
is acceptable
17
V. Conclusion and Further Research
Significant findings pertinent to the impact of various condition of workstation design to
response time (assembly time) and to the working posture have been generated from this
research. The following findings are concluded:
(i) The design of jig has significantly help subjects in performing their jobs. It has
shown statistically this factor is significant contributes to the Response time
(assembly time) of the plug assembly line.
(ii) The design of the jig does not have any implication in working posture. Either
provided or not provided with the jig, both subjects show a safe working posture.
However, appropriate design of tool needs to ensure the wrist posture of subject
within safe limit.
(iii) The position: standing and sitting while performing task does not contribute
significantly to the response time, both position of working posture are safe.
Subjects adopt safe working posture when they perform the task in standing
position with working height is slightly high. Correspondingly, their posture is
safe when perform the task in sitting position with working height is slightly low.
(iv) The Table height also has significant factor to the response time. Two sets of table
height, one is for precision job, the other for non-precision job. It turns out that
table height of 91 cm (non-precision) is more suitable for the job, it shown by the
response time shorter than the 103 cm (precision). This job does not require
precision position of the table.
(v) The table height of working also plays an important role to determine the safe
posture of a subject. When the table height is adjusted appropriately to subject’s
height or, when a subject manipulating the task in elbow height, the posture
adopted will be safe.
There are some areas need to explore further, among others are:
1) Design of jig was chosen can handle 4 plugs at the same time, the optimum number
should be investigated, how many is the optimum plugs that give the shortest
assembly time;
2) Design of assembly process, can be explored further whether two or three series of
subjects would be better than single subject finish the job.
3) Design of product itself can be further investigated, the number of components would
play significant contribution the response time.

18
REFERENCES
Alwin, L., Matthias, J. and Wolfgang, L. (2000). Electromyographical indication of
muscular fatigue in occupational field studies. International Journal of Industrial
Ergonomics, 25 (6), p. 645-660.
Biman, D. and Arijit, K. S. (1996). Industrial workstation design: A systematic
ergonomic approach. Applied Ergonomics, 27 (3), p. 157-163.
Blader, S., Barch-Holst, U., Danielsson, S., Ferhm, E., Kalpamaa, M., Leijon, M. and
Markhede, G. (1991). Neck and shoulder complaints among-sewing machine
operators: a study concerning frequency, symtoatology and dysfunction. Applied
Ergonomics, 22, p. 251-257.
Bruijin, I., d., Engels, J. A., Gulden J., W., J, van der (1997). A simple method to
evaluate the reliability of OWAS observations. Applied Ergonomics, 29 (4),
p. 281-283.
Carrasco, C., Coleman, N., Healey, S. and Lusted, M. (1995). Packing products for
customers: an ergonomics evaluation of three supermarket checkouts. Applied
Ergonomics, 26, p. 101-108.
Chaffin, D. B. and Andersson, G. B. J. (1991). Occupational biomechanics (New
York:John Wiley).
Choobineh, A., Tosian, R., Alhamdi, Z., Davarzanie and Mohammadhasan (2004).
Ergonomic intervention in carpet mending operation. Applied Ergonomic, 45(5),
p. 493-496.
Chung, M. K., Lee, I., Kee, D. (2005). Quantitative postural load assessment for whole
body manual task based on perceived discomfort. Ergonomics, 48 (5), p. 492-505.
Corlett, E. N. (1998). The investigation and evaluation of work and workplaces.
Ergonomics, 31, p. 727-734.
Daniela, C. and Enrico, O. (2006). The OCRA method for assessing and managing the
risk of upper limb work-related musculoskeletal disorders. A Satellite Event
(Course) to ICOH. 28th
International Congress. Jun 9 – 10, Milan, Italy.
Danuta, R., Tomasz, T., Karina, W., 2004. Quantitative assessment of upper limb muscle
fatigue depending on the condition of repetitive task load. Journal of
Electromyography and Kinesiology, vol. 14 (6), p. 671-682.
De Luca, C. J., 1993. Use of the surface EMG signal for performance evaluation of back
muscles. Article of Muscle Nerve, vol. 16, p. 210-216.
Farina, D., Gazzoni, M. and Marletti, R. (2003). Assessment of low back muscle fatigue
by surface EMG signal analysis: methodological aspects. Journal of
Electromyography and Kinesiology, 17, p. 47-54.
Guanyan, L. and Peter B. (1999). Current techniques for assessing physical exposure to
work-related musculoskeletal risks, with emphasis on posture-based methods.
Journal of Ergonomics, 42 (5), p. 674-695.
Goossens, R. H. M., Snijders, C. J., Roelofs, G. Y., Buchem, F.v., 2003. Free shoulder
space requirements in the design of high backrests. Ergonomics, 46(5), p. 518-
530.
Hignett, S. and McAtamney, L. (2000), Rapid entire body assessment (REBA). Applied
Ergonomics, 31, p. 201-205.
19
Isa Halim, Abdul Rahman Omar, Nor Hayati Saad, (2004). Ergonomic design to improve
occupational health in manufacturing industry. Proceeding of First International
Conference on Product Design and Development (ICPDD 2004), Universiti
Malaysia Sabah, p. 75-81.
Isa Halim, Abdul Rahman Omar, Nor Hayati Saad, (2004). Ergonomic design to improve
occupational health in manufacturing industry. Proceeding of First International
Conference on Product Design and Development (ICPDD 2004), Universiti
Malaysia Sabah, p. 75-81.
Isa Halim (2006). Ergonomics participatory opportunities for occupational health
enhancement in Malaysian SMIs. Universiti Teknologi MARA: Master thesis.
Jung, Dohyung and Chun (1992). Reach posture prediction of upper limb for ergonomic
workspace evaluation. Proceeding of the Human Factors Society, 1, p. 702-706.
Kamal, K. and Berman K. (2001). Workplace layout for seated manual handling tasks: an
electromyography study. International Journal of Industrials Ergonomics, 27(1),
p. 19-32.
Kivi, P. and Mattila, M. (1991). Analysis and improvement of work posture in the
building industry: application of the computerized OWAS method. Applied
Ergonomics, 22, p. 43-48.
Kristensen, B. J., Hansson, G. A., Fallentin, N., Andersen, J. H. and Ekdahl, C. (2001).
Assessment of work postures and movements using a video-based observation
method and direct technical measurements. Applied Ergonomics, 32, p. 517-524.
Louhevaara, V. (1999). Is the physical work load equal for ageing and young blue-collar
workers? International Journal of Industrial Engineering, 24, p. 559-564.
Marco, J. M. H. and jaap, H. v. D. (2005). Prediction of handgrip forces using surface
EMG of forearm mucles. Journal of Electromyography and Kinesiology, 15(4), p.
358-366.
Marras, W. S., Allread, W. G., Burr, D. L. and Fathallah, D. A. (2000). Prospective
validation of a low-back pain disorder risk model and assessment of ergonomic
interventions associated with manual materials handling tasks. Ergonomic,
43(11), p. 1866-1886.
Mattila, M., Karwowski, W. and Vilkki, M. (1993). Analysis of working postures in
hammering tasks on building construction sites using the computerized OWAS
method. Applied Ergonomics, 24, p. 405-412.
Massaccesi, M., Pagnotta, A., Soccetti, A., Masali, M., Masiero, C., Greco, F. (2003).
Investigation of work-related musculoskeletal disorders in truck drivers using
RULA method. Applied Eergonomic, 34, p. 303-307.
McAtamney, L. and Corlett, E. N. (1993). RULA: a survey method for the investigation
of work-related upper limb disorders. Applied Ergonomics 24 (2), p. 91-99.
Nagamachi, M. (1995). Requisites and practices of participatory ergonomics.
International Journal of Industrial Ergonomics, 15, p. 371-377.
Nico, J. D. and Jan, D. (2002). Sewing machine operation: workstation adjustment,
working posture and worker perceptions. International Journal of Industrial
Ergonomics, 30 (6), p. 341-353.

20
Olendorf, M. R. and Drury, C. G. (2001). Postural discomfort and perceived exertion in
standardized box-holding postures. Ergonomics, 44(15), p. 1341-1367.
Plamondon, A., Trimble, K., Lariviere, C., and Desjardins, P. (2004). Back muscle
fatigue during intermittent prone back extension exercise. Scandinavian Journal of
Medicine & Science In Sports, 14, p. 221-230.
Priel, V. Z. (1974). A numerical definition of posture. Journal of Human Factors, 16(6),
p. 576-584.
Razlan, M., Win, K. and Rampal K. G. (2000). Work-related musculoskeletal symptoms
among batik workers in Kelantan. Malaysian Journal of Medical Sciences, 7 (2),
p. 13-17.
Roy, S. H., De Luca and Casavant (1989). Lumbar muscle fatigue and chronic lower
back pain. Spine, 14, p. 992-1001.
Scott, G. B. and Lambe, N. R. (1996). Working practices in a perchery system, using the
OVAKO Working Posture Analyzing System (OWAS), Applied Ergonomics, 27,
p. 281-284.
Shuval, K. and Dochin, M. (2005). Prevalence of upper extremity musculoskeletal
symptoms and ergonomic risk factors at a Hi-Tech company in Israel.
International Journal of Industrial Ergonomics, 35 (6), p. 569-581.
Tissot, F., Messing, K. and Stock, S. (2005). Standing, sitting and associated working
conditions in the Quebec population in 1998. Ergonomics, 48(3), p. 249-269.
Van der Beek, A.J., Frings-Dresen, and M.H.W. (1998). Assessment of mechanical
exposure in ergonomic epidemiology. Occupational Environmental Medicine, 55,
p. 291-299.
Winkel, J., Mathiassen, S.E. (1994). Assessment of physical work load in epidemiologic
studies: concepts, issues and operational considerations. Ergonomics, 37, p. 979-
988.