Posture strategies generated by constrained optimization
8
Posture strategies generated by constrained optimization Robert Pettersson a , ˚ Asa Bartonek b , Elena M. Gutierrez-Farewik a,b,n a KTH Mechanics, Royal Institute of Technology, Osquars backe 18, SE-100 44 Stockholm, Sweden b Department of Women’s & Children’s Health, Karolinska Institute, Stockholm, Sweden article info Article history: Accepted 30 November 2011 Keywords: Posture Multibody system Static optimization abstract For people with motion disorders, posture can impact fatigue, discomfort or deformities in the long term. Orthopedic treatments such as orthoses or orthopedic surgeries which change geometric properties can improve posture in these individuals. In this study, a model has been created to study posture strategies in such situations. A 3D mechanical model consisting of eight rigid segments and 30 muscle groups is used in which varying moment arms along the ranges of motion and biarticular muscles are considered. The method is based on static optimization, both to solve the load sharing in the muscle system and to choose posture strategy. The optimization computes the specific posture with minimal required effort (level of muscle activations), while fulfilling constraints containing subject specific ranges of motion, muscle strength/weakness and external support if present. Anthropometry and strength were scaled to each individual, based on reported pediatric anthropometry and strength values, combined with each individual’s physical assessment. A control group of 10 able-bodied subjects as well as three subjects with motion disorders were studied, and simulated posture was compared with experimental data. The simulation showed reasonable to good agreement and ability to predict the effect of motion disorders and of external support. An example of application in parameter studies was also presented wherein ankle orthosis angles were varied. The model allows the user to study muscle activity at the muscle group level, position of center of mass and moments at joints in various situations. & 2011 Elsevier Ltd. All rights reserved. 1. Introduction An individual’s chosen standing posture could among able- bodied be generally the most comfortable posture, due to general health, body build and flexibility (Rybski, 2004). In persons with motion disorders the presence of lower limb contractures (restricted range of motion (ROM)), muscle weakness and spas- ticity can greatly affect standing posture (Bartonek et al., 2005). Contractures can be a consequence of spasticity during growth (Michael and Barnes, 2008), and weakness, of flaccid paresis (Beckung, 2002) or spasticity-reduction treatment, among others (Bjornson et al., 2007). For persons with deviating posture, it is difficult to predict the effect of prescribed orthopedic treatment (Nicolopoulos et al., 2000). Furthermore many parameters can be changed to affect posture: orthosis design (Owen, 2004), heel lifts (Eslami et al., 2006; Rodriguez and Aruin, 2002), muscle strength (Kuo and Zajac, 1993), weight/obesity (Gilleard and Smith, 2007), and even anthropometry (Rybski, 2004). In these cases mechan- ical theory may help clinicians make more informed decisions. In an ambitious and detailed musculoskeletal model, Amankwah et al. (2006) studied how passive joint properties affect postures, wherein reduced muscle effort and joint stiffness restrict the workspace of possible postures. They showed that stiffness in plantarflexion and hip flexion can greatly affect required muscle effort for static standing. Even if several postures are possible, it is not always clear how a subject may respond to a specific parameter change, e.g. orthotic treatment, altered strength, surgical release of con- tracture or weight change. Few orthotic treatment plans use scientific testing to evaluate their performance; it is therefore important to understand the amount of control obtained through orthotic treatment (Nicolopoulos et al., 2000). A mechanical model with parameter studies on subject-specific data could both help treatment decisions and give further insight of posture strategies. The objectives of this study were to create such a model to run subject-specific simulations allowing the user to specify lower extremity properties found at routine clinical assessment in order to have a feasible tool in a clinical context, Contents lists available at SciVerse ScienceDirect journal homepage: www.elsevier.com/locate/jbiomech www.JBiomech.com Journal of Biomechanics 0021-9290/$ - see front matter & 2011 Elsevier Ltd. All rights reserved. doi:10.1016/j.jbiomech.2011.11.053 n Corresponding author at: KTH Mechanics, Royal Institute of Technology, Osquars backe 18, SE-100 44 Stockholm, Sweden. Tel.: þ46 87907719; fax: þ46 87969850. E-mail address: [email protected] (E.M. Gutierrez-Farewik). URL: http://www.mech.kth.se (E.M. Gutierrez-Farewik). Journal of Biomechanics 45 (2012) 461–468
-
Upload
independent -
Category
Documents
-
view
3 -
download
0
Transcript of Posture strategies generated by constrained optimization

Journal of Biomechanics 45 (2012) 461–468
Contents lists available at SciVerse ScienceDirect
journal homepage: www.elsevier.com/locate/jbiomech
Journal of Biomechanics
0021-92
doi:10.1
n Corr
Osquars
fax: þ4
E-m
URL
www.JBiomech.com
Posture strategies generated by constrained optimization
Robert Pettersson a, Asa Bartonek b, Elena M. Gutierrez-Farewik a,b,n
a KTH Mechanics, Royal Institute of Technology, Osquars backe 18, SE-100 44 Stockholm, Swedenb Department of Women’s & Children’s Health, Karolinska Institute, Stockholm, Sweden
a r t i c l e i n f o
Article history:
Accepted 30 November 2011For people with motion disorders, posture can impact fatigue, discomfort or deformities in the long
term. Orthopedic treatments such as orthoses or orthopedic surgeries which change geometric
Keywords:
Posture
Multibody system
Static optimization
90/$ - see front matter & 2011 Elsevier Ltd. A
016/j.jbiomech.2011.11.053
esponding author at: KTH Mechanics, Roy
backe 18, SE-100 44 Stockholm, Sweden. Te
6 87969850.
ail address: [email protected] (E.M. Gutierre
: http://www.mech.kth.se (E.M. Gutierrez-Far
a b s t r a c t
properties can improve posture in these individuals. In this study, a model has been created to study
posture strategies in such situations. A 3D mechanical model consisting of eight rigid segments and
30 muscle groups is used in which varying moment arms along the ranges of motion and biarticular
muscles are considered. The method is based on static optimization, both to solve the load sharing in
the muscle system and to choose posture strategy. The optimization computes the specific posture with
minimal required effort (level of muscle activations), while fulfilling constraints containing subject
specific ranges of motion, muscle strength/weakness and external support if present. Anthropometry
and strength were scaled to each individual, based on reported pediatric anthropometry and strength
values, combined with each individual’s physical assessment. A control group of 10 able-bodied
subjects as well as three subjects with motion disorders were studied, and simulated posture was
compared with experimental data. The simulation showed reasonable to good agreement and ability to
predict the effect of motion disorders and of external support. An example of application in parameter
studies was also presented wherein ankle orthosis angles were varied. The model allows the user to
study muscle activity at the muscle group level, position of center of mass and moments at joints in
various situations.
& 2011 Elsevier Ltd. All rights reserved.
1. Introduction
An individual’s chosen standing posture could among able-bodied be generally the most comfortable posture, due to generalhealth, body build and flexibility (Rybski, 2004). In persons withmotion disorders the presence of lower limb contractures(restricted range of motion (ROM)), muscle weakness and spas-ticity can greatly affect standing posture (Bartonek et al., 2005).Contractures can be a consequence of spasticity during growth(Michael and Barnes, 2008), and weakness, of flaccid paresis(Beckung, 2002) or spasticity-reduction treatment, among others(Bjornson et al., 2007). For persons with deviating posture, it isdifficult to predict the effect of prescribed orthopedic treatment(Nicolopoulos et al., 2000). Furthermore many parameters can bechanged to affect posture: orthosis design (Owen, 2004), heel lifts(Eslami et al., 2006; Rodriguez and Aruin, 2002), muscle strength
ll rights reserved.
al Institute of Technology,
l.: þ46 87907719;
z-Farewik).
ewik).
(Kuo and Zajac, 1993), weight/obesity (Gilleard and Smith, 2007),and even anthropometry (Rybski, 2004). In these cases mechan-ical theory may help clinicians make more informed decisions.
In an ambitious and detailed musculoskeletal model, Amankwahet al. (2006) studied how passive joint properties affect postures,wherein reduced muscle effort and joint stiffness restrict theworkspace of possible postures. They showed that stiffness inplantarflexion and hip flexion can greatly affect required muscleeffort for static standing.
Even if several postures are possible, it is not always clearhow a subject may respond to a specific parameter change,e.g. orthotic treatment, altered strength, surgical release of con-tracture or weight change. Few orthotic treatment plans usescientific testing to evaluate their performance; it is thereforeimportant to understand the amount of control obtained throughorthotic treatment (Nicolopoulos et al., 2000). A mechanicalmodel with parameter studies on subject-specific data could bothhelp treatment decisions and give further insight of posturestrategies. The objectives of this study were to create such amodel to run subject-specific simulations allowing the user tospecify lower extremity properties found at routine clinicalassessment in order to have a feasible tool in a clinical context,

R. Pettersson et al. / Journal of Biomechanics 45 (2012) 461–468462
and to explore the model’s design and potential in predicting thestanding posture in three subjects with motion disorders as wellas in a group of able-bodied controls.
2. Method
2.1. Model
The model is a 3D system with eight rigid links and 20 degrees of freedom
(dof) (Fig. 1). Anthropometric data, i.e. segment inertia proportions, was derived
from Jensen (1986, 1989) scaled for age, body mass, height and segment lengths.
The pelvis segment length was defined as the distance between the midpoint of
hip joint centers and an approximated center of rotation point 50 mm anterior the
1st sacral vertebrae marker. The ground reaction force (GRF) was limited to act
under each foot segment, 1/10 foot length from the heel and 2/10 from the toe
(Hof et al., 2005) and without lateral width, i.e. the base of support (BoS) is the
resulting area of a parallelogram outlined by the feet. The inclusion of solid ankle–
foot orthoses (AFO) was performed using a stiff torsional spring with a specified
q7
q8
q9
q1
q2
q3
q6 q5
q4
q13
q14
q15
q16
q10
q18
q17
q20
q19
q12
q11
Fig. 1. The mechanical model with eight rigid links representing the feet, shanks,
thighs, pelvis and a head-arms-trunk segment, i.e. the joints/segments most likely
to be addressed clinically to improve standing. The single arrow head corresponds
to translational dof while the double arrowhead rotational dof according to the
right hand rule. Each dof are as follows: q1–q3—translational dof of the pelvis
segment, q4–q6—frontal, sagittal and oblique tilt respectively of the pelvis
segment, q7–q9 are the right hip ab/adduction, flexion/extension and rotation
respectively, q10 is the right knee flexion/extension, q11 and q12 are the right foot
plantar/dorsiflexion and inversion/eversion respectively, q13, q14 and q15 are the
left hip ab/adduction, flexion/extension and rotation respectively, q16 is the left
knee flexion/extension, q17 and q18 are the left foot plantar/dorsiflexion and
inversion/eversion respectively, q19 and q20 are the head-arms-trunk segments
posterior/anterior tilt and lateral tilt respectively.
neutral angle as observed experimentally. Joints’ limited ROMs were modelled
with exponential torsional springs MendofROM ¼�eð100ðcontracture angle�ðjoint angleÞÞÞ ,
which were practically inactive unless the end of the ROM was reached (sign
dependent on direction of the contracture).
Equations of motion were derived using Lagrange theory and were reduced
such that the model became static. The static postures were made stable by
constraining the vertical projection of the center of mass (COM) to lie within the
BoS. The model allows asymmetries in strength, anthropometry, ROM and
orthoses if present. The model may then freely choose any relative foot placement,
but with both feet in contact with the ground (i.e. heel rise was not allowed).
2.2. Muscle system
Fifteen muscle groups in each leg and two control moments representing
frontal and sagittal plane abdominal moments were modelled (Table 1). Muscles
were collected into groups representing joint extensors and flexors but divided
such that biarticular muscles were separated. A factor fðqÞ for each muscle group
about each joint was derived from SIMM (Delp et al., 1990) and describes each
muscle group’s maximum moment as a function of joint angle, based on each
muscle’s length and moment arm along the spanned joint’s ROM. The factor
was also normalized such that the sumP
ifi,jointðqjointÞ for fi : muscles at joint,
q : angle within ROMg has a maximum value of 1. Thus for each joint, fi,joint
represents the relative contribution of the i-th muscle to a specific joint config-
uration. This relationship between moment and joint angle was assumed to be the
same for all subjects while segment lengths were scaled to each individual’s
stature, age and gender (Morse et al., 2008; O’Brien et al., 2009).
Total strength of each muscle group was based on regression equations from
Eek et al. (2006) determined by age, weight and gender. Plantarflexor strength data
was not reported in children over 9, but was, on observation of Eek’s data,
approximately twice that of dorsiflexor strength in younger children. This assump-
tion was therefore applied here. Among the subjects in our study, weaknesses were
present, approximated during a clinical assessment with Manual Muscle Testing
(MMT) on a 0–5 scale (Hislop and Montgomery, 1995). Since MMT is a rough scale,
we have attempted to semiquantify strength; grades 0 (no strength), 3 (able to
resist gravity) and 5 (normal strength) have objective definitions, and the corre-
sponding strength for these grades were computed for each subject. Grade 4 has
been shown not significantly distinguishable from grade 5 (Aitkens et al., 1989) and
was therefore assumed as full strength. Grade 2 was assumed to be half of grade 3’s
strength. An activation variable, ai, for each muscle was then introduced and the
total available moment about a joint can be written as (shown for the knee)
Mtot ¼Mmax,flexionða2f2,kneeðqkneeÞþa4f4,kneeðqkneeÞþa14f14,kneeðqkneeÞÞ
þMmax,extensionða6f6,kneeðqkneeÞþa7f7,kneeðqkneeÞÞ ð1Þ
The passive ROM at a joint did not take into account the angle at adjacent joints.
Table 1Muscle groups and their functions.
Function Muscles No.
Dorsiflexion tib_ant, per_t, ext_d, ext_h 1
Plantarflexion med_gas, lat_g 2
soleus, tib_p, flex_h, flex_d, per_b, per_l 3
Knee flexion med_gas, lat_g 2
semimem, semit 4
bifemsh 14
Knee extension rect_fem 6
vas_med, vas_i, vas_l, pat_l 7
Hip flexion rect_fem 6
add_long, add_b, pect, grac 8
glut_med1, glut_min1, sar, tfl 9
psoas, iliacus 15
Hip extension semimem, semit, bifem 4
glut_max2, glut_max3 5
add_mag1, add_mag2, add_mag3 10
glut_med3, glut_max1, glut_min3 11
Hip abduction glut_med1, glut_min1, sar, tfl 9
glut_med3, glut_max1, glut_min3 11
glut_med2, glut_min2, peri 12
Hip adduction semimem, semit, bifem 4
add_long, add_b, pect, grac 8
add_mag1, add_mag2, add_mag3 10
psoas, iliacus 15
Hip internal rotation glut_med1, glut_min1, sar, tfl 9
Hip external rotation quad_fem, gem 13
psoas, iliacus 15
R. Pettersson et al. / Journal of Biomechanics 45 (2012) 461–468 463
2.3. Optimization/problem formulation
The general constrained optimization problem can be written as
minx
f ðxÞ subject to
cðxÞr0
ceqðxÞ ¼ 0
lbrxrub ð2Þ
where x is a vector containing all variables, f is the scalar function to be
minimized, c and ceq are the inequality and equality constraints, respectively,
and lb and ub are the variables’ lower and upper bounds. The biomechanical
analogies are as follows: variables are angles at each dof, activations in each
muscle group and external forces such as orthosis moment and GRFs; cost
function defines the strategy by which the individual chooses posture; constraints
on variables define ROMs and strength limits; and finally, the nonlinear
constraints contain the equilibrium equations, the equations to keep the COM’s
position within the BoS and the friction limit (Appendix A).
The problem becomes a complex constrained nonlinear optimization problem
(78 variables and approximately 214 constraints) and requires a nonlinear solver.
The function fmincon from Matlab (MathWorks) was used.
While the constraints deal with mechanical properties and conditions, the cost
function determines which of the feasible solutions to choose. The cost function
used was the sum of squared activations of each muscle group, and the posture
which minimizes this cost is chosen, corresponding to the least overall required
muscle activation.
2.4. Motion capture and clinical assessment
Motion analysis was performed using an eight-camera motion analysis system
(Vicon) with two force plates (Kistler) and a conventional, whole-body marker set
(Vicon, Plug-In-Gait). Quiet standing was recorded during 25 s, of which at least
5 s were chosen to represent the posture. In connection with motion analysis, the
subjects underwent a physical examination during which a physiotherapist
evaluated strength with MMT, measured passive joint ROM with a goniometer
and assessed presence of spasticity.
2.5. Application
The presented method was applied to 10 able-bodied controls and three
subjects with different motion disorders, and in a model-based parameter study.
Ethical approval was obtained. Participation was voluntary and in consent with
the children’s parents.
2.5.1. Control study
To test the simulation’s viability in predicting posture and postural changes,
standing data from a control group of 10 able-bodied children (5F/5M, mean(SD)
age 10.5(1.7)y, height 145(11) cm) who stood both with ordinary athletic shoes,
then with additional 30-mm heel wedges, was analyzed. Paired t-tests were used
to compare experimental vs. simulated pelvis angles, and a repeated measures
ANOVA was used to compare experimental vs. simulated hip flexion/extension,
hip ab/adduction, knee flexion/extension and ankle dorsi/plantarflexion angles.
Statistical comparison was then performed between the simulated vs. experi-
mental postural change due to heel elevation as a difference between the two
conditions.
2.5.2. Case 1
A male subject, 4.7 years old (height 111.5 cm, weight 19.7 kg), with arthro-
gryposis was studied. Passive ROM was in hip extension 01/01 (left/right), knee
extension 201/�101 and ankle dorsiflexion 201/�151, where 01 indicates a neutral
ankle or fully extended hip/knee and negative angles indicate that an angle less
than neutral was measured. The subject wore shoes and a solid AFO on the right
foot (151 shank anterior tilt). In this example the feet were constrained in the
model to have the heels aligned, as in the experiments. Standing with heel lifts of
10 mm, 20 mm, 30 mm was also studied. Strength in the left leg was normal (5)
(hip adductors (4)). Right knee extensor and hip adductor strength were nearly
normal (4) and hip abductors, plantarflexors and dorsiflexors had weakness (3).
2.5.3. Case 2
A female subject, 13.0 years old (height 157.0 cm, weight 41.4 kg), with
myelomeningocele was studied. Passive ROM in hip extension was 01/01 (left/
right), knee extension �101/�101 and ankle dorsiflexion �101/�101. Although
the dorsiflexion ROM was limited to �101, the shank orientation, standing with
heel–floor contact, could reach 321/221 (left/right) of anterior lean, due to subtalar
eversion, knee flexion and foot deformation. Therefore the shank orientation, gives
a better description of the dorsiflexion limit and was used as the constraint.
Strength in hip flexors, hip adductors and knee extensors was normal, hip
extension and knee flexion close to normal (4/4) but weakness was present in
hip abductors (2/2) dorsiflexors (1/1) and plantarflexors (1/1). Measurement and
simulation were performed both barefoot and with bilateral AFOs and shoes.
Two additional hypothetical situations were simulated for this subject in
barefoot stance: one with unlimited GRF placement under the foot, and one with a
penalty for resting against the end of the ankle ROM to represent discomfort.
2.5.4. Case 3
A female subject, 7.4 years old (height 119 cm, weight 21.9 kg), with
arthrogryposis was studied. Passive ROM was in hip extension 01/01 (left/right),
knee extension 151/151 and ankle dorsiflexion 01/01. The right leg was 1.5 cm
longer than the left. Solid AFOs and shoes were used in motion analysis, and the
measured shank angle (asymmetric) was used as input for the model’s dorsiflex-
ion limit. The subject had normal strength. Standing with a 30 mm heel lift was
also studied.
2.5.5. Parameter dependence, a simulation study
The neutral ankle angles of left and right AFOs were varied for a hypothetical
subject with normal strength in all joints except the ankles (anthropometry from
case 2 was used). AFO angles varied independently from 51 to 251 of dorsiflexion.
An asymmetry was studied with a limited knee extension of �201/�101 (left/
right). Otherwise normal ROM and strength were assigned.
3. Results
3.1. Control study
In the able-bodied group, the simulation predicted signifi-cantly more anterior pelvic tilt, slightly more pelvic lateral tilt,more hip flexion, slightly more hip adduction, and slightly lessknee extension than the experimental results. However, thesimulation predictions of the postural changes due to heelelevation were not significantly different from the experimentalvalues in any angle (Table 2).
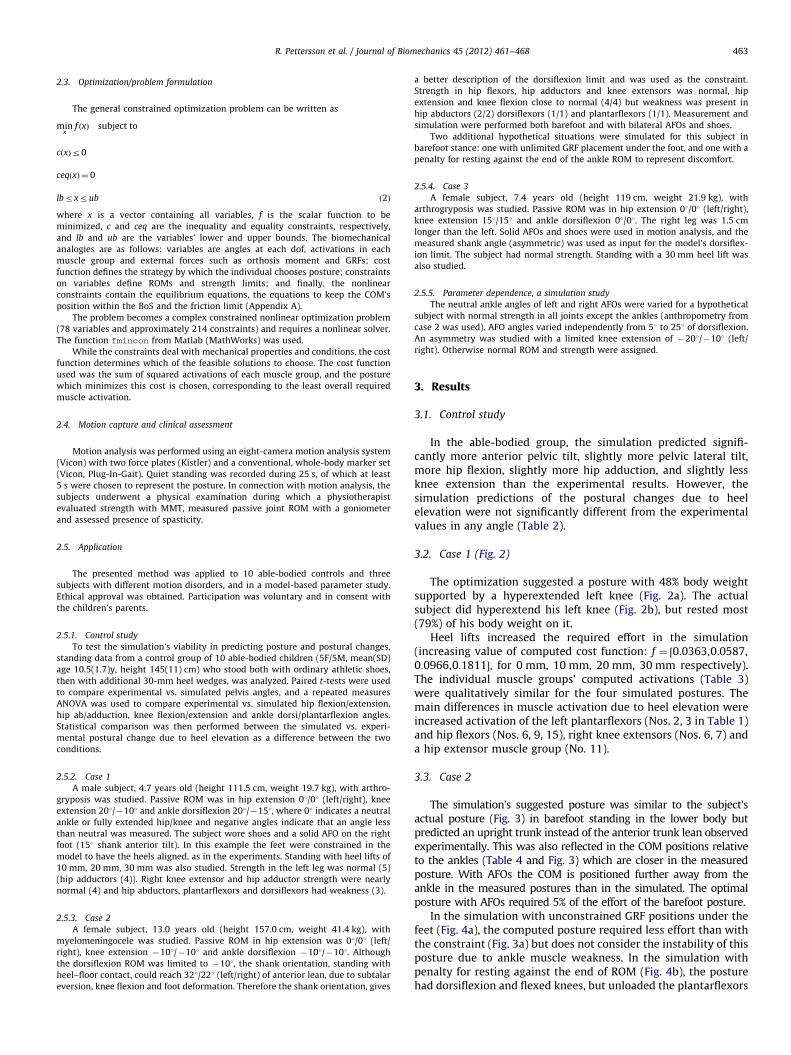
3.2. Case 1 (Fig. 2)
The optimization suggested a posture with 48% body weightsupported by a hyperextended left knee (Fig. 2a). The actualsubject did hyperextend his left knee (Fig. 2b), but rested most(79%) of his body weight on it.
Heel lifts increased the required effort in the simulation(increasing value of computed cost function: f ¼ ½0:0363,0:0587,0:0966,0:1811�, for 0 mm, 10 mm, 20 mm, 30 mm respectively).The individual muscle groups’ computed activations (Table 3)were qualitatively similar for the four simulated postures. Themain differences in muscle activation due to heel elevation wereincreased activation of the left plantarflexors (Nos. 2, 3 in Table 1)and hip flexors (Nos. 6, 9, 15), right knee extensors (Nos. 6, 7) anda hip extensor muscle group (No. 11).
3.3. Case 2
The simulation’s suggested posture was similar to the subject’sactual posture (Fig. 3) in barefoot standing in the lower body butpredicted an upright trunk instead of the anterior trunk lean observedexperimentally. This was also reflected in the COM positions relativeto the ankles (Table 4 and Fig. 3) which are closer in the measuredposture. With AFOs the COM is positioned further away from theankle in the measured postures than in the simulated. The optimalposture with AFOs required 5% of the effort of the barefoot posture.
In the simulation with unconstrained GRF positions under thefeet (Fig. 4a), the computed posture required less effort than withthe constraint (Fig. 3a) but does not consider the instability of thisposture due to ankle muscle weakness. In the simulation withpenalty for resting against the end of ROM (Fig. 4b), the posturehad dorsiflexion and flexed knees, but unloaded the plantarflexors

SIMULATED
SIMULATED with HEEL LIFT MEASURED with HEEL LIFT
MEASURED
Fig. 2. The resulting posture in Case 1 with and without heel lift: (a) simulation
without heel lift, (b) measured without heel lift, (c) simulation with heel lift, (d)
measured with heel lift. In this figure, as in Figs. 3–5, there is a sagittal, frontal and
oblique view of each posture. The ground reaction force at each foot are plotted for
the simulated postures, where direction and origin together with relative size can
be seen. COM positions are also shown.
Table 2Statistical values of the model’s viability in terms of predicting chosen postures and postural changes due to heel elevation.
Segment orientation Posture without heel wedge Postural change with heel wedge
Mean (SD)
simulation
Mean (SD)
experimental
p-Valuea Mean (SD)
simulation
Mean (SD)
experimental
p-Valuea
Pelvis tilt, sagittal (1)b 26 (7) 12 (5) 0.001 0 (4) 1 (1) 0.839
Pelvis obliquity, frontal (1)c�3 (5) 0 (2) 0.033 �1 (5) 0 (1) 0.565
Hip flexion (1) Right 24 (7) 3 (5) o0:001 3 (6) 2 (1) 0.662
Left 24 (7) 4 (4) 1 (4) 1 (1)
Hip ad-/abduction (1) Right 3 (2) �2 (2) 0.034 �1 (2) �1 (1) 0.792
Left 2 (3) 1 (3) 0 (2) 0 (1)
Knee flexion (1)d Right 0 (1) �5 (3) 0.004 4 (9) 1 (2) 0.354
Left 0 (1) �3 (4) 0 (0.1) 0 (1)
Ankle dorsi-/plantarflexion (1) Right 2 (0.3) 2 (3) 0.818 �11 (5) �10 (2) 0.103
Left 2 (1) 2 (3) �13 (0.7) �11 (1)
a Only one p-value is shown for bilateral data, calculated from a repeated measures ANOVA with between-subject factor of side (left or right) and analysis type
(simulated or experimental).b Positive indicates anterior tilt.c Positive indicates right tilt.d Negative indicates hyperextension.
R. Pettersson et al. / Journal of Biomechanics 45 (2012) 461–468464
by moving the center of pressure close to the ankles throughposterior trunk tilt.
3.4. Case 3
The simulation suggested an upright posture of the pelvis andhead-arms-trunk (HAT) segments, while the subject insteadextended her knees and hips and compensated with slightlyposterior trunk tilt (Fig. 5). The COM’s position was also moreanteriorly located in the experiment. There was good agreementbetween the simulated and measured postures with 30 mm heel
elevation. The pelvic tilt in the frontal plane was present in bothsimulation and experiments. The simulated heel lift of 30 mm,however, required 11 times the effort level as without.
3.5. Parameter dependence, a simulation study
The computed cost function was lowest for AFO angles of 17–211and 13–171 (left/right) (Fig. 6a), which provide symmetric posturesdespite asymmetric knee contractures. The higher cost function witha left AFO angle of 51 is due to the model’s compensation of largeanterior trunk flexion, resulting in larger hip and lower backmoments. If it is clinically relevant instead to decrease left kneeextension moment (Fig. 6b), the optimal orthosis angle combinationwas the same. However, a left orthosis angle of 51 also results in lowleft knee moment.
In the knee extensors, specifically rectus femoris, the activa-tion level in the left leg was less for postures with highest costfunctions, i.e. postures with forward trunk lean. With forwardflexion of the upper body, it was not optimal to activate a musclewhich partly flexes the hip (Fig. 6c).
4. Discussion
The optimization model was able to study posture strategiesdependent on subject properties and orthopedic aids with reason-able accuracy and to speculate on optimal orthotic specificationsfor a particular case. We also, however, demonstrate the need tobetter mechanically describe the subject in order to draw moreprecise conclusions about the choice of posture and eventually aidin treatment planning.
The optimization model was able to successfully predict thepostural changes due to heel elevation observed in a group ofable-bodied persons. The differences observed between the simu-lated and observed angles are predominantly attributable to thedefinition adopted to define pelvic–HAT segment connection,evident in the large differences in anterior pelvic tilt and hipflexion (a relative angle), and decreasing differences in the moredistal joints. The present model assumes that the HAT’s weight istransferred only through the joint between the HAT and pelvis, andits location is therefore important for the determination of theneutral angle of the pelvis. Furthermore, the model does notconsider stretch resistance within the ROM at any joint, even thoughpelvic orientation is dependent on the trunk and femur orientation
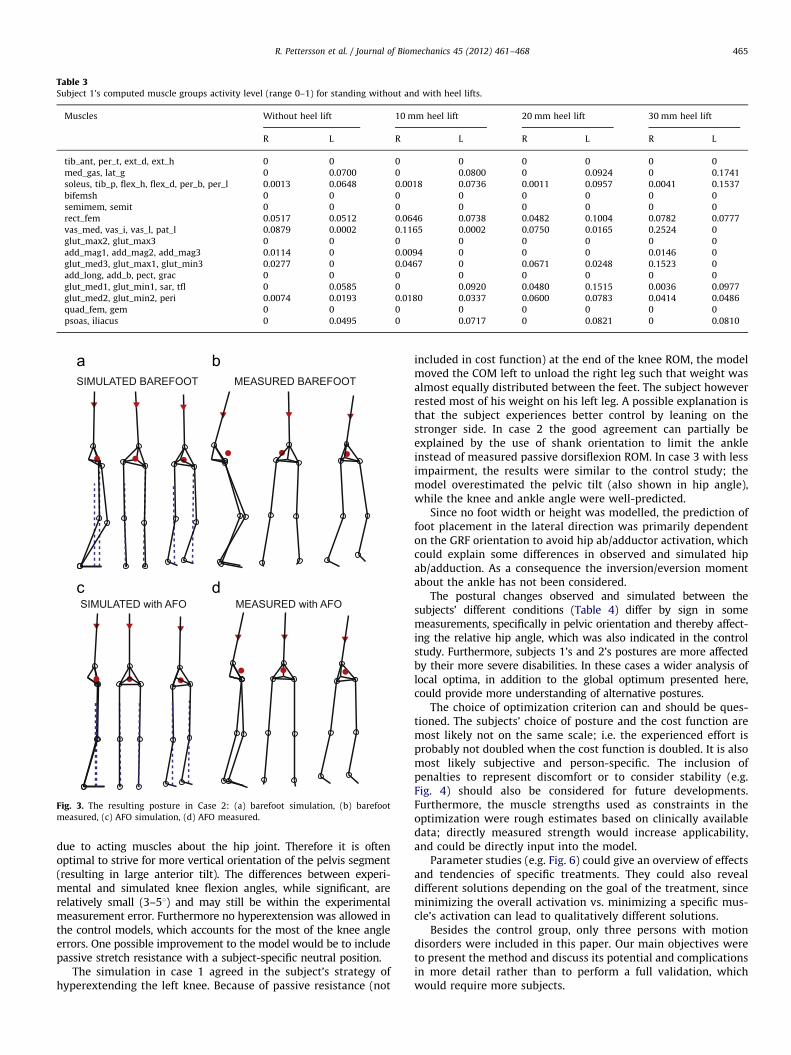
Table 3Subject 1’s computed muscle groups activity level (range 0–1) for standing without and with heel lifts.
Muscles Without heel lift 10 mm heel lift 20 mm heel lift 30 mm heel lift
R L R L R L R L
tib_ant, per_t, ext_d, ext_h 0 0 0 0 0 0 0 0
med_gas, lat_g 0 0.0700 0 0.0800 0 0.0924 0 0.1741
soleus, tib_p, flex_h, flex_d, per_b, per_l 0.0013 0.0648 0.0018 0.0736 0.0011 0.0957 0.0041 0.1537
bifemsh 0 0 0 0 0 0 0 0
semimem, semit 0 0 0 0 0 0 0 0
rect_fem 0.0517 0.0512 0.0646 0.0738 0.0482 0.1004 0.0782 0.0777
vas_med, vas_i, vas_l, pat_l 0.0879 0.0002 0.1165 0.0002 0.0750 0.0165 0.2524 0
glut_max2, glut_max3 0 0 0 0 0 0 0 0
add_mag1, add_mag2, add_mag3 0.0114 0 0.0094 0 0 0 0.0146 0
glut_med3, glut_max1, glut_min3 0.0277 0 0.0467 0 0.0671 0.0248 0.1523 0
add_long, add_b, pect, grac 0 0 0 0 0 0 0 0
glut_med1, glut_min1, sar, tfl 0 0.0585 0 0.0920 0.0480 0.1515 0.0036 0.0977
glut_med2, glut_min2, peri 0.0074 0.0193 0.0180 0.0337 0.0600 0.0783 0.0414 0.0486
quad_fem, gem 0 0 0 0 0 0 0 0
psoas, iliacus 0 0.0495 0 0.0717 0 0.0821 0 0.0810
MEASURED BAREFOOTSIMULATED BAREFOOT
SIMULATED with AFO MEASURED with AFO
Fig. 3. The resulting posture in Case 2: (a) barefoot simulation, (b) barefoot
measured, (c) AFO simulation, (d) AFO measured.
R. Pettersson et al. / Journal of Biomechanics 45 (2012) 461–468 465
due to acting muscles about the hip joint. Therefore it is oftenoptimal to strive for more vertical orientation of the pelvis segment(resulting in large anterior tilt). The differences between experi-mental and simulated knee flexion angles, while significant, arerelatively small (3–51) and may still be within the experimentalmeasurement error. Furthermore no hyperextension was allowed inthe control models, which accounts for the most of the knee angleerrors. One possible improvement to the model would be to includepassive stretch resistance with a subject-specific neutral position.
The simulation in case 1 agreed in the subject’s strategy ofhyperextending the left knee. Because of passive resistance (not
included in cost function) at the end of the knee ROM, the modelmoved the COM left to unload the right leg such that weight wasalmost equally distributed between the feet. The subject howeverrested most of his weight on his left leg. A possible explanation isthat the subject experiences better control by leaning on thestronger side. In case 2 the good agreement can partially beexplained by the use of shank orientation to limit the ankleinstead of measured passive dorsiflexion ROM. In case 3 with lessimpairment, the results were similar to the control study; themodel overestimated the pelvic tilt (also shown in hip angle),while the knee and ankle angle were well-predicted.
Since no foot width or height was modelled, the prediction offoot placement in the lateral direction was primarily dependenton the GRF orientation to avoid hip ab/adductor activation, whichcould explain some differences in observed and simulated hipab/adduction. As a consequence the inversion/eversion momentabout the ankle has not been considered.
The postural changes observed and simulated between thesubjects’ different conditions (Table 4) differ by sign in somemeasurements, specifically in pelvic orientation and thereby affect-ing the relative hip angle, which was also indicated in the controlstudy. Furthermore, subjects 1’s and 2’s postures are more affectedby their more severe disabilities. In these cases a wider analysis oflocal optima, in addition to the global optimum presented here,could provide more understanding of alternative postures.
The choice of optimization criterion can and should be ques-tioned. The subjects’ choice of posture and the cost function aremost likely not on the same scale; i.e. the experienced effort isprobably not doubled when the cost function is doubled. It is alsomost likely subjective and person-specific. The inclusion ofpenalties to represent discomfort or to consider stability (e.g.Fig. 4) should also be considered for future developments.Furthermore, the muscle strengths used as constraints in theoptimization were rough estimates based on clinically availabledata; directly measured strength would increase applicability,and could be directly input into the model.
Parameter studies (e.g. Fig. 6) could give an overview of effectsand tendencies of specific treatments. They could also revealdifferent solutions depending on the goal of the treatment, sinceminimizing the overall activation vs. minimizing a specific mus-cle’s activation can lead to qualitatively different solutions.
Besides the control group, only three persons with motiondisorders were included in this paper. Our main objectives wereto present the method and discuss its potential and complicationsin more detail rather than to perform a full validation, whichwould require more subjects.
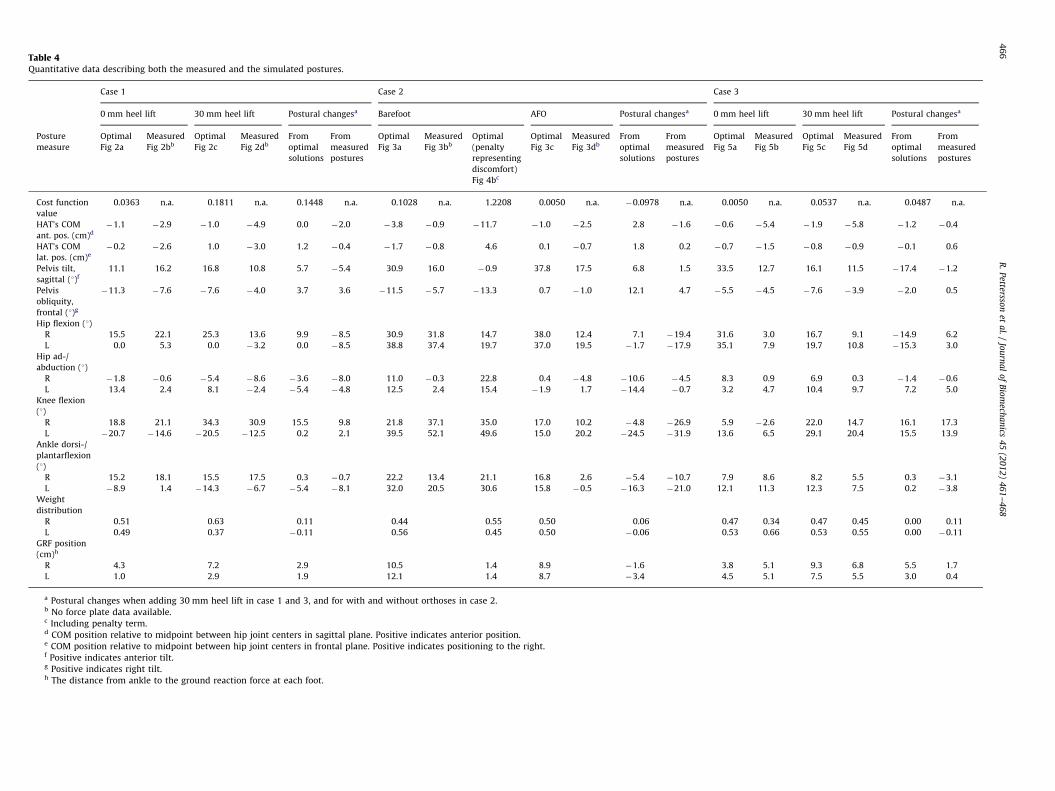
Table 4Quantitative data describing both the measured and the simulated postures.
Case 1 Case 2 Case 3
0 mm heel lift 30 mm heel lift Postural changesa Barefoot AFO Postural changesa 0 mm heel lift 30 mm heel lift Postural changesa
Posture
measure
Optimal
Fig 2a
Measured
Fig 2bb
Optimal
Fig 2c
Measured
Fig 2db
From
optimal
solutions
From
measured
postures
Optimal
Fig 3a
Measured
Fig 3bb
Optimal
(penalty
representing
discomfort)
Fig 4bc
Optimal
Fig 3c
Measured
Fig 3db
From
optimal
solutions
From
measured
postures
Optimal
Fig 5a
Measured
Fig 5b
Optimal
Fig 5c
Measured
Fig 5d
From
optimal
solutions
From
measured
postures
Cost function
value
0.0363 n.a. 0.1811 n.a. 0.1448 n.a. 0.1028 n.a. 1.2208 0.0050 n.a. �0.0978 n.a. 0.0050 n.a. 0.0537 n.a. 0.0487 n.a.
HAT’s COM
ant. pos. (cm)d
�1.1 �2.9 �1.0 �4.9 0.0 �2.0 �3.8 �0.9 �11.7 �1.0 �2.5 2.8 �1.6 �0.6 �5.4 �1.9 �5.8 �1.2 �0.4
HAT’s COM
lat. pos. (cm)e
�0.2 �2.6 1.0 �3.0 1.2 �0.4 �1.7 �0.8 4.6 0.1 �0.7 1.8 0.2 �0.7 �1.5 �0.8 �0.9 �0.1 0.6
Pelvis tilt,
sagittal (1)f
11.1 16.2 16.8 10.8 5.7 �5.4 30.9 16.0 �0.9 37.8 17.5 6.8 1.5 33.5 12.7 16.1 11.5 �17.4 �1.2
Pelvis
obliquity,
frontal (1)g
�11.3 �7.6 �7.6 �4.0 3.7 3.6 �11.5 �5.7 �13.3 0.7 �1.0 12.1 4.7 �5.5 �4.5 �7.6 �3.9 �2.0 0.5
Hip flexion (1)
R 15.5 22.1 25.3 13.6 9.9 �8.5 30.9 31.8 14.7 38.0 12.4 7.1 �19.4 31.6 3.0 16.7 9.1 �14.9 6.2
L 0.0 5.3 0.0 �3.2 0.0 �8.5 38.8 37.4 19.7 37.0 19.5 �1.7 �17.9 35.1 7.9 19.7 10.8 �15.3 3.0
Hip ad-/
abduction (1)
R �1.8 �0.6 �5.4 �8.6 �3.6 �8.0 11.0 �0.3 22.8 0.4 �4.8 �10.6 �4.5 8.3 0.9 6.9 0.3 �1.4 �0.6
L 13.4 2.4 8.1 �2.4 �5.4 �4.8 12.5 2.4 15.4 �1.9 1.7 �14.4 �0.7 3.2 4.7 10.4 9.7 7.2 5.0
Knee flexion
(1)
R 18.8 21.1 34.3 30.9 15.5 9.8 21.8 37.1 35.0 17.0 10.2 �4.8 �26.9 5.9 �2.6 22.0 14.7 16.1 17.3
L �20.7 �14.6 �20.5 �12.5 0.2 2.1 39.5 52.1 49.6 15.0 20.2 �24.5 �31.9 13.6 6.5 29.1 20.4 15.5 13.9
Ankle dorsi-/
plantarflexion
(1)
R 15.2 18.1 15.5 17.5 0.3 �0.7 22.2 13.4 21.1 16.8 2.6 �5.4 �10.7 7.9 8.6 8.2 5.5 0.3 �3.1
L �8.9 1.4 �14.3 �6.7 �5.4 �8.1 32.0 20.5 30.6 15.8 �0.5 �16.3 �21.0 12.1 11.3 12.3 7.5 0.2 �3.8
Weight
distribution
R 0.51 0.63 0.11 0.44 0.55 0.50 0.06 0.47 0.34 0.47 0.45 0.00 0.11
L 0.49 0.37 �0.11 0.56 0.45 0.50 �0.06 0.53 0.66 0.53 0.55 0.00 �0.11
GRF position
(cm)h
R 4.3 7.2 2.9 10.5 1.4 8.9 �1.6 3.8 5.1 9.3 6.8 5.5 1.7
L 1.0 2.9 1.9 12.1 1.4 8.7 �3.4 4.5 5.1 7.5 5.5 3.0 0.4
a Postural changes when adding 30 mm heel lift in case 1 and 3, and for with and without orthoses in case 2.b No force plate data available.c Including penalty term.d COM position relative to midpoint between hip joint centers in sagittal plane. Positive indicates anterior position.e COM position relative to midpoint between hip joint centers in frontal plane. Positive indicates positioning to the right.f Positive indicates anterior tilt.g Positive indicates right tilt.h The distance from ankle to the ground reaction force at each foot.
R.
Pettersso
net
al.
/Jo
urn
al
of
Bio
mech
an
ics4
5(2
01
2)
46
1–
46
84
66

SIMULATED, GRFunconstrained
SIMULATED,PENALTY included
Fig. 4. Simulation of subject 2. (a) Posture when not considering the stability of
the solution, i.e. allow the GRF to be placed under the ankle joint. (b) Posture when
considering discomfort.
SIM
SIM with HEEL LIFT MEASURED with HEEL LIFT
MEASURED
Fig. 5. The resulting posture in Case 3: (a) without heel lift simulation, (b) without
heel lift measured, (c) 30 mm heel lift simulation, (d) 30 mm heel lift measured.
510
1520
25
510
1520
250
0.5
1
1.5
2
2.5
Cos
t fun
ctio
n, s
quar
e ro
ot v
alue
510
1520
25
510
1520
250
5
10
15
20
25
30
Mom
ent [
Nm
]
510
1520
25
510
1520
250
0.1
0.2
0.3
0.4
0.5
Act
ivat
ion
leve
l
Right AFO angle [°]
Right AFO angle [°]
Right AFO angle [°] Left AFO angle [°]
Left AFO angle [°]
Left AFO angle [°]
Fig. 6. Results of parameter study with varying AFO-neutral angles of the right
and left sides separately. The figures show (a) the square root of the resulting cost
function value (purpose: to clarify the variations with low value), (b) required left
knee moment, (c) activation level of left leg rectus femoris.
R. Pettersson et al. / Journal of Biomechanics 45 (2012) 461–468 467
The presented model can be valuable in the early stage ofprescription or investigation of possible orthopeadic treatmentsto improve static posture strategy. The promising results withsubject-specific simulations, some even rather severely affectedby their disabilities, also demonstrates the model’s applicability,especially the model’s ability to predict postural changes due tocommon orthopeadic interventions. Probably the most compar-able study to ours is that of Amankwah et al. (2006). However,unlike theirs, the present model can be tailored to suit a widevariety of biomechanical constraints, and allows comparison toreal subjects; our simulations can be performed without theartificial posture constraints such as fixed stance width orenforced symmetry applied in the referred study. Also, the
present model applied minimization of muscle activations,instead of joint moments followed by a separate optimizationfor load-sharing, making the actual posture strategy based on thesubject’s individual muscle groups’ capabilities.
5. Conclusions
A model for studying posture strategies has been created andits design and potential have been explored. Moments or

R. Pettersson et al. / Journal of Biomechanics 45 (2012) 461–468468
activation of separate muscle groups can be studied in combina-tion with varying subject properties. The model suggests posturesbased on lower extremity contractures, weaknesses, heel lifts,orthoses and anthropometry for each specific case. Input data wasscaled according to reported pediatric anthropometry and eachindividual’s physical assessment. The simulation was able tosuccessfully predict postural changes due to heel elevation in acontrol group. We also found good qualitative agreement withcaptured data among the persons with movement disorders, butfurther investigation of the cost function, and more detailedanthropometric descriptions are required for more biofidelity.We are optimistic that the method has potential to providemechanical theory in clinical treatment decision-making.
Conflict of interest statement
There are no conflicts of interest present in the work.
Acknowledgements
The authors gratefully acknowledge the main financial supportfrom the Swedish Research Council. The financial supportfrom Skobranchens fond is also acknowledged. We thank alsoMarie Eriksson, CPO and Eva Brostrom, PhD, PT for their partici-pation in data collection.
Appendix A. Supplementary data
Supplementary data associated with this article can be foundin the online version at doi:10.1016/j.jbiomech.2011.11.053.
References
Aitkens, S., Lord, J., Bernauer, E., Fowler Jr., W.M., Lieberman, J.S., Berck, P., 1989.Relationship of manual muscle testing to objective strength measurements.Muscle and Nerve 12 (3), 173–177.
Amankwah, K., Triolo, R., Kirsch, R., Audu, M., 2006. A model-based study ofpassive joint properties on muscle effort during static stance. Journal ofBiomechanics 39, 2253–2263.
Bartonek, A., Gutierrez-Farewik, E.M., Haglund-Akerlind, Y., Saraste, H., 2005. Theinfluence of spasticity in the lower limb muscles on gait pattern in childrenwith sacral to mid-lumbar myelomenigocele: a gait analysis study. Gait &Posture 22, 10–15.
Beckung, E., 2002. Sjukgymnastik for barn och ungdom. Studentlitteratur.Bjornson, K., Hays, R., Graubert, C., Price, R., Won, F., McLaughlin, J.F., Cohen, M.,
2007. Botulinum toxin for spasticity in children with cerebral palsy: acomprehensive evaluation. Pediatrics 120 (July), 49–58.
Delp, S., Loan, J., Hoy, M., Zajac, F., Topp, E., Rosen, J., 1990. An interactive graphics-based model of the lower extremity to study orthopaedic surgical procedures.IEEE Transactions on Biomedical Engineering 37 (8), 757–767.
Eek, M.N., Kroksmark, A.-K., Beckung, E., 2006. Isometric muscle torque in children5 to 15 years of age: normative data. Archives of Physical Medicine andRehabilitation 87 (August), 1091–1099.
Eslami, M., Tanaka, C., Hinse, S., Farahpour, N., Allard, P., 2006. Effect of foot wedgepositions on lower-limb joints, pelvis and trunk angle variability duringsingle-limb stance. The Foot 16, 208–213.
Gilleard, W., Smith, T., 2007. Effect of obesity on posture and hip joint momentsduring a standing task, and trunk forward flexion motion. Journal of Obesity31, 267–271.
Hislop, H., Montgomery, J., 1995. Daniel’s and Worthingham’s Muscle Testing:Techniques of Manual Examination, sixth ed. WB Saunders.
Hof, A., Gazendam, M., Sinke, W., 2005. The condition for dynamic stability. Journalof Biomechanics 38, 1–8.
Jensen, R.K., 1986. Body segment mass, radius and radius of gyration proportionsof children. Journal of Biomechanics 19 (5), 359–368.
Jensen, R.K., 1989. Changes in segment inertia proportions between 4 and 20years. Journal of Biomechanics 22 (6/7), 529–536.
Kuo, A.D., Zajac, F.E., 1993. A biomechanical analysis of muscle strength as alimiting factor in standing posture. Journal of Biomechanics 26, 137–150.
Michael, P., Barnes, G.R.J., 2008. Upper Motor Neurone Syndrome and Spasticity:Clinical Management and Neurophysiology, second ed. Cambridge UniversityPress.
Morse, C.I., Tolfrey, K., Thom, J.M., Vassilopoulos, V., Maganaris, C.N., Narici, M.V.,2008. Gastrocnemius muscle specific force in boys and men. Journal of AppliedPhysiology 104 (2), 469–474.
Nicolopoulos, C., Scott, B., Giannoudis, P., 2000. Biomechanical basis of footorthotic prescription. Current Orthopaedics 14, 464–469.
O’Brien, T.D., Reeves, N.D., Baltzopoulos, V., Jones, D.A., Maganaris, C.N., 2009.Moment arms of the knee extensor mechanism in children and adults. Journalof Anatomy 215, 198–205.
Owen, E., 2004. Tuning of ankle–foot orthosis footwear combinations for childrenwith cerebral palsy, spina bifida and other conditions. In: Proceedings ofEuropean Society of Movement Analysis in Adults and Children (ESMAC)Seminars 2004.
Rodriguez, G.M., Aruin, A.S., 2002. The effect of shoe wedges and lifts on symmetryof stance and weight bearing in hemiparetic individuals. Archives of PhysicalMedicine and Rehabilitation 83, 478–482.
Rybski, M., 2004. Kinesiology for Occupational Therapy. Slack Incorporated.