![Diverse coordination of two ligands in ferromagnetic [Cu(μ-HCO2)2(3-pyOH)]n and [Cu2(μ-HCO2)2(μ-3-pyOH)2(3-pyOH)2(HCO2)2]n](https://static.fdokumen.com/doc/165x107/634161422ac0ffbf8a091276/diverse-coordination-of-two-ligands-in-ferromagnetic-cum-hco223-pyohn-and.jpg)
Spectroscopic and Computational Studies of (μ-Oxo)(μ-1,2-peroxo)diiron(III) Complexes of Relevance...
27
Spectroscopic and Computational Studies of (μ-Oxo)(μ-1,2- peroxo)diiron(III) Complexes of Relevance to Nonheme Diiron Oxygenase Intermediates Adam T. Fiedler # , Xiaopeng Shan # , Mark P. Mehn # , József Kaizer # , Stéphane Torelli # , Jonathan R. Frisch # , Masahito Kodera ‡ , and Lawrence Que Jr. # # Department of Chemistry and Center for Metals in Biocatalysis, 207 Pleasant St. S.E., University of Minnesota, Minneapolis, Minnesota 55455, U.S.A. ‡ Department of Molecular Science and Technology, Doshisha University, Tatara Miyakotani 1-3, Kyotanabe 610-0321, JAPAN Abstract With the goal of gaining insight into the structures of peroxo intermediates observed for oxygen activating nonheme diiron enzymes, a series of metastable synthetic diiron(III)-peroxo complexes with [Fe III 2 (μ-O)(μ-1,2-O 2 )] cores has been characterized by X-ray absorption and resonance Raman spectroscopy. EXAFS analysis shows that this basic core structure gives rise to an Fe-Fe distance of ~3.15 Å; the distance is decreased by 0.1 Å upon introduction of an additional carboxylate bridge. In corresponding resonance Raman studies, vibrations arising from both the Fe-O-Fe and the Fe-O- O-Fe units can be observed. A change in the Fe-Fe distance affects the ν(O-O) mode, as well as the ν sym (Fe-O-Fe) and the ν asym (Fe-O-Fe) modes. Indeed a linear correlation can be discerned between the ν(O-O) frequency of a complex and its Fe-Fe distance among the subset of complexes with [Fe III 2 (μ-OR)(μ-1,2-O 2 )] cores (R = H, alkyl, aryl, or no substituent). These experimental studies are complemented by a normal coordinate analysis and DFT calculations. Introduction Nonheme diiron centers have been found in the active sites of a number of metalloenzymes involved in oxygen activation. 1,2 These enzymes have diverse and essential biological functions such as the hydroxylation of methane in methane monooxygenase (MMO) and of toluene in toluene 4-monooxygenase, the generation of the catalytically essential Tyr radical in Class I ribonucleotide reductases (RNR), and the desaturation of saturated fatty acids in fatty acid desaturases. In the course of oxygen activation, O 2 binds to the diiron(II) center to form a peroxodiiron(III) intermediate, which in turn undergoes O-O bond cleavage to form high- valent intermediates, such as the diiron(IV) intermediate Q of MMO 3–5 and the diiron(III,IV) intermediate X of RNR. 6,7 Of great interest is the nature of the diiron(III)-peroxo intermediates generated by these enzymes, which to date has not been established. These intermediates have been found to exhibit a range of ν(O-O) frequencies (898 cm −1 for stearoyl-acyl carrier protein Δ 9 -desaturase, 8 870 cm −1 for RNR W48F/D84E-R2, 9 and 851 cm −1 for frog ferritin 10 ). Developing a rationale for the different frequencies would be helpful in deducing the structures of the corresponding intermediates. Biomimetic complexes can contribute significantly to our understanding of such transient species. Indeed there are now five reported crystal structures of (μ-peroxo)diiron(III) complexes, all with 1,2-peroxo bridges. 11–14 In these structures, the Fe-O-O-Fe units are supported by additional bridging ligands such as oxo, hydroxo, alkoxo, and/or carboxylato bridges. This study focuses on complexes with the (μ-oxo)(μ-1,2-peroxo)diiron(III) core, some NIH Public Access Author Manuscript J Phys Chem A. Author manuscript; available in PMC 2009 December 18. Published in final edited form as: J Phys Chem A. 2008 December 18; 112(50): 13037–13044. doi:10.1021/jp8038225. NIH-PA Author Manuscript NIH-PA Author Manuscript NIH-PA Author Manuscript
-
Upload
uni-pannon -
Category
Documents
-
view
3 -
download
0
Transcript of Spectroscopic and Computational Studies of (μ-Oxo)(μ-1,2-peroxo)diiron(III) Complexes of Relevance...

Spectroscopic and Computational Studies of (µ-Oxo)(µ-1,2-peroxo)diiron(III) Complexes of Relevance to Nonheme DiironOxygenase Intermediates
Adam T. Fiedler#, Xiaopeng Shan#, Mark P. Mehn#, József Kaizer#, Stéphane Torelli#,Jonathan R. Frisch#, Masahito Kodera‡, and Lawrence Que Jr.##Department of Chemistry and Center for Metals in Biocatalysis, 207 Pleasant St. S.E., Universityof Minnesota, Minneapolis, Minnesota 55455, U.S.A.‡Department of Molecular Science and Technology, Doshisha University, Tatara Miyakotani 1-3,Kyotanabe 610-0321, JAPAN
AbstractWith the goal of gaining insight into the structures of peroxo intermediates observed for oxygenactivating nonheme diiron enzymes, a series of metastable synthetic diiron(III)-peroxo complexeswith [FeIII
2(µ-O)(µ-1,2-O2)] cores has been characterized by X-ray absorption and resonance Ramanspectroscopy. EXAFS analysis shows that this basic core structure gives rise to an Fe-Fe distance of~3.15 Å; the distance is decreased by 0.1 Å upon introduction of an additional carboxylate bridge.In corresponding resonance Raman studies, vibrations arising from both the Fe-O-Fe and the Fe-O-O-Fe units can be observed. A change in the Fe-Fe distance affects the ν(O-O) mode, as well as theνsym(Fe-O-Fe) and the νasym(Fe-O-Fe) modes. Indeed a linear correlation can be discerned betweenthe ν(O-O) frequency of a complex and its Fe-Fe distance among the subset of complexes with[FeIII
2(µ-OR)(µ-1,2-O2)] cores (R = H, alkyl, aryl, or no substituent). These experimental studiesare complemented by a normal coordinate analysis and DFT calculations.
IntroductionNonheme diiron centers have been found in the active sites of a number of metalloenzymesinvolved in oxygen activation.1,2 These enzymes have diverse and essential biologicalfunctions such as the hydroxylation of methane in methane monooxygenase (MMO) and oftoluene in toluene 4-monooxygenase, the generation of the catalytically essential Tyr radicalin Class I ribonucleotide reductases (RNR), and the desaturation of saturated fatty acids in fattyacid desaturases. In the course of oxygen activation, O2 binds to the diiron(II) center to forma peroxodiiron(III) intermediate, which in turn undergoes O-O bond cleavage to form high-valent intermediates, such as the diiron(IV) intermediate Q of MMO3–5 and the diiron(III,IV)intermediate X of RNR.6,7 Of great interest is the nature of the diiron(III)-peroxo intermediatesgenerated by these enzymes, which to date has not been established. These intermediates havebeen found to exhibit a range of ν(O-O) frequencies (898 cm−1 for stearoyl-acyl carrier proteinΔ9-desaturase,8 870 cm−1 for RNR W48F/D84E-R2,9 and 851 cm−1 for frog ferritin10).Developing a rationale for the different frequencies would be helpful in deducing the structuresof the corresponding intermediates.
Biomimetic complexes can contribute significantly to our understanding of such transientspecies. Indeed there are now five reported crystal structures of (µ-peroxo)diiron(III)complexes, all with 1,2-peroxo bridges.11–14 In these structures, the Fe-O-O-Fe units aresupported by additional bridging ligands such as oxo, hydroxo, alkoxo, and/or carboxylatobridges. This study focuses on complexes with the (µ-oxo)(µ-1,2-peroxo)diiron(III) core, some
NIH Public AccessAuthor ManuscriptJ Phys Chem A. Author manuscript; available in PMC 2009 December 18.
Published in final edited form as:J Phys Chem A. 2008 December 18; 112(50): 13037–13044. doi:10.1021/jp8038225.
NIH
-PA Author Manuscript
NIH
-PA Author Manuscript
NIH
-PA Author Manuscript

of which have been reported to exhibit the lowest O-O frequencies among the diiron(III)-peroxo complexes thus far.15–17 In this paper several complexes with the (µ-oxo)(µ-1,2-peroxo)diiron(III) core are investigated in detail by resonance Raman and X-ray absorptionspectroscopies. Density-functional theory (DFT) calculations are used to aid in theinterpretation of the spectroscopic data.
Experimental SectionSyntheses
Commercially available chemicals were purchased and used without further purification. Thediiron(III) complexes, [FeIII
2(O)(OH)(BQPA)2](OTf)3, [FeIII2(O)(OH)(6-Me3-TPA)2]
(OTf)3 and [FeIII2(O)(AcO)2(BPPE)](ClO4)2, were synthesized according to published
methods17–19 (see Scheme 1 for ligand structures). Elemental analyses were performed atAtlantic Microlab, Inc. (Norcross, GA). Caution: Perchlorate salts are potentially explosiveand should be handled with care!
Bis(2-quinolylmethyl)-6-methylpyridyl-2-methylamine. (6-Me-BQPA)To a solution of 2-cholromethylquinoline hydrochloride (3.5 g, 15.25 mmol) in MeCN (200mL) at 0 °C was added Na2CO3 (9.6 g, 92 mmol); this mixture was then heated up to 82 °Cand stirred for 30 min, 2-aminomethyl-6-methylpyridine (0.9 g, 7.62 mmol) was added andthe resulting mixture was refluxed. After 3 days, the mixture was cooled to room temperatureand filtered to remove solid. The filtrate was evaporated to dryness under vacuum, and thecrude solid was recrystallized from hexane/ether (80/20) to obtain a pale yellow powder (85%). 1H NMR (CDCl3): δ (ppm) 8.12 (d, 2H), 8.05 (d, 2H), 7.74 (m, 8H), 7.5 (m, 2H), 7.01 (d,1H), 4.12 (s, 4H), 2.52 (s, 4H).
[FeIII2(O)(OH)(6-Me-BQPA)2](OTf)3To a solution of bis(2-quinolylmethyl)-6-methylpyridyl-2-methylamine (0.405 g, 1 mmol) andFe(MeCN)2(OTf)2 (0.436 g, 1 mmol) in dry MeCN (5 mL) at −40 °C was added tert-butylhydroperoxide in nonane (0.22 mL, 1 mmol). After the color of the solution changed to darkred, this mixture was warmed up slowly to room temperature and 20 mL dry THF was layeredabove the solution. After two days, red crystals were deposited out in about 60% yield. Anal.Calcd for [FeIII
2(O)(OH)(6-Me-BQPA)2](OTf)3·H2O or C57H51F9Fe2N8O12S3 (Found): C,48.25 (48.00); H, 3.62 (3.75); F, 12.05 (12.09); N, 7.90 (7.72); S, 6.78 (6.58).
Preparation of FeIII2(O)(O2) intermediatesFor the generation of intermediates 1, 2, and 3, a MeCN solution of the FeIII
2(µ-O)(µ-OH)(L)2 precursor was treated with 1 equiv triethylamine at −40 °C to generate the correspondingFeIII
2(µ-O)2 complex. To this solution was added 10 equiv H2O2 to produce the FeIII2(µ-O)
(µ-1,2-O2)(L)2 intermediate (1, L = 6-Me-BQPA; 2, L = BQPA; 3, L = 6-Me3-TPA).Intermediate 4 was obtained by the reaction of its diiron(III) precursor [FeIII
2(O)(OAc)2(BPPE)]2+ with 2 equiv triethylamine and 10 equiv H2O2 in MeCN at −40 °C.Conversions of diiron(III) precursors to corresponding peroxo intermediates were estimatedto be >90% on the basis of extinction coefficients previously reported for 2,16 3,15 and 4.17
Physical methods1H NMR spectra were recorded on a Varian Unity 300 spectrometer at ambient temperature.Chemical shifts (in ppm) were referenced to the residual protonic solvent peaks. UV-vis spectrawere recorded on a Hewlett-Packard 8453 diode array spectrophotometer. Resonance Ramanspectra were collected on an ACTON AM-506M3 monochromator with a Princeton LN/CCDdata collection system using Spectra-Physics models 2060 krypton ion and 2030-15 argon ion
Fiedler et al. Page 2
J Phys Chem A. Author manuscript; available in PMC 2009 December 18.
NIH
-PA Author Manuscript
NIH
-PA Author Manuscript
NIH
-PA Author Manuscript

lasers. Low-temperature spectra of peroxo intermediates in CH3CN were obtained at 77 Kusing a 135° backscattering geometry. Samples were frozen onto a gold-plated copper coldfinger in thermal contact with a dewar containing liquid nitrogen. Raman frequencies werereferenced to the features of indene. Slits were set for a band-pass of 4 cm−1 for all spectra.
XAS data collectionXAS data were collected on beamline X9B at the National Synchrotron Light Source (NSLS)of Brookhaven National Laboratory (BNL). Fe K-edge X-ray absorption spectra were recordedon frozen solutions at around 16 K over the energy range 6.9–8.0 keV as previously described.20–22 The storage ring condition was: 2.8 GeV, 100–300 mA. The beam vertical aperture ofthe pre-monochromator slits was 1 mm. Contamination of higher harmonics radiation wasminimized by utilizing a harmonic rejection. The horizontal spot size of the beam on the samplewas 4–6 mm. Spectra were measured with 10 eV steps below the edge, 0.3 eV steps in the edgeregion, and steps equivalent to 0.05 Å−1 increments above the edge (region borders were 6932,7102, and 7137 eV). An iron foil spectrum was concomitantly recorded for internal energycalibration, and the first inflection point of the K-edge energy was calibrated to 7112.0 eV.The data were recorded in fluorescence excitation mode (Aexp = (Cf/C0)) using a solid state 13element Ge detector.
Data analysisStandard procedures were used to analyze the XAS data. The pre-edge background intensitywas eliminated by fitting a Gaussian function to the background and a three-segment splinewith fourth-order polynomial components was used to remove low-frequency background.23
The resulting spectra were then treated with SSExafs20,24 in order to obtain near-edge XAS(XANES) parameters. The edge was modeled as an integral of a 75% Gaussian and a 25%Lorentzian peak and the heights, positions, and widths (at half height) of the Gaussian pre-edge peaks were refined to fit the data. Pre-edge peak areas are reported as percentage of theFe K-edge height × eV and multiplied by 100.
Analysis of the EXAFS data was performed using the program EXAFSPAK.25 EXAFSrefinement was carried out on k3χ(k) data, using the phase and amplitude functions obtainedfrom FEFF.26 EXAFS data fittings were performed using the back-transformation rangesprovided in Table 2. For each fit, the parameters r and σ2 were optimized, while n was keptfixed. n was then systematically varied in integer steps. The goodness of fit (GOF) wasdetermined using the formula: GOF = Σ (χcalc − χexp)2 / N, where N is the number of datapoints. The threshold energy (E0) was also varied, although it was maintained at a commonvalue for all shells.
DFT CalculationsGeometry optimizations of [FeIII
2(µ-O)(µ-1,2-O2)(6-Me3-TPA)2]2+ were performed with theAmsterdam Density Functional (ADF) 2004.01 software package27–29 on a cluster of 10processors (Ace computers) using ADF basis set IV (triple-ζ with single polarization on theligand atoms), an integration constant of 4.0, and the Vosko-Wilk-Nusair local densityapproximation30 with the nonlocal gradient corrections of Becke31 and Perdew.32
Antiferromagnetic coupling between the two Fe(III) centers was incorporated into the DFTcalculations with the construction of broken-symmetry (BS) wavefunctions,33–35 in which thespin-up (α) and spin-down (β) electrons were localized on Fe1 and Fe2, respectively. Althoughthe BS state is not a pure spin state (its wavefunction is an eigenfunction of Ms, not S2),Noodleman and coworkers have demonstrated that this approach reasonably approximates theantiferromagnetic ground state and provides accurate geometries.36 The Cartesian coordinatesfor the DFT geometry-optimized model are available in the Supporting Information (TableS1).
Fiedler et al. Page 3
J Phys Chem A. Author manuscript; available in PMC 2009 December 18.
NIH
-PA Author Manuscript
NIH
-PA Author Manuscript
NIH
-PA Author Manuscript

Normal Coordinate Analysis (NCA)Normal coordinate calculations used a general valence force field,37 and were performed usingthe QCPE program 576 developed by Peterson and McIntosh, which solves the vibrationalsecular equation GFL = λL.38 For complex 1, the large size of the molecule forced us to usea smaller model that included only the [Fe2O3] core. Structural parameters were derived fromDFT geometry optimizations. Given the idealized C2v symmetry of the [Fe2O3] unit, only oneforce constant was used to describe the Fe-Ooxo and Fe-Operoxo stretching motions.Additionally, a small Fe⋯Fe force constant of +0.50 mdyn/Å was included to model thenonbonded interaction between the two Fe atoms (essentially, this mode accounts for thesymmetric O-Fe-O and Fe-O-Fe bending motions). Five interaction force constants wereincluded to account for kinematic coupling between the stretching motions of the Fe-Ooxo/Fe-Operoxo/O-O bonds, as well as between the these motions and the Fe⋯Fe stretch. Theseparameters were then optimized to fit the experimentally determined frequencies, although theF(Fe⋯Fe) value was fixed. The resulting force constants are summarized in the SupportingInformation (Table S3).
Results and DiscussionFour metastable FeIII
2(µ-O)(µ-1,2-O2) complexes were generated at low temperature from thereaction of diiron(III) precursors with H2O2, as depicted in Scheme 2. Intermediates 1–3 havesupporting tetradentate tripodal ligands, while 4 is supported by a hexadentate dinucleatingligand that provides only three ligands in a facial array per iron (Scheme 1). Thus intermediate4 differs from the other three in having an additional carboxylate bridge that completes thedistorted octahedral coordination sphere about each iron. These complexes exhibit two intensevisible absorption features with maxima near 500 and 650 nm; there is also a much weakernear IR band near 800 nm for 1–3 (Figure 1). These intermediates are further characterized byX-ray absorption and resonance Raman spectroscopies in this study, and detailed analyses arepresented below.
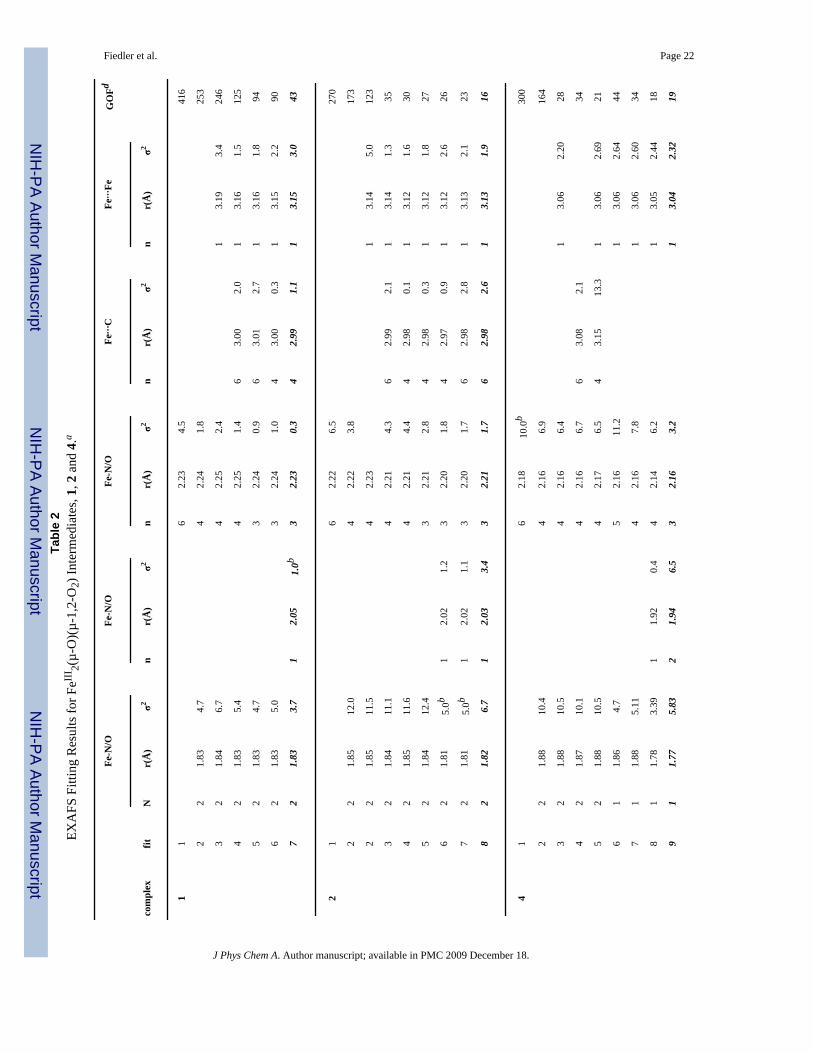
1. XAS studies of FeIII2(O)(O2) intermediatesAs the low thermal stability of the Fe2(O)(O2) intermediates made X-ray crystallographyunfeasible as a method for obtaining structural information, X-ray absorption spectroscopy(XAS) was adopted as an alternative method for structural characterization of these short-livedspecies. X-ray absorption spectra at the Fe K-edge were measured for three Fe2(O)(O2) species1, 2 and 4 (complex 3 was studied previously15) and the resulting XANES and EXAFS dataare presented in Figure 2 and Figure 3, respectively. Figure 2 compares the near-edge regionsof the three complexes, which provides information regarding the oxidation states andcoordination environments of the metal centers. The first inflection point of the rising edgewas assigned as the edge energy (E0) associated with the transition of an electron from the Fe1s orbital to the continuum. The values for 1, 2, and 4 are typical of iron(III) centers (Table 1).The energy of the pre-edge feature (Epreedge), at about 8–10 eV below the edge jump,corresponds to the Fe 1s→3d transitions. Interestingly, the pre-edge transition for 4 is moreintense than those for 1 and 2, indicative of a larger deviation from a centrosymmetric geometryin the case of 4.
The filtered Fe K-edge EXAFS data for complexes 1, 2 and 4, along with the correspondingFourier transforms (FT, R′ space), are shown in Figure 3 (the unfiltered data are shown inFigure S1). All three Fe2(O)(O2) species exhibit first-shell features between r’ = ~1.0 and 2.2Å and one or more prominent second-shell peaks between r’ = 2.5 and 3.1 Å (where r’ is theactual metal-scatterer distance after a phase-shift correction of approximately 0.4 Å). OurEXAFS analysis of 1 revealed that the first coordination sphere consists of two O/N atoms at1.83 Å, three N/O atoms at 2.23 Å, and an intermediate N/O scatterer at 2.05 Å (Table 2). The
Fiedler et al. Page 4
J Phys Chem A. Author manuscript; available in PMC 2009 December 18.
NIH
-PA Author Manuscript
NIH
-PA Author Manuscript
NIH
-PA Author Manuscript

intense second-shell feature at r’ = ~ 2.85 Å is well fit by a single Fe scatterer at 3.15 Å, thusproviding strong evidence that 1 is indeed a dinuclear complex. Proper fitting of the data alsorequired an additional shell of 4–6 C atoms near 3.0 Å, consistent with several earlier EXAFSstudies of Fe complexes with TPA-type ligands.22,39,40
Given the similarity of their supporting ligands, it is not surprising that the bond distancesobtained by EXAFS for 2 are nearly identical those found for 1 (Table 2). Importantly, thebond distances derived for 1 and 2 are quite similar to those found previously for the closelyrelated complex, [FeIII
2(O)(O2)(6-Me3-TPA)2]2+ (3) (Table 2).15 Thus, despite minordifferences, we can conclude that complexes 1–3 generally share the same Fe coordinationenvironments. The two short Fe-ligand bonds at ~1.8 Å are then assigned to the bridging oxoand peroxo groups, while the four remaining first-sphere atoms between 2.02 and 2.23 Å aresupplied by the N4 supporting ligands.
These results are further supported by DFT computations performed on [Fe2(O)(O2)(6-Me3-TPA)2]2+. These calculations assumed antiferromagnetically coupled high-spin Fe(III) centersand a µ-1,2 binding mode for the peroxo ligand. The resulting Fe2(O)(O2) unit is nearly planar,with an average dihedral angle of 2.2°. As shown in Figure 4, the optimized model featuresFe-Ooxo and Fe-Operoxo bonds with nearly equal lengths of ~1.8 Å, in good agreement withthe EXAFS-derived values of 1.81–1.84 Å. Moreover, the calculations point to considerablevariation in the Fe-N bond distances, which is also reflected in the experimental fits. Finally,the computed Fe-Fe distance of 3.17 Å approaches the values of 3.13–3.15 Å foundexperimentally. Thus, our combined EXAFS/DFT approach confirms the formulation ofcomplexes 1–3 as [FeIII
2(µ-O)(µ-1,2-O2)(L)2]2+.
Our EXAFS analysis of 4 shows that this complex deviates somewhat from the patternestablished by 1–3. For instance, it is not necessary to include a carbon shell at ~3 Å, which isoften required for complexes of tetradentate TPA-like ligands. Moreover, fits 8–10 in Table2, which vary with respect to the number of scatterers in each shell of the first coordinationsphere, are equally good, although we favor fit 9 because it corresponds to shells with the mostreasonable set of Debye-Waller (σ2) values. The scatterer at 1.77 Å likely corresponds to thebridging oxo group, while the value of 1.94 Å represents the average of the Fe-Operoxo and Fe-Oacetate bond distances. Importantly, the data require an Fe scatterer at 3.04 Å (Table 2). ThisFe-Fe distance is approximately 0.1 Å shorter than the values found for 1–3, likely reflectingthe presence of the additional carboxylate ligand bridging the Fe(III) centers.41
2. Resonance Raman studies of FeIII2(O)(O2) intermediatesResonance Raman spectroscopy is a very useful tool for probing the vibrations of the Fe2(µ-O)(µ-1,2-O2) core. In this study of 1–4, vibrations are observed that can be associated withboth the Fe-O-Fe and Fe-O-O-Fe substructures. For 1–3, all five possible stretching vibrationalmodes of the Fe2O3 core have been observed and identified by isotope labeling and excitationprofile experiments. The spectra are presented in Figure 5 and Figure 6, with spectra ofcomplexes with Fe-16O-Fe cores shown in black and those with Fe-18O-Fe cores provided inred. The vibrational frequencies are tabulated in Table 3.
The vibrations of the Fe-O-O-Fe unit have been reported previously and consist of three modes:the O-O stretch and symmetric and asymmetric ν(Fe-O2-Fe) deformations. Figure 5 shows theresonance Raman spectra of 1, 2, and 3 obtained with 647.1 nm excitation, in resonance withthe lower energy charge transfer (CT) transition. The O-O stretch is easily identified in the 850cm−1 region, with an 16O2→18O2 shift of 46 cm−1 that is consistent with a Hooke’s Lawcalculation for a diatomic O-O unit. The νsym(Fe-O2-Fe) mode is readily found below 500cm−1 and exhibits an 16O2→18O2 shift of 15–21 cm−1. On the other hand, the νasym(Fe-O2-Fe) mode is found above 500 cm−1 among vibrations of the Fe-O-Fe unit. In the case of 4, only
Fiedler et al. Page 5
J Phys Chem A. Author manuscript; available in PMC 2009 December 18.
NIH
-PA Author Manuscript
NIH
-PA Author Manuscript
NIH
-PA Author Manuscript

the ν(O-O) mode is observed and is found at 830 cm−1, which is about 20 cm−1 lower in energythan those of 1 – 3.45
In contrast to modes involving the peroxo group, vibrations arising from the Fe-O-Fe unit ofFeIII
2(µ-O)(µ-1,2-O2) complexes have not been previously noted. However, we readilyobserved such modes by shifting the laser excitation to higher energies, as shown in Figure 6.The modes were definitively assigned by incorporating 18O into the oxo bridge. For 4, onlyone vibration at 537 cm−1 is observed, which is assigned to the symmetric mode of the Fe-O-Fe unit. On the other hand, for 1 – 3, both νsym(Fe-O-Fe) and νasym(Fe-O-Fe) modes can beidentified. The symmetric modes are found near 500 cm−1 with 16O→18O downshifts of 12–16 cm−1, while the asymmetric modes are found near 700 cm−1 with 16O→18O downshifts of30–32 cm−1 (Table 3, Figure 6). The difference between 4 and the other three peroxo complexescan be ascribed to the symmetry of the Fe-O-Fe unit (Scheme 1). In 4, the two individual Fesites are identical, while those in 1 – 3 are distinct because the oxo bridge is trans to an amineon one Fe and trans to a pyridine on the other Fe. Indeed, our DFT computations of 3 confirmthe asymmetry in the Fe-Ooxo bond lengths (Figure 4). Sanders-Loehr and coworkers havepreviously noted that the νasym(Fe-O-Fe) mode becomes observable in the resonance Ramanspectrum of an Fe-O-Fe complex and increases in intensity as the Fe-O-Fe unit becomes moreasymmetric.46–48 This correlation rationalizes the spectral differences observed for 1 – 4.
Previously, the νsym(Fe-O-Fe) and νasym(Fe-O-Fe) frequencies of (µ-oxo)diiron(III)complexes have been found to reflect the Fe-O-Fe angle.18,49 When the values for 1–4 areinterpreted within this framework, the Fe-O-Fe angles are deduced to be 120° for 1–3 and 110°for 4, consistent with the differences in Fe-Fe distances determined by EXAFS analysis.Moreover, the predicted Fe-O-Fe angles for 1–3 agree nicely with the value of 121° computedby DFT for 3 (Figure 4).
The excitation profiles for the symmetric Fe-O-Fe and O-O stretching modes of complex 3(peaks at 511 and 847 cm−1, respectively) are shown in Figure 7. The corresponding profilesfor 1, 2 and 4 are quite similar (Figure S3). The ν(O-O) mode is strongly enhanced by excitationinto the broad absorption feature at 650 nm, confirming the assignment of this band as aperoxo■ Fe(III) charge transfer transition. Conversely, the peak corresponding to thesymmetric ν(Fe-O-Fe) mode is enhanced at much shorter wavelengths, indicating that theintense peaks in the near-UV region have significant contributions from oxo■ Fe(III) CTtransitions. Thus, our resonance Raman data provide considerable insights into the nature ofthe UV-vis absorption features.
An unexpected feature of our resonance Raman study is the slight sensitivity of the ca. 700cm−1 mode associated with the Fe-O-Fe unit in 1–3 to 18O-labeling of the peroxo ligand (Figure5, Table 3). The 16O2→18O2 downshift of 4 cm−1 in the case of 1 was also observed for thefully labeled Fe2(O)(O2) core generated by using both H2
18O and H218O2. These observations
suggest coupling between modes of the Fe-O-Fe and the Fe-O-O-Fe units. To further probethe vibrational dynamics of the Fe2(O)(O2) core, we performed a normal coordinate analysis(NCA) using the resonance Raman data presented above. In fact, complexes 1–3 provide idealsystems for NCA due to the abundance of isotope-shift data available for all five stretchingmodes of the Fe2(O)(O2) core (Table 3). The normal coordinate analyses described hereinutilized a 5-atom model of the Fe2(O)(O2) core derived from our DFT calculations (videsupra), in which the structural coordinates were symmetrized so as to obtain a molecule withstrict C2v symmetry (for more details see Experimental Section and Table S2). We limited ouranalysis to 1, since vibrational data for the fully-labeled Fe2(18O)(18O2) species were onlyavailable for this complex.
Fiedler et al. Page 6
J Phys Chem A. Author manuscript; available in PMC 2009 December 18.
NIH
-PA Author Manuscript
NIH
-PA Author Manuscript
NIH
-PA Author Manuscript
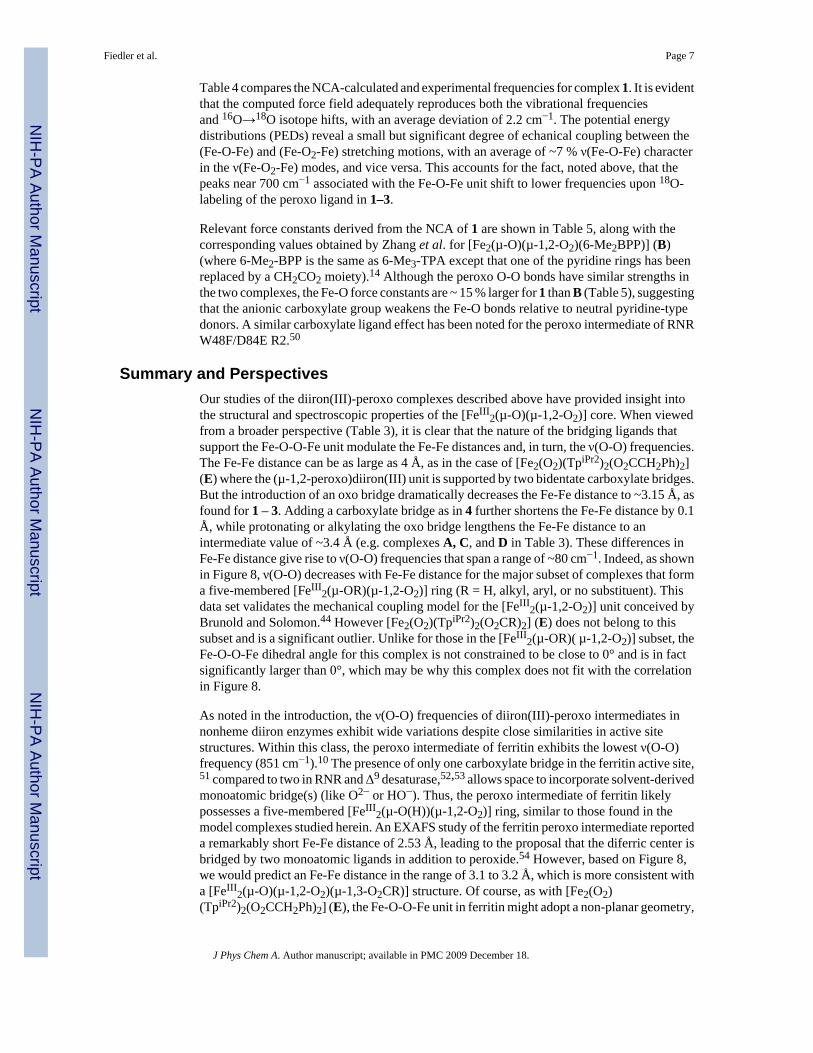
Table 4 compares the NCA-calculated and experimental frequencies for complex 1. It is evidentthat the computed force field adequately reproduces both the vibrational frequenciesand 16O→18O isotope hifts, with an average deviation of 2.2 cm−1. The potential energydistributions (PEDs) reveal a small but significant degree of echanical coupling between the(Fe-O-Fe) and (Fe-O2-Fe) stretching motions, with an average of ~7 % ν(Fe-O-Fe) characterin the ν(Fe-O2-Fe) modes, and vice versa. This accounts for the fact, noted above, that thepeaks near 700 cm−1 associated with the Fe-O-Fe unit shift to lower frequencies upon 18O-labeling of the peroxo ligand in 1–3.
Relevant force constants derived from the NCA of 1 are shown in Table 5, along with thecorresponding values obtained by Zhang et al. for [Fe2(µ-O)(µ-1,2-O2)(6-Me2BPP)] (B)(where 6-Me2-BPP is the same as 6-Me3-TPA except that one of the pyridine rings has beenreplaced by a CH2CO2 moiety).14 Although the peroxo O-O bonds have similar strengths inthe two complexes, the Fe-O force constants are ~ 15 % larger for 1 than B (Table 5), suggestingthat the anionic carboxylate group weakens the Fe-O bonds relative to neutral pyridine-typedonors. A similar carboxylate ligand effect has been noted for the peroxo intermediate of RNRW48F/D84E R2.50
Summary and PerspectivesOur studies of the diiron(III)-peroxo complexes described above have provided insight intothe structural and spectroscopic properties of the [FeIII
2(µ-O)(µ-1,2-O2)] core. When viewedfrom a broader perspective (Table 3), it is clear that the nature of the bridging ligands thatsupport the Fe-O-O-Fe unit modulate the Fe-Fe distances and, in turn, the ν(O-O) frequencies.The Fe-Fe distance can be as large as 4 Å, as in the case of [Fe2(O2)(TpiPr2)2(O2CCH2Ph)2](E) where the (µ-1,2-peroxo)diiron(III) unit is supported by two bidentate carboxylate bridges.But the introduction of an oxo bridge dramatically decreases the Fe-Fe distance to ~3.15 Å, asfound for 1 – 3. Adding a carboxylate bridge as in 4 further shortens the Fe-Fe distance by 0.1Å, while protonating or alkylating the oxo bridge lengthens the Fe-Fe distance to anintermediate value of ~3.4 Å (e.g. complexes A, C, and D in Table 3). These differences inFe-Fe distance give rise to ν(O-O) frequencies that span a range of ~80 cm−1. Indeed, as shownin Figure 8, ν(O-O) decreases with Fe-Fe distance for the major subset of complexes that forma five-membered [FeIII
2(µ-OR)(µ-1,2-O2)] ring (R = H, alkyl, aryl, or no substituent). Thisdata set validates the mechanical coupling model for the [FeIII
2(µ-1,2-O2)] unit conceived byBrunold and Solomon.44 However [Fe2(O2)(TpiPr2)2(O2CR)2] (E) does not belong to thissubset and is a significant outlier. Unlike for those in the [FeIII
2(µ-OR)( µ-1,2-O2)] subset, theFe-O-O-Fe dihedral angle for this complex is not constrained to be close to 0° and is in factsignificantly larger than 0°, which may be why this complex does not fit with the correlationin Figure 8.
As noted in the introduction, the ν(O-O) frequencies of diiron(III)-peroxo intermediates innonheme diiron enzymes exhibit wide variations despite close similarities in active sitestructures. Within this class, the peroxo intermediate of ferritin exhibits the lowest ν(O-O)frequency (851 cm−1).10 The presence of only one carboxylate bridge in the ferritin active site,51 compared to two in RNR and Δ9 desaturase,52,53 allows space to incorporate solvent-derivedmonoatomic bridge(s) (like O2− or HO−). Thus, the peroxo intermediate of ferritin likelypossesses a five-membered [FeIII
2(µ-O(H))(µ-1,2-O2)] ring, similar to those found in themodel complexes studied herein. An EXAFS study of the ferritin peroxo intermediate reporteda remarkably short Fe-Fe distance of 2.53 Å, leading to the proposal that the diferric center isbridged by two monoatomic ligands in addition to peroxide.54 However, based on Figure 8,we would predict an Fe-Fe distance in the range of 3.1 to 3.2 Å, which is more consistent witha [FeIII
2(µ-O)(µ-1,2-O2)(µ-1,3-O2CR)] structure. Of course, as with [Fe2(O2)(TpiPr2)2(O2CCH2Ph)2] (E), the Fe-O-O-Fe unit in ferritin might adopt a non-planar geometry,
Fiedler et al. Page 7
J Phys Chem A. Author manuscript; available in PMC 2009 December 18.
NIH
-PA Author Manuscript
NIH
-PA Author Manuscript
NIH
-PA Author Manuscript

in which case the close connection between Fe-Fe distances and ν(O-O) frequencies may breakdown. Regardless, our results will likely prove useful for interpreting trends in ν(O-O)frequencies among diiron(III)-peroxo intermediates of nonheme diiron enzymes.
Supplementary MaterialRefer to Web version on PubMed Central for supplementary material.
AcknowledgmentThis research was supported by the US National Institutes of Health (grant GM-38767 to L.Q. and postdoctoralfellowship GM-079839 to A.T.F.). XAS data were collected on beamline X9B at the National Synchrotron LightSource (NSLS). NSLS is supported by the U.S. Department of Energy, Office of Science, Office of Basic EnergySciences, under Contract No. DE-AC02-98CH10886. We thank Professor Thomas Brunold of the University ofWisconsin-Madison for graciously providing access to his computer cluster.
References and Notes1. Wallar BJ, Lipscomb JD. Chem. Rev 1996;96:2625–2658. [PubMed: 11848839]2. Merkx M, Kopp DA, Sazinsky MH, Blazyk JL, Müller J, Lippard SJ. Angew. Chem. Int. Ed
2001;40:2782–2807.3. Lee S-K, Fox BG, Froland WA, Lipscomb JD, Münck E. J. Am. Chem. Soc 1993;115:6450–6451.4. Liu KE, Valentine AM, Wang D, Huynh BH, Edmondson DE, Salifoglou A, Lippard SJ. J. Am. Chem.
Soc 1995;117:10174–10185.5. Shu L, Nesheim JC, Kauffmann K, Münck E, Lipscomb JD, Que L Jr. Science 1997;275:515–518.
[PubMed: 8999792]6. Sturgeon BE, Burdi D, Chen S, Huynh B-H, Edmondson DE, Stubbe J, Hoffman BM. J. Am. Chem.
Soc 1996;118:7551–7557.7. Riggs-Gelasco PJ, Shu L, Chen S, Burdi D, Huynh BH, Que L Jr, Stubbe J. J. Am. Chem. Soc
1998;120:849–860.8. Broadwater JA, Ai J, Loehr TM, Sanders-Loehr J, Fox BG. Biochemistry 1998;37:14664–14671.
[PubMed: 9778341]9. Moënne-Loccoz P, Baldwin J, Ley BA, Loehr TM, Bollinger JM Jr. Biochemistry 1998;37:14659–
14663. [PubMed: 9778340]10. Moënne-Loccoz P, Krebs C, Herlihy K, Edmondson DE, Theil EC, Huynh BH, Loehr TM.
Biochemistry 1999;38:5290–5295. [PubMed: 10220314]11. Ookubo T, Sugimoto H, Nagayama T, Masuda H, Sato T, Tanaka K, Maeda Y, Okawa H, Hayashi
Y, Uehara A, Suzuki M. J. Am. Chem. Soc 1996;118:701–702.12. Dong Y, Yan S, Young VG Jr, Que L Jr. Angew. Chem. Int. Ed. Engl 1996;35:618–620.13. Kim K, Lippard SJ. J. Am. Chem. Soc 1996;118:4914–4915.14. Zhang X, Furutachi H, Fujinami S, Nagatomo S, Maeda Y, Watanabe Y, Kitagawa T, Suzuki M. J.
Am. Chem. Soc 2005;127:826–827. [PubMed: 15656607]15. Dong Y, Zang Y, Shu L, Wilkinson EC, Que L Jr, Kauffmann K, Münck E. J. Am. Chem. Soc
1997;119:12683–12684.16. Kryatov SV, Taktak S, Korendovych IV, Rybak-Akimova EV, Kaizer J, Torelli S, Shan X, Mandal
S, MacMurdo V, Mairata i Payeras A, Que L Jr. Inorg. Chem 2005;44:85–99. [PubMed: 15627364]17. Kodera M, Taniike Y, Itoh M, Tanahashi Y, Shimakoshi H, Kano K, Hirota S, Iijima S, Ohba M,
Okawa H. Inorg. Chem 2001;40:4821–4822. [PubMed: 11531426]18. Zheng H, Zang Y, Dong Y, Young VG Jr, Que L Jr. J. Am. Chem. Soc 1999;121:2226–2235.19. Zang Y, Pan G, Que L Jr, Fox BG, Münck E. J. Am. Chem. Soc 1994;116:3653–3654.20. Scarrow RC, Maroney MJ, Palmer SM, Que L Jr, Roe AL, Salowe SP, Stubbe J. J. Am. Chem. Soc
1987;109:7857–7864.21. Shu L, Chiou Y-M, Orville AM, Miller MA, Lipscomb JD, Que L Jr. Biochemistry 1995;34:6649–
6659. [PubMed: 7756296]
Fiedler et al. Page 8
J Phys Chem A. Author manuscript; available in PMC 2009 December 18.
NIH
-PA Author Manuscript
NIH
-PA Author Manuscript
NIH
-PA Author Manuscript

22. Rohde J-U, Torelli S, Shan X, Lim MH, Klinker EJ, Kaizer J, Chen K, Nam W, Que L Jr. J. Am.Chem. Soc 2004;126:16750–16761. [PubMed: 15612713]
23. Klinker EJ, Jackson TA, Jensen MP, Stubna A, Juhász G, Bominaar EL, Münck E, Que L Jr. Angew.Chem. Int. Ed 2006;45:7394–7397.
24. Scarrow RC, Trimitsis MG, Buck CP, Grove GN, Cowling RA, Nelson MJ. Biochemistry1994;33:15023–15035. [PubMed: 7999760]
25. George, GN.; Pickering, IJ. Stanford Synchrotron Radiation Laboratory. Stanford, California:Stanford Linear Accelerator Center; 2000.
26. Rehr JJ, Mustre de Leon J, Zabinsky SI, Albers RC. J. Am. Chem. Soc 1991;113:5135–5140.27. te Velde G, Baerends EJ. J. Comput. Phys 1992;99:84–98.28. Guerra CF, Snijders JG, te Velde G, Baerends EJ. Theor. Chem. Acc 1998;99:391–403.29. ADF2003.01; SCM, Theoretical Chemistry. Amsterdam, The Netherlands: Vrije Universiteit;
http://www.scm.com30. Vosko SH, Wilk L, Nusair M. Can. J. Phys 1980;58:1200.31. Becke AD. J. Chem. Phys 1986;84:4524–4529.32. Perdew JP. Phys. Rev. B 1986;33:8822–8824.33. Noodleman L, Case DA. Adv. Inorg. Chem 1992;38423-+34. Noodleman L, Lovell T, Liu TQ, Himo F, Torres RA. Curr. Opin. Chem. Biol 2002;6:259–273.
[PubMed: 12039013]35. Noodleman L, Peng CY, Case DA, Mouesca JM. Coord. Chem. Rev 1995;144:199–244.36. Torres RA, Lovell T, Noodleman L, Case DA. Journal of the American Chemical Society
2003;125:1923–1936. [PubMed: 12580620]37. Wilson, EB.; Decius, JC.; Cross, PC. Molecular Vibrations; The Theory of Infrared and Raman
Vibration Spectra. London: McGraw-Hill; 1955.38. McIntosh DF, Peterson MR. 198939. Jensen MP, Costas M, Ho RYN, Kaizer J, Mairata i Payeras A, Münck E, Que L Jr, Rohde J-U, Stubna
A. J. Am. Chem. Soc 2005;127:10512–10525. [PubMed: 16045338]40. Rohde J-U, Stubna A, Bominaar EL, Münck E, Nam W, Que L Jr. Inorg. Chem 2006;45:6435–6445.
[PubMed: 16878956]41. A detailed EXAFS analysis was also performed on the unfiltered data of 4. As shown in Table S2,
the resulting structural parameters are almost identical to those obtained with the filtered data.42. Dong Y, Ménage S, Brennan BA, Elgren TE, Jang HG, Pearce LL, Que L Jr. J. Am. Chem. Soc
1993;115:1851–1859.43. Murch BP, Bradley FC, Que L Jr. J. Am. Chem. Soc 1986;108:5027–5028.44. Brunold TC, Tamura N, Kitajima M, Moro-oka Y, Solomon EI. J. Am. Chem. Soc 1998;120:5674–
5690.45. The ν(O-O) of 4 was originally reported to be at 816 cm−1 in ref. #17, but a higher value was found
in our experiments.46. Gómez-Romero P, Witten EH, Reiff WM, Backes G, Sanders-Loehr J, Jameson GB. J. Am. Chem.
Soc 1989:9039–9047.47. Norman RE, Yan S, Que L Jr, Sanders-Loehr J, Backes G, Ling J, Zhang JH, O'Connor CJ. J. Am.
Chem. Soc 1990;112:1554–1562.48. Cohen JD, Payne S, Hagen KS, Sanders-Loehr J. J. Am. Chem. Soc 1997;119:2960–2961.49. Sanders-Loehr J, Wheeler WD, Shiemke AK, Averill BA, Loehr TM. J. Am. Chem. Soc
1989;111:8084–8093.50. Skulan AJ, Brunold TC, Baldwin J, Saleh L, Bollinger JM Jr, Solomon EI. J. Am. Chem. Soc
2004;126:8842–8855. [PubMed: 15250738]51. Ha Y, Shi DS, Small GW, Theil EC, Allewell NM. J. Biol. Inorg. Chem 1999;4:243–256. [PubMed:
10439069]52. Logan DT, Su X-D, Åberg A, Regnström K, Hajdu J, Eklund H, Nordlund P. Structure 1996;4:1053–
1064. [PubMed: 8805591]53. Lindqvist Y, Huang W, Schneider G, Shanklin J. EMBO J 1996;15:4081–4092. [PubMed: 8861937]
Fiedler et al. Page 9
J Phys Chem A. Author manuscript; available in PMC 2009 December 18.
NIH
-PA Author Manuscript
NIH
-PA Author Manuscript
NIH
-PA Author Manuscript

54. Hwang J, Krebs C, Huynh BH, Edmondson DE, Theil EC, Penner-Hahn JE. Science 2000;287:122–125. [PubMed: 10615044]
Fiedler et al. Page 10
J Phys Chem A. Author manuscript; available in PMC 2009 December 18.
NIH
-PA Author Manuscript
NIH
-PA Author Manuscript
NIH
-PA Author Manuscript

Figure 1.Visible spectra of FeIII
2(µ-O)(µ-1,2-O2) intermediates, 1 (—), 2 (---), 3 (⋯), and 4 (-·-)collected in MeCN at −40°C.
Fiedler et al. Page 11
J Phys Chem A. Author manuscript; available in PMC 2009 December 18.
NIH
-PA Author Manuscript
NIH
-PA Author Manuscript
NIH
-PA Author Manuscript

Figure 2.Fe K-edge X-ray absorption near-edge structures (XANES, fluorescence excitation) ofFeIII
2(µ-O)(µ-1,2-O2) intermediates, 1 (—), 2 (---), and 4 (⋯) measured at ~ 17 K.
Fiedler et al. Page 12
J Phys Chem A. Author manuscript; available in PMC 2009 December 18.
NIH
-PA Author Manuscript
NIH
-PA Author Manuscript
NIH
-PA Author Manuscript

Figure 3.Fourier transforms of the Fe K-edge EXAFS data (k3 χ(k)) and Fourier-filtered EXAFS spectra(k3 χ(k), inset) of [FeIII
2(O)(O2)(6-MeBQPA)2]2+ (1, top), [FeIII2(O)(O2)(BQPA)2]2+ (2,
middle) and [FeIII2(O)(O2)(OAc)(BPPE)]+ (4, bottom). Experimental data displayed with
dashed (---) lines and fits with solid (—) lines. Back-transformation range: ~0.5 to 3.3 Å;Fourier transformed range: k = 2.0–14.5 Å−1 (1 and 2) or 2.0–14.0 Å−1 (4). Fit parameters foreach complex are provided in Table 2 in bold and italics.
Fiedler et al. Page 13
J Phys Chem A. Author manuscript; available in PMC 2009 December 18.
NIH
-PA Author Manuscript
NIH
-PA Author Manuscript
NIH
-PA Author Manuscript

Figure 4.Schematic showing metrical parameters computed by DFT for [FeIII
2(O)(O2)(6-Me3-TPA)2]2+ (3). All bond distances in Å. The Fe2(O)(O2) unit is essentially planar (averagedihedral angle = 2.2°). For the Fe-N bond distances, the values have been averaged over thetwo Fe centers. Differences in coordination geometry between the two sites are minor (< 0.03Å). See Table S1 for atomic coordinates.
Fiedler et al. Page 14
J Phys Chem A. Author manuscript; available in PMC 2009 December 18.
NIH
-PA Author Manuscript
NIH
-PA Author Manuscript
NIH
-PA Author Manuscript

Figure 5.Resonance Raman spectra obtained with 647.1-nm excitation of frozen CH3CN solutions of(top) [Fe2(µ-O)(µ-O2)(6-Me-BQPA)2]2+ (1) generated with 2 equiv. of Et3N and 10 equiv. ofH2
16O2 (black) or H218O2 (red); (middle) [Fe2(µ-O)(µ-O2)(BQPA)2]3+ (2) generated with 2
equiv. of Et3N and 10 equiv. of H216O2 (black) or H2
18O2 (red); (bottom) [Fe2(µ-O)(µ-O2)(6-Me3-TPA)2]3+ (3) generated with 2 equiv. of Et3N and 10 equiv. of H2
16O2 (black) orH2
18O2 (red). Frequencies (in cm−1) are provided for [Fe2O3]-based modes, with thecorresponding 16O2→18O2 shifts shown in brackets.
Fiedler et al. Page 15
J Phys Chem A. Author manuscript; available in PMC 2009 December 18.
NIH
-PA Author Manuscript
NIH
-PA Author Manuscript
NIH
-PA Author Manuscript

Figure 6.Resonance Raman spectra of frozen CH3CN solutions of 1 – 3 obtained with 514.5-nmexcitation and for 4 obtained with 457.9-nm excitation. In all cases, the [Fe2(µ-O)(µ-O2)]complexes were prepared with 100 equiv. of H2
16O (black) or H218O (red). Frequencies (in
cm−1) are provided for [Fe2O3]-based modes, with the corresponding 16O→18O shifts shownin brackets.
Fiedler et al. Page 16
J Phys Chem A. Author manuscript; available in PMC 2009 December 18.
NIH
-PA Author Manuscript
NIH
-PA Author Manuscript
NIH
-PA Author Manuscript

Figure 7.Resonance Raman excitation profiles of the νsym(Fe-O-Fe) (–■–) and ν(O-O) (–◆–) vibrationsof 3.
Fiedler et al. Page 17
J Phys Chem A. Author manuscript; available in PMC 2009 December 18.
NIH
-PA Author Manuscript
NIH
-PA Author Manuscript
NIH
-PA Author Manuscript

Figure 8.Plot of O-O stretching frequencies as a function of Fe-Fe distance for 1–4 and related complexes(A–D) with Fe2(µ-1,2-O2)(µ-OR) cores (R = H (A), alkyl (C), aryl (D), or no substituent (1–4, B)). Note that since resonance Raman data are not available for D (◇), the value used herecorresponds to a closely related complex (see Table 3).
Fiedler et al. Page 18
J Phys Chem A. Author manuscript; available in PMC 2009 December 18.
NIH
-PA Author Manuscript
NIH
-PA Author Manuscript
NIH
-PA Author Manuscript

Scheme 1.Ligands used in this study.
Fiedler et al. Page 19
J Phys Chem A. Author manuscript; available in PMC 2009 December 18.
NIH
-PA Author Manuscript
NIH
-PA Author Manuscript
NIH
-PA Author Manuscript

Scheme 2.Generation of FeIII
2(µ-O)(µ-1,2-O2) complexes of tetradentate ligands 6-Me-BQPA (1),BQPA (2), and 6-Me3-TPA (3) and hexadentate ligand BPPE (4) from respective diiron(III)precursors (see Scheme 1 for ligand structures). The abbreviation “py” represents a pyridine-like ligand, while “N” corresponds to a tertiary amine nitrogen on the polydentate ligand.
Fiedler et al. Page 20
J Phys Chem A. Author manuscript; available in PMC 2009 December 18.
NIH
-PA Author Manuscript
NIH
-PA Author Manuscript
NIH
-PA Author Manuscript

NIH
-PA Author Manuscript
NIH
-PA Author Manuscript
NIH
-PA Author Manuscript
Fiedler et al. Page 21
Table 1XAS Near-edge Features and Intensities for Complexes 1, 2 and 4.
complex E0 (eV) Epre-edge (eV) Pre-edge area
1 7122.8 7114.4 20.4(9)
2 7122.7 7114.5 18.3(9)
4 7123.6 7113.6 29.1(7)
J Phys Chem A. Author manuscript; available in PMC 2009 December 18.
NIH
-PA Author Manuscript
NIH
-PA Author Manuscript
NIH
-PA Author Manuscript
Fiedler et al. Page 22Ta
ble
2EX
AFS
Fitt
ing
Res
ults
for F
eIII 2(
µ-O
)(µ-
1,2-
O2)
Inte
rmed
iate
s, 1,
2 a
nd 4
.a
Fe-N
/OFe
-N/O
Fe-N
/OFe⋯
CFe⋯
FeG
OFd
com
plex
fitN
r(Å
)σ2
nr(
Å)
σ2n
r(Å
)σ2
nr(
Å)
σ2n
r(Å
)σ2
11
62.
234.
541
6
22
1.83
4.7
42.
241.
825
3
32
1.84
6.7
42.
252.
41
3.19
3.4
246
42
1.83
5.4
42.
251.
46
3.00
2.0
13.
161.
512
5
52
1.83
4.7
32.
240.
96
3.01
2.7
13.
161.
894
62
1.83
5.0
32.
241.
04
3.00
0.3
13.
152.
290
72
1.83
3.7
12.
051.
0b3
2.23
0.3
42.
991.
11
3.15
3.0
43
21
62.
226.
527
0
22
1.85
12.0
42.
223.
817
3
22
1.85
11.5
42.
231
3.14
5.0
123
32
1.84
11.1
42.
214.
36
2.99
2.1
13.
141.
335
42
1.85
11.6
42.
214.
44
2.98
0.1
13.
121.
630
52
1.84
12.4
32.
212.
84
2.98
0.3
13.
121.
827
62
1.81
5.0b
12.
021.
23
2.20
1.8
42.
970.
91
3.12
2.6
26
72
1.81
5.0b
12.
021.
13
2.20
1.7
62.
982.
81
3.13
2.1
23
82
1.82
6.7
12.
033.
43
2.21
1.7
62.
982.
61
3.13
1.9
16
41
62.
1810
.0b
300
22
1.88
10.4
42.
166.
916
4
32
1.88
10.5
42.
166.
41
3.06
2.20
28
42
1.87
10.1
42.
166.
76
3.08
2.1
34
52
1.88
10.5
42.
176.
54
3.15
13.3
13.
062.
6921
61
1.86
4.7
52.
1611
.21
3.06
2.64
44
71
1.88
5.11
42.
167.
81
3.06
2.60
34
81
1.78
3.39
11.
920.
44
2.14
6.2
13.
052.
4418
91
1.77
5.83
21.
946.
53
2.16
3.2
13.
042.
3219
J Phys Chem A. Author manuscript; available in PMC 2009 December 18.

NIH
-PA Author Manuscript
NIH
-PA Author Manuscript
NIH
-PA Author Manuscript
Fiedler et al. Page 23
Fe-N
/OFe
-N/O
Fe-N
/OFe⋯
CFe⋯
FeG
OFd
com
plex
fitN
r(Å
)σ2
nr(
Å)
σ2n
r(Å
)σ2
nr(
Å)
σ2n
r(Å
)σ2
102
1.88
11.9
81
1.98
4.3
32.
163.
21
3.05
2.34
20
3c2
1.84
42.
236
2.96
13.
14
a Bac
k-tra
nsfo
rmat
ion
rang
e: ~
0.5
0 to
3.3
Å; F
ourie
r-tra
nsfo
rmed
rang
e: k
= 2
.0 –
14.
5 Å−1
(1 a
nd 2
), 2.
0 –
14.0
Å−1
(4).
Res
olut
ion
= ~
0.12
Å. σ
2 in
uni
ts o
f Å2 .
The
firs
t tw
o sh
ells
wer
e fit
usi
nga
scat
ter w
ith o
xyge
n pa
ram
eter
s, w
here
as th
e th
ird e
mpl
oyed
nitr
ogen
par
amet
ers;
how
ever
, bac
ksca
tters
diff
erin
g by
Z =
1 c
anno
t be
dist
ingu
ishe
d by
EX
AFS
.
b σ2 -
valu
e he
ld fi
xed
durin
g op
timiz
atio
n.
c Ref
eren
ce 1
5
d GO
F =
good
ness
of f
it.
J Phys Chem A. Author manuscript; available in PMC 2009 December 18.

NIH
-PA Author Manuscript
NIH
-PA Author Manuscript
NIH
-PA Author Manuscript
Fiedler et al. Page 24Ta
ble
3R
aman
vib
ratio
nal f
requ
enci
es (c
m−1
) for
FeII
I 2(µ-
O)(
µ-1,
2-O
2) in
term
edia
tes 1
–4 a
nd R
elat
ed C
ompl
exes
A–E
.
Com
plex
ν sym
(Fe-
O-F
e)ν a
sym
(Fe-
O-F
e)ν(
O-O
)ν s
ym(F
e-O
2-Fe
)ν a
sym
(Fe-
O2-
Fe)
d(F
e-Fe
)
[Δ18
O,
Δ18O
2][Δ
18O
,Δ18
O2]
[Δ18
O,
Δ18O
2][Δ
18O
,Δ18
O2]
[Δ18
O,
Δ18O
2]
151
0[−
16, 0
]69
8[−
31, −
4]a
853
[0, −
45]
463
[0, −
15]
529
[0, −
26]
3.15
Å
252
2[−
13, −
]70
8[−
32, −
4]84
4[0
, −44
]46
4[0
, −17
]52
3[−
, −20
]3.
13 Å
351
1[−
12, −
]69
6[−
30, −
6]84
7[0
, −44
]46
3[−
, −21
]53
3[−
, −25
]3.
14 Å
4 b
537
[−20
, −]
−[−
, −]
830
[0, −
]−
[−, −
]−
[−, −
]3.
04 Å
A c
908
[−, −
47]
460
[−, −
13]
548
[−, 1
2]3.
40 Å
B d
-69
5[−
, −2]
847
[−, −
33]
465
[−, −
19]
-3.
17 Å
C e
900
[−, −
50]
471
[−, −
16]
3.46
Å
D f
(884
) g3.
33 Å
E h
876
[−, −
48]
421
[−, −
12]
4.00
Å
a Dow
nshi
ft of
−35
cm−1
obs
erve
d fo
r the
fully
labe
led
Fe2(
18O
)(18
O2)
cor
e.
b Alth
ough
the
reso
nanc
e R
aman
spec
trum
of 4
was
pre
viou
sly
publ
ishe
d in
ref 1
7 , th
e re
porte
d fr
eque
ncy
of th
e ν(
O-O
) mod
e (8
16 c
m−1
) diff
ers f
rom
the
valu
e of
830
cm−1
list
ed h
ere,
whi
ch w
asob
tain
ed in
our
labo
rato
ry fo
r dire
ct c
ompa
rison
s with
dat
a fo
r the
oth
er p
erox
o co
mpl
exes
we
inve
stig
ated
.
c A =
[Fe 2
(µ-O
H)(
µ-1,
2-O
2)(6
-Me 2
BPP
)]+
(6-M
e 2B
PP =
N,N
-bis
(6-m
ethy
l-2-p
yrid
ylm
ethy
l)-3-
amin
opro
pion
ate)
.14
d B =
[Fe 2
(µ-O
)(µ-
1,2-
O2)
(6-M
e 2B
PP)]
.14
e C =
[Fe 2
(µ-1
,2-O
2)(N
-Et-H
PTB
)(O
PPh 3
) 2]3
+ (N
-Et-H
PTB
= a
nion
of N
,N,-N
’,N’-
tetra
kis(
1’-e
thyl
benz
imid
azol
yl-2
’-m
ethy
l)-2-
hydr
oxy-
1,3-
diam
inop
ropa
ne).
12,4
2 Th
e R
aman
vib
ratio
nal
freq
uenc
ies w
ere
obta
ined
in o
ur la
bora
tory
(see
Fig
ure
S2 in
the
Supp
ortin
g In
form
atio
n).
f D =
[Fe 2
(µ-1
,2-O
2)(P
hCO
O)(
Ph-b
imp)
]2+
(Ph-
bim
p =
2,6-
bis[
bis[
2-(1
-met
hyl-4
,5-d
iphe
nylim
idaz
olyl
)met
hyl)a
min
omet
hyl]-
4-m
ethy
lphe
nola
te 1
1
J Phys Chem A. Author manuscript; available in PMC 2009 December 18.

NIH
-PA Author Manuscript
NIH
-PA Author Manuscript
NIH
-PA Author Manuscript
Fiedler et al. Page 25g Fr
eque
ncy
was
obt
aine
d fo
r the
rela
ted
com
plex
[Fe 2
(µ-1
,2-O
2)(C
H3C
OO
)(L)
]2+
(L =
N,N
’-(2
-hyd
roxy
-5-m
ethy
lxyl
ylen
e) b
is(N
-car
boxy
met
hylg
lyci
ne))
.43
h E =
[Fe 2
(µ-1
,2-O
2)(P
hCH
2CO
2)2(
TpiP
r2) 2
]2+
(Tpi
Pr2
= H
B(p
z’) 3
, whe
re p
z’ is
3,5
-bis
(isop
ropy
l)-py
razo
lyl.)
13,4
4
J Phys Chem A. Author manuscript; available in PMC 2009 December 18.

NIH
-PA Author Manuscript
NIH
-PA Author Manuscript
NIH
-PA Author Manuscript
Fiedler et al. Page 26Ta
ble
4C
ompa
rison
of E
xper
imen
tal a
nd N
CA
-Cal
cula
ted
Vib
ratio
nal D
ata
for 1
.
isot
ope
shift
s
mod
efr
eque
ncy
Δ18O
Δ18O
2Δ(
18O
, 18O
2)
ν sym
exp
510
−16
0−1
8
(Fe-
O-F
e)N
CA
513
−18
−1−2
0
ν asy
mex
p69
8−3
1−4
−35
(Fe-
O-F
e)N
CA
697
−31
−2−3
3
ν(O
-O)
exp
853
0−4
5−4
7
NC
A85
40
−48
−49
ν sym
exp
463
0−1
6−1
9
(Fe-
O2-
Fe)
NC
A46
1−1
−19
−20
ν asy
mex
p52
90
−26
−22
(Fe-
O2-
Fe)
NC
A53
1−2
−22
−23
J Phys Chem A. Author manuscript; available in PMC 2009 December 18.

NIH
-PA Author Manuscript
NIH
-PA Author Manuscript
NIH
-PA Author Manuscript
Fiedler et al. Page 27
Table 5Force Constants Obtained from Normal Coordinate Analyses for 1 and B.
Force constants (mdyn/Å)
L = 6-MeBQPA L = 6-Me2BPP
Internal coordinate (1) (B) a
r (Fe-Ooxo) 2.86 2.54
r (Fe-Operoxo) 2.17 1.84
r (O-O) 3.17 3.25
aReference 14
J Phys Chem A. Author manuscript; available in PMC 2009 December 18.


![Cyclodextrin-mediated entrapment of curcuminoid 4-[3,5-bis(2-chlorobenzylidene-4-oxo-piperidine-1-yl)-4-oxo-2-butenoic acid] or CLEFMA in liposomes for treatment of xenograft lung](https://static.fdokumen.com/doc/165x107/6313dbe3fc260b71020f4934/cyclodextrin-mediated-entrapment-of-curcuminoid-4-35-bis2-chlorobenzylidene-4-oxo-piperidine-1-yl-4-oxo-2-butenoic.jpg)