Specific fibre composition and metabolism of the rectus abdominis muscle of bovine Charolais cattle
12
RESEARCH ARTICLE Open Access Specific fibre composition and metabolism of the rectus abdominis muscle of bovine Charolais cattle Marie-Pierre Oury 1 , Rollande Dumont 1 , Catherine Jurie 2 , Jean-François Hocquette 2* , Brigitte Picard 2 Abstract Background: An important variability of contractile and metabolic properties between muscles has been highlighted. In the literature, the majority of studies on beef sensorial quality concerns M. longissimus thoracis. M. rectus abdominis (RA) is easy to sample without huge carcass depreciation and may appear as an alternative to M. longissimus thoracis for fast and routine physicochemical analysis. It was considered interesting to assess the muscle fibres of M. rectus abdominis in comparison with M. longissimus thoracis (LT) and M. triceps brachii (TB) on the basis of metabolic and contractile properties, area and myosin heavy chain isoforms (MyHC) proportions. Immuno- histochemical, histochemical, histological and enzymological techniques were used. This research concerned two populations of Charolais cattle: RA was compared to TB in a population of 19 steers while RA was compared to LT in a population of 153 heifers. Results: RA muscle had higher mean fibre areas (3350 μm 2 vs 2142 to 2639 μm 2 ) than the two other muscles. In RA muscle, the slow-oxidative fibres were the largest (3957 μm 2 ) and the fast-glycolytic the smallest (2868 μm 2 ). The reverse was observed in TB muscle (1725 and 2436 μm 2 respectively). In RA muscle, the distinction between fast-oxidative-glycolytic and fast-glycolytic fibres appeared difficult or impossible to establish, unlike in the other muscles. Consequently the classification based on ATPase and SDH activities seemed inappropriate, since the FOG fibres presented rather low SDH activity in this muscle in comparison to the other muscles of the carcass. RA muscle had a higher proportion of I fibres than TB and LT muscles, balanced by a lower proportion either of IIX fibres (in comparison to TB muscle) or of IIA fibres (in comparison to LT muscle). However, both oxidative and glycolytic enzyme activities were lower in RA than in TB muscle, although the LDH/ICDH ratio was higher in RA muscle (522 vs 340). Oxidative enzyme activities were higher in RA than in LT muscle, whereas glycolytic enzyme activity was lower. In RA muscle, contractile and metabolic properties appeared to be less well-correlated than in the two other muscles. Conclusions: RA muscle has some particularities in comparison to the LT and TB muscles, especially concerning the unusual large cross-section surface of SO fibres and the very low oxidative activity of intermediate IIA fibres. Background Post-mortem meat tenderisation processes involve enzy- matic and physicochemical mechanisms which are gov- erned in intensity and amplitude by the proportion of the different fibre types [1]. Until 2004, three fibre types were distinguished in adult cattle muscles. In 1960, the fibre classification was based on metabolism (oxidative or glycolytic) [2]. In 1972, the classification of PETER et al. [3] based both on their contractile (ATPase activity) and meta- bolic properties (Succinate Dehydrogenase activity) divided fibres into slow oxidative (SO), fast oxidative- glycolytic (FOG) and fast glycolytic (FG) types. The revelation of myosin ATPase activity [4], or the use of specific antibodies of different myosin heavy chains isoforms (MyHC) [5] revealing only the contractile properties, allowed I, IIA and IIX fibres to be distin- guished. More recently IIB fibres were identified in cattle [6-8]. Indeed, until 2004, many arguments * Correspondence: [email protected] 2 Institut National de la Recherche Agronomique (INRA), Unité de Recherche sur les Herbivores UR 1213, 63122 St-Genès-Champanelle, France Oury et al. BMC Biochemistry 2010, 11:12 http://www.biomedcentral.com/1471-2091/11/12 © 2010 Oury et al; licensee BioMed Central Ltd. This is an Open Access article distributed under the terms of the Creative Commons Attribution License (http://creativecommons.org/licenses/by/2.0), which permits unrestricted use, distribution, and reproduction in any medium, provided the original work is properly cited.
-
Upload
nationalagriculturalresearchinra -
Category
Documents
-
view
0 -
download
0
Transcript of Specific fibre composition and metabolism of the rectus abdominis muscle of bovine Charolais cattle
RESEARCH ARTICLE Open Access
Specific fibre composition and metabolismof the rectus abdominis muscle of bovineCharolais cattleMarie-Pierre Oury1, Rollande Dumont1, Catherine Jurie2, Jean-François Hocquette2*, Brigitte Picard2
Abstract
Background: An important variability of contractile and metabolic properties between muscles has beenhighlighted. In the literature, the majority of studies on beef sensorial quality concerns M. longissimus thoracis. M.rectus abdominis (RA) is easy to sample without huge carcass depreciation and may appear as an alternative to M.longissimus thoracis for fast and routine physicochemical analysis. It was considered interesting to assess the musclefibres of M. rectus abdominis in comparison with M. longissimus thoracis (LT) and M. triceps brachii (TB) on the basisof metabolic and contractile properties, area and myosin heavy chain isoforms (MyHC) proportions. Immuno-histochemical, histochemical, histological and enzymological techniques were used. This research concerned twopopulations of Charolais cattle: RA was compared to TB in a population of 19 steers while RA was compared to LTin a population of 153 heifers.
Results: RA muscle had higher mean fibre areas (3350 μm2 vs 2142 to 2639 μm2) than the two other muscles. InRA muscle, the slow-oxidative fibres were the largest (3957 μm2) and the fast-glycolytic the smallest (2868 μm2).The reverse was observed in TB muscle (1725 and 2436 μm2 respectively). In RA muscle, the distinction betweenfast-oxidative-glycolytic and fast-glycolytic fibres appeared difficult or impossible to establish, unlike in the othermuscles. Consequently the classification based on ATPase and SDH activities seemed inappropriate, since the FOGfibres presented rather low SDH activity in this muscle in comparison to the other muscles of the carcass. RAmuscle had a higher proportion of I fibres than TB and LT muscles, balanced by a lower proportion either of IIXfibres (in comparison to TB muscle) or of IIA fibres (in comparison to LT muscle). However, both oxidative andglycolytic enzyme activities were lower in RA than in TB muscle, although the LDH/ICDH ratio was higher in RAmuscle (522 vs 340). Oxidative enzyme activities were higher in RA than in LT muscle, whereas glycolytic enzymeactivity was lower. In RA muscle, contractile and metabolic properties appeared to be less well-correlated than inthe two other muscles.
Conclusions: RA muscle has some particularities in comparison to the LT and TB muscles, especially concerningthe unusual large cross-section surface of SO fibres and the very low oxidative activity of intermediate IIA fibres.
BackgroundPost-mortem meat tenderisation processes involve enzy-matic and physicochemical mechanisms which are gov-erned in intensity and amplitude by the proportion ofthe different fibre types [1].Until 2004, three fibre types were distinguished in
adult cattle muscles. In 1960, the fibre classificationwas based on metabolism (oxidative or glycolytic) [2].
In 1972, the classification of PETER et al. [3] basedboth on their contractile (ATPase activity) and meta-bolic properties (Succinate Dehydrogenase activity)divided fibres into slow oxidative (SO), fast oxidative-glycolytic (FOG) and fast glycolytic (FG) types. Therevelation of myosin ATPase activity [4], or the use ofspecific antibodies of different myosin heavy chainsisoforms (MyHC) [5] revealing only the contractileproperties, allowed I, IIA and IIX fibres to be distin-guished. More recently IIB fibres were identified incattle [6-8]. Indeed, until 2004, many arguments
* Correspondence: [email protected] National de la Recherche Agronomique (INRA), Unité de Recherchesur les Herbivores UR 1213, 63122 St-Genès-Champanelle, France
Oury et al. BMC Biochemistry 2010, 11:12http://www.biomedcentral.com/1471-2091/11/12
© 2010 Oury et al; licensee BioMed Central Ltd. This is an Open Access article distributed under the terms of the Creative CommonsAttribution License (http://creativecommons.org/licenses/by/2.0), which permits unrestricted use, distribution, and reproduction inany medium, provided the original work is properly cited.
existed to support the existence of myosin heavy chain(MyHC) isoform IIb in cattle but this isoform couldnot be formally identified. One explanation may be thenegative correlation that appears in mammals betweenthe concentration of MyHC IIb isoform and the size ofthe animals [6]. In addition, the presence of a commonantigenic determinant between MyHC IIb and MyHCIIx contributed to confuse these two isoforms [7]. Sofor a long time, IIX fibres were classified as IIB fibres,because the techniques used did not allow these twoisoforms to be distinguished [8]. The gene coding forthe IIb myosin heavy chain has also been revealed inskeletal muscle of cattle [9]. However the presence ofthe protein was observed only in extraocular and rec-tractor bulbi cattle muscles [10,11]. Recently the studyby Picard and Cassar-Malek [12] revealed the presenceof a fourth MyHC isoform in semitendinosus and long-issimus thoracis muscles of eleven 15-month-oldBlonde d’Aquitaine young bulls. Western-blot analysesconfirmed the presence of a fast MyHC. Altogether,these results indicate that a MyHC IIb isoform isexpressed in the semitendinosus muscle and, in smalleramounts, in the longissimus thoracis muscle of somecattle. However, its expression does not seem to befrequent.In addition to these pure fibres, the use of antibodies
by immuno-histochemistry allows hybrid fibres to bedistinguished, that contain multiple MyHC isoforms.There are in particular IIC fibres containing bothMyHC I and MyHC IIa isoforms, or IIAX fibres con-taining MyHC IIa and MyHC IIx isoforms. On exces-sively large samples for which the histologicaltechniques cannot be applied, the contractile and meta-bolic properties of muscles might also be estimated byelectrophoresis using a homogenate and/or by measure-ment of enzyme activities [for review, [13]]. The mostcommonly used enzymes are on the one hand lactatedehydrogenase and phosphofructokinase for the glycoly-tic metabolism and, on the other hand, isocitrate dehy-drogenase, citrate synthase or cytochrome-c-oxidase forthe oxidative metabolism [14]. The different enzymeactivities allow the muscles to be classified according totheir metabolic type.Considerable variability of contractile and metabolic
properties between muscles might be highlighted.Indeed, the continuously active muscles like M. diaphra-grama, M. masseter or the heart have a more oxidativemetabolism than the less active muscles, which tendrather to have a glycolytic metabolism [15].M. rectus abdominis (flank steak) is a muscle easy to
sample without huge carcass depreciation. So this mus-cle might appear as an alternative to M. longissimusthoracis for fast and routine physicochemical analysisfor studies on beef quality.
As part of two protocols established in our laboratory,observations were made of the specificities of the RAmuscle.The objective of this paper, by compiling these two
studies, is to characterize the muscle fibres of RA mus-cle in comparison to two other muscles of the carcass,chosen in order to represent different anatomicalregions, divergent growth patterns and functionalities.First RA muscle was compared to M. triceps brachii(TB) that is a muscle involved in movement and withM. longissimus thoracis (LT), a dynamic muscle (veryactive in the spine extension) that is often considered asa reference for which many results are available [16,17].JURIE et al. [18] observed that between 15 and 24
months, the proportion of the slow oxidative fibers SOincreases by 11% whereas the proportion of the fastoxido-glycolytic fibers FOG decreases. These evolutionslead to a more oxidative metabolism with age in themuscles of young bulls. Nevertheless, neither the pro-portions of the various types of fibers, nor the enzymaticactivities (LDH and ICDH) appeared significantly modi-fied by the age between cull cows of 4 and 9 years [19].Thus, we found interesting to evaluate the samples ofmuscles at the commonly used age depending on animaltype: 26 months when considering steers and 33 monthswhen considering heifers.
MethodsAnimalsThe first study concerned the RA and TB muscles of 19Charolais steers, slaughtered at 26 months of age and405 kg of carcass weight. The muscles were sampledone hour post mortem at the INRA experimental slaugh-terhouse (Theix, France) [20].The second study concerned the RA and LT muscles
of 153 Charolais heifers, slaughtered at 33 months ofage and 381 kg of carcass weight. The muscles weresampled 24 hours post mortem in an industrial slaugh-terhouse [21]. Thus, no one of these studies required anethical approval.
Measurements and analysisMuscle samplesA standardization of the sampling procedures wasadopted for each muscle with a clearly identified samplelocation (Figure 1). Samples intended for histochemicaland immuno-histochemical analysis were cut into 5 mmside cubes and stacked on a cork in order to positionthe muscular fibres and to allow freezing. The freezingwas made progressively into isopentane [22] then intoliquid nitrogen and the samples were packaged at -80°Cuntil analysis.Samples intended for electrophoretic separations and
metabolic properties of muscles were cut into small
Oury et al. BMC Biochemistry 2010, 11:12http://www.biomedcentral.com/1471-2091/11/12
Page 2 of 12
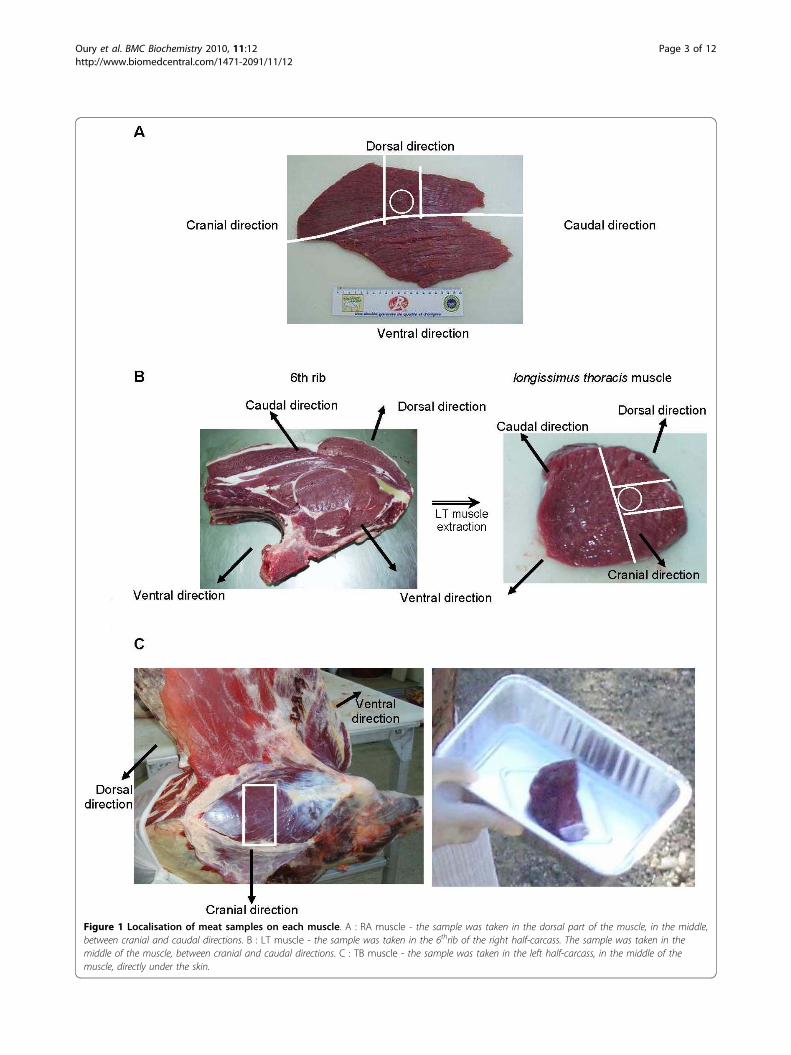
Figure 1 Localisation of meat samples on each muscle. A : RA muscle - the sample was taken in the dorsal part of the muscle, in the middle,between cranial and caudal directions. B : LT muscle - the sample was taken in the 6thrib of the right half-carcass. The sample was taken in themiddle of the muscle, between cranial and caudal directions. C : TB muscle - the sample was taken in the left half-carcass, in the middle of themuscle, directly under the skin.
Oury et al. BMC Biochemistry 2010, 11:12http://www.biomedcentral.com/1471-2091/11/12
Page 3 of 12
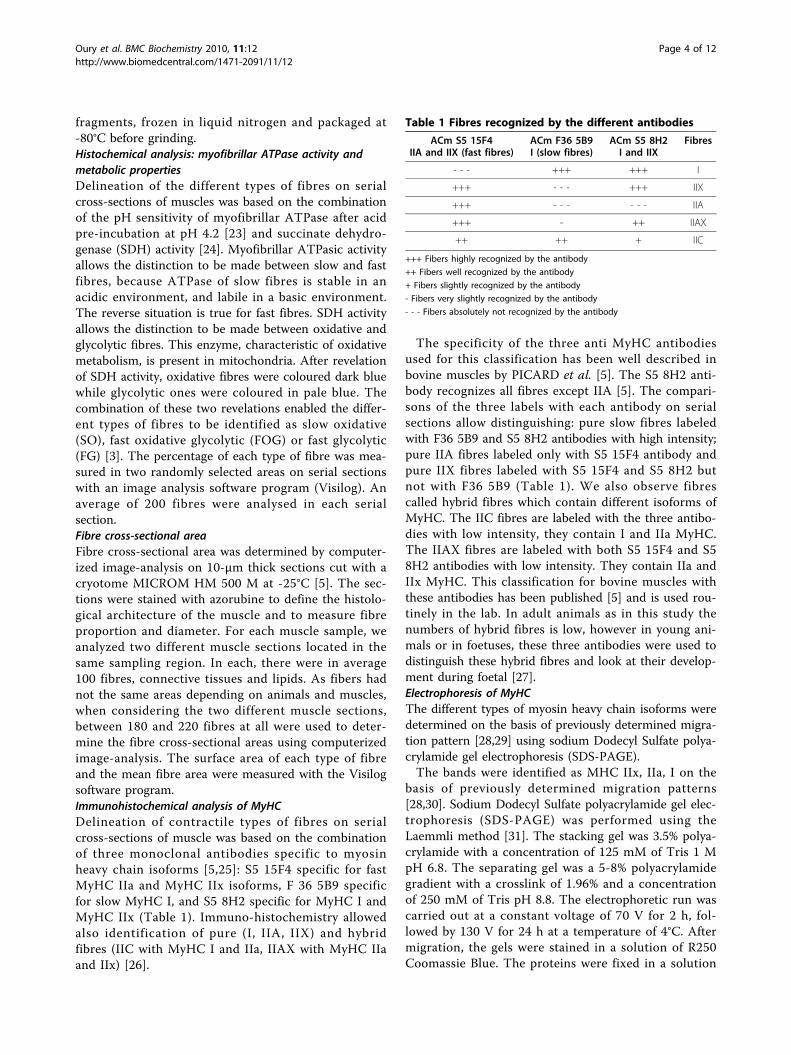
fragments, frozen in liquid nitrogen and packaged at-80°C before grinding.Histochemical analysis: myofibrillar ATPase activity andmetabolic propertiesDelineation of the different types of fibres on serialcross-sections of muscles was based on the combinationof the pH sensitivity of myofibrillar ATPase after acidpre-incubation at pH 4.2 [23] and succinate dehydro-genase (SDH) activity [24]. Myofibrillar ATPasic activityallows the distinction to be made between slow and fastfibres, because ATPase of slow fibres is stable in anacidic environment, and labile in a basic environment.The reverse situation is true for fast fibres. SDH activityallows the distinction to be made between oxidative andglycolytic fibres. This enzyme, characteristic of oxidativemetabolism, is present in mitochondria. After revelationof SDH activity, oxidative fibres were coloured dark bluewhile glycolytic ones were coloured in pale blue. Thecombination of these two revelations enabled the differ-ent types of fibres to be identified as slow oxidative(SO), fast oxidative glycolytic (FOG) or fast glycolytic(FG) [3]. The percentage of each type of fibre was mea-sured in two randomly selected areas on serial sectionswith an image analysis software program (Visilog). Anaverage of 200 fibres were analysed in each serialsection.Fibre cross-sectional areaFibre cross-sectional area was determined by computer-ized image-analysis on 10-μm thick sections cut with acryotome MICROM HM 500 M at -25°C [5]. The sec-tions were stained with azorubine to define the histolo-gical architecture of the muscle and to measure fibreproportion and diameter. For each muscle sample, weanalyzed two different muscle sections located in thesame sampling region. In each, there were in average100 fibres, connective tissues and lipids. As fibers hadnot the same areas depending on animals and muscles,when considering the two different muscle sections,between 180 and 220 fibres at all were used to deter-mine the fibre cross-sectional areas using computerizedimage-analysis. The surface area of each type of fibreand the mean fibre area were measured with the Visilogsoftware program.Immunohistochemical analysis of MyHCDelineation of contractile types of fibres on serialcross-sections of muscle was based on the combinationof three monoclonal antibodies specific to myosinheavy chain isoforms [5,25]: S5 15F4 specific for fastMyHC IIa and MyHC IIx isoforms, F 36 5B9 specificfor slow MyHC I, and S5 8H2 specific for MyHC I andMyHC IIx (Table 1). Immuno-histochemistry allowedalso identification of pure (I, IIA, IIX) and hybridfibres (IIC with MyHC I and IIa, IIAX with MyHC IIaand IIx) [26].
The specificity of the three anti MyHC antibodiesused for this classification has been well described inbovine muscles by PICARD et al. [5]. The S5 8H2 anti-body recognizes all fibres except IIA [5]. The compari-sons of the three labels with each antibody on serialsections allow distinguishing: pure slow fibres labeledwith F36 5B9 and S5 8H2 antibodies with high intensity;pure IIA fibres labeled only with S5 15F4 antibody andpure IIX fibres labeled with S5 15F4 and S5 8H2 butnot with F36 5B9 (Table 1). We also observe fibrescalled hybrid fibres which contain different isoforms ofMyHC. The IIC fibres are labeled with the three antibo-dies with low intensity, they contain I and IIa MyHC.The IIAX fibres are labeled with both S5 15F4 and S58H2 antibodies with low intensity. They contain IIa andIIx MyHC. This classification for bovine muscles withthese antibodies has been published [5] and is used rou-tinely in the lab. In adult animals as in this study thenumbers of hybrid fibres is low, however in young ani-mals or in foetuses, these three antibodies were used todistinguish these hybrid fibres and look at their develop-ment during foetal [27].Electrophoresis of MyHCThe different types of myosin heavy chain isoforms weredetermined on the basis of previously determined migra-tion pattern [28,29] using sodium Dodecyl Sulfate polya-crylamide gel electrophoresis (SDS-PAGE).The bands were identified as MHC IIx, IIa, I on the
basis of previously determined migration patterns[28,30]. Sodium Dodecyl Sulfate polyacrylamide gel elec-trophoresis (SDS-PAGE) was performed using theLaemmli method [31]. The stacking gel was 3.5% polya-crylamide with a concentration of 125 mM of Tris 1 MpH 6.8. The separating gel was a 5-8% polyacrylamidegradient with a crosslink of 1.96% and a concentrationof 250 mM of Tris pH 8.8. The electrophoretic run wascarried out at a constant voltage of 70 V for 2 h, fol-lowed by 130 V for 24 h at a temperature of 4°C. Aftermigration, the gels were stained in a solution of R250Coomassie Blue. The proteins were fixed in a solution
Table 1 Fibres recognized by the different antibodies
ACm S5 15F4IIA and IIX (fast fibres)
ACm F36 5B9I (slow fibres)
ACm S5 8H2I and IIX
Fibres
- - - +++ +++ I
+++ - - - +++ IIX
+++ - - - - - - IIA
+++ - ++ IIAX
++ ++ + IIC
+++ Fibers highly recognized by the antibody
++ Fibers well recognized by the antibody
+ Fibers slightly recognized by the antibody
- Fibers very slightly recognized by the antibody
- - - Fibers absolutely not recognized by the antibody
Oury et al. BMC Biochemistry 2010, 11:12http://www.biomedcentral.com/1471-2091/11/12
Page 4 of 12
made with ethanol (30%) and acetic acid (5%) for 20min at room temperature. Then, gels were incubated incolored solution containing propanol 2 (25%), aceticacid (10%) and Coomassie Blue R250 (2 g/L) for 20 minand analysed using a ChemiMajeur densitometer(Figure 2).Muscle metabolismThe metabolic type of muscle was determined by mea-suring enzyme activities. Anaerobic glycolytic metabo-lism was assessed by lactate dehydrogenase (LDH)activity [32]. Aerobic oxidative metabolism was assessedby isocitrate dehydrogenase (ICDH) and cytochrome-coxidase (COX) activities according to the BRIAND et al.[33] and PIOT et al. [14] methods.
Statistical analysisStatistical analysis of each of the two studies was madeseparately, as the differences between the two experi-ments were too important (delay between slaughteringand muscle sampling, type of animal, number ofanimals).So variance analysis and mean multiple comparisons
with one factor were carried out using the GLM proce-dure (general linear model) from SAS 9.1 [34]. Multiplecomparisons of the adjusted means (LSMEANS) werecarried out using the PDIFF option of the GLMprocedure.Correlation coefficients were calculated using Pear-
son’s model (SAS v 9.1).Principal component analysis (PCA) for meat quality
traits and physicochemical characteristics was madeusing WINSTAT software. This statistical method basedon the study of the covariances and the correlationsbetween variables allows the dimensions of the data set,originally described with a far larger number of vari-ables. PCA allows the calculation of new variables, calledprincipal components, which account for the variabilityin the data. The information can then be described withfewer variables than originally present since the princi-pal components are linear combinations of the originalvariables. The first principal component is the
combination of variables that explains the greatestamount of variability in the data. The second principaland subsequent components describe the maximumamount of remaining variability and must be indepen-dent of (orthogonal to) the first principal component.The main steps in PCA have been described for pre-vious applications in cattle [35,36]. Results are presentedin a 2D projection graph where variables near eachother at the periphery of the circle are positively corre-lated, orthogonal variables are independent and variablesseparated by 180° are negatively correlated. The closerto the periphery of the circle, the higher the coefficientof correlation between variables.
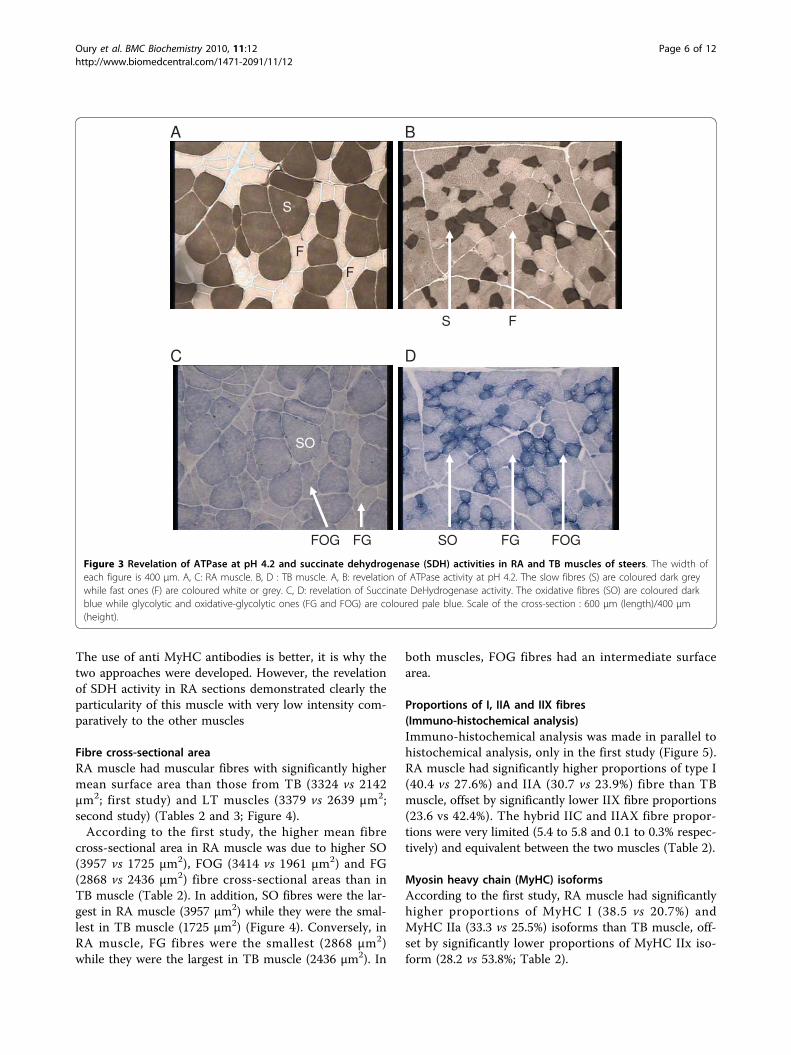
ResultsProportions of SO, FOG and FG fibres in RA and TBmuscles (histochemical analysis)In RA muscle, two different colours were observed whenanalysing ATPase activity revelation, black and white,which are characteristic of slow and fast fibres respec-tively. In TB muscle, the revelation allowed three differ-ent colours (black, grey and white) to be distinguished(Figure 3). In addition, the distinction between oxidativeand glycolytic fibres in RA muscle was quite impossible,all fibres being pale blue. In TB muscle, revelation of theSDH activity easily allowed dark blue oxidative fibres andclear blue glycolytic ones to be distinguished (Figure 3).The combination of ATPase and SDH classifications
made it possible to distinguish SO, FOG and FG fibres.According to this method, RA muscle appeared to havesignificantly higher proportions of SO fibres (37.8 vs28.0%), offset by significantly lower proportions of FOGfibres (8.3 vs 19.6%), as compared to TB muscle. Theproportions of FG fibres were equivalent between thetwo muscles (53.9% in RA muscle and 52.4% in TBmuscle; Table 2). Nevertheless, the contrasts betweenFG and FOG fibres were also less marked in RA musclethan in TB muscle.The classification of fibres in SO, FOG, FG on the
basis of the revelation of ATPase and SDH activities onserial muscle sections is still used by different authors.
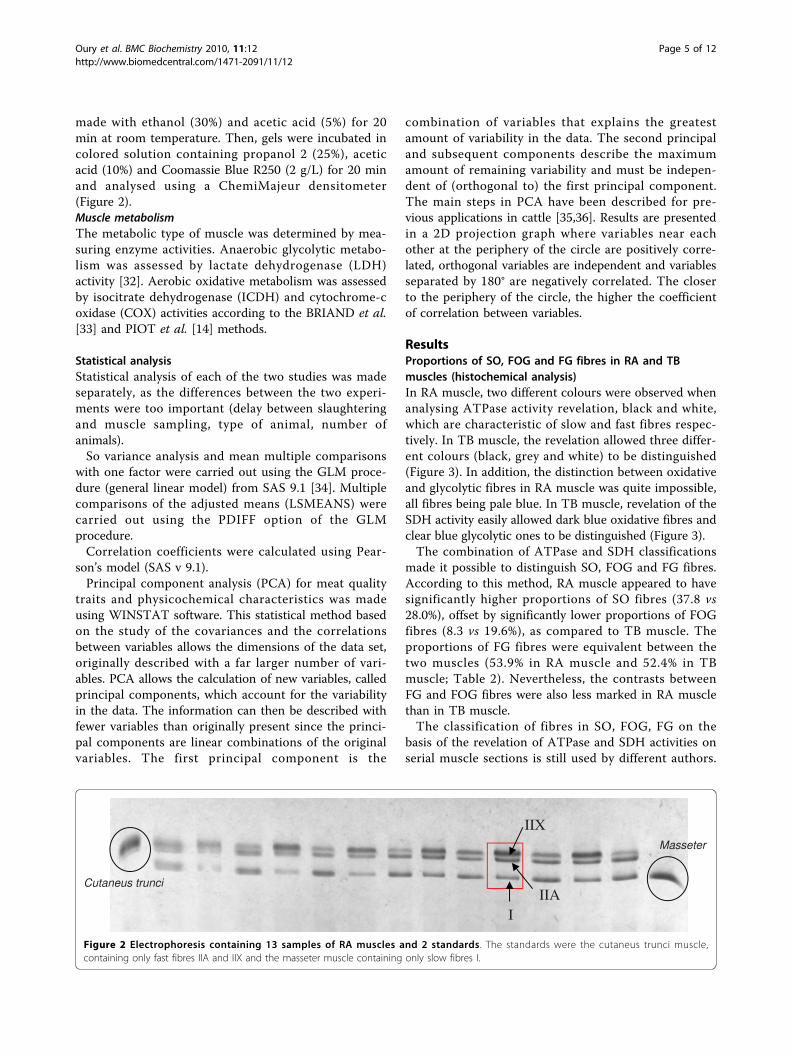
Figure 2 Electrophoresis containing 13 samples of RA muscles and 2 standards. The standards were the cutaneus trunci muscle,containing only fast fibres IIA and IIX and the masseter muscle containing only slow fibres I.
Oury et al. BMC Biochemistry 2010, 11:12http://www.biomedcentral.com/1471-2091/11/12
Page 5 of 12
The use of anti MyHC antibodies is better, it is why thetwo approaches were developed. However, the revelationof SDH activity in RA sections demonstrated clearly theparticularity of this muscle with very low intensity com-paratively to the other muscles
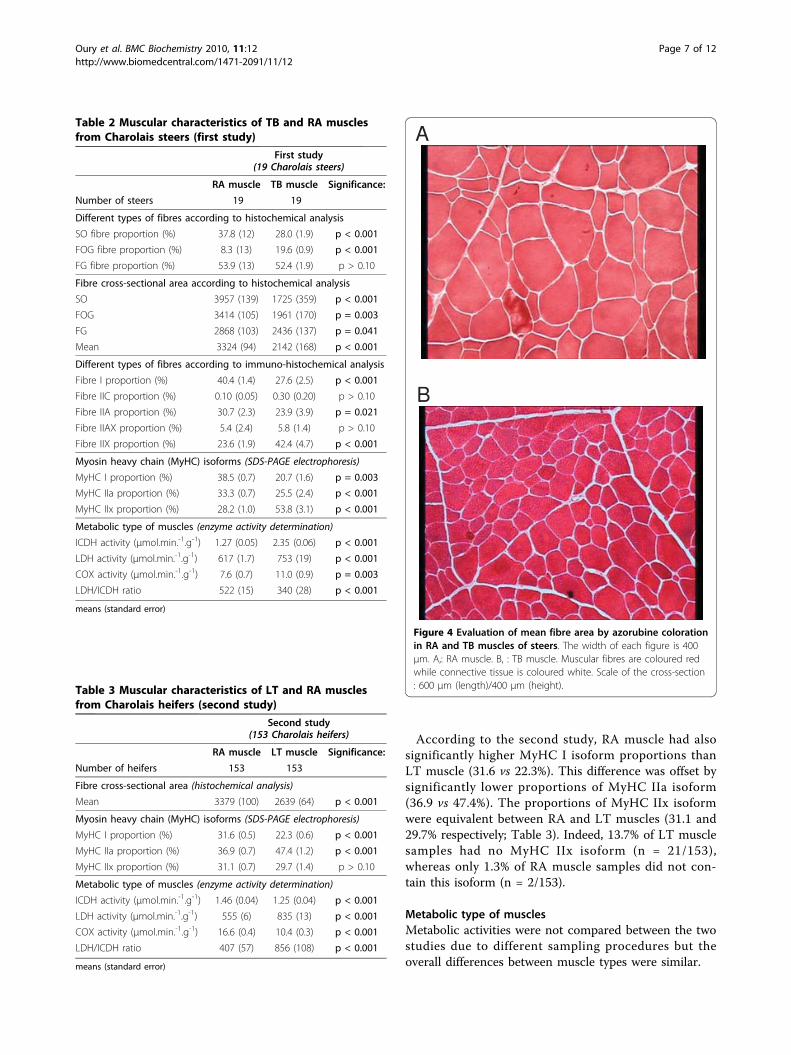
Fibre cross-sectional areaRA muscle had muscular fibres with significantly highermean surface area than those from TB (3324 vs 2142μm2; first study) and LT muscles (3379 vs 2639 μm2;second study) (Tables 2 and 3; Figure 4).According to the first study, the higher mean fibre
cross-sectional area in RA muscle was due to higher SO(3957 vs 1725 μm2), FOG (3414 vs 1961 μm2) and FG(2868 vs 2436 μm2) fibre cross-sectional areas than inTB muscle (Table 2). In addition, SO fibres were the lar-gest in RA muscle (3957 μm2) while they were the smal-lest in TB muscle (1725 μm2) (Figure 4). Conversely, inRA muscle, FG fibres were the smallest (2868 μm2)while they were the largest in TB muscle (2436 μm2). In
both muscles, FOG fibres had an intermediate surfacearea.
Proportions of I, IIA and IIX fibres(Immuno-histochemical analysis)Immuno-histochemical analysis was made in parallel tohistochemical analysis, only in the first study (Figure 5).RA muscle had significantly higher proportions of type I(40.4 vs 27.6%) and IIA (30.7 vs 23.9%) fibre than TBmuscle, offset by significantly lower IIX fibre proportions(23.6 vs 42.4%). The hybrid IIC and IIAX fibre propor-tions were very limited (5.4 to 5.8 and 0.1 to 0.3% respec-tively) and equivalent between the two muscles (Table 2).
Myosin heavy chain (MyHC) isoformsAccording to the first study, RA muscle had significantlyhigher proportions of MyHC I (38.5 vs 20.7%) andMyHC IIa (33.3 vs 25.5%) isoforms than TB muscle, off-set by significantly lower proportions of MyHC IIx iso-form (28.2 vs 53.8%; Table 2).
Figure 3 Revelation of ATPase at pH 4.2 and succinate dehydrogenase (SDH) activities in RA and TB muscles of steers. The width ofeach figure is 400 μm. A, C: RA muscle. B, D : TB muscle. A, B: revelation of ATPase activity at pH 4.2. The slow fibres (S) are coloured dark greywhile fast ones (F) are coloured white or grey. C, D: revelation of Succinate DeHydrogenase activity. The oxidative fibres (SO) are coloured darkblue while glycolytic and oxidative-glycolytic ones (FG and FOG) are coloured pale blue. Scale of the cross-section : 600 μm (length)/400 μm(height).
Oury et al. BMC Biochemistry 2010, 11:12http://www.biomedcentral.com/1471-2091/11/12
Page 6 of 12
According to the second study, RA muscle had alsosignificantly higher MyHC I isoform proportions thanLT muscle (31.6 vs 22.3%). This difference was offset bysignificantly lower proportions of MyHC IIa isoform(36.9 vs 47.4%). The proportions of MyHC IIx isoformwere equivalent between RA and LT muscles (31.1 and29.7% respectively; Table 3). Indeed, 13.7% of LT musclesamples had no MyHC IIx isoform (n = 21/153),whereas only 1.3% of RA muscle samples did not con-tain this isoform (n = 2/153).
Metabolic type of musclesMetabolic activities were not compared between the twostudies due to different sampling procedures but theoverall differences between muscle types were similar.
Table 2 Muscular characteristics of TB and RA musclesfrom Charolais steers (first study)
First study(19 Charolais steers)
RA muscle TB muscle Significance:
Number of steers 19 19
Different types of fibres according to histochemical analysis
SO fibre proportion (%) 37.8 (12) 28.0 (1.9) p < 0.001
FOG fibre proportion (%) 8.3 (13) 19.6 (0.9) p < 0.001
FG fibre proportion (%) 53.9 (13) 52.4 (1.9) p > 0.10
Fibre cross-sectional area according to histochemical analysis
SO 3957 (139) 1725 (359) p < 0.001
FOG 3414 (105) 1961 (170) p = 0.003
FG 2868 (103) 2436 (137) p = 0.041
Mean 3324 (94) 2142 (168) p < 0.001
Different types of fibres according to immuno-histochemical analysis
Fibre I proportion (%) 40.4 (1.4) 27.6 (2.5) p < 0.001
Fibre IIC proportion (%) 0.10 (0.05) 0.30 (0.20) p > 0.10
Fibre IIA proportion (%) 30.7 (2.3) 23.9 (3.9) p = 0.021
Fibre IIAX proportion (%) 5.4 (2.4) 5.8 (1.4) p > 0.10
Fibre IIX proportion (%) 23.6 (1.9) 42.4 (4.7) p < 0.001
Myosin heavy chain (MyHC) isoforms (SDS-PAGE electrophoresis)
MyHC I proportion (%) 38.5 (0.7) 20.7 (1.6) p = 0.003
MyHC IIa proportion (%) 33.3 (0.7) 25.5 (2.4) p < 0.001
MyHC IIx proportion (%) 28.2 (1.0) 53.8 (3.1) p < 0.001
Metabolic type of muscles (enzyme activity determination)
ICDH activity (μmol.min.-1.g-1) 1.27 (0.05) 2.35 (0.06) p < 0.001
LDH activity (μmol.min.-1.g-1) 617 (1.7) 753 (19) p < 0.001
COX activity (μmol.min.-1.g-1) 7.6 (0.7) 11.0 (0.9) p = 0.003
LDH/ICDH ratio 522 (15) 340 (28) p < 0.001
means (standard error)
Table 3 Muscular characteristics of LT and RA musclesfrom Charolais heifers (second study)
Second study(153 Charolais heifers)
RA muscle LT muscle Significance:
Number of heifers 153 153
Fibre cross-sectional area (histochemical analysis)
Mean 3379 (100) 2639 (64) p < 0.001
Myosin heavy chain (MyHC) isoforms (SDS-PAGE electrophoresis)
MyHC I proportion (%) 31.6 (0.5) 22.3 (0.6) p < 0.001
MyHC IIa proportion (%) 36.9 (0.7) 47.4 (1.2) p < 0.001
MyHC IIx proportion (%) 31.1 (0.7) 29.7 (1.4) p > 0.10
Metabolic type of muscles (enzyme activity determination)
ICDH activity (μmol.min.-1.g-1) 1.46 (0.04) 1.25 (0.04) p < 0.001
LDH activity (μmol.min.-1.g-1) 555 (6) 835 (13) p < 0.001
COX activity (μmol.min.-1.g-1) 16.6 (0.4) 10.4 (0.3) p < 0.001
LDH/ICDH ratio 407 (57) 856 (108) p < 0.001
means (standard error)
Figure 4 Evaluation of mean fibre area by azorubine colorationin RA and TB muscles of steers. The width of each figure is 400μm. A,: RA muscle. B, : TB muscle. Muscular fibres are coloured redwhile connective tissue is coloured white. Scale of the cross-section: 600 μm (length)/400 μm (height).
Oury et al. BMC Biochemistry 2010, 11:12http://www.biomedcentral.com/1471-2091/11/12
Page 7 of 12
Enzyme activities for ICDH (1.27 vs 2.35 μmol.min.-1.g-1),COX (7.6 vs 11.0 μmol.min.-1.g-1) and LDH (617 vs 753μmol.min.-1.g-1) were significantly lower in RA musclethan in TB muscle, reflecting a lower metabolic activity inRA muscle (first study; Table 2). The ratio between LDHand ICDH activities was significantly different between thetwo muscles, being higher for RA muscle (522 vs 340;p < 0.001) than TB muscle.The ICDH (1.46 vs 1.25 μmol.min.-1.g-1) and the COX
(16.6 vs 10.4 μmol.min.-1.g-1) oxidative enzyme activitieswere significantly higher in RA muscle than in LT mus-cle (second study). In contrast, the activity of LDH gly-colytic enzyme was significantly lower in RA muscle(555 vs 835 μmol.min.-1.g-1; Table 3). The ratio betweenLDH and ICDH activities was significantly lower for RAmuscle (407 vs 856; p < 0.001) than for LT muscle.
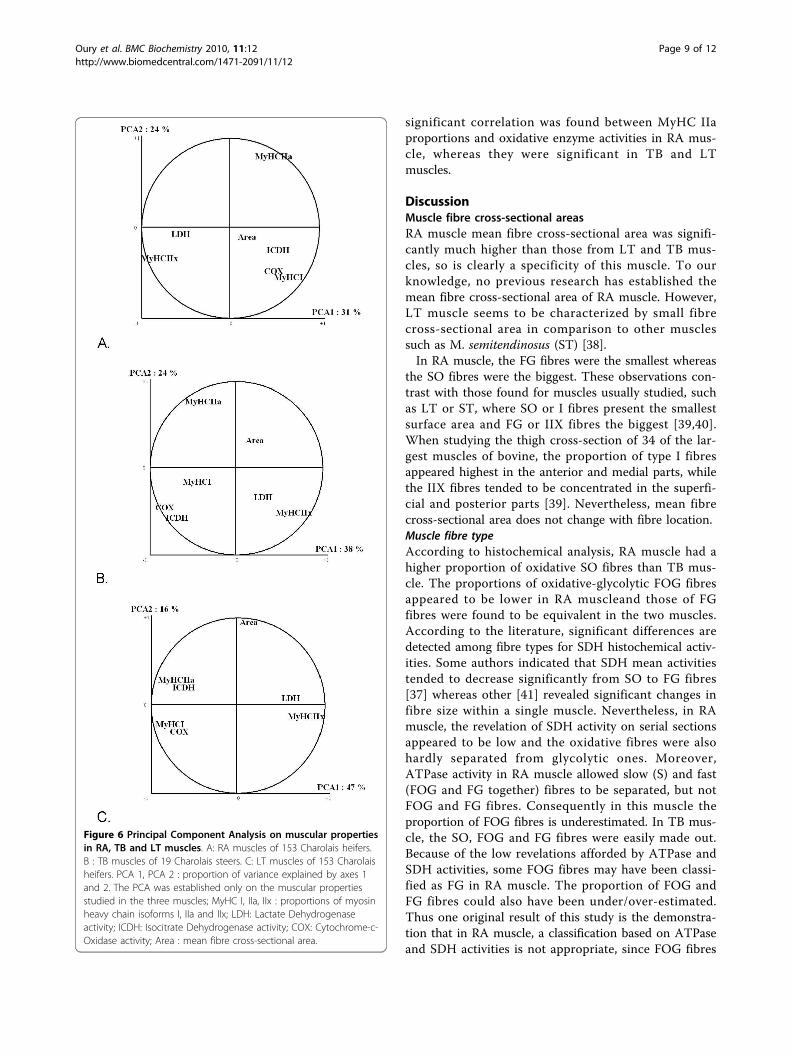
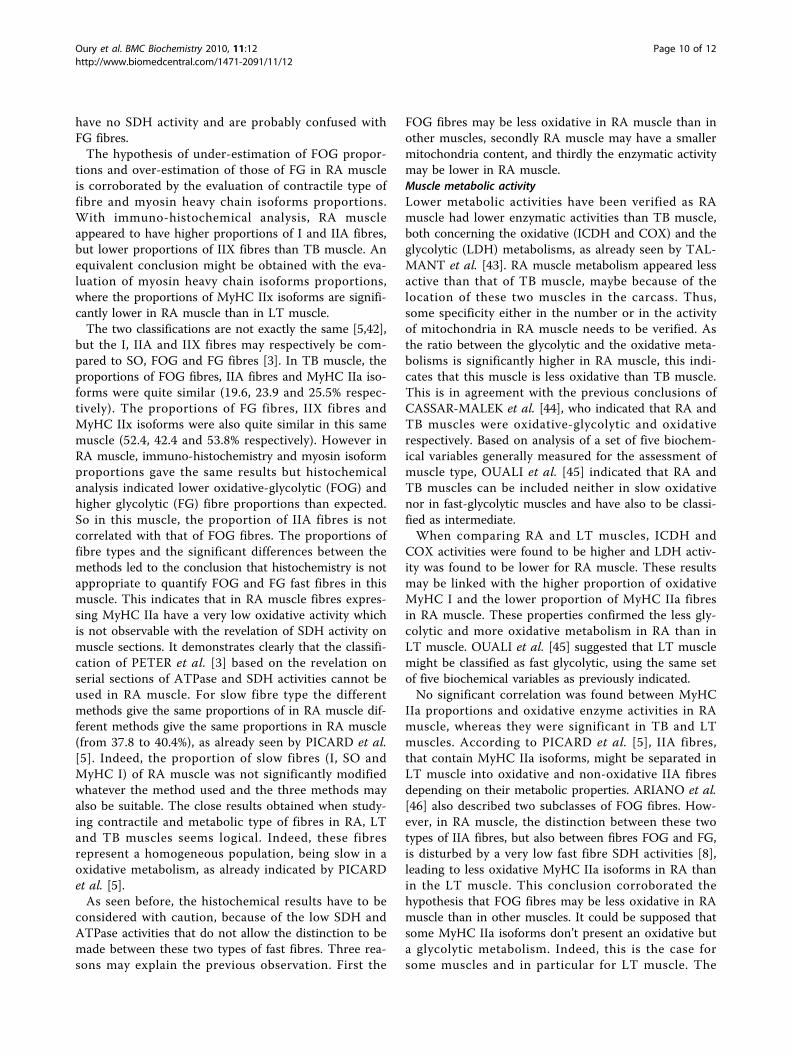
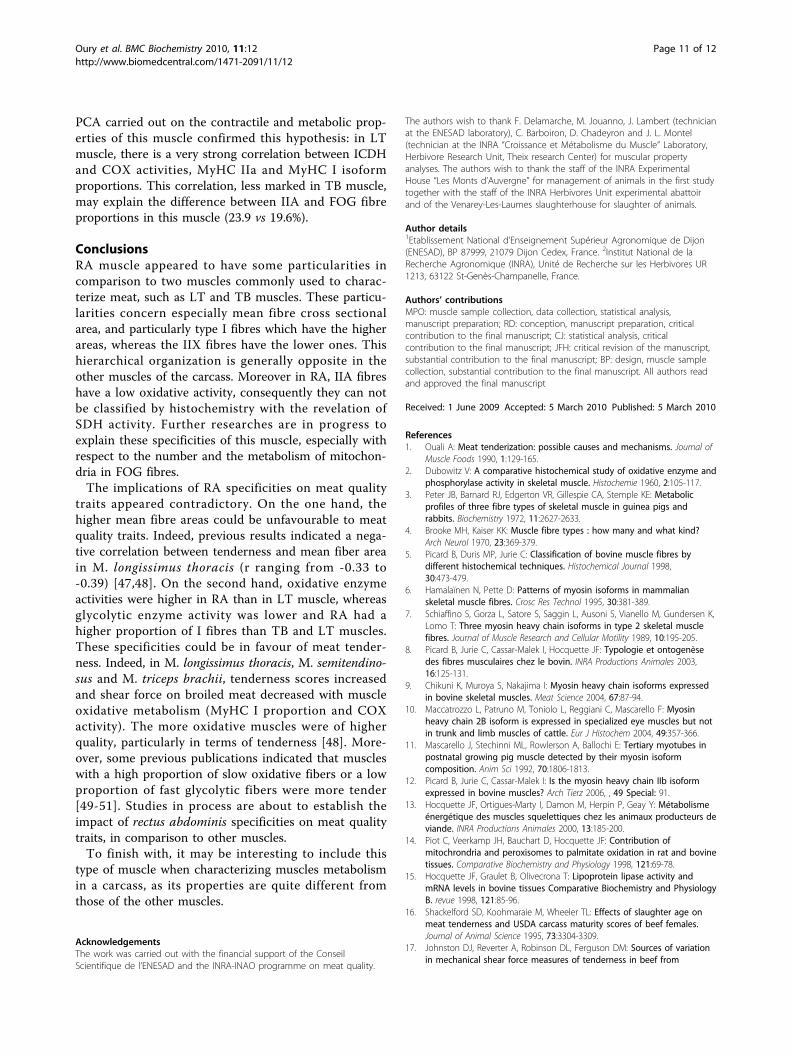
Correlation coefficients between certain muscleproperties/multivariate analysisThe relationships between muscle properties were stu-died by principal component analysis (PCA) for each ofthe three muscles separately. The dataset obtained foreach muscle was subjected to multivariate analyses tosummarize each muscle according to its contractile andmetabolic properties (Figure 6). The ability of these fea-tures to discriminate contractile and metabolic proper-ties was examined by canonical discriminant analyses.Almost 55% of the data variance was explained by thefirst two factors. The contractile and metabolic proper-ties were slightly more closely related in LT and TBmuscles than in RA since the two major principal
component axes explained respectively 62, 63 and 55%of the total variability. The first principal componentaxis was predominantly explained by the variability inmuscle metabolism. It opposed the oxidative characteris-tics (MyHC I, ICDH, COX) to glycolytic ones (MyHCIIx and LDH). In RA and TB muscles, the second prin-cipal component axis was explained by the myosin iso-form of oxidative-glycolytic fibres (MyHC IIa) whereasin LT muscle, it was explained by mean fibre cross-sec-tional area. As previously indicated by MORENO et al.[37], the three major fibre type populations (I, IIA andIIX) were clearly discriminated.MyHC I proportions were positively correlated with
ICDH and COX activities, but the correlations were sig-nificantly higher in LT (r = +0.43 and +0.54) and TBmuscles (r = +0.62 and +0.50) than in RA muscle (r =+0.31 and +0.37). Moreover, the negative correlationbetween MyHC I proportions and LDH activity was lessmarked in RA muscle (r = -0.22; p = 0.04) than in TBand LT muscle (r = -0.39 and -0.45; p < 0.001 respec-tively). In RA muscle, MyHC IIx proportions were notsignificantly correlated with LDH and COX activity, butwere negatively correlated with ICDH activity (r = -0.23;p = 0.04). In TB and LT muscles, MyHC IIx proportionswere significantly correlated with the three metabolicenzyme activities. On the one hand MyHC IIx wasfound to be positively correlated with LDH activity,while on the other hand MyHC IIx was found to benegatively correlated with ICDH and COX activities.COX and ICDH activities were positively correlated toeach other (r between +0.27 and +0.59; p < 0.01). No
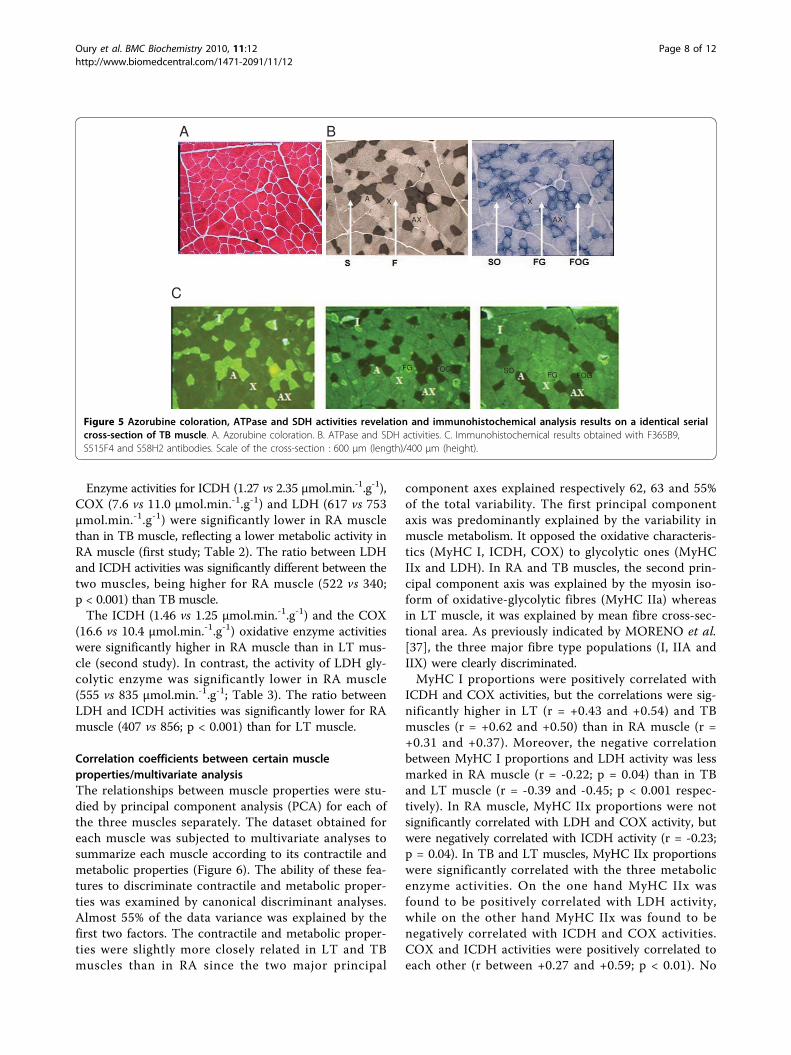
Figure 5 Azorubine coloration, ATPase and SDH activities revelation and immunohistochemical analysis results on a identical serialcross-section of TB muscle. A. Azorubine coloration. B. ATPase and SDH activities. C. Immunohistochemical results obtained with F365B9,S515F4 and S58H2 antibodies. Scale of the cross-section : 600 μm (length)/400 μm (height).
Oury et al. BMC Biochemistry 2010, 11:12http://www.biomedcentral.com/1471-2091/11/12
Page 8 of 12
significant correlation was found between MyHC IIaproportions and oxidative enzyme activities in RA mus-cle, whereas they were significant in TB and LTmuscles.
DiscussionMuscle fibre cross-sectional areasRA muscle mean fibre cross-sectional area was signifi-cantly much higher than those from LT and TB mus-cles, so is clearly a specificity of this muscle. To ourknowledge, no previous research has established themean fibre cross-sectional area of RA muscle. However,LT muscle seems to be characterized by small fibrecross-sectional area in comparison to other musclessuch as M. semitendinosus (ST) [38].In RA muscle, the FG fibres were the smallest whereas
the SO fibres were the biggest. These observations con-trast with those found for muscles usually studied, suchas LT or ST, where SO or I fibres present the smallestsurface area and FG or IIX fibres the biggest [39,40].When studying the thigh cross-section of 34 of the lar-gest muscles of bovine, the proportion of type I fibresappeared highest in the anterior and medial parts, whilethe IIX fibres tended to be concentrated in the superfi-cial and posterior parts [39]. Nevertheless, mean fibrecross-sectional area does not change with fibre location.Muscle fibre typeAccording to histochemical analysis, RA muscle had ahigher proportion of oxidative SO fibres than TB mus-cle. The proportions of oxidative-glycolytic FOG fibresappeared to be lower in RA muscleand those of FGfibres were found to be equivalent in the two muscles.According to the literature, significant differences aredetected among fibre types for SDH histochemical activ-ities. Some authors indicated that SDH mean activitiestended to decrease significantly from SO to FG fibres[37] whereas other [41] revealed significant changes infibre size within a single muscle. Nevertheless, in RAmuscle, the revelation of SDH activity on serial sectionsappeared to be low and the oxidative fibres were alsohardly separated from glycolytic ones. Moreover,ATPase activity in RA muscle allowed slow (S) and fast(FOG and FG together) fibres to be separated, but notFOG and FG fibres. Consequently in this muscle theproportion of FOG fibres is underestimated. In TB mus-cle, the SO, FOG and FG fibres were easily made out.Because of the low revelations afforded by ATPase andSDH activities, some FOG fibres may have been classi-fied as FG in RA muscle. The proportion of FOG andFG fibres could also have been under/over-estimated.Thus one original result of this study is the demonstra-tion that in RA muscle, a classification based on ATPaseand SDH activities is not appropriate, since FOG fibres
Figure 6 Principal Component Analysis on muscular propertiesin RA, TB and LT muscles. A: RA muscles of 153 Charolais heifers.B : TB muscles of 19 Charolais steers. C: LT muscles of 153 Charolaisheifers. PCA 1, PCA 2 : proportion of variance explained by axes 1and 2. The PCA was established only on the muscular propertiesstudied in the three muscles; MyHC I, IIa, IIx : proportions of myosinheavy chain isoforms I, IIa and IIx; LDH: Lactate Dehydrogenaseactivity; ICDH: Isocitrate Dehydrogenase activity; COX: Cytochrome-c-Oxidase activity; Area : mean fibre cross-sectional area.
Oury et al. BMC Biochemistry 2010, 11:12http://www.biomedcentral.com/1471-2091/11/12
Page 9 of 12
have no SDH activity and are probably confused withFG fibres.The hypothesis of under-estimation of FOG propor-
tions and over-estimation of those of FG in RA muscleis corroborated by the evaluation of contractile type offibre and myosin heavy chain isoforms proportions.With immuno-histochemical analysis, RA muscleappeared to have higher proportions of I and IIA fibres,but lower proportions of IIX fibres than TB muscle. Anequivalent conclusion might be obtained with the eva-luation of myosin heavy chain isoforms proportions,where the proportions of MyHC IIx isoforms are signifi-cantly lower in RA muscle than in LT muscle.The two classifications are not exactly the same [5,42],
but the I, IIA and IIX fibres may respectively be com-pared to SO, FOG and FG fibres [3]. In TB muscle, theproportions of FOG fibres, IIA fibres and MyHC IIa iso-forms were quite similar (19.6, 23.9 and 25.5% respec-tively). The proportions of FG fibres, IIX fibres andMyHC IIx isoforms were also quite similar in this samemuscle (52.4, 42.4 and 53.8% respectively). However inRA muscle, immuno-histochemistry and myosin isoformproportions gave the same results but histochemicalanalysis indicated lower oxidative-glycolytic (FOG) andhigher glycolytic (FG) fibre proportions than expected.So in this muscle, the proportion of IIA fibres is notcorrelated with that of FOG fibres. The proportions offibre types and the significant differences between themethods led to the conclusion that histochemistry is notappropriate to quantify FOG and FG fast fibres in thismuscle. This indicates that in RA muscle fibres expres-sing MyHC IIa have a very low oxidative activity whichis not observable with the revelation of SDH activity onmuscle sections. It demonstrates clearly that the classifi-cation of PETER et al. [3] based on the revelation onserial sections of ATPase and SDH activities cannot beused in RA muscle. For slow fibre type the differentmethods give the same proportions of in RA muscle dif-ferent methods give the same proportions in RA muscle(from 37.8 to 40.4%), as already seen by PICARD et al.[5]. Indeed, the proportion of slow fibres (I, SO andMyHC I) of RA muscle was not significantly modifiedwhatever the method used and the three methods mayalso be suitable. The close results obtained when study-ing contractile and metabolic type of fibres in RA, LTand TB muscles seems logical. Indeed, these fibresrepresent a homogeneous population, being slow in aoxidative metabolism, as already indicated by PICARDet al. [5].As seen before, the histochemical results have to be
considered with caution, because of the low SDH andATPase activities that do not allow the distinction to bemade between these two types of fast fibres. Three rea-sons may explain the previous observation. First the
FOG fibres may be less oxidative in RA muscle than inother muscles, secondly RA muscle may have a smallermitochondria content, and thirdly the enzymatic activitymay be lower in RA muscle.Muscle metabolic activityLower metabolic activities have been verified as RAmuscle had lower enzymatic activities than TB muscle,both concerning the oxidative (ICDH and COX) and theglycolytic (LDH) metabolisms, as already seen by TAL-MANT et al. [43]. RA muscle metabolism appeared lessactive than that of TB muscle, maybe because of thelocation of these two muscles in the carcass. Thus,some specificity either in the number or in the activityof mitochondria in RA muscle needs to be verified. Asthe ratio between the glycolytic and the oxidative meta-bolisms is significantly higher in RA muscle, this indi-cates that this muscle is less oxidative than TB muscle.This is in agreement with the previous conclusions ofCASSAR-MALEK et al. [44], who indicated that RA andTB muscles were oxidative-glycolytic and oxidativerespectively. Based on analysis of a set of five biochem-ical variables generally measured for the assessment ofmuscle type, OUALI et al. [45] indicated that RA andTB muscles can be included neither in slow oxidativenor in fast-glycolytic muscles and have also to be classi-fied as intermediate.When comparing RA and LT muscles, ICDH and
COX activities were found to be higher and LDH activ-ity was found to be lower for RA muscle. These resultsmay be linked with the higher proportion of oxidativeMyHC I and the lower proportion of MyHC IIa fibresin RA muscle. These properties confirmed the less gly-colytic and more oxidative metabolism in RA than inLT muscle. OUALI et al. [45] suggested that LT musclemight be classified as fast glycolytic, using the same setof five biochemical variables as previously indicated.No significant correlation was found between MyHC
IIa proportions and oxidative enzyme activities in RAmuscle, whereas they were significant in TB and LTmuscles. According to PICARD et al. [5], IIA fibres,that contain MyHC IIa isoforms, might be separated inLT muscle into oxidative and non-oxidative IIA fibresdepending on their metabolic properties. ARIANO et al.[46] also described two subclasses of FOG fibres. How-ever, in RA muscle, the distinction between these twotypes of IIA fibres, but also between fibres FOG and FG,is disturbed by a very low fast fibre SDH activities [8],leading to less oxidative MyHC IIa isoforms in RA thanin the LT muscle. This conclusion corroborated thehypothesis that FOG fibres may be less oxidative in RAmuscle than in other muscles. It could be supposed thatsome MyHC IIa isoforms don’t present an oxidative buta glycolytic metabolism. Indeed, this is the case forsome muscles and in particular for LT muscle. The
Oury et al. BMC Biochemistry 2010, 11:12http://www.biomedcentral.com/1471-2091/11/12
Page 10 of 12
PCA carried out on the contractile and metabolic prop-erties of this muscle confirmed this hypothesis: in LTmuscle, there is a very strong correlation between ICDHand COX activities, MyHC IIa and MyHC I isoformproportions. This correlation, less marked in TB muscle,may explain the difference between IIA and FOG fibreproportions in this muscle (23.9 vs 19.6%).
ConclusionsRA muscle appeared to have some particularities incomparison to two muscles commonly used to charac-terize meat, such as LT and TB muscles. These particu-larities concern especially mean fibre cross sectionalarea, and particularly type I fibres which have the higherareas, whereas the IIX fibres have the lower ones. Thishierarchical organization is generally opposite in theother muscles of the carcass. Moreover in RA, IIA fibreshave a low oxidative activity, consequently they can notbe classified by histochemistry with the revelation ofSDH activity. Further researches are in progress toexplain these specificities of this muscle, especially withrespect to the number and the metabolism of mitochon-dria in FOG fibres.The implications of RA specificities on meat quality
traits appeared contradictory. On the one hand, thehigher mean fibre areas could be unfavourable to meatquality traits. Indeed, previous results indicated a nega-tive correlation between tenderness and mean fiber areain M. longissimus thoracis (r ranging from -0.33 to-0.39) [47,48]. On the second hand, oxidative enzymeactivities were higher in RA than in LT muscle, whereasglycolytic enzyme activity was lower and RA had ahigher proportion of I fibres than TB and LT muscles.These specificities could be in favour of meat tender-ness. Indeed, in M. longissimus thoracis, M. semitendino-sus and M. triceps brachii, tenderness scores increasedand shear force on broiled meat decreased with muscleoxidative metabolism (MyHC I proportion and COXactivity). The more oxidative muscles were of higherquality, particularly in terms of tenderness [48]. More-over, some previous publications indicated that muscleswith a high proportion of slow oxidative fibers or a lowproportion of fast glycolytic fibers were more tender[49-51]. Studies in process are about to establish theimpact of rectus abdominis specificities on meat qualitytraits, in comparison to other muscles.To finish with, it may be interesting to include this
type of muscle when characterizing muscles metabolismin a carcass, as its properties are quite different fromthose of the other muscles.
AcknowledgementsThe work was carried out with the financial support of the ConseilScientifique de l’ENESAD and the INRA-INAO programme on meat quality.
The authors wish to thank F. Delamarche, M. Jouanno, J. Lambert (technicianat the ENESAD laboratory), C. Barboiron, D. Chadeyron and J. L. Montel(technician at the INRA “Croissance et Métabolisme du Muscle” Laboratory,Herbivore Research Unit, Theix research Center) for muscular propertyanalyses. The authors wish to thank the staff of the INRA ExperimentalHouse “Les Monts d’Auvergne” for management of animals in the first studytogether with the staff of the INRA Herbivores Unit experimental abattoirand of the Venarey-Les-Laumes slaughterhouse for slaughter of animals.
Author details1Etablissement National d’Enseignement Supérieur Agronomique de Dijon(ENESAD), BP 87999, 21079 Dijon Cedex, France. 2Institut National de laRecherche Agronomique (INRA), Unité de Recherche sur les Herbivores UR1213, 63122 St-Genès-Champanelle, France.
Authors’ contributionsMPO: muscle sample collection, data collection, statistical analysis,manuscript preparation; RD: conception, manuscript preparation, criticalcontribution to the final manuscript; CJ: statistical analysis, criticalcontribution to the final manuscript; JFH: critical revision of the manuscript,substantial contribution to the final manuscript; BP: design, muscle samplecollection, substantial contribution to the final manuscript. All authors readand approved the final manuscript
Received: 1 June 2009 Accepted: 5 March 2010 Published: 5 March 2010
References1. Ouali A: Meat tenderization: possible causes and mechanisms. Journal of
Muscle Foods 1990, 1:129-165.2. Dubowitz V: A comparative histochemical study of oxidative enzyme and
phosphorylase activity in skeletal muscle. Histochemie 1960, 2:105-117.3. Peter JB, Barnard RJ, Edgerton VR, Gillespie CA, Stemple KE: Metabolic
profiles of three fibre types of skeletal muscle in guinea pigs andrabbits. Biochemistry 1972, 11:2627-2633.
4. Brooke MH, Kaiser KK: Muscle fibre types : how many and what kind?Arch Neurol 1970, 23:369-379.
5. Picard B, Duris MP, Jurie C: Classification of bovine muscle fibres bydifferent histochemical techniques. Histochemical Journal 1998,30:473-479.
6. Hamalaïnen N, Pette D: Patterns of myosin isoforms in mammalianskeletal muscle fibres. Crosc Res Technol 1995, 30:381-389.
7. Schiaffino S, Gorza L, Satore S, Saggin L, Ausoni S, Vianello M, Gundersen K,Lomo T: Three myosin heavy chain isoforms in type 2 skeletal musclefibres. Journal of Muscle Research and Cellular Motility 1989, 10:195-205.
8. Picard B, Jurie C, Cassar-Malek I, Hocquette JF: Typologie et ontogenèsedes fibres musculaires chez le bovin. INRA Productions Animales 2003,16:125-131.
9. Chikuni K, Muroya S, Nakajima I: Myosin heavy chain isoforms expressedin bovine skeletal muscles. Meat Science 2004, 67:87-94.
10. Maccatrozzo L, Patruno M, Toniolo L, Reggiani C, Mascarello F: Myosinheavy chain 2B isoform is expressed in specialized eye muscles but notin trunk and limb muscles of cattle. Eur J Histochem 2004, 49:357-366.
11. Mascarello J, Stechinni ML, Rowlerson A, Ballochi E: Tertiary myotubes inpostnatal growing pig muscle detected by their myosin isoformcomposition. Anim Sci 1992, 70:1806-1813.
12. Picard B, Jurie C, Cassar-Malek I: Is the myosin heavy chain IIb isoformexpressed in bovine muscles? Arch Tierz 2006, , 49 Special: 91.
13. Hocquette JF, Ortigues-Marty I, Damon M, Herpin P, Geay Y: Métabolismeénergétique des muscles squelettiques chez les animaux producteurs deviande. INRA Productions Animales 2000, 13:185-200.
14. Piot C, Veerkamp JH, Bauchart D, Hocquette JF: Contribution ofmitochrondria and peroxisomes to palmitate oxidation in rat and bovinetissues. Comparative Biochemistry and Physiology 1998, 121:69-78.
15. Hocquette JF, Graulet B, Olivecrona T: Lipoprotein lipase activity andmRNA levels in bovine tissues Comparative Biochemistry and PhysiologyB. revue 1998, 121:85-96.
16. Shackelford SD, Koohmaraie M, Wheeler TL: Effects of slaughter age onmeat tenderness and USDA carcass maturity scores of beef females.Journal of Animal Science 1995, 73:3304-3309.
17. Johnston DJ, Reverter A, Robinson DL, Ferguson DM: Sources of variationin mechanical shear force measures of tenderness in beef from
Oury et al. BMC Biochemistry 2010, 11:12http://www.biomedcentral.com/1471-2091/11/12
Page 11 of 12
tropically adapted genotypes, effects of data editing and theirimplications for genetic parameter estimation. Austr J Exp Agric 2001,41:991-996.
18. Jurie C, Bauchart D, Culioli J, Dransfield E, Jailler R, Lepetit J, Listrat A,Martin JF, Ouali A, Geay Y, Picard B: Modifications des caractéristiques dumuscle Longissimus Thoracis chez les taurillons entre 15 et 24 mois.Rencontres, Recherche, Ruminants 2002, 9:265.
19. Jurie C, Bauchart D, Culioli J, Dransfield E, Jailler R, Lepetit J, Listrat A,Martin JF, Ouali A, Geay Y, Picard B: Les caractéristiques du muscleLongissimus Thoracis ne sont pas modifiées chez les vaches de réformeentre 4et 9 ans d’âge. Rencontres, Recherche, Ruminants 2002, 9:266.
20. Micol D, Oury MP, Picard B, Hocquette JF, Briand M, Dumont R, Egal D,Jailler R, Dubroeucq H, Agabriel J: Effect of age at castration on animalperformances, muscle characteristics and meat quality traits in 26-month-old Charolais steers. Livestock Science 2008, 120:116-126.
21. Oury MP, Agabriel J, Agabriel C, Micol D, Picard B, Blanquet JP, Roux M,Dumont R: Relationship between rearing practices and eating qualitytraits of the muscle rectus abdominis of Charolais heifers. LivestockScience 2007, 111:242-254.
22. Bevilacqua A, Zaritzky NE, Calvelo A: Histological measurements of ice infrozen beef. Journal of Food Technology 1979, 14:237-251.
23. Guth L, Samaha FJ: Qualitative differences between actomyosin ATPaseof slow and fast mammalian muscle. Exp Neurol 1969, 25:138-152.
24. Pearse AGE: Histochemistry theorical and applied London: EnglandChruchillJA 1968, 948-950.
25. Jurie C, Nedelec J, Picard B: Production des anticorps monoclonauxspécifiques des chaînes lourdes de myosine. INRA Productions Animales1998, 11:146-149.
26. Pons F, Leger J, Chevallay M, Tome F, Fardeau M, Leger J:Immunocytochemical analysis of myosin heavy chains in human fetalskeletal muscles. J Neurol Sci 1986, 76:151-163.
27. Picard B, Jurie C, Duris MP, Renand G: Consequences of selection forhigher growth rate on muscle fibre properties in cattle. LivestockProduction Sciences 2005, 102:107-120.
28. Young OA, Davey L: Electrophoretic analysis of proteins from singlebovine muscle fibres. Biochemical Journal 1981, 195:317-327.
29. Picard B, Robelin J, Geay Y: Influence of castration and postnatal energyrestriction on the contractile and metabolic characteristics of bovinemuscle. Ann Zootech 1995, 44:347-357.
30. Picard B, Barboiron C, Duris MP, Gagniere H, Jurie C, Geay Y:Electrophoretic separation of bovine muscle myosin heavy chainisoforms. Meat Science 1999, 553:1-7.
31. Laemmli UK: Cleavage of structural proteins during the assembly of thehead of the bacteriophage TA. Nature 1970, 227:680-685.
32. Ansay M: Individualité musculaire chez le bovin : étude de l’équipementenzymatique de quelques muscles. Ann Biol Anim Biochim Biophys 1974,14:471-486.
33. Briand M, Tamant A, Briand Y, Monin G, Durand B: Metabolic types ofmuscle in the sheep: I myosin ATPase glycolytic and mitochondrialenzyme activities. Eur J Appl Physiol 1981, 46:347-358.
34. SAS Institute: Guide for Personal Computers. Version 91 Cary NC : SASInstitute 2002.
35. Hocquette JF, Bas P, Bauchart D, Vermorel M, Geay Y: Fat partitioning andbiochemical characteristics of fatty tissues in relation to plasmametabolites and hormones in normal and double-muscled younggrowing bulls. Comparative Biochemistry and Physiology A 1999,122:127-138, Erratum,. Comparative Biochemistry and Physiology A 1999,123 : 311-312..
36. Cassar-Malek I, Picard B, Kahl S, Hocquette JF: Relationships betweenthyroid status, tissue oxidative metabolism, and muscle differentiation inbovine fetuses. Domestic Animal Endocrinology 2007, 33(1):91-106.
37. Moreno-Sanchez N, Diaz C, Carabano MJ, Rueda J, Rivero JLL: Acomprehensive characterisation of the fibre composition and propertiesof a limb (Flexor digitorum superficialis, membri thoraci) and a trunk(Psoas major) muscle in cattle. BMC Cell Biology 2009, 9-67.
38. Jurie C, Martin JF, Listrat A, Jailler R, Culioli J, Picard B: Effects of age andbreed of beef bulls on growth parameters, carcass and musclecharacteristics. Animal Science 2005, 80:257-263.
39. Totland GK, Kryvi H: Distribution patterns of muscle fibre types in majormuscles of the bull (Bos taurus). Anatomy and Embryology 1991,184:441-450.
40. Picard B, Lefaucheur L, Berri C, Duclos MJ: Muscle fibre ontogenesis infarm animal species. Reproduction Nutrition Development 2002, 42:415-431.
41. Rivero JL, Galisteo AM, Aguera : Skeletal muscle histochemistry in maleand female. Am J Vet Res 1993 1993, 54:675-680.
42. Staron RS, Pette D: Correlation betweeen myofibrillar ATPase activity andmyosin heavy chain composition in rabbit muscle fibres. Histochemestry1986, 86:19-23.
43. Talmant A, Monin G, Briand M, Dadet M, Briand Y: Activities of metabolicand contractile enzymes in 18 bovine muscles. Meat Science 1986,18:23-40.
44. Cassar-Malek I, Hocquette JF, Jurie C, Listrat A, Jailler R, Bauchart D,Briand Y, Picard B: Muscle-specific metabolic, histochemical andbiochemical responses to a nutritionally induced discontinuous growthpath. Animal Science 2004, 204:79-59.
45. Ouali A, Sentandreu MA, Aubry L, Boudjellal A, Tassy C, Geesink GH, Farias-Maffet G: Meat toughness as affected by muscle type. Indicators of milkand beef quality Wageningen: The NetherlandsHocquette JF, Gigli S 2005,447-451.
46. Ariano MA, Amstrong RB, Edgerton VR: Hindlimb muscle fibre populationsof five mammals. Journal of Histochemical Cytochemistry 1973, 21:51-55.
47. Seideman SC: Methods of expressing collagen characteristics and theirrelationship to meat tenderness and muscle fiber types. Journal of FoodScience 1986, 51:273-276.
48. Renand G, Picard B, Touraille C, Berge P, Lepetit J: Relationships betweenmuscle characteristics and meat quality traits of young Charolais bulls.Meat Science 2001, 59:49-60.
49. Dransfield E, Martin JF, Bauchart D, Abouelkaram S, Lepetit J, Culioli J,Jurie C, Picard B: Meat quality and composition of three muscles fromFrench cull cows and young bulls. Animal Science 2003, 76:387-399.
50. Ockerman HW, Jaworek D, Van Stavern B, Parrett N, Pierson CJ: Castrationand sire effects on carcass traits, meat palatability and muscle fibercharacteristics in Angus cattle. Journal of Animal Science 1984, 59:981-990.
51. Strydom PE, Naude RT, Smith MF, Scholtz MM, Van Wyk JB:Characterisation of indigenous African cattle breeds in relation to meatquality traits. Meat Science 2000, 55:79-88.
doi:10.1186/1471-2091-11-12Cite this article as: Oury et al.: Specific fibre composition andmetabolism of the rectus abdominis muscle of bovine Charolais cattle.BMC Biochemistry 2010 11:12.
Submit your next manuscript to BioMed Centraland take full advantage of:
• Convenient online submission
• Thorough peer review
• No space constraints or color figure charges
• Immediate publication on acceptance
• Inclusion in PubMed, CAS, Scopus and Google Scholar
• Research which is freely available for redistribution
Submit your manuscript at www.biomedcentral.com/submit
Oury et al. BMC Biochemistry 2010, 11:12http://www.biomedcentral.com/1471-2091/11/12
Page 12 of 12