Spatio-temporal variation of flood vulnerability at the Poyang Lake Ecological Economic Zone,...
10
Provided for non-commercial research and educational use only. Not for reproduction or distribution or commercial use. This article was originally published by IWA Publishing. IWA Publishing recognizes the retention of the right by the author(s) to photocopy or make single electronic copies of the paper for their own personal use, including for their own classroom use, or the personal use of colleagues, provided the copies are not offered for sale and are not distributed in a systematic way outside of their employing institution. Please note that you are not permitted to post the IWA Publishing PDF version of your paper on your own website or your institution’s website or repository. Please direct any queries regarding use or permissions to [email protected]
-
Upload
independent -
Category
Documents
-
view
3 -
download
0
Transcript of Spatio-temporal variation of flood vulnerability at the Poyang Lake Ecological Economic Zone,...

Provided for non-commercial research and educational use only. Not for reproduction or distribution or commercial use.
This article was originally published by IWA Publishing. IWA Publishing recognizes the retention of the right by the author(s) to photocopy or make single electronic
copies of the paper for their own personal use, including for their own classroom use, or the personal use of colleagues, provided the copies are not offered for sale and
are not distributed in a systematic way outside of their employing institution.
Please note that you are not permitted to post the IWA Publishing PDF version of your paper on your own website or your institution’s website or repository.
Please direct any queries regarding use or permissions to [email protected]
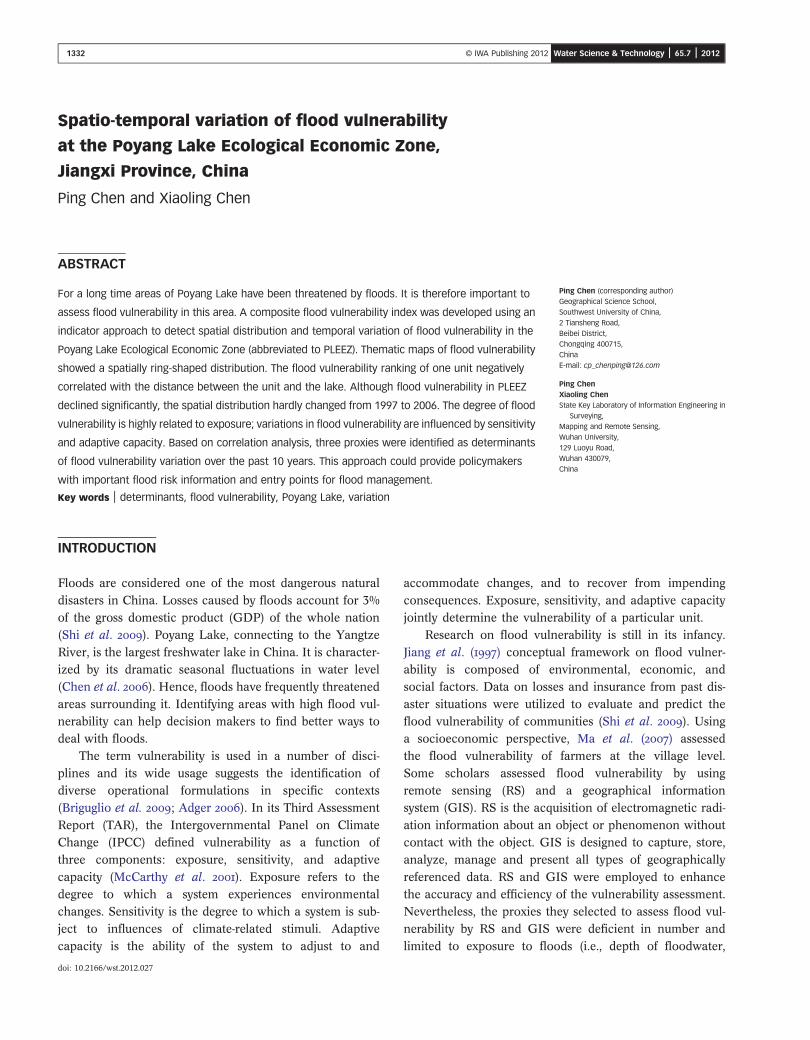
1332 © IWA Publishing 2012 Water Science & Technology | 65.7 | 2012
Spatio-temporal variation of flood vulnerability
at the Poyang Lake Ecological Economic Zone,
Jiangxi Province, China
Ping Chen and Xiaoling Chen
ABSTRACT
For a long time areas of Poyang Lake have been threatened by floods. It is therefore important to
assess flood vulnerability in this area. A composite flood vulnerability index was developed using an
indicator approach to detect spatial distribution and temporal variation of flood vulnerability in the
Poyang Lake Ecological Economic Zone (abbreviated to PLEEZ). Thematic maps of flood vulnerability
showed a spatially ring-shaped distribution. The flood vulnerability ranking of one unit negatively
correlated with the distance between the unit and the lake. Although flood vulnerability in PLEEZ
declined significantly, the spatial distribution hardly changed from 1997 to 2006. The degree of flood
vulnerability is highly related to exposure; variations in flood vulnerability are influenced by sensitivity
and adaptive capacity. Based on correlation analysis, three proxies were identified as determinants
of flood vulnerability variation over the past 10 years. This approach could provide policymakers
with important flood risk information and entry points for flood management.
doi: 10.2166/wst.2012.027
Ping Chen (corresponding author)Geographical Science School,Southwest University of China,2 Tiansheng Road,Beibei District,Chongqing 400715,ChinaE-mail: [email protected]
Ping ChenXiaoling ChenState Key Laboratory of Information Engineering in
Surveying,Mapping and Remote Sensing,Wuhan University,129 Luoyu Road,Wuhan 430079,China
Key words | determinants, flood vulnerability, Poyang Lake, variation
INTRODUCTION
Floods are considered one of the most dangerous natural
disasters in China. Losses caused by floods account for 3%of the gross domestic product (GDP) of the whole nation(Shi et al. ). Poyang Lake, connecting to the Yangtze
River, is the largest freshwater lake in China. It is character-ized by its dramatic seasonal fluctuations in water level(Chen et al. ). Hence, floods have frequently threatened
areas surrounding it. Identifying areas with high flood vul-nerability can help decision makers to find better ways todeal with floods.
The term vulnerability is used in a number of disci-
plines and its wide usage suggests the identification ofdiverse operational formulations in specific contexts(Briguglio et al. ; Adger ). In its Third Assessment
Report (TAR), the Intergovernmental Panel on ClimateChange (IPCC) defined vulnerability as a function ofthree components: exposure, sensitivity, and adaptive
capacity (McCarthy et al. ). Exposure refers to thedegree to which a system experiences environmentalchanges. Sensitivity is the degree to which a system is sub-ject to influences of climate-related stimuli. Adaptive
capacity is the ability of the system to adjust to and
accommodate changes, and to recover from impending
consequences. Exposure, sensitivity, and adaptive capacityjointly determine the vulnerability of a particular unit.
Research on flood vulnerability is still in its infancy.
Jiang et al. () conceptual framework on flood vulner-ability is composed of environmental, economic, andsocial factors. Data on losses and insurance from past dis-
aster situations were utilized to evaluate and predict theflood vulnerability of communities (Shi et al. ). Usinga socioeconomic perspective, Ma et al. () assessedthe flood vulnerability of farmers at the village level.
Some scholars assessed flood vulnerability by usingremote sensing (RS) and a geographical informationsystem (GIS). RS is the acquisition of electromagnetic radi-
ation information about an object or phenomenon withoutcontact with the object. GIS is designed to capture, store,analyze, manage and present all types of geographically
referenced data. RS and GIS were employed to enhancethe accuracy and efficiency of the vulnerability assessment.Nevertheless, the proxies they selected to assess flood vul-nerability by RS and GIS were deficient in number and
limited to exposure to floods (i.e., depth of floodwater,
1333 P. Chen & X. Chen | Spatio-temporal variation of flood vulnerability Water Science & Technology | 65.7 | 2012
population distribution, and elevation) (Sanyal & Lu ;
Forte et al. ). Socioeconomic factors were disregarded.Vulnerability is a set of conditions and processes resultingfrom biophysical and socioeconomic factors that increase
the susceptibility of a community to the impact of hazards(Kumpulainen ). In this paper we assess flood vulner-ability by combining more biophysical proxies offered bythe RS technique and socioeconomic proxies, which were
specialized and organized by GIS.Spatio-temporal variation is an inherent property of
vulnerability. Biophysical and socioeconomic processes
determine the spatio-temporal variation of vulnerability(Cutter & Finch ). More localized analyses have pro-vided understanding of situations in areas experiencing
significant changes in vulnerability (Sonmez et al. ;Cutter & Finch ). These researchers paid moreattention to how and where vulnerability changes. In thisstudy we focus on what affects flood vulnerability by analys-
ing the variations of flood vulnerability and its componentsof exposure, sensitivity and adaptive capacity.
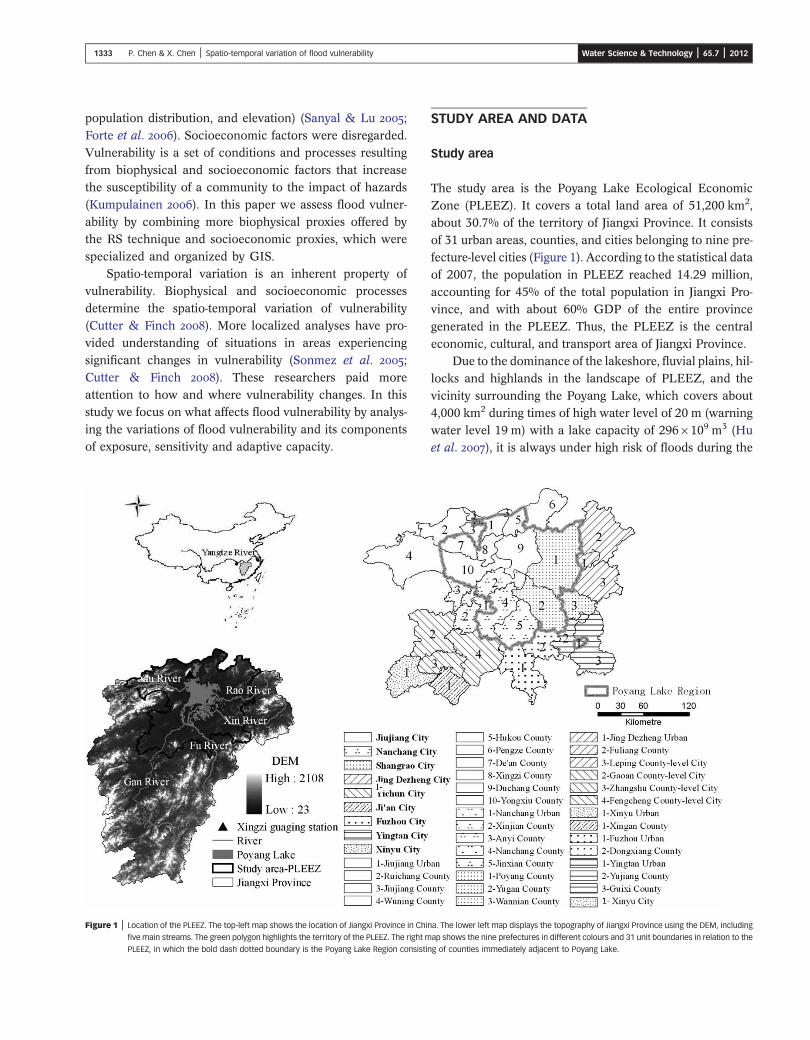
Figure 1 | Location of the PLEEZ. The top-left map shows the location of Jiangxi Province in Chi
five main streams. The green polygon highlights the territory of the PLEEZ. The right m
PLEEZ, in which the bold dash dotted boundary is the Poyang Lake Region consisti
STUDY AREA AND DATA
Study area
The study area is the Poyang Lake Ecological EconomicZone (PLEEZ). It covers a total land area of 51,200 km2,about 30.7% of the territory of Jiangxi Province. It consists
of 31 urban areas, counties, and cities belonging to nine pre-fecture-level cities (Figure 1). According to the statistical dataof 2007, the population in PLEEZ reached 14.29 million,
accounting for 45% of the total population in Jiangxi Pro-vince, and with about 60% GDP of the entire provincegenerated in the PLEEZ. Thus, the PLEEZ is the central
economic, cultural, and transport area of Jiangxi Province.Due to the dominance of the lakeshore, fluvial plains, hil-
locks and highlands in the landscape of PLEEZ, and the
vicinity surrounding the Poyang Lake, which covers about4,000 km2 during times of high water level of 20 m (warningwater level 19 m) with a lake capacity of 296 × 109 m3 (Huet al. ), it is always under high risk of floods during the
na. The lower left map displays the topography of Jiangxi Province using the DEM, including
ap shows the nine prefectures in different colours and 31 unit boundaries in relation to the
ng of counties immediately adjacent to Poyang Lake.

1334 P. Chen & X. Chen | Spatio-temporal variation of flood vulnerability Water Science & Technology | 65.7 | 2012
summer rainy season. Five major rivers (Xiu River, Gan
River, Fu River, Xin River, and Rao River) of the PoyangLake watershed all flow into the lake. However, the lake’soutlet is not wide enough to drain floodwater into the
Yangtze River. Floodwater from the five main streams andthe Yangtze River leads to frequent floods in the lake. From1950 to 2005, flood events occurred 46 times (1.25 year inter-vals) in the Poyang Lake region (Wang et al. ). Accordingto Huang et al. () and the observed data from Xingzigauging station, from 1980 to 2009 the annual maximumwater level has exceeded the warning water level 19 times.
Data preparation
In 1998, a great flood occurred in the south of China. Thehigh number of casualties and economic losses exceeded his-toric records in the PLEEZ. We therefore selected data from1997 to 2006 to investigate whether flood vulnerability has
changed during those periods. The definition of vulnerabilityby IPCC was applied to measure flood vulnerability. A totalof 20 proxies were selected to represent exposure, sensitivity,
and adaptive capacity to floods Table 1. In Table 1, ‘þ ’ and‘� ’ denote positive and negative correlation betweenproxies and flood vulnerability, respectively. For example,
the higher the assessment of farmers’ income in a certainunit, meaning they are more financially able to recover
Table 1 | List of proxies for construction of the flood vulnerability index (FVI)
Component Indicator Proxy (Pi, i¼ 1–20)
Exposure Precipitation Annual average rainfall þRatio of rainfall in wet season þ
Topography Elevation more than 23 m (% of totAverage slope –
Hydrology Drainage density þSurface runoff coefficient þ
Demographicdistribution
Population density þ
Sensitivity Soil Soil type þVegetation Woodland coverage rate –
Agriculture Cultivated land ratio (% of total areFishery Fishery production þInfrastructure Infrastructure investment –Demographicstructure
Farming population ratio (% of totaMarginalized population ratio aged
years old (% of total) þAdaptive
capacityEducation Illiteracy rate (% of population overMedical resource Medical resources per 104 populatioIncome Annual income of farmer –
Annual income of urban worker –Finance Deposit of financial institutions per
GDP per capita –
quickly from flood disasters, the lower the vulnerability to
floods is in the unit. Therefore, the annual income of a farm-ing population negatively correlates with flood vulnerability.The data set of biophysical features included was processed
by ArcGIS 9.0, designed by ESRI, Inc.In Table 1, the information on elevation and slope was
extracted from the digital elevation model (DEM) with ascale of 1:250,000 (at 100 m resolution). The proxy
of elevation was based on the percentage of areaswith elevation higher than 23 m out of the total area of oneunit. An elevation of 23 m is relatively safe against flood as
the historic highest water level was 22.58 m in 1998. Averageslope is the mean value of the slope of one unit.
Due to the different units and domains of the data sets,
all proxies were normalized into a domain ranging from 0 to1 based on the followed equation:
Pij ¼P0ij �min (P0
ij)
max (P0ij)�min (P0
ij)
(ð1Þ
Pij ¼ 1�P0ij �min (P0
ij)
max (P0ij)�min (P0
ij)
(ð2Þ
where Pij is a normalized value of proxy i of unit j, and P0ij is
the raw data of proxy i of units j. The proxies denoted by ‘þ ’
were transformed by Equation (1); and the proxies labelled
Data source
Weather stations
al area) – DEM (1:250,000)DEM (1:250,000)National Topography DatasetPaper (Chen )Statistical yearbooks
Chinese Soil Thematic Map (1:4,000,000)Chinese natural resources database(1998), Statistical yearbooks (2007)
a) þ Statistical yearbooks
l population) þamong 0–14 and >60 Fifth National Census Data
15) þn – Statistical yearbooks
capita –

1335 P. Chen & X. Chen | Spatio-temporal variation of flood vulnerability Water Science & Technology | 65.7 | 2012
‘� ’ by Equation (2) to ensure a positive correlation between
flood vulnerability and these proxies.
METHODS
An indicator approach was chosen to construct a compositeflood vulnerability index (FVI) because of its extensive appli-
cations and feasibility in various scales.
Constructing the flood vulnerability index
Analytic hierarchy process (AHP) was chosen to determinethe weights of the proxies. The assessment was comprisedfour hierarchies: overall goal (assessing flood vulnerability),
criteria (three components of vulnerability), sub-criteria (14indicators), and alternatives (20 proxies) (Table 2). Com-bined with expert suggestions and achievements of pastresearch on flood risk in the Poyang Lake watershed (Fu
et al. ; Gao et al. ), the priority matrices werederived and numerically expressed by pairwise comparisons.Consistency ratios of the matrices were calculated and
passed a check of the judgements. The calculated weightsof each proxy are shown in Table 2 where Pi (i¼ 1–20) rep-resents the 20 proxies, which are numbered in the order
that they appear in Table 1.
Table 2 | Weights of proxies yielded by the AHP method
Component Indicator Proxy Wi
Exposure 0.424 P1∼P7 0.199 0.500 0.0420.500 0.042
0.290 0.600 0.0740.400 0.049
0.167 0.500 0.0350.500 0.035
0.344 1.000 0.146
Sensitivity 0.288 P8∼P10 0.065 1.000 0.0190.107 1.000 0.0310.351 1.000 0.101
Sensitivity 0.288 P11–P14 0.217 1.000 0.0620.125 1.000 0.0360.134 0.500 0.019
0.500 0.019
Adaptive capacity 0.288 P15–P20 0.119 1.000 0.0340.134 1.000 0.0390.456 0.800 0.105
0.200 0.0260.291 0.600 0.050
0.400 0.034
The 20 proxies were aggregated with the weights to con-
struct a composite FVI as follows:
FVIj ¼ FVE þ FVS þ FVAC ¼X20i¼1
Pij ×Wi (3)
where FVIj is the FVI of unit j, FVE is flood exposure, FVS isflood sensitivity and FVAC is flood adaptive capability of unit
j. They were calculated by proxies belonging to the threecomponents respectively and their weights. Pij is the normal-ized value of proxy i of unit j; Wi is the weight of proxy i.
Identifying flood vulnerability ranking
The FVI of 1997 and 2006 was divided into quarters andthen scored from 1 to 4. A score of 1 was defined as low vul-nerability; 2 as medium vulnerability; 3 as high vulnerability;
and 4 as the highest vulnerability.
Identifying determinants of flood vulnerability variation
Pearson’s correlation analysis between the difference of FVI
and the difference of the values of the proxies of the 31 unitsfor nine 1-year periods from 1997 to 2006 was conducted todetect whether statistically significant relationships existed
between the vulnerability variation and the proxies. If so,the key proxies were identified as determinants of the vari-ation of flood vulnerability. Statistical software SPSS13.0was used for the correlation analysis.
RESULTS AND DISCUSSION
Temporal variations of flood vulnerability
FVIs of each unit in PLEEZ from 1997 to 2006 were calcu-lated and illustrated by a line chart. In order to reveal the
FVI characteristics of these units, they were categorizedinto three groups called A, B and C according to the FVIaverages of each unit in the 10 years. In Figure 2 the X-axis
represents the years from 1997 to 2006 and the Y-axis rep-resents FVI ranging from 0.325 to 0.748. Every line showsthe variation of FVI of one unit. At the bottom of Figure 2,UA is the abbreviation for urban area, C for county and
CLC for county-level city. The line chart demonstrates adecreasing trend of flood vulnerability. Statistical analysisrevealed that the FVIs of 20 units in PLEEZ in 2006 reached
their minimums within the decade and so did that of fiveunits in 2005. The FVIs in a few units, such as Yugan C,

Figure 2 | Line charts of FVIs of the 31 units in PLEEZ from 1997 to 2006 UA: urban area; C: county; CLC: county-level city.
1336 P. Chen & X. Chen | Spatio-temporal variation of flood vulnerability Water Science & Technology | 65.7 | 2012
Poyang C, Xinjian C, Zhangshu CLC, increased in thedecade. It is concluded that despite the FVIs of a few coun-ties increasing, from 1997 to 2006 flood vulnerability in
most areas of the PLEEZ had been decreasing.
Spatial distribution of vulnerability and its components
The FVI and its three components of the units in 1997 and2006 were selected to analyze the spatial distribution of
flood vulnerability in the PLEEZ. They were categorizedby the equal-interval method into four rankings: low,medium, high, and highest. The thematic maps of rankingsrevealed the spatial distribution of flood vulnerability
(Figure 3). Spatial distribution and variations of exposure,sensitivity, and adaptive capability jointly determined floodvulnerability. Figure 3 displays a low-outer and high-inner
ringed pattern of exposure and sensitivity. The rankings ofthe exposure of 31 units did not change between 1997 and2006. Flood sensitivity was generally ranked high in 1997.
In 2006, the number of units with low sensitivity increasedto eight and high sensitivity decreased from 14 to 10. Adap-tive capacity was clearly demonstrated in the low-northeast
and high-southwest areas in the PLEEZ. This is partlyassociated with notable differences and polarization in theeconomy at the Poyang Lake region. Economic develop-ment in the eastern region of Poyang Lake fell behind
compared with the western region (Gan et al. ).Although adaptive capacity increased in 2006, it still main-tained the spatial distribution pattern.
As shown in the FVI maps in Figure 3, the ranking offlood vulnerability in the PLEEZ ascended from the
periphery to the interior of the PLEEZ with a ring-shaped distribution. The most vulnerable unit was Nan-chang County in 1997 and 2006. It is one of the most
densely populated counties in the PLEEZ (520 peopleper km2 in 2006). Its low average elevation also exposesit to greater flood hazards. A high cultivated land ratioof over 40% and a developed fishing industry make this
unit highly sensitive to floods. The rankings of exposureand sensitivity of Nanchang County therefore were high-est in 1997 and 2006 (Figure 3). Its economic
development has been far behind that of other units. In2006, its GDP per capita was about 800 US dollars, farbelow the average of the counties in the PLEEZ. There-
fore, its adaptive capacity could not effectively decreaseits flood vulnerability. Wuning County was one of thecounties with low vulnerability in the PLEEZ in 1997and 2006. Despite a high farmer ratio in the area (89%),
it had the lowest population (104 people per km2 in2006), a relatively high elevation compared with otherunits, and the largest average slope (11W) referring to the
DEM in Figure 1, which effectively reduced its exposureto flood and flood vulnerability.
According to the spatial distribution of the flood vul-
nerability and its components, the extent of floodvulnerability is highly related to exposure, and variationsin flood vulnerability are influenced by sensitivity and adap-
tive capacity. Consequently, special flood disastermanagement schemes should be laid out for each unitaccording to their degree of flood exposure, sensitivityand adaptive capability. For example, at the centre of the
PLEEZ attention should be given to mitigating sensitivity
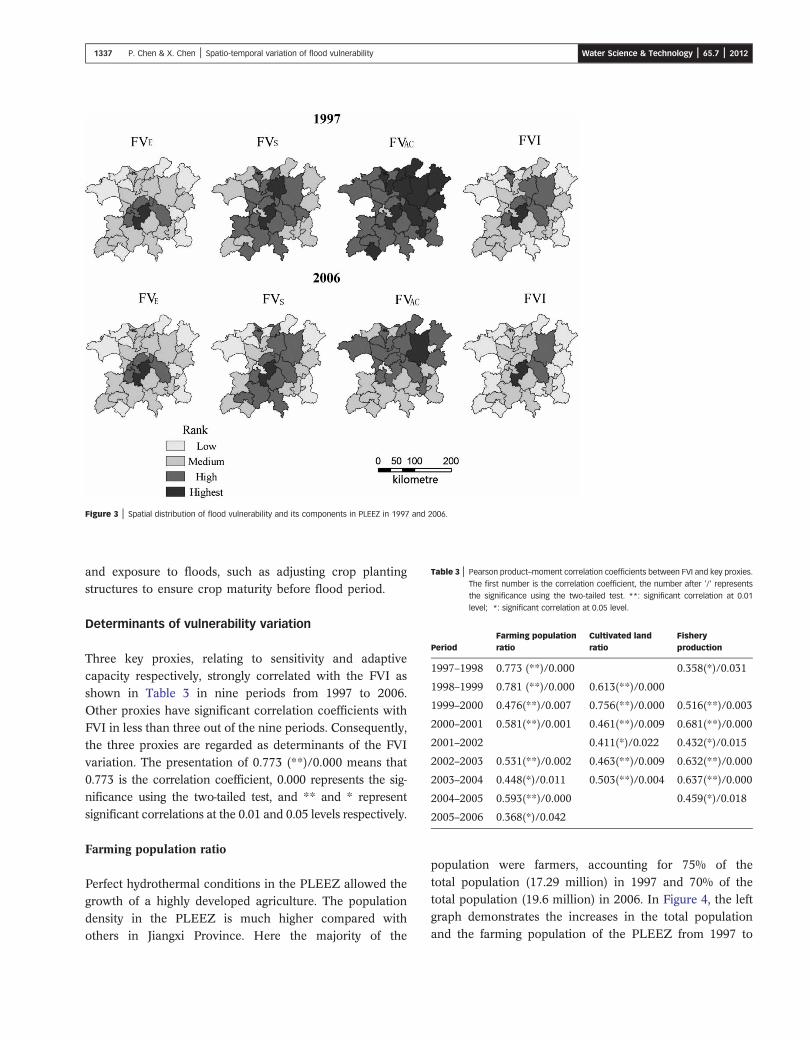
Table 3 | Pearson product–moment correlation coefficients between FVI and key proxies.
The first number is the correlation coefficient, the number after '/' represents
the significance using the two-tailed test. **: significant correlation at 0.01
level; *: significant correlation at 0.05 level.
PeriodFarming populationratio
Cultivated landratio
Fisheryproduction
1997–1998 0.773 (**)/0.000 0.358(*)/0.031
1998–1999 0.781 (**)/0.000 0.613(**)/0.000
1999–2000 0.476(**)/0.007 0.756(**)/0.000 0.516(**)/0.003
2000–2001 0.581(**)/0.001 0.461(**)/0.009 0.681(**)/0.000
2001–2002 0.411(*)/0.022 0.432(*)/0.015
2002–2003 0.531(**)/0.002 0.463(**)/0.009 0.632(**)/0.000
2003–2004 0.448(*)/0.011 0.503(**)/0.004 0.637(**)/0.000
2004–2005 0.593(**)/0.000 0.459(*)/0.018
2005–2006 0.368(*)/0.042
Figure 3 | Spatial distribution of flood vulnerability and its components in PLEEZ in 1997 and 2006.
1337 P. Chen & X. Chen | Spatio-temporal variation of flood vulnerability Water Science & Technology | 65.7 | 2012
and exposure to floods, such as adjusting crop plantingstructures to ensure crop maturity before flood period.
Determinants of vulnerability variation
Three key proxies, relating to sensitivity and adaptivecapacity respectively, strongly correlated with the FVI asshown in Table 3 in nine periods from 1997 to 2006.
Other proxies have significant correlation coefficients withFVI in less than three out of the nine periods. Consequently,the three proxies are regarded as determinants of the FVI
variation. The presentation of 0.773 (**)/0.000 means that0.773 is the correlation coefficient, 0.000 represents the sig-nificance using the two-tailed test, and ** and * represent
significant correlations at the 0.01 and 0.05 levels respectively.
Farming population ratio
Perfect hydrothermal conditions in the PLEEZ allowed thegrowth of a highly developed agriculture. The population
density in the PLEEZ is much higher compared withothers in Jiangxi Province. Here the majority of the
population were farmers, accounting for 75% of the
total population (17.29 million) in 1997 and 70% of thetotal population (19.6 million) in 2006. In Figure 4, the leftgraph demonstrates the increases in the total population
and the farming population of the PLEEZ from 1997 to

Figure 4 | The line charts of average farming population ratio and FVI of PLEEZ from 1997 to 2006.
1338 P. Chen & X. Chen | Spatio-temporal variation of flood vulnerability Water Science & Technology | 65.7 | 2012
2006. The lower growth rate of the farming population com-
pared with the total population led to a decrease in thefarming population ratio during the decade. The rightgraph shows the line charts of the average farming popu-
lation ratio and the average FVI, which decreased atalmost equal rate. Farmers are the most vulnerable groupin the PLEEZ because agriculture in the floodplain of
Poyang Lake is particularly sensitive to floods. The decreasein the proportion of farmers in a unit resulted in a reductionin the sensitivity to flood of the unit. Meanwhile, the slowgrowth of the farming population as the area of cultivated
land decreased effectively relieved the planting pressureson cultivated land, which helped to maintain the quality ofland and the income of farmers.
Cultivated land ratio
The cultivated land ratio reflects the proportion of farmland
area to the total area of a unit. In the Poyang Lake region,the main types of land cover and land use include cultivatedland, woodland, water, urban or built-up land and barren
land. Along with the economic development in thePLEEZ, the transformations within these types of landcover and land use were bound to happen. Among these
types, cultivated land is the most sensitive to floods becausethe crops are in a critical period of maturation during theflood season. The loss of cultivated land is relativelyhigher than that of others. From 1997 to 2006, the area of
the cultivated land had reduced by 7.9%, about 82061 ha,which was almost changed into the built-up land with theurbanization process in PLEEZ (Ni et al. ). Hence,
the sensitivity to floods of a unit would be lower due tothe reduction in the area of cultivated land.
Fishery production
Fisheries are a significant livelihood for populations livingaround Poyang Lake. Fisheries are a special field because
on the one hand they increase the income of the people;on the other hand, they heighten their risk to potentialeconomic losses from floods. Fishing activities in the
PLEEZ consist of wild fisheries and farmed fisheries. Inrecent years, wild fish resources have been severelydegraded in Poyang Lake (Yu & Sun ). Farmed fish-eries have a much higher yield than wild fisheries. The
indicator of fishery production mainly reflected the outputfrom farmed fisheries. Floodwater often causes fish toescape from the nurseries, which results in high economic
losses even if wild fisheries recuperate a small portion ofthe losses. For example, due to the great flood in 1998,the production of wild fisheries in the PLEEZ increased
to 70,000 tons, doubling the yield compared with the1990s. That growth primarily came from fish escapingfrom farmed fisheries. This makes fishery production an
important element in assessing flood sensitivity in thePLEEZ.
Due to the absence of literature on the flood vulner-ability of the PLEEZ, we compared the results of this
study with previous investigations on flood vulnerabilityin the Poyang Lake region. Our results on the spatial distri-bution of flood vulnerability agreed with that of Ma et al.() who focused on the flood vulnerability of farmersat the village level and concluded that more than 55% ofvillages in highly vulnerable areas were situated in the
east. Jiang et al. () discovered that land cover patternsand land cover changes in the Poyang Lake region over thelast 20 years accompanied a general decline in flood
1339 P. Chen & X. Chen | Spatio-temporal variation of flood vulnerability Water Science & Technology | 65.7 | 2012
vulnerability, which concurs with our conclusion. How-
ever, Jiang’s study paid more attention to the delineationof land cover pattern and changes and the other factorsaffecting flood vulnerability were neglected.
CONCLUSIONS
In this study, the feasibility of using a composite index to
reveal the spatio-temporal variation of flood vulnerabilityin the PLEEZ was investigated. It is concluded that thisapproach is useful for assessing flood vulnerability. Flood
vulnerability in the PLEEZ is spatially distributed in aring-shaped pattern and is negatively correlated with the dis-tance between one unit and the lake. The pattern of spatial
distribution was almost unchanged from 1997 and 2006,although the flood vulnerability in the PLEEZ decreased.Three key proxies were identified as the determinants offlood vulnerability in this specific decade at the county level.
This study presents a cost-effective and efficient way togenerate maps showing the spatial distribution of floodvulnerability by using RS and GIS techniques. It is con-
venient to compare flood vulnerability across differentperiods and space. Furthermore, this approach is widelyapplicable at different scales because the main data sources
including statistical data, remotely sensed images, andmeteorological data are readily available and the linearaggregation of proxies can be calculated simply. The
unavailability of some socioeconomic data, such as insur-ance, building quality, level of flood protection andmanagement, restricted our ability to produce more highlyaccurate results about flood vulnerability. The difficulty of
spatializing socioeconomic data in grid type prevents usfrom revealing the spatial information within a unit andthe ranking of vulnerability transited abruptly at boundaries
between units. Despite these limits, the study has resulted ina reasonably accurate spatial distribution of flood vulner-ability. It provides policymakers with the basis for
identifying highly vulnerable units and a way to find keyindicators dominating the variation of flood sensitivity andadaptive capability, in order to reduce flood vulnerability.
ACKNOWLEDGEMENTS
This work was funded by National Key Basic Research Pro-
gram (2009CB723905) the National Natural ScienceFoundation of China project (41071261).
REFERENCES
Adger, W. N. Vulnerability. Global Environmental Change16 (3), 268–281.
Briguglio, L., Cordina, G., Farrugia, N. & Vella, S. Economicvulnerability and resilience concepts and measurements.Oxford Development Studies 37 (3), 229–247.
Chen, M. Q., Cai, H. S. & Huang, L. ComprehensiveEvaluation of Natural Factors Fragile of Eco-environmentalin Poyang Lake Region. Chinese Journal of Eco-Agriculture13 (4), 181–183.
Chen, X. L., Li, H., Bao, S. M., Wu, Z. Y., Fu, W. J., Cai, X. B. &Zhao, H. M. RS and GIS based study on landscapepattern change in the Poyang Lake wetland area, China.Geoinformatics Proceeding of SPIE 6419, 64192E1–64192E7.
Cutter, S. L. & Finch, C. Temporal and spatial changes insocial vulnerability to natural hazards. Proceedings of theNational Academy of Sciences of the United States ofAmerica 105 (7), 2301–2306.
Forte, F., Strobl, R. O. & Pennetta, L. A. Methodology usingGIS, aerial photos and remote sensing for loss estimation andflood vulnerability analysis in the Supersano-Ruffano-Nociglia Graben, southern Italy. Environmental Geology 50(4), 581–594.
Fu, C., Chen, J. & Zhang, Y. P. Study on relationship betweenloss of flood disaster and development of social economy inPoyang Lake area. Journal of Jiangxi Normal University(Natural Science) 31 (5), 541–544.
Gan, R., Zheng, L.&Wang,W. A study on temporal and spatialpattern ineconomydifference inPoyangLake region. Journal ofJiangxi Agricultural University (Social Science) 7 (4), 86–89.
Gao, J., Nickum, J. E. & Pan, Y. An assessment of flood hazardvulnerability in the Dongting Lake Region of China. Lake andReservoirs: Research and Management 12 (1), 27–34.
Hu, K. D., He, Y. L. & Luo, S. L. Hydrological and climaticcharacters in Poyang Lake region. Available from: http://www.jxwmw.cn/zhuantipind/system/2007/12/23/010021422.shtml (accessed 1 July 2011).
Huang, S. E., Zhang, Y. Z. & Gu, X. Q. Poyanghu flooddisaster system study basing on remote sensing andgeographical information system. Jiangxi MeteorologicalScience and Technology 4 (26), 44–46.
Jiang, L., Bergen, K. M., Brown, D. G., Zhao, T., Tian, Q. & Qi, S. Land-cover change and vulnerability to flooding nearPoyang Lake, Jiangxi Province, China. PhotogrammetricEngineering and Remote Sensing 74 (6), 1–12.
Jiang, T., Xu, P. & Xu, G. Conceptual framework of floodvulnerability. Disaster Reduction in China 7 (2), 24–29.
Kumpulainen, S. Vulnerability concepts in hazard and riskassessment. Geological Survey of Finland, Spatial Paper 42,65–74.
Ma, D. G., Chen, J., Zhang, W. J., Zheng, L. & Liu, Y. Farmers’ vulnerability to flood risk: a case study in thePoyang Lake region. Journal of Geographical Sciences 17 (3),269–284.

1340 P. Chen & X. Chen | Spatio-temporal variation of flood vulnerability Water Science & Technology | 65.7 | 2012
McCarthy, J. J., Canziani, O. F., Leary, N. A., Dokken, D. J. &White, K. S. Climate change 2001: Impacts, adaptationand vulnerability. Available from: http://www.grida.no/publications/other/ipcc_tar/?src=/climate/ipcc_tar/wg2/index.htm (accessed 1 Feb 2011).
Ni, L. Q., & Gan, X. H. A study on land use and economicdevelopment in Poyang Lake region. Prices Monthly 19 (5),19–23.
Sanyal, J. & Lu, X. X. Remote sensing and GIS-based floodvulnerability assessment of human settlements: a case studyof Gangetic West Bengal, India. Hydrological Progresses 19(18), 3699–3716.
Shi, Y., Xu, S., Shi, C., Sun, A. & Wang, J. A review ondevelopment of vulnerability assessment of floods. Progressin Geography 28 (1), 41–46.
Sonmez, F. K., Komuscu, A. U., Erkan, A. & Turgu, E. Ananalysis of spatial and temporal dimension of droughtvulnerability in Turkey using the standardized precipitationindex. Natural Hazards 35 (2), 243–264.
Wang, F., Wu, D. & LI, R. Analysis on flood disastercharacteristics in Lake Poyang Region. Journal of LakeSciences 20 (4), 500–506.
Yu, Z. & Sun, S. Fishery resources in Poyang Lake. ChineseFisheries Economics 5, 43–46.
First received 25 May 2012; accepted in revised form 2 December 2011