Spatial patterns of soil biological and physical properties in a ridge tilled and a ploughed Luvisol
8
Spatial patterns of soil biological and physical properties in a ridge tilled and a ploughed Luvisol Evelyn Mu ¨ ller a, *, Holger Wildhagen a , Michael Quintern a , Ju ¨ rgen Heß b , Florian Wichern c , Rainer Georg Joergensen c a Department of Soil Science, University of Kassel, Nordbahnhofstr. 1a, 37213 Witzenhausen, Germany b Department of Organic Farming and Cropping, University of Kassel, Nordbahnhoftr. 1a, 37213 Witzenhausen, Germany c Department of Soil Biology and Plant Nutrition, University of Kassel, Nordbahnhofstr. 1a, 37213 Witzenhausen, Germany 1. Introduction Tillage systems have to fulfil several main purposes in modern agriculture. Primarily, they loosen the soil and incorporate plant residues or other amendments. In the best case, tillage manage- ment prepares an optimum seed bed for germination and further crop growth (Pikul et al., 2001). Furthermore, tillage system should minimize erosion and pathogens (Henriksen et al., 2007) and provide an optimum weed control, which is especially important in organic agriculture (Dick, 1997). Tillage systems differ according to their invasion depth and intensity (Paul et al., 1999), their residue distribution (Kandeler et al., 1999), their impact on soil water supply, aeration, and soil biota (Franzluebbers et al., 1995; Liebig et al., 1995; Dick, 1997; Limon-Ortega et al., 2002). An essential precondition for sustainable agriculture is a knowledge of these tillage induced impacts on the soils (Rahman et al., 2008). The mouldboard ploughing system is the most common agricultural tillage system in the world. The advantages are, e.g. deep loosening of the soil, incorporation of plant residues into deeper layers, mechanical weed control and a homogeneous plane seed bed (Ha ˚ kansson et al., 1998). Disadvantages are the development of plough pans with high bulk density, resulting in poor conditions for C and N mineralization (Reicosky and Archer, 2007), as well as high inputs of fuel and workload. The ridge tillage system is not as common but is also established throughout the world. In general, the ridges are formed with sheets of metal or rollers and the ridges stay in the same position in the field for years and are mounted again in the following spring (Benjamin et al., 1990). Permanent ridges provide a better water (Benjamin et al., 1990) and temperature environ- ment (Bargar et al., 1999) for plant emergence and further plant growth, compared to flat soil surfaces. A lower bulk density has additional positive effects on root growth (Liebig et al., 1993; Pikul et al., 2001). In Germany, the ridge tillage system is mainly used for potato (Solanum tuberosum) cultivation due to facilitated harvest. However, the ridge tillage system can also be used for cereals, legumes or vegetables (Tisdall and Hodgson, 1990; Borin and Sartori, 1995; Nokes et al., 1997). The positive attributes have resulted in a growing interest in ridge tillage, especially in organic agriculture. In the tillage system of Turiel, the ridges are formed with a ridger and stay on the field from sowing to harvest of the crop. They are reformed in the next year on the former furrow Soil & Tillage Research xxx (2009) xxx–xxx ARTICLE INFO Article history: Received 21 January 2009 Received in revised form 24 May 2009 Accepted 27 May 2009 Keywords: Turiel Bulk density Microbial biomass C Microbial biomass N ABSTRACT The present study was conducted to determine the spatial heterogeneity of bulk density, soil moisture, inorganic N, microbial biomass C, and microbial biomass N in the ridge tillage system of Turiel compared to conventional mouldboard ploughing on three sampling dates in May, July, and August. The soil sampling was carried out under vegetation representing the ridge in a high spatial resolution down the soil profile. Bulk density increased with depth and ranged from 1.3 g cm 3 at 10 cm depth to 1.6 g cm 3 at 35 cm in ploughed plots and from 1.0 g m 3 at 5 cm to 1.4 g m 3 at 35 cm in the ridges. In the ploughed plots, the contents of microbial biomass C and microbial biomass N remained roughly constant at 215 and 33 mgg 1 soil, respectively, throughout the experimental period. The microbial biomass C/N ratio varied in a small range around 6.4. In the ridged plots, the contents of microbial biomass C and microbial biomass N were 5% and 6% higher compared to the ploughed plots. Highest microbial biomass C contents of roughly 300 mgg 1 soil were always measured in the crowns in July. The lowest contents of microbial biomass C of 85–137 mgg 1 soil were measured in the furrows. The ridges showed strong spatial heterogeneity in bulk density, soil water content, inorganic nitrogen and microbial biomass. ß 2009 Elsevier B.V. All rights reserved. * Corresponding author. Tel.: +49 5542 98 1518. E-mail address: [email protected] (E. Mu ¨ ller). G Model STILL-2681; No of Pages 8 Please cite this article in press as: Mu ¨ ller, E., et al., Spatial patterns of soil biological and physical properties in a ridge tilled and a ploughed Luvisol. Soil Tillage Res. (2009), doi:10.1016/j.still.2009.05.011 Contents lists available at ScienceDirect Soil & Tillage Research journal homepage: www.elsevier.com/locate/still 0167-1987/$ – see front matter ß 2009 Elsevier B.V. All rights reserved. doi:10.1016/j.still.2009.05.011
-
Upload
independent -
Category
Documents
-
view
6 -
download
0
Transcript of Spatial patterns of soil biological and physical properties in a ridge tilled and a ploughed Luvisol

Soil & Tillage Research xxx (2009) xxx–xxx
G Model
STILL-2681; No of Pages 8
Spatial patterns of soil biological and physical propertiesin a ridge tilled and a ploughed Luvisol
Evelyn Muller a,*, Holger Wildhagen a, Michael Quintern a, Jurgen Heß b,Florian Wichern c, Rainer Georg Joergensen c
a Department of Soil Science, University of Kassel, Nordbahnhofstr. 1a, 37213 Witzenhausen, Germanyb Department of Organic Farming and Cropping, University of Kassel, Nordbahnhoftr. 1a, 37213 Witzenhausen, Germanyc Department of Soil Biology and Plant Nutrition, University of Kassel, Nordbahnhofstr. 1a, 37213 Witzenhausen, Germany
A R T I C L E I N F O
Article history:
Received 21 January 2009
Received in revised form 24 May 2009
Accepted 27 May 2009
Keywords:
Turiel
Bulk density
Microbial biomass C
Microbial biomass N
A B S T R A C T
The present study was conducted to determine the spatial heterogeneity of bulk density, soil moisture,
inorganic N, microbial biomass C, and microbial biomass N in the ridge tillage system of Turiel compared
to conventional mouldboard ploughing on three sampling dates in May, July, and August. The soil
sampling was carried out under vegetation representing the ridge in a high spatial resolution down the
soil profile. Bulk density increased with depth and ranged from 1.3 g cm�3 at 10 cm depth to 1.6 g cm�3
at 35 cm in ploughed plots and from 1.0 g m�3 at 5 cm to 1.4 g m�3 at 35 cm in the ridges. In the
ploughed plots, the contents of microbial biomass C and microbial biomass N remained roughly constant
at 215 and 33 mg g�1 soil, respectively, throughout the experimental period. The microbial biomass C/N
ratio varied in a small range around 6.4. In the ridged plots, the contents of microbial biomass C and
microbial biomass N were 5% and 6% higher compared to the ploughed plots. Highest microbial biomass
C contents of roughly 300 mg g�1 soil were always measured in the crowns in July. The lowest contents of
microbial biomass C of 85–137 mg g�1 soil were measured in the furrows. The ridges showed strong
spatial heterogeneity in bulk density, soil water content, inorganic nitrogen and microbial biomass.
� 2009 Elsevier B.V. All rights reserved.
Contents lists available at ScienceDirect
Soil & Tillage Research
journal homepage: www.elsev ier .com/ locate /s t i l l
1. Introduction
Tillage systems have to fulfil several main purposes in modernagriculture. Primarily, they loosen the soil and incorporate plantresidues or other amendments. In the best case, tillage manage-ment prepares an optimum seed bed for germination and furthercrop growth (Pikul et al., 2001). Furthermore, tillage system shouldminimize erosion and pathogens (Henriksen et al., 2007) andprovide an optimum weed control, which is especially important inorganic agriculture (Dick, 1997). Tillage systems differ according totheir invasion depth and intensity (Paul et al., 1999), their residuedistribution (Kandeler et al., 1999), their impact on soil watersupply, aeration, and soil biota (Franzluebbers et al., 1995; Liebiget al., 1995; Dick, 1997; Limon-Ortega et al., 2002). An essentialprecondition for sustainable agriculture is a knowledge of thesetillage induced impacts on the soils (Rahman et al., 2008).
The mouldboard ploughing system is the most commonagricultural tillage system in the world. The advantages are, e.g.deep loosening of the soil, incorporation of plant residues into
* Corresponding author. Tel.: +49 5542 98 1518.
E-mail address: [email protected] (E. Muller).
Please cite this article in press as: Muller, E., et al., Spatial patternsploughed Luvisol. Soil Tillage Res. (2009), doi:10.1016/j.still.2009.05
0167-1987/$ – see front matter � 2009 Elsevier B.V. All rights reserved.
doi:10.1016/j.still.2009.05.011
deeper layers, mechanical weed control and a homogeneous planeseed bed (Hakansson et al., 1998). Disadvantages are thedevelopment of plough pans with high bulk density, resulting inpoor conditions for C and N mineralization (Reicosky and Archer,2007), as well as high inputs of fuel and workload.
The ridge tillage system is not as common but is alsoestablished throughout the world. In general, the ridges areformed with sheets of metal or rollers and the ridges stay in thesame position in the field for years and are mounted again in thefollowing spring (Benjamin et al., 1990). Permanent ridges providea better water (Benjamin et al., 1990) and temperature environ-ment (Bargar et al., 1999) for plant emergence and further plantgrowth, compared to flat soil surfaces. A lower bulk density hasadditional positive effects on root growth (Liebig et al., 1993; Pikulet al., 2001). In Germany, the ridge tillage system is mainly used forpotato (Solanum tuberosum) cultivation due to facilitated harvest.However, the ridge tillage system can also be used for cereals,legumes or vegetables (Tisdall and Hodgson, 1990; Borin andSartori, 1995; Nokes et al., 1997). The positive attributes haveresulted in a growing interest in ridge tillage, especially in organicagriculture. In the tillage system of Turiel, the ridges are formedwith a ridger and stay on the field from sowing to harvest of thecrop. They are reformed in the next year on the former furrow
of soil biological and physical properties in a ridge tilled and a.011

Fig. 2. Ridge scheme with sampled positions and depths under faba bean (Vicia faba
L.) in 2007.
E. Muller et al. / Soil & Tillage Research xxx (2009) xxx–xxx2
G Model
STILL-2681; No of Pages 8
positions. The question is whether some of the positive attributesof the permanent ridge tillage system can be integrated into that ofTuriel, resulting in better conditions for plant emergence andfurther growth, compared to the mouldboard ploughing system.The objective was to study the spatial patterns of soil biological andphysical properties down the profile at different positions of theridges in the Turiel tillage system in comparison with aconventional mouldboard ploughing system.
2. Materials and methods
2.1. Site description and experimental design
The research was conducted on the experimental site ‘‘Linden-breite’’ at the Hessian State Domain Frankenhausen in northernHesse, Germany (518240 N, 98250 E, 248 m a.s.l.). Samples weretaken on 16 May, 10 July, and 20 August 2007. During theexperimental period, precipitation was 366 mm and meantemperature was 16.6 8C, ranging from 4 to 25 8C. The total annualrainfall was 932 mm in 2007. The mean annual rainfall is 650 mmand the mean annual temperature 8.5 8C. The soil was a HaplicLuvisol on loess. The texture was 2% sand, 81% silt, and 17% clay at0–30 cm depth. The pH (CaCl2) was 6.8, soil organic C and total Nwere 1.1% and 0.1%, respectively.
The field experiment was established in 2002, comparingconventional mouldboard ploughing down to 25 cm depth withthe ridge till system of Turiel and the shallow mouldboard Ecomatsystem of Kverneland (down to 7 cm). The present experiment isfocused on a comparison of conventional mouldboard ploughingwith the Turiel system. The field trial was carried out as a fullyrandomized block design with four blocks and the two factors tillagesystem and crop. The field trial consisted of 36 plots with a total areaof 2.85 ha. The size of the ridged plots was 13.5 m� 35 m and thesize of the other plots 12 m � 35 m. Crop rotation was biennialgrass–clover followed by wheat (Triticum aestivum L.), intercrop(green manure), potato (Solanum tuberosum L.), intercrop (greenmanure), faba bean (Vicia faba L., variety ‘‘Gloria’’) and barley(Hordeum vulgare L.). In 2007, faba bean was investigated on ridgedand ploughed plots. Faba bean was sown on 4 April on ploughed (50germinable seeds m2) and on 14 April 2007 on ridged plots. Theridges with green manure were split off and the new ridges wereformed and sown on the previous year’s furrow position.
2.2. Soil sampling and bulk density
For estimating the bulk density, four soil plots of 50 cm � 50 cmon ploughed and 25 cm � 50 cm on ridged plots were cleared ofvegetation on eight faba bean plots in April 2007. On the ploughedplots, four cylinders (100 cm3) were taken at each depth from thesoil surface, from 5, 15, 25 and 35 cm depth. On the ridged plots,the contour had to be taken into consideration (Fig. 1). The soil
Fig. 1. Sampling scheme for bulk density in ridges. Squares show position of the
sampling cylinders.
Please cite this article in press as: Muller, E., et al., Spatial patternsploughed Luvisol. Soil Tillage Res. (2009), doi:10.1016/j.still.2009.05
samples were taken under the crown (5, 15, 25, 35 cm depth) andin the west furrow (5, 15, 25, 30 cm depth) from the soil surface.For the first depth at the crown, the top 5 cm of the soil wereremoved. Three cylinders according to the defined diameter of theridge surface were placed west, middle and east on that surfacewith four replicates, respectively. For the 15 and 25 cm depthanother 5 cm of the soil was removed in each case, resulting in alarger surface because of the sinusoidal form of the ridge.According to the larger diameter of the ridge, four cylinders weretaken with four replicates, respectively. Under the crown at 35 cmdepth, just one row in the middle of the former ridge was sampled.In the furrows, soil samples were taken in line at each depth withfour replicates. Wheel-tracked areas in the plots were excludedfrom sampling.
The soil sampling for estimating microbial biomass, mineralnitrogen and soil water content was carried out with a soil auger(1.5 cm diameter) under vegetation. In ridged plots, a rasteraccording to the ridge contour was used (Fig. 2). On the evaluatedridge nine positions with intervals of 10 cm linear distance weremarked, from west to east: furrow 1 (F1), furrow 2 (F2), shoulder 1(S1), shoulder 2 (S2), crown (Cr), shoulder 3 (S3), shoulder 4 (S4),furrow 3 (F3), and furrow 4 (F4). The original soil surface onploughed plots was the reference elevation (=0.0 m) for the soildepths on the ridge. In ridged and ploughed plots soil samples weretaken in 10 cm sections to a depth of 30 cm. At least tensubsamples were mixed to proved one bulked soil sample. Onthe ridges, where the positions S2, Cr and S3 rose above thereference elevation, additional samples were taken in each case(Cr: 10–0 cm; S: 5–0 cm).
2.3. Microbial biomass
Microbial biomass C and microbial biomass N were estimatedby the chloroform-fumigation-extraction method (Brookes et al.,1985; Vance et al., 1987) using the pre-extraction procedure ofMueller et al. (1992) to exclude living roots from the samples. Forpre-extraction, 30 g of moist soil was weighed in two polyethylenebottles, one for the fumigated and one for non-fumigatedtreatment. Then, the soil was shaken horizontally with 100 mlof 0.05 M K2SO4 at 200 rpm for 30 min. The soil suspension wastransferred completely into beakers with a further 25 ml of0.05 M K2SO4. All visible roots, root fragments and foreign materialwere picked out and weighed. In a second step the suspension wasstirred and transferred completely into filters with 25 ml of 0.05 MK2SO4. For fumigation, the filters with the extracted soil wereimmediately fumigated for 24 h at 25 8C with ethanol-free CHCl3.The non-fumigated samples were left in the filters over night. Thefumigated and non-fumigated soil in the filters was extractedagain with 100 ml of 0.5 M K2SO4 by horizontal shaking at 200 rpmfor 30 min. Organic C was measured with a Dima-TOC 100automatic analyzer (Dimatec, Essen, Germany). The amount of themicrobial biomass was calculated as EC/kEC, where EC = (organic C
of soil biological and physical properties in a ridge tilled and a.011

E. Muller et al. / Soil & Tillage Research xxx (2009) xxx–xxx 3
G Model
STILL-2681; No of Pages 8
extracted from fumigated soils) � (extracted organic C from non-fumigated soils) and kEC = 0.45 (Wu et al., 1990; Joergensen, 1996).The N of the microbial biomass was calculated as EN/kEN, whereEN = (extracted total N from fumigated soils) � (extracted total Nfrom non-fumigated soils) and kEN = 0.54 (Brookes et al., 1985;Joergensen and Mueller, 1996).
Inorganic nitrogen was the sum of nitrate (NO3�) and
ammonium (NH4+) and determined in the pre-extracts and in
the non-fumigated extracts of the chloroform-fumigation-extrac-tion procedure. Ion concentrations were measured with acontinuous flow analyzer (Evolution II auto analyzer, AllianceInstruments, Cergy – Pontoise, France). All results are based onoven-dried soil (105 8C, approximately 24 h).
3. Results
3.1. Ploughed plots
Bulk density increased with soil depth (Fig. 3a). The valuesranged from 1.3 g cm�3 at 10 cm depth to 1.6 g cm�3 at 35 cmdepth. The inorganic N content ranged from 4.6 mg kg�1 soil at20 cm depth in July to 11.1 mg kg�1 soil at 30 cm in May.Differences in concentrations between the three months weregenerally low. The soil water content ranged from 15% at 30 cmdepth in July to 19% at 0–10 cm depth in May (Fig. 4a). At 10 and30 cm depth, the contents of microbial biomass C (Fig. 5a) andmicrobial biomass N (Fig. 5b) remained roughly constant at 215
Fig. 3. (a) Bulk density (g cm�3) in ploughed plots under faba bean (Vicia faba L.) in
2007. (b) Bulk densities (g cm�3) in ridged plots under furrow in 2007.
Fig. 4. (a) Contents of inorganic nitrogen in ploughed plots under faba bean (Vicia
faba L.) in 2007. (b) Soil water contents in ploughed plots under faba bean (Vicia faba
L.) in 2007.
Please cite this article in press as: Muller, E., et al., Spatial patternsploughed Luvisol. Soil Tillage Res. (2009), doi:10.1016/j.still.2009.05
and 33 mg g�1 soil, respectively, throughout the experimentalperiod. At 20 cm depth, the contents of microbial biomass C andmicrobial biomass N showed a significant 8% and 4% increase inJuly. Throughout the experimental period, the microbial biomass C,the microbial biomass N and the inorganic N contents were highlysignificantly correlated (data not shown). The microbial biomass C/N ratio varied in a small range around 6.4.
3.2. Ridged plots
In the furrows of the ridged plots (Fig. 3b), bulk density rangedfrom 1.0 at 10 cm depth to 1.5 g cm�3 at 30 cm depth, both valuesmeasured in May. Bulk density was highest at 10 and 20 cm depthin July and at 30 cm in May. Excluding the furrows, bulk densityalways increased down the profile from 1.0 to 1.4 g cm�3 at 35 cmdepth (Fig. 6). In May, different areas of same bulk densities werefound. The most pronounced area (1.0 g cm�3) was at 12–18 cmdepth with a well-defined ridge scheme. Bulk densities were lowerin the outer rows than in the middle of the ridge (rows 2–3). Below25 cm depth, the areas with same bulk density formed linearbands. In July, the ridge was solidified down to 30 cm depth, thebands became larger and moved downwards. At 18 cm depth, theinner rows showed slightly higher bulk densities than the rows atthe edges. In August, the ridge showed nearly the same pattern asin July.
of soil biological and physical properties in a ridge tilled and a.011
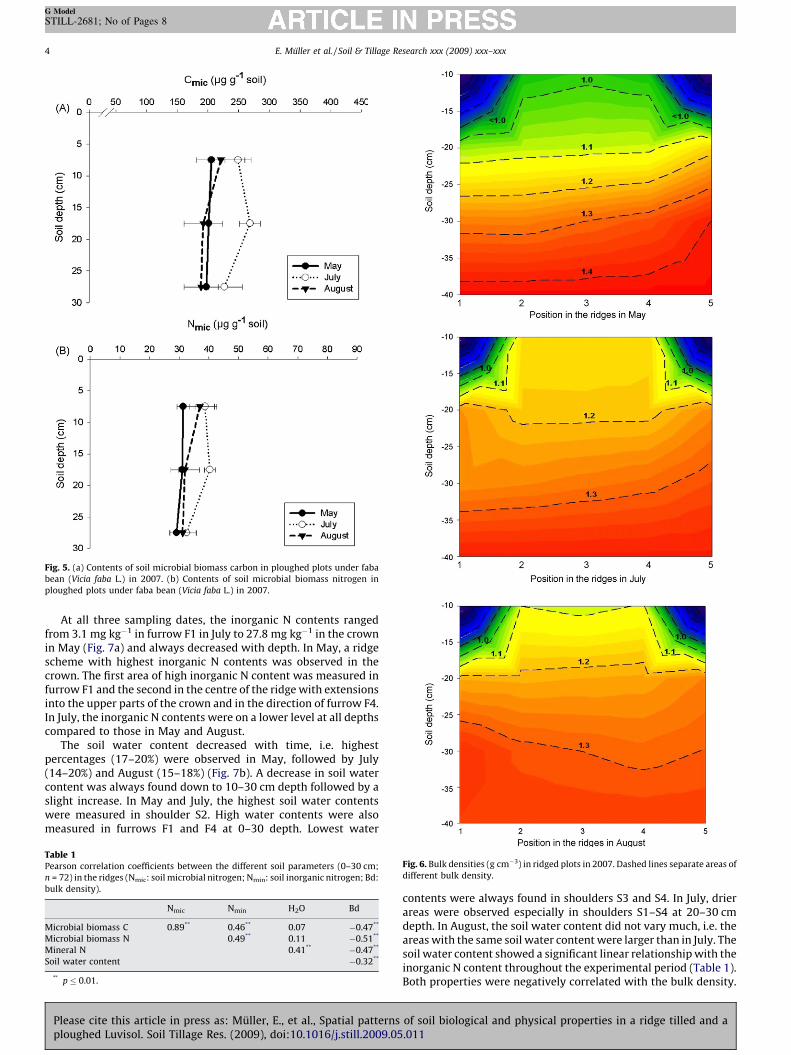
Fig. 5. (a) Contents of soil microbial biomass carbon in ploughed plots under faba
bean (Vicia faba L.) in 2007. (b) Contents of soil microbial biomass nitrogen in
ploughed plots under faba bean (Vicia faba L.) in 2007.
E. Muller et al. / Soil & Tillage Research xxx (2009) xxx–xxx4
G Model
STILL-2681; No of Pages 8
At all three sampling dates, the inorganic N contents rangedfrom 3.1 mg kg�1 in furrow F1 in July to 27.8 mg kg�1 in the crownin May (Fig. 7a) and always decreased with depth. In May, a ridgescheme with highest inorganic N contents was observed in thecrown. The first area of high inorganic N content was measured infurrow F1 and the second in the centre of the ridge with extensionsinto the upper parts of the crown and in the direction of furrow F4.In July, the inorganic N contents were on a lower level at all depthscompared to those in May and August.
The soil water content decreased with time, i.e. highestpercentages (17–20%) were observed in May, followed by July(14–20%) and August (15–18%) (Fig. 7b). A decrease in soil watercontent was always found down to 10–30 cm depth followed by aslight increase. In May and July, the highest soil water contentswere measured in shoulder S2. High water contents were alsomeasured in furrows F1 and F4 at 0–30 depth. Lowest water
Fig. 6. Bulk densities (g cm�3) in ridged plots in 2007. Dashed lines separate areas of
different bulk density.
Table 1Pearson correlation coefficients between the different soil parameters (0–30 cm;
n = 72) in the ridges (Nmic: soil microbial nitrogen; Nmin: soil inorganic nitrogen; Bd:
bulk density).
Nmic Nmin H2O Bd
Microbial biomass C 0.89** 0.46** 0.07 �0.47**
Microbial biomass N 0.49** 0.11 �0.51**
Mineral N 0.41** �0.47**
Soil water content �0.32**
** p � 0.01.
Please cite this article in press as: Muller, E., et al., Spatial patternsploughed Luvisol. Soil Tillage Res. (2009), doi:10.1016/j.still.2009.05
contents were always found in shoulders S3 and S4. In July, drierareas were observed especially in shoulders S1–S4 at 20–30 cmdepth. In August, the soil water content did not vary much, i.e. theareas with the same soil water content were larger than in July. Thesoil water content showed a significant linear relationship with theinorganic N content throughout the experimental period (Table 1).Both properties were negatively correlated with the bulk density.
of soil biological and physical properties in a ridge tilled and a.011
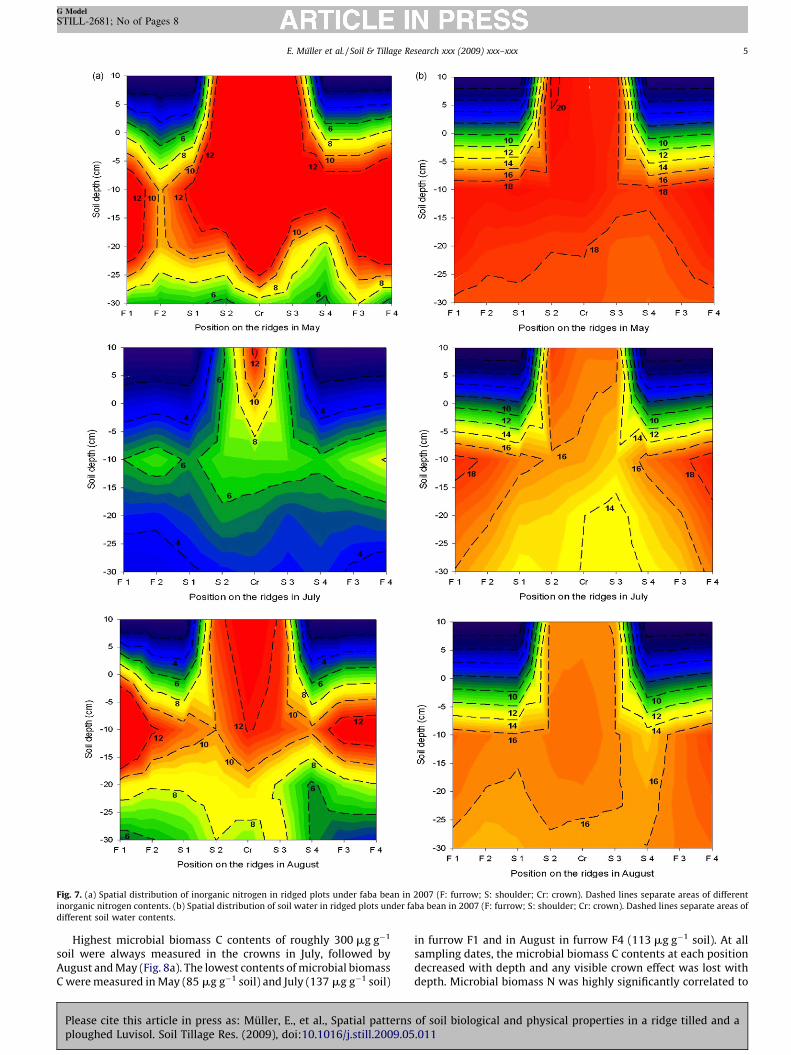
Fig. 7. (a) Spatial distribution of inorganic nitrogen in ridged plots under faba bean in 2007 (F: furrow; S: shoulder; Cr: crown). Dashed lines separate areas of different
inorganic nitrogen contents. (b) Spatial distribution of soil water in ridged plots under faba bean in 2007 (F: furrow; S: shoulder; Cr: crown). Dashed lines separate areas of
different soil water contents.
E. Muller et al. / Soil & Tillage Research xxx (2009) xxx–xxx 5
G Model
STILL-2681; No of Pages 8
Highest microbial biomass C contents of roughly 300 mg g�1
soil were always measured in the crowns in July, followed byAugust and May (Fig. 8a). The lowest contents of microbial biomassC were measured in May (85 mg g�1 soil) and July (137 mg g�1 soil)
Please cite this article in press as: Muller, E., et al., Spatial patternsploughed Luvisol. Soil Tillage Res. (2009), doi:10.1016/j.still.2009.05
in furrow F1 and in August in furrow F4 (113 mg g�1 soil). At allsampling dates, the microbial biomass C contents at each positiondecreased with depth and any visible crown effect was lost withdepth. Microbial biomass N was highly significantly correlated to
of soil biological and physical properties in a ridge tilled and a.011

Fig. 8. (a) Spatial distribution of soil microbial biomass carbon in ridged plots under faba bean in 2007 (F: furrow; S: shoulder; Cr: crown). Dashed lines separate areas of
different soil microbial biomass carbon concentrations. (b) Spatial distribution of soil microbial biomass nitrogen in ridged plots under faba bean in 2007 (F: furrow; S:
shoulder; Cr: crown). Dashed lines separate areas of different soil microbial biomass nitrogen contents.
E. Muller et al. / Soil & Tillage Research xxx (2009) xxx–xxx6
G Model
STILL-2681; No of Pages 8
Please cite this article in press as: Muller, E., et al., Spatial patterns of soil biological and physical properties in a ridge tilled and aploughed Luvisol. Soil Tillage Res. (2009), doi:10.1016/j.still.2009.05.011

E. Muller et al. / Soil & Tillage Research xxx (2009) xxx–xxx 7
G Model
STILL-2681; No of Pages 8
the microbial biomass C (Table 1). Both microbial properties werealso negatively correlated with the bulk density. The average C/Nratio of 6.5 ranged from 5.2 to 7.8 during the investigation period.
4. Discussion
The mean microbial biomass C content of 220 mg g�1 soilobserved throughout the experimental period in the different plotswas in the lower part of the range observed in arable Luvisol sitesin Central Europe (Anderson and Domsch, 1989; Rover and Kaiser,1999; Dilly et al., 2003; Dilly and Munch, 2004; Nieder et al., 2008).In 2003, the contents of microbial biomass C and microbialbiomass N were homogeneously at 156 and 31 mg g�1 soil,respectively, at the experimental site (Brandt and Heß, 2004).The seasonal variations between the three sampling days,especially in the ploughed plots, were below 10%. This percentageis even lower than the results of Kaiser and Heinemeyer (1993) andJoergensen et al. (1994) for arable Luvisols of Northern Germanyand it is also lower than the seasonal variations summarized byWardle (1998) from data of arable sites all over the world. Also, themean microbial biomass N content of 36 mg g�1 soil in the differentplots was in the lower part of the range observed in arable Luvisolsites in Central Europe (Dilly and Munch, 2004; Nieder et al., 2008).The mean microbial biomass C/N ratio of 6.5 is close to theestimated mean of 6.7 set by Jenkinson (1988) for a common soilmicrobial community to calibrate the kEN value (Joergensen andMueller, 1996). Ridging apparently has no marked effects onmicrobial N storage in comparison to ploughing, suggesting similarmicrobial communities and the absence of strong nutrientlimitations.
In the plough plots, microbial biomass C, microbial biomass N,and N mineralization did not reveal any marked depth gradient at0–30 cm depth in accordance with Lavahun et al. (1996). Thissuggests homogeneous conditions for microbial life under ploughtillage. In contrast, the ridged plots revealed strong spatial non-homogeneity, reflecting the different positions in furrows,shoulders and crown. This is a striking feature of the presentresults and might be caused by different effects of (1) bulk density,(2) water content, (3) plant residue distribution, and (4) rootgrowth on microbial biomass and activity.
In both tillage systems, bulk density usually increased withsoil depth, reaching a maximum of between 1.5 and 1.6 g cm�3 at30–40 cm depth in the ploughing pan. This is in line with theresults of others in arable Luvisols (Lavahun et al., 1996; Meyeret al., 1996; Etana et al., 1999; Olesen and Munkholm, 2007;D’Haene et al., 2008). In the crown and the shoulders of theridges, bulk density was roughly 0.2–0.1 g cm�3 lower than in theploughed plots and the furrows of the ridged plots. Thisdifference decreased with depth and during the cropping season,especially from July to August. A similar pattern was reported byLiebig et al. (1993) for ridges and furrows in the US Corn Belt.However, Stone and Heslop (1987) reported no significantdifferences between the bulk densities of ridges and a decreasein a mouldboard plough tillage system after 3 years. This wassupported by Vinther and Dahlmann-Hansen (2005) for the soilat 5–10 cm depth. Katsvairo et al. (2002) found even lower bulkdensities at 10–15 cm depth in mouldboard ploughed plots(1.2 g cm�3) in comparison with the ridges (1.3 g cm�3) at the sixleaf stage of corn, this difference diminished later. Also, Pikulet al. (2001) reported a higher bulk density of the ridged(1.52 g cm�3) in comparison with mouldboard ploughed soil(1.44 g cm�3) at 0–20 cm depth. Although the bulk densities ofthe present experiment did not reach extremely high values atthe different positions of the ridges, the bulk density causednegative effects on the microbial biomass as observed by Kaiserand Heinemeyer (1993), Nieder et al. (1995), and Ahl et al.
Please cite this article in press as: Muller, E., et al., Spatial patternsploughed Luvisol. Soil Tillage Res. (2009), doi:10.1016/j.still.2009.05
(1998). For this reason, bulk density seems to be important forthe observed spatial differentiation of microbial biomass C,microbial biomass N, and N mineralization in the ridged plots.
Although the microbial biomass C and N were not related to thesoil water content, the microbial turnover was probably indirectlyaffected by the water content, as suggested by the positivecorrelation between soil moisture and inorganic N content. Thiswas likely caused by the sinusoidal form of the ridges, whichinfluences the distribution of precipitation and with this the soilwater regime. Bargar et al. (1999) observed higher infiltration ratesin furrows than in crowns, following a lateral soil water movementinto the ridge body. This phenomenon was explained by a negativehydraulic gradient of the drier areas in the ridge crown (Benjaminet al., 1990; Waddell and Weil, 1996). Jaynes and Swan (1999)found lower tracer concentrations in the furrows than under theridge crown and shoulders, indicating higher infiltration rates.Henriksen et al. (2006) assumed that precipitation ran down theshoulders and infiltrated primarily in the furrows, therebyprotecting inorganic N of the ridge crown from leaching. Evenwhen the soil was puddled as observed during the present fieldtrial, precipitation had more time to infiltrate in the furrowscompared to the shoulders. Some high soil water contents werevisible in the crowns, which might be caused by the roughersurface on the crown (Taconet and Ciarletti, 2007). An additionalreason is probably the stem-flow down to the base of faba beans,where infiltration was facilitated in comparison with the puddledsoil surface nearby. In the present ridge tillage system of Turiel, thecrowns of the ridges were newly formed every year on the previousyear’s furrows, always cutting off the pore system connectingsubsoil with upper soil. So, capillary water supply for the plantsfrom the deeper soil layer was reduced in comparison withpermanent ridges as described by Borin and Sartori (1995) in theAmerican Corn Belt.
The hot spots of microbial biomass were located in the centralbody of the ridges (May and August) and in the crown (July). Plantresidues were mainly incorporated into the central body duringridge formation. In addition, this area contained high watercontents and it was the preferred place for root growth. Duringcrop development, roots transfer large amounts of C and N asrhizodeposition into the soil (Nguyen, 2003; Wichern et al., 2007,2008), especially in the vegetative period from May to July (Keithet al., 1986; Nieder et al., 1995; Kuzyakov and Domanski, 2000; Fuet al., 2002). Faba beans released up to 78% of the total below-ground plant biomass N as rhizodeposition (Mayer et al., 2003).During maturation, an increasing amount of dead roots serve assubstrate for soil microorganisms, resulting in increased microbialbiomass contents.
5. Conclusion
In contrast to ploughing, the ridge tillage system of Turiel led tostrong spatial variability in bulk density, soil water content,inorganic nitrogen and microbial biomass C and microbial biomassN under faba bean. This variability is mainly due to differences inbulk density, which has an impact on soil moisture, residuedistribution and root growth. The ridges were formed every yearwith a tillage depth of 30–35 cm. For this reason, the Turiel tillagesystem cannot be regarded as a reduced system, although itsintensity is lower than that of the conventional ploughing system.
Acknowledgements
We have to give special thanks to Eberhard Kolsch and MariusOtto for maintaining the field plots and valuable discussion. Wefurther acknowledge the technical support and kind help of MargitRode, Gabriele Dormann and Elsa Zwicker.
of soil biological and physical properties in a ridge tilled and a.011

E. Muller et al. / Soil & Tillage Research xxx (2009) xxx–xxx8
G Model
STILL-2681; No of Pages 8
References
Ahl, C., Joergensen, R.G., Kandeler, E., Meyer, B., Woehler, V., 1998. Microbialbiomass and activity in silt and sand loams after long-term shallow tillagein central Germany. Soil Till. Res. 49, 93–104.
Anderson, T.-H., Domsch, K.H., 1989. Ratios of microbial biomass carbon to totalorganic carbon in arable soils. Soil Biol. Biochem. 21, 471–479.
Bargar, B., Swan, J.B., Jaynes, D., 1999. Soil water recharge under uncropped ridgesand furrows. Soil Sci. Soc. Am. J. 63, 1290–1299.
Benjamin, J.G., Blaylock, A.D., Brown, H.J., Cruse, R.M., 1990. Ridge tillage effect onsimulated water and heat transport. Soil Till. Res. 18, 167–180.
Borin, M., Sartori, L., 1995. Barley, soybean and maize production using ridge tillage,no-tillage and conventional tillage in north-east Italy. J. Agric. Eng. Res. 62, 229–236.
Brandt, M., Heß, J., 2004. Systeme reduzierter Bodenbearbeitung im OkologischenLandbau. Schlussbericht Projekt 02OE525. Bundesprogramm OkologischerLandbau, http://orgprints.org/1266/01/1266-02OE525-unikassel-brandt-2003-bodenbearb.pdf.
Brookes, P.C., Landman, A., Pruden, G., Jenkinson, D.S., 1985. Chloroform fumigationand the release of soil nitrogen: a rapid direct extraction method to measuremicrobial biomass nitrogen in soil. Soil Biol. Biochem. 17, 837–842.
D’Haene, K., Vermang, J., Cornelis, W.M., Leroy, B.L.M., Schiettecatte, W., De Neve, S.,Gabriels, D., Hofman, G., 2008. Reduced tillage effects on physical properties ofsilt loam soils growing root crops. Soil Till. Res. 99, 279–290.
Dick, W.A., 1997. Tillage system impacts on environmental quality and soil biolo-gical parameters. Soil Till. Res. 41, 165–167.
Dilly, O., Blume, H.P., Munch, J.C., 2003. Soil microbial activities in Luvisols andAnthrosols during 9 years of region-typical tillage and fertilisation practices innorthern Germany. Biogeochemistry 65, 319–339.
Dilly, O., Munch, J.C., 2004. Litter decomposition and microbial characteristics inagricultural soils in northern, central, and southern Germany. Soil Sci. PlantNutr. 50, 843–853.
Etana, A., Hakonsson, I., Zagal, E., Bucas, S., 1999. Effects of tillage depth on organiccarbon content and physical properties in five Swedish soils. Soil Till. Res. 52,129–139.
Franzluebbers, A.J., Hons, F.M., Zuberer, D.A., 1995. Tillage and crop effects onseasonal dynamics of soil CO2 evolution, water content, temperature, and bulkdensity. Appl. Soil Ecol. 2, 95–109.
Fu, S., Cheng, W., Susfalk, R., 2002. Rhizosphere respiration varies with plant speciesand phenology: a greenhouse pot experiment. Plant Soil 239, 133–140.
Hakansson, I., Stenberg, M., Rydberg, T., 1998. Long-term experiments with differ-ent depths of mouldboard ploughing in Sweden. Soil Till. Res. 46, 209–223.
Henriksen, C.B., Rasmussen, J., Mølgaard, J.P., 2007. Potato tuber yield and qualityand soil inorganic nitrogen as affected by timing of ridging with and withoutcatch crops. Soil Till. Res. 94, 36–46.
Henriksen, C.B., Rasmussen, J., Søgaard, C., 2006. Ridging in autumn as an alternativeto mouldboard ploughing in a humid-temperate region. Soil Till. Res. 85, 27–37.
Jaynes, D.B., Swan, J.B., 1999. Solute movement in uncropped ridge-tilled soil undernatural rainfall. Soil Sci. Soc. Am. J. 63, 264–269.
Jenkinson, D.S., 1988. The determination of microbial biomass carbon and nitrogenin soil. In: Wilson, J.R. (Ed.), Advances in Nitrogen Cycling in AgriculturalEcosystems. CAB International, Wallingford.
Joergensen, R.G., 1996. The fumigation-extraction method to estimate soil micro-bial biomass: calibration of the kEC value. Soil Biol. Biochem. 28, 25–31.
Joergensen, R.G., Meyer, B., Mueller, T., 1994. Time-course of the soil microbialbiomass under wheat: a one year field study. Soil Biol. Biochem. 26, 987–994.
Joergensen, R.G., Mueller, T., 1996. The fumigation-extraction method to estimatesoil microbial biomass: calibration of the kEN value. Soil Biol. Biochem. 28, 33–37.
Kaiser, E.-A., Heinemeyer, O., 1993. Seasonal variations of soil microbial biomasscarbon within the plough layer. Soil Biol. Biochem. 25, 1649–1655.
Kandeler, E., Tscherko, D., Spiegel, H., 1999. Long-term monitoring of microbialbiomass, N mineralisation and enzyme activities of a Chernozem under differ-ent tillage management. Biol Fertil. Soils 28, 343–351.
Katsvairo, T., Cox, W.J., van Es, H.M., Otis, D.J., 2002. Tillage and rotation effects onsoil physical characteristics. Agron. J. 94, 299–304.
Keith, H., Oades, J.M., Martin, J.K., 1986. Input of carbon to soil from wheat plants.Soil Biol. Biochem. 18, 445–449.
Kuzyakov, Y., Domanski, G., 2000. Carbon input by plants into soil. J. Plant Nutr. SoilSci. 163, 421–431.
Please cite this article in press as: Muller, E., et al., Spatial patternsploughed Luvisol. Soil Tillage Res. (2009), doi:10.1016/j.still.2009.05
Lavahun, M.F.E., Joergensen, R.G., Meyer, B., 1996. Activity and biomass of soilmicroorganisms at different depths. Biol Fertil. Soils 23, 38–42.
Liebig, M.A., Jones, A.J., Doran, J.W., Mielke, L.N., 1995. Potential soil respiration andrelationship to soil properties in ridge tillage. Soil Sci. Soc. Am. J. 59, 1430–1435.
Liebig, M.A., Jones, A.J., Mielke, L.N., Doran, J.W., 1993. Controlled wheel trafficeffects on soil properties in ridge tillage. Soil Sci. Soc. Am. J. 57, 1061–1066.
Limon-Ortega, A., Sayre, K.D., Drijber, R.A., Francis, C.A., 2002. Soil attributes in afurrow-irrigated bed planting system in northwest Mexico. Soil Till. Res. 63,123–132.
Mayer, J., Buegger, F., Steen Jensen, E., Schloter, M., Heß, J., 2003. Estimating Nrhizodeposition of grain legumes using a 15N in situ stem labeling method. SoilBiol. Biochem. 35, 21–28.
Meyer, K., Joergensen, R.G., Meyer, B., 1996. The effects of reduced tillage onmicrobial biomass C and P in sandy loess soils. Appl. Soil Ecol. 5, 71–79.
Mueller, T., Joergensen, R.G., Meyer, B., 1992. Estimation of soil microbial biomass Cin the presence of living roots by fumigation-extraction. Soil Biol. Biochem. 24,179–181.
Nguyen, C., 2003. Rhizodeposition of organic C by plants: mechanisms and controls.Agronomics 23, 375–396.
Nieder, R., Harden, T., Martens, R., Benbi, D.K., 2008. Microbial biomass in arablesoils in Germany during the growth period of annual crops. J. Plant Nutr. Soil Sci.171, 878–885.
Nieder, R., Willenbockel, A., Neugebauer, E., Widmer, P., Richter, J., 1995. Die Rolleder mikrobiellen Biomasse und des mineralisch fixierten Ammoniums bei denStickstoff-Transformationen in niedersachsischen Loß-Ackerboden unter Win-ter-Weizen. II. Umsetzung von 15N-markiertem Stickstoff. Z. Pflanzenern. Bod-enk. 158, 477–484.
Nokes, S.E., Fausey, N.R., Subler, S., Blair, J.M., 1997. Stand, yield, weed biomass, andsurface residue cover comparisons between three cropping/tillage systems on awell-drained silt loam soil in Ohio, USA. Soil Till. Res. 44, 95–108.
Olesen, J.E., Munkholm, L.J., 2007. Subsoil loosening in a crop rotation for organicfarming eliminated plough pan with mixed effects on crop yield. Soil Till. Res.94, 376–385.
Paul, E.A., Harris, D., Collins, H.P., Schulthess, U., Robertson, G.P., 1999. Evolution ofCO2 and soil carbon dynamics in biologically managed, row-crop agroecosys-tems. Appl. Soil Ecol. 11, 53–65.
Pikul Jr., J.L., Carpenter-Boggs, L., Vigil, M., Schumacher, T.E., Lindstrom, M.J., Riedell,W.E., 2001. Crop yield and soil conditions under ridge and chisel-plow tillage inthe northern Corn Belt, USA. Soil Till. Res. 60, 21–33.
Rahman, M.H., Okubo, A., Sugiyama, S., Mayland, H.F., 2008. Physical, chemical andmicrobiological properties of an Andisol as related to land use and tillagepractice. Soil Till. Res. 101, 10–19.
Reicosky, D.C., Archer, D.W., 2007. Moldboard plow tillage depth and short-termcarbon dioxide release. Soil Till. Res. 94, 109–121.
Rover, M., Kaiser, E.-A., 1999. Spatial heterogeneity within the plough layer: low andmoderate variability of soil properties. Soil Biol. Biochem. 31, 175–187.
Stone, J.A., Heslop, L.C., 1987. Blade cultivator, ridge, and moldboard plow tillagecomparison on a poorly drained soil. Trans. ASAE 30, 61–64.
Taconet, O., Ciarletti, V., 2007. Estimating soil roughness indices on a ridge-and-furrow surface using stereo photogrammetry. Soil Till. Res. 93, 64–76.
Tisdall, J.M., Hodgson, A.S., 1990. Ridge tillage in Australia: a review. Soil Till. Res. 18,127–144.
Vance, E.D., Brookes, P.C., Jenkinson, D.S., 1987. An extraction method for measuringsoil microbial biomass C. Soil Biol. Biochem. 19, 703–707.
Vinther, F.P., Dahlmann-Hansen, L., 2005. Effects of ridging on crop performanceand symbiotic N2 fixation of fababean (Vicia faba L.). Soil Use Manage. 21, 205–211.
Waddell, J.T., Weil, R.R., 1996. Water distribution in soil under ridge-tillage and no-till corn. Soil Sci. Soc. Am. J. 60, 230–237.
Wardle, D.A., 1998. Controls of temporal variability of the soil microbial biomass: aglobal-scale synthesis. Soil Biol. Biochem. 30, 1627–1637.
Wichern, F., Eberhardt, E., Mayer, J., Joergensen, R.G., Muller, T., 2008. Nitrogenrhizodeposition in agricultural crops: methods, estimates and future prospects.Soil Biol. Biochem. 40, 30–48.
Wichern, F., Mayer, J., Joergensen, R.G., Muller, T., 2007. Release of C and N fromroots of peas and oats and their availability to soil microorganisms. Soil Biol.Biochem. 39, 2829–2839.
Wu, J., Joergensen, R.G., Pommerening, B., Chaussod, R., Brookes, P.C., 1990. Mea-surement of soil microbial biomass C by fumigation-extraction—an automatedprocedure. Soil Biol. Biochem. 22, 1167–1169.
of soil biological and physical properties in a ridge tilled and a.011