Relaxational polarization in polar dielectric barium magnesium niobate
Upload
independentCategory
view
3download
0
ARTICLE IN PRESS
0142-9612/$ - se
doi:10.1016/j.bi
�CorrespondE-mail addr
(U. Zimmerma
Biomaterials 28 (2007) 1327–1345
www.elsevier.com/locate/biomaterials
Physical and biological properties of barium cross-linkedalginate membranes
Heiko Zimmermanna, Felix Wahlischb, Claudia Baierb, Markus Westhoffb, Randolph Reussb,Dirk Zimmermannc, Marcus Behringerb, Friederike Ehrharta, Alisa Katsen-Globaa,
Christoph Giesed, Uwe Marxd, Vladimir L. Sukhorukovb, Julio A. Vasqueze, Peter Jakobf,Stephen G. Shirleya, Ulrich Zimmermannb,�
aAbteilung Kryobiophysik & Kryotechnologie, Fraunhofer-Institut fur Biomedizinische Technik, D-66386 St. Ingbert, GermanybLehrstuhl fur Biotechnologie, Biozentrum, Am Hubland, Universitat Wurzburg, D-97074 Wurzburg, Germany
cAbteilung fur Biophysikalische Chemie, Max-Planck-Institut fur Biophysik, D-60439 Frankfurt, GermanydProbiogen AG, Goethestrasse 54, D-13086 Berlin, Germany
eDepartmento Biologia Marina, Facultad de Ciencias del Mar, Universidad Catolica del Norte, Coquimbo, ChilefLehrstuhl fur Experimentelle Physik V, Am Hubland, Universitat Wurzburg, D-97074 Wurzburg, Germany
Received 25 September 2006; accepted 22 November 2006
Abstract
We describe the manufacture of highly stable and elastic alginate membranes with good cell adhesivity and adjustable permeability.
Clinical grade, ultra-high viscosity alginate is gelled by diffusion of Ba2+ followed by use of the ‘‘crystal gun’’ [Zimmermann H. et al.,
Fabrication of homogeneously cross-linked, functional alginate microcapsules validated by NMR-, CLSM- and AFM-imaging.
Biomaterials 2003;24:2083–96]. Burst pressure of well-hydrated membranes is between 34 and 325 kPa depending on manufacture and
storage details. Water flows induced by sorbitol and raffinose (probably diffusional) are lower than those caused by PEG 6000, which
may be related to a Hagen–Poiseuille flow. Hydraulic conductivity, Lp, from PEG-induced flows ranges between 2.4� 10�12 and
6.5� 10�12mPa�1 s�1. Hydraulic conductivity measured with hydrostatic pressure up to 6 kPa is 2–3 orders of magnitude higher and
decreases with increasing pressure to about 3� 10�10mPa�1 s�1 at 4 kPa. Mechanical introduction of 200mm-diameter pores increases
hydraulic conductivity dramatically without loss of mechanical stability or flexibility. NMR imaging with Cu2+ as contrast agent shows
a layered structure in membranes cross-linked for 2 h. Phase contrast and atomic force microscopy in liquid environment reveals surface
protrusions and cavities correlating with steps of the production process. Murine L929 cells adhere strongly to the rough surface of
crystal-bombarded membranes. NaCl-mediated membrane swelling can be prevented by partial replacement of salt with sorbitol
allowing cell culture on the membranes.
r 2006 Elsevier Ltd. All rights reserved.
Keywords: Hydrogels; Hydraulic conductivity; NMR-imaging; AFM; Topography; Cell culture
1. Introduction
Alginate gels are currently being employed and exploredfor a wide range of medical and pharmaceutical applica-tions including cell microencapsulation, drug delivery, andtissue engineering. Examples are the encapsulation of islets
e front matter r 2006 Elsevier Ltd. All rights reserved.
omaterials.2006.11.032
ing author. Tel.: +49 931 888 4508; fax: +49 931 888 4509.
ess: [email protected]
nn).
of Langerhans and parathyroid tissue for the treatment ofdiabetes mellitus and hypoparathyroidism [1–8] and theencapsulation of human chondrocytes or mesenchymalstem cells for repair of cartilage defects [9–12]. Alginate-based wound dressings are increasingly viable alternativesto the traditional cotton or viscose gauzes [13,14] andmembranes inoculated with cells are being explored forburn treatment. Alginate keeps wounds moist and fostersthe formation of tissue [15]. Alginate may also serveas a cryoprotectant for single cells and, especially, for

ARTICLE IN PRESSH. Zimmermann et al. / Biomaterials 28 (2007) 1327–13451328
multicellular systems [16]. Alginate films on glass surfaceshave been used for non-invasive cell guidance [6].Additionally, alginate is an appealing material for theconstruction of ‘‘biohybrid organs’’ and ‘‘micro-bioreac-tors’’ because its hydrated three-dimensional networkallows cells to adhere, spread, migrate and interact withother cells [6]. Although still in their infancy, micro-bioreactors on alginate membranes tackle many problemsin regenerative medicine. An artificial lymph node cangenerate human monoclonal antibodies and test immunefunctions in vitro [17].
Alginate microcapsules or membranes for medical andpharmaceutical use must (i) preserve donor cell viabilityand function, (ii) prevent immunological response and (iii)have long-term integrity. Biocompatibility and mechanicaland elastic properties depend, inter alia, on the algalsource, processing methods, formulation and gellingconditions [16,18].
Extensive experience from 20 collection sites andunsuccessful trials of laboratory cultures has shown (seee.g. [19]) that the specific microenvironment and ecologicalhistory of the algal growth place is crucial for thereproducible manufacture of clinical-grade alginate.Microenvironments can vary on small scales (tens ofmeters) as a result of climatic and sea conditions.Characterisation of clinical-grade alginate should includehigh-resolution specification of the growth area as well ascomplete environmental and preparation data. These data,composition analysis, records of seasonal and annualbiomass production and local data about the persistenceand mortality of kelp populations are documented forLessonia nigrescens and Lessonia trabeculata [20–22].L. nigrescens from tidal zone of the Chilean coast isexposed to extremely high surf and its stipes are veryelastic and flexible because they contain high-M alginates(about 60% mannuronate acid [23]). L. trabeculata issubtidal from depths between 5 and 30m and its stipes arevery stiff due to a high-G content (guluronate acid about90% [24]).
The recent introduction of the ‘‘crystal gun’’ hasconsiderably improved the cross-linking process of thealginate with Ba2+ ions because of uniform gelling [25–27].These developments have resulted in a new generation ofcell or tissue containing microcapsules made of 1:1mixtures of high-G and high-M alginate that havefunctioned in rodent studies for more than a year withoutevoking any significant immunological response [8,16].
We demonstrate that these technologies can manufac-ture large, additive-free, biocompatible alginate mem-branes exhibiting the strength and elasticity required forwound dressing. In particular, protocols are given for theconstruction of (cell-seeded) alginate membranes that arehighly stable and elastic in physiological solutions and alsocell-permeable as required for micro-bioreactors. Althoughchallenges remain, this body of knowledge facilitatesimplementation of the results described here into medicaland pharmaceutical applications.
2. Materials and methods
2.1. Alginate
Alginate constitutes a family of unbranched anionic polysaccharides,
mainly extracted from brown algae (Phaeophyta). It is composed of 1-4-
linked a-L-guluronic acid and b-D-mannuronic acid arranged in homo-
polymeric (GGG-blocks and MMM-blocks) or heteropolymeric block
structures (MGM-blocks). Ultra-high viscosity alginates of clinical grade
were extracted from stipes of L. nigrescens and L. trabeculata growing at
the Chilean coast close to Coquimbo (500 km north of Santiago de Chile).
The algae were harvested directly from the sea, peeled and subjected to
immediate antimicrobial treatment [16]. After harvesting, cutting and
drying the stipe pieces, contaminants were physically removed from the
surface. The large-scale technology for alginate extraction has been
described elsewhere [16,18,19]. A 0.1% w/v solution of the ultra-high
viscosity alginates (UHV-alginates) had a viscosity of 20–40mPa s.
Quality control of the purified alginates was performed using the assays
developed by Leinfelder et al. [19].
2.2. Production of NT-alginate membranes
0.7% w/v purified UHV-alginates from L. nigrescens and L. trabeculata
were dissolved in sterile 0.9% NaCl solution. 1:1 mixtures of L. nigrescens
and L. trabeculata alginates (final composition: about 35%M and 65%G)
were used if not stated otherwise. Screening experiments showed these
‘‘NT-alginate’’ membranes to have best mechanical stability and elasticity.
In some experiments, up to 5% fetal calf serum (FCS; purchased from
PAA, Linz, Austria) was added to the alginate mixture before cross-
linking to test the effect of the protein on the swelling properties of the
alginate [28].
The set-up for forming membranes consisted of a rectangular inner
compartment of 52� 90mm2 whose thickness could be varied between 1.5
and 2mm with spacers. This compartment was separated from two outer
compartments (Fig. 1) by wetted filters (regenerated cellulose reinforced
with non-woven cellulose; pore diameter 0.2mm; Sartorius AG, Gottingen,
Germany) supported by 10-mm thick ceramic plates (Porolith; average
pore size 25mm; Keramische Fabrik Meissen GmbH, Meissen, Germany).
The inner compartment was filled with 8 or 12ml of the 0.7% w/v alginate
solution depending on the thickness of the spacer. Then isoosmolar 0.9%
NaCl containing 20mM BaCl2 was added to the outer compartments. The
compartments were set vertically to avoid the inclusion of air bubbles in
the alginate matrix. The Ba2+ cross-linking proceeded for 2 or 15 h. The
membranes were removed and their area determined. They were kept in
distilled water (Ampuwa water; Fresenius Kabi, Bad Homburg,
Germany) for at least 1 h before transfer into osmolyte solutions or into
sorbitol-modified culture medium. The sorbitol-modified culture
medium was made by 1:1 mixture of complete growth medium
(CGM) and of an isoosmolar sorbitol solution. CGM consisted
of RPMI 1640 supplemented with 2mM L-glutamine, 2mM sodium
pyruvate, 1% non-essential amino acids, 100mgml�1 penicillin and
100Uml�1 streptomycin (PAA, Linz, Austria). The final FCS concentra-
tion (FCS Gold; PAA, Linz, Austria) of the modified growth medium was
adjusted to 10%.
Some of these conventional alginate membranes were immediately
bombarded with BaCl2 crystals using the crystal gun technique introduced
recently by Zimmermann et al. [16,24] for cross-linking microcapsules.
The crystal gun was mounted on an XY plotter allowing local control of
cross-linker concentration. Crystals (250–350mm in diameter) were pre-
heated at 150 1C for 3 h and stored under dry and sterile conditions.
Membranes were bombarded for 45 s (corresponding roughly to
500–800mg BaCl2). Then the membranes were incubated further for
1min in a 20mM BaCl2 solution before being transferred into distilled
water for storage. Membranes of high hydraulic conductivity were made
by introducing pores into the bombarded matrix with a cannula of tip
diameter of 200mm (so-called perforated membranes).

ARTICLE IN PRESS
Fig. 1. Schematic of alginate membranes casting frame. The symmetric
chamber had a rectangular (52� 90mm2) inner compartment (1), whose
thickness was varied between 1.5 and 2mm with a spacer (2). The inner
compartment was separated from the two outer compartments (3) by
cellulose filters (4) with pore diameter 0.2mm. The outer compartments
were porous ceramic plates (average pore size 25 mm) in polyacetal frames
(5). The chamber was clamped between two stainless steel plates (6) with
screws (not shown). The inner and outer compartments were filled,
respectively, with 0.7% w/v alginate solution and the cross-linking
solution (20mM BaCl2 in 0.9% NaCl), via inlets (inward arrows). During
filling, the chamber was kept vertical to avoid air bubbles in the alginate
matrix.
H. Zimmermann et al. / Biomaterials 28 (2007) 1327–1345 1329
2.3. Burst pressure
The pressure resistance of alginate membranes was tested with a home-
built, air-inflation device having a digital manometer (Greisinger-
electronic, Regenstauf, Germany). The device was in principle a filter
holder consisting of two parts screwed together. A fully hydrated
membrane of about 13mm2 was clamped to one half of the holder. Both
halves of the holder were then carefully screwed together to avoid shear
forces on the clamped membrane.
Membranes were pressurised at about 1 kPa s�1 until rupture. The
maximum pressure recorded prior to rupture was defined as the burst
pressure according to Vernon et al. [29].
2.4. Atomic force microscopy (AFM)
Two force microscopes with ‘‘Explorer’’-heads (Topometrix, Darm-
stadt, Germany; now Veeco, New York, USA) were used. The AFMs had
liquid tripod-scanners (model 5180-00, maximum scan range 100mm in x/y
and nominal 10mm in z direction) and standard Si3N4 cantilevers (type
1530) with arm length of 100mm and width of 22mm. The scans were
performed in liquid using an intermittent contact mode. In this mode the
change of the vertical cantilever oscillation amplitude (drive frequency
33–40Hz) was detected. Slow scanning rates (line frequencieso1Hz) were
used. Measurements were discarded when forward and backward signals
were not identical. Image resolution was normally 300� 300 pixels. A
complete scan usually needed about 45min. The data were processed and
analysed using SPMLab (version 5.01 and 6.02) software from Topome-
trix (Darmstadt, Germany, now Veeco, New York, USA). To emphasise
topographical features, images were converted into the so-called shadow
mode (for details, the reader is referred to Zimmermann et al. [30]). The
average area roughness value, Ra, was determined by using the
Topometrix software. Ra represents the arithmetic mean of the absolute
values of the deviations from the mean height for a selected area (so-called
area of interest). It is important to note that Ra-values can only be
compared if areas of interest are mostly planar. Furthermore, Ra-values
measured with AFM tips of different size cannot usually be compared
straightforwardly. However, in these studies we could safely assume that
the tip size remained unchanged, even after long scanning periods, because
very stable and reasonably ‘‘broad’’ Si3N4 cantilevers were used. Contact
with the soft alginate membrane did not damage the tip.
A special holder was designed to allow surface scanning of alginate
membranes with no lateral or vertical movement or deformation. The
holder, made of PMMA, consisted of a central cylinder with a diameter of
11.6mm and a height of 3.8mm surrounded by an outer cylinder. The
circular groove formed a reservoir of diameter 23.5mm and a depth of
7.0mm and the resulting volume was about 3.4ml. A V2A stainless-steel
holder was fitted over the central cylinder, holding the membrane while
keeping its upper side exposed. Appropriate pieces of alginate membranes
were punched, rapidly put into the holder and flooded with the storage
medium to suppress drying as well as osmotic stress upon the membranes
when sorbitol-modified culture medium was used. The alginate holder was
glued onto a standard AFM rack consisting of a small x/y table within a
solid metal block. The rack was positioned on a pneumatic vibration
isolation table (purchased by Integrated Dynamics Engineering GmbH,
Raunheim, Germany and by Technical Manufacturing Corporation,
Peabody, USA). To prevent evaporation well-wetted tissues were placed
between rack and head. At regular intervals after scanning, osmolality was
measured using a cryoscopic osmometer (Osmomat 030, Gonotec, Berlin,
Germany) and found to be constant.
Silicone casts were made of the pore structure of the filters used in
membrane manufacture. Hydrated filters were placed on a cloth for clean
room application to remove surplus water without dehydration. Pieces of
filter were clipped and fixed in a cell culture dish (Greiner Bio-One, Essen)
with double-sided tape (Tesa Doppelband, Tesa AG, Hamburg, Ger-
many). Silicone base and curing agent (ratio 10:1, Sylgard 184, Dow
Corning, Wiesbaden) were mixed and degassed for 15min in an exsiccator.
The mixture was poured into the dish to a height of about 2mm and
degassed for another 10min. Final hardening was initiated by elevating
the temperature to 80 1C for 90min. The hardened silicone was removed
from the dish and separated carefully from the filter to obtain a clean
reprint structure. The silicone sheet was clipped before AFM measure-
ments.
2.5. NMR-imaging
NMR contrast agents are needed to visualise the Ba2+ cross-linked
alginate membranes with 1H-NMR-imaging techniques because alginate
hydrogels consist of about 99% water. Cu2+ ions reduce the spin-lattice
relaxation time, T1, of water and have a similar affinity constant to
alginate as Ba2+ [31]. Therefore, Cu2+ is a perfect contrast agent for
probing the Ba2+ cross-linking process (Manz et al. [26]). For NMR
imaging membranes were incubated in distilled water containing 1.5mM
Cu2+ acetate for 24 h. The membranes were washed thoroughly with
Cu2+-free distilled water (or sorbitol-modified culture medium) for 24 h to
completely remove unbound Cu2+. For studies in sorbitol-modified
culture medium, membranes were washed with this solution. NMR-
imaging was performed with a Bruker AMX-500 microscopy system

ARTICLE IN PRESSH. Zimmermann et al. / Biomaterials 28 (2007) 1327–13451330
(Bruker Analytische Messtechnik, Silberstreifen, Rheinstetten, Germany).
The magnetic field strength was 11.75T and the maximal gradient strength
660mT/m. The vertical bore was 8.9 cm diameter. A Helmhotz-type radio
frequency coil (diameter 12mm, wire distance 5mm), tuneable to the
proton resonance frequency of 500MHz, was used as transmitter and
receiver. Membranes incubated in distilled water were placed vertically in
a glass cuvette (1.0� 9.0mm2), for membranes incubated in a sorbitol-
modified culture medium a larger glass tube (diameter 4.7mm) was used
(because of the increased thickness; see below). The membrane-radio
frequency coil assembly was introduced vertically into a homebuilt probe-
head. Single-slice proton distribution images of the membranes were made
using a T1-weighted two-dimensional cross-sectional spin echo imaging
sequence as described by Wagner et al. [32]. The slice thickness was 1mm.
The echo time (TE) and repetition time (TR) were adjusted to 10.09 and
43.15ms, respectively. In the case of glass cuvettes, the matrix- and field of
view (FOV)-data were 256� 64 pixel and 10� 2.5mm2, respectively. In
the case of tubes the corresponding parameters were 128� 128 pixel
and FOV ¼ 5� 5mm2. In both cases the isotropic nominal inplane
resolution was 39mm. Quantitative distribution images of the spin-lattice
relaxation time of protons, T1, (so called T1 maps) were acquired using
saturation recovery [33]. Using spin echo imaging (slice ¼ 1mm,
TE ¼ 10.09ms) 12 T1-weighted images were acquired by selecting
repetition times between 10ms and 4 s. The T1 map was then calculated
on a pixel-by-pixel basis.
Fig. 2. Schematic of the permeation cells for osmotic (A) and hydrostatic
flow experiments (B). The Plexiglas cell had two 5-ml compartments (1, 2),
each with a circular face with a 13-mm diameter hole, into which the
alginate membrane (3) was clamped. The membrane was stabilised on
both sides by nylon mesh (4) and held in a Plexiglas support (5) with a
central 10mm hole. In osmotic experiments (A), compartment 1 was filled
with distilled water and compartment 2 with an osmolyte solution. The
shift of menisci in the horizontal portions of the calibrated capillaries (6, 7)
gave transmembrane flow. Ports 8 and 9 (for filling and cleaning the
chamber) were plugged during measurements. Both compartments had
magnetic stirrers (10). In hydrostatic experiments (B), the compartments
were filled with distilled water or sorbitol-modified culture medium. The
pressure difference (DP) was controlled by adjusting the vertical spacing of
the water filled capillaries.
2.6. Osmotically induced transmembrane water flow
Hydraulic conductivity was calculated from water flows induced across
the membranes by adding PEG 6000 (Merck Schuchardt, Hohenbrunn,
Germany), raffinose (Sigma-Aldrich GmbH, Steinheim, Germany) and
sorbitol (Merck, Darmstadt, Germany) to distilled water. The osmolality
of the solutions was determined cryoscopically (Osmomat 030, Gonotec,
Berlin, Germany). The osmotic pressure exerted was adjusted to about
290mosmol kg�1. For testing unstirred layer effects some PEG 6000
experiments were also performed at a concentration of 120mosmol kg�1.
The viscosity of the high-osmolality solutions was 6.63mPa s for PEG
6000, 1.18mPa s for raffinose and 1.09mPa s for sorbitol (measured at
room temperature). The low-osmolality PEG 6000 solution exhibited a
viscosity of 3.53mPa s. The densities of the osmolyte solutions were
1.015 g cm�3 for sorbitol, 1.013 g cm�3 for PEG 6000 and 1.046 g cm�3 for
raffinose. The pH-value of the unbuffered solutions were 7.0–8.1 before
use, but in the case of the PEG 6000 solutions pH-values were very often
between 5.5 and 7.0. The alginate membranes were equilibrated with the
osmolyte solutions overnight before use. Transmembrane water flows
were measured using the home-built horizontal permeation cell depicted in
Fig. 2A. The set-up consisted of two 6.5-ml Plexiglas compartments. The
receptor compartment ‘‘2’’ contained the osmolyte solution and the donor
compartment ‘‘1’’ distilled water. Each compartment had a circular face
with a 20-mm diameter hole. A disk-shaped alginate membrane of about
18mm in diameter was punched from the externally cross-linked alginate
membrane, stabilised on both sides by frames of a nylon mesh with square
openings of 65� 65 mm2 (Falcon, Becton Dickinson, Le Pon De Claix,
France) and then placed into a disk-shaped Plexiglas support. The support
consisted of two mould halves of 20mm outer diameter. One half
contained a groove of 16mm in diameter to accept the stabilised alginate
membrane (see Fig. 2A). The Plexiglas supports contained a central hole
of 10.0mm diameter (corresponding to an area of 79.3mm2). The halves
of the Plexiglas support were clamped tightly together and integrated into
the permeation cell between the two compartments. A tight seal between
the Plexiglas support and the compartment walls was achieved by
mechanical compression of the periphery of the oversized membranes.
Each compartment was equipped with two ports (see Fig. 2A). Ports 8 and
9 were used for filling and cleaning the permeation cell but were closed by
plugs during flow measurements. Ports 6 and 7 were connected with
calibrated pipettes via Tygon tubes (Saint-Gobain Performance Plastics
Verneret, Charny, France). The pipettes were clamped horizontally and
filled with osmolyte solution and solvent, respectively.
Prior to the experiment, 50 ml samples were taken from each
compartment for cryoscopic determination of the osmolality. The bulk
phases of both chambers were stirred by small magnetic stirrer bars if not
stated otherwise. The measurements were performed at room temperature
with the chambers insulated from the heat of the motors. Transmembrane
water flow was measured for up to 60min by monitoring the shift of the
menisci in both capillaries (volume influx into compartment ‘‘2’’ versus
volume efflux out of compartment ‘‘1’’). After the experiment, aliquots
were taken from both compartments for osmolality measurements. A
significant increase in the osmolality of compartment ‘‘1’’ was never
found. However, it must be noted that the osmolality in compartment ‘‘2’’
was slightly lowered after the end of the experiment due to water flow.
Finally, before removal of the membrane from the diffusion chamber
Indian ink was regularly added to compartment ‘‘1’’ and a hydrostatic
pressure difference of DP ¼ 1 kPa was applied (see below) to test for
possible water flow bypassing the membrane through imperfect seals. If
dye was observed in compartment ‘‘2’’ data were discarded. However, it is
important to note that this was a very rare event.
2.7. Hydrostatically induced transmembrane water flow
Both compartments of the permeation cell were filled with distilled
water (or with sorbitol-modified culture medium). Transmembrane water
flow was induced by a hydrostatic pressure difference, DP, of up to 6 kPa
for 15–30min. Perforation of the membranes using a cannula resulted in

ARTICLE IN PRESSH. Zimmermann et al. / Biomaterials 28 (2007) 1327–1345 1331
large volume flows. In this case, DP of only 0.1 kPa were applied for
2–10min. Hydrostatic pressure was generated by water (or sorbitol-
modified culture medium) filled, bent capillaries with a vertical spacing of
up to 60 cm corresponding to 6 kPa (Fig. 2B). Larger DP led frequently to
leaks at the periphery of the membranes. In the case of sorbitol-modified
culture medium this occurred even at lower pressures.
2.8. Cell attachment to alginate membranes
Cell attachment to membranes (post-treated with the crystal gun) was
tested with L929 mouse fibroblasts. L929 cells were cultured in CGM or in
sorbitol-modified culture medium. Culture was performed in a humidified
incubator under 5% CO2 in air. For cell attachment cells were transferred
into the sorbitol-modified culture medium described above.
A droplet containing 2� 106 cells (suspended in the sorbitol-modified
culture medium) was placed on the surface of an alginate membrane of
about 4� 8 cm2. The membrane was pre-treated with 100ml of a
fibronectin solution (0.25mg/ml; Calbiochem, Darmstadt, Germany).
After the cells had attached to the alginate membrane, 12ml sorbitol-
modified culture medium was added. Photographs of the attached cells
were made every 2 or 3 days over a period of about 6 weeks. For electron
microscopy the seeded NT-alginate membranes were washed in 0.25M
HEPES solution, fixed with 2% glutaraldehyde in sodium cacodylate
buffer, treated with 2% osmium tetroxide and afterwards with 1% tannic
acid, both solutions diluted in cacodylate buffer (for more details see
Katsen et al. [34]). After careful dehydration by rising ethanol series,
critical point drying, sputtering with carbon and different heavy metals,
the samples were examined with a variable pressure scanning electron
microscope LEO 435 VP (Carl Zeiss NTS GmbH, Oberkochen, Germany)
using low voltage of 5–10 kV.
2.9. Theoretical considerations
2.9.1. Calculation of the hydraulic conductivity
The hydraulic conductivity, Lp, of the membranes was calculated from
the slope of the volume influx and efflux curves (see further below Fig. 7)
according to Eq. (1) derived from the thermodynamics of irreversible
processes [35,36]:
Jv ¼ 1=A� DV=Dt ¼ LpðDP� sDpÞ, (1)
where Jv is the net volume (water) flow, DV is the volume change in the
capillaries per time interval Dt, DP is the hydrostatic pressure, Dp is the
osmotic pressure exerted by osmolytes and s is the reflection coefficient of
the alginate membrane for the osmolytes (ranging between zero and
unity). Note that in osmotic experiments DP is zero, whereas in
hydrostatic pressure experiments the effective osmotic pressure, sDp, iszero. The quantity A is the effective filtration area of the alginate
membrane. The effective filtration area was less (25.4mm2) than the cross-
sectional area of the central hole of the Plexiglas supports because of the
large lattice of the nylon mesh in relation to the opening. In the case of
perforated membranes the area A in Eq. (1) represents the cross-sectional
area of the pore(s), Ap ¼ p� r2 (provided that the ‘‘background’’ water
permeability of the membrane can be neglected, see further below).
2.9.2. Non-diffusional (Hagen–Poiseuille type) water flow
If the osmotic flow of water proceeds by the mechanism of diffusion
then it can be shown [36] that
LpRT=Vw ¼ Pd (2)
with Pd is the permeability coefficient of the alginate membrane for water
derived from tracer experiments in which the water movement is purely
dictated by self-diffusion and Vw is the partial molar volume of water, R is
the gas constant and T is the absolute temperature in K. Pd is defined as
Dw/d where Dw is the self-diffusion coefficient of free water
(2.4� 10�5 cm2 s�1) and d the thickness of the barrier. The term
LpRT=Vw is very often referred to as Pos, the osmotic permeability
coefficient for water. In contrast, if the volume flow is related to a
Hagen–Poiseuille type then Pos4Pd, i.e. Eq. (2), does not hold. If it is
imagined that the barrier consists of uniform cylindrical pores and that the
flow is laminar the ‘‘equivalent pore radius’’ of alginate membranes can be
calculated from Eq. (2) [37–40]:
r ¼
ffiffiffiffiffiffiffiffiffiffiffiffiffiffiffiffiffiffiffiffiffi8ZdVwPos
RT
s(3)
or after replacement of Pos by Eq. (2):
r ¼ffiffiffiffiffiffiffiffiffiffiffiffiffi8ZdLp
p, (4)
where Z being the viscosity of the osmolyte solution and d is thickness of
the membrane being equal to the length of the pore.
In the case of perforated membranes the radius of the artificially
introduced pores can be determined under the microscope. Therefore, Eq.
(4) can be used for calculation of the theoretically expected hydraulic
conductivity.
2.9.3. Diffusional water flow
The usual assumption for polyacrylamide or agarose gels used for
‘sieving’ macromolecules is that they have little or no effect on the
diffusion of small molecules (such as sorbitol and raffinose). For a review
of diffusion in gels see Muhr and Blanchard [41]. In the light of the
thermodynamics of irreversible processes this means (see above) that the
reflection coefficient and, in turn the effective osmotic pressure, of the low
molecular weight solutes is close or equal to zero. Here, we calculate the
flows expected from diffusive flow in alginate membranes.
The compartments of the permeation cell in Fig. 2A were sufficiently
large, that the concentrations within them did not change significantly
during the experiment (see above). Initially, the solute diffuses into the gel
from compartment 2 eventually reaching the other side, at which point the
solute concentration at the ‘‘water’’ face of the gel is maintained at zero
while that at the ‘‘osmolyte’’ face in compartment 1 is maintained at cs(initial concentration of solute). A steady-state linear concentration
gradient is developed within the gel. The step height of this gradient is
cs, its extent is d (thickness of the gel, assuming the unstirred layers are
thin compared to the gel) and its slope is therefore cs/d. The time taken for
the steady state to become established, t, will be of the order of d2/Ds,
where Ds is the diffusion constant of the solute. During this time, gradients
will be steeper and, accordingly, flows higher than those of the steady state
(and, partially, hydraulic in nature). However, for the substances and gel
thicknesses used here, t lies in the range of 1–5min, i.e. less than the
experimental delay between introduction of solute and the start of flow
measurement. Note that if the solute is retarded (its diffusion constant
within the gel is less than that in free solution but not zero) exactly the
same steady state will form eventually (the boundary conditions on its
gradient are unchanged), it will simply take longer to become established.
Once the steady state is established the solute will diffuse down its gradient
at a molar rate Jsm (mol/s/unit area of gel):
Jsm ¼ Dscs=d (5)
which corresponds to a volume rate, Jsv, (vol/s/unit area of gel, or velocity)
given by
Jsv ¼ DscsV s=d, (6)
where V s is the molar volume of the solute.
A concentration gradient of solute cannot exist without a correspond-
ing concentration gradient of water. The extent of the water gradient is,
again, d and its step height is Dcw (concentration of pure water–water
concentration in the solution). This will induce molar (Jwm) and volume
(Jwv) water flows of
Jwm ¼ DwDcw=d (7)
and
Jwv ¼ DwDcwVw=d, (8)

ARTICLE IN PRESS
1The precipitates apparently occurred from reactions of Ba2+ bound to
the alginate polymeric chains with sulphate in the culture medium.
H. Zimmermann et al. / Biomaterials 28 (2007) 1327–13451332
where Dw and Vw are, respectively, the diffusion constant and molar
volume of water. (Note that Eqs. (7) and (8) are, in fact, very closely
related to Eq. (2).)
The net (observable) volume flow is Jv ¼ Jwv�Jsv or
Jv ¼ ðDwDcwVw �DscsV sÞ=d. (9)
Note that all the terms of Eq. (9) are known, either from physico-
chemical data or from the experimental setup, there are no free
parameters.
Mixing x mol of water with y mol of solute should give a solution with
volume Q, where
Q ¼ xVw þ yV s
or
1 ¼ Vwx=Qþ V sy=Q ¼ Vwcw þ V scs
or
cw ¼ ð1� V scsÞ=Vw, (10)
where cw is the concentration of water in the solution. (The term V scs is
the volume fraction of the solute.)
If C0 is the concentration of pure water (¼ 1=Vw) then
Dcw ¼ C0 � cw
or
Dcw ¼ V scs=Vw. (11)
It is possible for Dcw to be somewhat larger than this value if the solute
has strongly bound water.
Substituting this in Eq. (9) gives
Jv ¼ ðDwV scs �DsV scsÞ=d
or
Jv ¼ DwV scsð1�Ds=DwÞ=d. (12)
Note that the diffusion constant of the solute appears only in the term
(1�Ds/Dw). So if it is small compared to the diffusion constant of water it
has a very weak effect on the steady-state flow and it is not necessary to
have a highly accurate value for it.
3. Results
3.1. Mechanical and elastic properties of alginate
membranes
Membranes of NT-alginate (1:1 mixtures of L. nigrescens
and L. trabeculata alginates; final composition: about 35%M and 65% G) were transparent. Cross-linking reduced gelarea by �14–19%, independent of spacer and cross-linkingtime, to about 40 cm2 (about 8.5 cm in length and 4.7 cm inwidth). Membrane thickness was more variable. 2-h cross-linking reduced thickness by about 50% (spacer 1.5mm:thickness 0.7370.19mm, n ¼ 42; spacer 2mm: thickness1.0370.30mm, n ¼ 13) and 15-h by about 65% (spacer1.5mm: 0.5370.20mm, n ¼ 14; spacer 2mm: 0.7670.32mm, n ¼ 30). Area and thickness remained constantduring 1 day in distilled water. Crystal bombardmentfurther decreased area and thickness by about 15% and10%, respectively. Transfer of crystal-bombarded mem-branes from water to sorbitol-modified culture mediumresulted in unidirectional swelling. Thickness increased30% and area fell o4% in 2 days, both remaining constantthereafter.
Membranes remained clear after crystal bombardmentbut some tiny precipitates were seen very frequently inculture medium but only occasionally after long-termstorage in sorbitol-modified culture medium at 37 1C.1
Extension of cross-linking time from 2 to 15 h and,particularly, crystal bombardment considerably increasedthe mechanical stability and flexibility of the membranes.Mechanical introduction of up to 60 pores of about 200 mmin diameter per 8 cm2 did not change mechanical stabilityor elasticity (data not shown).Burst pressures of membranes stored in distilled water
for up to 6 weeks at room temperature are listed in Table 1.Despite scatter due to thickness variation some trends areclear. The 1-day burst pressure of conventionally preparedmembranes increased with increasing spacer thickness andcross-linking time. The highest values (about 226 kPa)occurred at 2mm and 15 h. Crystal bombardment con-siderably increased burst pressure. Even after a cross-linking time of 2 h, burst pressures were measured at250 kPa. After 15 h cross-linking, values were often above300 kPa. Spacer thickness did not seem to affect the burstpressure of bombarded membranes. Several weeks’ storagein distilled water reduced burst pressures of thin 2-hconventionally cross-linked membranes significantly butdid not affect those of 15-h or bombarded membranes.Transfer of membranes into sorbitol-modified solutionmarkedly reduced the burst pressure of bombardedmembranes but had less effect on conventionally cross-linked ones. Membranes cross-linked for 15 h and bom-barded with crystals gave best results under culturemedium conditions, even though the average burst pressurewas much lower than in distilled water. After several weeksof incubation in sorbitol-modified culture medium anaverage burst pressure of about 77 kPa was measured (seeTable 1).Burst pressure measurements showed that the addition
of protein before cross-linking did not improve themechanical, elastic or swelling properties of the membranes(data not shown), in contrast with results for alginatemicrocapsules [16]. Dehydration and subsequent re-hydra-tion gave very thin NT-alginate membranes (around0.1mm) showing no swelling and remaining very stableand elastic when incubated for X2 weeks in distilled water.The burst pressures of these membranes were beyond therange of the air-inflation device (data not shown). Bycontrast, re-hydrated membranes incubated in sorbitol-modified culture medium did swell (up to 0.4mm) and hadburst pressures similar to those in Table 1.
3.2. Sandwich composition of cross-linked alginate
membranes
NMR imaging revealed a layered structure for con-ventionally cross-linked and bombarded membranes.

ARTICLE IN PRESS
Table 1
Burst pressure of alginate membranes
Production parameters Storage medium Burst pressure (kPa)
Spacer (mm) Cross-linking time (h) Crystal gun 1 day storage (n) 2–6 weeks storage (n)
1.5 2 � Distilled water 74757 (14) 59724 (14)
2.0 2 � Distilled water 108756 (15) 100767 (31)
1.5 15 � Distilled water 143732 (15) 129746 (22)
2.0 15 � Distilled water 226788 (17) 3167110 (11)
1.5 2 + Distilled water 2527102 (41) 2997104 (25)
2.0 2 + Distilled water 243776 (34) 2517102 (15)
1.5 15 + Distilled water 300776 (29) 3147147 (6)
2.0 15 + Distilled water 325784 (42) 3177120 (25)
1.5 2 � Sorbitol-modified culture medium 40730 (12) 34721 (42)
1.5 15 � Sorbitol-modified culture medium 108730 (17) 41726 (37)
1.5 2 + Sorbitol-modified culture medium 74733 (12) 49716 (28)
1.5 15 + Sorbitol-modified culture medium 136746 (13) 77733 (35)
Fig. 3. Logarithmic T1 maps of alginate membranes (spacer 1.5mm)
cross-linked conventionally for 2 (A–C) or 15 h (E–G) and bombarded
with BaCl2 crystals (exposed surface upturned). Images of non-
bombarded membranes (cross-linked for 2 h and 15 h) are given in (D
and H), respectively. The T1 relaxation times are false coloured (blue
corresponds to the T1 of free water).1H-NMR-imaging was performed on
membranes exposed to Cu2+ in distilled water for 24 h and washed
afterwards for further 24 h with Cu2+-free distilled water. NMR-
measurements were conducted in distilled water. For technical details,
see Section 2. A, E, D, H ¼ NT-alginate membranes (a 1:1 mixture of
high-G and high-M alginates); B, F ¼ membranes made up of high-G; C,
G ¼ membranes made up of high-M. Note that the T1 relaxation times
decrease from the periphery of the membranes towards the membrane
interior and may increase again within the core (except in the membranes
of C, E, G and H).
H. Zimmermann et al. / Biomaterials 28 (2007) 1327–1345 1333
Typical T1 maps together with line-scans of membraneswith different M/G ratios are given in Figs. 3 and 4. ForNT-alginate membranes cross-linked for 2 h, the T1
relaxation time decreased from the periphery towards thecore where it increased again. This was seen whether or notthe membranes were bombarded with crystals (A, D inFigs. 3 and 4). However, there were indications (compare Awith D) that bombardment further enhanced T1 within thecore. Therefore, the core and periphery of 2-h cross-linkedmembranes contained less-bound Cu2+ than does theintermediate region. This sandwich composition of 2-hcross-linked NT-alginate membranes was also observedwhen membranes were exposed to Cu2+ for 9 days or whenthe pH was lowered to 5 (data not shown), thus excludingthe possibility that a tight network in the peripheral layersprevented diffusion of the Cu2+ into the core [26].
The sandwich structure could not be detected in 15-hcross-linked NT-alginate membranes with or withoutbombardment (Fig. 3E and H). Fifteen-hour cross-linkinggave a symmetric, parabolic profile of T1-values through-out the cross-section (Fig. 4E and H). T1-peaking in thecore region of 2-h, but not of 15-h cross-linked membraneswas also found for NT-alginate membranes exposed to290mosmol kg�1 PEG 6000 solution (data not shown).Fifteen-hour membranes were very thin (see Fig. 3),particularly in the presence of PEG 6000 (see furtherbelow Table 3A). Therefore, it is not clear whether thedisappearance of the T1-peaking in the core region was realor resulted from the limited resolution of the NMRimaging technique. Experiments with high-G alginaterevealed that T1-peaking in the core region depended onmembrane thickness. Shrinkage of these membranes during15-h exposure to Ba2+ was much less than in the case ofNT-alginate membranes. As indicated in Fig. 3F, thesandwich composition could be resolved in high-Gmembranes cross-linked for 15 h and post-treated withBaCl2 crystals. As in the case of NT-membranes, thesandwich composition persisted after 9-d Cu2+-exposure(data not shown). However, membranes of high-M alginate
had nearly constant T1 throughout even at 2-h cross-linking (C, G in Fig. 3) and the line-scans (C, G in Fig. 4)frequently revealed a symmetric, parabolic profile. Crystal-bombarded NT-alginate membranes washed and incubatedin sorbitol-modified culture medium did not exhibit asandwich structure (data not shown). The NMR contrastof these membranes was very poor and T1 throughout themembrane was similar to that of the surrounding mediumimplying no significant Cu2+ binding.
3.3. Topography of alginate membranes
AFM gave information about the effect of the filter usedin the manufacturing process. Imaging of conventional

ARTICLE IN PRESS
A E
B
C
F
D
G
H
Fig. 4. Line scans corresponding to the T1 maps of Fig. 3. Note the more and less symmetric, parabolic decrease of T1 from the periphery to the core
region. This is particularly distinct in images of membranes cross-linked for 15 h. Also A, B and D show sharp increase of the T1 in the core. Outside the
membranes the T1 assumed the value for free water (about 3000ms), except in B, C and D. In these cases there was—if any—only a very thin layer of water
between the NMR glass cuvette (marked by vertical dashed lines) and the membrane, m, because of the large size of the specimen. This led to a lowering of
the T1-values.
H. Zimmermann et al. / Biomaterials 28 (2007) 1327–13451334

ARTICLE IN PRESS
10 μm
10 μm
A1
A2
10 μm
10 μm
B1
B2
10 μm
10 μm
C2
C1
5 μm
Δ
Fig. 5. AFM images of the filter used for manufacturing alginate membranes (A1, A2) and of membranes cross-linked for 2 h and post-treated with BaCl2crystals (B1, B2: exposed surface; C1, C2: non-exposed surface). Images are given in the left-shaded shadow mode. The crevice in C1, discrete positive (C2)
and negative (A2, B1, B2) structural elements are marked by rectangles and circles, and the ‘‘micro-crater’’ in B1 by an arrow. Inset: definition of the
‘‘next neighbour distance’’.
H. Zimmermann et al. / Biomaterials 28 (2007) 1327–1345 1335
membranes in distilled water was only possible after 15-hcross-linking as the surface of 2-h membranes was too softfor artefact-free images.2 However, crystal bombardmentgave stiff surfaces that could be scanned in distilled waterafter only 2-h cross-linking. Sorbitol incubated membraneswere difficult to scan due to swelling but the same typicalstructural elements of the surfaces could be seen. Coatingthe surface with fibronectin (and the associated shortdrying) had no effect on the topographical features.Therefore, the images discussed below were all acquiredin distilled water.
Figs. 5 and 6 show two representative images of a filterpore structure and selected topographical features ofalginate membranes. They are depicted in the left-shaded‘‘shadow mode’’ that gives a three-dimensional impressionof the microscopic surface structure [30].
The mean ‘‘micro-roughness’’ of the surface, Ra, wasdetermined in 10� 10 mm2 areas not exhibiting largecorrugations. 15-h cross-linked membranes had averageRa-value of 38721 nm (n ¼ 36). Post-treatment with BaCl2crystals significantly increased the roughness althoughthere was no significant difference between Ra of theexposed and un-exposed sides (63739 nm; n ¼ 78 versus
67736 nm; n ¼ 92). The average surface roughness waseven higher for membranes bombarded with crystals after2-h cross-linking but, again, no significant difference
2Preliminary studies yielded similar results for high-M alginates,
whereas high-G alginates could be scanned even after a 2-h cross-linking
time.
between exposed and un-exposed sides (97763 nm;n ¼ 69 versus 92743 nm; n ¼ 81).Regardless of manufacturing process, there were two
kinds of structural elements: (i) regular, discrete ‘‘positive’’elements (protrusions of up to 600 nm; see e.g. C2 in Fig. 5)and (ii) single crevices (see e.g. A2 and C2 in Fig. 6) andgroups of crevices that were more or less aligned (C1 andC2 in Fig. 5).3 Discrete ‘‘negative’’ structural elements (i.e.pits) were only found after crystal bombardment (see e.g.B1 and B2 in Fig. 5).There were large numbers of discrete positive elements
on 15-h conventional membranes. These were also seen onboth surfaces of bombarded membranes (A1 in Fig. 6),whatever the cross-linking time, and were best resolved incrater-free areas. The regularity and frequency of theseelements suggested that they were imprints of the (negative)pores of the filters (A1 and A2 in Fig. 5), even though filterswere rougher (150722 nm; n ¼ 72) than the membranesand the protrusions were smaller than the filter pores(2.570.7 mm; n ¼ 288) and somewhat different in shape.The average diameter of the protrusions was comparablefor bombarded and non-bombarded membranes, butdepended on cross-linking time (2-h: 1.6–1.7 mm; 15-h:1.2–1.3 mm). The mismatch between membrane and filterelements obviously stemmed from contraction on gelling.Interactions between structural elements and the AFM
tip [42] complicate correlation of protrusion diameter and
3Note that in B2 of Fig. 6 the crevice (at the right-hand side of the
image) was associated with many wrinkles, i.e. positive folds (see the
marker in the image). These wrinkles were only found on surfaces of 15-h
cross-linked membranes that were exposed to BaCl2 crystals.

ARTICLE IN PRESS
10 μm
10 μm 10 μm
10 μm
C1
C2B2
10 μm
10 μm
B1A1
A2
Fig. 6. AFM images of conventional membranes cross-linked for 15 h (A1, A2) and bombarded 15-h membranes (B1, B2: exposed surface; C1, C2: non-
exposed surface). Images are given in the left-shaded shadow mode. Wrinkles in B2; crevices in A2, C2; discrete positive elements in A1, C1 and negative
(B1) elements are marked.
Table 2
‘‘Next-neighbour distances’’ of negative and positive structural elements in alginate membranes revealed by AFM
Filter pores Silicone imprint Two hours cross-linked and crystal-
bombarded
Fifteen hours cross-linked and
crystal-bombarded
Fifteen hours
conventionally
cross-linkedExposed surface Non-exposed
surface
Exposed surface Non-exposed
surface
Distance (mm) 2.9270.52 2.8770.32 2.3670.46 2.5370.50 2.4770.48 2.3870.49 2.5270.51
Contraction
(%)
0 2 20 13 16 18 14
N 96 96 120 120 120 120 120
H. Zimmermann et al. / Biomaterials 28 (2007) 1327–13451336
shape with cross-linking time but do not affect thedetermination of the ‘‘next neighbour distance’’, D, ifregular patterns exist. Twenty-four D values for filter poresand membrane protrusions were calculated from each of4–5 images (inset of A1 of Fig. 5) and their averages arelisted in Table 2. D for the protrusions was of the sameorder as D for the pores, although 13.4–19.2% smallerdepending on the manufacturing process, which accordswith the small lateral contraction on gelling. Also, D for theimprints of the pores in silicone (known for minimalshrinkage) is identical to D for the pores themselves.
Crevices were seen both on bombarded and conventionalmembranes and, therefore, are not generated by the crystalstream although it might amplify them. We think that themajority of crevices originate from inhomogeneous shrink-age. Crevices were seen on both exposed and un-exposedsides whereas discrete negative structural elements were
restricted to the exposed surface. The exposed surfacessporadically showed ‘‘micro-craters’’ (see the arrow in B1
of Fig. 5) and, sometimes, grouped discrete negativestructural elements (see the circles in B2 of Fig. 5 and inB1 of Fig. 6). Micro-craters were seen both after 2- and15-h cross-linking and had a diameter of a few micro-meters. The large craters seen by phase contrast micro-scopy were only observed in membranes cross-linked for2 h (data not shown). The diameters of the large craters(250–350 mm) correspond quite well with the initial averagediameter of the injected crystals. However, numerous smallcrystals are generated by collision in the jet stream(unpublished results) so it is quite likely that ‘‘micro-craters’’ also arise from the bombardment. AFM cannotprobe deep enough to determine whether the negativestructural elements (including the micro-craters) representcontinuous pores through the membranes.

ARTICLE IN PRESSH. Zimmermann et al. / Biomaterials 28 (2007) 1327–1345 1337
3.4. Osmotically induced water flow
Fig. 7A and B show typical influx and efflux curvesinduced by 290mosmol kg�1 non-electrolytes. The lineswere fitted by least squares and the squared correlationcoefficient, r2 was usuallyX0.98 (see e.g. Fig. 7A). Only forsorbitol the r2-value was somewhat smaller (around 0.96)because of the very small volume flows. Flows calculated
-300
-200
-100
0
100
200
300
0 10 20 30 40 50 60
0 10 20 30 40 50 60
-20
-10
0
10
20
0 5 10 15 20 25
-30
-20
-10
0
10
20
30
volu
me
, μl
volu
me,
μlvolu
me,
μl
ΔV/Δt = 5.2 μl/min
ΔV/Δ t = -5.1 μl/min
ΔV/Δt = 0.4 μl/min
ΔV/Δt = -0.4 μl/min
ΔV/Δt = 0.9 μl/min
ΔV/Δt = -1.1 μl/min
B
C
A
time, min
Fig. 7. Typical recordings of osmotically (A and B) and hydrostatically
(C) induced water flows across planar bombarded 15-h alginate
membranes. Compartment (2) of the permeation cell shown in Fig. 2
was filled with 290mosmol kg�1 PEG 6000 (A) or sorbitol (B) whereas
compartment ‘‘1’’ contained distilled water. In C, both compartments
were filled with water, and the flow was induced by a hydrostatic pressure
difference of 1 kPa (by using the set-up of Fig. 2B). The plots show the
volume changes in the capillaries with time. Influx into compartment ‘‘2’’
is filled circles and efflux from compartment ‘‘1’’ is open circles. The good
agreement between the slopes DV/Dt of the influx and efflux curves shows
water loss and swelling were negligible.
from influx and efflux data were practically identical foreach osmolyte indicating that no water loss or membraneswelling occurred. Also, membrane thickness was mea-sured before and after flow and did not change. Themembrane thickness and water flows (at least wheninduced by PEG 6000 and raffinose) depended on thethickness of the original spacer (Table 3A). However,membrane thickness was specifically affected by eachosmolyte. Table 3A shows that membranes exposed toPEG 6000 were always very thin (between 0.13 and0.18mm) while membranes pre-incubated in sorbitol orraffinose solution exhibited large variations (ranging from0.27 to 0.50mm).Despite the application of the same osmolality of
290mosmol kg�1 (osmotic pressure, Dp, of about720 kPa), the water flows, Jv, induced by sorbitol(Fig. 7B) and raffinose (data not shown) were much lessthan those induced by PEG 6000 (Fig. 7A). With stirring(see Table 3A), Jv for membranes from the 1.5-mm spacerwere about 0.3� 10�6m s�1 (sorbitol), 1.2� 10�6m s�1
(raffinose) and 3.1� 10�6m s�1 (PEG 6000). Except forsorbitol, the flow decreased by a factor of about 1.5 whenmembranes were prepared with a 2-mm spacer. Thevolume flows induced by PEG 6000 did not decrease asmuch as expected when the osmolality was reduced to120mosmol kg�1. Water flows were generally lower with-out stirring and 15-h, non-bombarded membranes yieldedsimilar flows to bombarded ones.Table 3B lists water flow in the presence of NaCl.
Replacement of water in the donor compartment by290mosmol kg�1 NaCl gave no flow. A 1:1 mixture ofisotonic NaCl and sorbitol (or PEG 6000) led to waterflows of the order of magnitude measured without NaCl.RPMI 1640 culture medium (with or without 10% FCS) orsorbitol-modified medium produced flows between0.3� 10�6 and 0.5� 10�6m s�1. The highest flows occurredon replacing 150mosmol kg�1 NaCl of RPMI with150mosmol kg�1 PEG 6000 and were about 50% of thosefound using the osmolytes in water.
3.5. Hydrostatically induced water flow
We used only 15-h bombarded membranes for measur-ing pressure driven flow because of their high stability andflexibility. Flow was calculated when the slopes of influxand efflux curves were practically identical (Fig. 7C). Thevalues of the squared correlation coefficient, r2, were about0.96. Hydraulic conductivity, Lp decreased with increasingpressure both in distilled water and sorbitol-modifiedculture medium (Table 4). Therefore, pressure-inducedleaks are not responsible for the relatively large conductiv-ity. Lp measured at high pressure differences, DP, wasof the order of that obtained with PEG 6000 but atlow DP (0.1 kPa) it was very much higher (up to30.8� 10�10mPa�1 s�1).Pores created with a 200 mm cannula increased water
flow and hydraulic conductivity by several orders of

ARTICLE IN PRESS
Table 3A
Water flow through 15-h cross-linked alginate membranes induced by non-electrolytes
Production parameters Osmolytes,
mOsm
Membrane
thickness (mm)
(n)
Jv,exp(10�6m s�1)
(n)
sLp,exp
(10�12mPa�1 s�1)
Jv,theoa
(10�6m s�1)
Posb
(10�4m s�1)
rc (nm)
Spacer (mm) Crystal gun
1.5 + Sorbitol, 290 0.2870.15 (12) 0.370.1 (4) 0.370.1 0.370.15 — —
0.270.1(4)d 0.370.1d
2.0 + Sorbitol, 290 0.4170.11 (9) 0.370.2 (5) 0.470.2 0.370.05 — —
0.270.1 (4)d 0.370.1d
1.5 + Sorbitol, 150 0.2770.06 (3) 0.270.1 (3) 0.470.1 0.270.03 — —
1.5 + Raffinose, 290 0.3070.12 (11) 1.270.2 (3) 1.770.4 0.870.3 — —
0.770.1 (4)d 1.070.1d
2.0 + Raffinose, 290 0.5070.06 (4) 0.670.2 (4) 0.870.2 0.670.1 — —
1.5 + PEG 6000, 290 0.1370.05 (12) 3.170.3 (4) 4.470.4 3.771.4 6.070.6 4.870.3
2.570.2 (4)d 3.770.5d
2.0 + PEG 6000, 290 0.1470.02 (5) 2.270.4 (5) 3.170.7 3.470.5 4.371.0 4.870.8
1.5 + PEG 6000, 120 0.1370.03 (4) 2.170.4 (4) 6.571.3 1.570.4 9.071.8 4.770.5
2.0 + PEG 6000, 120 0.1870.09 (4) 1.770.3 (4) 5.570.9 1.170.6 7.571.3 5.070.8
1.5 � PEG 6000, 290 0.1370.03 (4) 2.870.5 (4) 4.170.8 3.770.9 5.771.0 5.270.6
2.0 � PEG 6000, 290 0.1570.04 (4) 1.870.3 (4) 2.470.5 3.270.9 3.370.6 4.370.3
aCalculated according to Eq. (12) using Dw ¼ 2.5� 10�5 cm2 s�1. The diffusion constant for PEG, o10�6 cm2 s�1 under a variety of conditions [66] is
small enough to be ignored for the purposes of this calculation. Other diffusion constants are from standard tables. The flow induced by NaCl under the
conditions described in the text was calculated as 0.00970.002� 10�6m s�1 (below the experimental detection limit). The ‘errors’ in this column represent
the spread of membrane thicknesses used at each point.bCalculated according to Eq. (2) by assuming sPEG ¼ 1 in Eq. (1).cCalculated according to Eq. (4) by assuming sPEG ¼ 1 in Eq. (1).dNo stirring conditions.
Table 3B
Water flow through 15-h cross-linked alginate membranes induced by non-electrolytes in the presence of NaCl
Production parameters Osmolytes Osmolality of
NaCl (mOsm)
Membrane
thickness (mm)
Jv (10�6m s�1) sLp
(10�12mPa�1 s�1)
n
Spacer (mm) Crystal gun
1.5 + NaCl 290 0.2370.11a n.d.b — 3
1.5 + Sorbitol/NaCl 150 0.3070.00 0.370.1 0.570.2 3
1.5 + PEG6000/NaCl 150 0.1370.06 0.870.2 1.470.3 3
1.5 + Culture medium 290 0.2070.10a 0.570.1 0.770.2 3
1.5 + FCS-free culture medium 290 0.2070.12a 0.370.1 0.570.1 4
1.5 + Sorbitol-modified culture
medium
150 0.4570.15 0.470.1 0.670.1 5
1.5 + PEG 6000-modified culture
medium
150 0.2470.07 1.070.1 1.670.2 6
aNote that the membranes were not pre-incubated overnight due to excessive swelling which prevented pressure-tight clamping of the membranes in the
permeation cell. Note further that during the flow measurements the membrane thickness increased by a factor of 2–3. Due to this water influx and efflux
was not always linear with time. Data for membrane thickness represent the initial values before swelling.bn.d. ¼ not detectable.
H. Zimmermann et al. / Biomaterials 28 (2007) 1327–13451338
magnitude. At DP ¼ 0.1 kPa, high flows restricted mea-surement time to about 2–10min. Lp was roughly propor-tional to the number of the pores and the ‘‘background’’conductivity can be neglected. Columns seven and eight ofTable 5 compare experimental and calculated values of Lp
per pore using the average pore radii determined bymicroscopy. These radii varied between 97 and 119 mmbecause of gel deformation. The theoretical values may beoverestimated as any narrowing of the pore within themembrane disproportionately reduces flow but the agree-ment between theoretical and experimental data is quite
satisfactory and justifies the conclusion that hydraulicconductivity is exclusively determined by the pores.We observed 20–40% shrinkage of the pores in sorbitol-
modified culture medium so more pores were required toreach a given level of the hydraulic conductivity.
3.6. Cellularised alginate membranes
Alginate membranes swelled in conventional culturemedia (such as CGM) and disintegrated within 2 days(whether conventionally cross-linked or bombarded). The

ARTICLE IN PRESS
Table 5
Pressure-induced water flow through 15-h cross-linked, crystal-bombarded and perforated alginate membranes incubated in distilled water (DP ¼ 0.1 kPa)
Production parameters Pore radius
(mm)
Lp,expa
(10�6mPa�1 s�1)
Lporep;exp
b
(10�3mPa�1 s�1)
Lporep;theo
c
(10�3mPa�1 s�1)
n
Spacer
(mm)
Cross-linking
time (h)
Membrane
thickness (mm)
Pores
1.5 2 0.3070.04 1 9872 2.670.5 2.270.5 4.070.6 4
1.5 2 0.5270.18 2 105714 3.071.5 1.270.7 2.870.5 6
2.0 2 0.8070.10 1 107713 3.070.8 2.270.5 1.870.3 7
2.0 2 0.8070.08 2 9776 4.771.1 2.070.6 1.570.2 6
2.0 15 0.3770.04 1 107716 2.870.9 2.171.0 3.971.4 11
2.0 15 0.4070.08 2 9775 4.870.5 2.170.3 3.270.7 8
1.5 2 0.4470.17 6 10078 13.370.8 1.870.3 3.170.9 4
2.0 2 0.4670.09 6 11973 18.772.7 1.870.2 3.970.9 4
2.0 15 0.2370.03 6 9973 13.871.7 1.970.2 5.370.7 3
aHydraulic conductivity per effective filtration area, A (Eq. (1)).bHydraulic conductivity of a single pore, i.e. by assuming that water flow occurred exclusively through the pores (Eq. (1), A replaced by Ap ¼ the area of
the pores).cHydraulic conductivity of a single pore calculated theoretically from the pore radius and the membrane thickness (Eq. (4)).
Table 4
Hydrostatically induced water flow through 15-h cross-linked alginate membranes
Production parameters Medium Membrane
thickness (mm)
DP (kPa) Jv (10�6m s�1) Lp (10�10mPa�1 s�1) r (nm) n
Spacer (mm) Crystal gun
1.5 + Distilled water 0.2270.07 0.1 0.270.1 19.577.1 60716 5
1.5 + Distilled water 0.2170.08 1 0.570.2 5.471.8 30710 4
1.5 + Distilled water 0.1370.03 4 1.370.1 3.270.3 1973 3
1.5 + Distilled water 0.1570.00 6 1.770.1 2.970.1 1971 3
1.5 + Sorbitol-modified culture medium 0.3270.08 0.1 0.370.1 30.8713.2 87719 7
1.5 + Sorbitol-modified culture medium 0.3770.14 1 0.370.1 2.771.2 28711 8
H. Zimmermann et al. / Biomaterials 28 (2007) 1327–1345 1339
unidirectional swelling could be limited to about 30%when NaCl was replaced partly by sorbitol, which, unlikePEG 6000 did not affect cell viability. Proliferation wasalso of the same order of magnitude as in normal culturemedium (data not shown). In screening experiments,murine L929 fibroblasts could attach to conventionalalginate membranes from sorbitol medium, but onlysporadically and/or to small restricted areas. Exposure ofthe membranes for 10min to air, followed by surfacetreatment with 100 ml of fibronectin solution and subse-quent 10-min drying gave enhanced but still rather poorand irreproducible cell adhesion. Best results were obtainedafter fibronectin treatment of bombarded membranes.AFM showed the membrane topography to be unchangedby fibronectin treatment (data not shown). Attachment,spreading and migration were greatly improved when cellswere pre-cultured in sorbitol-modified medium for 2 daysand high cell concentrations (about 2� 106 cells permembrane) were inoculated. For membranes dried tem-porarily for about 10min before seeding, confluence couldbe obtained within 3–6 days. After confluence, prolifera-tion continued covering the attached cells with a layer thatcould be easily removed by washing. Representative opticaland SEM images of cellularisation are shown in Fig. 8. Cellattachment and spreading were restricted to the alginate
membrane and greatly facilitated by large fissures(Fig. 8B). In perforated membranes, cells often migratedinto pores and attached to the pore walls (Fig. 8C),reducing the hydraulic conductivity by one to two orders ofmagnitude (data not shown). Introducing new pores couldrestore water permeability. Optical (Fig. 8D) and, particu-larly, SEM images (Fig. 8E and F) revealed microvilli andfilopodia as seen during migration on other substrates [30].Confluence was achieved within 2 days on bombardedareas. After 1 month (data not shown), cellularisedmembranes had not disintegrated and were still mechani-cally stable and showed no loss of cell viability.
4. Discussion
4.1. Structural composition of alginate membranes
Crystal-bombarded membranes were characterised byextremely high mechanical strength and flexibility whenincubated in distilled water. They could withstand pres-sures of 300–400 kPa before rupture. Introduction of up to60 200 mm-diameter pores per 8 cm2 membrane did notdegrade stability and flexibility. These properties stem fromthe balance of blocks of poly-mannuronate and poly-guluronate in the alginate. Divalent ions interact differently

ARTICLE IN PRESS
Fig. 8. Optical (A–D) and SEM images (E–F) of murine L929 cells attached to bombarded 15-h membranes. Photographs were taken 1 day (A and B), 5
days (C and D) and 7 days (E and F) after seeding. Note that cell attachment and spreading were restricted to the alginate sheet (A) and favour the crevices
(B). Micrograph C shows a 200-mm pore colonised by L929 cells. Black bars are 100mm (A–D), and white bars are 10 mm (E and F).
H. Zimmermann et al. / Biomaterials 28 (2007) 1327–13451340
with MM-, GG- and MG-blocks causing differing mem-brane properties. Membrane stiffness increases in theorder: MG-blocksoMM-blocksoGG-blocks and elasti-city in the order: GG-blocksoMM-blocksoMG-blocks[16,43]. From Ca2+ gelling of low-viscosity alginates,guluronate blocks are implicated in the selective bindingof the divalent cations [43] that induce chain–chainassociation. Grant et al. [44] and Rees and Welsh [45]have formulated the ‘‘egg box model’’ for junction zones.The model’s validity has been confirmed by molecularmodelling [46]. In the egg box, two helical chains formstrongly associated structures. Van der Waals and hydro-gen bonding play important roles in the formation ofcompact dimers with cavities. The oxygen-containinggroups of the guluronate cavities can chelate divalent ionswhile the flat mannuronate chains cannot. With enoughdivalent cations, the preformed guluronate dimers canassociate laterally to form a three-dimensional network.The lateral associations of guluronate dimers (like associa-
tions of poly-mannuronate) involve weaker interactionsthat display no particular specificity and seem to be mainlygoverned by electrostatic interactions. Donati et al. [47]have shown that GG- and MG-blocks can form mixedjunctions. The ‘‘zipping’’ of long alternating sequences insecondary MG/MG-junctions combined with a growth ofjunction zones was suggested to account (together with theMM-blocks) for the syneresis of alginate gels [47].Syneresis is a term describing the macroscopic shrinkage
of low-viscosity alginate gels with water exudation onincreasing Ca2+ concentration [43,47,48]. Interestingly,Draget et al. [43] found that syneresis increased withincreasing molecular weight (i.e. viscosity) of the alginates.Consistent with this, we observed a dramatic decrease inmembrane thickness when UHV alginates were exposed tohigh Ba2+ concentrations, particularly with bombardment.This is also obvious from the 1H-NMR-images and linescans of high-G, high-M and NT-alginates (Figs. 3 and 4).The images show maximum shrinkage for NT- and high-M
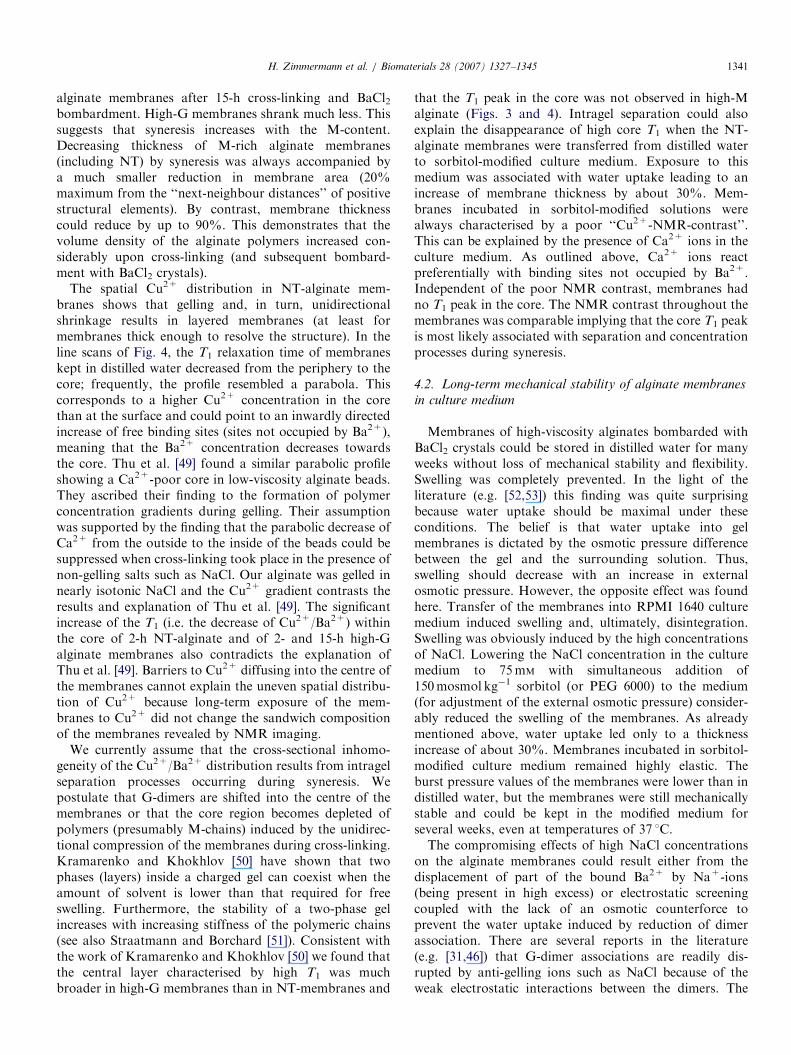
ARTICLE IN PRESSH. Zimmermann et al. / Biomaterials 28 (2007) 1327–1345 1341
alginate membranes after 15-h cross-linking and BaCl2bombardment. High-G membranes shrank much less. Thissuggests that syneresis increases with the M-content.Decreasing thickness of M-rich alginate membranes(including NT) by syneresis was always accompanied bya much smaller reduction in membrane area (20%maximum from the ‘‘next-neighbour distances’’ of positivestructural elements). By contrast, membrane thicknesscould reduce by up to 90%. This demonstrates that thevolume density of the alginate polymers increased con-siderably upon cross-linking (and subsequent bombard-ment with BaCl2 crystals).
The spatial Cu2+ distribution in NT-alginate mem-branes shows that gelling and, in turn, unidirectionalshrinkage results in layered membranes (at least formembranes thick enough to resolve the structure). In theline scans of Fig. 4, the T1 relaxation time of membraneskept in distilled water decreased from the periphery to thecore; frequently, the profile resembled a parabola. Thiscorresponds to a higher Cu2+ concentration in the corethan at the surface and could point to an inwardly directedincrease of free binding sites (sites not occupied by Ba2+),meaning that the Ba2+ concentration decreases towardsthe core. Thu et al. [49] found a similar parabolic profileshowing a Ca2+-poor core in low-viscosity alginate beads.They ascribed their finding to the formation of polymerconcentration gradients during gelling. Their assumptionwas supported by the finding that the parabolic decrease ofCa2+ from the outside to the inside of the beads could besuppressed when cross-linking took place in the presence ofnon-gelling salts such as NaCl. Our alginate was gelled innearly isotonic NaCl and the Cu2+ gradient contrasts theresults and explanation of Thu et al. [49]. The significantincrease of the T1 (i.e. the decrease of Cu2+/Ba2+) withinthe core of 2-h NT-alginate and of 2- and 15-h high-Galginate membranes also contradicts the explanation ofThu et al. [49]. Barriers to Cu2+ diffusing into the centre ofthe membranes cannot explain the uneven spatial distribu-tion of Cu2+ because long-term exposure of the mem-branes to Cu2+ did not change the sandwich compositionof the membranes revealed by NMR imaging.
We currently assume that the cross-sectional inhomo-geneity of the Cu2+/Ba2+ distribution results from intragelseparation processes occurring during syneresis. Wepostulate that G-dimers are shifted into the centre of themembranes or that the core region becomes depleted ofpolymers (presumably M-chains) induced by the unidirec-tional compression of the membranes during cross-linking.Kramarenko and Khokhlov [50] have shown that twophases (layers) inside a charged gel can coexist when theamount of solvent is lower than that required for freeswelling. Furthermore, the stability of a two-phase gelincreases with increasing stiffness of the polymeric chains(see also Straatmann and Borchard [51]). Consistent withthe work of Kramarenko and Khokhlov [50] we found thatthe central layer characterised by high T1 was muchbroader in high-G membranes than in NT-membranes and
that the T1 peak in the core was not observed in high-Malginate (Figs. 3 and 4). Intragel separation could alsoexplain the disappearance of high core T1 when the NT-alginate membranes were transferred from distilled waterto sorbitol-modified culture medium. Exposure to thismedium was associated with water uptake leading to anincrease of membrane thickness by about 30%. Mem-branes incubated in sorbitol-modified solutions werealways characterised by a poor ‘‘Cu2+-NMR-contrast’’.This can be explained by the presence of Ca2+ ions in theculture medium. As outlined above, Ca2+ ions reactpreferentially with binding sites not occupied by Ba2+.Independent of the poor NMR contrast, membranes hadno T1 peak in the core. The NMR contrast throughout themembranes was comparable implying that the core T1 peakis most likely associated with separation and concentrationprocesses during syneresis.
4.2. Long-term mechanical stability of alginate membranes
in culture medium
Membranes of high-viscosity alginates bombarded withBaCl2 crystals could be stored in distilled water for manyweeks without loss of mechanical stability and flexibility.Swelling was completely prevented. In the light of theliterature (e.g. [52,53]) this finding was quite surprisingbecause water uptake should be maximal under theseconditions. The belief is that water uptake into gelmembranes is dictated by the osmotic pressure differencebetween the gel and the surrounding solution. Thus,swelling should decrease with an increase in externalosmotic pressure. However, the opposite effect was foundhere. Transfer of the membranes into RPMI 1640 culturemedium induced swelling and, ultimately, disintegration.Swelling was obviously induced by the high concentrationsof NaCl. Lowering the NaCl concentration in the culturemedium to 75mM with simultaneous addition of150mosmol kg�1 sorbitol (or PEG 6000) to the medium(for adjustment of the external osmotic pressure) consider-ably reduced the swelling of the membranes. As alreadymentioned above, water uptake led only to a thicknessincrease of about 30%. Membranes incubated in sorbitol-modified culture medium remained highly elastic. Theburst pressure values of the membranes were lower than indistilled water, but the membranes were still mechanicallystable and could be kept in the modified medium forseveral weeks, even at temperatures of 37 1C.The compromising effects of high NaCl concentrations
on the alginate membranes could result either from thedisplacement of part of the bound Ba2+ by Na+-ions(being present in high excess) or electrostatic screeningcoupled with the lack of an osmotic counterforce toprevent the water uptake induced by reduction of dimerassociation. There are several reports in the literature(e.g. [31,46]) that G-dimer associations are readily dis-rupted by anti-gelling ions such as NaCl because of theweak electrostatic interactions between the dimers. The

ARTICLE IN PRESSH. Zimmermann et al. / Biomaterials 28 (2007) 1327–13451342
subsequent swelling of the membranes can obviously notbe suppressed by the external osmotic pressure, p, of NaCl.This can be explained by assuming that the reflectioncoefficient of the membranes for NaCl is equal or close tozero (i.e. sNaClDp ¼ 0 in Eq. (1) [35]).
However, it is difficult to ascribe the stabilising effect ofsorbitol to a simple osmotic mechanism. Optimisticestimates of sorbitol’s reflection coefficient on the basis ofthe experimentally determined water flows are no higherthan 0.1. Even if the reflection coefficient were 0.99,sorbitol would diffuse to equilibrium in the thin gel withinhours and the osmotic pressure vanishes, whereas stabilisa-tion is observed for weeks. While it is possible to imagine amechanism where the important variable is absoluteosmotic pressure rather than osmotic gradient betweengel and surrounding medium, it is much more likely thatstabilisation occurs as a result of the lowered concentrationof NaCl or the low ionic strength.
4.3. Hydraulic conductivity
The hydraulic conductivities from hydrostatic pressuredifferences were of the same order as those measured bypressure application to membranes of comparable materi-als. Taking the membrane thickness into account, examplesare strong polyacid gel-filled membranes (poly 2-acryl-amido-2-methylpropanesulfonic acid; d ¼ 70–120 mm;Lp ¼ 10�12–10�10mPa�1 s�1 [54]), agarose-dextran gels(d ¼ 70–170 mm; Lp ¼ 1.4� 10�10–1.4� 10�9mPa�1 s�1
[55]) and bentonite membranes (d ¼ 2 mm; Lp ¼ 10�9
mPa�1 s�1 [56]).The alginate membranes are highly compressible. The
flow increased by only one order of magnitude whenthe imposed hydrostatic pressure was increased by nearlytwo orders. This is not surprising given the ‘sparse’nature of the gel (0.7% w/w) and large equivalent poreradius (�60 nm) that decreases as the gel is compressed.It does, however, warn against extrapolating the hydraulicpressure/flow data beyond the range of experimentalmeasurement.
The hydraulic conductivity of the membranes could beincreased by several orders of magnitude by the introduc-tion of pores without changes of mechanical and elasticproperties. The pores were permeable to cells and could beperfused by static pressure application at reasonable rates,which is of great relevance for use of alginate membranes in‘‘micro-bioreactors’’. The decrease in hydraulic conductiv-ity by cell proliferation at the edges of and within the porescan easily be compensated by introduction of more pores,because it has been shown that up to six pores per 0.8 cm2
did not affect the mechanical stability and flexibility of themembranes.
4.4. Non-diffusional versus diffusional water flow
The expected flows calculated from Eq. (12) and shownin Table 3A are in fair agreement with the measured values.
The assumptions are: (1) the solutes can enter the gel(reflection coefficients o1); (2) each substance diffusesaccording to its own concentration gradient and ‘coupling’occurs because all gradients are contained within the gel(unstirred layers are thin compared to the gel); (3) diffusionconstants are sufficiently large that a steady state isestablished on the experimental time-scale and (4) thediffusion constant of water in the gel is not significantlylower than that in free solution. Given the hydrodynamicestimates of effective pore radius, the physical properties ofthe solutes and the experimental method, these assump-tions are plausible. Inspection of Eq. (12) shows that themajor component of the volume flow is that of water. Thesolute counter-flows are much smaller except in the case ofNaCl. It is possible to estimate the final solute concentra-tion in the ‘water’ compartment from these flows, theexperimental duration and the size of the compartment.Only in the case of NaCl would these final concentrationsbe cryoscopically detectable.Although this simple model predicts the observed flows
quite well for all solutes, it is possible that othermechanisms could operate especially in the case of PEG.If PEG cannot enter the gel (reflection coefficientsPEG ¼ 1) then it could initially induce a hydrodynamicflow so high that the gel drastically compresses, limiting theflow. Mauro [57] and Ray [58] have shown for membranepores that an osmotically driven water flow is equivalent toa hydrostatically driven water flow, i.e. in both caseshydrostatic pressures are the operative forces within thepores. Assuming that sPEG ¼ 1, it is possible to calculatePos (Eq. (2)) from experiments in which the compartmentsof the permeation cells were stirred. These values are(4.3–6.0)� 10�4m s�1 at 290mosmol kg�1 and (7.5–9.0)�10�4m s�1 at 120mosmol kg�1 (see Table 3A, secondcolumn from the right), i.e. up to two orders of magnitudelarger than the diffusive permeability of water, Pd
(1.6� 10�5m s�1; see [59]). That would indeed suggestwater movement occurring by viscous (Hagen–Poiseuilletype) flow through pores. From Eqs. (3) and (4), the‘‘equivalent radius’’ of these pores would be of the order of4–5 nm (Table 3A, first column from the right). Fortechnical reasons hydrodynamic data could only beacquired at lower flow rates and cannot readily beextrapolated but we have no reason to assume that thegel could not be compressed to this extent. ‘Collapsed’pores of this size would exclude PEG, which has beenreported as having an unusually large hydrodynamic radiusof 6.1 nm [60]. We have noted that membranes exposed toPEG 6000 were much thinner than membranes exposed tosorbitol and raffinose.
4.5. Unstirred layer effects
Uncertainties associated with the measurement of waterflows generated by osmotic means are unstirred layereffects and counter-flows generated differences in density.Unstirred layer effects usually lead to an underestimation

ARTICLE IN PRESSH. Zimmermann et al. / Biomaterials 28 (2007) 1327–1345 1343
of the hydraulic conductivity (see e.g. [36,61–63]). Eventhough the bulk solutions on both sides of a barrier arewell stirred, there are always zones adjacent to the barrierwhere convective transport of solutes is not possible. Thismeans that the actual concentration of osmotically activesubstances near the membrane is considerably less than theconcentration in the external medium. In the ideal case,concentration gradients occur only within the unstirredlayers and are therefore ‘ill-defined’ as their thickness maybe unknown. Furthermore, concentration–polarisationeffects within membranes can also occur. These may bevery significant as alginate membranes have relatively largeamounts of bound as well as stagnant water [6,64] andbecause of the sandwich-like structure (for details aboutconcentration polarisation effects in compound mem-branes, see [65]). Concentration polarisation and unstirredlayer effects increase with increasing viscosity and con-centration difference. Thus, it is not surprising that inunstirred experiments flows induced by raffinose and PEG6000 were considerably lower. Equally, the result (seeTable 3A) that at 120mosmol kg�1 PEG 6000(p ¼ 300 kPa) the Lp-value was only about 1.5–1.8 largerthan that measured at 290mosmol kg�1 (p ¼ 720 kPa) canalso be taken as a hint for the presence of unstirred layereffects and concentration polarisation effects within themembranes.4
Unstirred layer and concentration polarisation effectsplay no role in perforated membranes. However, unstirredlayers are of importance in the ‘free-diffusion’ model as thereal length of the concentration gradient is the thickness ofthe gel plus those of the unstirred layers. So it is expectedthat lower flows will be seen in the absence of stirring.
The topography of the surface can affect the thickness ofthe unstirred layer. It could also give clues to the possibleexistence of large pores.
4.6. Topography, near-surface structure and cell adhesivity
AFM shows numerous crevices in the surface of NT-alginate membranes (Figs. 5 and 6). The average width ofthese negative structural elements was a few micrometersand they probably arise through inhomogeneous contrac-tion during syneresis. BaCl2 bombardment producedadditional (discrete) negative structural elements of a fewmicrometers diameter on the exposed side. Phase contrastmicroscopy showed occasional large craters of about300 mm diameter, i.e. the size of the original crystals. Thesecraters were only detectable in membranes cross-linked for2 h. Consistent with this, it was found that the surfaceroughness of 2-h cross-linked membranes after crystalbombardment was much higher than that of 15-h ones. It
4A membrane thickness of about 0.1mm seems to be the lowest value
that can be obtained by compression of alginate membranes due to
osmotic (hydrostatic) pressure. This threshold value was obviously
reached at an osmolality of above 120–150mosmol kg�1 of PEG 6000
(see Table 3A). Thus, we can exclude possible effects of membrane
thickness on the Lp-values.
may be that a 2-h membrane has a somewhat plasticsurface that readily forms craters while the more elasticsurface of a 15-h membrane springs back, leaving littlevisible mark around a small injury.Could the discrete negative surface structures be the ends
of pores? This seems unlikely given the much smaller‘‘equivalent pore radius’’ estimated from the water flowmeasurements. If bombardment created continuous300 mm-pores, flows should be comparable to thosemeasured with 200-mm diameter pores. But Lp’s ofbombarded and non-bombarded membranes determinedwith PEG 6000 gradients (Table 3A) were comparable.However, the smallest diameter of a non-uniform poredictates volume flow and in hydrogel networks pores arehighly tortuous and irregular. Thus, it cannot a priori beexcluded that negative structural elements narrow locallyto about the diameter estimated from the flow measure-ments. Furthermore, it is also conceivable that connectionsbetween existing pores and the negative surface structuresexist and/or are generated by the bombardment.Although more research is required, it is clear that BaCl2
bombardment considerably increased cell adhesion. Fibro-nectin coating improved cell attachment, spreading andmigration but satisfactory and reproducible results wereonly obtained after ‘‘pre-structuring’’ the surfaces bybombardment. The ‘‘pre-structuring’’ of the surface isreflected in the surface micro-roughness, Ra. Bombardedmembranes had an Ra-value of 65 nm, whereas for non-bombarded ones Ra was only about 38 nm. The roughnessof these membranes arose mainly from the imprints of thefilter pores (Fig. 5). But non-bombarded membranesshowed some (very poor) cell attachment in contrast toBa2+-cross-linked alginate beads [16], which do not. Ra forthese beads was 25 nm [28]. We conclude that surfaces ofhighly purified alginate can only serve as a substratum formigration of anchorage-dependent cells if Ra-value issignificantly larger than 25 nm (see also [6]). Preferentiallocations for initial cell attachment seem to be large fissuresand folds in the membranes or the edges of pores. Fissuresprobably stem from inhomogeneous contraction duringcross-linking and are seen both in bombarded and non-bombarded membranes.The high Ra of both faces of bombarded membranes
may arise as shockwaves from the impacts propagate,reflect and cause distortion. But it is more likely to be aresult of increased shrinkage and syneresis.The above considerations show that the roughness of the
surface can be modified according to the needs and cells bythe gelling process, by the filters used in the manufacturingprocess and by modification of the crystal bombardment.
5. Conclusions
We have characterised a class of alginate membranes byanalysing their surfaces, near-surface regions and bulkstructure as well as their mass transport and cellularisationproperties. NT-alginate membranes are low-cost; can be

ARTICLE IN PRESSH. Zimmermann et al. / Biomaterials 28 (2007) 1327–13451344
produced on small or large scale; have high stability,strength and adjustable permeability. They can be storedfor months and can act as a cell culture substrate. Theirproperties can be fine-tuned by adjusting manufacture andsurface treatments. Besides technical and medical applica-tions, study of these membranes will lead to a betterunderstanding of the complex mechanisms of cross-linking,syneresis and intragel phase separations in three-dimen-sional alginate gels.
Acknowledgments
We are extremely grateful to P. Gessner, A. Biegner, L.PlieX, M. Hanauer, T. Schneider-Hohendorf, C. Kappel, C.Blum, and F. Bauer for their excellent technical assistance.We would also like to thank M. Sohner for his great help inperforming NMR imaging. This work was supported bygrants of the Bundesministerium fur Bildung und For-schung to U.Z. (Grant no. 0312108), to H.Z. (Grant nos.0312107 and 03N8707) and to U.M. (Grant no. 0312104).The work was also supported by a grant to J.A.V.(FONDECYT 1040425).
References
[1] Clayton HA, James RFL, London NJM. Islet microencapsulation: a
review. Acta Diabetol 1993;30:181–9.
[2] Hasse C, Klock G, Schlosser A, Zimmermann U, Rothmund M.
Parathyroid allotrans-plantation without immunosuppression.
Lancet 1997;350:1296–7.
[3] Kuhtreiber WM, Lanza RP, Chick WL. Cell encapsulation technol-
ogy and therapeutics. Boston, MA: Birkhauser; 1999.
[4] Lanza RP, Langer R, Vacanti J. Principles of tissue engineering. San
Diego: Academic Press; 2000.
[5] Zimmermann U, Mimietz S, Zimmermann H, Hillgartner M,
Schneider H, Ludwig J, et al. Hydrogel-based non-autologous cell
and tissue therapy. Biotechniques 2000;29:564–81.
[6] Zimmermann U, Thurmer F, Jork A, Weber M, Mimietz S,
Hillgartner M, et al. A novel class of amitogenic alginate
microcapsules for long-term immunoisolated transplantation. Ann
NY Acad Sci 2001;944:199–215.
[7] Storrs R, Dorian R, King SR, Lakey J, Rilo H. Preclinical
development of the islet membrane. Ann NY Acad Sci
2001;944:252–66.
[8] Schneider S, Feilen PJ, Brunnenmeier F, Minnemann T, Zimmer-
mann H, Zimmermann U, et al. Long-term graft function of adult rat
and human islets encapsulated in novel alginate-based microcapsules
after transplantation in immunocompetent diabetic mice. Diabetes
2005;54:687–93.
[9] Hauselmann HJ, Fernandes RJ, Mok SS, Schmid TM, Block JA,
Aydelotte MB, et al. Phenotypic stability of bovine articular
chondrocytes after long-term culture in alginate beads. J Cell Sci
1994;107:17–27.
[10] Weber M, Steinert A, Jork A, Dimmler A, Thurmer F, Schutze N,
et al. Formation of cartilage matrix proteins by BMP-transfected
murine mesenchymal stem cells encapsulated in a novel class of
alginates. Biomaterials 2002;23:2003–13.
[11] Cancedda R, Dozin B, Giannoni P, Quarto R. Tissue engineering and
cell therapy of cartilage and bone. Matrix Biol 2003;22:81–91.
[12] Hendrich C, Weber M, Battmann A, Schutze N, Julius C, Steinert A,
et al. Differentiation of human and murine chondrogenic cells
encapsulated in ultra-high viscosity alginate. In: Hendrich C, Noth U,
Eulert J, editors. Cartilage surgery and future perspectives. Heidel-
berg: Springer; 2003. p. 171–81.
[13] Agren MS. Four alginate dressings in the treatment of partial
thickness wounds: a comparative experimental study. Br J Plast Surg
1996;49:129–34.
[14] Hilton JR, Williams DT, Beuker B, Miller DR, Harding KG. Wound
dressing in diabetic foot disease. Clin Infect Dis 2004;39:
S100–3.
[15] Lindern von JJ, Niederhagen B, Appel T, Berge S. Treatment of soft
tissue defects with exposed bone in the head and face region with
alginates and hydrocolloid dressings. J Oral Maxillofac Surg
2002;60:1126–30.
[16] Zimmermann H, Zimmermann D, Reuss R, Feilen PJ, Manz B,
Katsen A, et al. Towards a medically approved technology for
alginate-based microcapsules allowing long-term immunoisolated
transplantation. J Mater Sci: Mater Med 2005;16:491–501.
[17] Giese Ch, Marx U. Artificial human lymph node: a device for
generation of human antibodies and testing of immune functions
in vitro. 2005. Proceedings of the 2nd world congress on regenerative
medicine, May 18–20, Leipzig.
[18] Zimmermann U, Leinfelder U, Hillgartner M, Manz B, Zimmermann
H, Brunnenmeier F, et al. Homogeneously cross-linked scaffolds
based on clinical-grade alginate for transplantation and tissue
engineering. In: Hendrich C, Noth U, Eulert J, editors. Cartilage
surgery and future perspectives. Heidelberg: Springer; 2003. p. 77–86.
[19] Edding ME, Fonck EA, Macchiavello JE. Lessonia. In: Akatsuka I,
editor. Biology of economic algae. The Hague: SPB Academic
Publishing; 1994. p. 407–46.
[20] Vasquez JA, Vega JMA, Matsuhiro B, Urzua C. The ecological
effects of mining discharges on subtidal habitats dominated by
macroalgae in northern Chile: population and community level
studies. Hydrobiologia 1999;399:217–29.
[21] Vega JMA, Vasquez JA, Buschmann AH. Population biology of the
subtidal kelps Macrocystis integrifolia and Lessonia trabeculata
(Laminariales, Phaeophyceae) in an upwelling ecosystem of northern
Chile: interannual variability and El Nino 1997–98. Rev Chil Hist
Nat 2005;78:33–50.
[22] Vasquez JA. Lessonia trabeculata a subtidal bottom kelp in northern
Chile: a case study for a structural and geographical comparison.
In: Seeliger U, editor. Coastal plant communities of Latin America.
San Diego: Academic Press; 1992. p. 77–89.
[23] Venegas M, Matsuhiro B, Edding ME. Alginate composition of
Lessonia trabeculata (Phaeophyta: Laminariales) growing in exposed
and sheltered habitats. Bot Marina 1993;36:47–51.
[24] Leinfelder U, Brunnenmeier F, Cramer H, Schiller J, Arnold K,
Vasquez JA, et al. A highly sensitive cell assay for validation
of purification regimes of alginates. Biomaterials 2003;24:
4161–72.
[25] Zimmermann H, Hillgartner M, Manz B, Feilen P, Brunnenmeier F,
Leinfelder U, et al. Fabrication of homogeneously cross-linked,
functional alginate microcapsules validated by NMR-, CLSM- and
AFM-imaging. Biomaterials 2003;24:2083–96.
[26] Manz B, Hillgartner M, Zimmermann H, Zimmermann D, Volke F,
Zimmermann U. Cross-linking properties of alginate gels determined
by using advanced NMR imaging and Cu2+ as contrast agent. Eur
Biophys J 2004;33:50–8.
[27] Wolf R, Zimmermann D, Weber M, Feilen P, Ehrhart F, Salinas
Jungjohann M, et al. Real-time 3-D dark-field microscopy for the
validation of the cross-linking process of alginate microcapsules.
Biomaterials 2005;26:6386–93.
[28] Hillgartner M, Zimmermann H, Mimietz S, Jork A, Thurmer F,
Schneider H, et al. Immunoisolation of transplants by entrapment in
F-19-labelled alginate gels: production, biocompatibility, stability,
and long-term monitoring of functional integrity. Materialwissen
Werkstofftech 1999;30:783–92.
[29] Vernon RB, Gooden MD, Lara SL, Wight TN. Native fibrillar
collagen membranes of micron-scale and submicron thickness for cell
support and perfusion. Biomaterials 2005;26:1109–17.

ARTICLE IN PRESSH. Zimmermann et al. / Biomaterials 28 (2007) 1327–1345 1345
[30] Zimmermann H, Hagedorn R, Richter E, Fuhr G. Topography of
cell traces studied by atomic force microscopy. Eur Biophys J
Biophys Lett 1999;28:516–25.
[31] Smidsrød O, Skjak-Bræk G. Alginate as immobilization matrix for
cells. Trends Biotechnol 1990;8:71–8.
[32] Wagner HJ, Schneider H, Mimietz S, Wistuba N, Rokitta M, Krohne
G, et al. Xylem conduits of a resurrection plant contain a unique lipid
lining and refill following a distinct pattern after desiccation. New
Phytol 2000;148:239–55.
[33] Freeman R, Hill HDW. Fourier transform study of NMR spin-lattice
relaxation by progressive saturation. J Chem Phys 1971;54:3367–71.
[34] Katsen AD, Vollmar B, Mestres-Ventura P, Menger MD. Cell
surface and nuclear changes during TNF-a-induced apoptosis in
WEHI 164 murine fibrosarcoma cells. A correlative light, scanning
and transmission microscopical study. Virchows Arch 1998;
433:75–83.
[35] Zimmermann U, Steudle E. Physical aspects of water relations of
plant cells. Adv Bot Res 1978;6:45–117.
[36] Dainty J. Water relation of plant cells. Adv Bot Res 1963;1:279–326.
[37] Koefoed-Johnsen V, Ussing HH. The contributions of diffusion and
flow to the passage of D2O through living membranes; effect of
neurohypophyseal hormone on isolated anuran skin. Acta Physiol
Scand 1953;28:60–76.
[38] Prescott DM, Zeuthen E. Comparison of water diffusion and water
filtration across cell surfaces. Acta Physiol Scand 1953;28:77–94.
[39] Durbin RP, Frank H, Solomon AK. Water flow through frog gastric
mucosa. J Gen Physiol 1956;39:535–51.
[40] Robbins E, Mauro A. Experimental study of the independence of
diffusion and hydrodynamic permeability coefficients in collodion
membranes. J Gen Physiol 1960;43:523–32.
[41] Muhr AH, Blanshard JMV. Diffusion in gels. Polymer 1982;
23:1012–26.
[42] Keller D. Reconstruction of STM and AFM images distorted by
finite-size tips. Surf Sci 1991;253:353–64.
[43] Draget KI, Gaserød O, Aune I, Andersen PO, Storbakken B, Stokke
BT, et al. Effects of molecular weight and elastic segment flexibility
on syneresis in Ca-alginate gels. Food Hydrocolloids 2001;15:485–90.
[44] Grant GT, Morris ER, Rees DA, Smith PJC, Thom D. Biological
interactions between polysaccharides and divalent cations: the egg-
box model. FEBS Lett 1973;32:195–8.
[45] Rees DA, Welsh EJ. Secondary and tertiary structure of poly-
saccharides in solutions and gels. Angewandte Chem Int Ed
1977;16:214–23.
[46] Braccini I, Perez S. Molecular basis of Ca2+-induced gelation in
alginates and pectins: the egg-box model revisited. Biomacromole-
cules 2001;2:1089–96.
[47] Donati I, Holtan S, Morch YA, Borgogna M, Dentini M, Skjak-
Bræk G. New hypothesis on the role of alternating sequences in
calcium-alginate gels. Biomacromolecules 2005;6:1031–40.
[48] van Vliet T, van Dijk HJM, Zoon P, Walstra P. Relation between
syneresis and rheological properties of particle gels. Colloid Polym
Sci 1991;269:620–7.
[49] Thu B, Gaserød O, Puas D, Mikkelsen A, Skjak-Bræk G, Toffanin R,
et al. Inhomogeneous alginate gel spheres: an assessment of the
polymer gradients by synchrotron radiation-induced X-ray emission,
magnetic resonance, and mathematical modelling. Biopolymers
2000;53:60–71.
[50] Kramarenko EY, Khokhlov AR. Intranetwork phase separation in
polyelectrolyte gels. Polym Gel Net 1998;6:45–56.
[51] Straatmann A, Borchard W. Phase separation in calcium alginate
gels. Eur Biophys J 2003;32:412–7.
[52] Kubota N, Kikuchi Y. Macromolecular complexes of chitosan. In:
Dumitriu S, editor. Polysaccharides: structural diversity and func-
tional versatility. New York: Marcel Dekker; 1998. p. 595–625.
[53] Wang LH, Khor E, Lim LY. Chitosan–alginate–CaCl2 system for
membrane coat application. J Pharma Sci 2001;90:1134–42.
[54] Zhou JS, Childs RF, Mika AM. Pore-filled nanofiltration membranes
based on poly(2-acrylamido-2-methylpropanesulfonic acid) gels.
J Membr Sci 2005;254:89–99.
[55] White JA, Deen WM. Agarose-dextran gels as synthetic analogs of
glomerular basement membrane: water permeability. Biophys
J 2002;82:2081–9.
[56] Li L, Dong JH, Lee R. Preparation of a-albumina-supported
mesoporous bentonite membranes for reverse osmosis desalination
of aqueous solutions. J Colloid Interface Sci 2004;273:
540–6.
[57] Mauro A. Some properties of ionic and non-ionic semipermeable
membranes. Circulation 1960;21:845–54.
[58] Ray PM. On the theory of osmotic water movement. Plant Physiol
1960;35:783–95.
[59] Stejskal EO, Tanner JE. Spin diffusion measurements: spin echoes in
the presence of a time-dependent field gradient. J Chem Phys
1965;42:288–92.
[60] Noronha FSM, Cruz JS, Beirao PSL, Horta MF. Macrophage
damage by Leishmania amazonensis cytolysin evidence of pore
formation on cell membrane. Infect Immun 2000;68:4578–84.
[61] Kuhn W. Grenze der Durchlassigkeit von Filtrier- und Loslichkeits-
membranen. Z Elektrochem 1951;55:207–17.
[62] Everitt CT, Haydon DA. Influence of diffusion layers during osmotic
flow across bimolecular lipid membranes. J Theor Biol 1969;
22:9–19.
[63] Barry PH, Diamond JM. Effects of unstirred layers on membrane
phenomena. Physiol Rev 1984;64:763–872.
[64] Esch M, Sukhorukov VL, Kurschner M, Zimmermann U. Dielectric
properties of alginate beads and bound water relaxation studied by
electrorotation. Biopolymers 1999;50:227–37.
[65] Schneider H, Zhu JJ, Zimmermann U. Xylem and cell turgor pressure
measurements in intact roots of glycophytes: transpiration induces a
change in the radial and cellular reflection coefficients. Plant Cell
Environ 1997;20:221–9.
[66] Colsenet R, Soderman O, Mariette F. Effects of ionic strength and
denaturation time on polyethyleneglycol self-diffusion in whey
protein solutions and gels visualized by nuclear magnetic resonance.
J Agric Food Chem 2006;54:5105–12.
Copyright © 2022 FDOKUMEN