High Temperature Tensile Creep of Magnesium Oxide Single Crystals
Upload
independentCategory
view
0download
0
JOURNAL OF APPLIED PHYSICS VOLUME 88, NUMBER 5 1 SEPTEMBER 2000
Relaxational polarization in polar dielectric barium magnesium niobateSurya M. GuptaLaser Materials Division, Centre for Advanced Technology, Indore–452013, India
E. Furman, E. Colla, and Z. XuDepartment of Materials Science and Engineering, University of Illinois at Urbana Champaign,Urbana, Illinois 61801
Dwight ViehlandTransduction Research and Development Branch, Naval Research Warfare Center,Newport, Rhode Island 02841-1708
~Received 4 February 2000; accepted for publication 2 June 2000!
Relaxor-like dielectric behavior, analogous to that found in lead magnesium niobate, has beeninduced in the polar dielectric barium magnesium niobate~BMN!. In BMN, the dielectric constantwas increased and the temperature of the maximum dielectric constant was shifted to a lowertemperature with a decrease in measurement frequency with increasing A-site vacancyconcentrations. The frequency dispersion of the permittivity maximum exhibited good agreementwith the Arrhenius relationship. An activation energy of 0.15 eV and a preexponential factor1014s21 were determined. No frequency dispersion in the imaginary part of the permittivity wasfound below the temperature of the dielectric maximum. A linear polarization-electric fielddependence was observed at room temperature. A polarization of 0.3mC/cm2 was found under afield of 75 kV/cm at 25 °C. Phase analysis revealed a single phase perovskite structure with ahexagonal unit cell witha55.77 Å andc57.08 Å. ^110& selected area electron diffraction patternsrevealed superlattice reflections along the^111&. High resolutionZ-contrast imaging was used tostudy the local ordering and the origin of the relaxational polarization. ©2000 American Instituteof Physics.@S0021-8979~00!09017-4#
i
le
t,crlo
mn
ioth
riciolo
-
r
-the
rd
tgle
d
ersnyl
edbe
dter
henery
erean-insus-y-
lettceto
I. INTRODUCTION
Barium magnesium niobate~BMN! is a polar dielectric,which has a relative permittivity~e! of 32 and aQ factor(1/tand) of 5600 at 10 GHz.1 On the basis of ionic radidifferences between B-site cations, BMN was conjecturedposses no B-site cation ordering, but in actuality it has tripunit cell due to threeB8-site cation sublattices ordered~1:2!along the^111&.2,3 Stoichiometric ordering influences theQfactor.4 Due to the highQ factor and dielectric constanbarium based perovskite materials are very suitable miwave dielectric resonators for commercial wireless technogies.
Recently this material has been explored for the optization of its dielectric properties via chemical substitutiocrystal structure, and microstructures.5 Viehlandet al.6 stud-ied the ordering behavior and Butcher and Thomas7 studiedthe transformation from relaxor to polar dielectric behavin Ba-doped lead magnesium niobate. Here we reportrelaxor-like dielectric characteristics in the polar dielectBMN containing A-site vacancies. The frequency dispersin the dielectric constant and the dissipation factor is anagous to that of lead magnesium niobate~PMN! and variousdipolar glass systems.8–11 The relaxor behavior in BMN isexplained by the Skanavi model.12 Phase analysis and microstructural and field induced polarization are also studied.
II. EXPERIMENTAL PROCEDURE
The specimens studied in this investigation were fabcated according to the formula Ba122x(Mg1/3Nb2/3)11xO3
2830021-8979/2000/88(5)/2836/7/$17.00
Downloaded 28 Jan 2003 to 144.214.24.138. Redistribution subject to A
tod
o--
i-,
re
n-
i-
~BMN-x! for 0,x,0.25. The purity of the starting raw materials was 99.9% and the specimens were prepared bycolumbite precursor method.13 The columbite precurso(MgNb2O6) was first prepared by mixing predetermineamounts of MgO and Nb2O5 in isopropanol and ball millingfor 5 h using a ZrO2 grinding media. The slurry was dried a80 °C and the powder was calcined at 1100 °C for 4 h. Sinphase formation of MgNb2O6 was confirmed by x-ray dif-fraction ~XRD!. The columbite precursor was then mixeand ball milled with predetermined amounts of BaCO3 pow-ders and calcined at 1300 °C for 2 h. The calcined powdwere mixed again and pressed into cylinders using polyvialcohol as a binder at a hydrostatic pressure of;172 MPa.These cylinders were fired at 1500 °C for 4 h in air afterbinder burnout at 450 °C for 2 h. The densities of all sinterpellets were measured volumetrically and determined toabove 95% of the theoretical.5 The calcined and sinterespecimens were analyzed by a Rigaku x-ray diffractomefor second phase formation. The sintered blocks were tcut into thin disks and polished on different grades of empapers to obtain parallel surfaces. The polished surfaces wultrasonically cleaned to remove dust particles and thennealed at 650 °C for half an hour to remove surface strainduced during polishing. Sample discs were electrodeding sputtered on gold, followed by a thin coating of air dring silver paste to insure good electrical contact.
The dielectric response was measured using a HewPackard ~HP! 4284A inductance-capacitance-resistan~LCR! bridge, which can cover a frequency range from 20
6 © 2000 American Institute of Physics
IP license or copyright, see http://ojps.aip.org/japo/japcr.jsp

plca
uthmon
ehg
acgraa
ioon
ch
r tnsudgiogg
sivto-
eolt-ceill-uc-
ero
pe-beThelar
,yedagern-ofcat-e-forin
r-oth
ast,ultt as
Fur-s
iss.
the.
e
c-
asc-
0.
2837J. Appl. Phys., Vol. 88, No. 5, 1 September 2000 Gupta et al.
106 Hz. For low temperature measurements, the samwere placed in a Delta Design 9023 test chamber, whichbe operated between2180 and1250 °C. The temperaturewas measured using a HP 34401A multimeter via a platinresistance thermometer device mounted directly onground electrode of the sample fixture. The LCR, test chaber and multimeter were interfaced with a computer to clect data while cooling at a rate of 4 °C/min at ten frequecies between 102 and 106 Hz.
Polarization electric field (P–E) measurements wermade using a modified Sawyer–Tower circuit at 10 Hz. Tvoltage from the polarization change was fed into a voltaamplifier and then digitized by the computer.
Scanning electron micrographs were taken from the frtured surfaces. The fractured surfaces were sputtered byand palladium. The fractured surfaces were used for gsize and morphology determination. A qualitative study wcarried out using energy dispersive x-ray spectroscopy~LinkEDS System, Oxford X-ray System with detector resolut133 eV! equipped with Zeiss DSM-960 scanning electrmicroscope~SEM!.
Transmission electron microscopy~TEM! specimenswere prepared by ultrasonically drilling 3 mm discs, whiwere mechanically polished to;100 mm. The center por-tions of these discs were then further ground by a dimple;10 mm and argon ion milled to perforation. Specimewere coated with carbon before examination. The TEM sties were done on a Phillips EM-420 microscope operatinan accelerating voltage of 120 kV. Scanning transmisselectron microscope~STEM! studies were performed usinmodel HB501~resolution 10 Å! operating at an acceleratinvoltage 100 kV. Quantitative energy dispersive x-ray~EDX!and line scans were carried out using Link energy disperspectroscopy, Oxford X-ray System with a Si–Li detec~resolution 136 eV! equipped with an Oxford virtual standards.
FIG. 1. SEM images of fractured surfaces for various compositions:~a!MgNb2O6, ~b! BMN-0, ~c! BMN-10, and~d! BMN-25.
Downloaded 28 Jan 2003 to 144.214.24.138. Redistribution subject to A
esn
me-
l--
ee
-oldins
n
o
-atn
er
Specimens forZ-contrast imaging were prepared by thsame method as the TEM specimens. In addition, low vage argon ions were used during milling in order to reduthe thickness of the amorphous layers produced by ion ming. Amorphous layers broaden electron probes, thus reding the spatial resolution ofZ-contrast imaging. Thesesamples were thinned to electron transparency using a 4 kVAr ion beam at a 13° inclination and then cleaned at a lowvoltage ~1.5 kV! at a 10° inclination. Specimens were alsplasma cleaned before examination.
Z-contrast images were obtained using a VG MicroscoHB603 300 kV STEM with a 1.26 Å resolution. High resolution images were formed by scanning a 1.26 Å proacross a specimen aligned to a major zone axis.Z-contrast signal was collected from a high-angle annudetector~typically 40–150 mrad!. In this high-angle regimelateral coherence between individual columns is destroand thus an incoherent image is formed. The resultant imis a map of the columnar scattering power, which in tudepends on the atomic numberZ of each column. The scattered intensity can approach the compositional sensitivitythe atomic-number-squared dependence of Rutherford stering, allowing for detection of compositional inhomogenities on an atomic scale. The key aspect of this techniquestructural determinations is that the intensity distributionthe high-resolutionZ-contrast images provides direct intepretable images of atomic columns that are sensitive to bstructure and composition on an atomic scale. In contrconventional high resolution TEM images are more difficto interpret in such terms since reversals in image contrasa function of defocus and specimen thickness can occur.thermore, in the110& projections, the Mg and Nb columnare;2.86 Å apart, whereas the Mg~or the Nb! and the Bacolumns are;2.02 Å apart. Thus, a 1.26 Å electron probesufficient to distinguish between Ba, Mg, and Nb columnThe resolution power is enhanced significantly due tolarge difference in the averageZ among the three columnsContributions to the image intensity from O22 anions wereneglected due to its small atomic number.
III. RESULTS AND DISCUSSION
A. Microstructural analysis
Figures 1~a!–1~d! show SEM pictures of the fractursurfaces for sintered MgNb2O6, BMN-0, BMN-10, andBMN-25, respectively. Intergranular fracture and unidiretional grains~approximately 10mm in length! can be seen inFig. 1~a!. However, Figs. 1~b!–1~d! show intragranular frac-ture and well defined grains. The average grain size wapproximately 1mm. No unreacted starting elements or se
TABLE I. Compositional study of grains and grain boundaries for BMN-1
Positions Barium~at. %! Magnesium~at. %! Niobium ~at. %!
Grain 1 50.7 11.8 37.5Grain 2 50.3 12.3 37.4Grain 3 50.0 13.4 36.6
Grain boundary 52.1 11.0 36.9
IP license or copyright, see http://ojps.aip.org/japo/japcr.jsp
-like
nd
-the
raintsle I.ndre
ti-
ainBa,ere
theheed.of
rain
trandrlyof
ent
s.are
o
2838 J. Appl. Phys., Vol. 88, No. 5, 1 September 2000 Gupta et al.
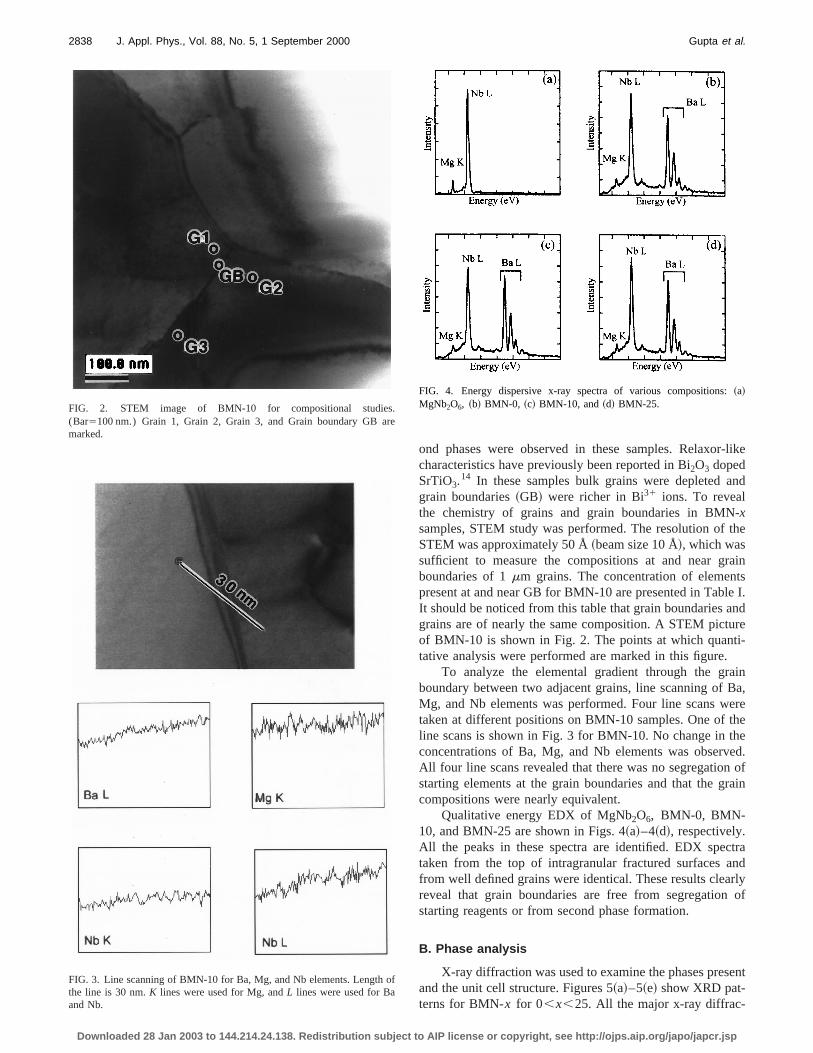
FIG. 2. STEM image of BMN-10 for compositional studie(Bar5100 nm.) Grain 1, Grain 2, Grain 3, and Grain boundary GBmarked.
FIG. 3. Line scanning of BMN-10 for Ba, Mg, and Nb elements. Lengththe line is 30 nm.K lines were used for Mg, andL lines were used for Baand Nb.
Downloaded 28 Jan 2003 to 144.214.24.138. Redistribution subject to A
ond phases were observed in these samples. Relaxorcharacteristics have previously been reported in Bi2O3 dopedSrTiO3.
14 In these samples bulk grains were depleted agrain boundaries~GB! were richer in Bi31 ions. To revealthe chemistry of grains and grain boundaries in BMNxsamples, STEM study was performed. The resolution ofSTEM was approximately 50 Å~beam size 10 Å!, which wassufficient to measure the compositions at and near gboundaries of 1mm grains. The concentration of elemenpresent at and near GB for BMN-10 are presented in TabIt should be noticed from this table that grain boundaries agrains are of nearly the same composition. A STEM pictuof BMN-10 is shown in Fig. 2. The points at which quantative analysis were performed are marked in this figure.
To analyze the elemental gradient through the grboundary between two adjacent grains, line scanning ofMg, and Nb elements was performed. Four line scans wtaken at different positions on BMN-10 samples. One ofline scans is shown in Fig. 3 for BMN-10. No change in tconcentrations of Ba, Mg, and Nb elements was observAll four line scans revealed that there was no segregationstarting elements at the grain boundaries and that the gcompositions were nearly equivalent.
Qualitative energy EDX of MgNb2O6, BMN-0, BMN-10, and BMN-25 are shown in Figs. 4~a!–4~d!, respectively.All the peaks in these spectra are identified. EDX spectaken from the top of intragranular fractured surfaces afrom well defined grains were identical. These results cleareveal that grain boundaries are free from segregationstarting reagents or from second phase formation.
B. Phase analysis
X-ray diffraction was used to examine the phases presand the unit cell structure. Figures 5~a!–5~e! show XRD pat-terns for BMN-x for 0,x,25. All the major x-ray diffrac-
f
FIG. 4. Energy dispersive x-ray spectra of various compositions:~a!MgNb2O6, ~b! BMN-0, ~c! BMN-10, and~d! BMN-25.
IP license or copyright, see http://ojps.aip.org/japo/japcr.jsp

nt
eevaau, a
n
er
rein
0d
ee
y
tio
ru
ed
ing
of-dlar
ec-be-ec-ecte
ibles
mBal-redyedas
dtheea-alos
ns
-,ity
2839J. Appl. Phys., Vol. 88, No. 5, 1 September 2000 Gupta et al.
tion lines of BMN were identified with the reported JoiCommittee on Powder Diffraction Standards~JCPDS! file.15
The perovskite structure of BMN has a hexagonal unit cwith a55.77 Å andc57.08 Å. Our results revealed that thcell dimensions remain unchanged with increasing A-sitecancy concentration. Additional peaks were identifiedmagnesium niobate. The intensity of these peaks were foto increase with increasing A-site vacancy concentrationshown in Figs. 5~c!–5~e!. The concentration of magnesiumniobate was less than 5% in the BMN-x (x.10) specimensstudied. It should be noticed from the x-ray data thatsuperlattice lines are present for the BMN-x specimens. Theabsence of superlattice lines indicates that the 1:2 orddomains are small. Recently, Akbas and Davies5 found su-perlattice lines in pure BMN samples. Differences in ordedomain sizes can be attributed to variations in processconditions. The sintering temperature was 1640 °C for 1in Davies’ samples, whereas our specimens were sintere1500 °C for 4 h.
C. Z-contrast imaging
The ordered structure of BMN has a trigonal supercwith a 1:2 $¯Mg–Nb–Nb ! repeat sequence along th^111& of the parent cubic cell. A110& projection of a fully1:2 ordered structure of BMN-10 is shown in Fig. 6~a!. Inthis case, the BI and BII columns are exclusively occupied bMg and Nb cations, respectively. The BI and BII sublatticesare indicated in the figure by solid lines. The intensity rabetween the BI~Mg21! and BII~Nb51! columns,I ~BI!/I ~BII!,is about 1/12. This is the same as that predicted by the stture of A(B1/3
I ,B2/3II !O3 ~BMN! and implies that the BI col-
umns are practically invisible. A high-resolutionZ-contrastimage of a micron-sized ordered domain in BMN-10 viewalong the^110& is shown in Fig. 6~b!. The bright spots arefrom the strongly scattering Ba21 columns (Z556), whereas
FIG. 5. Comparison of x-ray diffraction patterns for various compositio~a! BMN-0, ~b! BMN-5, ~c! BMN-10, ~d! BMN-15, and~e! BMN-25. Anadditional phase peak is marked by an arrow.
Downloaded 28 Jan 2003 to 144.214.24.138. Redistribution subject to A
ll
-snds
o
ed
dghat
ll
c-
the light spots are from the weaker scattering Nb51~BII! col-umns. Empty or invisible spots correspond to the scatterfrom Mg21~BI! columns.
A ^110& SAED pattern taken from an ordered domainBMN-10 is shown in Fig. 6~c!. This pattern reveals the presence of 1/3 $111% superlattice reflections, which resultefrom the 1:2 ordering of the B-site cation sublattices. Simi^110& SAED pattern and 1/3111& superlattice reflectionswere also observed for BMN-0 specimens~SAED pattern notshown!. No changes were observed in the superlattice refltions during cooling or heating in the temperature rangetween2180 and 50 °C. The presence of superlattice refltions in BMN-10 reveals that A-site vacancies have no effon the 1:2 ordering. 1/3^111& Superlattice reflections weralso present in BMN-25.
TheZ-contrast image in Fig. 6~b! provides direct atomicevidence of the structural model shown in Fig. 6~a!. Deter-mination of composition on an atomic scale is also possusing Z-contrast imaging, as long as the kinds of atompresent are known. Figure 6~d! shows an intensity profilemeasured along the$002% plane arrowed in Fig. 6~b!. Thisplane contains both BI~Mg21! and BII~Nb51! columns. Sta-tistically ~more than 50 intensity ratios were measured frodifferent areas!, the average intensity ratio between theI
and BII columns was determined to be very close to the cculated ratio of 1/12. This demonstrates in the 1:2 ordeBMN that the BI and BII sublattices are occupied only bMg21 and Nb51 cations, respectively. It should be mentionthat I ~BI!/I ~BII! was independent of specimen thickness,illustrated in Figs. 7~a! and 7~b!. This figure shows two in-tensity profiles measured from thicker@Fig. 7~a!# and thinnerareas@Fig. 7~b!#, respectively. Although the thicker area haa higher total scattering intensity than the thinner one,relative intensity ratios were the same. Therefore, the msured value ofI ~BI!/I ~BII! can be used to determine the locMg and Nb distributions on an atomic scale in PMN. Rati
:
FIG. 6. Z-contrast data for BMN.~a! Structural model for 1:2 orderedBa~Mg1/3Nb2/3!O3, ~b! atomic-resolutionZ-contrast image of an ordered domain in Ba~Mg1/3Nb2/3!O3, ~c! ^110& SAED pattern from an ordered domainand ~d! intensity profile along the arrowed plane showing weak intensfrom the B1 site.
IP license or copyright, see http://ojps.aip.org/japo/japcr.jsp
o
pitieurontwuhi
be,
ge
py-
bnd
te
twr
nd
u
ll-
ng
sis-
genot
ic
oc-
on
ious
,
2840 J. Appl. Phys., Vol. 88, No. 5, 1 September 2000 Gupta et al.
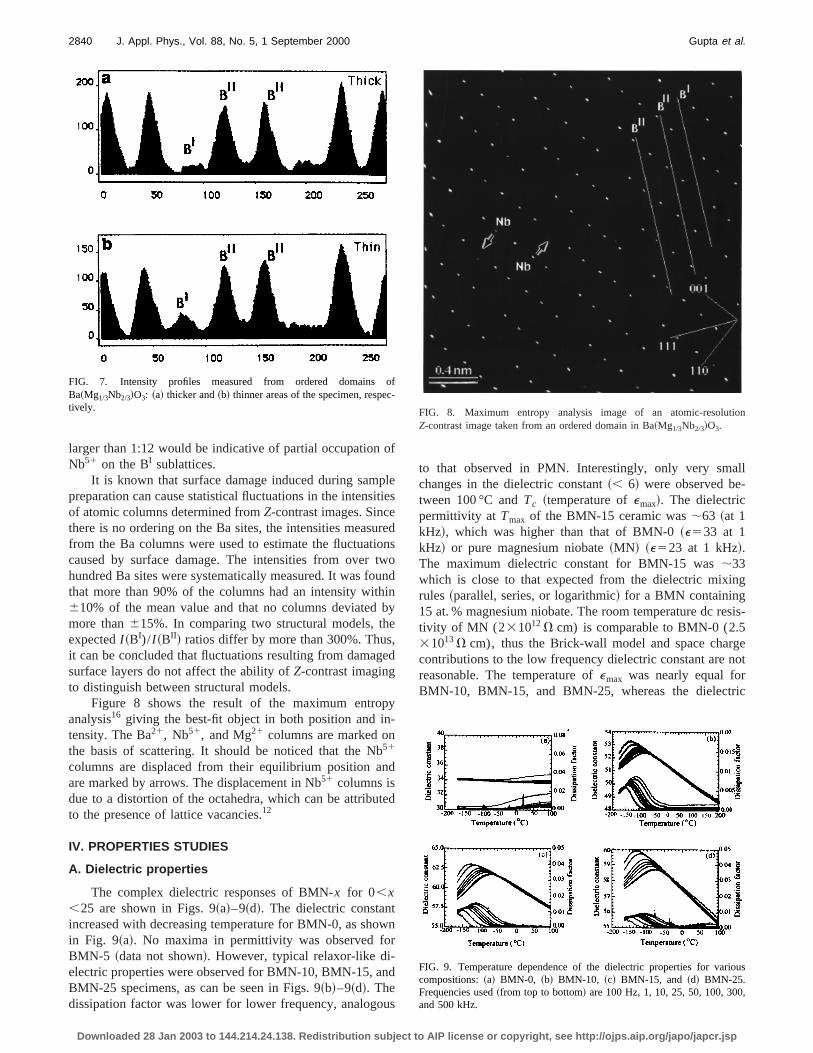
larger than 1:12 would be indicative of partial occupationNb51 on the BI sublattices.
It is known that surface damage induced during sampreparation can cause statistical fluctuations in the intensof atomic columns determined fromZ-contrast images. Sincthere is no ordering on the Ba sites, the intensities measfrom the Ba columns were used to estimate the fluctuaticaused by surface damage. The intensities from overhundred Ba sites were systematically measured. It was fothat more than 90% of the columns had an intensity wit610% of the mean value and that no columns deviatedmore than615%. In comparing two structural models, thexpectedI ~BI)/I ~BII! ratios differ by more than 300%. Thusit can be concluded that fluctuations resulting from damasurface layers do not affect the ability ofZ-contrast imagingto distinguish between structural models.
Figure 8 shows the result of the maximum entroanalysis16 giving the best-fit object in both position and intensity. The Ba21, Nb51, and Mg21 columns are marked onthe basis of scattering. It should be noticed that the N51
columns are displaced from their equilibrium position aare marked by arrows. The displacement in Nb51 columns isdue to a distortion of the octahedra, which can be attributo the presence of lattice vacancies.12
IV. PROPERTIES STUDIES
A. Dielectric properties
The complex dielectric responses of BMN-x for 0,x,25 are shown in Figs. 9~a!–9~d!. The dielectric constanincreased with decreasing temperature for BMN-0, as shoin Fig. 9~a!. No maxima in permittivity was observed foBMN-5 ~data not shown!. However, typical relaxor-like di-electric properties were observed for BMN-10, BMN-15, aBMN-25 specimens, as can be seen in Figs. 9~b!–9~d!. Thedissipation factor was lower for lower frequency, analogo
FIG. 7. Intensity profiles measured from ordered domainsBa~Mg1/3Nb2/3!O3: ~a! thicker and~b! thinner areas of the specimen, respetively.
Downloaded 28 Jan 2003 to 144.214.24.138. Redistribution subject to A
f
lees
edso
ndny
d
d
n
s
to that observed in PMN. Interestingly, only very smachanges in the dielectric constant~, 6! were observed between 100 °C andTc ~temperature ofemax!. The dielectricpermittivity at Tmax of the BMN-15 ceramic was;63 ~at 1kHz!, which was higher than that of BMN-0~e533 at 1kHz! or pure magnesium niobate~MN! ~e523 at 1 kHz!.The maximum dielectric constant for BMN-15 was;33which is close to that expected from the dielectric mixirules ~parallel, series, or logarithmic! for a BMN containing15 at. % magnesium niobate. The room temperature dc retivity of MN (2 31012V cm) is comparable to BMN-0 (2.531013V cm), thus the Brick-wall model and space charcontributions to the low frequency dielectric constant arereasonable. The temperature ofemax was nearly equal forBMN-10, BMN-15, and BMN-25, whereas the dielectr
f
FIG. 8. Maximum entropy analysis image of an atomic-resolutiZ-contrast image taken from an ordered domain in Ba~Mg1/3Nb2/3!O3.
FIG. 9. Temperature dependence of the dielectric properties for varcompositions:~a! BMN-0, ~b! BMN-10, ~c! BMN-15, and ~d! BMN-25.Frequencies used~from top to bottom! are 100 Hz, 1, 10, 25, 50, 100, 300and 500 kHz.
IP license or copyright, see http://ojps.aip.org/japo/japcr.jsp

-di
m,
oi-
lcu
.7
d-o
pn-t
ntdecnsr
inecnortani
that
for
12.tolar-
eds.isis-re-rain
l
tive
2841J. Appl. Phys., Vol. 88, No. 5, 1 September 2000 Gupta et al.
constant increased with increasing Ba21 vacancy concentration which can be attributed to weak coupling betweenelectric dipoles.
The frequency dispersion of the permittivity maximurevealed close agreements to an Arrhenius relationshipcan be seen in Fig. 10~a!. An activation energy of 0.15 eVand preexponential factor of 1014s21 were calculated forBMN-10. No frequency dispersion in the imaginary partpermittivity, below the temperature of the dielectric maxmum was observed. A fictitious freezing temperature, calated using the Vogel–Fulcher relationship,17 was estimatedto be near 0 K as shown in Fig. 10~b!. The Curie constant forBMN-10, calculated using the Curie–Weiss law, was 13105.
The dipole relaxation in BMN-15 and BMN-0 was stuied at room and low temperatures and these data are shin Figs. 11~a!–11~d!. The value ofe8 remains unchanged uto a frequency of 105 Hz, but it decreased at higher frequecies for BMN-15. This decrease ine8 occurred sharply alower temperatures as can be seen in Fig. 11~a!. No suchrelaxation was found for BMN-0@Figs. 11~c! and 11~d!#. Oncomparing the data for BMN-15 and BMN-0, it is evidethat higher concentrations of A-site vacancies result inelectric relaxation at higher frequencies. The higher dieltric constant in BMN-15 can be attributed to contributiofrom a relaxational polarization due to Ba vacancy. The ogin of this relaxational polarization can be explained usthe Skanavi model,12 in which weakly bound ions displacfrom equilibrium positions and in this case Nb ions displafrom its equilibrium position, as shown in the maximum etropy analysis image of BMN-10 in Sec. III C. The relaxbehavior arises because of the distorted octahedral coning unit cells in the matrix of nondistorted hexagonal u
FIG. 10. Analysis of frequency dispersion ofTmax for BMN-10: ~a! Arrhen-ius and ~b! Vogel–Fulcher fitting. Ea50.15– 0.16 eV, preexponentiafactor51014– 1015 s21, and fictitious freezing temperature50 K.
Downloaded 28 Jan 2003 to 144.214.24.138. Redistribution subject to A
-
as
f
-
7
wn
i--
i-g
e-
in-t
cells. This then results in dipolar clusters, analogous tofound in dipolar glasses.
B. Field induced polarization
Electric field induced polarizations were measuredthe MN and BMN-x (0,x,25) specimens. A linearP–Ecurve was observed for all the samples, as shown in Fig.The polarization under a field of 30 kV/cm was foundincrease with increasing Ba-vacancy concentration. A poization of 0.3mC/cm2 was found under a field of 75 kV/cmat 25 °C for BMN-10.
V. CONCLUSIONS
Relaxor-like dielectric characteristics have been inducin the polar dielectric BMN by creating A-site vacancieHigh resolutionZ-contrast and maximum entropy analysimages revealed 1:2 B-site cation ordering and Nb-ion dplacement. Scanning transmission electron microscopyvealed homogeneous compositions between grains and g
FIG. 11. Frequency dependence of the real and imaginary part of relapermittivity for various compositions:~a!–~b! BMN-15 and~c!–~d! BMN-0.
FIG. 12. Comparison ofP–E curves for MgNb2O6 and BMN-x for 0,x,25.
IP license or copyright, see http://ojps.aip.org/japo/japcr.jsp

ow,
tao
he
e-
lsa
. J.
a-
n,
, J.
2842 J. Appl. Phys., Vol. 88, No. 5, 1 September 2000 Gupta et al.
boundaries. No segregation of secondary phases wasserved by SEM, but a small peak of a secondary phasefound by x-ray diffraction. An activation energy of 0.15 eVa preexponential factor 1014s21, a fictitious freezing tem-perature near 0 K, and a Curie constant of 1.773105 werecalculated for BMN-10. A linearP–E curve was observed aroom temperature and the polarization was found to increwith increasing A-site vacancy concentration. The originthe relaxational polarization in BMN is explained using tSkanavi model.
ACKNOWLEDGMENTS
This work was supported by the Office of Naval Rsearch~S.M.G.!, Naval UnderSea Warfare Center~E.F. andE.C.!, and the Department of Energy~Z.X.!. The use of thefacilities in the Center for Microanalysis in the MateriaResearch Laboratory at the University of Illinois at UrbanChampaign is gratefully acknowledged.
Downloaded 28 Jan 2003 to 144.214.24.138. Redistribution subject to A
b-as
sef
-
1S. Nomura, Ferroelectrics49, 61 ~1983!.2F. Galasso and J. Pyle, Inorg. Chem.2, 482 ~1963!.3F. Galasso and J. Pyle, J. Phys. Chem.67, 1561~1962!.4M. Onoda, J. Kuwata, K. Koneta, K. Toyama, and S. Nomura, JpnAppl. Phys., Part 121, 1707~1982!.
5M. A. Akbas and P. K. Davies, J. Am. Ceram. Soc.81, 670 ~1998!.6D. Viehland, N. Kim, Z. Xu, and D. A. Payne, J. Am. Ceram. Soc.78,2481 ~1995!.
7S. J. Butcher and N. W. Thomas, J. Phys. Chem. Solids52, 595 ~1991!.8U. Hochi, Phys. Rev. Lett.48, 1494~1982!.9K. Knorr, U. Volkman, and A. Loidl, Phys. Rev. Lett.57, 2544~1986!.
10M. Solamon, K. Rao, and Y. Yeshurun, J. Appl. Phys.52, 1687~1981!.11U. Kobler and K. Binder, J. Magn. Magn. Mater.15–18, 313 ~1980!.12G. I. Skanavi, IA. M. Ksendzov, V. A. Trigubenko, and V. G. Prokhv
tilov, Sov. Phys. JETP33, 250 ~1958!.13S. L. Swartz and T. R. Shrout, Mater. Res. Bull.17, 1245~1982!.14A. K. Mehrotra, Ph.D. thesis, University of Illinois at Urbana Champaig
1983.15JCPDS file No. 17–173.16S. J. Pennycook, D. E. Jesson, A. J. McGibbon, and P. D. Nellist
Electron Microsc.45, 36 ~1996!.17D. Viehland, S. J. Jang, M. Wuttig, and L. E. Cross, J. Appl. Phys.69, 414
~1991!.
IP license or copyright, see http://ojps.aip.org/japo/japcr.jsp
Copyright © 2022 FDOKUMEN