Investigation of thermoelectric properties of magnesium-based ...
Upload
khangminh22Category
view
0download
0
HAL Id: hal-00915133https://hal.archives-ouvertes.fr/hal-00915133
Submitted on 6 Dec 2013
HAL is a multi-disciplinary open accessarchive for the deposit and dissemination of sci-entific research documents, whether they are pub-lished or not. The documents may come fromteaching and research institutions in France orabroad, or from public or private research centers.
L’archive ouverte pluridisciplinaire HAL, estdestinée au dépôt et à la diffusion de documentsscientifiques de niveau recherche, publiés ou non,émanant des établissements d’enseignement et derecherche français ou étrangers, des laboratoirespublics ou privés.
Removal of hardness agents, calcium and magnesium, bynatural and alkaline modified pumice stones in single
and binary systemsMohammad Noori Sepehr, Mansur Zarrabi, Hossein Kazemian, Abdeltif
Amrane, Kamiar Yaghmaian, Hamid Reza Ghaffari
To cite this version:Mohammad Noori Sepehr, Mansur Zarrabi, Hossein Kazemian, Abdeltif Amrane, Kamiar Yaghma-ian, et al.. Removal of hardness agents, calcium and magnesium, by natural and alkaline modifiedpumice stones in single and binary systems. Applied Surface Science, Elsevier, 2013, 274, pp.295-305.�10.1016/j.apsusc.2013.03.042�. �hal-00915133�

Removal of Hardness Agents, calcium and magnesium, by Natural and
Alkaline Modified Pumice Stones in single and binary systems
Mohammad Noori Sepehr1, Mansur Zarrabi1*, Hossein Kazemian2, Abdeltif Amrane3, Kamiar
Yaghmaian4, Hamid Reza Ghaffari5
1Department of Environmental Health Engineering, Faculty of Health, Alborze University of
Medical Sciences, Karaj, Iran
2Department of Chemical and Biochemical Engineering, Western University, London, ON,
Canada N6A5B9
3Ecole Nationale Supérieure de Chimie de Rennes, Université de Rennes 1, CNRS, UMR
6226, Avenue du Général Leclerc, CS 50837, 35708 Rennes Cedex 7, France
4Department of Environmental Health Engineering, Faculty of Health, Tehran University of
Medical Sciences, Tehran, Iran
5 Department of Environmental Health Engineering, Faculty of Health, Hormozgan
University of Medical Sciences, Bandar-e-Abbas, Iran
--------------------------------------
*Corresponding Author:
Email Address: [email protected]
Phone: +98 2614336007
Fax: +98 2614319188
1
Abstract
Natural and alkaline modified pumice stones were used for the adsorption of water
hardening cations, Ca+2 and Mg+2. The adsorbents were characterized using XRF, XRD, SEM
and FTIR instrumental techniques. At equilibrium time and for 150 mg/L of a given cation,
removal efficiencies were 83% and 94% for calcium and 48% and 73% for magnesium for
raw and modified pumices, respectively. The optimal pH for raw and modified pumices were
found to be 6.0, leading to the removal of 79 and 96% of calcium and 51 and 93% of
magnesium by 10 g/L of raw and modified pumice adsorbents, respectively. Maximum
adsorption capacities were 57.27 and 62.34 mg/g for Ca+2 and 44.53 and 56.11 mg/g for Mg+2
on the raw and modified pumices, respectively. Ca+2 and Mg+2 adsorption capacities of the
pumice adsorbents decreased in the presence of competing cations. Less than 300 minutes
were needed to achieve 99 and 92% desorption of the adsorbed Ca+2 and 100 and 89% of the
adsorbed Mg+2 from the natural and modified pumices, respectively. After treating synthetic
water solution simulating an actual water stream with the alkali-modified pumice, total
hardness of the treated sample met the required standard for drinking water, namely below
300 mg/L of CaCO3 (297.5 mg/L). The studied pumice adsorbents, and especially the treated
pumice, can be therefore considered as promising low cost adsorbents, suitable for the
removal of hardness ions from drinking water.
Keywords: Calcium; Magnesium; Adsorption; Modification; Batch system
2
1. Introduction
Most of the water resources should be treated for purification before consumption. In
some countries, groundwater is the main safe drinking water resource [1]. In some cases, the
resource does not satisfy to the desirable levels regarding their chemical properties, such as
hardness, nitrate contamination, heavy metals, soluble iron, etc. [2]. Among them, water
hardness can appear problematic in some cases; it can also be considered as an important
aesthetic parameter. However, because public acceptance of hardness differs remarkably
according to local conditions, a maximum acceptable level has not been defined. In general,
water supplies with total hardness higher than 200 mg/L can be tolerated by consumers but
are considered as poor resources; while values higher than 500 mg/L are not acceptable for
most of the domestic consumptions. Hardness in water refers to existing divalent ions, such
as iron, manganese, calcium and magnesium. Among them, calcium and magnesium are
known as the dominant species for water hardening [3]. Although it has been shown that
water hardness doesn’t have serious health impact, it has been demonstrated that hard water
is responsible for the formation of deposits in boiler and household facilities, as well as
diverse influence on cleaning performances of detergents [4]. Formation of precipitates may
cause a decrease of heat transfer in boiler, a decrease of fluid rate, bursting of water pipeline,
the formation of stain in dishes and clothes. Furthermore, high concentrations of magnesium
in drinking water may induce a bitter taste [5]. In water purification and treatment plant, lime
and soda ash are used for the removal of hardness. One of the main drawbacks of this process
is the resulting waste, namely the large amount of liquid sludge produced, as well as the need
for re-carbonation of the softened water [6, 7]. In addition, the use of additional chemicals to
prevent sludge production is restricted and hence in most cases water hardness species cannot
be fully removed [8]. Ion exchange processes have been considered as an alternative
3
approach which is commercially in use worldwide. However, high power consumption and
periodical regeneration of saturated ion-exchanger resins are needed. Potential hazards of the
effluent solutions resulting from the regeneration process should also be taken into account
[9].
Recently, various methods including electrodeionization process [7],
electromembrane processes [8], capacitive deionization [9], membrane and fluidized pellet
reactor [10], ion exchange process [11-13] and adsorption [14, 15] have been studied for the
removal of a wide variety of ionic and molecular species from various water streams,
including those responsible for hardness (e.g. Ca+2 and Mg+2 cations). Amongst the
developed processes, adsorption has been widely studied for the uptake of various ionic and
molecular species form water. Although the efficiency of activated carbon (AC) as an
adsorbent, it cost remains its main drawback. Hence, finding inexpensive and efficient
adsorbents remains a topical matter to water treatment industries [16]. Pumice stone is a
volcanic rock which corresponds to solidified frothy lava formed when highly pressurized
and super-heated rock is vigorously erupted from a volcano. Pumice can also be formed from
the mixing of hot lava with water. This unnatural formation is considered as a result of
simultaneous rapid cooling and depressurization. The depressurization creates bubbles (i.e.
pores) by lowering the solubility of water and CO2 molecules dissolved in the lava, causing a
rapid release of gases. The simultaneous cooling and depressurization trap the bubbles inside
the pumice matrix; resulting in highly porous pumice with a very low density (0.35-0.65
g/cm3), a high water absorption capacity (20-30%) and mainly composed of SiO2 and Al2O3.
Considering these physicochemical characteristics, it can be considered as a potential
adsorbent for environmental applications [17]. Pumice has been tested for the removal of
sulfur dioxide [18], chromium [19], phenol and 4-chlorophenol [20]. The main objective of
this research was to evaluate a raw pumice stone and its alkali-modified form (i.e. NaOH-
4
treated) for the removal of calcium and magnesium from a synthetic solution simulating the
Karaj Water Supply System (Iran).
2. Materials and Methods
2.1. Chemicals and solutions
All chemicals used in this work were obtained from Merck (Merck Co. Germany).
0.05 M H2SO4 and 0.1 M NaOH were used for pH adjustment (Jenway, model 3510).
MgSO4.7H2O and CaCl2 were used for the preparation of stock solutions using deionized
water. The electrical conductivity of the stock solutions was in the range of 21–26 µs/cm
(Jenway, model 4520). A solution containing chloride (450 mg/L), nitrate (25 mg/L) and
sulfate (325 mg/L) was prepared. Conductivity and total dissolved solid (TDS) of water
solutions were adjusted by adding 1150 mg/L sodium chloride leading to a conductivity of
1850 µs/cm, which corresponded to that of the Karaj water supply system. Raw pumice stone
was obtained from Tikmeh Dash Reign of East Azerbaijan (Azerbaijan, Iran). All
experiments were conducted according to the Standard Methods for the Examination of
Water and Wastewater [21].
2.2. Preparation of the Adsorbent
Raw pumice stone was washed several times with distilled water before use in order
to remove any impurities until the turbidity value became lower than 0.1 NTU. The adsorbent
was then treated with 1 M solution of HCl for further purification by dissolving acid soluble
components of the sample. It was then washed with deionized water to remove the excess of
acid (pH= 7). Pumice was then dried at 55oC for 24 hours to evaporate the remaining water
molecules. The dried pumice was then milled and sieved to achieve 10-30 meshes (2000 to
841 microns). In order to modify the pumice stone with sodium hydroxide, it was treated with
2 M NaOH for 24 hours at room temperature. During modification, the solution was stirred at
200 rpm. The modified pumice was then filtered and calcined at 750°C for 6 h in an electrical
5
furnace (Lenton, England). The calcined sample was then washed several times with
deionized water to remove the excess of NaOH. The modified adsorbent was then dried at
55oC for 24 h before use.
2.3. Batch Experiments
All experiments were conducted in batch mode in 250 mL conical flasks. Several
operating parameters including pH (2-10), temperature (10-50oC), adsorbent mass (2-10 g/L),
initial calcium and magnesium concentrations (25-150 mg/L) and contact time were
investigated. Optimized adsorption times for natural and modified pumice adsorbents were
first examined by varying the contact time at room temperature, pH= 6.0 and for an adsorbent
mass of 6 g per liter of solution. For this purpose, 6 g of adsorbent were added to 1 L of
solution in a conical flask containing Ca+2 or Mg+2 cations at a concentration in the range of
25 to 150 mg/L. The mixture was then shaken at 200 rpm (Hanna-Hi 190M, Singapore).
Samples were taken at predetermined time intervals, filtered (0.45 µ, Wathman), centrifuged
(Sigma-301, Germany) and the ion concentration was measured by a titration method [21].
The removal efficiency (RE) was determined as follows (Eq. 1):
0
0 100)(C
CCRE e (1)
After investigation of the effect of the contact time and the initial ion concentration, the
effects of pH and adsorbent mass were examined. The effect of temperature was then
investigated in the optimal conditions for pH, adsorbent mass and contact time, for three
initial concentrations of Ca+2 or Mg+2 cations (50, 100 and 150 mg/L).
2.4. Adsorbent effect on electrical conductivity (EC) and turbidity
In order to measure the influence of adsorbents on EC and turbidity of water, 6 g/L of
natural or modified adsorbent was poured into 250 mL of deionized water ( i.e. free from
calcium and magnesium) at pH=6.0 and shaken for 200 min at 200 rpm. At predetermined
6
time intervals, samples were taken for conductivity and turbidity measurements (Jenway,
Model 4520).
2.5. Isotherm study
Equilibrium experiments were conducted in 250 mL conical flasks by adding 6 g/L of
natural or alkali modified pumice stone to 250 mL of magnesium or calcium solutions at
concentrations ranging from 25 to 150 mg/L. The mixture was shaken at 200 rpm for 6 hours
at 25oC to ensure that maximum sorption was achieved. The adsorption results were then
analyzed by Langmuir, Freundlich and Temkin isotherm models.
The Langmuir isotherm model is based on the assumption of a homogenous surface energy
distribution. The non-linear (Eq. 2) and linear (Eq. 3) forms of the Langmuir model are
described as follows:
)1()(
e
eme bC
bCqq (2)
)(1
bqqC
qC
mm
e
e
e (3)
Where is the equilibrium amount of adsorbate (mg/g), the equilibrium concentration of
adsorbate (mg/L), the maximum adsorption capacity (mg/g) and b (L/mg) the Langmuir
constant. The important feature of the Langmuir model can be described based on the RL
parameter expressed by Eq. (4):
eq eC
mq
)1(1
0bCRL (4)
Adsorption is unfavorable for RL > 1, linear for RL = 1, favorable for 0 < RL < 1 and
irreversible for RL = 0.
The Freundlich isotherm model that is appropriate for heterogeneous systems is expressed by
equations (5) and (6).
7
nefe CKq
1 (5)
efe CnKq log/1log)log( (6)
Where qe is the amount of adsorbate (mg/g), Ce is the equilibrium concentration of adsorbate
(mg/L), (mg1-1/nL1/n/g) and are the Freundlich constants. Large values of reveals
high affinity of the adsorbate. For a favorable adsorption, the value of the Freundlich constant
(n) should be in the range of 1 to 10.
fK n/1 fK
The Temkin isotherm is also available for heterogeneous surface adsorption. The non-linear
and linear forms of the Temkin model are given by Eq. (7) and Eq. (8):
)ln()(1
ete CkbRTq (7)
)ln()ln( 11 ete CBkBq (8)
Where B1=RT/b1, b1 is the adsorption heat (kJ/mol) and kt is the equilibrium binding constant
(L/g) corresponding to the maximum binding energy. A high value of b1 shows a fast sorption
of adsorbate at initial stage. Similarly, a low value of kt is related to weak bonding of
adsorbate onto the medium. By plotting qe vs. ln(Ce) one can deduce b1 and kt from the slope
and the intercept of this curve, respectively.
2.6. Kinetic modeling
Kinetic sorption of calcium and magnesium onto natural and alkali-modified pumice
adsorbents were investigated by adding 6 g/L of natural and modified adsorbent into 250 mL
solution containing 50, 100 and 150 mg/L of the considered cation. The pH of the solution
was adjusted at 6.0 and shaken at 200 rpm until reaching equilibrium time. The kinetic of
sorption was analyzed by means of the pseudo-second order model, which is expressed as
follows:
8
22 te
t qqkdtdq (9)
Where k2 is the rate constant (g/mg min). Integration of Eq. (9) at the boundary, qt=0 at t=0
and qt=qt at t=t and then rearrangement to a linear form gives (Eq. 10):
tqqkqt
eet
112
2
(10)
The value of k2 and qe can be determined from the slope and the intercept of the plot t/qt vs. t,
respectively.
2.7. Determination of the zero point charge
The zero point charge was determined using 0.01 M solution of NaCl as an electrolyte
and by adding 0.1 M solutions of NaOH or HCl. For this purpose, the pH of eight beakers
containing 50 mL of electrolyte was set to the desirable values in the range of 2 to12. Then
0.5 gram of adsorbent was added into each beaker and shaken for 48 hours. After completion
of the reaction, the adsorbent was filtered and the final pH of each beaker was measured. By
plotting the initial pH versus the pH after 48 hours of agitation, the zero point charges of the
adsorbents were determined, which were found to be 6.3 and 6.5 for natural and modified
pumices, respectively.
2.8. Binary System Test
Calcium and magnesium co-exist in actual water streams. Series of experiments were
conducted to investigate the effects of one another regarding the adsorption behavior. 6 g/L
of adsorbent was added to 250 mL solution containing calcium and magnesium (100 mg/L
each). The solution was then shaken at 200 rpm at room temperature for 4 hours (as
equilibrium time). Samples were taken at predetermined time intervals, filtered and calcium
and magnesium concentrations were measured.
9
2.9. Regeneration of the spent adsorbents
Regeneration tests for saturated natural and modified pumices were carried out by
adding 6 g/L of spent adsorbent in 2 M solution of NaOH. For adsorbent saturation, 6 g/L of
adsorbent were let in contact with 250 mL solution containing 100 mg/L calcium or
magnesium and stirred at 200 rpm until equilibrium time was reached (240 minutes). The
spent adsorbent was filtered, washed and dried at 55oC for 24 h. The dried spent adsorbent
was let in contact of 2 N NaOH for 500 min; then filtered, washed several times with
deionized water and dried at 550C for 24 h. The regenerated adsorbent was then tested for the
adsorption of calcium and magnesium and the regeneration percentage was calculated based
on the comparison of the removal efficiencies of fresh and regenerated adsorbents.
3. Results and Discussion
3.1. Adsorbent Characteristics
Natural and modified adsorbents were characterized by means of various instrumental
techniques including X-Ray Diffraction (XRD), X-Ray Fluorescence (XRF), Scanning
Electron Microscopy (SEM) and Fourier Transform Infrared spectroscopy (FTIR). Chemical
composition of the natural pumice, which was conducted by XRF, is shown in Table 1 [17,
19]. The main chemical components of natural pumice were SiO2 (63.45%) and Al2O3
(17.24%) resembling natural zeolite composition [22]. Alkali modification of the natural
pumice by means of sodium hydroxide affected the SiO2 and Al2O3 contents, which increased
to 66.34% and 23.32% respectively.
The specific surface area of the adsorbents was measured using the BET technique. It
showed a significantly higher specific surface area for the modified pumice if compared to
the natural one, 36.30 and 2.34 m2/g respectively. The remarkable improvement of the
10

surface area can most likely be attributed to the removal of components occupying the pores
of the pumice resulting in more accessible pores and consequently larger surface area.
The XRD patterns of the natural and modified pumice adsorbents are illustrated in
Fig.1. While the existence of crystalline phases in the natural and modified pumice samples
can be ascribed to the peaks at 2θ=12.00, 26.00, 28.00, 32.50, 33.00, 33.50, 34.50 and 28.0o; the
observed dome between 2θ= 20 to 40 can be considered as an evidence for the presence of
some amorphous phase in both samples. However, the decrease of the dome’s height (i.e.
area of the dome) in the modified sample can be attributed to a decrease of the amorphous
phase in the modified pumice.
SEM micrographs showing surface morphology of the natural and modified pumice
adsorbents at magnification of 500X are displayed in Fig. 2. While the surface of the natural
adsorbent showed irregular texture with larger grains and sharper edges, the alkali treated
pumice showed a deeply re-structured texture with finer particles size and smoother surface.
Fig. 3 shows the Fourier transform infrared spectroscopy (FTIR) of the natural (a) and
modified (b) pumices at wavelengths in the range 400–4000 cm_1. The absorption band at
~1043 cm-1 was the characteristic peak of (SiO4)2- groups due to the symmetric stretching
vibration of Si–O–Si. The peaks at ~784 and ~464cm-1 can be assigned to bending vibrations
of Si–O–Si bond. The small peak at ~615 cm-1 can be assigned to the regional vibration of
reductive carbon in crystal lattice. Other peaks can be assigned to adsorbed water molecules
including the broadening peak at ~3449 cm-1 that belongs to the asymmetric stretching
vibration of H-O bond and the peak at ~1640 cm-1 can be assigned to the bending vibration of
H–O–H bond. Overall, a high similarity appeared between both IR spectra, in agreement with
the available literature [23].
3.2. Effect of the electrical conductivity (EC) and the turbidity
11

Partial dissolution of an adsorbent in the surrounding solution can influence the
adsorption process impacting metal uptake capacity. EC and turbidity tests were conducted
and showed an increase with time for both natural and modified pumices samples (Fig.4). EC
for natural and modified pumices increased from 6 to 20 µs/cm and 11 to 36 µs/cm,
respectively. This increase can be attributed to the presence of some soluble constituents from
the adsorbents. Furthermore, the higher increase observed for the modified pumice may be
attributed to the release of Na+ ions loaded during the modification process. Turbidity
increased from 0.2 to 1.3 NTU and 0.3 to 1.2 NTU for the natural and modified pumice
samples respectively, namely close to the standard values and hence may not influence the
disinfection process.
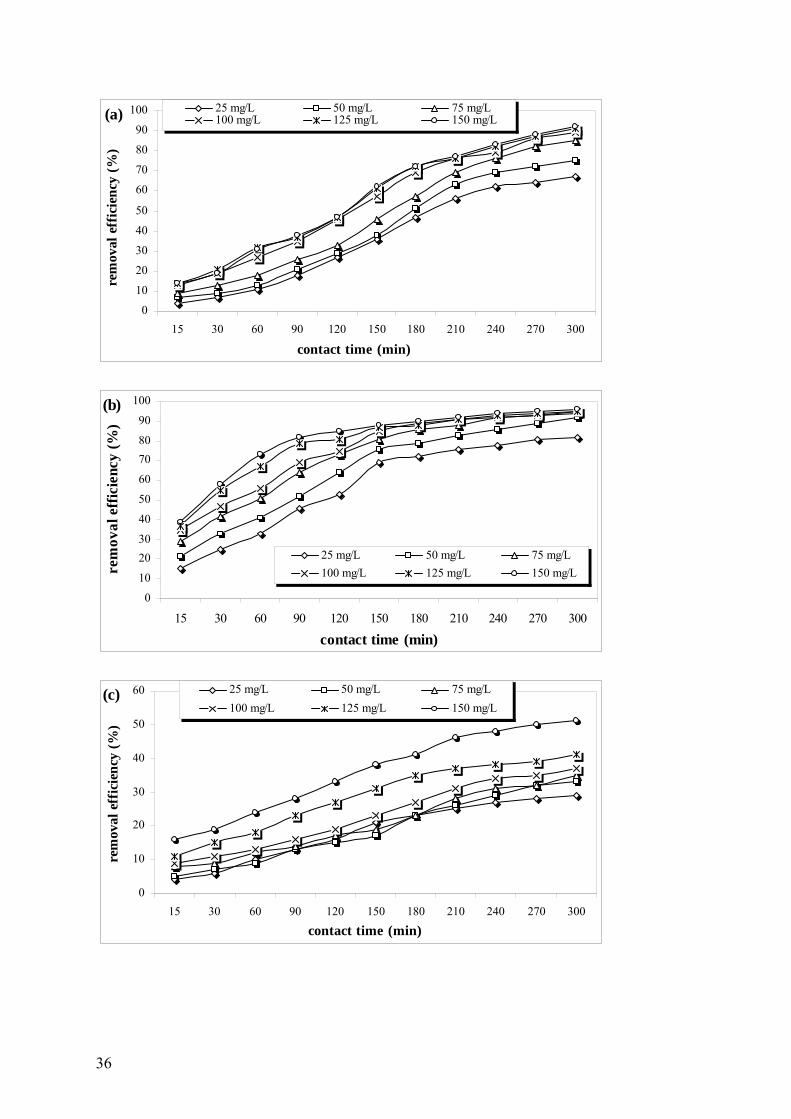
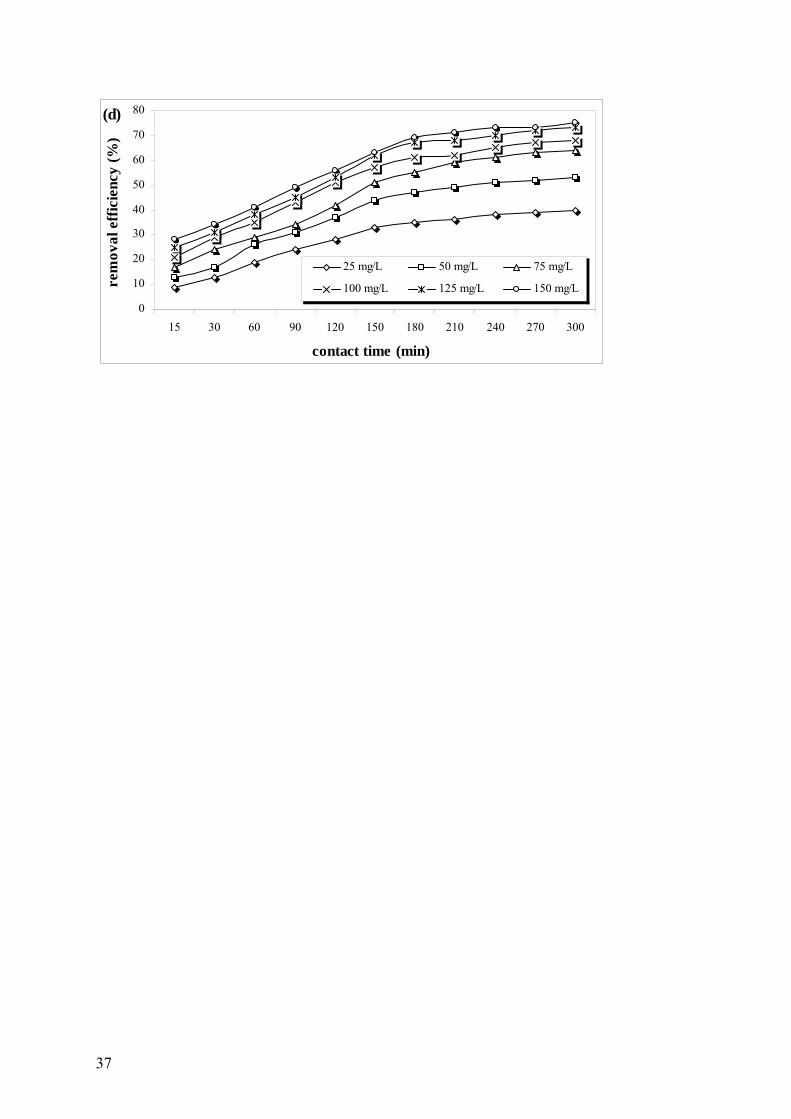
3.3. Effect of the contact time and the initial hardness agents concentration
The effects of the initial calcium and magnesium concentrations and the contact time
on the removal efficiency of pumice are illustrated in Figure 5. As it can be seen, adsorption
efficiency was improved by increasing the contact time and the initial ions concentration.
While for natural pumice sample, the equilibrium time was not reached even after 240
minutes (Figs.5a and b), equilibrium was reached after 150 and 180 min for calcium and
magnesium adsorption on the alkali-modified pumice (Figs.5c and d). Accordingly, for an
initial metal concentration of 150 mg/L, 83% and 94% of calcium and 48% and 73% of
magnesium were adsorbed by natural and modified pumices respectively, showing for both
adsorbents a higher affinity for calcium over magnesium. Furthermore, alkali modification of
pumice improved the adsorption capacity toward both tested cations.
Surface adsorption and ion exchange can be considered as the driving forces of ion
removal. While bonding of metal ions to the surface can be considered as the main
mechanism responsible for metal uptake by natural pumice, in addition to surface adsorption,
ion exchange can also be involved in the case of the alkali-modified pumice leading to a
12
remarkable enhancement of the adsorption capacity [19]. Furthermore, alkali modification
can contribute to the removal of impurities, which can unblock some pores improving
accessibility to the active adsorption and ion exchange sites of the modified sample. Removal
efficiency also showed an increase with the initial metal concentration, which can be
attributed to an increase of the concentration gradient increasing the driving force [24].
Equilibrium data were analyzed by pseudo-first order, pseudo-second order and intra-
particle diffusion kinetic models. Fig.6 shows the fitting of equilibrium data onto pseudo-
second order kinetic model and the related parameters are listed in Table 2. Pseudo-first order
and intra-particle diffusion kinetic models showed lower correlation coefficient (R2), and
hence the corresponding data are not shown. Equilibrium data fitting confirmed that
increasing the initial cations concentration increased sorption capacity of raw and modified
adsorbents. As can be seen from Table 2, the experimental qe values were close to those
calculated. In addition and for both adsorbents, the rate constants (k2) for calcium sorption
were higher than those observed for magnesium, confirming the higher affinity of the studied
adsorbents for calcium over magnesium.
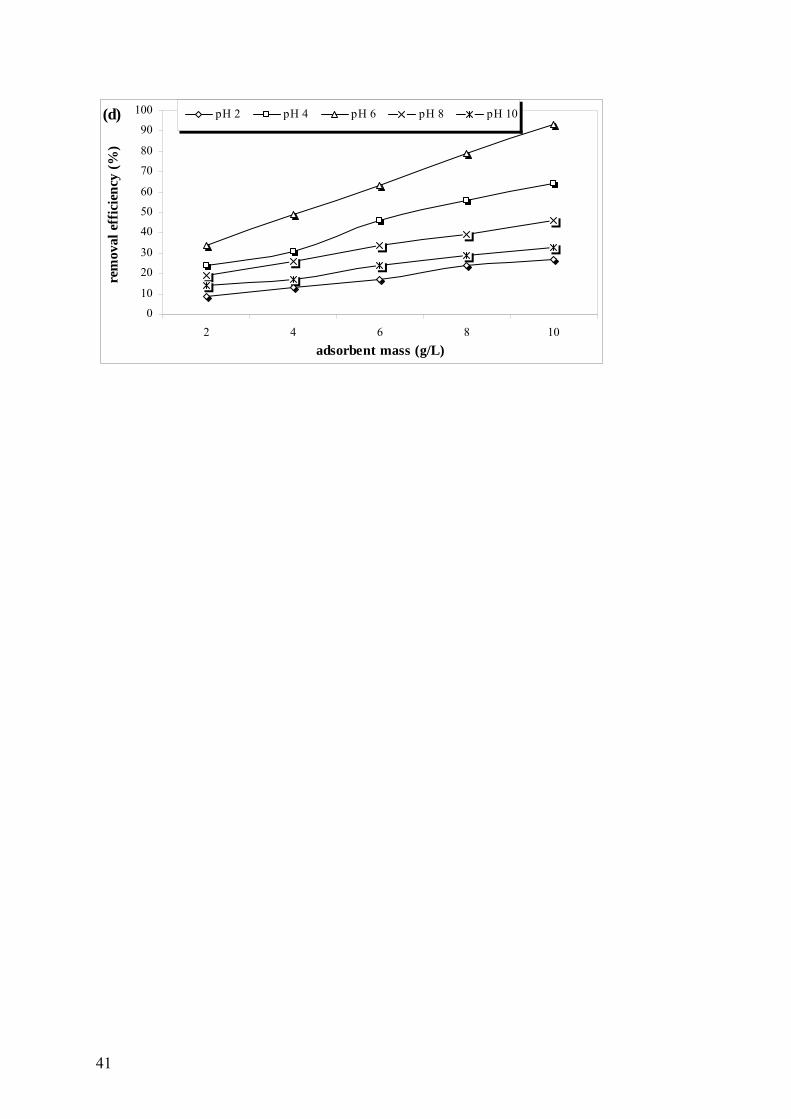
3.4. Effect of the pH and the adsorbent mass
The pH of the solution should be considered as an important factor affecting metal
adsorption process due to its impact on the degree of ionization of metal specie and the
surface charge of the adsorbent. The effect of pH of the reaction mixture on the adsorption
efficiency at various adsorbent doses was examined in order to optimize the adsorbent dosage
and the pH. According to the results summarized in Fig.7, the highest adsorption capacity
towards Ca+2 and Mg+2 ions was achieved at pH=6 for both natural and modified pumices
and for all tested dosages. This optimal pH was in accordance with the zero point charge
values (6.3 and 6.5 for natural and modified pumices respectively, see 2.7). As it is shown in
Fig 7, at this pH 79 and 96% of calcium (Figs.7a and b) and 51 and 93% of magnesium
13

(Figs.7c and d) were removed by 10 g/L of the natural and modified pumice adsorbents,
respectively. The lower removal efficiencies observed in acidic medium (i.e. pH in the range
2-5) can be attributed to the protonation of adsorbent functional groups or competition of H+
with metal ions to bind and occupy the active sites of the adsorbents. On the other hand, in
alkaline environment (i.e. pH in the range 8-10), the formation of metal hydroxide can be
considered as the main reason for decreasing metal uptake [25]. Similar results were reported
for the removal of magnesium by manganese oxide coated zeolite [26] and for the removal of
calcium using raw sugar cane bagasse modified with tartaric acid and citric acid [27]. The
highest removal capacity at pH=6, namely close to the zero point charges of natural and
modified pumices, confirms that the studied pumice adsorbents can be considered as
promising low cost adsorbents suitable for the removal of hardness ions from drinking water.
The linear increase of the adsorption capacity for increasing adsorbent dosage indicated the
accessibility of a larger number of sorption sites at higher dosage to adsorb calcium and
magnesium ions. Contrarily, in the removal of calcium using raw and modified sugar cane
bagasse, adsorption capacity remained constant above 100 mg adsorbent [27].
3.5. Effect of the temperature
The temperature effect in the range of 10oC to 60oC was studied and thermodynamic
parameters were calculated and summarized in Table 3. As shown in Fig.8, while the effect
of temperature on magnesium adsorption seemed to be negligible, a low maximum for the
adsorption of calcium was observed at 20oC.
The Arrhenius equation was used to evaluate the nature of the adsorption (either physical (5–
40 kJ/mol) or chemical (40–800 kJ/mol) :
(11)
Where Ao is the temperature independent factor called “frequency factor,” Ea the activation
energy (kJ/mol), R is the gas law constant (8.314 J/mol.K), and T is the absolute temperature
14
(K). A plot of ln k versus 1/T yields to a straight line, from which the Ea and Ao can be
obtained from the slope and the intercept, respectively. In the present work, the values of Ea
and Ao were observed to be 175.32 kJ/mol and 144.45 kJ/mol for calcium and 135.82 kJ/mol
and 122.53 kJ/mol for magnesium adsorption on the natural and modified pumice adsorbents
respectively, indicating chemical adsorption rather than physisorption.
Thermodynamic parameters were determined for temperatures ranging from 20 to
60°C using the equilibrium constant kd (qe/Ce). The change in free energy (∆Go) was
determined as follows (Eq. 12):
do KRTG ln (12)
Where, ΔGo is the standard free energy (kJ/mol). The parameters of enthalpy ∆Ho (kJ/mol)
and entropy ∆So (kJ/mol) related to the adsorption process were calculated from the following
equation (Eq. 13):
RT
H
R
SK
oo
d
ln (13)
The parameters of enthalpy (∆Ho) and entropy (∆So) can be calculated from the slope and the
intercept of the linear plot of ln kd versus 1/T. Fig.9 shows the thermodynamic plots and the
related parameters are collected in Table 3. The values of ∆Ho were positive for all systems;
showing that the sorption reaction was endothermic in nature. The negative ∆So value
characterized a decrease in randomness at the solid/liquid interface during the sorption
process. In addition, the values of standard free energy (∆Go) were positive indicating that the
sorption of metals was not thermodynamically spontaneous.
3.6. Adsorption Isotherms
Langmuir, Freundlich and Temkin models were used to evaluate the results of
adsorption tests. The different adsorption isotherms are illustrated in Fig.10 and the
corresponding calculated data are collected in Table 4. The Fitting of equilibrium data onto
15
isotherm models shows that the Freundlich isotherm gave the highest regression coefficients
for calcium and magnesium adsorption compared to Temkin and Langmuir isotherms.
However, the closeness of the regression values indicated the relevance of the three isotherm
models. The surface of the adsorbent contained most likely heterogeneous moieties which
were uniformly distributed on the surface, accounting for Langmuir, Freundlich and Temkin
isotherms [28]. The values of the separation factor (RL) were calculated for various initial
metal concentrations for raw and modified pumice adsorbents and were found between 0 and
1 (0.0176 to 0.0030 and 0.0292 to 0.0050 for calcium adsorption, 0.0400 to 0.0069 and
0.0320 to 0.0055 for magnesium adsorption on raw and modified pumice adsorbents,
respectively), indicating a favorable adsorption process, as confirmed from the values of the
Freundlich factor (n) which were in the range 1-10 (Table 4).
Maximum sorption capacities according to the Langmuir constant (qmax) for calcium
and magnesium adsorption using various natural adsorbents are listed in Table 5 to allow
comparison with the results from the present work. Maximum sorption capacities by raw and
modified pumices were 62.34 and 57.27 mg/g for calcium and 44.53 and 56.11 mg/g for
magnesium respectively, namely higher than those reported in Table 5, except for the
adsorption of magnesium on pecan nutshell.
3.7. Binary System
In order to study the interfering effect of Ca+2 and Mg+2 ions one another, adsorption
tests were conducted in the optimal conditions using a mixture of Ca+2 and Mg+2 cations (100
mg/L each) (Fig.11). Cation uptake was 63% and 74% for calcium and 27% and 59% for
magnesium on the natural and modified pumices, respectively. It can be noticed that
equilibrium time and adsorption efficiency were lower compared to the values observed in
single ion adsorption tests, which can be attributed to a competition between the two cations
for occupying the active sites leading to a faster saturation of the adsorbent in the
16
simultaneous presence of calcium and magnesium. Nevertheless and similarly to the single
ion adsorption tests, calcium showed higher adsorption compared to magnesium indicating a
higher selectivity of the adsorbents for calcium. These results also showed the efficiency of
natural and modified pumices for the removal of calcium and magnesium from water streams.
3.8. Effect of other co-existing anions
Actual water samples contain a wide range of anionic species that may influence on
the adsorption of calcium and magnesium ions. In order to study the performance of the
pumice adsorbents in actual situation, a synthetic water sample containing chloride (450
mg/L), nitrate (25 mg/L) and sulfate (325 mg/L), as well as 100 mg/L of calcium and 100
mg/L of magnesium, was prepared. This sample simulated the actual water of the Karaj
Water Supply system. The total dissolved solid (TDS) of the water sample was 1150 mg/L
and the conductivity was adjusted by sodium chloride to 1850 µs/cm (according to the Karaj
water supply system). The adsorption tests were conducted using 6 g/L of either natural or
modified pumice adsorbents at pH 6 for 240 minute at room temperature. According to the
results, counter ions (i.e. anions) decreased the adsorption capacity of the adsorbents for Ca2+
and Mg2+ cations, since removal efficiencies decreased to 53% and 61% for calcium and to
24% and 51% for magnesium for the natural and modified adsorbents, respectively. From
this, the total remaining hardness in the treated water sample by using the natural and
modified pumice adsorbents should be 429 and 297.5 mg/L as CaCO3 respectively, namely
close to the advocated value, since the total hardness for drinking water should be less than
300 mg/L as CaCO3 (AWWA, 2005); hence the alkali modified pumice can be considered as
a promising adsorbent for water softening. In addition, nitrate, chloride and sulfate
concentrations were also measured after treatment. Removal efficiencies were 5.6 and 33%
for nitrate, 33 and 63% for chloride and 51 and 59% for sulfate for natural and modified
pumices, respectively.
17
Furthermore, the conductivity of the water sample treated with the natural and
modified adsorbents increased to 1975 and 1936 µs/cm, respectively. This should be related
to the increase of the total dissolved solid, which were 1234 and 1221 mg/L after water
treatment with the natural and modified pumices respectively, most likely due to partial
dissolution of the adsorbents. Overall, although the co-existing ions can interfere in the
sorption of calcium and magnesium, final total hardness can meet the required standard level
when the alkali modified pumice was used as an adsorbent.
3.9. Regeneration of the saturated adsorbents
Regeneration experiments were conducted to study the reusability of the spent
adsorbents, which is a very important parameter in terms of economical feasibility of the
developed process. Regeneration using sodium hydroxide solution was carried out on the
spent natural and modified pumice samples. Regeneration percentage of the spent adsorbent
versus reaction time is illustrated in Fig.12. Maximum recovery of the adsorbed calcium and
magnesium was achieved in less than 300 minutes leading to 99 and 92% desorption of the
adsorbed calcium and 100 and 89% of the adsorbed magnesium from the natural and
modified pumices, respectively. Furthermore, maximum cation desorption for saturated
natural pumice was observed after 510 min of regeneration, while only 300 min of
regeneration was needed to achieve maximum cation desorption of the saturated modified
pumice adsorbent. It should be noticed that even if the modified pumice stone showed higher
sorption capacity for magnesium rather than natural pumice, its regeneration potential was
lower than that of the natural pumice.
4. Conclusion
Softening of hard water by removing Ca2+ and Mg2+ cations was studied using
natural and alkali-modified pumices as adsorbents. Increasing the mass of adsorbent, the
contact time or the initial ions concentration led to an increase of cations removal. The
18
studied pumice adsorbents showed a higher selectivity for calcium adsorption if compared to
magnesium. For both adsorbents, an increase of EC and turbidity was shown, which can be
attributed to a partial dissolution of the adsorbent; this increase remained however limited.
After treating synthetic water solution simulating an actual water stream with the alkali
modified pumice, total hardness of the treated sample met the required standard for drinking
water.
Acknowledgment
This work was supported by Alborz University of Medical Sciences. The authors are
grateful to Alborz University of Medical Sciences for financial support of this work.
19
References
[1] B.V.D. Bruggen, C. Vandecasteele, Removal of pollutants from surface water and
groundwater by nanofiltration: overview of possible applications in the drinking water
industry, Environ. Pollut. 122 (2003) 435–445.
[2] M.R. Teixeira, M.J. Rosa, The impact of the water background inorganic matrix on the
natural organic matter removal by nanofiltration, J. Membr. Sci. 279 (2006) 513–520.
[3] M. Yan, D. Wang, J. Ni, J. Qu, Y. Yan, C.W.K. Chow, Effect of polyaluminum chloride
on enhanced softening for the typical organic-polluted high hardness North-China surface
waters, Sep. Purif. Technol. 62 (2008) 401–406
[4] K. Suzuki, Y. Tanaka, T. Osada, M. Waki, Removal of phosphate, magnesium and
calcium from swine wastewater through crystallization enhanced by aeration, Water Res. 36
(2002) 2991–2998.
[5] A. Dimirkou, M.K. Doula, Use of clinoptilolite and an Fe-overexchanged clinoptilolite in
Zn2+ and Mn2+ removal from drinking water, Desalination. 224 (2008) 280–292.
[6] R. Sheikholeslami, Composite scale formation and assessment by the theoretical Scaling
Potential Index (SPI) proposed previously for a single salt, Desalination 278 (2011) 259–267.
[7] L. Fu, J. Wang, Y. Su, Removal of low concentrations of hardness ions from aqueous
solutions using electrodeionization process, Sep. Purif. Technol. 68 (2009) 390–396.
[8] J.S. Park, J.H. Song, K.H. Yeon, S.H. Moon, Removal of hardness ions from tap water
using electromembrane processes, Desalination 202 (2007) 1–8.
[9] S.J. Seo, H. Jeon, J.K. Lee, G.Y. Kim, D. Park, H. Nojima, J. Lee, S.H. Moon,
Investigation on removal of hardness ions by capacitive deionization (CDI) for water
softening applications, Water Res. 44 ( 2010 ) 2267–2275.
20
[10] C.W. Li, J.C. Liao, Y.C. Lin, Integrating a membrane and a fluidized pellet reactor for
removing hardness: effects of NOM and phosphate, Desalination 175 (2005) 279-288.
[11] J.N. Apell, T.H. Boyer, Combined ion exchange treatment for removal of dissolved
organic matter and hardness, Water Res. 44 (2010) 2419–2430.
[12] H. Faghihian, M.G. Maragheh, H. Kazemian, The use of clinoptilolite and it’s sodium
form for removal of radioactive caesium, and strontium from nuclear wastewater and Pb++,
Ni++, Cd++, Ba++ from municipal wastewater, Appl. Radiat. Isot. 4 (1999) 655-661.
[13] H. Kazemian, H. Modarres, H.G. Mobtaker, Evaluating the performance of an Iranian
natural clinoptilolite and its synthetic zeolite P for removal of Cerium and Thorium from
nuclear wastewaters, J. Radioanal. Nucl. Chem. 258 (2003) 551-556
[14] A. Torabian, H. Kazemian, L. Seifi, G.N. Bidhendi, A.A. Azimi, S.K. Ghadiri, Removal
of Petroleum Aromatic Hydrocarbons by Surfactant-Modified Natural Zeolite, Clean. 38
(2010) 77-83.
[15] L. Seifi, A. Torabian, H. Kazemian, G.N. Bidhendi, A.A. Azimi, S. Nazmara, M. A. M.,
Adsorption of BTEX on surfactant modified granulated natural zeolite nanoparticles:
parameters optimizing by applying Taguchi experimental design method, Clean-Soil, Air,
Water, 39 (2011) 939–948.]
[16] N. Feng, X. Guo, S. Liang, Y. Zhu, J. Liu, Biosorption of heavy metals from aqueous
solutions by chemically modified orange peel, J. Hazard. Mater. 185 (2011) 49–54.
[17] B. Ersoy, A. Sariisik, S. Dikmen, G. Sariisik, Characterization of acidic pumice and
determination of its electrokinetic properties in water, Powder Technol. 197 (2010) 129–
135.
[18] B. Ozturk, Y. Yildirim, Investigation of sorption capacity of pumice for SO2 capture,
Process Saf. Environ. Prot. 86 (2008) 31– 36.
21

[19] M.R. Panuccio, A. Sorgona, M. Rizzo, G. Cacco, Cadmium adsorption on vermiculite,
zeolite and pumice: Batch experimental studies, J. Environ. Manage. 90 (2009) 364-374.
[20] F. Akbal, Sorption of phenol and 4-chlorophenol onto pumice treated with cationic
surfactant, J. Environ. Manage. 74 (2005) 239–244.
[21] AWWA, Standard Methods for the Examination of Water and Wastewater, 20th ed.,
Washington, DC, 2005.
[22] H. Kazemian, M.H .Mallah, Elimination of Cd2+ and Mn2+ from Wastewaters Using
Natural Clinoptilolite and Synthetic Zeolite-P, Iran. J. Chem. Chem. Eng. 25 (2006)
91-94.
[23] X. Li, W. Yang, Q. Zou, Y. Zuo: Investigation on Microstructure, Composition, and
Cytocompatibility of Natural Pumice for Potential Biomedical Application, Tissue Eng.
Part C. 16 (2010) 427-434.
[24] F. Gode, E. Moral, Column study on the adsorption of Cr(III) and Cr(VI) using Pumice,
Yarıkkaya brown coal, Chelex-100 and Lewatit MP 62, Bioresour. Technol. 99 (2008) 1981–
1991.
[25] F. Guzel, H. Yakut, G. Topal, Determination of kinetic and equilibrium parameters of
the batch adsorption of Mn(II), Co(II), Ni(II) and Cu(II) from aqueous solution by black
carrot (Daucus carota L.) residues, J. Hazard. Mater. 153 (2008) 1275–1287.
[26] S.R. Taffarel, J. Rubio, Removal of Mn2+ from aqueous solution by manganese oxide
coated zeolite, Miner. Eng. 23 (2010) 1131–1138.
[27] E.M. Soliman, S.A. Ahmed, A.A. Fadl, Removal of calcium ions from aqueous
solutions by sugar cane bagasse modified with carboxylic acids using microwave-assisted
solvent-free synthesis, Desalination. 278 (2011) 18–25.
22
[28] L. Low, T. Teng, A. Ahmad, N. Morad, Y. Wong, A Novel Pretreatment Method of
Lignocellulosic Material as Adsorbent and Kinetic Study of Dye Waste Adsorption, Water
Air Soil Pollut. 218 (2011) 293-306.
[29] A. Garcia-Mendieta, M.T. Olguin, M. Solache-Rios, Biosorption properties of green
tomato husk (Physalis philadelphica Lam) for iron, manganese and iron–manganese from
aqueous systems, Desalination. 284 (2012) 167–174.
[30] O.K. Jinior, L.V.A. Gurgel, L.F. Gil, Removal of Ca(II) and Mg(II) from aqueous single
metal solutions by mercerized cellulose and mercerized sugarcane bagasse grafted with
EDTA dianhydride (EDTAD), Carbohydr. Polym. 79 (2010) 184–191.
[31] K.K. Krishnani, X. Meng, C. Christodoulatos, V.M. Boddu, Biosorption mechanism of
nine different heavy metals onto biomatrix from rice husk, J. Hazard. Mater., 153, 2008,
1222-1234.
[32] J.C.P. Vaghetti, E.C. Lima, B. Royer, B.M. da Cunha, N.F. Cardoso, J.L. Brasil, S.L.P.
Dias, Pecan nutshell as biosorbent to remove Cu(II), Mn(II) and Pb(II) from aqueous
solutions, J. Hazard. Mater., 162 (2009) 270-280
[33] O. Yavuz, Y. Altunkaynak, F. Guzel, Removal of copper, nickel, cobalt and manganese
from aqueous solution by kaolinite, Water Res, 37 (2003) 948–952.
23

Figure Captions
Fig.1. XRD patterns of natural pumice (a) and alkali modified pumice (b)
Fig.2. SEM images of natural pumice (a) and alkali modified pumice (b)
Fig.3. FTIR spectra of natural pumice (a) and alkali modified pumice (b)
Fig.4. Effect of natural and modified pumices on conductivity and turbidity (6 g/L adsorbent,
pH 6.5, room temperature, agitation speed 200 rpm, 5 µs/cm initial EC and approximately
zero initial turbidity)
Fig.5. Effect of initial cation concentrations and contact time on the removal efficiency, (a)
Ca2+ on natural pumice, (b) Ca2+ on modified pumice, (c) Mg2+ on natural pumice, (d) Mg2+
on modified pumice (experimental conditions: pH=6.5, adsorbent dose 6 g/L, room
temperature, 200 rpm agitation speed).
Fig.6. Fitting of equilibrium data onto pseudo-second order kinetic model, (a) Ca2+ on natural
pumice, (b) Ca2+ on modified pumice, (c) Mg2+ on natural pumice, (d) Mg2+ on modified
pumice
Fig.7. Effect of pH and adsorbent dosage on calcium and magnesium removals, (a) Ca2+ on
natural pumice, (b) Ca2+ on modified pumice, (c) Mg2+ on natural pumice, (d) Mg2+ on
24

modified pumice (contact time 210 min, ions concentration 100 mg/L, room temperature, 200
rpm agitation).
Fig.8. Effect of the temperature on the removal efficiency (ions concentration 100 mg/L,
adsorbent 6 g/L, pH 6.5, contact time 210 min)
Fig.9. Thermodynamic illustration for calcium and magnesium adsorption on natural and
modified pumices
Fig.10. Fitting of equilibrium data onto isotherm models, (a) Freundlich, (b) Langmuir, (c)
Temkin
Fig.11. Sorption of calcium and magnesium in binary system (adsorbent 6 g/L, pH 6.5, ions
concentration 100 mg/L, room temperature, 200 rpm agitation speed)
Fig.12. Regeneration of the saturated adsorbents (spent adsorbent: 6 g/L, initial calcium and
magnesium concentration: 100 mg/L each and 2 N NaOH used for regeneration).
25

Table 1 Chemical compaction of raw used adsorbent (w/w)
Component % Component %
SiO2 63.45 SrO 0.09
Al2O3 17.24 MgO 1.03
TiO2 0.37 K2O 2.16
P2O5 0.21 SO3 0.16
CaO 3.22 Na2O 2.00
Fe2O3 2.86 Cl- 0.30
26

Table 2 Pseudo second order kinetic parameters for the present work
Calcium on raw adsorbent Calcium on modified adsorbent
k2 qe, calc qe, exp R2 k2 qe, calc qe, exp R2
50 mg/L 0.63 5.59 5.25 0.98 0.71 6.30 5.91 0.97
100 mg/L 0.67 8.99 8.83 0.99 0.82 17.82 15.33 0.98
150 mg/L 0.73 16.05 15.75 0.98 0.89 25.70 23.50 0.99
Magnesium on raw adsorbent Magnesium on modified adsorbent
k2 qe, calc qe, exp R2 k2 qe, calc qe, exp R2
50 mg/L 0.57 2.61 2.33 0.99 0.60 5.77 4.25 0.97
100 mg/L 0.59 3.61 3.16 0.98 0.61 13.26 10.83 0.98
150 mg/L 0.61 14.49 12.33 0.97 0.65 21.83 18.25 0.97
27
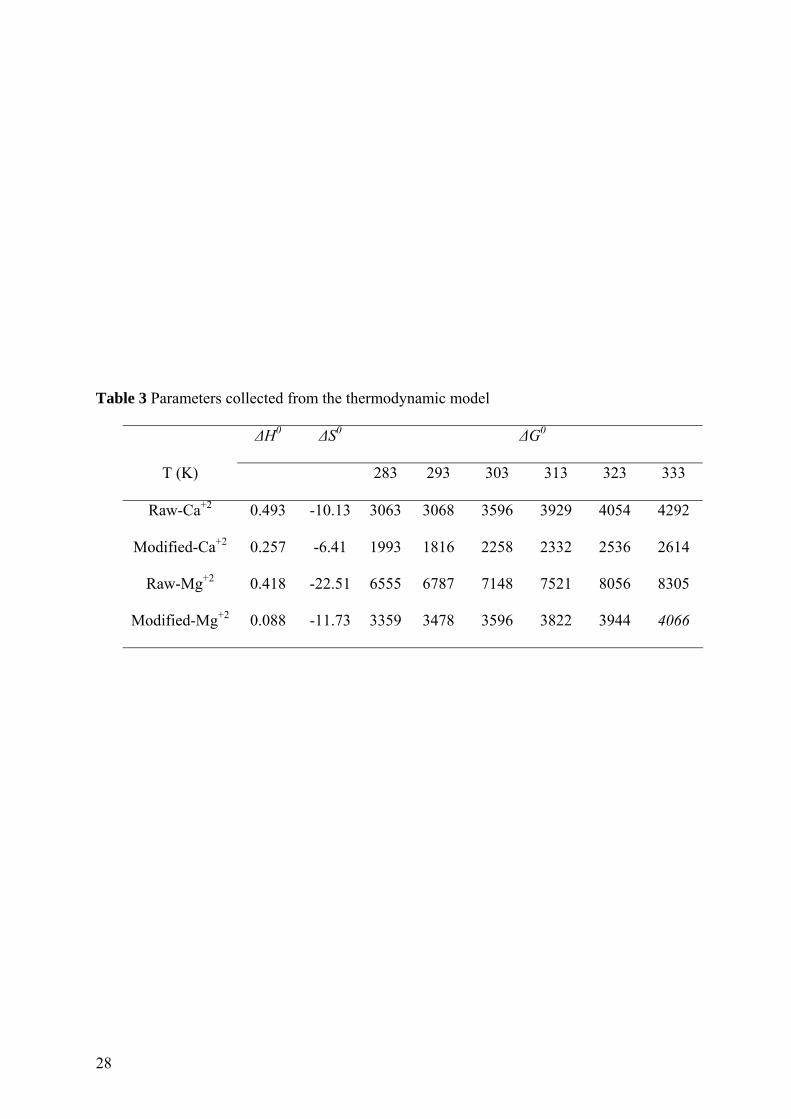
Table 3 Parameters collected from the thermodynamic model
ΔG0 ΔS0 ΔH0
333 323 313 303 293 283 T (K)
4292 4054 3929 3596 3068 3063-10.13 0.493 Raw-Ca+2
2614 2536 2332 2258 1816 1993-6.41 0.257 Modified-Ca+2
8305 8056 7521 7148 6787 6555-22.51 0.418 Raw-Mg+2
4066 3944 3822 3596 3478 3359-11.73 0.088 Modified-Mg+2
28
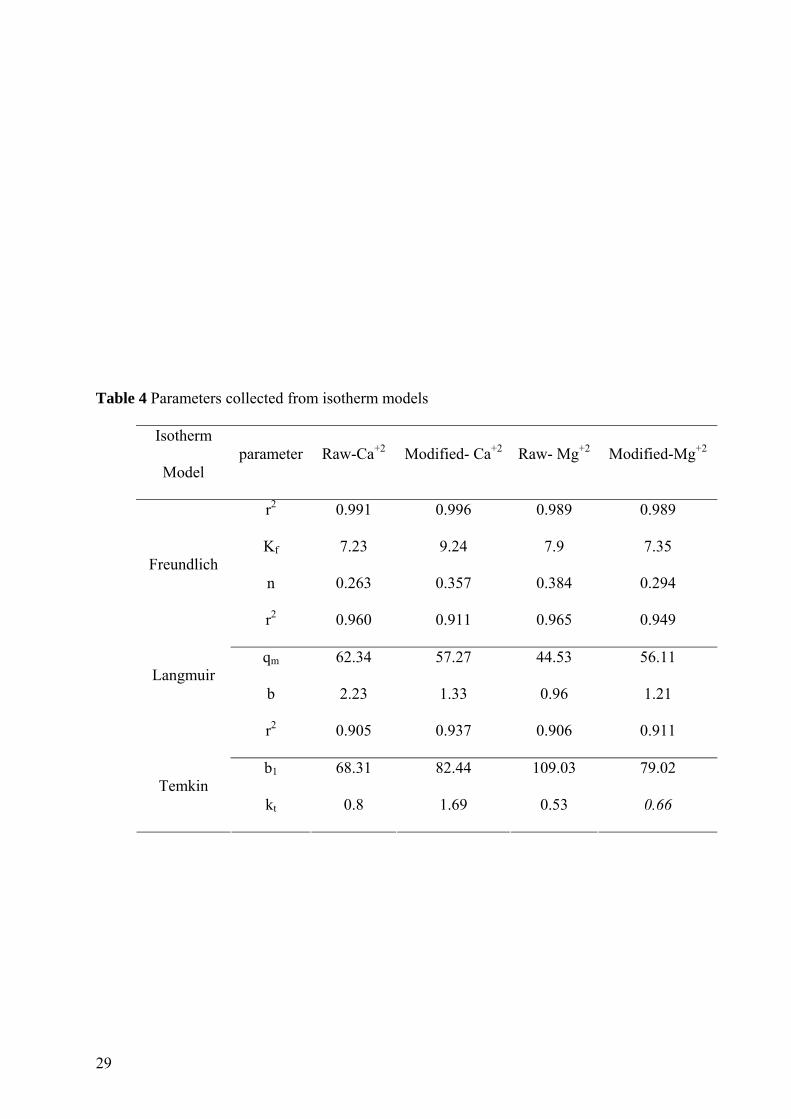
Table 4 Parameters collected from isotherm models
Modified-Mg+2 Raw- Mg+2 Modified- Ca+2 Raw-Ca+2 parameter Isotherm
Model
0.989 0.989 0.996 0.991 r2
7.35 7.9 9.24 7.23 Kf
0.294 0.384 0.357 0.263 n
Freundlich
0.949 0.965 0.911 0.960 r2
56.11 44.53 57.27 62.34 qm
1.21 0.96 1.33 2.23 b
Langmuir
0.911 0.906 0.937 0.905 r2
79.02 109.03 82.44 68.31 b1
0.66 0.53 1.69 0.8 kt
Temkin
29
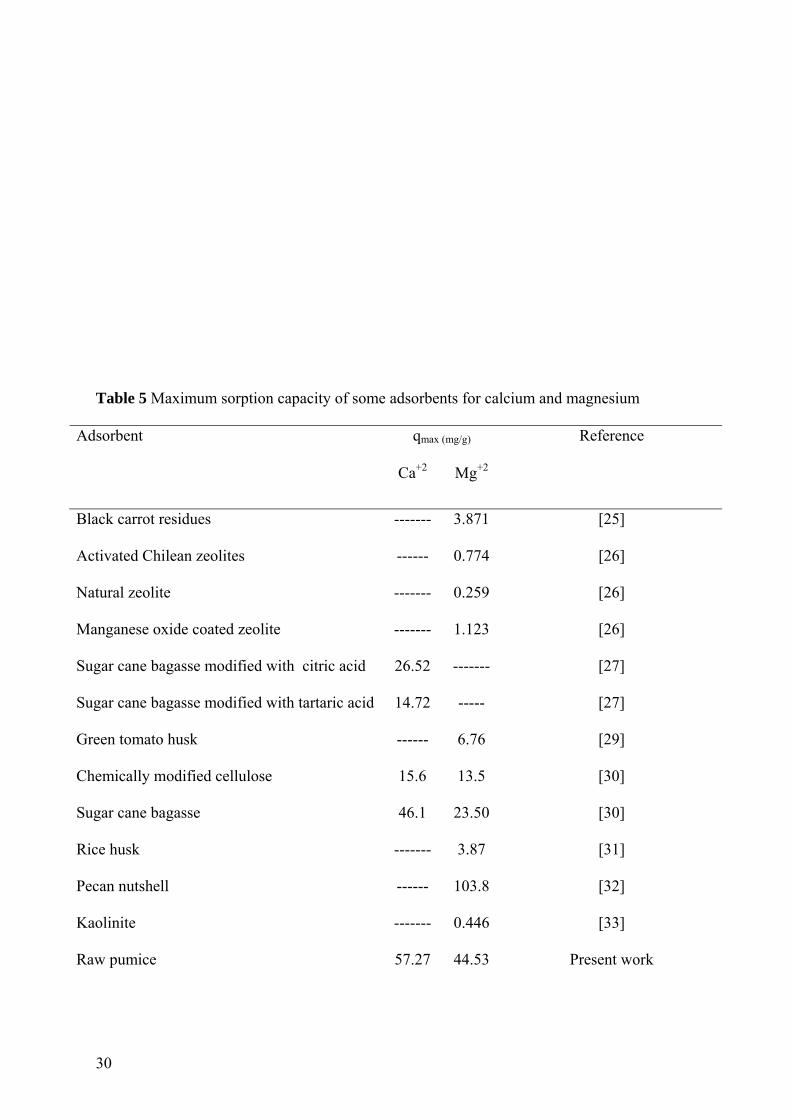
Table 5 Maximum sorption capacity of some adsorbents for calcium and magnesium
qmax (mg/g) Adsorbent
Ca+2 Mg+2
Reference
Black carrot residues ------- 3.871 [25]
Activated Chilean zeolites ------ 0.774 [26]
Natural zeolite ------- 0.259 [26]
Manganese oxide coated zeolite ------- 1.123 [26]
Sugar cane bagasse modified with citric acid 26.52 ------- [27]
Sugar cane bagasse modified with tartaric acid 14.72 ----- [27]
Green tomato husk ------ 6.76 [29]
Chemically modified cellulose 15.6 13.5 [30]
Sugar cane bagasse 46.1 23.50 [30]
Rice husk ------- 3.87 [31]
Pecan nutshell ------ 103.8 [32]
Kaolinite ------- 0.446 [33]
Raw pumice 57.27 44.53 Present work
30

Modified pumice 62.34 56.11 Present work
Figure 1
31
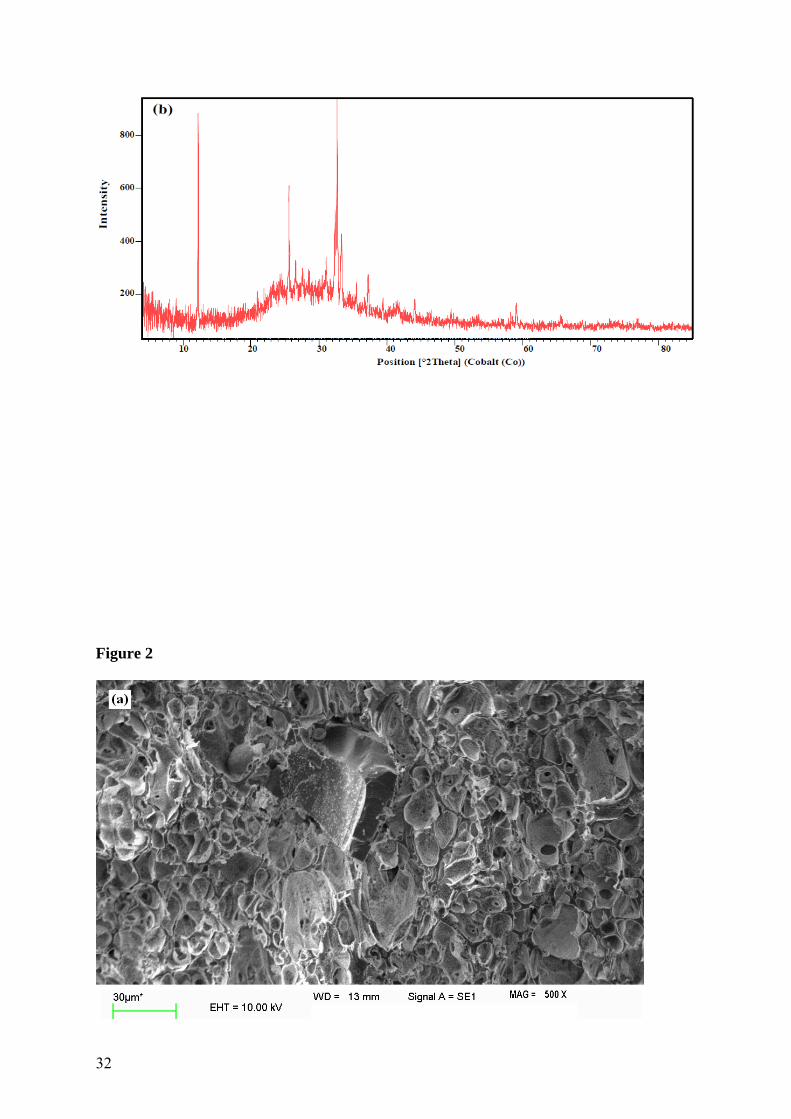
Figure 2
32
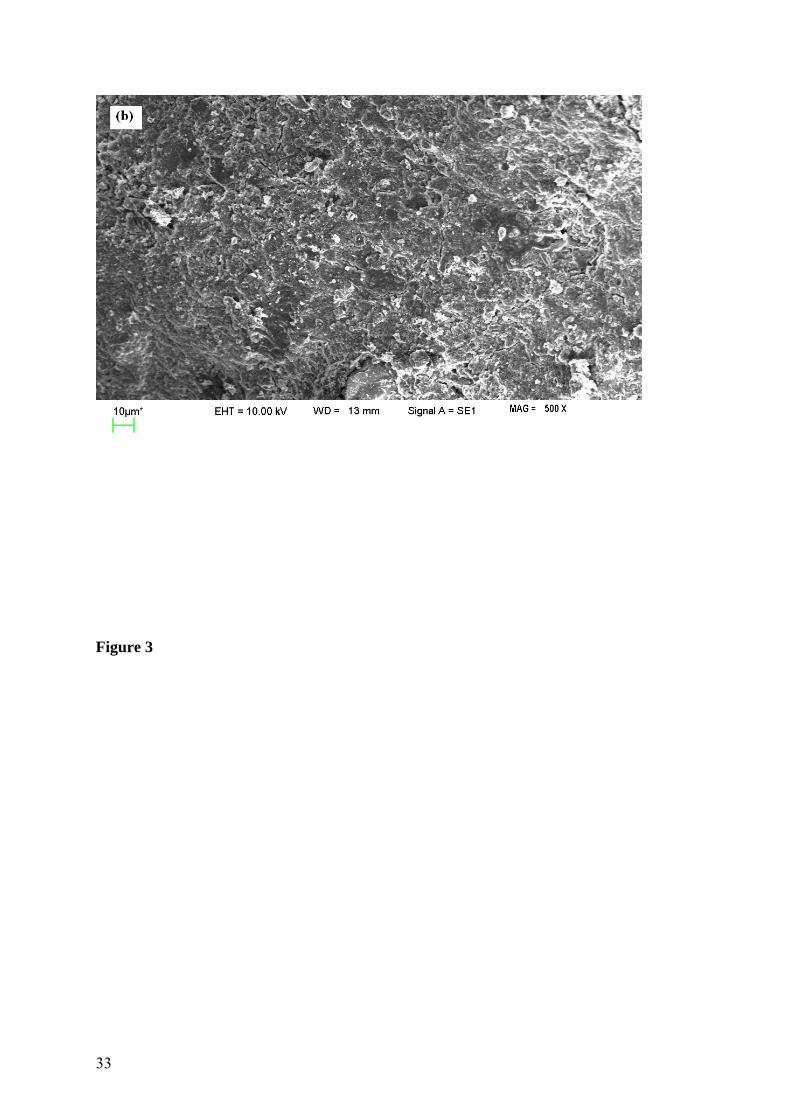
Figure 3
33

Figure 4
34

0
10
20
30
40
50
10 20 30 60 90 120 150 180 210 250
contact time (min)
EC
0
1
2
3
4
5
Tu
rbid
ity
Raw+EC Modified+EC
Raw+Turbidity Modified+Tuurbidity
Figure 5
35
(a)
0
10
20
30
40
50
60
70
80
90
100
15 30 60 90 120 150 180 210 240 270 300
contact time (min)
rem
oval
eff
icie
ncy
(%
)25 mg/L 50 mg/L 75 mg/L100 mg/L 125 mg/L 150 mg/L
(b)
0
10
20
30
40
50
60
70
80
90
100
15 30 60 90 120 150 180 210 240 270 300
contact time (min)
rem
oval
eff
icie
ncy
(%)
25 mg/L 50 mg/L 75 mg/L
100 mg/L 125 mg/L 150 mg/L
(c)
0
10
20
30
40
50
60
15 30 60 90 120 150 180 210 240 270 300
contact time (min)
rem
oval
eff
icie
ncy
(%
)
25 mg/L 50 mg/L 75 mg/L
100 mg/L 125 mg/L 150 mg/L
36
(d)
0
10
20
30
40
50
60
70
80
15 30 60 90 120 150 180 210 240 270 300
contact time (min)
rem
oval
eff
icie
ncy
(%)
25 mg/L 50 mg/L 75 mg/L
100 mg/L 125 mg/L 150 mg/L
37
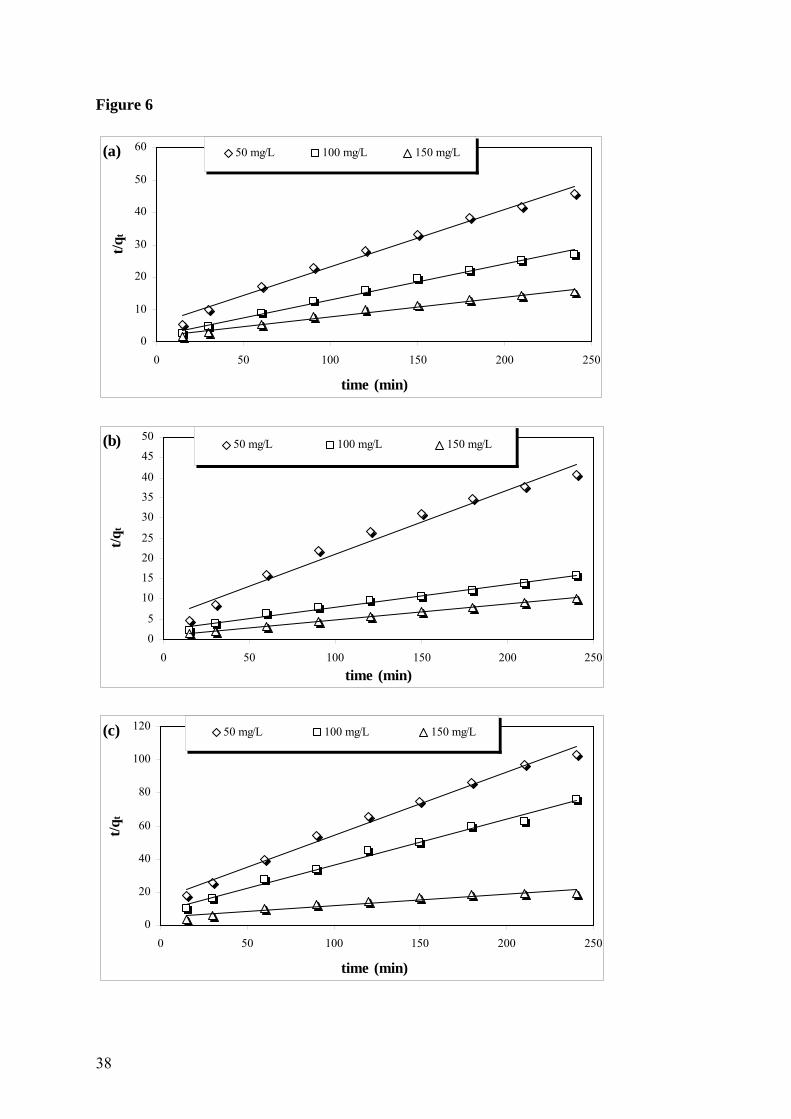
Figure 6
(a)
0
10
20
30
40
50
60
0 50 100 150 200 250
time (min)
t/q t
50 mg/L 100 mg/L 150 mg/L
(b)
0
5
10
15
20
25
30
35
40
45
50
0 50 100 150 200 250
time (min)
t/q t
50 mg/L 100 mg/L 150 mg/L
(c)
0
20
40
60
80
100
120
0 50 100 150 200 250
time (min)
t/q t
50 mg/L 100 mg/L 150 mg/L
38

(d)
0
10
20
30
40
50
60
70
0 50 100 150 200 250
time (min)
t/q t
50 mg/L 100 mg/L 150 mg/L
39

Figure 7
(a)
0
10
20
30
40
50
60
70
80
2 4 6 8 10
adsorbent mass (g/L)
rem
oval
eff
icie
ncy
(%)
pH 2 pH 4 pH 6 pH 8 pH 10
(b)
0
10
20
30
40
50
60
70
80
90
100
2 4 6 8 10
adsorbent mass (g/L
rem
oval
eff
icie
ncy
(%
)
pH 2 pH 4 pH 6 pH 8 pH 10
(c)
0
10
20
30
40
50
60
2 4 6 8 10
adsorbent mass (g/L)
rem
oval
eff
iice
ncy
(%
)
pH 2 pH 4 pH 6 pH 8 pH 10
40
(d)
0
10
20
30
40
50
60
70
80
90
100
2 4 6 8 10
adsorbent mass (g/L)
rem
oval
eff
icie
ncy
(%
)pH 2 pH 4 pH 6 pH 8 pH 10
41
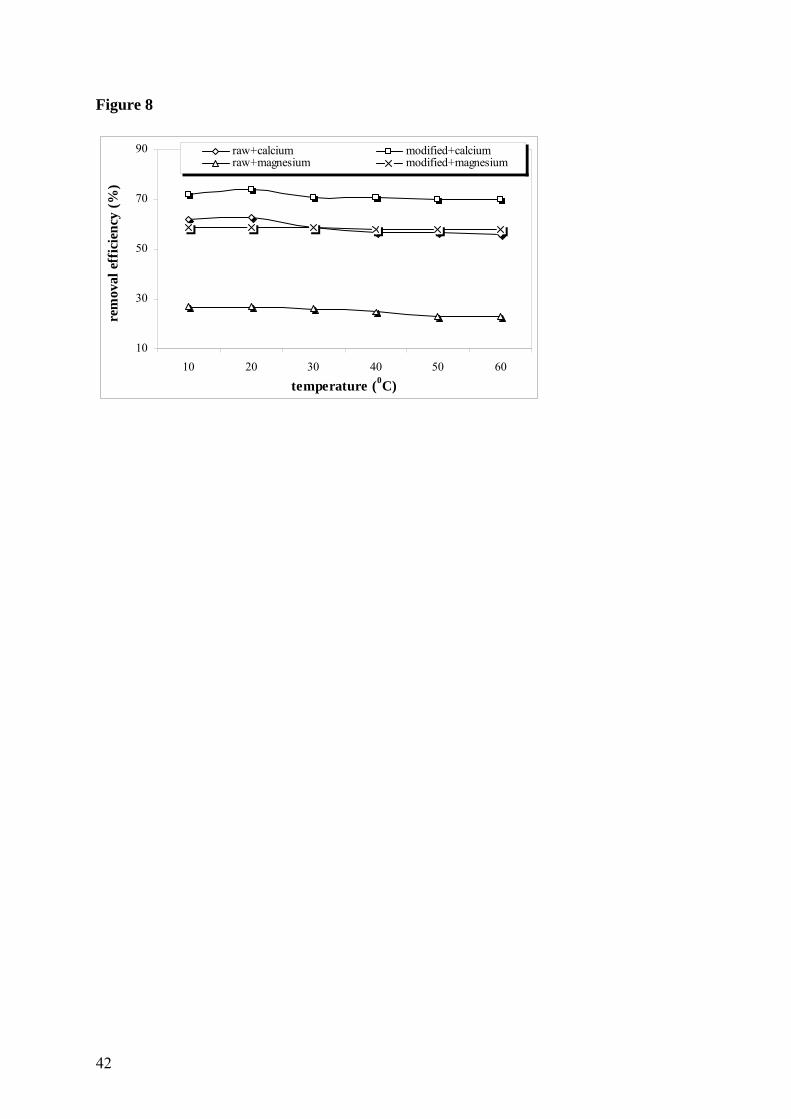
Figure 8
10
30
50
70
90
10 20 30 40 50 60
temperature (0C)
rem
oval
eff
icie
ncy
(%
)
raw+calcium modified+calciumraw+magnesium modified+magnesium
42

Figure 9
-3.5
-3
-2.5
-2
-1.5
-1
-0.5
0
0.003533569 0.003412969 0.00330033 0.003194888 0.003095975 0.003003003
1/T
Ln
kd
raw+calcium modified+calcium raw+magnesium modified+magnesium
43

Figure 10
(a)
0.3
0.5
0.7
0.9
1.1
1.3
1.5
0.4 0.6 0.8 1 1.2 1.4
Log Ce
Log
qe
Raw calcium Modified calcium Raw magnesium Modified magnesium
(b)
0
0.5
1
1.5
2
2.5
3
3.5
4
2 7 12 17 22
Ce
Ce/q
e
Raw calcium Modified calcium Raw magnesium Modified magnesium
(c)
0
5
10
15
20
25
30
1 1.5 2 2.5 3
Ln Ce
q e
Raw calcium Modified calcium Raw magnesium Modified magnesium
44
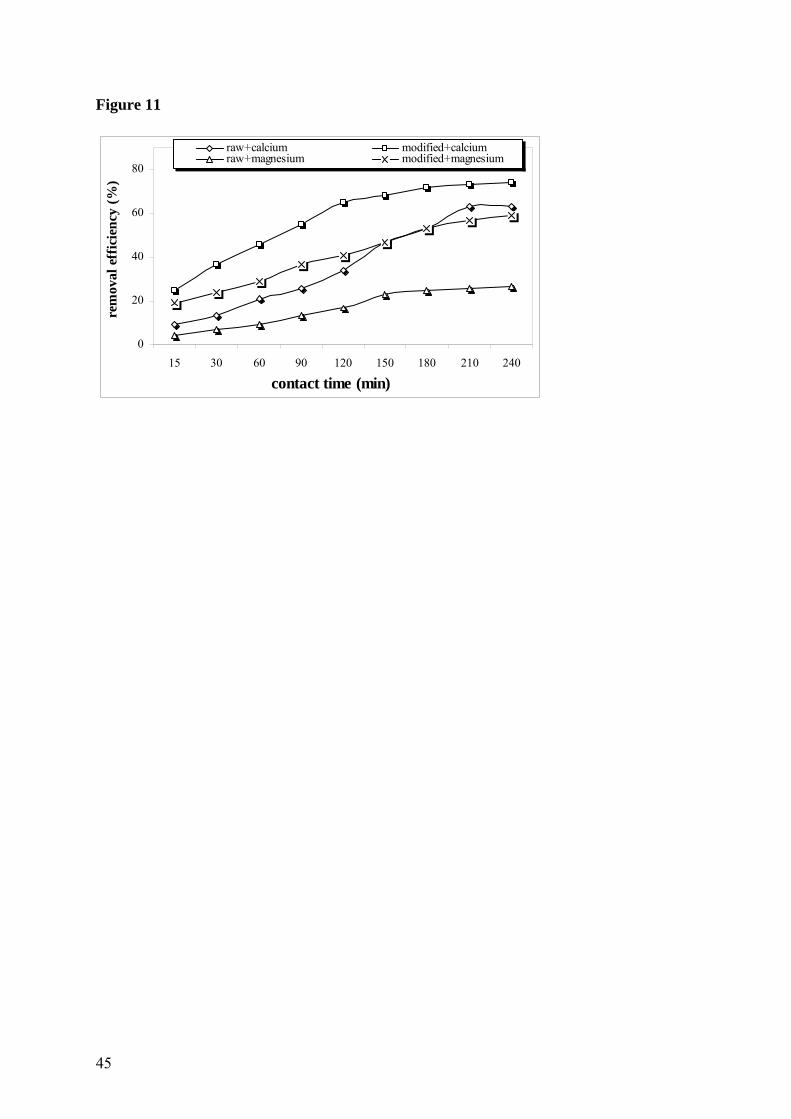
Figure 11
0
20
40
60
80
15 30 60 90 120 150 180 210 240
contact time (min)
rem
oval
eff
icie
ncy
(%
)
raw+calcium modified+calciumraw+magnesium modified+magnesium
45
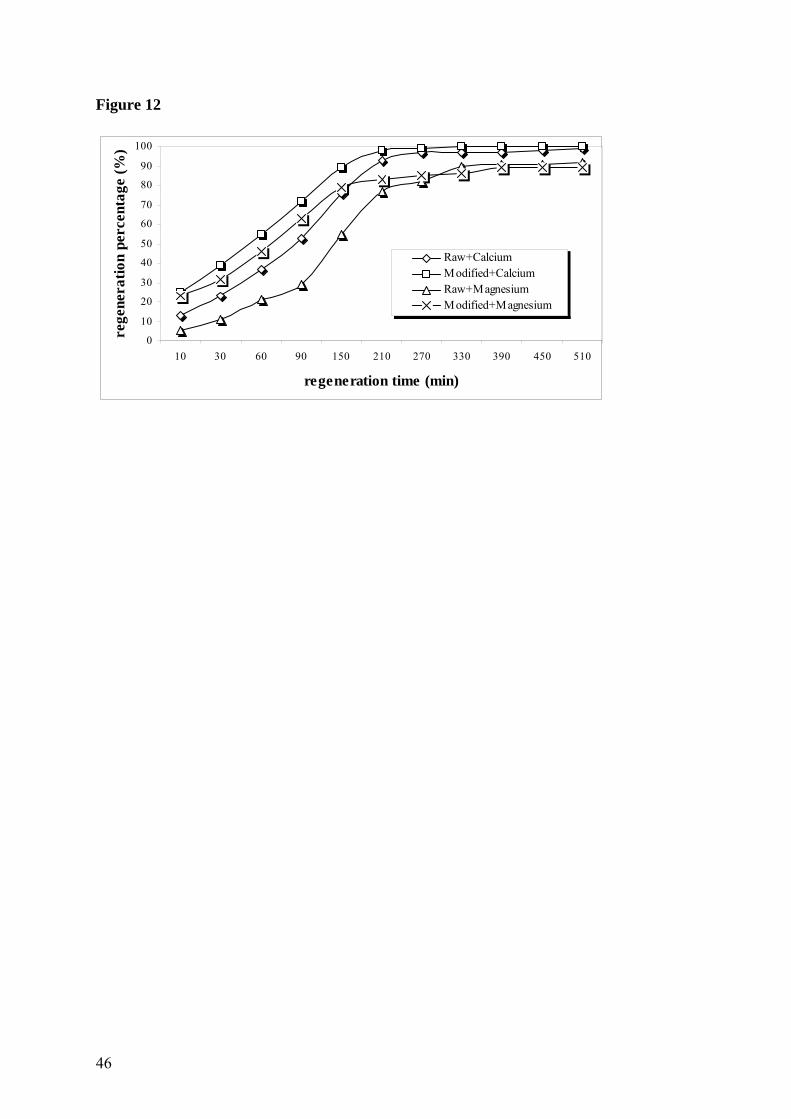
Figure 12
0
10
20
30
40
50
60
70
80
90
100
10 30 60 90 150 210 270 330 390 450 510
regeneration time (min)
rege
nera
tion
per
cent
age
(%)
Raw+CalciumModified+CalciumRaw+MagnesiumModified+Magnesium
46
Copyright © 2022 FDOKUMEN