Location based services and location based behavior in a ...
Upload
khangminh22Category
view
0download
0
SPATIAL PATTERNS, LOCATION VARIABLES AND THE INDUSTRIAL STRUCTURE OF KISH DISTRICT’S
AGRICULTURAL MANUFACTURING INDUSTRIES
BY
JAMES MORONGE MIYOGO
* t8 has reen accepted foeDEGREE .....
\ M J A CORY MAY EE PLACED UNlVEiiSiTY LIBRARY.
THESIS S U B M ITTED IN PARTIAL FULFILMENT OF T H E R E Q U I R E M E N T S F O R T H E D E G R E E O F M A S T E R OF ARTS, LN INDUSTRIAL G E O G R A P H Y , IN T H E
F A C U L T Y OF ARTS, UNIVERSITY O F NAIROBI.1997
J3R°lavaari
UNIVERSITY OF NAIROBI LIBRARY
fi

11
DECLARATION
This thesis is my original work and has not been presented for a degree in any other university.
JAMES M O R O N G E M I Y O G O
This thesis has been submitted with my approval as the University Supervisor
PROFESSOR R. B. O G E N D O

Ill
DEDICATION
This work is dedicated to One who has not only loved me so much, but has also been a constant
source of inspiration, comfort, joy and guidance throughout my life - M Y GOD.

IV
ABSTRACT
This study examines some aspects of agro-based industries in Kisii District. One of the
aspects examined is that of the spatial patterns of the industries. The study also examines the
variables that have influenced the location of these industries and which therefore are responsible
for the prevailing spatial patterns. Finally, the study analyses industrial structural characteristics
of the industries with a view to determining whether the characteristics contribute significantly to
regional development. Literature has been reviewed on both the theoretical and empirical bases.
A number of conceptual and theoretical frameworks/models are provided for the study.
Data analysis is based on primary data collected from a sample of industries where a
recording schedule was utilized, and interviews conducted with industrialists in the study area.
This analysis has utilized both descriptive and inferential statistics, as well as industrial location
analytical tools. The descriptive statistics used include: means, percentages, frequencies and
correlations. The inferential tools utilized are chi-square and factor analysis. The industrial
location pattern is analyzed using the coefficient of localization and the location quotient as
analytical tools.
Analysis of data relating to industrial spatial patterns indicates that there is a spatial
concentration of agro-based industries in Kisii Municipality. Analysis of data on industrial
location variables shows that the various variables influencing the location of agro-based
industries can be summarised into mainly four factors, namely: personal preferences, market
accessibility, industrial support infrastructure-cum-urban economies and government support-
cum-labour-water supply. Analysis of industrial structural characteristics reveals the following:
the technology utilized by industries is predominantly labour-intensive; the industries mainly

V
obtain their raw materials locally; the establishments manufacture primarily consumer goods;
they produce goods largely for the local market; and the scale of production of industries is
mainly very small and/or small.
Several conclusions have been drawn from the major findings of this study. It is apparent
that a core- periphery type of development pattern exists in the study area with Kisii
Municipality being the core and the rest of the study area being the periphery. Secondly, the
industrial location variables influencing agro-based industries in Kisii District are mainly
economic. Finally, the structure of Kisii District agro-based industries is largely centre-periphery
orientated and hence inappropriate, and does not significantly contribute to regional
development.
It is recommended that measures be taken by planners and policy makers to effectively
deal with the apparently polarised space economy of Kisii District. It is also recommended that
the identified industrial location variables be used as policy instruments to influence equitable
industrial and overall regional development in the study area. In addition, there is need to closely
study the industrial structural characteristics of the study area with a view to determining ways
and means through which the industries could be more diversified so as to play a more
significant role in regional development.
It is imperative to undertake further research in all manufacturing and allied service
industries in both Kisii District and other parts of Kenya in order to achieve a nationally more
comprehensive and well diversified and equitable pattem(s) of industrial development in Kenya.

VI
ACKNOWLEDGEMENTS
I would like to express my sincere gratitude to the following individuals and institutions
for their support during the preparation of this thesis.
I wish to thank the University of Nairobi, through the Chairman of the Department of
Geography, Dr. D.N. Mungai, for offering me a scholarship to enable me to undertake the
masters degree programme. I am grateful to the Office of the President for granting me a
research permit.
However, my deepest thanks and gratitude go to my supervisor, Professor R.B. Ogendo
whose assistance, encouragement and supervision throughout the preparation of this thesis has
been very valuable. He tirelessly pinpointed out mistakes and made constructive criticisms which
have contributed to the successful completion of this work.
I am also indebted to the entire staff of Geography Department who have been, in one
way or another, instrumental in my successfully undertaking this work. I am particularly grateful
to the Chairman of the Department, Dr. D.N. Mungai, who has assisted and encouraged me
throughout the postgraduate programme. His interest in my work has been a source of
inspiration and stimulation. I am also very grateful to Dr. E.M. Irandu who has, not only taken
keen interest in my progress, but has also made very valuable suggestions which I have
incorporated in this work.
I wish to extend my thanks to Mr. F. Mwangi who assisted me in data analysis, Mr A.
Nyaribo, Mr. J. Kirema and Mr. I. Ayuyo who assisted me in the cartographic work. Mr. V.
Abuga, the departmental librarian, has been of great assistance to me.

Vll
I am grateful to the following for their assistance during the research period, namely:
officials of the Districts Industrial Development Office (Kisii District); officials of the Districts
Trade Office (Kisii District) and various industrialists who took time off their busy schedules
to have discussions with me.
I am deeply indebted to my Dad, my late Mom, brothers and sisters and other relatives
who have been a source of inspiration and support throughout my life. My deepest appreciation
goes, particularly, to my elder brother, Mr. Johnson Nyabira Miyogo and his family, for their
constant support, inspiration and encouragement without which I would not have gone this far.
My gratitude goes to Betty N. Ogugu and Esther N. Wanjoga, close friends, for their
prayers and concern for my progress. Ken J. Omoke and John M. Omonywa have also been an
inspiration to me.
The typing of this thesis has been a joint effort between Ms R. Njuguna and Mr. F.
Mwangi and I am very grateful to them. However, I remain solely responsible for any
shortcomings in this thesis.

TABLE OF CONTENTS Page
Abstract................................. ............................... iv
Acknowledgements ....................................................... vi
List of statistical tables .................................................. xv
List of figures (maps and diagrams) ....................................... xvii
CHAPTER ONE: INTRODUCTION
1.1 Statement of the research problem ...................................... 1
1.2 Review of selected literature ........................................... 4
1.2.1 Introduction .......... 4
1.2.2 Theoretical bases ............................................5
1.2.3 Empirical bases .......................................... 11
1.3 Justification of the study ............................................. 19
1.4 Objectives, their scopes and limits ..................................... 21
1.4.1 Objectives and their scope(s) .................................. 21
1.4.2 Limits of the study .......................................... 22
1.5 Hypotheses ....................................................... 23
1.6 Conceptual and theoretical frameworks/models............................ 25
1.6.1 Operational definitions and concepts .............................. 25
1.6.1.1 Operational definitions ................................... 26
1.6.1.2 Operational concepts ..................................... 29
1.6.2 Conceptual framework/model ................................... 32
VIII

1.6.3 Theoretical frameworks/models........................................ 39
CHAPTER TWO: T H E STUDY AREA
2.1 Introduction ........................................................ 89
2.2 Location and size ................................................... 89
2.3 Surface configuration in relation to industrial location and structure ............ 92
2.4 Climate (and drainage) in relation to industrial location and structure ........... 95
2.5 The geological base and related soils from the viewpoint of industrial location .... 109
2.6 Agricultural bases for industrial location and structure .......................110
2.7 Population characteristics ............................................... 114
2.8 Infrastructural bases for industrial location and structure .......................115
2.8.1 Standard infrastructure .............................................115
2.8.2 Human infrastructure .............................................. 120
CHAPTER THREE: M E T H O D O L O G Y
3.1 Introduction .......................................................... 121
3.2 Experimental design .................................................... 121
3.2.1 Universe ................... , .............................. 121
3.2.2 Sample frame .................................................122
3.2.3 Sampling procedure ........................................... 122
3.2.4 Data requirements ..............................................
ix
Page

X
3.2.5 Methods of data collection..................................... 124
3.2.6 Primary data sources .......................................... 124
3.2.7 Secondary data sources.......................................... 125
3.2.8 Data analysis ............................................... 126
3.2.8.1 Analysis of data relating to industrial spatial patterns ........ 127
3.2.8.2 Analysis of data relating to industrial location variables..... 130
3.2.8.3 Analysis of data relating to industrial structure ............. 132
3.2.9 Methods of data presentation ................................... 134
3.2.9.1 Maps ............................................... 134
3.2.9.2 Diagrams ........................................... 134
3.2.9.3 Tables ............................................. 135
3.2.10 Limitations of research methodology .......................... 135
CHAPTER FOUR: SPATIAL INDUSTRIAL PATTERNS OF KISII DISTRICT
AGRICULTURAL M A N U F A C T U R I N G INDUSTRIES
4.1 Introduction .......................................................... 138
4.2 Industrial spatial patterns ................................................139
4.3 Hypothesis testing ..................................................... 154
4.4 Implications of findings on industrial spatial patterns .......................... 155
Page

XI
CHAPTER FIVE: LOCATION VARIABLES INFLUENCING THE LOCATION OF AGRO-
BASED INDUSTRIES IN KISII DISTRICT
Page
5.1 Introduction .......................................................... 159
5.2 Data analysis and results ................................................. 160
5.3 Identification and labelling of factors........................................ 171
5.4 Explanations of the factors ............................................... 175
5.5 Hypothesis testing ...................................................... 184
5.6 Implications of research findings on location variables of agro-based industries ....... 185
CHAPTER SIX: STRUCTURE OF AGRICULTURAL MANUFACTURING INPUSTRIESJN
KISII DISTRICT
Page
6.1 Introduction ...........................................................184
6.2 Technological orientation................................................ 190
6.2.1 Hypothesis Testing...............................................196
6.3 Sources of raw materials utilized........................................... 199
6.3.1 Hypothesis Testing.............................................. 201
6.4 Manufactured commodities and their markets .................................205
6.4.1 Types of commodities manufactured ................................ 205
6.4.1.1 Hypothesis Testing...................................... 207
6.4.2 Markets for manufactured commodities 212

6.4.2.1 Hypothesis Testing.......................................214
6.5 Scale of production......................................................218
6.5.1 Hypothesis testing ............................................... 220
6.6 Implications of the prevailing industrial structure of Kisii District's
agro-based industries..................................................... 225
CHAPTER SEVEN: S U M M A R Y OF RESEARCH FINDINGS. RELATED CONCLUSIONS
A N D THE RESULTANT RECOMMENDATIONS
7.1 Introduction ...........................................................229
7.2 Research Findings on:
Page
7.2.1 Industrial spatial patterns......................................... 230
7.2.2 Industrial location variables ........................................231
7.2.3 Industrial structural characteristics .................................. 232
7.3 Conclusions based on the foregoing findings and directly from the field:
7.3.1 Industrial spatial patterns ......................................... 233
7.3.2 Industrial location variables ........................................233
7.3.3 Industrial structural characteristics .................................. 234
7.4 Recommendations based on both the findings and related conclusions:
7.4.1 Industrial spatial patterns ......................................... 234
7.4.2 Industrial location variables ....................................... 237
7.4.3 Industrial structural characteristics .................................. 238
Xll

X U l
7.5 Other general recommendations ............................................240
7.6 Contributions made by the study............................................ 241
REFERENCES AND BIBLIOGRAPHY
References ............................................................... 244
Select bibliography......................................................... 251
LIST OF APPENDICES
Appendix 1: Recording schedule for industrial location variables in Kisii District .........254
Appendix 2: Recording schedule for the industrial structure of Kisii District's
agricultural manufacturing industries 256
Appendix 3: Industrial establishments visited for research purposes, 1994.............. 261
Appendix 4: Categories of the establishments visited for research purposes ............. 264
Appendix 5: Table of random numbers ..........................................265
Appendix 6: Industrial location variables and their codes ............................267
Appendix 7: Data analysis results.............................................. 268
Appendix 8: Correlation Matrix............................................... 273

Xlv'
LIST OF STATISTICAL TABLES
Table Page
2.1 Population projections of selected age-groups, 1979 - 1996 .................. 114
4.1 Agro-based manufacturing employees in Kisii District ...................... 140
4.2 Percentages of employees in agro-based manufacturing and the allied service sector in
Kisii District ........................................................ 141
4.3 Employees in manufacturing and the allied service sector in Kisii District .......143
4.4 Location quotient values for manufacturing industries and.allied service sector in
Kisii District ........................................................ 148
4.5. Number of agricultural manufacturing establishments in Kisii District .........150
5.1. Factor analysis for industrial location variables ......................... . . 168
5.2. Rotated factor matrix for industrial location variables......................... 170
6.1. Technological orientation of agricultural manufacturing industries in
Kisii District......................................................... 193
6.2. Observed and expected frequencies....................................... 197
6.3. Sources of raw materials utilized by agricultural manufacturing industries in
Kisii District ........................................................ 200
6.4. Observed and expected frequencies ...................................... 202
6.5. Types of products manufactured by agro-based manufacturing industries in
Kisii District ........................................................ 206
6.6. Observed and expected frequencies ...................................... 208

XV
Table
6.7. Markets for manufactured products of agro-based industries in Kisii District .... 213
6.8. Observed and expected frequencies ..................................... 215
6.9. Scale of production of agro-based industries in Kisii District ................. 219
6.10. Observed and expected frequencies..................................... 221
Page
xvi
LIST OF FIGURES
Figure Page
Figure 1 A model illustrating the main variables of industrial location as
formulated by the classicists and neo-classicists......................... 38
Figure 2 Optimum location and the concept of spatial margins to profitability...... 43
Figure 3 The behavioural matrix and industrial location decisions ................ 47
Figure 4 A basic model of factors influencing industrial location................. 51
Figure 5 Industry and regional development-Myrdal’s process of cumulative
causation........................................................ 57
Figure 6 The polarised space economy of Kenya ............................. 79
Figure 7 The centrifugal model for comprehensive equitable regional and
urban planning.................................................... 82
Figure 8 The M N C ’s spatial control hierarchy and patterns of wellbeing as formulated by
Hymer ......................................................... 86
Figure 9 Kenya: Position of Kisii District.................................... 90
Figure 10 Kisii District: Administrative Boundaries ............................ 91
Figure 11 Kisii District: Surface Configuration................................ 94
Figure 12 Kisii District: Combined 762mm rainfall reliability and mean annual rainfall 102
Figure 13 Kisii District: Combined 762mm rainfall reliability and precipitation
effectiveness index .............................................. 103
Figure 14 Kisii District: Mean monthly rainfall periodicity at 5 0 m m .............. 104
Figure 15 Kisii District: Mean monthly rainfall periodicity at 7 5 m m .............. 105

Figure 33 Types of products/commodities manufactured by agro-based non-food establishments
in Kisii District...................................................210
Figure 34 Markets for manufactured products of agro-based industries in Kisii
District..........................................................217
Figure 35 Scale of production of agro-based food industries in Kisii District .223
Figure 36 Scale of production of agro-based non-food industries in Kisii District.223
' Page

Figure 16 Kisii District: Mean monthly rainfall periodicity ai 100mm ................ 106
Figure 17 Kisii District: Mean monthly rainfall periodicity at 150mm ......................107
Figure 18 Kisii District: Agro-ecological z o n e s ..................................................................113
Figure 19 Kisii District: Road classification network...............................................................117
Figure 20 Kisii District: Powerline distribution.................................................................. 119
Figure 21 Kisii District: Quantitative industrial spatial patterns .....................................152
Figure 22 Number of agricultural manufacturing establishments in 1994 ........................... 153
Figure 23 Cumulative percentage graph showing ‘cut-off point’ for significant
factors ...................................................................................................................................167
Figure 24 Proportion of total variance graph showing ‘cut-off point’ for
significant factors.................................................................................................................167
Figure 25 Industrial centres in Kisii D istrict................................................................................. 179
Figure 26 Road network and qualitative industrial location in Kisii D is tr ic t................180
Figure 27 Power supply and qualitative industrial location in Kisii District ....................... 182
Figure 28 Establishments A and B ...................................................................................................191
Figure 29 Technological orientation of agro-based industries in Kisii D istr ict.............195
Figure 30 Sources of raw materials for agro-based food industries in Kisii District . . . 204
Figure 31 Sources of raw materials for agro-based non-food industries in Kisii District . 204
Figure 32 Types of products/commodities manufactured by agro-based food
XVII
Page
establishments in Kisii District . 210
1
CHAPTER ONE
1.1 STATEMENT OF THE RESEARCH PROBLEM
This study examines certain aspects of agricultural manufacturing industries in Kisii District,
namely: spatial industrial patterns, likely causal location variables and the associated industrial
structure.
Location of economic activities (and more especially manufacturing), is an important
aspect of development. This is because location of such activities in given places is usually
accompanied by investment o f resources in those places (Myrdal 1957). This enables locally
available resources in those regions to be mobilized for purposes of regional development
(Wegulo 1984). Pred (cited in Collins and Walker 1975), further notes that development o f an
industry in particular places leads to increased population and income in those places, which in
turn stimulate further growth of service and commercial sectors to satisfy the increased demands
of industrial workers.
Given the significance of location decisions, spatial industrial patterns are of paramount
importance due to the fact that they have ramifications for intra-regional development. An
equitable distribution of industries (and other economic activities), is likely to facilitate a broader
spectrum of intra-regional development. On the other hand, inequitable spatial patterns of
industries, (and other economic activities), are likely to lead to lopsided development. This is
a situation whereby some areas tend to attract more development and/or are more developed than
others. This phenomenon has been popularly referred to as ‘polarization*. Polarization which
has characterised Kenya’s space economy is inappropriate for equitable regional development

2
because it is associated with many kinds of inequalities/disparities, nationally,regionally, locally,
and even on individual bases (Ogendo 1988).
This study examines the industrial spatial patterns of agro-based industries in Kisii
District, with a view to determining whether a polarized development pattern exists in the study
area and consequently suggesting possible solutions to the problem if this is the case.
Whereas there is a general consensus among scholars, (for instance geographers,
development planners and economists), on the significance of location decisions of industries
(and other economic activities), one problem, however, remains fundamentally unresolved. This
is associated with the determination of the "actual variables" which influence decisions to locate
in certain places and not others (Wegulo 1984). A number of theories explaining industrial
location variables have been advanced by mainly economists and geographers. The economists’
:ontributions include the ‘Least-Cost Theory’ by Alfred Weber, and the ‘Profit Maximisation
Theory’ by Fetter (1924), Hotelling (1929), Robinson (1934), Palander (1935), Hoover (1937)
and Losch (1954). The geographers have contributed the ‘Spatial Margins to Profitability’
approach by Rawstron (1958), the ‘Behavioural Matrix’ by Pred (1957), among other theories.
An examination of the contributions by both economists and geographers shows that they
(the theories), suffer from certain limitations and cannot therefore adequately explain location
decisions in certain places. For instance, the economists’ contributions are viewed as inadequate
from the geographical viewpoint because they preclude the spatial dimension (Chapman and
Walker 1991).
Owing to the limitations of both the geographers’ and economists’ contributions, the
location variables influencing location decisions in given places can only be determined on the

3
basis of empirical studies in those places. The desire to determine the ‘actual variables’
influencing agricultural manufacturing industries in Kisii District inspired this study.
Industrial structural characteristics can significantly influence regional development. For
instance, if they, (the characteristics), are appropriate, they can contribute to equitable regional
development. Thus, industrial structural studies are important because they (studies) can, help
determine the appropriateness of given industrial structure(s). In this study, industrial structural
characteristics are intended to give an indication of, inter alia, the agro-based manufacturing
sector’s scale of production, predominant types of technology utilized, raw material sources,
major products manufactured and their markets.
In a nutshell, the thrust of this study can be summarized by the following questions,
which essentially constitute the statement of the problem:
(1) What are the spatial patterns of agricultural manufacturing industries in Kisii
District?, or Does polarization which has characterized Kenya’s space economy
also exist in the study area?
(2) Which variables account for the spatial patterns of agricultural manufacturing
industries?
(3) Does the industrial structure of agro-based industries in Kisii District significantly
contribute to equitable regional development?

4
1.2 R E V IE W O F S E L E C T E D L IT E R A T U R E
1.2 .1 IN T R O D U C T IO N
This section reviews selected literature on both theoretical and empirical bases, regarding spatial
industrial patterns, location variables and industrial structure. The rationale behind the selection
of literature (and not a review of all available literature) lies in the availability and abundance
of relevant literature. If a review of all available literature was undertaken, it would be, to say
the least, almost unmanageable.
Review of literature is undertaken because of several reasons, namely:
(a) It helps to identify theoretical and/or empirical aspects that have been studied in
the (planned) field of study along with their respective weakness(es) and/or
gap(s). It is therefore the weakness(es) and/or gap(s) that the research undertaken
should make an effort to remedy and/or fill in, respectively.
(b) It enables the researcher to determine the contribution(s) of past research(es)
relevant to his/her research problem;
(c) It helps the researcher to identify what the past researchers have contributed,
which he/she does not agree with, and therefore creates a possibility of his/her
making a contribution to the relevant area of research.
(d) A literature review is imperative so as to identify topics (or sub-topics) already
studied so as to avoid investigating the same, as this may lead to a waste of time,
money as well as possible duplication of work.

<
Iklow is i rcwcw <>f literature on theoretical and empirical bases
1.2.2 TlIKOKirrtCAI. BASES
li n apt to start tlm section with the work of George Renner (1974, 1950) Renner is
credited with temp the first geographer to formulate a general principle of industrial location
He classified industry into extractive, reproductive, fabncativc. and facilitativc and stated that
in order m be able to undertake any of these, six ingredients arc required, namely: raw
materials, market, labour (including management), power, capital, and transportation In his
general principle of industrial location. Renner (cited in Smith 1971:99) notes,
An industry tends to locate at a point winch provides maximum access to its ingredients or component elements If all these component elements arc juxtaposed, the location of the industry is predetermined If. however, they occur widely separated, the industry is so located as to be most accessible to that element which would he the most expensive or difficult to transport and which, therefore becomes the location factor for the industry m question.
The above principle though generally applicable, operates in different wavs with each of
the four classes of industry. Renner also considers what he terms as industrial symbiosis He
introduces the terms 'disjunctive symbiosis* where it is advantageous for unlike industries to
exist together w ithout any "organic* connection, and "conjunctive symbiosis" which occurs when
different industries in an area have organic connection, such as one providing material for

6
another. This tendency for industry to develop symbiotically may ultimately lead to a big
regional concentration of industry, to which Renner applies the expression, "coindustrialization".
Renner contributed immensely to the study of industrial location during his time by
putting his ideas down in a formal way, particularly for the majority of geographers unaware
of the more rigorous theoretical work of some economists available by his time. Renner’s
contribution is particularly useful due to the fact that many of his contemporaries were reticent
about stating ideas concerning industrial location as formal laws or general principles.
Despite his contribution, Renner has, however, been criticized on several grounds. The
major criticism is his failure to penetrate the economic forces behind his laws (Murata, cited in
Smith 1971:99). For example he has not emphasized that an industry’s "point of optimum
access to its ingredient elements" is a product of spatial cost variation (Smith 1971:99). Renner
has also been criticized on account of his industrial symbiosis and coindustrialization. It has
been argued that these are merely elaborate expressions for externalities and agglomeration
tendencies.
Smith (1971, 1981), an economic geographer, has contributed immensely to the whole
problem of location of manufacturing industry. He has underscored the influence of a number
of location determining variables among which he includes: labour, transportation, raw material
availability and market. He has also incorporated personal considerations which, he argues, may
combine with economic criteria to give an enterprise total satisfaction (Smith 1971: 32-92). He
has observed that the variation of location variables (spatially) make certain places more
favourable for location than others. Accordingly, this has led to spatial inequalities in Western
Europe and North America. Smith has discussed three case studies, "Iron and Steel industry in

7
U.S.A .", "The location of Electrical Appliances Plant" and, "The location of a branch of
Electronics Industry". He has identified the key variables in location in each of the case studies
as well as the market requirements. In his illustrations of the industrial development strategy,
the only centrally planned economy (communist) state he considers is Poland. Although Smith’s
work is useful, his views are confined exclusively to the developed capitalist economy. He has
therefore been criticized on the ground that his work lacks much relevance to the practical
problems of the developing countries (Wegulo, 1984).
Ogendo (1972:51-72) has observed that the location of any given industry is governed
by physical and human variables. The physical variables noted include: the geological
influence, the topographical effects, the significance of the distribution and reliability of rainfall,
and the associated water resources for industry, and the ecological influence of vegetation and
animal potential. Human factors include: (a) demographic and other socio-political and
administrative factors, and; (b) economic factors. The economic factors cited include: (i)
capital and managerial skill, (ii) industrial raw materials, (iii) industrial inter-dependence (or
linkages), (iv) market attraction, (v) influence of infrastructure, (vii) industrial cost-structure and
(vii) personal considerations. He has summarized the above factors as follows:
(i) historical, "topo-geolo-geographical" and ecological influences;
(ii) combined influence of transfer and processing costs with emphasis on availability
and cost of capital, managerial and other skills and transport;

8
(iii) the influence of personal considerations with emphasis on personal cost-reducing
and revenue-increasing factors and their interaction with government location
directives;
(iv) the influence of the spatial pattern of infrastructural facilities and market; and,
(v) the influence of economies of agglomeration and/or industrial linkages.
Ogendo (1972:73-82), has broadly classified Kenya’s manufacturing and allied service
industries into:
(a) the agricultural processing and/or fabricating industries; and,
(b) the non-agricultural processing and/or fabricating and service industries.
These industries are further subdivided into:
(i) the agricultural food processing industries;
(ii) the agricultural non-food manufacturing industries;
(iii) the non-agricultural manufacturing industries; and,
(iv) the allied service industries.
Each of the above main sub-division falls into a number of individual or combined groups
of industries according to the International Standard Industrial Classification (ISIC) of all
economic activities. This study, identifies with Ogendo’s work on two grounds: (i) the work

9
is closely related to this study and its frame of reference is a geographical region, namely,
Kenya, and; (ii) the work lays special emphasis on agricultural manufacturing industries as this
study does. The major difference lies in the fact that Ogendo’s study is pitched on a national
level. His observations and fmdings therefore relate to a much larger (geographical) framework.
On the other hand, this study’s frame of reference is limited to examining the location and
structure of agro-based industries at a District level.
Norcliffe (cited in Walker and Collins 1975), has noted that three variables have a strong
influence on the location of modern industry, namely: infrastructure, internal and external
economies of scale, and linkage and contact fields. He views infrastructure in terms of
availability of water, electricity, transport system and waste disposal. He has identified four
types of economies of scale, namely: plant internal economies of scale; localization of-a-single
industry economies, urbanization economies, and centralization economies (which are similar
to urbanization economies but operate on a larger scale (regional level) than the latter (which
operate on urban level). He further argues that linkage and contact patterns (especially that of
face-to-face) are becoming increasingly important. Although useful, Norcliffe’s observations
are general and may not necessarily apply to the study area (that is, Kisii District).
Leong and Morgan (1982) have also observed the importance of various variables in
influencing the location o f industries. These include: raw materials, fuel and power, human
resources, transport, markets, capital, government policies and industrial inertia. Other factors
which are considered important include; availability of suitable sites, climate, water supply and
historical accident. Whereas these variables are important, this work is general and lacks a
specific frame of reference. Such a frame o f reference is necessary because, the "actual

10
variables" that influence location of manufacturing establishments in a region are specific to that
region. Explanations of such variables cannot, therefore, be couched in terms o f the "general
variables" presented by Norcliffe and Leong and Morgan.
Cannon (cited in Walker and Collins 1975:113), has noted that various incentives are
used by governments to induce industrial location because of the varied nature o f manufacturing
activities. He has given the examples of pre-built rental factories and policies that subsidize a
particular factor of production such as labour or capital, though he has argued that these
(policies), tend to create biases in favour of industries and technologies which use relatively
large amounts of the subsidized factors. Other incentives are: (a) those that have a direct
pecuniary impact on the investment decision, (b) those that attempt to increase the absolute
volume of manufacturing activity by extending credit to establishments that are unable to obtain
investment through normal channels, and; (c) those that focus solely on improving the
psychology of investment in target regions. This study has examined the role of the government
policy as one of the variables influencing location of agricultural manufacturing industries in
Kisii District.
Chapman and Walker (1987, 1991), have noted the influence of various variables in the
choice of industrial location. They argue that "an understanding of the variables influencing the
choice of location for a new factory has been the traditional focus o f concern within industrial
geography". The two writers have underscored the importance of various factors of production
namely: land, labour, capital and enterprise in influencing plant ( or factory/industry) location.
Other factors which are considered of paramount importance include: transport costs, cost-
structures, agglomeration economies and the distribution of customers, suppliers, as well as,

11
competition. According to the two writers, spatial distribution patterns of industries are
influenced by locational requirements and they vary. These observations by Chapman and
Walker are useful to this study but they are general as they do not relate to any geographic
region.
1.2.3 EMPIRICAL BASES
In a survey carried out in Kenya during 1964/65, Ogendo (1972: 86-87) noted that Kenya had
2,747 factories each employing 5 or more operatives. These factories employed 95,692
operatives. There was a further 2,780 establishments with one to four operatives. The findings1
from the survey indicated that:
(1) In 1964, Kenya had few significant industrial establishments in comparison with
the more industrialized countries of the modem world. These few factories
(including those with only 1-4 operatives each) provided employment for about
1.1 per cent of Kenya’s estimated population of 9 million in 1964. Many of the
factories employing 1-4 persons were found insignificant in terms of ”value-
added" by manufacturing;
(2) Most of the operatives (58.4 per cent o f the 92,692 national total manufacturing
operatives), employed in 60.1 per cent of the 2,747 factories (each with 5-100+
operatives), were engaged in agricultural manufacturing industries.
(3) During 1964, most of Kenya’s manufacturing industries consisted of small-sized
mechanized factories (71.9 per cent o f the 2,747 factories) though there were a

12
few which were larger and wholly mechanized (constituting 14.3 per cent of the
2,747 factories);
(4) Kenya’s industries were found to be quantitatively fairly well diversified at the
national level. In 1964 the national index of diversification was 54.4 per cent.
The urban quantitative index of diversification was 46.3 per cent which compares
favourably with the rural quantitative index of diversification o f 35.7 per cent.
In a case study of location and structure of forest based industries, Ogendo (1966) notes
that during a 1964/65 survey, the popular factory sizes in the saw-milling industry were those
factories employing between 5-19 persons, 20-49 persons, and 50-99 persons, in that order.
There were a few factories employing between 1-4 persons and 100 and over persons. Although
only 15 in number, the factories employing 100 and or more persons accounted for 37.6 per cent
of the 6,398 saw-milling employees and were followed by two medium sized factories which
employed nearly equal number of persons. The two smaller types of factories, although
accounting for 46.8 per cent of the establishments, only employed 11,9 per cent of the labour
force in the industry. In 1964, Kenya had 14 pulp and paper establishments mainly concerned
with the manufacture of paper products. Together, they employed 563 workers. There were
581 furniture and fixtures establishments in 1964 and these were mainly based in larger towns
(74 per cent of the establishments) namely: Nairobi, Mombasa, Kisumu and Nakuru. Nairobi
accounted for 45.5 per cent of the labour force and 40.8 per cent of the establishments in the
industry, Mombasa’s share was 20.6 per cent of the industry’s establishments and 18.2 per cent
of its labour force; Kisumu, 5.5 per cent of the establishments and 8.7 per cent of the labour

13
force; Nakuru, 6.7 per cent and 3.5 per cent, respectively. The furniture and fixtures industry
was composed of small establishments employing 1-4 persons per establishment or 5-19 persons.
These two groups accounted for 94 per cent of the establishments and 69 per cent o f the
employees. The last two size groups employing between 20-49 persons and 50-59 persons each,
only made up 6 per cent of the establishments and provided work for only 31 per cent o f the
industry’s labour force. The significant factory sizes in terms of employment were therefore
those employing 5-19 persons and 20-49 persons each.
As far as miscellaneous wood products industry was concerned, Ogendo notes that there
were 39 establishments in 1964. Nairobi had 13 establishments and accounted for 22.5 per cent
of the labour force. Other important centres were Naivasha, Laikipia, Nakuru and Mombasa.
The main products from the industry included matches, pencil slats, carvings, boxes and crates.
In terms of employment, the industry was characterized by large establishments. The six largest
establishments accounted for 71.3 per cent of the 1,123 employees. The two smaller sizes (those
of 5-9, 20-49 employees categories) were also significant. They accounted for 51.7 per cent of
establishments and 26.6 per cent of the entire labour force in the industry. The minimum-sized
establishments (those employing 1-4 persons), though significant in terms of establishment
numbers, were insignificant from the view point of employment.
From the foregoing review, it will be noted that Ogendo’s findings are very useful for
the current study because they emphasize agricultural manufacturing industries and also refer to
a specified geographical region, that is, Kenya. However, the work needs to be updated since
location and structure are dynamic aspects of industry. It is hoped that the current study will,

14
to some extent, serve to update some of Ogendo’s findings and conclusions, especially for the
specified current study area.
The McLaughlin-Robock study, (cited in Wheat 1973), has examined various aspects of
industrial location in thirteen southern states stretching from Virginia to Oklahoma and Texas
(in U .S .A .) after the 2nd world war. On the basis of this study, "market" has been found to be
exerting an overriding importance in location decisions followed by access to raw materials.
Other factors considered important by the study are: labour supply, agglomeration economies
and resources. Though these findings are useful, they have a major limitation in that they are
based on socio-economic backgrounds which are not similar to those in developing countries in
general, and Kenya in particular. Moreover, the study was undertaken in the 1960’s which for
purposes of this study is a long time back. Changes in technology, consumers’ demands and
increase in market all combine to affect decisions on what are considered crucial factors in
industrial location.
Nixson (1973, 47-73, 74-127) has carried out studies on industrial location in Kenya and
Uganda. On the basis o f these studies, he lists the following location variables as being
important in location decision-making:
(a) transport and processing costs;
(b) the demand (market), and;
(c) personal considerations.

15
According to his findings, processing costs do not appear to be of much significance
within Uganda, so are labour supply and costs. Similarly, most industrialists attach little
significance to inter-industry linkages and only in a few cases was proximity to other firms
considered important. Moreover, inter-industry transactions were manifested only in a small
scale. Nixson made similar observations about industrial location in Kenya. He, however,
observes that there are a lot of variations of locational requirements at industry level and also
from one country to another (Kenya and Uganda). Nixson’s work is useful because it is based
on Kenya and Uganda and therefore, closer to what this writer is likely to find in the field. This
study, on the other hand, seeks to narrow down the frame of reference from "country'' (national)
level to "District" level.
Obiero (1980) has noted several variables that influence the location of the sugar industry
including: physical, social and economic factors. Among the social factors she examined
included, population and the role of the government influencing the location of the sugar
industry. The economic factors included, land, capital, managerial skills, industrial raw
materials, transport, power, markets, industrial cost-structure and personal considerations. She
has concluded from her findings that the Western Kenya sugar industry is apparently influenced
by physical rather than economic factors. This, she argues, is due to certain anomalies in the
economic operations of various established sugar factories. These anomalies relate to the fact
that sugar companies do not meet their own production costs. Instead they are highly subsidized
by farmers and especially the government in transportation. More specifically, the variables
found to influence the location of the sugar industry included the government’s role and
personal considerations. Other factors such as land, capital, labour, transportation, tax and cost-

16
structure were found insignificant. Obiero’s findings are definitely relevant to the current study
because the sugar industry is one of the most important agricultural manufacturing industries in
Kenya. However, the study will be concerned more with agricultural manufacturing industries
including the sugar industry and its frame of reference will be Kisii District and not the whole
of Western Kenya Region.
Wegulo (1984) has examined the location, structure and impact of manufacturing and
supporting service industries in Nyanza Province. He has noted the following industrial location
variables as being significant:
(a) the availability of local market,
(b) the availability of local support infrastructure, and ;
(c) government support-cum-labour-personal considerations.
In the light of the above findings, Wegulo has concluded that industrialists in Nyanza
seek locations which guarantee them ready market for disposal of their goods. He further notes
that sites that have been serviced,(provided with water, roads, railway lines (or sidings) and
power installations), by the government or relevant municipalities, are advantaged, since they
tend to attract industry better.
As far as spatial distribution of manufacturing establishments is concerned (in Nyanza
Province), Wegulo used the total number of manufacturing operatives in each District, as an
index of measurement. The findings show that in 1980, Kisumu District accounted for 76.75
per cent of the manufacturing operatives in Nyanza Province. South Nyanza accounted for

17
10.17 per cent, Kisii, 9.76 per cent and Siaya District, 3.31 per cent. Wegulo, therefore
concluded, from his findings, that there was a spatial concentration of industries in Kisumu
Town and District which tended to encourage polarized activities at the expense of the rest of
Nyanza Province.
The industrial structural characteristics studied by Wegulo included: the predominantly
prevailing technology and the type of goods produced. His findings show that capital-intensive
technology accounted for 43 per cent of industries especially agricultural manufacturing. Only
19 per cent of all the manufacturing and supporting industries were "partially labour" intensive
technologically. "Wholly labour-intensive" type of technology was not apparently reflected in
any of the categories of manufacturing or supporting service industries. On the types of goods
produced, export orientated manufacturing accounted for 54.5 per cent of the total operatives
involved in the sample as compared to 20.8 per cent and 17.6 per cent, respectively, for
consumer goods and intermediate/producer goods. However, on narrowing down the scope to
consideration of consumer goods versus intermediate producer goods, Wegulo found an
overwhelming preponderance of consumer goods which accounted for 75 per cent of the total
number of operatives engaged, leaving only 25 per cent of the operatives engaged in the
production of intermediate/producer goods. Most of the operatives in Nyanza were engaged in
processing industries with negligible "value added" accruing to national economy. Wegulo
therefore concluded that the structure of manufacturing and supporting service industries in
Nyanza was weak and was unlikely to effect adequate regional development unless major
structural modifications were implemented.

18
This work identifies very closely with Wegulo’s study. Not only does it (Wegulo’s work)
deal with location and structure, but also its frame o f reference is Nyanza Province within which
the study area is found. This (current) study, however, differs from Wegulo’s (work) since it
is based on a District and not a province, that is, it has a narrower frame o f reference to
facilitate more detailed analysis. Moreover, it lays emphasis on agricultural manufacturing
industries and not manufacturing industries in general (as Wegulo’s work does).
Kinyanjui (1987) has investigated the factors that motivate entrepreneurs to establish
industries in Thika. Her study reveals that government support to industry and accessibility to
external business information are significant in the location decisions of large scale industries,
whereas production cost-saving factors and accessibility to national markets are important for
small-scale industries. The study also shows the factors that influence the general spatial patterns
of industries. These include: the price of land, presence of a major highway, and presence of
a major railway line. Kinyanjui has, however, limited her study of industrial structural features
to spatial linkages. Other structural features, especially those given prominence by this study are
not considered.
Opondo (1989) has studied the spatio-structural characteristics of small-scale industries
in Kisumu Municipality. Her findings show that there are distinct structural characteristics
between formal and informal enterprises in terms of: capital investment, ownership, technology
utilized, and employment. Using factor analysis, specifically the principal components approach,
she has identified the most significant factors that motivate entrepreneurs to establish industries
in Kisumu. These include: agglomeration economies, industrial infrastructure, business
information and personal considerations. She has also identified variables that strongly influence

19
intra-urban industrial spatial pattem(s). Using a simplified input-output system, she has
established linkages between small-scale industries and Kisumu urban industrial economy.
This study differs from Opondo’s (study) in terms of: the frame of reference, types of industries
given emphasis, and the variables given consideration (in terms o f both industrial location and
structure).
1.3 JUSTIFICATION OF THE STUDY
This study, can be justified on several grounds. It will be noted that although a number of
studies relevant to the current one have been undertaken, the approach(es) and the scope(s) of
such studies differ from those of this work.
Some of the studies undertaken have wide frame(s) of reference. They cover wider
geographic regions as compared to the current research (Ogendo 1972, Obiero 1980, Wegulo
1984, Nixson 1973). This study is unique in that it covers a smaller geographic region, ( a
District), considered more appropriate for purposes of detailed analysis. It will also be noted
that some of the studies and/or works related to this study lack a frame of reference (Chapman
and Walker 1987, 1991, Leong and Morgan 1982, Bale 1981). Such studies and/or works are
general and, therefore, their observations and hence their findings do not relate directly to those
likely to be found in the study area.
Another justification for this study is that some of the studies undertaken and which are
relevant to this study need to be updated. Some of these (studies) were undertaken in the 1960’s
and early 1970’s [(Ogendo, 1966, 1972 Nixson (1973) McLaughlin-Robock study (cited in
Wheat 1973)]. Since then, there have been many changes affecting location and structure of

20
industries. These include: changes in technology, changes in consumer demands and
preferences, and scale(s) of operations as well as increased markets. Some of the work(s) of
western writers (such as Smith 1971, 1981), which are related to this study, suffer(s) from the
limitation of being irrelevant to the socio-econo-political background(s) of developing countries
such as Kenya. Hence, findings and conclusion(s) arrived at, by these (western) writers, in
connection with the current study are neither conclusive nor representative of the circumstances
in developing countries, such as Kenya, and particularly Kisii District.
Furthermore, unlike this study, other relevant studies have tended to address themselves
to general manufacturing and allied service industries (Nixson 1973, Wegulo 1984). Others are
based on one specific industry (Obiero 1980). The present srudy is unique in that it is based on
a specific composite type of manufacturing industry (that is, agricultural manufacturing) and
considers several individual industries within agricultural manufacturing.
The study area chosen (Kisii District) is relevant in this study on account of its high
agricultural potential. Out of 135,100 acres o f land available for fanning, 78 per cent is suitable
for agriculture (District Development Plan, 1994-1996). The economy of the District is heavily
agriculturally orientated. Thus, most of the industries located in the study area are agricultural
processing and/or fabricating.
Implicit, from the available literature, is the fact that although such (literature) addresses
itself to issues closely related to this study, the similarity ends there. Other writers’ and/or
researchers’ frames of reference, scopes, as well as, approaches differ from those of the present
study. Hence, this study curves out a "niche" for itself among other studies because it addresses

21
This makes this study unique and hence its justification.
1.4 O B JE C T IV E S . T H E IR S C O P E S AND L IM IT S
1 .4 .1 O B JE C T IV E S A N D T H E IR S C O P E S
In the light of the statement of the problem, the objectives of this study and their scope(s) are
outlined below as follows:
(1) To describe and portray the spatial industrial patterns of agro-based industries in
Kisii District.
(1) The emerging the industrial spatial patterns have been described. These patterns
have been portrayed using cartographic techniques.
(ii) The manufacturing employees in both agro-based and non-agro-based industries
have been utilized to compute percentages, the coefficient of localisation and the
location quotient on the bases of which the spatial industrial patterns have been
described.
(iii) The numbers of agro-based establishments in 1994 in the various divisions of the
study area have been used to determine the industrial spatial patterns.
(2) To evaluate the nature of the variables that have influenced the location of
agricultural manufacturing industries in both Kisii District.
itself to issues relating to a specified spatial (or geographical) region and group of industries.

22
The following variables have been examined in this study:
(i) Physical variables;
(ii) Economic variables; and,
(iii) Demographic, socio-political and administrative variables.
(3) To determine whether the industrial structure of agro-based industries in the study
area contributes significantly to its (the study area’s) development.
The significance of selected aspects of industrial structure has been analyzed. These
aspects include:
(i) Predominant type of technology utilized;
(ii) Source(s) of the raw materials used;
(iii) Types of commodities manufactured;
(iv) Markets for the manufactured commodities, and;
(v) Scales of production.*
1 .4 .2 L IM IT S O F T H E ST U D Y
This study’s limits are as follows:
(i) This study addresses itself to the spatial patterns, location variables and the
industrial structure of agricultural manufacturing industries in Kisii District. No
other aspects of the agro-based industries are examined.
(ii) Owing to data limitations, the study has only given consideration to a few industrial
structural characteristics. These are: technological orientation; scale o f production;

23
source(s) of raw materials; types of commodities manufactured, and; the markets for the
manufactured commodities. Other industrial structural attributes are not given
consideration.
(iii) It is noted that equitable regional development is a function of many variables,
some of which include: people’s culture, prevalence of skilled labour, resource
endowment, people’s drive towards improvement of quality of life, and so on.
However, this study does not concern itself with these but specifically examines
the influence of some aspects of agricultural industries on the equitable
development of Kisii District.
(iv) The study limits itself to agro-based industries in Kisii District. However, to facilitate
the computation of the coefficient of localisation, employment figures for non-agro-based
manufacturing and allied service sector are utilized. No consideration is given to
industries outside the study area,
1 .5 H Y P O T H E S E S
The above objectives need to be recast into hypotheses. Given below are the relevant
hypotheses. Hypotheses 1 and 2 relate to the industrial spatial patterns and the industrial location
variables, respectively. The rest of the hypotheses are concerned with the selected industrial
structural variables.
(1) H0: There is no significant industrial localization in Kisii District.
Hj: There is significant industrial localization in Kisii District.

24
(2) H,: Economic variables are not the main determinants of the location
of agro-based manufacturing industries in Kisii District.
H,: Economic variables are the main determinants of the location of
agro-based manufacturing industries in Kisii District.
(3) Ho: The differences between agro-based food and agro-based non-food
establishments, in terms of technological orientation, are not .
significant.
H,: The differences between agro-based food and agro-based non-food
establishments, in terms of technological orientation, are
significant.
4. H0 The sources of raw materials for both agro-based food and agro-based non-food
manufacturing industries are not significantly different.
H, The sources of raw materials for both agro-based food and agro-based non-food
l manufacturing industries are significantly different.
5. Ho There is no significant difference in the types of commodities, manufactured by
agro-based food and agro-based non-food industries.
H, There is a significant difference in the types of commodities, manufactured by
agro-based food and agro-based non-food industries.

25
6. H0 There is no significant difference between agro-based food and agro-based non
food industries in terms of market for manufactured products.
Ht There is a significant difference between agro-based food and agro-based non
food industries in terms of market for manufactured products.
7. H0 The scale of production of agro-based food and agro-based non-food industries
is not significantly different.
Hi The scale of production of agro-based food and agro-based non-food industries
is significantly different.
1.6 CONCEPTUAL AND THEORETICAL FRAMEWORKS /MODELS
This section deals with the study’s operational definitions and concepts as well as the
conceptual and theoretical frameworks. The operational definitions and concepts are presented
first followed by a discussion of the conceptual and theoretical frameworks.
1.6.1 OPERATIONAL DEFINITIONS AND CONCEPTS
Definitions are, broadly speaking, procedures for specifying meaning. They are vital for
the development of understanding and communication of information (Harvey 1969). A concept
refers to a mental construct, image, thought or idea, especially one that is constructed by
generalization from particular examples (Harvey 1969, Clark 1987). A number of concepts and
definitions have been used in this study. These need to be explained in the context in which they
have been used so as to make them clear to the readers.

26
1 .6 .1 .1 O P E R A T IO N A L D E F IN IT IO N S
The operational definitions are provided below as follows:
Establishment - this is an individual plant in which goods are manufactured, usually in an
enclosed shed.
Industry - refers to any productive enterprise, (especially manufacturing and certain service
industries, such as, transportation and communications) which employs relatively large amounts
of capital and labour.
Industrialist - refers to a business person involved in manufacturing in a factory and/or in the
provision of services. This could be the owner, or the one in charge (for example the manager).
Other terms used in this study to refer to same individual are entrepreneur and manufacturer.
Location Variables - these refer to the phenomena which influence the choice of location of an
industry. In this study, various variables which influence location of agricultural manufacturing
industries in Kisii District are examined, namely: physical, economic, demographic and socio
political variables.
Operatives - these are the assembly-line workers who assist in manufacturing materials in
factories or establishments. They can be classified as skilled, semi-skilled and unskilled. Skilled
operatives are those who have acquired competence in their work by knowledge attained through
training and/or experience. Semi-skilled operatives are those who have gained some experience

27
in their work but have not reached the level of a skilled worker. Unskilled operatives are those
who are inexperienced and/or untrained and have no recognizable competence in their work.
Employees - this term refers to both the assembly-line workers (operatives) as well as others
employed in the management (the industrialist(s) and/or the assistants).
Development-inducing industries - these are those industries which are either located in the urban
or rural areas, but which, by virtue of their clear profitability, are capable of ploughing back
a substantial portion of their financial proceeds into the rural areas. Good examples include: tea,
coffee and sugar industries.
Development-supporting industries - these are industries, (largely of the service type), which can
only plough back money into the rural areas if they are owned and located there. Otherwise for
similar industries whose owners live in the urban areas, they, (the industries), merely act largely
as sources of leakages of rural development funds, except in instances where the wages they pay
their workers is ploughed back to the rural areas by the workers. Good examples include:
printing and publishing, motor vehicle repair, a number of other service industries, metal
furniture and fixture fabrication.
Processing - refers to an early stage of the conversion of primary agricultural raw materials, for
example, the conversion of sugarcane into milled sugar; raw hide from animals into leather;

28
separation of cotton lint from cotton seed, and so on. In this case, milled sugar, cotton lint, and
leather are products of the processing stage o f manufacturing.
Fabrication - refers to the later stage of manufacturing, whereby the processed products are
made relatively directly useful to the users. For example, the conversion of leather into shoes,
bags; fabrication of sisal fibre into carpets, and so on.
Agglomeration economies - these are economies emerging from "the association of
productive activities in close proximity to one another", as in a major specialised industrial
region or in a large town or city. Agglomeration typically gives rise to external economies of
scale.v , ' ;.
Jua Kali activities - these are activities conducted in the open and other unplanned working sites
in which people work while exposed to harsh environmental conditions like heat from the sun,
rain and dust.
Eigenvalue - this refers to the total variance in the entire set of original variables that is
accounted for by each factor or component in the factor analysis or principal component analysis
procedures, respectively.
Communalitv - this is the proportion of variance for each variable accounted for by all the
factors or components.

29
Factor Loadings - these are correlations between variables and factors. The higher the
correlation between a variable and a factor, the higher the loading o f the variable on the factor.
1.6.1.2 OPERATIONAL CONCEPTS
The concepts used in the study are explained as follows:
Development - this is a process that includes economic growth as one of its essential aspects,
but goes beyond this to encompass the complex of interdependent changes in society as a whole
which carry society forward according to prevailing value judgements (Hermansen, 1972). This
process raises the standards of living of people through increasing incomes and consumption
levels, creation of conditions conducive for self esteem through socio-cultural and political as
well as economic systems. It also deals with increasing people’s freedom o f choice and
enlarging the range of choices in terms of consumer goods and services.
Equitable regional development - this is comparatively equated, (not necessarily equal)*
development that takes into account the differences in regions, in terms of, particularly, their
resource endowment(s). It should be noted that the value of a resource is not intrinsic in the
material itself but depends on the structure of demand, the state o f technology, the cost of
transportation, the social and political organization for transforming the raw material into
marketable commodities. Thus, to make resources in an area available for development,
considerable investment may be required.

30
Intra-regional development - this is development within all parts o f a given region. This concept
takes into account the fact that within a region, different parts are likely to have distinct
endowments which should be exploited for purposes of the region’s development. Although
physical resources may have dwindling importance, as inputs o f production, the start of
development in a locality will frequently result from a unique resource advantage which attracts
capital and other factors o f production.
Industrial structure - this refers to the aggregate of individual industries in a region, that account
for all the manufacturing ranked according to magnitude which can be measured proportionately
using given criteria (or a criterion). It also refers to certain aspects o f industry herein referred
as ‘structural aspects’. Examples of such aspects include: technology utilization, scale of
production, location of industry, ownership pattem(s), types o f goods produced, and raw
materials used.
Spatial distribution/pattem - this concept refers to the areal spread of phenomena (or
phenomenon). In this study, it refers to the areal ‘spread’ of agricultural manufacturing
industries in Kisii District.
Polarization effects - These are effects which result in the decrease of absolute level of
development of a peripheral area relative to a core area (Obiero, 1980). For instance, migration
from a peripheral area to a core area (such as a town) may remove productive population from
the former to the latter.

31
Location - This refers to the actual area where industrial activity takes place or spatial/areal
spread of given industrial activity in relation to other industries and/or economic activities.
Infrastructure - this is the underlying super-structure of services and amenities needed to
facilitate industrial, agricultural and other economic development(s). Infrastructure, therefore,
includes the provision of transport, communications, education facilities, power supplies, water,
health facilities, etc.
Manufacturing - This is a process by which any of the raw materials (primary or secondary, of
vegetable or animal origin), are converted into more useful forms (Ogendo 1972:2). This process
takes place in a factory (or establishment). The raw materials are converted into valuable
commodities, ready for consumption. Manufacturing often consists of two stages, namely :
processing and fabricating.
Development centres (DCs) - These are planned and graded relatively larger industrial towns
which meet particular centrifugally-based rural development threshold size(s) in terms o f the
number and size(s) of manufacturing establishments, their operatives and the graded resident
population(s) but with their planned symbiotic rural counterparts in mind. The manufacturing
operatives and resident populations, respectively, vary from 10,OCX) and 200,000 in DC1; 4,500
and 50,000 in DC2; 4,000 and 30,000 in DC3; 1,500 and 18,000 in DC4, to 1,000 and 18,000
in DC5.

32
Development points (DPs) - These are points (usually planned and graded smaller urban centres),
by virtue of directed planning, from which economic growth and/or economic development is
purposely intended to originate and operate most efficiently with a view to radiating or diffusing
to the surrounding rural areas. The manufacturing operatives and resident populations,
respectively, range from 700 and 10,000 in DPI; 600 and 5,000 in DP2; 500 and 4,000 in DP3;
350 and 3,500 in DP4, to 200 and 2,000 in DP5.
Potential development points (PDPs) - these are planned and graded small towns that are,
centrifugally, largely local in function, but with intended characteristics o f the development
centres and development points, though at the basic level(s). They have manufacturing
operatives^ A *%om 1500 in a PDP1; 1000 in PDP2; 500 in PDP3; to 50 or more in PDP5.
LiJ
Service centres (SCs) - these are planned, up-and-coming, relatively smaller towns (than
potential development points), and less important in function. They are more ubiquitous and
often denser than the potential development points, hence, more numerous and play the basic
roles in the Central Place Theory service hierarchy. Some may even have significant industrial
cores.
1 .6 .2 C O N C E P T U A L F R A M E W O R K /M O D E L
This section attempts to provide a conceptual model for this study. The model is based
on the normative theories of location formulated by the classical and the neo-classical
economists. The theories include: the "least cost" or "cost-minimisation" approach, usually
BAST AFTV ‘ 1 * COL!_ECT7oil

33
associated with Alfred Weber, and the "market- areaTlocational interdependence7"profit
maximization" approach(es). The classical and neo-classical approaches have been contributed
mainly by economists with the intention of integrating industrial location into the main body of
economic theory and, in particular, the "theory of the firm", so as to come up with "pure rules"
of location which lead to optimal location of the individual firm (Nixson, 1973:5,6). Such
theories (or approaches) are based on the response o f the individual firm to such economic
factors as: (a) transport; (b) labour; and, (c) access to market.
The birth of modem industrial location theory is generally dated as 1909 and is associated
with Alfred Weber’s seminal work (namely; *Uber den standort der Industrie^ - translated as,
Theory of the Location of Industries). However, before this work, other Germans, such as
J. H. Von Thiinen and Wilhelm Launhardt had written on this (or somewhat related ) subjects.
To come up with his theory, Weber made certain assumptions for the purpose of
eliminating complexities of the real world, namely:
(a) Raw materials are found in certain localities only, that is, they are not ubiquitous;
(b) There is perfect competition with each producer having unlimited market, and,
finally;
(c) There are several labour locations which are fixed with labour being immobile
and in unlimited supply at a given wage rate.
Given the above assumptions, Weber argued that, the primary factor influencing
industrial location is transport cost. Other factors Weber considered important were labour costs

34
and agglomerative and deglomerative forces. He has referred to the first two (that is, transport
and labour costs) as "general regional factors" while the third one as a "local factor".
Costs are not considered directly but rather as a function of weight to be carried and
distance to be covered (Smith, 1971). Weber’s theory of location begins by identifying a
minimum cost location using Launhardt’s locational triangle (Smith, 1971:114). By using
isodapanes (lines drawn around the least-transport cost location joining places o f equal additional
transport costs), Weber’s theory seeks a better location either through savings in labour costs
and/or agglomeration economies. Where savings in labour and/or agglomeration economies
exceed additional transport costs, a critical isodapane is defined and a new optimum location is
identified (Norcliffe, cited in Walker and Collins 1975:21) . According to Weber’s theory, the
locational objective of the businessman is to substitute between the three factors (that is,
transport, labour and agglomerating economies), and in so doing select a site which minimizes
total costs (least-cost). Such a location is known as the optimum location.
Although Weber’s work provides a valuable basis for development of the theory of
location, he (Weber) has been criticized for his unrealistic assumptions. His assumption o f fixed
labour location is unrealistic taking into account the great labour mobility, especially in Kenya.
He has also assumed constant demand and has altogether omitted institutional factors (Nixson,
1973:8,9). Furthermore, Weber has been criticized on account of the fact that his analysis does
not give adequate explanation of locational factors or variables. He does not give reasons for
selecting and designating three factors as important as opposed to those he rejected (or did not
consider), [Obiero 1980]. It has been noted that several developments, since Weber’s time, have
downgraded the importance of his three location factors (or variables) (Norcliffe, cited in Walker

35
and Collins, 1975:22, 23, 24). For instance, Smith (1971) has noted the decline in the
importance o f transport when he states:
Transportation is often considered to be the most important single determinant of plant location.
xV This is less true than it has been historically^ but transportation is still a major factor in the location of many industries (Smith 1971:69).
Despite these criticisms however, Weber’s theory should not be downplayed. At the turn
of the century, his theory had relevance but subsequent developments call for revision of the
theory.
Hoover (1948) attempted to respond to the criticisms raised about Weber’s ideas by
trying to make more realistic his (Weber’s) weak sounding assumptions. Unlike Weber, who
assumed that transport costs are directly proportional to distance moved and weight carried,
Hoover varied the costs to reflect length, direction of the haul and the composition of the goods
involved. He also incorporated institutional factors (Wegulo, 1984).
Despite Hoover’s attempts to reformulate and make Weber’s original ideas more realistic,
the least-cost approach is still criticized for over-emphasizing the supply component in the
production process and neglecting demand. Smith (1971) notes:
The weakness of the approach is that as soon as demand is allowed to vary in space, the least (average) cost location does not necessarily yield maximum profits, since it may be preferable to move to a new location with higher unit costs

36
but where greater sales will increase total profits (Smith, 1971:137).
To overcome the weaknesses of the "least cost" or "cost-minimisation" approaches, the
"market area" or locational interdependence school of thought was developed by among others,
Fetter (1924) and Hotelling (1929). This approach assumes that all firms have identical
production costs and sell to a spatially distributed market. The price of products to consumers
varies with transportation costs from the factory. In choosing his location, each seller seeks to
control the largest possible area which is determined by consumer behaviour and location
decisions of other firms. Thus, the manufacturer exercises monopoly control over that section
of the market which he can supply at a lower price than his rivals (Smith, 1971:138).
This school of thought has been criticized just as its predecessor (the least-cost school of
thought) for being unrealistic in that it over-emphasizes the demand aspect at the expense of
other considerations which are likely to influence the entrepreneurs decisions in location of
enterprises (Wegulo, 1984).
Losch (1954) has incorporated both demand and supply aspects into the notion of location
of production. Losch’s main contribution is not in helping to explain the location which he takes
as given, but in trying to formulate the optimum market areas (where profit is maximized), for
firms in competing industries in a given area (Bale, 1981:63). Losch, like his predecessors
(Fetter and Hotelling 1929, among others), notes that every firm (or production unit) has an
element of spatial monopoly in which it can best serve itself. The incorporation of transport
costs to more distant markets increases the prices o f goods produced by the firm and quantity
demanded gradually declines until it is zero. Given a homogeneous plain, evenly populated with

37
homogeneous people, a demand cone may be constructed around a firm defining the market area
and the quantity sold (Chapman and Walker 1987:40, Lloy and Dicken [cited in Chapman and
Walker 1991], have shown that competition will finally turn the circle (formed by the demand
cone) into a hexagon (hence hexagonal market areas) which are part of a series serving a region
more efficiently. Losch’s work is actually an extension of the earlier schools of thought such
as the "least cost" and the "market area" approaches, though it differs from them in the sense
that he does not hold demand and/or supply constant. He (Losch) argues that the goal of a
rational production unit is to select a location at which profits are maximized.
The various ideas advanced by the classicists and neo-classicists are incorporated in the
conceptual model shown in figure 1. Accordingly, the main variables influencing industrial
location include: transport costs associated with the transportation of inputs and outputs; demand
variables which are associated with the market areas of industrialists; agglomeration costs; labour
costs; and, institutional costs such as insurance, taxation, interest rates, and so on. The classical
and neo-classical approaches find some expression in the location of various types of industries
both in the ‘developed’ and ‘developing’ worlds. However, such expression is limited - due to
the limitation(s)- o f the approaches and the fact that it is rare that industrialists are given a free
hand to determine the location of industry. It is general consensus, therefore, that the classical
and neo-classical theories, which oscillate around the notion o f "optimum location", are far from
being accepted as capable of guiding the location (more especially in the contemporary world),
of manufacturing industries.

FIG. I : A M O D E L I L L U S T R A T I N G T H E
A S F O R M U L A T E D B Y
M A I N V A R I A B L E S O F I N D U S T R I A L L O C A T I O N
T H E C L A S S I C I S T S A N D N E O - C L A S S I C I S T S
0 0
S ou r ce ! O b ie ro . J. C . A. ( 1980. 29 }

39
1 .6 .4 T H E O R E T IC A L F R A M E W O R K S /M O D E L S
As already noted, the classical and neo-classical theories (or approaches) of plant location
are not very significant in the contemporary world due to a number of changes that have
occurred since the theories were first formulated. Moreover, central in these theories are certain
assumptions regarding the characteristics of those responsible for the selection of the best (or
optimum) plant location. These characteristics are embraced in the concept o f "economic man"
(Chapman and Walker, 1991). Such an individual is considered rational and is in command of
perfect knowledge of all the relevant economic information including the ability to predict the
actions of competitors and future events (Bale 1981, Chapman and Walker 1991, Wegulo 1984).
However in reality, no individual can possess such "omniscient” powers. These, and other
weaknesses o f the ‘normative’ industrial location theories (or classical and neo-classical theories)
have led to the emergence of other schools of thought whose approaches "are sub-optimal” in
nature. These (schools of thought) are more realistic in that they have attempted to moderate
the superhuman attributes of the ‘economic man’ alluded to in the classical and neo-classical
theories.
Since 1950’s, writers have recognized the need to consider both demand and supply
(cost) as independent variables of location. One of the best attempts made towards this direction
is that of Greenhut (1956) who has both developed a theory and conducted empirical research.
Greenhut (1956:279-80) identifies three classes of location factors (variables). These include:
demand factors, cost factors and purely personal factors. Demand factors include those factors
that influence the character of demand, that is, not only where potential buyers are located, but
also the nature of demand for products and the way it relates to cost, the impact o f competitors

40
and the need for personal contact or particular services required by customers (Greenhut,
1956:279). Cost factors can be divided into several subgroups. The first subgroup covers the
cost of buying and running the factory itself including capital costs. The second subgroup
includes the costs of personnel, and the living and community conditions, which affect the
availability, happiness and productivity of the work force. The last two groups of cost factors
(or variables) are material costs and transport costs. Purely personal factors (variables) include
the importance of psychic income (non-monetary satisfaction), environmental preferences and
the security motive. Empirical research led by Greenhut, however, showed that location
variables did not fit conveniently into his (economic) categories (Greenhut 1956, Greenhut and
Colberg 1962).
Other emerging schools of thought (or approaches) include; the "behavioural approach";
the "spatial margins to profitability approach" and the "structural approaches."
The idea of "spatial margins to profitability" was developed by two British geographers,
E.M. Rawstron (1958) and D. M. Smith (1971, 1981). The idea arose out o f the need to refine
the concept o f optimum point location and make allowance for sub-optimal behaviour (Wegulo,
1984). The possibility of sub-optimal behaviour in the choice of factory location was seemingly
being confirmed by empirical studies of industrial location, as answers to questionnaire surveys
of industrialists stressed the importance of "personal considerations" over the more obvious
conventional variables such as proximity to raw materials and market (Chapman and Walker
1991). In some cases, a businessman or entrepreneur may feel that benefits (e.g. social
amenities) that would be gained by sub-optimal locations compensate for extra profits found at
the would be optimal location(s), in which case the location chosen will be sub-optimal in the

41
sense that it increases his general level of satisfaction without necessarily maximizing profit
(Bale, 1981:78). Such entrepreneurs are thus "satisficers" and not "optimizers".
Bale (1981:80) has listed the following as other variables which might make an
industrialist locate away from the optimum location. They include:
(i) the residence or birthplace of the founder of the industry;
(ii) the availability of a vacant factory or plot of land at the right time;
(iii) imitation or gregariousness on the part of the consumer;
(iv) parental backing o f the development o f the enterprise, and;
(v) the support of local authority or the central government.
An industry’s "spatial margins to profitability" can be defined by the total cost and total
revenue curves as illustrated in figure 2. Within the spatial margins (V0 and Vj in Figure 2), an
industrialist can make profit which may not be maximum (depending on how far he locates from
the optimum point or point of highest profit), but, which is nevertheless satisfying to him.
The "spatial margins to profitability" approach has, however, been criticized for
assuming an irrational and non-economic "entity" in location decision-making. The case for
economic decision-making is stronger now in the developed and developing worlds given the
current decline in resources. Profit maximization seems to be a major consideration still if
judgement were to be made from the ever expanding business techniques such as market research
and advertising. It has also been argued that the "spatial margins to profitability" approach
simply represents a shift of scale-replacing a point (as in Weber’s model) with an area. Within
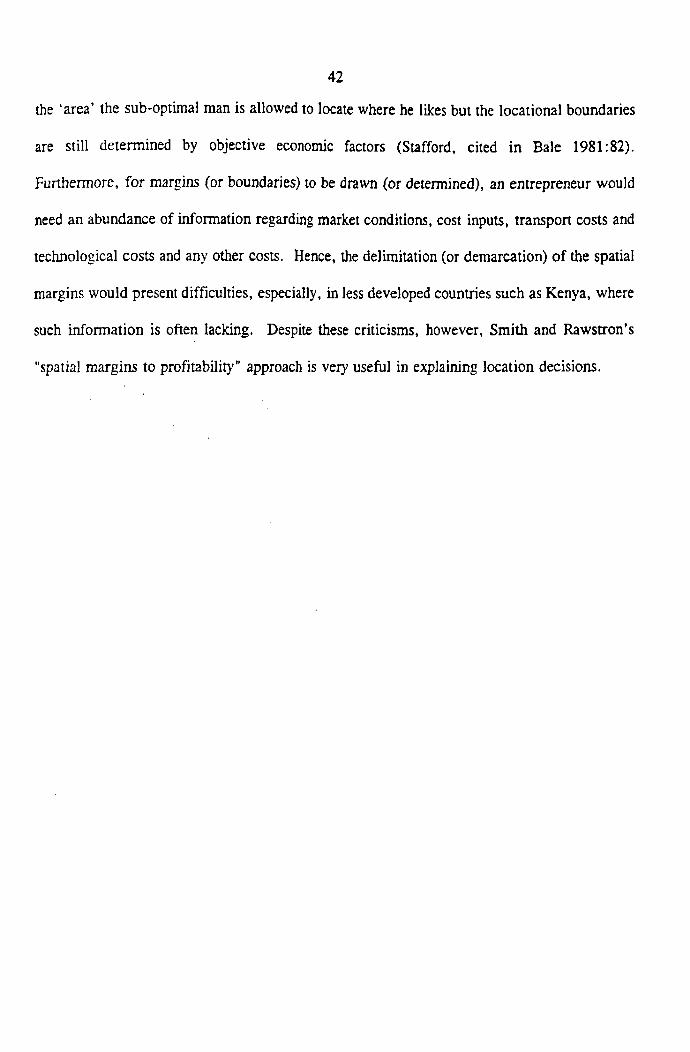
42
the ‘area1 the sub-optimal man is allowed to locate where he likes but the locational boundaries
are still determined by objective economic factors (Stafford, cited in Bale 1981:82).
Furthermore, for margins (or boundaries) to be drawn (or determined), an entrepreneur would
need an abundance of information regarding market conditions, cost inputs, transport costs and
technological costs and any other costs. Hence, the delimitation (or demarcation) of the spatial
margins would present difficulties, especially, in less developed countries such as Kenya, where
such information is often lacking. Despite these criticisms, however, Smith and Rawstron’s
"spatial margins to profitability" approach is very useful in explaining location decisions.

43
MONETARYUNITS
Location at R will maximilt revtnue of the firm.Location at C will minimize costs of the firm.Location between Vq and V| will allow the firm to moke profit.
TC C = To lo l Cost Curve
TRC - Total Revenue Curve
FIG. 2 : OPTIMUM LOCATION AND THE C O N C E P T OF SP A T IA L M ARG INS TO PROFITABI Sou rce ! D. M. Smith (1966,1971 and 1981)

44
The other approach that has gained popularity in explaining plant location decisions is
the "behavioural approach". It is actually closely related to the spatial margins to profitability
approach as it explains where, within the spatial margins, industrialists are likely to locate their
establishments depending on the information available to them and their ability to use it (Bale
1981). The "behavioural approach" derived its inspiration from the work of Simon (1957b) and
March and Simon (1958) (cited in Chapman and Walker, 1991). Simon observed, that whereas
the ‘economic man’ is an "optimizer" his real world equivalent is a "satisficer".
Pred (1967) incorporated these ideas within his concept of the "behavioural matrix",
which he applied to a variety of decision-making situations including the selection of a new
factory location. The matrix explains theoretically where within the spatial margins (assuming
these have been determined) industrialists actually locate their industries. Pred (1967, 1969)
suggests that this location (that is, within the spatial margins) will depend on two factors,
namely:
(a) the amount of information available to the industrialist (or decision-maker), and;
(b) the industrialist’s ability to utilize the information.
Thus, Pred’s behavioural matrix consists of axes which measure the quality of
information available to the industrialist (or decision-maker) and his ability to use the
information. Depending on these two factors, firms have different positions in the behaviourial
matrix. Consequently, an industrialist’s success in selecting a viable location will depend on his
position in the matrix. Those industrialists with a high level of information at their disposal and

45
with a well developed ability to use the information are likely to select well and will thus locate
towards the bottom right hand comer (see Figure 3). On the other hand, those industrialists that
have little information, and are generally incompetent and ignorant in economic terms, are
likely to locate towards the top left hand corner of the behavioural matrix (Smith 1971, Bale
1981, Chapman and Walker, 1991). Figure 3 shows Pred’s behavioural matrix. Three areas
have been identified, within which hypothetical industrial activity may be profitably undertaken.
Within each o f the three areas, an optimal location is identified. The geographical position of
a number of establishments is linked to their position in the behavioural matrix. Generally,
establishments in the bottom right o f the matrix have chosen locations near, at least, one optima.
Most of the establishments chart ierized by positions in the top left of the matrix, have selected
unprofitable locations.
Pred’s behavioural matrix has been criticized on several grounds. Smith (1971:107) has
noted that, the ability of industrialists (or firms) to choose satisfactory locations (where profit
is made) and yet these, (firms) have handicaps of information as well as ability to use it,
emphasizes the failure of the matrix position to predict how good a choice will be made. The
attribution of the satisfactory locations of such firms, to such factors as "chance" or "good luck"
(Bale 1981:84) is not satisfactory. The behavioural approach has also been criticized on account
of the fact that it overemphasizes availability of information. There are many variables involved
in location decision-making. Moreover, even if the information necessary was available, the
individual industrialists may not be able to manipulate it to the desirable ends.
To complicate the situation further, in many developing countries, Kenya included, the
industrialists or entrepreneurs are often not allowed a wide and free choice in location decisions.

46
Despite these criticisms, the behavioural approach helps in explaining location-behaviour-
influencing variables. Its applicability, however, lies in its being blended with other valid
contribution(s) by other theorists.
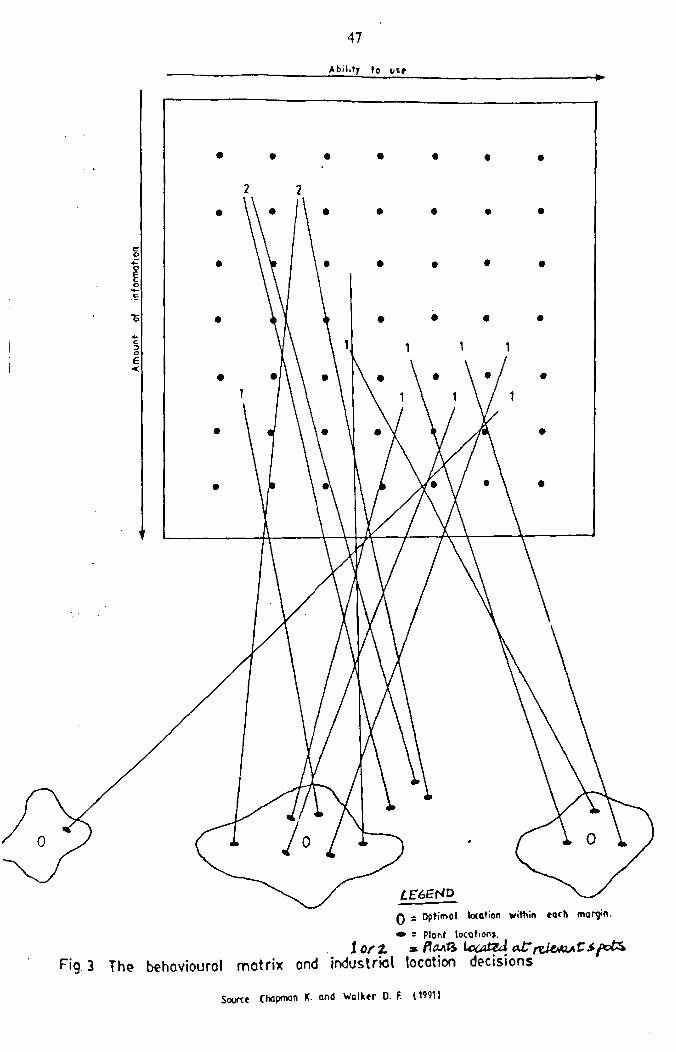
47
Abi Myf o uie
• = Plant location.io rz * cU?
Pig. 3 The behavioural matrix and industrial location decisions
Source Chapman K. and Walker D. F. (1991)
48
Another explanation that has emerged is the structural school(s) of thought. Apparently,
these consist of several rather than a single approach. The approaches’ attention focuses on how
a firm’s use o f space is determined in the wider economic and social structure(s) inside which
it operates. These schools of thought are founded on Marxist analysis because of their emphasis
on the development of "production under capitalism." The structural schools of thought provide
an important link between spatial and non-spatial behaviour by locational trends and behaviour
of individual firms to changes within the system as a whole.
Smith (1981:142) has observed that the chief merit of the Marxian (or structural)
approach(es) " is its breadth which permits industrial location to be analyzed as an integral part
of the totality of economic, social and political processes." This view has become strongly
entrenched in the analysis of international development and underdevelopment, (Chapman and
Walker 1991).
However, "applications of the structural approach(es) are less common than general
assertions of its superiority as a mode of explanation possibly due to the intellectual demands
imposed by such a holistic view of society" (Chapman and Walker 1991).
Hamilton (cited in Chorley and Haggett 1967) has incorporated many of the location
variables (of industry) that have been advanced by the various schools of thought (or approaches)
to produce a model of industrial location (see Figure 4).
Accordingly, there are three kinds of entrepreneurs that decide location in the real world,
namely: private capitalist, corporate capitalist and state administration. The model (Figure 4)
clearly distinguishes three different approaches to the location problem. Location decisions in

49
the capitalist sector are influenced by profit motives while state location choices are influenced
by less easily quantified motives such as ‘national interest(s), social cost(s) or social benefit(s)’.
Circumstances that are peculiar to each kind of entrepreneur also influence their choice
of location. For instance, the private entrepreneur is influenced by personal considerations,
which could be economic in nature (such as personal cost-reducing and personal revenue-
increasing factors) or social (such as climate, hobby possibilities, etc.) than the corporate
capitalist or state. When a firm grows under a corporation, personal factors (or considerations)
are subordinated to the interests of shareholders and the efficiency of the plant in a highly
competitive world. Location decisions are influenced by corporate interests which include the
efficient capital, technical and economic relationships of new plants to existing plants, and
division o f the market to ensure adequate supplies of products to existing or potential market
areas.
As the model shows, the state can bring its social and planning policies to bear upon
decisions in the capitalist sector of a mixed economy. At the same time, state production or
strategic needs influence location decisions.
Extraneous elements are introduced in the next stage of the model. These include,
demand (which is influenced by population size, distribution and occupation), techniques and
plant economies. These elements condition the line or range of production, establish how many
plants of optimum scale are required to serve the market, and indicate how far the production
process is technically divisible or indivisible and thus amenable to spatial dispersal or
concentration. The scale of operation chosen is an important consideration in examining the

accessibility that the various locations offer in terms of economic costs regarding supplies of
materials, labour, markets and energy, (see economic costs in Figure 4).
50

51
E N T R E P R E N E U R
P '9 .4 A BASIC MODEL OF FACTORS INFLUENCING INDUSTRIAL LOCATIONSourc e: Modified from Hamilton F .E .Is Industrial Location Model (inChorley R.J. aftd
Hoggett R£ds) |1967|/Mode(s in Geography1: Maftiuen, London )/

52
The model shows that in deciding where to locate industry, entrepreneurs take into
account the summed totals of production and transport costs of raw materials, fuel (or power)
and components, the cost of labour inputs and the cost of distributing the product(s) to the
market from alternative locations.
Hamilton’s model is comprehensive and gives a general view of location variables taken
into account by different entrepreneurs, though it (model) does not indicate the relative
importance o f each location variable.
It has already been noted that the location of economic activities, especially
manufacturing industries plays a great role in regional and national development. A number o f
models have been put forward to explain regional development. These models are based on the
works of, inter alia, Perroux (1955), Myrdal (1957), Hirschman (1958), Boudeville (1966),
Friedmann (1966) and Ogendo (1980, 1988).
Perroux’s work was centred around the concept of "growth pole" which he defined in
relation to economic space. Frangois Perroux believed that "the basic fact of spatial and
industrial development is that growth does not appear everywhere all at once but rather that it
appears in points, or development poles with variable intensities, spreading along diverse
channels and with varying terminal effects to the whole of the economy". Perroux described
economic space as comprising poles or foci, and defines poles as "centres" from which
centrifugal forces emanate and to which centripetal forces are attracted. He argued that each
centre has an attraction and repulsion and has its proper field, which is set in the field of other
centres (Perroux 1954). The forces which Perroux conceives are essentially economic and the

53
poles which generate such forces are, basically, firms or industries, or groups of firms or
industries.
Perroux was largely concerned with growth rates among sectors of the economy or, more
specifically, with firms and industries and their interrelationships. Such sectors (or firms and
industries or poles) are represented by an input-output matrix in which growth effects can be
transmitted across rows and columns. In this matrix, growth is directly related to the activity
of the poles themselves, and also the degree of inter-connection amongst them.
An important feature of Perroux’s notion of growth pole(s) is ‘dominance’ of many firms
by one firm. This is said to occur when the flow of goods and services from industry X to
industry Y is a greater proportion of X’s output than the flow from Y to X of Y ’s output. In
such a case, Y is said to be dominant, while firm X is dependent.
Another feature of the growth pole(s) concept is the emphasis placed on the size of the
pole (or firm or industry). The rate of growth or change is assumed to be directly related to the
size of the pole (or industry). The bigger it is, the larger will be its field of dominance over
other firms (or industries) which sell to it or buy from it.
Perroux’s growth pole(s) incorporates the notions of leading industries (Industrie motrice)
and propulsive firms. Accordingly, at the core of growth poles are propulsive firms which
belong to leading industries. These firms dominate other economic units. There may be just one
dominant propulsive firm, or a core of them forming an industrial complex. The salient features
of a leading industry are that it should be relatively new and dynamic with an advanced level
of technology. It should have a high income elasticity of demand for its products which are
usually sold to national markets. Moreover, it should have strong inter-industry linkages and,

54
hence, assert considerable influence in its environment. The major characteristics of propulsive
firms are that they should be relatively large; have a high integration capacity with other firms;
have a high degree of dominance; have a high ability to innovate; belong to a fast growing
industry; and they should be capable of generating significant growth impulses.
Perroux’s ideas have been criticized by a number of scholars from different viewpoints.
Darwent (cited in Friedmann and Alonso 1966), has argued that the growth poles(s) concept "has
become associated with an enormous variety of ideas and ill-defined concepts and notions".
Alonso (1964) has taken Perroux to task over his ideas on advanced technology (associated with
the leading industry) as a pre-requisite for the functioning of a growth pole. Alonso has
observed that this type of technology (as advanced by Perroux) is out of reach of the developing
countries. Furthermore such technology may be inappropriate in terms o f factor inputs, such
as a capital-intensive technology associated with possible employment reducing tendencies.
Perroux's notion of "leading industry with strong inter-industry linkages" has been
criticized. Perroux does not explain how such an industry finds location to serve as a nucleus
around which other industries cluster. This is especially so when it is considered that Perroux
concludes that "such clusters will become growth poles, if served by leading propulsive
industries which are localized to form an industrial complex large enough to exert a determining
influence over its industrial environment" (Misra et ah 1974:183). What criteria ought be
satisfied prior to the establishment of these (leading industries) type of industries? Perroux’s
model does not answer this and other questions.
Perroux has also been criticized on his focus on the economic space structural
characteristics of the growth pole and inter- relations between industries. He has excluded the

55
spatial (or geographical) dimension of development. It goes without saying that growth occurs
in geographic space and is inevitably influenced by spatial organization. Moreover, it (growth)
has an effect upon the spatial structure of the economy and hence the existence of poles (as
introduced by Perroux), though attractive, presents unsolved questions of the so-called
development poles.
Thus, a number of theorists have attempted to reorientate the scope o f the original growth
pole(s) idea to include the spatial perspective, which is lacking. Myrdal and Hirschman have
attempted to integrate a theory of "geographical incidence of growth" with a hypothesis of "the
mechanism of the geographical transmission of development impulses". Both start with the
premise that development is necessarily geographically imbalanced. For instance, Hirschman
(1958:83,84) argues that it must be taken for granted that economic progress does not appear
everywhere at the same time and that once it has appeared, powerful forces make for spatial
concentration of economic growth. Myrdal has also noted that growth is initiated in certain
places because of initial advantages they may have had.
fAijizLal observes that once growth has been initiated or once regional inequalities have
emerged because of some initial advantages some regions may have had, the interplay of market
forces tends to increase rather than decrease regional inequalities. This takes place through a
process Myrdal has called "circular and cumulative causation" (see Figure 5). According to this
process, development makes an area attractive for further development. Thus, there are growing
regions (where development has been initiated) and stagnating regions. Development impulses
are transmitted by means of ‘backwash effects’ and ‘spread effects . Backwash effects are
centripetal forces whose effects are to increase regional inequalities by enabling the growing

56
areas to exploit the stagnating areas. This is through the flow of capital, commodities and
labour to the growing regions. Keeble (cited in Chorley and Haggett, 1967:259) notes:
Since faced with the higher returns obtainable in growth areas those other regions tend to lose not only their more skilled and enterprising workers, but also much of their locally generated capital.
However, the backwash effects are not the only means of transmitting development
impulses. Also of significance are ‘certain centrifugal "spread effects" of expansionary
momentum from the centres of economic expansion (that is, growing areas) to other regions’
(Myrdal cited in Chorley and Haggett, 1967:259). The growing regions may stimulate demand
for, for example, agricultural and mineral products of other regions. This may initiate economic
growth in those areas, Myrdal has insisted that the mechanism of regional growth occurs in
such a way that centripetal forces become stronger than centrifugal spread effects. However,
if the impact o f centrifugal forces is stronger than centripetal forces, the process of cumulative
causation may well begin in the stagnating areas.

r-
F I G . 5 : I N D U S T R Y A N D R E G I O N A L D E V E L O P M E N T
Sou rce ' K t tb le , D. I - Models of Economic ~ Chorley ( R. J. ond ‘,_
M Y R D A L ’ S P R O C E S S O F C U M U L A T I V E C A U S A T I O N
;D-m*nt , in^Models in Geogrophy'C-ds) (1967)
58
Whereas, he does not subscribe to the process of circular and cumulative causation,
Hirschman has noted the role o f backwash effects (which he calls "polarization effects") in
inducing regional disparities in economic growth and "trickling down effects" (equivalent of
Myrdafs "spread effects") whereby growth is extended outwards from the core to the less
favoured regions. Hirschman argues that if an imbalance between regions resulting from the
dominance o f polarization effects develops during the early stages of growth, counter-balancing
forces will come in operation to restore the situation to an equilibrium position. Chief among
these forces is government economic policy. Their (forces) inclusions, together with the
exclusion o f any cumulative mechanism (Hirschman, 1958; 187) represents the chief structural
difference o f Hirschman’s model from that of Myrdal.
Myrdal and Hirschman are credited with having identified the basic reason(s) why
development is localized in space, and exposing the nature and mechanism through which
development impulses are propagated from a limited set of urbanized regions to the rest of the
country. However, it has been argued that the theory which Myrdal and Hirschman have
proposed is essentially non-geographical, since they hardly say anything about the geographical
location o f development centres and the geographical manifestation of the development impulses
propagated from such centres (Hermansen, 1972:44).
Due to the weakness observed in Perroux’s abstract conception of space and Hirschman’s
and Myrdal’s theories o f unbalanced growth, Boudeville has come up with a modified model that
lays emphasis on the regional character of economic space. His model centres around a ' growth
centre" in which economic and social development may be initiated and transmitted to the area
around it. This model (of growth centre) gives some clearer direction to the most important

59
‘normative questions o f regional economic development, namely, those concerned with the
regional allocation of investments in both time and space.
Boudeville maintains that economic space is "tied" to geographical space through a functional
transformation which describes the relevant properties of economic spaces (Hermansen,
1972:197).
Much of Boudeville’s work in this general direction, especially from development
viewpoint, is based on his conception of three types of (geographic regions, or) space namely:
homogeneous space, polarized space, and planning/programming space.
Boudeville’s model is thus modified from Perroux’s. In this modified model, he
(Boudeville) has changed the definition of ‘economic space’ so that it becomes the application
of economic variables in or on geographic space. In other words, the (growth) pole in Perroux’s
abstract economic space becomes an ‘urban centre’ in geographic space with its associated
periphery or hinterland. Boudeville has thus defined a growth pole as "a set of propulsive
industries (that is, large-scale industrial complexes) located in an urban area and capable of
inducing increased development throughout their zones of influence".
Boudeville is credited for his attempt to give a geographical orientation to the growth pole
theory treating poles as "geographical agglomeration of activities rather than a complex of
sectors different from the national matrix". Boudeville has also observed that "growth poles will
appear as towns possessing a complex of propulsive industries" (Boudeville, 1966:112,113).
Despite these contributions, however, Boudeville has been criticized for his inability to rid his
theory of non-spatial implications of the growth poles (Misra et al. 1974:137).

60
Friedmann has also attempted to address the problem of regional development in a
geographical framework. In a case study of Venezuelan regional development, Friedmann
(1966) used the centre (or core) periphery model in which he argued that development originates
in a number of small urban centres termed as "cores". Such cores are surrounded by areas
lagging behind in economic activity and development. Such lagging areas are known as the
‘periphery’. The process of development is said to involve the economic and social integration
of the core and the periphery. The periphery is dependent on the core and its development is
largely determined by institutions in the core.
Friedmann’s centre (or core) periphery model is of two types, namely, the ‘local case’
and the ‘international case’. In the local case, Friedmann's centre-periphery model involves a
policy of encouraging spatial integration between the core and periphery at the intra-regional
scale (namely, the level of a polarized region), while correcting the imbalance evident between
the main national core (or pole - as in the case of Nairobi in Kenya, Paris in France, etc) and
the rest of the (relevant) nation, (namely, the periphery, for example, the rest of Kenya, France
etc, as in the quoted example above).
Friedmann’s centre-periphery model can also be applied internationally, as already noted.
For instance, Myrdal (1957) and Hirschman (1958), independently introduced the idea of a
process whereby one region (or country) (called North, by Hirschman) is the growth centre (or
core)-(being more advanced and developed)- and is seen as influencing or controlling the rest
of the nation (or another country or other countries, called South by Hirschman) by the
processes o f "polarization/backwash effects" (of Hirschman and Myrdal, respectively) and
"trickling-down/spread-effects" (also of Hirschman and Myrdal, respectively). Consequently,

61
polarization effects on the South, by the North, tend to be at the South's disadvantage and are
due to the North’s stronger economic position. The polarization effects include severe
competition against the South’s relatively inefficient industries and a tendency towards selective
migration of the young, more educated and skilled people from South to the North in search
of greater opportunities and, apparently, higher salaries available in the North.
Moreover, since the North’s industrial enterprises are relatively more productive than
those of the South, whatever little capital the South has is also likely to migrate to the North,
where interest rates are higher and the security (and, perhaps currency strength) of such capital
is guaranteed. However, the "trickling down effects "/"spread effects" from the North to the
South are (i) the increased North’s purchases and investments in the South and, (ii) the
absorption, by the North, of some of the South’s under- or unemployed, thereby raising per
capita incomes in the South.
Nonetheless, it is apparent that the spread-effects are most likely to be balanced in favour
of the North (the growth centre) and against the South (the periphery), and that such an
imbalanced situation will tend to persist up to the point where, either:
(a) the lagging of the South begins to affect the North’s growth, or:
(b) the South will seek to redress/redeem the balance by political action or revolution.
John Friedmann’s model therefore borrows and expands Hirschman s notion of unbalanced
growth".

6 2
The centre (or core)-periphery muderSeems to take for granted that development will
always originate from some urban centre and should the centre be integrated (it is not stated
how) with the periphery, then innovations are likely to diffuse towards the relatively poor areas.
It may be argued that the mere presence of urban system (centre) even when it occurs in a
spatial system of other centres does not constitute a raison d'etre for development of its
hinterland (periphery) (Wegulo 1984). Not unless the activities within urban centres (eg.
manufacturing) are intimately linked to the activities of the rural (peripheral) areas. Only in this
way might it be possible to discourage parasitic relationship(s) between the core and the
periphery that are (is) likely to emerge.
This line of thought has been extensively explored by Ogendo (1988, 1989). He has
developed the centrifugal model, to reinforce the District Focus for Rural Development (DFRD)
strategy in Kenya’s regional development planning.
The District Focus strategy, was launched in July, 1983 and adopted, lor the first time,
in the 1984-1988 National Development Plan. The introduction of the strategy was due to
disabling problems that faced other approaches that had been adopted for regional development
planning of, especially, the rural areas. Such approaches included:
(a) Disaggregated style of national and/or regional development policies and plans,
largely based on models such as: Perroux’s growth pole(s) model, Boudeville s
growth centre model, and especially Friedmann’s growth centre/ centre-periphery
(local and international) model(s). The above models tended to create polarized,

63
hence, inequitable national and/or regional development. Hence, they were later
dropped by the government for other proposals such as:
(b) President Kenyatta s slogan of, ‘back to the land’ which was reinforced by a
series o f small settlement schemes in many parts of Kenya. This approach later
developed teething troubles and could not solve accumulated problems, especially
the rapidly growing population; and,
(c) Special Rural Development Programme (SRDP), which was apparently abandoned
halfway through its implementation, and;
(d) Integrated Rural Development Programme (IRDP), which never took off.
The main objectives of the District Focus strategy for rural development included:
(i) Mobilizing the domestic resources of each District for equitable development,
especially between the urban and rural areas.
(ii) Encouraging cost-sharing between the government and the local population,
(iii) Allowing for popular participation by involving local people in planning and in
the implementation of local projects,
(iv) Reducing the polarization of the space economy,
(v) Discouraging the existing adverse rural-urban migration,
(vi) Promoting rapid growth of medium-sized and small-sized towns, and,
(vii) Encouraging productive linkages between the agricultural and others sectors of
the national economy, and between the rural areas and the local service centres,
market centres, gateway towns and intermediate large urban centres.

64
The District Focus for Rural Development (DFRD) strategy aims at development from
below. The model puts great emphasis on the motivation and popular participation of the rural
population in rural development. In a nutshell, the model aims at inducing, supporting and
sustaining rural development. However, the DFRD strategy has not achieved most of its
objectives due to problems facing its implementation. These are outlined below:
(a) Conflicts arising due to lack of clear operational definition as to the role(s) and
function(s) of its various organs, for example, the District Monitoring and
Evaluation Committee(s) and the Provincial Monitoring and Evaluation
Committee(s).
(b) Problems related to information that is either inaccurate, irrelevant, untimely,
aggravated by shortness of programming time and lack of both development funds
and skilled personnel.
(c) Delays in the release of funds from the Ministries concerned.
(d) In some cases, not all the projects forwarded by the District Development
Committee(s) are approved for funding by the Ministry of Finance.
(e) Poor, or even, lack of rural population participation (in the identification,
prioritisation and the implementation of the District development projects)
remains a disturbing problem.
(0 Other problems that impede proper functioning of the District Focus strategy,
include: lack of commitment; lack of (senior) skilled personnel, low level of
integration in the decisionmaking processes; mistrust; low wages, politicised civil

65
service; genuine dearth/scarcity of known mobilizable development resources;
personalisation of the public offices; unnecessary transfers, or early retirement (s)
of experienced personnel; intensified primacy which tends to accelerate rural-
urban migration; education that orientates graduates for urban employment
opportunities; rapid population growth rate; socio-cultural drawbacks and red
tape; level and distribution of foreign investments and aid; high proportion of
young children; youth and women who are predominantly illiterate; partial
decentralisation of planning; inadequacy of data at District level; vulnerability of
projects to political issues; and, the problematic complex organisation at the
provincial and District levels.
To improve the District Focus strategy, the following should be considered:
(i) There is need for genuine and practical development from below, not
disaggregated and imposed from above. This will ensure popular participation
of the rural population, which is vital for the success of the DFRD strategy.
(ii) Districts that are specifically disadvantaged should be exposed to development
policies and plans directed at solving problems of poverty.
(iii) There is need for greater use of appropriate technology rather than borrowed
unfamiliar technology.
fiv) Objectives that are more likely to foster popular participation and which could,
finally, solve rural development problems should be encouraged.

66
(v) Deliberate policies and plans are to be adopted to facilitate comprehensive
development planning.
(vi) Rural development planners should consider, as basic, the ecological-cum-overall-
environmental conserving strategies.
Ogendo’s centrifugal model1 (Ogendo 1988,1989) has the following principal objectives;
1. Development resource bases assessment
The model aims at using a comprehensive assessment of all known development resource bases
in each District, while toning down/eliminating identified variables that are negative.
2. Industrial structural studies
The centrifugal model relies on applied industrial structural studies so as to discourage largely
parasitic type of both local and international core-periphery exploitative regional development
structure. Hence the right industrial structure requires a critical assessment of the following:
2.1 a) Formal sector industries,
b) Informal sector industries.
2.2 a) Agro-based (food and non-food) industries.
b) Non-agro-based industries.
c) Non-agro-based allied service industries.
'For a detailed study o f the model the reader should consult Ogendo (1988, 1989).

68
b) Low quality goods industries.
c) Dangerous component(s) goods and low-quality pharmaceutical and related
goods local industries.
2.11 a) Industries using local raw materials.
b) Industries using imported raw materials.
2.12 a) Capital goods industries
b) Intermediate/producer goods industries.
2.13 a) Capital-intensive industries,
b) Labour-intensive industries.
2.14 a) Public (mainly Parastatal or Government) owned
industries.
b) Privately owned local or foreign (multinational or transnational)
industries,
c) Public (non-government) cooperatively owned industries.
2.15 a)Industries capable of establishing extensive (forward or backward)
linkages.
b) Industries with little or very limited (forward and backward)
linkages.
c) Leading and/or key industries.

69
2.16 a) Primary/extractive industries.
b) Secondary/manufacturing industries.
c) Service industries: i) Standard tertiary industries
ii) Technocratic (or quanemary) industries.
3. Development-inducing and development-supporting industries
The model gives priority to development-inducing and development-supporting industries. It is
these industries which are principally capable of ploughing development finance into the rural
areas.
9
4. Location patterning of industries
The centrifugal model advocates for deliberate location patterning of (especially development-
inducing) industries such that: a) some have national activity radii such as the final stages coffee
industry centred in Nairobi, but ploughing back development funds into the rural areas (almost
nationwide); b) others have intermediate activity radii (for instance, flour milling, brewing, etc);
c) while others (such as sugarcane processing, tea processing, etc.) have short activity radii.
The diversification of activity radii ensures that the rural areas are appropriately radially catered
for in national, regional and local aspects of development.
70
5. Replanning of present urban system
The model takes the present Kenyan urban system as given but proceeds to plan for their
conversion into development centres (DCs), development points (DPs), potential development
points (PDPs) and service centres (SCs). Development points are of national and/or regional
calibre. They serve their respective macro econo-geographic regions, as well as, their micro
areal units. Development points are intermediate in size and function and mainly serve the
macro-economic regions and the local District(s) in which they are located. Potential
development points are largely local in function, although they are larger and more important
than either service centre(s) type 1 and type 2.
6. Infrastructural networks and media
The centrifugal model encourages full development of various local, regional, national and
international infrastructural networks and media.
7. Leakage of development funds
The model attempts to discourage leakages of development funds from any given District or
region by introducing semi-closed system(s). This is particularly the case with regard to the
development items most affected by such development capital leakages to other and/or
international centres of greater attraction.

71
8. Replanning of areal units
The model demarcates the supermacro and macro regional economic development areal units to
coincide with the zoned supermacro and macro geographic units, hence, forming supermacro and
macro econo-geographic regions.
51 Identification o f development aspects by which Districts have affinity
The model identifies development aspects by which Districts have affinity (in terms of physical,
environmental, economic, political, social and cultural aspects). The model also identifies the
‘development triggering District.’ This is the District likely to give a lead to other associated
District(s) somewhat lagging behind in any given macro-econo-geographic region.
KX Investment o f development capital
The model suggests short-term investment of idle development capital, in proven profitable large
economic enterprises in local, or neighbouring, or any other approved micro, macro or core
macro areal units, for a specified period of time. Profits from such investment could be used for
that District’s development either in short- or long-term planning process. 11
11. Agglomeration economies
The model takes advantage of agglomeration economies. Examples include: a) internal
economies of scale due to any large scale industry in the District; b) external economies of scale
within thriving large scale industries in the District; and c) any urbanization economies.

72
12 Cumulative Causation (model) designed to be non-polarizing as regards the selected
industries
The model advocates for designed non-polarized cumulative causation (model) type of
development-inducing industrial enterprises, with strong forward and backward linkages
especially in the agro-based industrial sector.
13 Elements o f sound industrial strategy
According to the model, elements of sound industrial strategy should include the following:
i) Industrial development must be approached actively and aggressively.
ii) Industrial development should be broadly supported countrywide and should be
turned into a virtual crusade.
iii) Industrial development approach, since it is largely experimental, should be seen
to be as free as possible from prejudices and should be reasonably flexible.
iv) The government should generate initiative and the drive to industrial
development.
v) There is need to create a favourable industrial development climate.
vi) Government bureaucratic requirements need to be streamlined.
vii) There should be justified protection of new industries; attraction of foreign
capital, and; "guarded” international open-door outlook.
viii) Training and development of personnel (both managerial and technical) should be
emphasized.

73
ix) Industrial development should be placed in proper perspective in relation to other
sectors o f the economy.
14 Procedures for depolarization o f Kenya’s polarized space economy
The centrifugal model examines Kenya’s current polarized space economy and proceeds to
suggest remedial measures.
Accordingly, the Kenyan present polarized space economy falls into various types of
polarized economic surfaces/zones (Figure 6) as follows:
1. The Nairobi core zone (1.0);
2. Active periphery (1.1 - 2.4);
3. Downward transitional zones (3.1 - 3.5); and,
4. Negative-cum-problem zones (4.3 - 4.5).
14.1 Nairobi Core Zone (1.0)
The Nairobi core zone (1.0) lacks in natural resources of its own, although it can attract these
[from its neighbouring resource frontier(s)] due to its relatively high internal efficiency. The
rone is virtually endowed with all the necessary development components such as: capital,
technology, societal or institutional innovation, all types of labour, manufacturing industries,
external economies of inter-industry linkages, urbanization economies, favourable terms of trade,
high intra-regional demand,including full national power to withdraw decision-making from any
the local/national peripheral zones. It is apparent that the core zone is congested. In order to
74
lessen this congestion and create greater efficiency in the core zone, the inflow o f development
factors/determinants, (particularly societal innovation and decision-makins) should be diverted
to other less favoured zones/surfaces, such as: upward transitional zone(s), depressed zone(s),
stagnating zone(s), and negative zone(s). Such a procedure should reduce the existing regional
inequalities, thereby facilitating the reorganization of the Nairobi core zone to eliminate
congestion and allow for greater efficiency.
14.2 Active Periphery (1,1-2.4)
The active periphery (1.1-2.4) is part of the resource frontier for the Nairobi core zone. The
active periphery consists, on the ground, of the various secondary core zones, such as, Malindi-
Kilifi-Mombasa-Ramisi secondary core zone; Kiambu-Murang’a-Nyeri-Meru secondary core
zone;Lake Basin’s Kisii-Kisumu-Kakamega-Bungoma secondary core zone; Nakuru-Njoro-
Elburgon-Molo secondary core zone, and; Eldoret-Kapsabet-Kakamega secondary core zone.
Structurally, the active periphery comprises:
1.1- 1.3: a) Upward transitional zone(s) - which are partly resource frontier, although actively
competitive in relation to the Nairobi core zone.
2 ’t-2-2.-.V)jyThe rest of the active periphery - this is largely a resource frontier for zones 1.0 and
1.1- 1.3 above. Zones 2.1-2.2 are far less competitive in relation to the Nairobi core zone as
compared to zones 1.1-1,3.
2.3-2.4 b)ii): Less active parts of the Inner Fringe Zones - although 2.3-2.4 are incorporated in
the active periphery, they do not, in practice, belong here, so that they are, for practical

75
purposes, not included in the active periphery. 2.3-2.4 zones are mainly resource frontiers for
zones 1.0, 1.1-1.3 and even zones 2. 1-2.2.
To maintain sustained development, the secondary core and related active periphery zones
should retain enough factor returns, (through wages, etc.) in order to create adequate internal
demand to provide the basis for regional service and manufacturing industries, and to mobilize
development determinants from outside. The creation of urbanization economies and their inter
industry linkages within the active periphery should facilitate comprehensive development,
especially when the natural resources complexes are utilized by the relevant processing industries
to enhance the value of such natural resources, thus availing more development funds. In
summary, the central requirements for development in the active periphery zone include:
a) Building o f an effective internal demand - in order to maintain sustained development,
the active periphery have to be able to retain enough factor returns (through wages, etc.),
in order to create adequate internal demand to provide the basis for regional service and
manufacturing industries, and to mobilize from outside.
b) The creation of urbanization economies and their inter-industry linkages within the active
periphery should effect comprehensive development, especially when the natural resource
complexes are utilized by the relevant processing industries to enhance the value of such
natural resources, thereby availing more development funds.
c) Creational of dynamic institutional/societal structures -these determine the value of the
resource frontier zone’s natural (and human) resources and such zones ability to retain
factor returns on the development of such secondary zones.

76
c) Granting o f decision-making power by the Nairobi core zone. It is apparent that the
cumulative effect is almost always favourable to the core zone, which keeps on
increasing its relative advantage until such a time as the active periphery zones are able
to exert effective pressure, (political or otherwise), for more or most decision-making
powers, thereby weakening the core zone's self-perpetuating tendencies and/or trends.
14.3 Downward Transitional Zones (3.1-3.5)
The downward transitional zones (3.1-3.5) experience an inverted economic development
situation, and seem to suffer more from backwash-effects. Thus, these zones benefit far less
from spread-effects.
The downward transitional zones constitute the Outer Fringe Zones, namely: 3.1-3,30 -
Depressed "passive" periphery "problem" zones, and; 3.31-3.5 Slowly developing or
stagnating "neutral" periphery "problem" zones. As regards the downward transitional zones,
the possible remedial measures may be outlined as follows:
i) The stimulation of internal development factors through the expansion of internal
demand (this is usually through public income transfers to the relevant zones in each
case) and through the specialization of the regional economic structure.
ii) The mobilization of the development process from inside:
(a) In theory; The depressed zones/surfaces are regarded as a closed system.
(b) In practice: However, in practice, the development process from inside is superseded
and, usually, guided by government impulses from outside such depressed regions. The

77
major factors which stimulate a depressed region’s development from outside, include:
the world s demand for various types of their resources; the depressed region’s links with
outside in terms of access to outside information, resources and markets, and; the zone’s
capacity to internalize outside developmental factors through building up of its internal
economic demand from savings derived from export-based activities. This facilitates self-
sustained development.
iii) Formation of groups within the depressed zone which (groups) have the capacity for
mobilizing and utilizing resources in the service of self-defined objectives. These groups
involve the services of regional businessmen, intellectuals and politicians. All the above
groups have to identify themselves with the depressed region's interests and should be
capable o f pressing for the zone's interest with outside decision-makers.
iv) Increasing the competitive capacity of the downward transitional zones towards the
outside by rationalizing existing production processes, or by identifying new potential
products, or high value resources (such as precious minerals, etc.). The transport and
other means o f communication should be improved in the zones to facilitate easy access
to the external market.
14,4 Negative-cum-problem Zones (4.3-4,51
The negative-cum-problem zones, like the downward transitional zones, experience an inverted
economic de situation and fall into four sub-zone areal units, namely.
4.3: Cold (Afro-Alpine - 4.3.1) semi-desert and Cold (mountain summit - 4.3.2) ice-capped
or barren (stony) desert are not, however, differentiated and are shown combined as 4.3,

78
4.4 Hot, low-lying, standard Kenyan desen (4.4), and;
4.5 Hot, low-lying, barren stony desen.
As for the negative-cum-problem zones (4.3-4.5), the future will much depend on advanced
technology, unless high-value minerals or mineral oil could be found with the zones. Such
positively substantial development resources could trigger large-scale development which could
serve as bases o f large capital investments necessary for developing these currently, otherwise,
inhospitable zones, such as parts of Turkana and Samburu found within West Pokot’s macro-
economic development planning region forming a portion of the Greater Eldoret Region.
Generally speaking, comprehensive development will require the adoption of deliberate
policies and plans. These include: (a) i) goal setting for regional development plans; ii)
objectives in the inter-regional and inter-local planning; iii) principal problems in designing
regional policies and plans; iv) Major problems in implementing regional policies and plans; b)
some basic weaknesses of regional development planning: i) regional development priorities,
and; ii) role of regional development research.

4 *ES U D A N f I

80
15 Role of the urban system in centrifugal model
The role of the urban system in the development of Kenyan Districts would appear to fall in
following functions:
a) to transmit technological and societal innovation, control and decision-making
functions from the Central Government core region, centrifugally downwards
through regional urban centres to their respective metropolitan areas or
hinterlands;
b) to transmit production factors and commodities between the regional urban
centres and their metropolitan hinterlands, as well as both the national urban and
regional hierarchies;
c) to facilitate the interaction between economic, societal and political development
determinants at both local and regional levels;
d) to interrelate development determinants from outside with those from inside the
region, at both local and regional levels;
e) to accelerate metropolitan areas development by encouraging more of the urban-
located businessmen to establish rural-linked development-inducing and/ or
development-supporting industries with the specific aim of ploughing back, into
the relevant metropolitan areas, profits, development finance, and allied
production factors, and;

81
f) to facilitate the spreading out into the rural hinterlands and beyond, those
urbanization economies which make for lower cost and higher efficiency o f the
regional activities.
The principal components of Ogendo’s centrifugal model are shown in figure 7. Ogendc
model is very useful for comprehensive equitable regional development planning.

FIGl 7 t h e c e n t r if u g a l m o d e l f o r c o m p r e h e n s i v e e q u it a b l e r e g io n a l a n d u r b a n p l a n n i n g .S o u r c e : M o d e l l e d f r o m O g e n d o ' s o n g i n o l p e r c e p t i o n ( 1968, 1989)

83
It has been established that the activities of multinational corporations {hereafter referred
to as MNCs1), play a role in regional and/or national development ( Kaplinsky 1978, Coughlin
1988, Jhingan 1989, Langdon 1975). The role of MNCs is important because in less developed
countries (LDCs), such as Kenya, direct foreign investment accounts for a substantial share of
value-added. Moreover, it (the investment) is concentrated in the leading sectors, such as the
manufacturing and agricultural sectors (Kaplinsky 1978).
In Kenya, Nairobi serves as the local and regional headquarters of a number of MNCs.
Prior to 1945, MNCs activities in Kenya were concentrated in the agricultural and trade sectors
(Swainson 1976). However, in the contemporary situation substantial changes have occurred.
There has been a shift in the orientation of foreign investment. MNCs investments are now
concentrated in the manufacturing sector, dominantly in the petroleum products, industrial
chemicals, pharmaceutical products, footwear, paints, soaps, metal products sector and solt
drinks. There is relatively little investment in primary production but a great deal relatively in
the manufacturing and service sectors.
Jhingan (1989) has noted the following as the merits of MNCs:
(i) They lead to a net increase in capital formation since they provide large and
cheap capital to LDCs by way of direct investment. *
'A multinational corporation is a company or enterprise m th its headquarters in a developed country such as the United States, Britain, West Germany, Japan, etc., and also operates in other countries, both the developed and the developing (Jhingan J989).

84
(ii) They start new ventures following which the advantages of superior management,
training, education and entrepreneurial ability are bestowed on these ventures.
(iii) They transfer superior technology to LDCs which is usually based on research
and development in the parent concerns. This leads to the discovery and
introduction of new processes and differentiated products in LDCs. These
products tend to raise the standard of living of the people.
(iv) MNCs introduce new methods of marketing in LDCs through market research in
their headquarters. They adopt new and better advertising and promotional
methods which impart information to buyers and create demand for products.
This encourages competition.
Despite these (apparent) advantages, MNCs have been accused of doing more harm than
good, especially as far as the development of LDCs is concerned.
It has been noted that there is excessive head office (headquarters of given MNC) control
over the activities of subsidiary establishments (Langdon 1975, Smith 1979, Kaplinsky 1978).
The head office controls annual budgets, capital expenditure, sources of material inputs, choice
of production techniques, marketing policies, personnel policies and the profitability targets, of
subsidiaries. This control does not, in most cases, take into account the local conditions in
which any given MNC subsidiary is operating. This leads to conflicts of interest between MNC
activities and the state (national) activities of the country where the MNC is operating.
Scholars have argued that multinationals are an extension of core-periphery relationships that
e*ist in LDCs. Such relationships are associated with the exploitation of the periphery by the

85
core. Smith (1979) notes that the control, top level management planning and decision making
in MNCs subsidiaries is exercised from the ‘home territory’ (the headquarters), which constitutes
the core. The periphery is the overseas countries where MNCs operate. Hymer (cited in Smith
1979) argues that MNCs are hierarchical in their organisation. They consist of ‘top level
hierarchy’ and ‘bottom level hierarchy’. The ‘top level hierarchy’ comprises senior management
with functions o f goal determination and planning. The ‘bottom level hierarchy’ comprises day
to day management of operations, performed by people with relatively low pay and status as
compared to top level management. Hymer’s model is illustrated in figure 8. The ‘home
territory’ is representative of North America or Europe, with a metropolis of top level control
and subsidiary centres. ‘Overseas’ represents the periphery, usually the developing countries
‘where control is exercised from the capital or major port, itself a subsidiary of the home (core)
metropolis. Figure 8 is shown below.

F I G . S T H E M N C S ' S P A T I A L C O N T R O L H I E R A R C H Y A N D P A T T E R N S O F W E L L B E I N G A S F O R M U L A T E D B Y H Y M E R
t . f V F L J D a y - ro - d a y m a r t o g # m r n f p r ^ i r l o f * i o n J<*rol < r»ri t r tr>i ( r # l c f j t O '* P o y
***•>

37
Three levels ot management are highlighted by the model. Ixvcl one consists of top
level management holding well paying and high status jobs. Level two consists of medium level
management. The employees earn medium pay and hold medium status jobs. Level three
consists of day to day management with little local control, and relatively low pay and low status
jobs. In a study of seven British MNCs in Kenya, Kaplinsky (1978) observed that parent
establishments ‘are anxious to control the generation of new technology in their subsidiaries and
that, particularly in the consumer and intermediate goods sectors, subsidiaries are dependent
upon parent companies for generation (and choice) of new technology’. Jhingan (1989) also
observes that MNCs transfer second rate and overpriced technology to LDCs. Moreover, the
technology transferred to LDCs is capital-intensive hence inappropriate to the ‘capital-scarce and
hence labour-surplus economies’.
MNCs have also been accused of accentuating regional and/or sectoral inequalities
especially in LDCs. This is because they establish their plants in big towns and cities (for
instance, Nairobi, Mombasa, Nakuru, Kisumu, etc., in Kenya) where infrastructural facilities
are well developed. Other parts of the countries involved are often neglected. Furthermore,
MNCs concentrate mainly in certain (leading) sectors of the economies of LDCs.
MNCs are associated with transfer-pricing practices. Research in parts of the world has
shown that there is a very large difference between the profits declared and the effective profits
(Robbins and Stoubaugh 1975). It has been noted that MNCs overprice their imports and

88
underprice the exports of LDCs. The effect of this is that there is little capital formation in
LDCs since net capital inflow is very small.
There is need for developing countries to control and curtail the damaging effects of
MNCs and utilize them for their maximum benefit. Some suggestions of achieving this include:
(i) LDCs should enter into ‘turnkey agreements’ whereby MNCs will undertake
projects and once these (the projects) are fully operational, they (MNCs) entrust
them to a local firm. In lieu of these services, the MNCs should be paid cither
a fixed or cost-plus fee.
(ii) Joint-venture agreements, between local firms and/or government with MNCs,
should be entered into. These agreements should be specific, for instance, to
manufacture product(s) within the country with locally available raw materials,
train and employ manpower, carry out research and development in the host
country, as well as, invest a certain percentage of profits in it.
(iii) LDCs should establish independent agencies to report on the workings and
activities o f MNCs from time to time and action should be taken, against MNCs
involved in activities regarded as offensive.
(iv) Before contracts are entered into, between states and MNCs, there should be
active bargaining, to procure agreements. Baily (1976) has noted that more often
than not Kenya does not actively bargain with foreign companies. Even where
such bargaining does take place, the criteria used by the state are often narrow
and misguided leading to sub-optimal decisions.

89
CHAPTER TWO
THE STUDY AREA
2.1 IN T R O D U C T IO N
This chapter examines various relevant aspects of Kisii District. These aspects include
the physical, economic and population characteristics of the study area. An examination of these
characteristics is important because of their influence on this study.
2.2 LOCATION AND SIZE
Kisii District is one of the Districts making up Nyanza Province. The District shares
common borders with Nyamira District to the north and east, Narok District to the south and
Homa Bay and Migori Districts to the west. Figure 9 shows the position of Kisii District in
Kenya. Figure 10 shows the divisional administrative boundaries of the study area. The study
area lies between latitude 0° 30’ and 1° south and longitude 34* 38’ and 35° east. It is the
second smallest District in Nyanza Province after Nyamira District.
Kisii District covers an area of about 1302.1 km2 and is subdivided into a number of
administrative divisions (Figure 10). Nyamarambe is the largest division occupying 208.2 km2,
followed by Masaba and Keumbu which occupy 160 km2, and 149 km2, respectively. The
smallest divisions are Sameta and Nyamache which occupy areas of 81 km2 and 78 km2,
respectively. The three largest divisions occupy an area o f about 40 per cent of the study area’s
total land area.

90
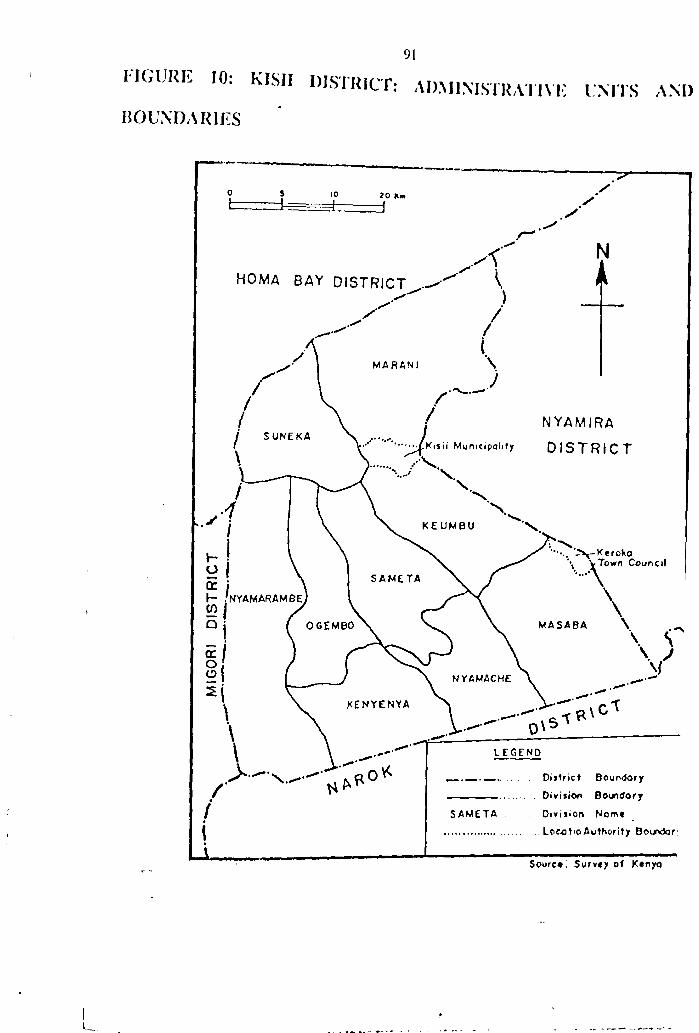
MIG
ORI
D
IST
RIC
T
FIGURE 10: KISH
BOUNDARIES
91
D IS TR IC T: administrative I M I S AND
Sourc*; Survey of Kenyo

92
2,3 S U R F A C E C O N F IG U R A T IO N IN RELA TIO N T O INDU STRIA L L O C A T IO N AND
S T R U C T U R E
A study o f surface configuration of an area (in this case, Kisii District) is of paramount
importance in the study of industrial location and structure. This is because, among other
things, surface configuration influences ecological zones and agricultural production, hence,
agro-based industrial raw materials. It also influences transport network.
Kisii District, like much of western Kenya, have been influenced by successive phases
of prolonged sub-aerial denudation and large scale tectonic disturbances. Earth movements
including uplifts, tilting, faulting and volcanicity took place in the region giving rise to an upland
environment as exemplified by Kisii Highlands.
Structurally, the study area consists of three major topographical zones. These zones are
closely related to altitude. The first topographical zone consists of areas with an altitude of less
than 1500 metres above sea level. It is found along the western boundary of the District and is
considered pan of the Lake Victoria Basin. This zone includes parts of Suneka, Marani and
Nyamarambe. The crops that can be grown in this zone are coffee, sugarcane, groundnuts,
soyabeans and bananas.
The second topographical zone consists of those areas with an altitude of between 1500
and 1800 metres above sea level. This includes parts of; River Gucha basin, western parts of
Keumbu Division, eastern Marani and Sameta. This zone is associated with the cultivation of
tea, coffee, vegetables (such as cabbages, peas, beans, spinach etc), maize and dairying.
The third topographical zone consists of areas whose height above sea level is 1800
metres and above. This zone covers parts of Eastern and southern Keumbu, Masaba and

93
southern parts o f Marani. Tea and pyrethrum are widely grown in this zone. Other crops grown
in this zone include maize, wheat (on small scale), vegetables and fruits.
The study area is mainly hilly, with steep slopes and several ridges. There are several
prominent topographical features including Mts. Nyamasibi and Sameta; Nyanchwa, Kiongongi,
Kegochi hills, and Manga Escarpment (Figure 11). This type of landscape, characterised by
steep slopes, poses challenges to agriculture and transport network. Steep slopes are unsuitable
for cultivation due to thin soils along the slopes which are deficient in nutrients. Furthermore
there is the danger of soil erosion. However, due to population pressure on the available land
in the study area, steep slopes have been brought under cultivation of maize, tea, fruits (such
as passion fruit), and vegetables. The slopes have also been an obstacle to the transport network
in the study area. Moreover, during the rainy season roads along the hilly terrain become
impassable.
Kisii District has a number of marshy areas. These are very common especially along
valley bottoms. Marshy areas reduce the total land area available for cultivation. This realization
led to the inception of the ‘Valley Bottom Drainage Project’ which is helping to reclaim the
many swamps in the study area and, hence, increase in the total land available to cultivators.

MtG
OR
l D
IS
TR
IC
T
94
I k;i KK 11: KISII DISTRICT: SURFACH CO.N'FKJURA TION
r/

95
2.4 CLIMATE (AND DRAINAGE) IN RELATION TO INDUSTRIAL LOCATION AND
STRUCTURE
Rainfall amounts, its reliability and effectiveness influence agricultural production and
the amount of water available for industry, thereby, influencing industrial location and structure.
The climate of the study area is one of the wettest in Kenya. This is because the area is
the centre ot convergence of daily convectional-cum-orographic lake winds with the 750mb
easterlies.
A combined 762mm rainfall reliability and mean annual rainfall map (Figure 12) shows
that the study area generally receives reliable rainfall. The chance of receiving 762mm of rain
in a year is good with a probability of failure of 0 to 5 per cent in almost the entire District,
except for a small portion to the western part, where probability of failure is 5 to 15 per cent
per annum.
The combined rainfall reliability and precipitation effectiveness index map'(Figure 12)
shows that, at 762mm (30 inches) rainfall reliability, Kisii District receives reliable rainfall. The
chance of receiving 762mm2 (30 inches) of rainfall in a year is good with a probability of
failure of 0 to 5 per cent throughout the study area. However, despite the uniformity of rainfall 1
1 The combination, in a single map, o f rainfall reliability isoltnes and precipitation effectiveness (or moisture) index is useful fo r planning purposes. This is due to the fact that rainfall may be reliable but not effective. Rainfall reliability does not take into account the amount o f rain water which is absorbed into the ground to be utilized by crops and hence the need to combine it with precipitation effectiveness.
'■762mm (30 inches) o f rainfall is regarded as the minimum amount o f rainfall required to facilitate the cultivation o f crops, but with particular emphasis on maize, an all-importantstaple food crop.

96
reliability throughout the study area, the precipitation effectiveness for moisture) index varies.
Thus, Kisii District fails into three moisture index categories, namely:
(i) Moisture index range from +20 to +10: This range has a drought limit designation,
moist sub-humid. Evapotranspiration values vary from 0.8Eo to 0.6Eo. The south-eastern
tip of the study area experiences this moisture index range.
(ii) Moisture index range from +10 to 0: The drought limit designation for this range is
also moist sub-humid and is demarcated by evapotranspiration ranging from 0.8Eo to
0.6En. The central, eastern and southern parts of the study area fall under the moisture
range.
(iii) Moisture index range from 0 to -10: This is classified as dry sub-humid. The area
covered include the western and northern parts of the study area and evapotranspiration
varies from 0.6E0 to 0.4Eo. Unlike the case in the first two moisture index categories,
the area covered by this category is, generally speaking, a dry zone.
The combined rainfall reliability and precipitation effectiveness index map (Figure 13)
shows that almost the entire study area has one drought designation limit, namely, moist sub-
humid, with precipitation effectiveness tending to improve towards the central, eastern and
south-eastern parts of the study area.
The type and variety of industrial crops that can be grown in the study area is likely to
vary according to precipitation effectiveness. Crops that do not require a lot of rainfall such as
cassava, millet and sorghum can be grown to the western part of the District. The central and

97
eastern parts are likely to support such crops as maize, coffee and marginal tea. The south
eastern part can support tea, coffee, pyrethrum, and fruits.
According to the mean monthly rainfall periodicity map at 50mm (Figure 14), much of
the study area is wet throughout the year (0D,3). However, a portion to the north and north-east
has one dry month (i.e. 1D,1), namely, January. Thus, crops which do not require a lot of
rainfall, for example sorghum, millet, and cassava, can be widely cultivated throughout the
District.
At 75mm level (Figure 15), the relevant parts of the study area occupy much less ground
as compared with the 50mm level. As a result, at the 75mm level, Kisii District falls into six
sections, namely: the northern, the north-eastern, the western, the central, the southern and the
south-eastern (Figure 15). To the north, the areal unit has only two dry months, (2D, 1,2,),
namely, January and February. To the north-east, the unit has only one dry month (1D,1), in
January. To the west, like the north-east unit, there is also one dry month, (ID, 1), in January,
while in the central unit, there is no dry month, (0D,3). In the southern unit, there are two
groups of dry months, namely, the first (2D, 1,7), in January and July, and the second, (1D,7),
in July. The south-eastern unit experiences two dry months, (2D,7,10), in July and October.
Each o f the above areal units can support a variety of crops, some of which are important
industrial raw materials including: maize, marginal coffee, wheat, fruits (such as bananas,
papaws, guavas, etc.), potatoes, beans, peas and vegetables.
According to the mean monthly rainfall periodicity at 100mm level (Figure 16) the study
area can be divided into five parts: the northern, the western, the central, the eastern and the
southern parts. The northern part has two dry months, (2D 1,2), in January and February and

98
hence it can support the cultivation of maize, coffee, pyrethrum and marginal tea. To the west,
there are three dry months (3D, 1,2,7), namely: January, February and July. This part is suitable
for maize and fruits. The central pan experiences two groups of dry months, the first (2D, 1,2),
in January and February, while the other, (2D 1,7) in January and July. This pan, like the
northern part, is suitable for maize, coffee, pyrethrum and marginal tea. The eastern part
experiences one dry month, (ID, 1), in January and is very suitable for maize, pyrethrum,
various fruits and marginal tea. The southern part has two categories of dry months. The first
category consists of two dry months (2D1,7), in January and July white the second category,
five dry months in January, February, July, August and October.
At the highest 150mm mean monthly level of rainfall periodicity, (Figure 17), there are
six groups of areal units. Some of them are more complex than others. The simpler units are
the northern, the southern, the south-eastern and the north-eastern units. The more complex units
are the western unit, (partitioned into nine sub-units) and the central unit (partitioned into twenty
sub-units). The northern unit experiences three groups of dry months. The first group,
(9W,4,5,9), has nine dry months with wet months in April, May, and September; the second
group, (8W ,3-5,9), consists of eight dry months with wet months in March, April, May and
September, while the last group, (7W ,3-5,9,11), experiences seven dry months with wet months
in March, April, May, September and November. The western areal unit is complex and can
be partitioned into nine sub-units, as outlined below:
(0 8W ,3-5,8 - Eight dry months, with wet months from March to May and in August.

99
<ii) 7W,3-5,8,9 - Seven dry months, with wet months from March to May , August and
September.
(iii) 60 ,1 ,2 ,6 ,7 ,10 ,12 - Six dry months in January, February, June, July, October and
December.
(iv) 8VV,4,5,9,11 - Eight dry months with wet months in April, May, September and
November.
(v) 8W .3-5,11 - Eight dry months with wet months from March to May and in November.
(vi) 7W, 3-5 ,8,11 - Seven dry months with wet months from March to May and in August and
November.
(vii) 9W ,4,5,11 - Nine dry months with wet months in April, May and November.
(viii) 7W,4,5 ,9 ,11,12 - Seven dry months with wet months in April, May, September,
November and December.
(ix) 6D, 1,2 ,6-8,10 - Six dry months in January, February, from June to August and October.
The southern unit experiences four groups of dry months. The first group, (9W,4,5,12),
consists of nine dry months with wet months in April, May and December. The second group,
(8W,4,5,11,12), has eight dry months with wet months falling in April, May, November and
December, while the third group, (9W,4-6), is composed of nine dry months with wet months
from April to June. The last group, (10W,4,5), consists of ten dry months with wet months in
April and May. The south-eastern areal unit experiences nine dry months, (9W.3-5). with wet
months from March to May. The north-eastern unit has six dry months, (6D, 1,2,7,10-12), with

100
wet months in January, February, July and from October to December. The central unit is the
most complex and is partioned into twenty units, outlined as follows:
(i) 60 ,1 ,2 ,7 ,8 ,10 ,12 - six dry months in January, February, July, August, October and
December.
(ii) 5D, 1,2 ,7 ,8 ,10 - five dry months in January, February, July, August and October.
(iii) 6D, 1-3,7,8,10 - six dry months from January to March, July, August and October.
(iv) 6D, 1,2,7,8,10,11 - Six dry months from January, February, July, August, October and
November.
(v) 8W ,4-6,12 - Eight dry months with wet months from April to June and in December.
(vi) 40 ,1 ,2 ,7 ,11 - Four dry months in January, February, July and November.
(vii) 4 0 ,1 ,2 ,7 ,1 0 - Four dry months in January, February, July and October.
(viii) 3D, 1,2,7 - Three dry months in January, February and July.
(ix) 50 ,1 ,2 ,7 ,10 ,12 - Five dry months in January, February, July, October and December.
(x) 8W ,3-5,9 - Eight dry months with wet months from March to May and in September.
(xi) 8W,3-6 - Eight dry months with wet months from March to June.
(xii) 6D, 1,2,6,7,11,12 - Six dry months in January, February, June, July, November and
December.
(xiii) 7W .3-5,8,9 - Seven dry months from March to May and in August and September.
(xiv) 5D, 1,2,7,11,12 - Five dry months in January, February, July, November and December.
(xv) 7W ,3-6,9 - Seven dry months from March to June and in September.
(xvi) 7W,3-5 ,9,11 - Seven dry months from March to May and in September and November.

101
(xvii) 6D, 1,2,7 ,8,10,12 - Six dry months in January, February, July, August, October and
December.
(xviii) 5D, 1,2,7,10,12 - Five dry months in January, February, July, October and December.
(xix) 4D, 1,2,7 ,12 - Four dry months in January, February, July, December.
(xx) 5D, 1,2,6,7,12 - Five dry months in January, February, June, July and December.
Since all these areas are at the highest mean monthly level of rainfall periodicity, each
of the above areal units can support a variety of crops, some of which are important industrial
raw materials including: tea, coffee, pyrethmm, maize, wheat, fruitsfsuch as bananas, papaws,
guavas, etc.), potatoes, beans, peas and vegetables.

HGL’RK ,2: K,SI1 ,)ISTWCI': COMBINED 762M.M RAINFALL
RLLIAHILITV AND m e a n a n n u a l r a in f a l l
POOR
Z . R
ui (g irp"sj
3 -«a
'3 * ao
Ii
Ni
,f*rrT*ri*x** efeftto’irt...........
^ r o w :k i ................
8o^>0oort.................... ...
i - ~ J = to tf 20 25
0V- 5—t IO- - -i. iT-jj—
g . . & ' : C P M A'£ CcL
$ a j £ c e ;

IKJIKi: 13: KISII DISTRICT: CO.MBINKI) 762.M.M RAINFALL
RKLIAHILITY
L_E_G_E_N_DPR ECIPITATIOH EFFECT I V_ENESS INDEX
1.5 Moist Sub-Humid (+20 to +10)8E
1.2 Moist Sub-Humid (+10 to 0)2.1 Dry Sub-Humid (0 to -10) 1
2.2 Dry Sub-Humid (-10 to -20) J
3.1 Semi-Arid (-20 to -30) 0.4E
0.6E
International Boundarie
Provincial Boundaries.
District Boundaries. . .
to 15
KILOMETRE
10
MILES
L E G E N D
762 RMNPALT, RELIABILIT
Chance of receiving les than 762mm, of rain in year .
GOOD..................FAIR....................POOR..................
bOOKCE'. &■£>■ Cf

10,1
FIGURE 14: KIS11 DISTRICT: MEAN MONTHLY ,r
PERIODICITY AT 5 0 M M ______________________ L
L E G E I N DI
At the 50mm level the letter D and figure symbols below ore interpreted os follows
0D,3 Wet all year
10,7 . .One dry month (in July)
20,1,2 Two dry months (in January and, February).
30 ,6 *8 Three dry months (from June to jftggust).
40,1,7*9 Four dry months (in January and from July to September)
o d ; 3


i *-> D
FIGURE 16: KISH DISTRICT: MEAN MONTHLY RAINFALL
PERIODICITY AT 100MM
2 0 , 1 , 2
!. T ^ £ ft r
— J h - ;O Q m m [ o v p( i h o i « t t p r r n w , n ,i■---------- ■—---------— - ° r>r> n n r j i j r * ; | p - *
I D . I O n n fj r v m o n t h f n
( 3 0 , 1 , 7 , 1 2 Thr“e ^ m n n t h r * ^ J n n , j 0 r v> J „ | v f ln.
6 0 . 1 , 2 , 6 - 9 3 l * d r y m r l h t f m . n n . ^ v , f n r P, - y c n . , 1*
7W , 3 - 5 , 8 . 9 S e v ^ n d r y r n n n ' h s U i M . Wo- m n n ' h - . ( r , ^ . m v „ , , , ,
9 W , 3 - 5 N i n e d r y m o n » h - , f w .f h m n M | r , f r e r f , * , ............. , , , ^
I OW, 4 Ton ^ r V { * , 1 h wn* r - ^ n U I r ,
i* 4 1 e '*i [ r <
■\-r^ ‘
NA
International Boundaries
Provincial Boundaries
District Boundones.
c IDi c.
f—- - -L~ —
: 0 6 £*!Z>0 , /! & C cc~~-tc< ^> Q ..

108
Due to its high altitude, the study area does not experience excessive temperatures despite
its proximity to the equator. The mean annual minimum temperature ranges from 14 °C to 18°C
to the north while in the rest of the two Districts temperatures range from 10°C to 20°C. Mean
maximum temperatures range from 26*C to 30°C in the North and 22’C to 26°C in the rest of
the area of study. Thus crops which do not require excessive temperatures such as coffee, tea,
pyrethrum, bananas and others can be easily cultivated in the study area.
As far as drainage is concerned, the study area has no natural or artificial lakes.
However, it has a number of permanent rivers and intermittent streams. The main river is River
Gucha which rises from Mt. Kiabonyoru in Nyamira District, The river has
adequate water for the development of a small hydro-electric station to supply electricity to
industries in the study area. Another prominent river in Kisii District is Riana. Other rivers
include: Mogusii, Iyabe and Mogonga, These rivers are supplemented by other water sources
in the study area including springs, streams, boreholes and roof catchments.
Thus, the study area is well endowed with water supply which supports agricultural
production and hence industrial raw materials. Moreover, there is plenty of water for industrial
use- Temperatures are also not excessively high and this has further encouraged agricultural
production.

109
2.5 TH E G E O L O G IC A L B A SE AN D RELATED SO IL S FROM T H E V IE W P O IN T O F
IN D U ST R IA L L O C A T IO N
The u n d erly in g rock structure is an important variable in the location o f som e industries.
Furthermore, th e ro ck structure influences the characteristics o f soils form ed and, hence,
resultant agricultural production, and industrial raw materials.
The geological structure of Kisii District consists of Bukoban, Nyanzian and Kavirondian
rock systems, The dominant system is the Bukoban system represented in the study area by the
Kisii series. They are estimated to be 670 million years old. The Kisii series were formed
during the Precambrian era but are much younger than the Nyanzian and Kavirondian systems.
The Nyanzian system consists of rocks of great thickness of various types of ancient volcanic
materials associated with some pyroclastic rocks and lenses of conglomerate. The Kavirondian
system consists of alternating bands of grit, sandstones, mudstones and conglomerates especially
along the banks of rivers.
The geological structure of the study area has influenced soil characteristics. These (soil
characteristics), in turn, have influenced agricultural production and, hence, industrial raw
materials. The dominant soil type in the District is nitosols. These soils are well drained, deep
and with thick humic topsoil. The soils are associated with the Kisii series rock type. They
(soils) support a wide variety of crops which are important industrial raw materials, namely, tea,
coffee, pyrethrum and others, such as; bananas, groundnuts, beans, maize, Irish and sweet
Potatoes. Nitosols are thus dominant in those agro-ecological zones such as; coffee-tea zone,
^ tea-dairy zone and the wheat-maize-pyrethrum zone. Other soil types m the study area
delude phaeozems, ferralsols, acrisols, and vertisols. Phaeozems are clays that are in some

n oplaces poorly o r excessively d rained . In places where phaeozems are well drained , they support
a number o f industria l raw m aterials for example, tea, sugarcane and coffee. O ther soils such
as ferralsols and acrisois a re not fertile , while vertisols are poorly drained and cannot therefore
support agriculture.
2.6 A G R IC U L T U R A L B A SE S F O R INDUSTRIAL L O C A T IO N AND S T R U C T U R E .
Kisii District can be divided into three main ecological zones1 comprising upper midland
(UM) which covers 75 per cent, lower highland (LH) covering 20 per cent, and; lower midland
(LM) covering 5 per cent (Figure 18), These zones support various agricultural activities, hence
influencing the industrial raw materials available in different parts of the study area. The
industrial raw materials constitute the agricultural bases for industrial location and structure.
There are two lower highland zones, each with distinct characteristics. The first zone (LH1) is
most suitable for growing tea and for dairy farming. Hence, it is known as the tea-dairy zone.
This zone is moderately cool and humid with good climatic conditions for pastures. The
temperatures are suitable for high quality tea but too cold for other crops such as pyrethrum.
The zone has an altitude ranging from 1890 m to 2180 m. The soils found in this zone consist
of nitosois and phaeozems. The zone receives a mean annual rainfall ranging from 1400 mm
to 2100 mm. It covers Masaba division. The second lower highland zone (LH2) is a wheat-
rcaize- pyrethrum zone. Climatic conditions in this zone are good for pyrethrum and wheat
(especially late maturing wheat like Kenya Bongo); and fair for maize. The soils found in this
tyro-ecological zones are zones o f potential land-use delimited on the basis o f natural (or ewironmental) factors

I l l
zone are nitosols and phaeozems and the altitude of the zone ranges from 1675 m to 2180 m.
The zone covers parts of Keumbu and Masaba Divisions. Mean annual rainfall in the zone
ranges between 1300 mm to 1600 mm. Upper midland zone (UMl) which is the largest agro-
ecological zone in the study area, is most suitable for the cultivation of tea and coffee. Climatic
conditions in this zone are temperate and humid and can support arabica coffee and tea. Mean
annual rainfall ranges from 1400 mm to 2100 mm. Annual mean temperatures range from 13°C
to 21 °C. This zone is found within altitudes 1420 m to 2060 m and covers the divisions of
Suneka, Marani, Ogembo, Kenyenya, Sameta, Nyamache, Nyamarambe and Keumbu. The soils
found in this zone include nitosols, phaeozems, feralsols, luvisols and camposals. Other crops
that can be grown in this zone include fruits such as guavas, papaws and vegetables. The lower
midland zones (LM1 and LM2) cover the smallest area in the District. The first zone (LM1)
is most suitable for the cultivation of sugarcane. However, the yield is low and this zone is best
developed in Homa Bay District. The second zone (LM2) is suitable for maize, coffee and
marginal sugarcane. The zone receives rainfall ranging from 1400 mm to 1600 mm. Mean
annual temperatures range between 20.5°C and 21.0°C. Other crops that can be grown in this
zone include groundnuts and soyabeans. The lower midland zones cover parts of Suneka, and
Nyamarambe Divisions.
Dairying is carried out mainly in the second lower highland (LH2) zone where various
breeds of cattle are kept, both local and exotic. Crossbreeds are also common. Other animals
kePt in the study area include sheep, goats and poultry. However, it should be noted that in the
study area, livestock fanning is mainly undertaken on a small scale and, hence, cannot support
aSro-based processing industry.

112
There are no gazetted forests in Kisii District. However, efforts of church organizations,
government and non-governmental organisations efforts have encouraged the afforestation of
numerous hilltops and swamps. The efforts of these organizations have resulted in the
afforestation of 103 ha. and 32 ha, of Nyangwata and Kiabigori hilltops, respectively. A total
of 18.5 ha. of swamp in Keumbu have also been afforested. Due to high rainfall, tree survival
rate is very high. Despite this, much of the timber consumed in the District is imported from
other Districts.
i

. L i . ' l S K I S H D I S T R I C T : A G R O - E C O L O G I C A L Z O N E S
/
/rs

114
2.7 P O P U L A T IO N C H A R A C T E R IS T IC S
In 1979, the former Kisii District had a population of 568,556 people. The population
had been projected to increase to 1,137,054 in 1989 (Kenya, Republic of, 1989). This represents
an increase of almost 100 per cent. Actual population figures for the study are not available,
however.
Nevertheless, the study area’s population structure is made up of mainly young people.
The population proportion of children aged between 0-14 years is approximately 54 per cent of
the total population. The observed high population growth is accounted for by high fertility
levels. The average number of children per family ranges between 4-6 children. Ominde (1975)
has noted that the study area lies within the high fertility belt. Maximum fertility occurs
between cohorts 15-34 years, which account for 73-77 per cent of total fertility levels (District
Socio-cultural Profiles Report, 1984). Table 2.1 below shows population projections of selected
age-groups between 1979 and 1996.
TABLE 2.1: POPULATION PROJECTIONS OF SELECTED AGE- GROUPS 1979-1996
AGE - 1979 1993 1994 1996
6-13 (PRIMARY) 13800 227,614 235,808 253,092
>‘•-17 (SECONDARY) 36,388 59,702 61,851 66,385
'3-39 (LABOUR FORCE) 245,048 402,057 416,530 447,060
60 + 13,077 21,455 22,223 23,857
15-49 (FEMALES) 119,441 195,971 203,026 217,909
Source: District Development Plan, 1994 - 1996

115
From the foregoing remarks, it will be noted that the study area has a high population
growth rate and therefore more than enough labour for her industries. However, the rapidly
growing population is a major constraint on the resources and the economic productivity of the
entire District and will continue to do so unless sources of gainful employment arc increased to
absorb the increasing number of youths or until effective family planning strategies are put in
place.
2.8 INFRASTRUCTURAL BASES FOR INDUSTRIAL LOCATION AND STRUCTURE
Infrastructure plays a big role in influencing industrial location and structure. For
instance, the road network of a region influences the region’s industries’ access to both raw
materials and markets, and power line distribution influences the amount of electricity supplied
to the region and the specific areas it is supplied to in the region.
2.8,1 STANDARD INFRASTRUCTURE
The District has a road network of 1,079.9 kilometres of classified roads and 435
kilometres of rural access roads, About 103.1 kilometres are tarmacked, 411.9 kilometres
gravelled while 565,8 kilometres are earth roads, (District Development Plan, 1994-96).
An international trunk road passes through the study area, thereby benefiting Marani,
Suneka and Nyamarambe Divisions, besides Kisii Municipality. There are several national trunk
roads, primary roads and other roads within at least each division of the study area (Figure 19).
116
The utilization of roads is very intensive, because they serve high agricultural po
areas (to procure industrial raw materials) as well as urban centres (markets) of the study
Though roads are fairly well distributed, poor maintenance and hilly terrain of the District
them impassable during the rainy seasons. The tarmacked road network passes through
urban centres, Figure 19 shows road classification in Kisii District.

i y o o t w
111
19: KISII DISTRICT: ROAD CLASSIFICATION NETWORK
Adopted from District Development Plan ll99h — 19963

118
The rural electrification programme has been implemented in the study area. Almost all
divisions have a power line. However, even the divisions with power lines have only been
covered to a small extent. The industrial development potential of the study area has thus not
been fully mobilized. Tea growing areas have electricity for processing tea in the factories. In
areas served, the utilization rates are very high and the demand for the services is high.
However there are a number of market centres and numerous coffee factories that badly need
electricity but are yet to receive it. Major urban areas such as Kisii Municipality which are well
supplied with electricity have attracted more industries than areas with little or no electricity
supply. The slow pace of electrification has been blamed on the high cost of electrical
installations like transformers. However, plans are underway to supply electricity to all factories
and mills that require it (District Development Plan, 1994-1996). Figure 20 shows the study
area’s power line distribution.

119
fl(;i RE20: KISII DISTRICT: POWERLINE DISTRIBUTION
Source: KUM Distr ict Development pion, 1994-96

1 2 0
2.8.2 HUMAN INFRASTRUCTURE
Kisii District has some of the highest population growth rates and densities in Kenya.
Over 50 per cent of the total population is composed of children and young people (District
Development Plan, 1994-1996). For 1994, it was projected that the population of Kisii District
would be 966,428 rising to 1,037,263 by 1996. Out of this total population, the age group
comprising the labour force would be 416,530 in 1994 rising to 447,060 people by 1996. Thus
the study area can boast of a high potential in industrial (although largely unskilled) manpower
during the present and coming years.
However, a significant number of this labour force is employed in the agricultural
sector(s) which can no longer support them, due to decline in land size as a result of population
increase. Furthermore, much of the labour force lacks skills essential for employment in
industry. This is associated with low education levels in the study area. However, more and
more people are recognizing the significance of education and job skills. It is projected that by
1996, there will be 253,092 primary school-going children and 66,385 secondary school-going
children (District Development Plan, 1994-96). There is need for increasing gainful employment
sources so as to absorb the increasing labour force.
r ti

121
CHAPTER THREE
METHODOLOGY
3.1 IN T R O D U C T IO N
This ch ap te r deals w ith this study s methodology. Various methodological aspects are
examined, nam ely : experim ental design, data requirements for the study, and data collection and
analysis techniques.
Research methodology is veiy essential in any research undertaking because it answers
the fundamental question, "how does one conduct the research?". As Prewitt (1974) noted,
methodology helps the researcher to avoid self deception.
3.2 EXPERIMENTAL DESIGN
3.2.1 UNIVERSE
The universe can be defined as the aggregate of all individual objects related to a given
problem (Gregory 1978). Thus/ a universe of all industries in a given place would consist of all
die industries that exist or have existed in that place. For the purpose of this study, the universe
consisted of all manufacturing and allied service industries in Kisii District totalling 280 at the
time the research was undertaken (1994).
'This figure is based on records provided by the District Trade Office

122
3,2.2 SAMPLE FRAME
A sample frame is an important part of the universe called the working population* 1. A
sample frame or working population contains the ideal representative sample of all types of
individuals of the population (i.e. there is nothing else in the universe which is not represented
in the working population or sample frame but the sample frame is always much smaller than
the universe). A list of agricultural manufacturing industries in the study area was obtained from
the District Trade Office, which is charged with the responsibility of licensing trade activities
in the District, including industries. This constituted the sample frame and consisted of 2002
establishments. The utilization of a sample as opposed to a study of all manufacturing industries
in Kisii District was necessitated by the insufficiency of financial resources and the time at the
disposal of the researcher. Furthermore it has been noted that sample coverage often permits
a higher level of accuracy as opposed to full enumeration (Moser and Kalton 1971) although this
depends on the sophistication of the analytical tools.
3.2.3 SAMPLING PROCEDURE
To facilitate the selection of a sample from the sample frame one of the basic principles
of experimental design was utilized, namely, the principle of randomization. It has been argued
diat randomizing helps to ‘average out’ the effects of extraneous factors that may be present in
to sample frame (Hosking and Clark 1986).. To obtain a sample of the industries from all the
'A working population has been defined as a complete set of counts or measurements fom all objects possessing one or common characteristics (Hammond and McCullagh 1978)
lThis figure is based on records provided by the District Trade Office

123
divisions including Kisii Municipality and Keroka Town Council, stratified random sampling
procedure was utilized. The industries were stratified as agro-based food processing industries
and agro-based non-food manufacturing industries as well as according to the administrative units
in which they were located. Each of the industries was allotted a number. Using a table of
random numbers (Appendix 5) a sample of 65 industries was selected (Appendix 3). This sample
size was deemed adequate given the limitations of financial resources and time. Moreover, it
accounted for over 30% of the population of industries. A pilot survey was carried out to
determine the existence and actual location of the establishments to be visited. Afterwards, the
researcher and his assistants visited the various industrial establishments to administer recording
schedules and conduct interviews.
3. 2.4DATA REQUIREMENTS
Data is very essential for any research undertaking. This is because any conclusions
arrived at, at the end of the research, will depend on the analysis of data collected in the initial
stages. Therefore, the availability and quality of data play an important role in research. There
are two types o f data, namely: primary data and secondary data. Primary data is usually
collected from the field by the researcher himself, and hence it is known as raw data. Secondary
data on the other hand, is collected from published and unpublished sources. Such data is,
therefore, derived from other peoples’ effort(s) at an earlier date.
To m eet the objectives set o u t for this study, it (study) has relied on both prim ary and
secondary da ta . T he data collected for this study includes the following:

124
(i) Data on spatial industrial patterns of Kisii District agricultural manufacturing
industries. The number of operatives employed in the relevant industries in each
division o f the study area was determined.
(ii) Data on the en ab les influencing industrial location within Kisii District.
(iii) Data on the structure of agricultural manufacturing industries in Kisii District.
3.2. 5METHODS OF DATA COLLECTION
To obtain the relevant data, both primary and secondary data sources were used.
3.2. 6 PRIMARY DATA SOURCES
Primary data was obtained from the field. To obtain the data from the field, recording
schedules (Appendix 1 and 2) were utilized and interviews conducted. Recording schedules were
administered on industrialists (or their assistants) by the researcher with the help o f research
assistants. The rationale behind the use of recording schedules is that they facilitate personal
contact with the interviewee, and hence better communication and probing ot issues likely to
cause confusion. Moreover, they can facilitate better answers especially if the interviewer can
create afl "atmosphere of ease" (i.e., allay fears of the respondent). Furthermore, recording
schedules can, to a large extent, eliminate the problem of low response rate which is
characteristic o f postal questionnaires.
As already noted, personal interviews was another method of data collection from the
f«M. The interviews were conducted in order to elaborate and expound on the relevant issues
which the recording schedule did not handle. Interviews were conducted with various

125
personalities although restricted to individuals whom it was thought had certain special
information. Among those interviewed included: District Industrial Development Officer,
District Trade Officer, officials of the Kenya Industrial Estates, planning officers and
industrialists. These interviews took the form of discussion of topics relevant to industrial
development in general and agricultural manufacturing industries in particular. Mo recording
schedules were used during such interview sessions although short notes were taken whenever
it was considered appropriate. The chief advantage of this technique was that respondents had
the freedom to volunteer information that may have inadvertedly been ignored by the researcher
so long as care was taken to keep the discussion within relevant grounds. However, information
acquired from this source had to be treated with caution given the fact that it tended to reflect
individual biases as defined by the respondent’s official position.
3.2.7 SECONDARY DATA SOURCES
For purposes of this study, the relevant secondary data sources included:
(1) ‘Industrial census’ - This is published annually and provides information relating to,
among other things, the number of operatives employed in manufacturing establishments,
each with at least five or more operatives.
0 ‘D ire c to ry o f industries’ - This data source gives information on employment, it
also gives names of establishments, when they were established, their postal and
locational contacts and the type of commodities produced by the establishments.

126
W ‘Statistical abstract’ - This is published annually and contains information on nearly all
aspects of the economy. It is anticipated that the current statistical abstract will provide
information for this study.
(4) ‘Development Plans - National development plans and District development plans
provide useful information related to planning aspects during the period covered by the
plans.
(5) ‘Other sources’ - These include economic surveys, District socio-cultural profiles repons
and any other appropriate sources such as annual reports and statements of accounts of
companies.
3.2J3 DATA ANALYSIS
To analyze the data obtained from the field, several statistical analytical tools have been
used. At the initial stages data was summarised into tables, which proved useful in preliminary
investigations and conclusions, as well as forming a basis for statistical analyses of the relevant
aspects of agro-based manufacturing industries in Kisii District. This study has utilized both
descriptive and inferential statistical analytical tools in data analysis.
Among the descriptive statistical tools utilized include: means, frequencies, percentages
and correlations. The justification for the utilization of descriptive statistics can be summarised
as follows:
they facilitate easy assimilation of data;

127
lb) they help in comparison between different sets of raw data; and,
(c) they assist ^ researcher irt the presentation of data in a summarised form and
hence such data can be easily communicated to other people.
The chi-square non-parametric test and factor analysis are the inferential statistical
analytical tools that have been used. Inferential statistics provide a means of measuring the
uncertainty associated with sampling from populations and a precise measure of confidence that
can be placed on the results based on representative samples (Mathews, 1981).
The industrial location analysis tools used include, the coefficient of localisation and the
location quotient.
3.2.3.1 ANALYSIS OF DATA RELATING TO INDUSTRIAL SPATIAL PATTERNS
In analyzing the spatial patterns of Kisii District agricultural manufacturing industries,
the techniques of coefficient of localisation and location quotient have been used. The
coefficient of localisation measures the degree of localisation/conccntration of a given industry
or other economic activity(ies) distributed over a set of areal units/regions. The criteria used
for measurement include: population, land area, manufacturing employment, or income (Isard
I960), in this study, the criterion used is manufacturing employment.
The values of the coefficient range between 0 and 1. The value 0 indicates even
distribution of the given industry in the areal units/regions considered. A value such as 1 (or
close to 1) indicates concentration of industry in a given area! unit. The coefficient has certain
limitations. These include:

128
(i) On its own, the coefficient of localisation is a rather crude index. Hence, it has
little value unless combined with other techniques.
(ii) The index can only be computed in terms of its two extreme values.
However, the coefficient is a useful preliminary technique for regional comparison of
economic activities and for showing change in the distribution of criteria (for instance,
employment), over a period of time. The formula for computing the coefficient of localisation
is given below
XL = — where L = coefficient of localisation
100 X = Regional percentagedifferences of employment
The technique of location quotient seeks to identify "spatial agglomeration" or localization
of industries (Bale 1981:126 ). The location quotient indicates the degree to which a region’s
industries are in balance, or otherwise.
In this study, the number of operatives employed in each category of agricultural
manufacturing industries (namely, agricultural food and non-food industries) in each division of
study area and Kisii Municipality has been determined. The location quotient for each
Austria! group (namely, agricultural food manufacturing and agricultural non-food
manufacturing) has been computed using the formula below.

129
LQ = -----Md / Mn
Where
LQ — Location quotient of agricultural manufacturing industries in any given division
or Kisii Municipality
SD " Nurnber of employees in each category of agricultural manufacturing in any
given division or Kisii Municipality
SN = Total number of agricultural manufacturing employees in Kisii District
Md = Divisional total manufacturing employees
Mn = Total manufacturing employees in Kisii District
A location quotient of more than 1.0 means that the respective division or Kisii
Municipality has more than its fair share of industries ( that is, there is localization). A location
quotient of less than 1.0 means that the division (or Kisii Municipality has less than its fair share
of industry )
The location quotient is a useful technique that is widely applied because of its simplicity
and the fact that it can be based on readily available data.
However the technique has its own limitations, namely: its simplicity and the fact that
does not give much information beyond the fact that a region has more or less than its
proportional" share of industries.

130
3.2.3. ANALYSIS OF DATA RELATING TO INDUSTRIAL LOCATION VARIABLES
Most o f the variables known to influence the location of agro-bascd industries were
initially identified (before the field research was undertaken). Sixteen major variables were
isolated and included:
V01 Local availability of raw materials
V02 Availability of local capital for investment
V03 Proximity to other local establishments
V04 Presence of urban economies
VOS Availability of local market
V06 Transport costs
V07 Nearness to home
V08 Access to power supply
V09 Suitable underlying rock structure
V10 Suitable surface configuration
V I 1 Availability of cheap land for expansion
V12 Influence of government
V13 Influence of local politics
V14 Adequate water supply
V15 Labour supply
V16 Influence of personal considerations
*

131
Industrialists and/or their assistants were asked to rank these variables in order of
importance, using a scale ranging from 1 to 10 (Appendix 1).
Using a computer package, SPSS (Statistical Package for Social Scientists) Held results
were analyzed to derive means, percentages, frequencies and correlations. Some of the results
are shown in appendix 7. Further detailed analysis of the Field results was undertaken using the
factor analysis procedure.
Factor analysis is a data analytical tool originally used by psychologists (Taylor 1977).
It has been used in a number of research strategies to:
(1) Evaluate/test hypotheses deduced from theory;
(2) Transform a set of variables into a new set or orthogonal
factors for input into a regression model;
(3) Explore the underlying structure of a data matrix; and
(4) Achieve parsimony in data description.
The technique is used to reduce data in such a way that new and fewer derived variables
from the original data set are obtained.
The application of factor analysis in geographical research is w-ell-documcntcd (Johnston
1978, Obara 1983, Wegulo 1984). In this study the technique of factor analysis has been
employed in estab lish ing the principal variables that influence industrial location in the study
A lthough the application o f factor analysis is widespread in geographical research, the
technique is faced with a number of limitations. In the first instance, factor analysis consists of

132
many alternative approaches which normally give different results. The choice of these
approaches during data analysis is often subjective limiting the comparability of factor results.
A further limitation of factor analysis often cited is that the technique is mainly a descriptive tool
and offers very little explanation especially when applied to problems with nonexisting theories
(Obara, 1983).
3.2.fl.ANALYSIS OF DATA RELATING TO INDUSTRIAL STRUCTURE
This study examines various industrial structural characteristics of agricultural
manufacturing industries. These include, among others, the type of technology utilized, types
of commodities produced and their markets, raw materials used and their sources, and the scale
of production. In all the structural aspects, the chi-square non-parametric test has been utilized
to determine whether the differences between agro-based and non-agro-based industries are
significant.
Chi-square measures the discrepancy between observed and expected frequencies. It
involves a comparison of observed and expected frequencies.
where X2 = Chi-square £ - Summation
F„ = O bserved frequencies F . = Expected frequencies

133
If the calculated chi-square statistic is greater than or equal to the tabulated value at a
given significance level, the null hypothesis is rejected, and vice versa. However the chi-square
test is sensitive to sample size. Moreover it does not show the strength of a relationship.
This study has adopted the market for manufactured commodities criterion in analyzing
the predominant types of technology (Pearson 1969). Labour-intensive industries are identified
with the domestic (local) market production and capital-intensive industries with export market
production.
The scale of production o f the various agricultural manufacturing industries was analyzed
on the basis of the number of operatives employed by the establishments. Depending on the
number of operatives employed, industries were categorized as follows:
(i) 1 - 4 Very small
(ii) 5 - 19Small scale
(iii) 20 - 49
(iv) 50 - 99
(v) 100 - 199 Medium scale
(vi) 200 - 499
To an a ly ze the types o f goods produced, agro-based manufacturing industries were
stratified according to various categories as: (a) consum er goods, (b) export goods, and.
(^intermediate goods.

134
The market for goods produced was categorized into: local market, (that is. within the
District), and external market (other pans of Kenya and outside Kenya). Manufacturers were
asked to state where their products are sold in order of volume of sales. On the basis of the
results, the predominant market for goods produced was determined.
3.2, 9 METHODS OF DATA PRESENTATION
Data in this study has been presented using various methods. These include maps,
diagrams (pie charts and bar graphs) and tables. These methods are useful in providing a quick
visual impression of the different types of data, as well as, for summarising the data.
3.2. 9.1 M aps
This study has utilised quantitative maps to show quantitative aspects of various occurrences.
Among the maps used in this study include: a map of manufacturing employment and a map of
number of agricultural manufacturing establishments in Kisii District.
3*2.9 .2 Diagrams
This study has used diagrams such as bar graphs and pie charts. Bar graphs arc used to represent
in diagram m ed fo rm the items o f a data body where no continuity exists betw een the individual
items (Ferguson and Ngau, 1981). The length of each bar is proportional to the value the bar
^presents. Pie charts, on the other hand, take a circle to represent the whole body of data. The
circle is then divided into sectors representing the various items considered.

135
3.2.9 .3 Tables
A number o f tables have been used in this thesis. These tables provide summaries of the data
under consideration. The summaries are useful for further detailed analysis of the data. They
also provide a quick visual impression of the data, and more especially its quantitative aspects.
3.2.10 L IM IT A T IO N S O F R E S E A R C H M ETH O D O LO G Y
(i) One o f the most serious problems experienced during the research was the general
lack o f data on various aspects of industries. For instance, the District Industrial
Development Office did not have sufficient records on the industries in the
District. There was also lack of data on industrial operatives and on various
industrial structural aspects. Various measures were taken by the researcher and
his assistants to solve the problem of lack of sufficient information. These
included supplementing the insufficient records with: a pilot survey before the
actual research; field observations; and interviews.
('0 In a number of cases industrialists misunderstood the purpose of the study and
hence became reluctant to provide the required information. Some of the
respondents gave information that seemed inaccurate. There were cases where
the researcher was given appointments which were not honoured by the
respondents and this led to a waste of time and money. To go round this
problem, the researcher tried as much as possible to explain the aims and purpose
of this study to the respondents and to create an atmosphere of ease.

136
(iii) Bad weather conditions also hampered the research to some extent. The research
was conducted during the short rains season and this made it difficult to travel.
The state of roads was also worsened by the wet weather and this implied lack
of vehicles on some routes. The net effect was a delay in obtaining the essential
data and an inevitable rise in transport and overall research costs. To deal with
this problem, the research was mainly undertaken during the afternoon hours
when the weather conditions had fairly improved.
(iv) Financial constraints were also experienced. A lot of money was utilized in the
field and in having this work compiled. The available financial resources were
inadequate. These financial constraints were exaggerated by the large areas
covered as well as the poor state of roads when the research was conducted.
However, this researcher tried to be as economical as possible with the scarce
financial resources at his disposal.
(v) In some instances, some of the industrialists (especially those operating on a very
small scale) were semi-illiterate and so could not comprehend the questions in the
recording schedules. Thus, the interviewer and his assistants had to verbally
translate the questions into Kiswahili or mother tongue (Kisii). This inevitably
led to some loss of accuracy and misinterpretation of the recording schedules
content, despite the interviewer’s attempts to minimise this as much as possible.
(vi) Some difficulties were encountered during statistical analyses. Some of the statistical
tools originally thought to be suitable were found to be inadequaie. For instance, the
location quotient had to be supplemented by the coefficient of localisation. When using

137
the chi-square non-parametric test to determine the significance of the results obtained
from the field, data cells had to be combined to increase observations so that the
expected frequencies could be higher than 5 as required by the test. In the factor analysis
procedure, not all the industrial location variables could be analyzed as clouded results
were being obtained. Two of the variables that had been shown by descriptive statistics
to be relatively unimportant had to be left out of the procedure.
(vii) Difficulties were also met in mapping. During the period of writing and correction of the
thesis a new district was curved out of the study area thus creating a problem of
boundary definition for the two districts. This study has utilized the administrative units
set out in the 1992-1996 Kisii District Development Plan. Another problem encountered
was that of lack of uniformity in map and diagram style. This was due to the large
number of maps and diagrams needed for this study and which therefore had to be
handled by more than one cartographer. The researcher tried to minimize this problem
by having corrections and amendments made wherever possible. Understandably, a lot
of expenses were also incurred in producing the large number of maps and diagrams. To
solve this problem, the author had to supplement the meagre research funds with personal
sources.

138
CHAPTER FOUR
SPATIAL INDUSTRIAL PATTERNS OF KISII DISTRICT
AGRICULTURAL MANUFACTURING INDUSTRIES
4.1 INTRODUCTION
This chapter examines the spatial patterns of agro-based industries in Kisii District. The
significance o f such (spatial) patterns lies in their implications for intra-regional development.
As already noted, the concentration of economic activities (especially manufacturing) in certain
areas at the expense of others, is likely to lead to lopsided development which (development)
exacerbates inequalities in a region. On the other hand, an equitable distribution of economic
activities, among other things, is likely to result in equitable regional development.
The null and alternative hypotheses to be tested in this chapter states that: H0: ‘there is
no significant industrial localization in Kisii District’ and that: H,: ‘there is significant industrial
localization in Kisii District’, respectively.
It is important to point out right from the outset that some of the data used in this chapter
have certain shortcomings. Data on manufacturing employees, especially in the various
divisions, are based on estimates which were provided by the District Industrial Development
Office. As at the time the research was being undertaken, there was no database on the number
°f manufacturing employees in the various divisions comprising Kisii District. Whereas the data
Provide an indication of the spatial patterns of agro-based industries in the study area, there is
a Possibility that the estimates are not accurate. Moreover, the degree of inaccuracy cannot be

139
determined, which in itself is an example of the problems facing policy makers and development
planners not only in the study area but in Kenya as a whole. An enumeration of employees in
the entire study area by the researcher and his assistants could have been impossible due to
limited financial resources and time at their disposal. Thus, the estimates should be treated with
caution.
4,2 INDUSTRIAL SPATIAL PATTERNS
To determine the nature of the spatial patterns of agricultural manufacturing industries
in Kisii District, the techniques of coefficient of localisation and location quotient have been
used. To map the location of the agricultural manufacturing establishments, two indices have
been used, namely: number of employees (that is, all employees in the establishments including
the operatives), and the total number of establishments. The index of number of employees
employed has been used to generate a map portraying industrial spatial patterns. The criterion
of total number o f establishments in each division has been used to produce bar graphs for the
respective divisions. The justification for the utilization of the two indices to map manufacturing
lies in the need to gain additional insight into the location patterns of agricultural manufacturing
in Kisii District.
agro-Table 4.1 shows based manufacturing employees in Kisii District.

140
TABLE 4.1: AGRO-BASED MANUFACTURING EMPLOYEES IN KISII DISTRICT
DIVISION1 AFP ANFM Total
vfyamache 301 135 436
Suneka 46 24 70
Nyamarambe 45 33 78
Marani 80 33 113
Sameta 55 30 85
Ogembo 215 89 304
Keumbu 33 23 56
Masaba 245 94 339
Kenyenya 70 48 118
Kisii Municipality 902 258 1160
Keroka Town Council 110 104 214
Total 2102 871 2973
Source: District Industrial Development Office 1994
AFP - Agro-based food processing
ANFM - Agro-based non-food manufacturing
■ v, At nercentaws of agricultural manufacturing employeesOn the basis of the data in table 4.1, p
>n each division have been worked in out table 4.2.
------------------------------------------ . ■ •„ ,h . etude area as well as Kisii Municipality' The term division includes all the divisions m the study
and Keroka Town Council

141
TABLE 4.2: PERCENTAGES1 OF EMPLOYEES L\ AGRO-BASED MANUFACTURING
AND THE ALLIED SERVICE SECTOR IN KISII DISTRICT
Division Main Industrial Group
AFP ANFM
Nyamache 10.1245 4.5409
Suneka 1.5473 0.8073
Nyamarambe 1.5136 1.1100
Marani 2.6909 1.1100
Sameta 1.8500 1.0091
Ogembo 7.2318 2.9936
Keumbu 1.1100 0.7736
Masaba 8.2408 3.1618
Kenyenya 2.3545 1.6145
Kisii Municipality 30.3397 8.6781
Keroka Town Council 3.7000 3.4982
Total 70.7030 29.2970
Source: Research Data, 1994
W C c " ! ^ * * * * * * * * *$973 employees) and not the respective totals of each c g ry f
142
Data in table 4.2 indicates that Kisii Municipality commands a higher percentage of total
employees in both agricultural food processing (30.3397%) and agricultural non-food
manufacturing (8.6781%), than all the divisions.
Nyamache Division is second overall in both agro-based food and non-food industries
(10.1245% and 4.5409%, respectively). Masaba Division also has a significant share of the
District’s employees in agro-based industries. It accounts for 8.2408% and3.I618% employees
in agro-based food and non-food industries, respectively.
The other division with a fairly significant share of agro-based employees is Ogembo with
7,2318% share in agricultural food employees and 2.9936% share in agro-based non-food
employees. Keroka Town Council accounts for 3.7000% and 3.4982% of employees
respectively, in both agro-based food and non-food industries. The three divisions (Nyamache,
Masaba and Ogembo as well as Kisii Municipality and Keroka Town Council account for
59.6368% and 22.8726% of the employees in agro-based food and non-food industries,
respectively Other divisions do not significantly contribute to the study area s share of
manufacturing industries. The computed percentages thus indicate spatial concentration of
manufacturing employment in Kisii Municipality.
Table 4.3 shows totals of employees in agro-based industries as well as, in non-agro
based manufacturing and allied service sector.

143
TABLE 4.3: EMPLOYEES IN MANUFACTURING AND THE ALLIED SERVICE
SECTOR LN KISH DISTRICT
D iv is io n Combined AFP NAMS Total
and ANFM
N'yamache 436 140 576
Suneka 70 30 100
Nyamarambe 78 34 112
Marani 113 40 153
Sameta 85 37 122
Ogembo 304 140 444
Keumbu 56 20 76
Masaba 339 148 487
Kenyenya 118 54 172
Kisii Municipality 1160 470 1630
Keroka Town
Council 214 90 304
Total 2873 1303 4176
Source: District Industrial Development Office 1994
AF\1 = Agro-based food processing ANFM = Agro-based non-food manufacturing
^AMS = Non-agro-based manufacturing and allied service sector

144
Data in table 4.3 has been used to compute the coefficient of localisation and location
q u o t ie n t values. The procedure for calculating the coefficient of localization is as follows:
(i) Determination of the proportion of divisional agro-based employees in the Districts' agro-
based employees.
(ii) Computation of the percentage share of the divisional total employees in the study area’s
total employees.
(iii) Determination of the deviations of divisional percentage of agro-based employees from
corresponding Districts’ percentage of employees in all manufacturing.
(iv) The coefficient of localisation (L) is the sum of either negative or positive deviations in
(iii) above, divided by 100. The coefficient of localisation is calculated below.

145
D iv is io n Div, agro-based Div. total manu. Differencesemployees as % employees as <+ or -)of Dist. agro- % of Dist. totalbased employees manu. employees
Div. Div. % of Div. total Div. % ofemployees Dist. total manu. manu.
employees employeesNyamache 436 14.665 576 13.793 0.872Suneka 70 2.355 100 2.395 -0.04Nyamarambe 78 2.624 112 2.682 -0.058Marani 113 3.801 153 3.664 0.137Sameta 85 2.859 122 2.921 -0.062Ogembo 304 10.225 444 10.632 -0.407Keumbu 56 1.884 76 1.820 0.064Masaba 339 11.403 487 11.662 -0.259Kenyenya 118 3.970 172 4.119 -0.149Kisii Mun. 1160 39.018 1630 39.033 -0.015
Keroka TownCouncil 214 7.200 304 7.280 -0.08
Total 2973 100.00 4176 100.00 1.07 -1.07
Div. = Division Manu, - Manufacturing Mun. = Municipality Dist. - District
1. 7L = —
100
= 0.017
where l = Localisation coefficient
The localisation coefficient computed above is low (it approaches aero), signifying idcm.ty
between the two sets of data, namely, the agro-based industry data set and the manufac g
industry data set.

146
The coefficient therefore suggests that agro-based industries in the study area arc not
concentrated in any particular division. However, there is need for further detailed analysis to
confirm this.
Data in tables 4.1 and 4.3 have been used to compute the location quotient values. The
procedure for calculating the location quotient is outlined below:
(i) Determination of the divisional agro-based employees for both food and non-food
industries.
(ii) Determination of the divisional non-agro-based employees.
(iii) Determining total agro-based employees in the entire study area.
(iv) Determining total non-agro-based manufacturing employees in Kisii District
(v) Location quotient values have been determined using the formulae below:
AFPdiv AGMkd + NAMSu,L.Q. for AFP = ------------- x -----------— -------------
AGMkd AGMkd + NAMS0(V
where L.Q.
AFP
A F P div
AGMkd
NAMSdiv
= Location Quotient
= Agro-based food processing industries
= Total agro-based food processing divisional operatives
= Total general agro-based operatives in Kisii District
= Total divisional non-agro-based manufacturing and allied service sector
operatives

147
NAMSkd Total non-agro-based manufacturing and allied service sector operatives
in Kisii District
ANFMDjv AGM^ + NAMSkdL.Q. for ANFM = ------------- x ----------------------------
AGMf^) AGMkd + NAMSdiv
where L.Q. = Location Quotient
ANFM = Agro-based non-food industries
ANFMd1v = Total agro-based non-food divisional operatives
AGM,^ = Total general agro-based non-food operatives in Kisii District
NAMSfQj = Total non-agro-based manufacturing and allied service operatives in Kisii
, District
NAMSdiv = Total divisional non-agro-based manufacturing and allied service operatives
The computed location quotient values are shown in table 4.4

148
TABLE 4.4: LOCATION QUOTIENT VALUES FOR MANUFACTURING INDUSTRIES
AND THE ALLIED SERVICE SECTOR IN KISII DISTRICT
Division AFP ANFM
Nyamache 0.7596 0.3407
Suneka 0.6686 0.3488
Nyamarambe 0.5840 0.4283
Maratii 0.7500 0.3135
Sameta 0.6552 0.3574
Ogembo 0.7038 0.2914
Keumbu 0,6311 0.4399
Masaba 0.7312 0.2806
Kenyenya 0.5915 0.4056
Kisii Municipality 0.8043 0.2301
Keroka Town Council 0.5259 0.4973
AFP ~ Agro-based food processing
ANFM = Agro-based non-food manufacturing
NAMS = Non agro-based manufacturing and allied service sector
Source: Computed from research data, 1994.

149
The co m p u ted location quotient values indicate concentration on industnes in ccnam p an s
of the District.
As fa r as agro-based food industries are concerned, Kisii M unicipality leads with a
location quotient value of 0.8043. Other leading values are recorded by: Nyamache (0.7595);
Marani (0.7500), Ogembo (0.7038) and Masaba (0.7312). Keroka Town Council has a location
quotient value of 0.5259. In terms of agro-based non-food manufacturing, Keroka Town
Council leads with a location quotient value of 0.4973, followed by Keumbu (0.4399),
Nyamarambe (0.4283), Kenyenya (0.4056) and Sameta (0.3574). Kisii Municipality has a
location quotient of 0.2301.
The computed location quotient values (see table 4.4) indicate that: 1
(1) No part of the study area has more than its fair share of industries. This
confirms the fact that the study area is still underdeveloped in terms of industries.
(7) There is a spatial concentration of agro-based manufacturing industries in the two
leading urban centres in Kisii District, namely, Kisii Municipality and Keroka
Town Council. The Municipality accounts for the highest location quotient value
in agro-based food processing. Moreover, it accounts for the highest proportion
of manufacturing employment in both agro-based food and non-food industries.
Keroka Town Council has the highest location quotient value in the agro-based
non-food processing establishments category.

150
To further determine the spatial patterns of agro-bascd industries in Kisii District the
number of agro-based establishments in the study area during the research period (1994) is
shown table 4.5,
TABLE 4.5: NUMBER OF AGRICULTURAL MANUFACTURING ESTABLISHMENTS
IN K ISn DISTRICT
Division Number of establishments
Nyamache 16
Suneka 24
Nyamarambe 10
Marani 27
Sameta 5
Ogembo 9
Keumbu 10
Masaba 18
Kenyenya 14
Kisii Municipality 55
Keroka Town Council 12
Total 200
Source: District Trade Office, 1994.

151
Data in table 4.5 dears shows Kisii Municipality also leads in the number of agro-based
establishments that are located in the District, followed by Marani. Suncka, Masaba and
Nyamache Divisions, respectively.
To portray the spatial patterns of agro-based industries, two indices have been used namely:
(i) number of employees, and
(ii) number of establishments.
Figure 21 portrays cartographically the spatial patterns of agro-based industries in Kisii
District using manufacturing employees. Accordingly, the leading agro-based industrial areas
in the study area in terms of employment include: Kisii Municipality, Nyamachc, Masaba,
Ogembo and Keroka Town Council, respectively. It would appear that other divisions arc not
significant industrial units.
Figure 22 shows the number of agricultural manufacturing establishments per division of
Kisii District. Accordingly the leading industrial areas include: Kisii Municipality, Marani,
Suneka, Masaba and Nyamache.

Source: Boaed on reieoreh data ,1994

M /
G O
R i
153
PQ 22 K I S H D I S T R I C T : N U M B E R O F A G R I C U L T U R A L M A N U F A C T U R I N G E S T A B L I S H M E N T S IN 1 9 9 4

154
There is an apparent discrepancy in the spatial patterns portrayed by the two methods.
This can be explained in terms of the scale of operation and the number of licensed
establishments. Some divisions possess relatively large numbers of establishments (for instance,
Suneka and Marani) but these establishments employ relatively few people. They operate at a
very small scale. Examples include: tailoring establishments, butcheries, and carpentries. On
the other hand, some of the divisions have few establishments but which employ relatively
large numbers of people. Good examples include Nyamache, Masaba, and Ogcmbo divisions and
Keroka Town Council. These divisions possess establishments that employ comparatively more
people. Examples include Nyamache Tea Factory in Nyamache, Kiamokama Tea Factory in
Masaba and Ogembo Tea Factory in Ogembo.
Since the data on number of agricultural establishments in the study area were obtained
from the District Trade Office, it is possible that some of the divisions which appear to have
relatively fewer establishments, have more establishments but which may not have been licensed
and therefore not registered in the District trade office. There w'erc cases in some divisions
where the researcher and his assistants "discovered" establishments which did not appear in the
records of the District Trade Office. Moreover, the probable inaccuracy of data on agro-based
employees has been noted elsewhere.
4-3 HYPOTHESIS TESTING
Research results clearly indicate a spatial concentration of agro-based manufacturing m
Kisii Municipality. This has been determined on the basis of:(l) manufacturing employment -
*e Municipality leads in terms of the percentages of agro-based employees. Computed location
155
quotient values suggest a spatial concentration of especially agro-bascd food proccssmg
industries; and, (2) the number of agricultural manufacturing establishments in the study area ■
the Municipality leads all other divisions in terms of the number of agricultural manufacturing
establishments.
On the basis of the above research findings, the null hypothesis that ‘there is no
significant industrial localisation in Kisii District’ has been rejected. The alternative hypothesis
that ‘there is significant industrial localisation in Kisii District’, has been adopted.
It should be noted that localisation of industries is not just within Kisii Municipality as
opposed to other divisions in the District, but more especially within Kisii town1 where most
of the industries that employ relatively large numbers of people are located.
4.4 IMPLICATIONS OF FINDINGS ON INDUSTRIAL SPATIAL PATTERNS
It has been clearly established through research findings, that there is industrial
localisation in Kisii Municipality as compared to other industrial centres and rural areas in Kisii
District. It would appear that a core-periphery type of development pattern is prevalent in Kisii
District. Kisii Municipality is core, while the rest of the District is the periphery. Although this
type of development pattern is likely to be at a much lower level when compared with corc-
periphery at the national level, it is nevertheless significant since it implies polarization. As
stated elsewhere, polarization is associated with inequalities and hence results in a type of
development that is unequitable in a given region. In the light of the research findings, it is
Operative that measures are taken by planners and policy makers to deal with the polarized type
1 Kisii town refers to the built-up urea. within Kisii Municipality

156
of development pattern that evidently exists in Kisii District. As far as industrial spatial patterns
are concerned the government should take measures to discourage localisation of industries in
towns in the study area, especially, Kisii and Keroka towns and to decentralize more of the
relevant industries to other parts of the District. TJ#, right incentive package is likely to go a long
way in encouraging equitable industrial development. Such a package would include:
(i) Provision of infrastructural facilities such as tarmacked roads, electricity, water
supply, and housing to various relevant parts of the District. This is likely to go
a long way in making such parts as attractive as possible.
(ii) Budgetary controls such as credit restrictions, differential taxation and licensing
and government expenditure. For instance, Kisii Municipal Council would impose
lower local taxes and licensing fees in areas that are comparatively less developed
in terms of industrial development and higher taxes in such areas as Kisii
Municipality.
(iii) Provision of research information to industrialists on the location and site
advantages and disadvantages of various areas in Kisii District regarding specific
industrial enterprises;
(iv) Making o f special financial relief provisions for manufacturers who locate their
establishments in disadvantaged areas. Such arrangements would include, among
others, low interest rate loans, tax exemptions, and low or subsidised rents.

157
There are a number of other measures that could be taken>nfy the apparently
polarized industrial spatial pattern of Kisii District agro-based industries. A few of them arc
outlined below, namely:
(a) There is need to divert the inflow of development factors/dctcrminants
(particularly societal innovation and decision- making) from the Kisii town core
zone to other parts of the District. Such a measure is likely to reduce regional
inequalities.
(b) Effective internal demand should be built and the creation of dynamic societal
structures encouraged in peripheral regions of Kisii District. People in these
regions should be encouraged to retain in the relevant divisions of the study area
their returns (such as wages and salaries, etc.) in order to create adequate internal
demand.
(c) Those people employed in Kisii Municipality should be encouraged to send part
of their financial returns to their relatives and friends in peripheral areas. This
is likely to boost demand in those regions, and hence provide a basis for regional
service and manufacturing industries.
(d) Societal structures that are anti-development, (for instance, unwillingness to
educate children by some parents), should be highly discouraged in the study
area.
<e) Kisii District is endowed with various resources, especially agricultural sources.
Various crops such as tea, coffee, pyrethrum. sugarcane etc. do well in the

158
various agro-ecologicai zones. Furthermore there are other developable non-
agricultural industrial resources,(such as soapstone mined in Tabaka in
Nyamarambe Division) which could be utilized. It is important that the external
demand for these various resources is mobilized and links established both within
and outside the study area, in terms of access to external information, resources
and markets. Exploitation and marketing of these extra resources, especially
soapstone which is a very important non-agricultural resource, should be improved
and streamlined.
(f) Formation of ‘interest groups* in peripheral regions which (groups) have the
capacity for mobilizing and utilizing resources is another suitable measure. Such
groups would include: regional businessmen, regional intellectuals and regional
politicians. These groups should identify themselves with the interests of the
regions and should be capable of pressing for the regions interests with outside
decision makers.
In concluding this chapter, it is important that for the purpose of equitable regional
development, the current industrial (and overall) spatial pattern (which is cntropic or polarized),
be corrected by appropriate measures to generate negentroplc equitable spatial pattern. It is
also important to encourage industrial development in the study area as a whole.

159
CHAPTER FIVE
l o c a t io n v a r ia b l e s in flu en c in g th e LOCATION OFAGRO-
BASED INDUSTRIES IN KISII DISTRICT
5.1 INTRODUCTION
This chapter focuses on the identification of the variables that have influenced the location
of agro-based manufacturing industries in Kisii District.
The null and alternative hypotheses to be tested in this chapter state that: H„: 'economic
variables are not the main determinants of the location of agricultural manufacturing industries’
and that H r ‘economic variables are the main determinants of the location of agricultural
manufacturing industries’.
Manufacturers were asked to rank the variables known to influence the location of agro-
based industries in order of importance starting with the most important to the least important
variables. The ranking scale below was provided.
Rank Points awarded
L Very important variable influencing location of this industry *
Important variable influencing location ofthis industry ^
3- Fairly important variable influencing location ofthis industry 7
4- Least important variable influencing location of this industry

160
5.2 DATA ANALYSIS AND RESULTS
The results were analyzed using means, frequencies, percentages and correlations
(A p p e n d ix 7). Further d e t a i l e d a n a ly s is w a s u n d e r ta k e n u s in g the fa c to r a n a ly s is p r o c e d u r e o f
the principal axis type.
The first variable, raw material availability, had the lowest mean 2.48. It is a very
important factor of location of agro-based industries in Kisii District. This is exemplified by the
fact that 61 5% (40) of the establishments in the study area viewed it as very important in their
location decisions. This compares with the 10.6% (7) which viewed it as the least important
factor. 24.6% (16) and 3.1% (2) indicated that raw material availability was an important and
fairly important variable, respectively. The significance of raw material availability as a variable
of industrial location in the study area lies in the fact that most of the agro-based manufacturing
industries in Kisii District are raw material orientated.
The variable of availability of local capital plays a fairly crucial role in the location of
agro-based establishments in Kisii District. It has a mean of 7.21. It was selected as very
important in industrial location by 6.2% (4) of the industries. 7.7% (5) and 35.4% (23) of the
establishments ranked it important and fairly important in their location decisions. 50.8 ,o (33)
of the industrialists viewed local availability of capital as the least important consideration in the
location of agro-based industries.
Proximity to other establishments is not an important consideration in the location of
agricultural manufacturing industries in Kisii District. This is explicitly clear from research
findings and data analysis. The variable has a very high mean of 9.77. Moreover over 90%
(59) of the industrialists indicated that the variable is least important in their location decisions.

161
Only 9.2% (6) o f the industrialists felt thar thf» ( • i ■ , ,3 “ C1111131 me enable is fairly important in the location
of their establishments.
The variable of presence of urban economies has a mean of 7.34 signifying that it is
fairly important though tending towards being least important in the location decisions in the
study area. 3.1% (2), 3.1% (2) and 35.4% (23) chose the variable as very important, important
and fairly important respectively. 58.5% (38) of the establishments indicated that the variable
was least important in their location decisions. The variable has a mean of 8.34.
The availability of local market is considered as important in influencing the location of agro-
based establishments in Kisii District. This is indicated by the data analytical results. The
variable has a low mean of 4.56. Furthermore over 60% (41) of the industries visited indicated
that the variable was either very important, important or fairly important. Only less than 40%
(24) of the industries indicated that the variable is least important.
Transport costs is an equally important consideration (though not as important as
availability of local market) among industrialists in location decisions. It has a fairly high mean
of 6.57. It was considered very important by 18.5% (12) of the industries; 29.2% (19)
important; 10.8% (12) fairly important; while 41.5% (27) considered the variable least
important.
The variable of nearness to home is considered very important by industrialists in Kisii
District. Over 70% (47) of the agro-based industries indicated that it was either very important,
important or fairly important. Less than 30% (18) of the establishments indicated that the
variable was least important. The significance of the variable is further emphasized by its low
mean of 3.45. Power supply is also important in influencing the location of agro-based

162
manufacturing industries. It has a mean of 6.66. 21.5% (14), 27.7% (13) and 13.3% (9) of
the industries chose the vanable as either very important, important or fairly important. 36.9%
(24) chose it as least important.
The variable of underlying rock structure is the least important variable. This conclusion
is arrived at on the basis of data analysis results. The variable has the highest mean of 9.95.
Furthermore almost all the establishments visited (98.5%) considered it least important in their
location decisions. Otherwise only one establishment (1.5%) felt the variable was fairly
important in its location.
Surface configuration is also not an important variable in the location of agro*bascd
establishments in Kisii District. It has a high mean of 9.49. Moreover, over 90% (61) of the
industrialists chose it as the least important variable in the location of their industries. Less than
10% (4) chose it as fairly important influencing location.
Availability of land is not very crucial in the study area. 3.1% (2) and 23.1% (15) of the agro-
based industries visited felt that the variable was important and fairly important, respectively.
73.8% (48) of the industries regarded the variable as least important. The variable has a mean
of 8.53 which further stresses the fact that is relatively unimportant in industrial location
decision making in Kisii District.
The government does not play a great role in the location of agro-based industries in Kisii
District. Data analysis indicates that over 80% (54) of the industries visited regarded
government role in their location decisions as minimal (that is, least important). Less than 20%
(U ) of the industries indicated that the government played some role in the location decisions.
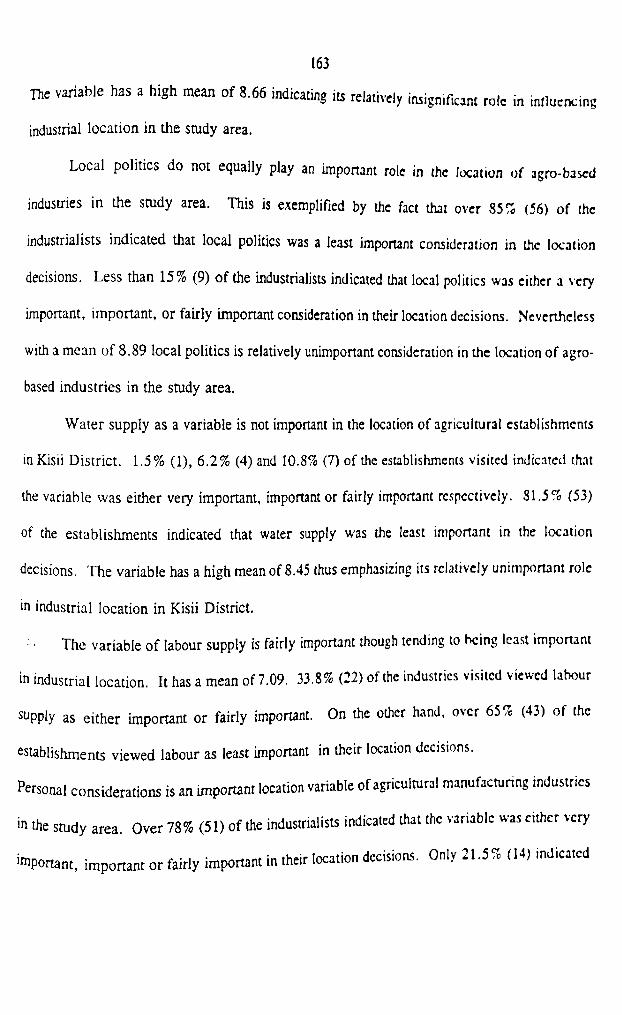
163
T he v a r i a b l e h a s a h ig h m e a n o f 8 .6 6 in d ic a tin g its re la tiv e ly in s ig n if ic a n t r o l e in in f lu e n c in g
industrial location in the study area.
Local politics do not equally play an important role in the location of agro-based
industries in the study area. This is exemplified by the fact that over 85 % (56) of the
industrialists indicated that local politics was a least important consideration in the location
decisions. Less than 15% (9) of the industrialists indicated that local politics was either a very
important, important, or fairly important consideration in their location decisions. Nevertheless
with a mean of 8.89 local politics is relatively unimportant consideration in the location of agro-
based industries in the study area.
Water supply as a variable is not important in the location of agricultural establishments
in Kisii District. 1.5% (1), 6.2% (4) and 10.8% (7) of the establishments visited indicated that
the variable was either very important, important or fairly important respectively. 81.5% (53)
of the establishments indicated that water supply was the least important in the location
decisions. The variable has a high mean of 8.45 thus emphasizing its relatively unimportant role
in industrial location in Kisii District.
The variable o f labour supply is fairly important though tending to being least important
in industrial location. It has a mean of 7.09. 33.8% (22) of the industries visited viewed labour
supply as either important or fairly important. On the other hand, over 65% (43) of the
establishments viewed labour as least important in their location decisions.
Personal considerations is an important location variable of agricultural manufacturing industries
'n the study area. Over 78% (51) of the industrialists indicated that the variable was cither very
important, important or fairly important in their location decisions. Only 21.5% (14) indicated

164
Out the variable was least important in the location of their establishments. The vanable has
a low mean 3.58 which further emphasizes its significant role in location decisions in Kisii
District.
Having established the means, frequencies and percentages of the sixteen variables, the
interrelationships (correlations) between the variables were examined. These correlations arc
a prelude to factor analysis.
The correlation matrix of the 16 variables is shown in appendix 8. The variables and
their respective codes are identified in appendix 6. The correlation matrix shows values of the
Pearson’s Product Moment correlation computed for all the variables using the SPSS package.
Correlations ± 0.3000 were regarded as significant at both 0.01 and 0.001 significance
levels. The correlation matrix indicates that there are significant correlations between the
variables influencing the location of agro-based industries in Kisii District. For instance,
significant interrelationships exist between: government influence and personal coasidcrations
(-0.6238); surface configuration and underlying rock structure (0.6015); personal considerations
and local availability of raw materials (0.6115); power supply and water supply (0.5484); and
personal considerations and nearness to home (0.4656).
The significant correlation between personal considerations and government influence is
probably due to the fact that as government influence(s) in industrial location become more
important, personal considerations are, in most cases, subordinated. The local availability of
raw materials and nearness to home are, in fact, part of the considerations taken into account
by industrialists in their location decisions. This explains the close relationships between these
variables. The underlying rock structure and surface configuration have significant correlation.

165
For instance, the rock structure determines rock resistance to agents of erosion and weathering
and the type of landscape formed.
To obtain more comprehensive results the correlation matrix was exposed to factor
analysis. The type of factor analysis utilized in this study is the principal axis factoring (PAF).
It was decided that those variables that were viewed as least important by over 90% of
industrialists be left out of the factor analysis procedure. This was done mainly to leave out
insignificant variables that will have only clouded the results. The variables that have been
excluded from the factor analysis procedure include: underlying rock structure, surface
configuration and proximity to other establishments. This leaves thirteen variables for the factor
analysis procedure.
Factor analysis begins with a correlation matrix (Appendix 8). The major problem faced
in factor analysis involves the decision as to how many independent factors to extract from the
original data set. Three major approaches have been recommended by statisticians These
include:
(a) use of a predetermined eigenvalue;
(b) use of cumulative percentage; and,
(c) scree test of the percentage of total variation.
For p u r p o s e s o f this study, an eigenvalue of at least above unity (above 1) was decided upon as
signifying the independence of a variable from the rest. On the basis of this requ.remcnt. four
factors were extracted from the original data set.

166
It is possible to construct a cumulative percentage curve. From the curve it will be
established that the first four factors contribute to the growth of a very steep slope that accounts
for 65.1 per cent of the variance in the original data set after which the graph rises less steeply
(Figure 23).
Using the scree test, the cut off point for significant factors is the point w here there is
sharp drop in the curve showing the proportion of total variance accounted for by each factor
and beyond which the curve slopes off (Figure 24).

PRO
PORT
ION
OF
TOTA
L V
AR
IAN
CE
■ C
UM
ULA
TIV
E PE
RC
EN
TA
GE
PIG 24 PROPORTION OP TOTAL VARIANCE GRAPH SHOWING 'd j'p -Q p p POINT* FOR SIGNIFICANT FACTORS.

168
Using factor analysis, the 13 original variables have been meaningfully collapsed into
four independent factors.
The communalities, eigenvalues, percentage of variance and cumulative percentages of
the four variables have been extracted using the PAF procedure. These arc shown in table 5.1.
TABLE 5.1: FACTOR ANALYSIS FOR INDUSTRIAL LOCATION VARIABLES
Variable Communality Factor
V01 79643 1
V02 .22322 2
V04 33074 3
V05 39610 4
V06 .26782
V07 ,10214
V08 .26694
vn .20224
V12 ,14043
V13 .46246
V14 .50380
V15 .43302
V16 .66982
Eigenvalue % of Variance Cun
2.87327 26.6 26.6
2.28446 17.2 43. S
1.89091 12.4 56.2
1.31352 8.9 65.1
169
Table 5,1 shows that the four factors extracted by the PAF procedure together account
for 65.1 % of the total variation in the original data set.
The initial factor solution (unrotated factor matrix) was rotated using the varimax
rotation. Rotation is basically aimed at enabling easy and accurate interpretation of the factors
with their respective variables. Rotation makes the variance of certain variables with respect
to one factor to be maximised. Hence a higher loading of certain variables on some factors is
expected so as to facilitate a more accurate identification of the factor concerned. The rotated
factor matrix is shown in table 5.2.
V
r

170
TABLE 5.2: ROTATED FACTOR MATRIX FOR INDUSTRI.
VARIABLES
Variable Factor 1 Factor 2 Factor 3 Factor 4
V01 i .82979 -.21359 .08732 -.05865
V02 .44129 -.02646 -.16626 .01193
V04 .13021 .02113 .44195 .20321
V05 .20670 .75585 .33256 -.12508
V06 -.03334 .52890 .16818 .20818
V07 .50161 .01840 .10647 .06739
V08 .05781 .12704 .53256 .22363
V ll -.21333 .20778 .46818 .19678
V12 -.81532 -.05585 .20512 .40379
V13 -.28372 -.15606 .22656 .40221
V14 -.44195 -.12492 .28694 .41134
VI5 -.04979 .01329 .13501 .69492
V16 .65509 .18323 .05825 .16816
In order to establish the main variables influencingthe location of agricultural manufacturing
industries in Kisii District, the variousfactors that derived from the factor analysis procedure.
have been identified and labelled.

171
5.3 IDENTIFICATION AND LABELLING OF FACTORS
For easy and accurate interpretation of the factors, it was decided that only those
variables that load on the factors with a value equal to or greater than ( £ ) 0.4000 be taken into
account. One of the major problems associated with the identification and labelling of factors
in factor analysis is the provision of a label that adequately reflects the composite importance
of the various variables associated with a factor (Taylor 1977, Wegulo 1984). Thus, bipolar and
tripolar factors are common in factor analysis. In this study, an attempt has been made to
ensure that the labels provided for the factors are as accurate as possible and reflective of the
constituent variables.
Variables
Local availability of raw materials
Personal considerations
Nearness to home
Availability of local capital
Factor one is associated with four variables, which load significantly on it. These
include, local availability of raw materials, personal considerations, nearness to home, and
availability of local capital. This factor may be interpreted as representing variables that arc
Personally considered by industrialists when making location decisions, affecting agro-based
industries. These are variables which industrialists consider as likely to reduce their costs and/or
FACTOR ONE
Loadings
0.82979
0.65509
0.50161
0.44129

172
increase their revenue. For instance, an entrepreneur is likely to seek location near a particula
raw material supplier or banker because he feels that friendship is likely to influence th
availability of materials or funds (Greenhut 1956:173). Factor one has, therefore, been labcllci
personal preferences.
FACTOR TWO
Variables leadings
Availability of local market 0.75585
Low transport costs 0.52890
4 {
Two variables have loaded significantly in factor two. These are, availability of local markc
and low transport costs. Factor two may be regarded as ‘representatives of variables related t<
access to the market of the goods manufactured.’ Factor two has therefore been labelled marke
accessibility.
Variable
Power supply
Land availability
Urban economies
FACTOR THREE
leadings
0.53256
0.46818
0.44195

173
Three variab les load significantly with factor three. These include, pow er supply, lar
availability and urban econom ies. The first two variables are associated w,th 'industrial suppo
infrastructure. F actor three has therefore been labelled industrial support infrastructure-cun
urban economies. Factor three is an example of a ‘bipolar factor.’
FACTOR FOUR
Variable Loadings
Labour supply 0.69492
Water supply 0.41134
Government influence 0.40379
Local politics 0.40221
Four variables have been identified as loading significantly with factor four. These includ
labour supply, water supply, government influence and the role of local politics. Factor fou
may be identified as representing variables related to government influence (and local politic
which in most cases manifests through, for example, the influence on the location of govemmer
sponsored projects, the influence on local council decisions, etc.). Factor four may thus h
labelled as government influence-cum4abour-water supply. This factor is an example of ,
bipolar factor.

174
In a nutshell, the main variables influencing rh* ,ng the location of agro-based industries in Kisi
District may be collapsed into four factors, as follows:
(i) Personal preferences;
(ii) Market accessibility;
(iii) Industrial support infrastructure-cum-urban economies; and,
(iv) Government influence-cum-labour-water supply.
However, certain considerations should be taken into account. These arc as follows:
(a) The four factors have been identified on the basis of the major variables which were
considered for the factor analysis procedure. Quite a number of other variables (mainly
physical) were not considered for the factor analysis procedure. This is basically because
some of the variables, (for instance, the underlying rock structure and surface
configuration), were regarded as least important by over 90% of the establishments
visited, When the factors were included in the factor analysis procedure, they tended to
cloud the results. However, it should be noted that the variables of underlying rock\
structure and surface configuration, have influenced the location of agro-based
establishments in the study area, albeit mainly indirectly. For example, the underlying
rock structure of Kisii District, (consisting of dominantly the Bukoban rock system), has
influenced the type(s) of soils and hence influencing the agro-based industrial bases.
Moreover, different commercial crops in the study area (tea. coffee, maize, millets,
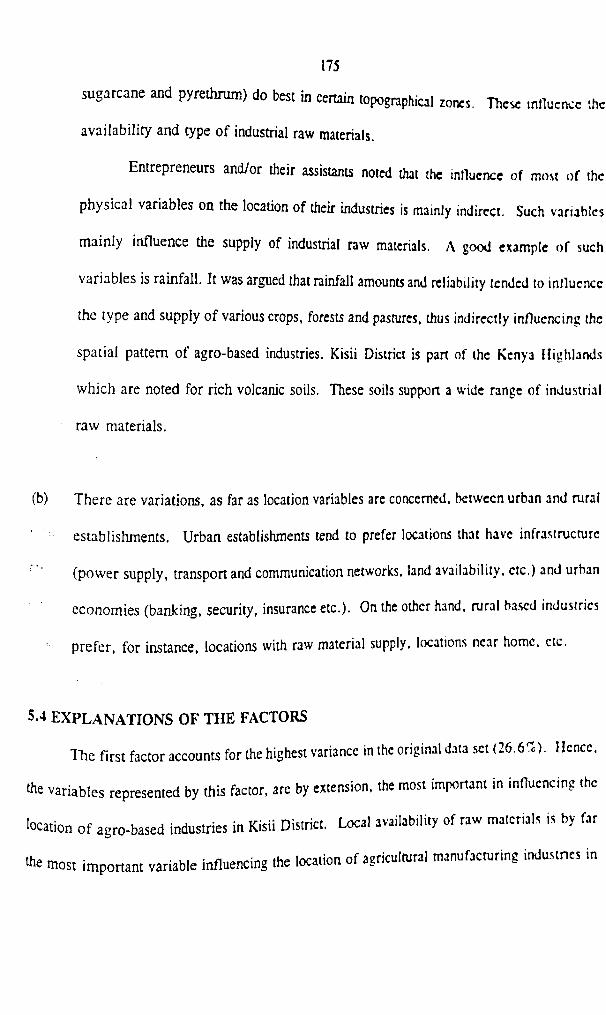
175
sugarcane and pyrethrum) do best in certain topograph,cal zones. These influence the
availability and type o f industrial raw materials.
Entrepreneurs and/or their assistants noted that the influence of most of the
physical variables on the location of their industries is mainly indirect. Such variables
mainly influence the supply of industrial raw materials. A good example of such
variables is rainfall. It was argued that rainfall amounts and reliability tended to influence
the type and supply of various crops, forests and pastures, thus indirectly influencing the
spatial pattern of agro-based industries. Kisii District is part of the Kenya Highlands
which are noted for rich volcanic soils. These soils support a wide range of industrial
raw materials.
(b) There are variations, as far as location variables are concerned, between urban and rurat
establishments. Urban establishments tend to prefer locations that have infrastructure
(power supply, transport and communication networks, land availability, etc.) and urban
economies (banking, security, insurance etc.). On the other hand, rural based industries
prefer, for instance, locations with raw material supply, locations near home, etc.
5.4 EXPLANATIONS OF THE FACTORS
The first factor accounts for the highest variance in the original data set (26.6r«). Hence,
'he variables represented by this factor, are by extension, the most important m influencing the
location o f agro-based industries in Kisii District. I^cal availability of raw materials is by far
the most important variable influencing the location of agricultural manufacturing industries in

176
Kisii District. Industries such as flour milling, tea, coffee and sugarcane processing, saw
milling, furniture and fixtures fabrication, meat products processing, arc strongly raw matena
orientated. The raw materials for these industries are bulky and they have low value. Hence,
manufacturers consider it uneconomical to locate such industries far from where their raw
materials are obtained since high transport costs could be incurred, which in turn implies high
production costs. Moreover, some of the raw materials are perishable (they lose quality), for
instance, green leaf (tea). Consequently, tea factories are located wiihin the regions where the
raw material is locally procured, so that it (raw material) can be processed as soon as possible
after it is picked. Personal considerations is also a very important industrial location variable in
the study area. The variable influences decision making by indirectly affecting cost, partially
demand; and/or providing non-pecuniary rewards (Greenhut 1956). Hamilton (1974) also notes
that the choice of location is usually a non-issue for small-scale entrepreneurs initially
establishing an industry. Often the entrepreneur begins to operate his business in his home
town. Similarly, North (1974) argues that a familiar environment and long standing contacts arc
crucial in the initial success of a new firm so that the possibility of opening a factory in another
area is rarely considered.
Some o f the personal considerations influencing the location of industries in the study
area include:
(i) Nearness to home - Some of the entrepreneurs noted that location near home
meant a familiar environment which was neighbourly. Moreover, nearness to
home helped to maintain the socio-economic set up and reduces transport costs

177
between place o f work and place of residence. Th:s is a personal cost-rcduang
factor (Greenhut 1956).
(ii) Contacts - industrialists indicated that they tended to locate in certain places in
Kisii District due to the fact that they had formed contacts with customers which
promoted their sales. Thus, they had access to the local market which increased
their sales. This access to local market can be considered as a personal revenue-
increasing factor since it indirectly influences sales {Greenhut, 1956).
(iii) Another factor related to personal preferences of the ind : stria lists was that of the
availability of local capital. This is a personal cost-reducing factor,
Entrepreneurs noted that initial capital was not easy to come by, Thus,
industrialists tended to locate in areas where they could locally mobilise capital
through such sources as friends, and families. Onyemelukwe (1974) notes that
successful capital mobilisation for businesses is frequently not through formal
financial institutions, but through informal sources, especially within the
entrepreneur’s extended family circle and friends. Thus, even when an
entrepreneur desires to establish his enterprise in another town that seems to offer
better promise of industrial profitability, capital immobility may discourage long
distance movement away from one’s people (Opondo 1989).
The second factor accounts for 17.2% of the total variance in the original data set. It
has been labelled market accessibility. Market accessibility is an important factor largely due
to the desire among industrialists to reduce transport costs for both raw materials and fimshed

178
products and/or minimises losses. This is an important consideration especially in Kish Distn
where roads are poor and become impassable during the rainy season. Some of the industn
in the District manufacture finished products that are bulky and fragile, for example, the st:
drinks and furniture and fixtures industries. These industries are market orientated. Some
the industries (for instance bakeries) produce perishable products (bread and cakes). Su<
industries are located near the market so that the products can be readily consumed before th<
go bad. Figure 25 shows the industrial centres in Kisii District. Figure 26 shows a do
relationship between the location of industrial centres and the road network of Kisii District.

J r j
FIGURE 25: INDUSTRIAL CENTRES IN KISH DISTRICT

ISO
, |(a-KK 26: ROAD NETWORK AND QUA l |T , T( lOL'Al ION IN KISH DISTRICT VE f N I J lS i iU A I .
t

181
Factor three accounts for 12.4% of the variance :n the original data set and has txrcn
labelled industrial support infrastructure-cum-urban economics. This factor is especially
important among those industries located in urban areas in Kisii District for example. Kisii.
Keroka, Nyamache, Ogembo towns etc. Industrial support infrastructure such as power supply,
land availability, and a good transport and communication network plays an important role in
influencing industrialists to locate in urban areas. Power supply in most cases implies relatively
higher volumes of production within a short time since machines can be used {assuming they
are available and/or industrialist can afford to purchase them). Currently there is a high demand
for power among industrialists in Kisii District, which (demand) has not been met by the rural
electrification programme. The leading industrial centres are those that arc supplied with power
(Figure 27).

HCl’KK 27: POWLR SUPPLY AND INDUSTRIAL I.OC'A I ION IN KISIIIHSTKICT
t I M S t .
— — .- r »i*'f• (■ rC1 * 1 * cn p ; f j

183
L and availability is an important variable influencing loo t,on of industries m K,s„
District. T h is is due to land scarcity in the District. This scarcity ,s related to high dem and for
it arising ou t o f the high population totals (projected at 966,428 in 1994) and growth rates
(3.5% p er annum . D istrict Development Plan 1994-1996) in the study area. Land is an essential
prerequisite fo r industrial development. Factories, offices, and stores arc established on the
land. It is a lso useful for parking and for future expansion. In urban areas o f Kisii D istrict,
urban economies seem to piny an important role in influencing the location of aero-based
industries. When interviewed, industrialists indicated that such factors as availability of banking
services, security, insurance in combination with other advantages of urban areas, (such as
power supply and a better transport network), play a role in their location decisions.
Factor four explains 8.9% of the variance in the original data set. This tripolar factor
has been labelled, government influence-cum-labour-water supply. The factor contributes least
to the variance in the original data set and by extension, the constituent variables do not play a
very significant role in the location of agricultural manufacturing industries in Kisii District.
Government influence in the study area has not been very strong. The government has been
trying to encourage industrial development through the Kenya Industrial Estates Limited (KID
and through e n c o u r a g i n g kali activities. The KJE provides premises for industries, (for
instance, the KIE bakery in Keroka town), as well as financial assistance to viable industrial
Projects. A ju a kali shed has been constructed in Kisii town through government aid. Local
politics have played some role, (albeit insignificantly), in the location of agro-based industries
in the District. The most notable case(s) is in the tea industry. All the tea factories visited
indicated that local politics was very important in their location, labour supply is not a very

184
important consideration in Kisn District. The type of labour that is required by most industries
in the District (semi-skilled and unskilled) is readily available especially m Km. town and other
urban centres where rural-urban migration has led to rapid population increase. In cases where
industries require highly skilled (mainly managerial) labour, this can be sought from the District
and/or other parts of Kenya. Water supply is also not very important as an industrial location
variable. The establishments that require water, for instance, flour millers, meat processing
establishments, soft drinks processing establishments, etc. can easily obtain it from nearby local
sources.
5.5 HYPOTHESIS TESTING
, The null and alternative hypotheses are tested on the basis of results obtained from factor
analysis. The utility of the factor analysis procedure in hypothesis testing has been noted. For
instance, Johnston (1978:158) states:
"The search for hypothesised common patterns [in data matrices] is best conducted via the ... method of factor analysis"
He further notes that both the principal component analysis and factor analysis arc
"extremely flexible tools for finding order in large geographical data matrices, either inductively
or as test o f hypotheses" (Johnston 1978:181). Data analysis of research results indicates that
*e various variables influencing the location of agro-based industries can be meaningfully
summarised into four factors. These are outlined below.
Personal preferences;
Market accessibility;

(iii) Industrial support inffasmicture-cum-urban economies; and,
(jv) Government influcncc-cum-labour-wstcr supply
A close examination of the factors and their constituent variables indicates that they arc
essentially economic in character. The first three factors and almost all their constituent variables
are economic in nature. The fourth factor is socio-political and physical. The null hypothesis set
out at the beginning o f the study, that ‘economic variables are not the main determinants of the
location of agricultural manufacturing industries in Kisii District is therefore rejected, and the
alternative hypothesis that ‘economic variables are the main determinants of the location of
agricultural manufacturing industries in Kisii District is, consequently, accepted. The acceptance
of the alternative hypothesis is based on the analysis of research findings which indicates that
the four factors identified and their constituent variables are essentially economic.
5.6 IMPLICATIONS OF RESEARCH FINDINGS ON LOCATION VARIABLES
INFLUENCING AGRO-BASED in d u s t r ie s
Research findings indicate that the predominant variables influencing the location of 3gro-
based industries in Kisii District are essentially economic in character. These findings have
implications for planners and policy makers interested in determining the location of agro-based
industries in the study area and, consequently, influencing Kisii District's development. Some
of the location variables that are found to play a leading role in the location of industries can be
“sed as policy instruments to influence the location of these industries. In the study area, such
variables include, inter alia, availability of raw materials, personal considerations, nearness to
185
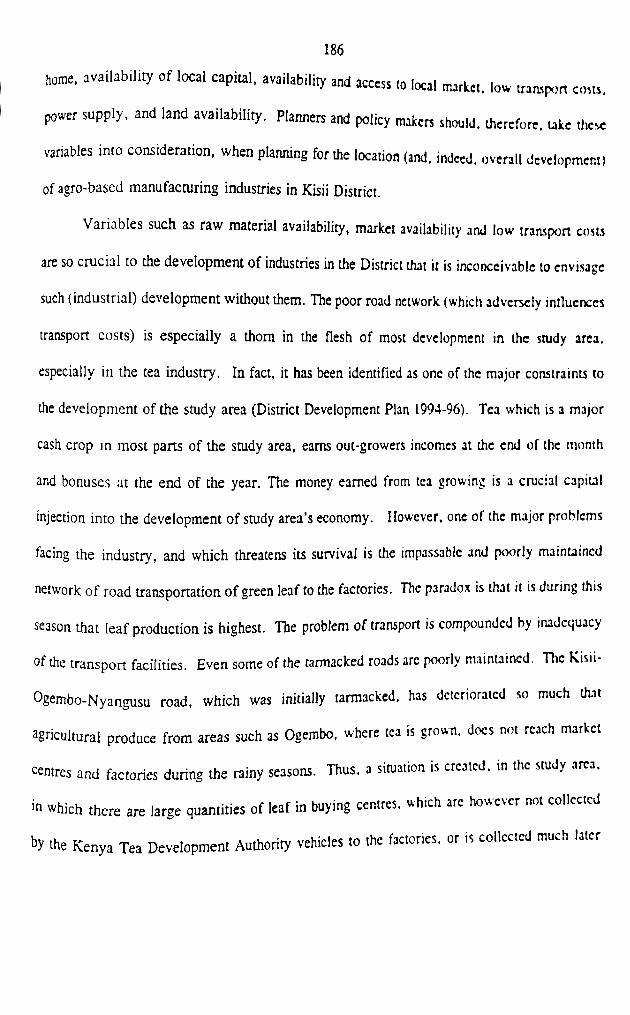
186
home, availability of local capital, availability and access to local market, low transport costs,
power supply, and land availability. Planners and policy makers should, therefore, take these
variables into consideration, when planning for the location (and. indeed, overall development)
of agro-based manufacturing industries in Kisii District.
Variables such as raw material availability, market availability and low transport costs
are so crucial to the development of industries in the District that it is inconceivable to envisage
such (industrial) development without them. The poor road network (which adversely influences
transport costs) is especially a thorn in the flesh of most development in the study area,
especially in the tea industry. In fact, it has been identified as one of the major constraints to
the development of the study area (District Development Plan 1994-96). Tea which is a major
cash crop in most parts of the study area, earns out-growers incomes at the end of the month
and bonuses at the end of the year. The money earned from tea growing is a crucial capital
injection into the development of study area’s economy. However, one of the major problems
facing the industry, and which threatens its survival is the impassable and poorly maintained
network o f road transportation of green leaf to the factories. The paradox is that it is during this
season that leaf production is highest. The problem of transport is compounded by inadequacy
of the transport facilities. Even some of the tarmacked roads arc poorly maintained. The Kisii-
Ogembo-Nyangusu road, which was initially tarmacked, has deteriorated so much that
agricultural produce from areas such as Ogembo, where tea is grown, docs not reach market
«ntres and factories during the rainy seasons. Thus, a situation is created, in the study area,
in which there are large quantities of leaf in buying centres, which arc however not collected
by the Kenya Tea Development Authority vehicles to the factories, or is collected much later

187
after it is picked. The transportation vehicles are mostly unable to reach the buying centres
since, among other factors, the roads are impassable.
In essence, it is imperative that planning for the development of agricultural
manufacturing industries in Kisii District, take into account, among other things, the variables
that play a significant role in the location of such industries. This is due to the fact that location
decisions of manufacturing (and other economic activities) play a major role in regional and
indeed (overall) national development.

183
CHAPTER SIX
STRUCTURE OF AGRICULTURAL MANUFACTURING
INDUSTRIES IN KISII DISTRICT
6.1 INTRODUCTION
This chapter examines a few selected industrial structural characteristics of agricultural
manufacturing industries in Kisii District. The stmctural characteristics examined include:
(i) Predominant types of technology utilized;
(ii) Sources of the raw materials used;
(iii) Types of commodities manufactured;
(iv) Markets for the manufactured commodities; and,
(v) Scales of production
A number of hypotheses. will be tested in this chapter. These arc stated below as
follows:
3 1 o f industrial structure o f a b a s e dand on the basis o f their validation or
otherwise, the significance of the establishments in the study area has i

to
189
1. H„. m e differences between agro-based food and agro-based non-food
establishments, in tenns of technological orientation. are not
significant.
H, m e differences between agro-based food and agro-based non-food
establishments, in terms of technological orientation, arc
significant.
H0 The sources o f raw materials for both agro-based food and agro-based non-food
manufacturing industries are not significantly different.
H, The sources of raw materials for both agro-based food and agro-based non-food
manufacturing industries are significantly different.
3. H0 There is no significant difference in the types of commodities manufactured by
agro-based food and agro-based non-food industries.
Hi There is a significant difference in the types of commodities manufactured by
agro-based food and agro-based non-food industries.
4. H„ There is no significant difference between agro-based food and agro-based non
food industries in terms of markets for manufactured commodities.
H, There is a significant difference between agro-based food and agro-based non
food industries in terms of markets for manufactured commodities.

190
5. Ho The scale of production of agro-based fool and agro-based A u r ic s
is not significantly different.
H, The scale of production of agro-based food and agro-bascd non-food industries
is significantly different.
In this chapter, there is extensive reliance on, (i) descriptive statistics, especially, (i)
percentages, and (ii) chi-square (x*) as a non-parametric test, at the expense of other non*
parametric tests (such as the Kolmogorov-Smimov test, the Mann-Whitncy test, the Kruskal*
Wallis test, among others), which require data to be on the interval scale. Such requirements
could not be met because the data available from the field was largely on nominal and ordinal
scales.
6.2 TECHNOLOGICAL ORIENTATION
The type of technology employed in a manufacturing establishment is an important aspect
of industrial structure. It has been noted that technological orientation of a manufacturing
enterprise influences, among other things, the scale of production and, hence, volume of output
3s well as the capacity to generate employment opportunity (Wcgulo. 19S4). It is therefore
imperative that the type of technology predominant in any given are3. should be appropriate (for
instance, it should recognise the resource endowment of the given area). Kenya’s development
Plans have recognised the fact and state that among the several strategy of increasing
employment in the manufacturing sector, is the choice of appropriate technology (Kenya. 1978.
>983, 1989). In this study, technology has been examined in terms of the type that is

Co* f
191
predominant among the agricultural manufacturing industries in the study area, whether cap.tal
intensive or labour-intensive.
The significance of the distinction between capital-intensive and labour-intensive types
of production arises from the changing relations between costs and output found in the two types
of industries, In a labour-intensive industry, costs are mainly in the form of variable costs and
hence, total costs will tend to rise as output rises. In the case of a capital-intensive industry,
fixed costs form a substantial proportion of total costs and will tend to rise less rapidly than
output (Pearson 1969). This is illustrated by figure 28 A&B which represent a labour-intensive
establishment and a capital-intensive establishment, respectively.
costs are twice as high in establishment B as ine s ta b l i s h m e n t A. Costs arc represented b y the

192
lines, F C (fixed costs), TV C (total variable costs). TC (tom costs), and AC (average cost, At
low levels o f ou tput, for instance, 0 „ establishment A can produce at a low er average cos, than
establishm ent B , bu t as output rises, establishment A ’s average cos, show little change whereas
establishm ent B ’s d ro p sharply so that at high levels o f output, (for example 0 ;). average costs
in B are well below those in A.
If the amount to be sold was fixed at Ot, then A can undersell B and B*s advantage at
higher levels of output is unattainable. Given that the amount to be sold is determined bv the size
of the market and that markets in developing countries tend to be small, industries will only be
established in these countries if they are relatively labour-intensive or if they can sell their
products outside the domestic market. Thus, another distinction between labour-intensive
production and capital-intensive production is that the former is mainly dependent on the
domestic market while the latter is export market orientated. Capital-intensive industries
established in developing countries will generally find the domestic market in those countries too
£Dsmall to enable,operate at levels of output high enough to ensure minimum costs (Pearson
1969:65), Consequently, the market for manufactured commodities can be used as a criterion
for establishing the technological orientation of industries. Accordingly labour-intensive
industries are identified with the domestic (local) market production and capital-intensive
industries with export market production. This study has adopted the market for manufactured
commodities criterion in analyzing the predominant types of technology.
’According to Pearson (1969) there is an exception to the identification o f labour-intensive Production with the domestic market. This is ttfo u n d in the case of industries producing for both the domestic (local) market and the export marketindustries (after the Roman two-headed god who could see bot p f
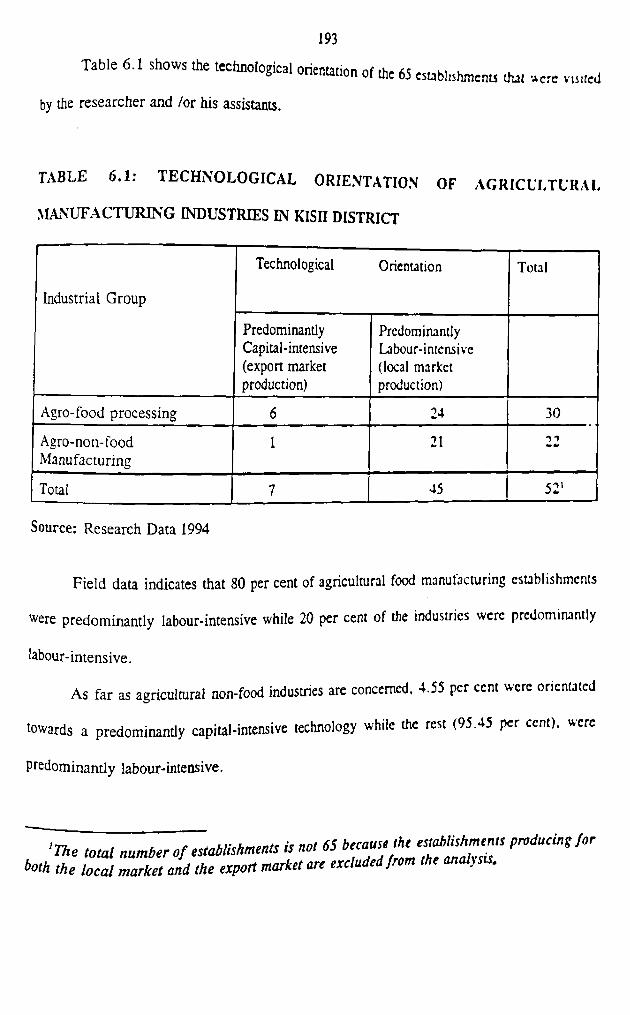
193
T ab le 6 .1 show s the technological orientation of the 65 establishments that -Acre vts.ted
by the researcher and /or his assistants.
TA BLE 6 .1 : T E C H N O L O G IC A L O R IE N T A T IO N O F A G R IC U L T U R A L
M A N U F A C T U R IN G IN D U STR IES IN KISII DISTRICT
Industrial Group
Technological Orientation Total
Predominantly Capital-intensive (export market production)
Predominantly Labour-intensive (local market production)
Agro-food processing 6 24 30
Agro-non-foodManufacturing
1 21 n
Total 7 45 52'
Source: Research Data 1994
Field data indicates that 80 per cent of agricultural food manufacturing establishments
were predominantly labour-intensive while 20 per cent of the industries were predominantly
labour-intensive.
As far as agricultural non-food industries are concerned, 4.55 per cent were orientated
towards a predominantly capital-intensive technology while the rest (95.45 per cent), were
predominantly labour-intensive.
I'ru . t . . uuehmntK iv not 65 because the establishments producing forThe total number of establishments is not oo , ,both the local market and the export market are excluded from the analysis.

In total, 13.46 per cent of the establishments visited were predominantly capital-intensive
while 86.54 per cent were predominantly labour-intensive. Figure 29 shows the technological
orientation of agro-based industries in Kisii District.
194

195
ig u r e : 29
K E Y
A .F.P. Agro -/ood proeetiitnfl
A.N.F.M. , A 9r o - n o - / » «
Predominonfly C o p i t o ^ ' " 1* " * i,,f
predomtnontfy L o b o u * »M*r.»!*•
predominontly CopHoi Predcminontly
s * « .

196
It is also of interest to this study, to determine the extent to wind. the p a ren t
differences between agro-based food and agro-based non-food establishments, in terms of
technological orientation, are statistically significant. For instance, research findings indicate
that the proportion of agro-based food industries that arc predominantly capital-intensive is
higher than that of agro-based non-food industries. On the other hand, the proportion of agro-
based non-food establishments that is predominantly labour-intensive is higher than that of agro-
based food establishments.
6.2.1 HYPOTHESIS TESTING
To test the significance of the differences noted above, chi-square, a non-paramctric test,
has been utilized. The null hypothesis to be tested states that,‘the differences between agro-based
food and agro-based non-food establishments, in terms of technological orientation, arc not
significant. ’ The alternative hypothesis states that ‘the differences between agro-based food and
agro-based non-food establishments, in terms of technological orientation, arc significant .
Table 6.2 shows the observed and expected frequencies.

197
TABLE 6.2: OBSERVED AND EXPECTED FREQUENCIES
Industrial Group Technological Orientation
TotalPred. Cap. Intensive
Pred, Lab. Intensive
Observed Expected Observed Expected
Agro-foodprocessing
6 4.04 24 25.96 30
Agro-non-foodManufacturing
1 2.96 21 19.04 ■n
Total 7 45 52
Pred. = Predominantly Lab. = Labour Source: Research Data 1994 Cap. = Capital
Using the above data, x2 is computed as follows:
(6-4.04)2 (1-2.96)2 , (24-25.96)2 (21 - 19.04)24.04 + 2.96 25.96 19.04
= 2.6
At 0.05 significance level and with one degree of freedom, the calculated chi-squarc
value of 2 .4 is less than the critical value of 3.84. TVrcfore the alternative hypothesis that 'the
differences between agro-based food and agro-based non-food industries, in terms of
technological orientation, are significant’ is rejected and instead the null hypothests that ’the
differences between agro-based food and agro-based non-food industries, in terms of
technological orientation, are not significant is adopted.
Research results can be summarised as follows:
prance of labour-intensive technology in (0 Apparently, there is a preponder
agricultural manufacturing industries in Kisii Di

198
(ii) T h e p roportion o f agro-based food industries that is both predominantly | lh .w -
intensive and capital-intensive is higher than that of agro-hascd non.fu.xl
industries.
Some of the possible explanations for this situation include:
1. Some of the industries in the study area, especially agro-based non-food such as
most furniture and fixtures establishments, spinning and weaving industries, etc.,
are labour-intensive. Among the reasons for this include the nature of the
products made. The nature of the products in these industries such as beds,
tables, stools, sofa sets, mats, baskets, etc, must be made in as many different
designs as possible. This can be accomplished by use of human labour,
? Furthermore, labour is relatively cheap in Kisii District and this encourages the
utilization of a technology that is predominantly labour-intensive. Moreover,
some parts of the District are inaccessible to power (electricity) to enable the
utilization of machines, such as lathe machines which are used in the furniture
and fixtures industry. 2
2- Factory processes in some of the industries (especially food processing) such as
tea , coffee, bakeries, saw milling, grain milling, soft drinks and carbonated
water, by nature require the use of machines. Moreover, the raw m aterials for

199
these industries are bulky and therefore they must mamtam a g.ven level of
output, after a given period of time, which (output) can only he attained by using
machines.
6-3 SOURCES OF RAW MATERIALS IJm T 7m
The sources of raw materials utilized by agricultural manufacturing industries in Kisu
District is another important attribute of industrial structure. In situations where largely
imported raw materials are used in manufacturing enterprises in a given areal unit, such a unit
is not likely to develop internally, ceteris paribus. This is because the materials arc likely to
cost the areal unit a lot in terms of financial resources, which (resources) could be devoted to
development. On the other hand, in cases where largely local raw materials arc used by
establishment(s) in an area, the people of that area are likely to cam incomes which mas
ultimately be used in the development of the given area.
Table 6.3 below shows the sources of raw materials for agricultural manufacturing
industries in Kisii District.

200
TABLE 6.3: SOURCES OF RAW MATERIALS UTILIZED BY AGRICULTURAL
MANUFACTURING INDUSTRIES IN KISII DISTRICT
Industrial Group Source of Raw Material Total
Local Other Parts of Kenya
Local and Other Parts of Kenya
Agro-foodprocessing
28 3 2 33
Agro-non-food Manufacturing
21 2 9 32
Total 49 5 11 65
Source: Research Data 1994
Research results indicate that 84.85 percent of agricultural food manufacturing industries
obtain their raw materials locally. 9.09 per cent of the industries obtain their raw materials from
other parts of Kenya while 6.09 per cent obtain from local as welt as other parts of Kenya.
In terms of agricultural non-food industries, 65.63 per cent obtain their raw materials
from Kisii District, 6.25 per cent from other parts of Kenya, while 28.12 per cent obtain their
raw materials from both local and other parts of Kenya.
In total, 75.38 per cent of the establishments interviewed obtained their raw materials
from Kisii District, 7.69 per cent from other parts of Kenya while 16.93 per cent of the
establishments obtained their raw materials locally and from other parts of Kenya. Apparently,
‘ re are differences, albeit small, between agricultural food and agro-based non-food

201
m anufacturing. F o r instance, the proportion of agricultural food establishments that ob.atn .h e r
raw m aterials bo th locally and from other pans of Kenya is higher than that o f agncultural non-
food establishments.
6.3.1 H Y P O T H E S IS T E S T IN G
To test the significance of the differences observed, the chi-square (x:) test has been
utilized.
The null hypothesis states that ‘the sources of raw materials for both food and aero-based
agro-based non-food manufacturing industries are not significantly different.’ The alternative
hypothesis states that ‘the sources of raw materials for both agro-based food and agro-based non
food manufacturing industries are significantly different.’
Table 6.4 shows the observed and expected frequencies.

202
TABLE 6.4: OBSERVED AND EXPECTED FREQUENCIES
Industrial Group
Source of Raw Murr,.,!
TotalLocal Local and Other Parts1
Observed Expected Observed Expected
Agro-foodprocessing
28 24.88 5 8.12 33
Agro-non-foodManufacturing
21 24.12 11 7.88 32
Total 49 16 65Source: Research Data 1994
Using data above, chi-square is computed as follows:
(28-24.88)2 (5-8.12)2 (21-24.12)2 (11-T8S)124.88 + 8,12 + 24.12 7.88
= 3.23
At 0.05 significance level and with one degree of freedom, the calculated x1 value is 3.-3
while the critical value is 3.84. The null hypothesis that 'the sources of raw materials for both
food and agro-based non-food manufacturing industries are not significantly different is
accepted.
Research data clearly indicates that agricultural food and agricultural non-fond indus.r.cs
predominantly obtain their raw materials from the study area. This is most likely due to the
nature of the raw materials of the industries in question. Most of these (raw ma.criais) arc
'This category has been amalZam* f? J nd, Z7goriefOee i Z ' u Z T This amalgamating Kenya and ‘Local and Other Tarts ° f Keny J m wi!h morc observ ations so that thehas been necessitated by the desire to pro f nql„rcd bv the chi-square non-‘*pected frequencies in each celt is higher than 5, as reqParametric test

203
5ulky, for example, coffee, grains, wood, meat, etc. Hence high importation cost, are likely
to be incurred if the raw materials were obtained from a source distant from the factories
Moreover, some of the raw materials such as tea leaves lose quality if not transported to the
factories in good time. In fact the local availability of raw materials variable is one of the mo* t
important variables influencing the location of most industries in Kisii District, as noted
elsewhere.
It will also be observed from the research results that some industries obtain their raw
materials from other parts of Kenya-apart from Kisii District. This applies to cases where the
raw materials are not locally available (in Kisii District). For instance, bakeries utilize mainly
wheat flour which is obtained from other parts of Kenya. Other industries which rely on raw
materials from external sources include, spuming, weaving, textiles, knitting, etc. Other
industries such as saw milling and furniture and fixtures depend on both local and external
sources for their raw materials. Figures 30 and 31 show the sources of raw materials for agro
based food industries and agro-based non-food industries.

FIG 3 0 SOURCES
CD
F I G - 3 1 .SOU R C E O F R A W M A T E R IA L FOR A G R 0 - 5 A S E D NON FOODI N D U S T R I E S IN K IS H D I S T R I C T
Source : Bo*ed on r t t e a r c h d o l a , 1994

205
6A MANUFACTURED C O M lunnrriES AND T trr[R NtAPkFT<:
6.4.1 T Y P E S O F C O M M O D IT IE S MANUFACTURED
T he types o f products manufactured by industries is a sigmfican, indus.ru! structural
aspect. T o facilita te equitable regional development, manufacturing activities should be
represented in the production of consumer commodities, intermediate commodities as well :s
export commodities.
One o f the approaches for studying industrial structure, from the point of view of the
types of commodities manufactured, is the ‘export base model'. The model involves making a
distinction between industries producing for the local use and those producing for the external
market. The basic industries are those that produce for export while those that serve the local
market are termed as non-basic industries. Once the problem of separating export production
from local production is overcome, the total figures for value of production or employment m
the basic and non-basic sectors, can be calculated for any city or region. The basic/non-basic
(B/N) ratio can be determined (which takes the form of l.X, where X is the non basic
employment divided by basic employment). The model suffers from some limitations. As already
noted, a tech n ica l p roblem m ight be encountered in making a distinction between baste and non-
basic goods. Moreover, the B /N ratio is a purely descriptive device and has no value in itself
i" explaining w hy specific industries are represented as they are in particular cities or regions.
This m odel has no t been adopted in this study due to the fact that aside from its own limitations.
„ i orrminvment figures for basic md non-basicaPpropriate data (that is, value of production, emp y
industries, etc.) were not available.

206
According to Barker et al (1973), the types of commodities manufactured by an industry
may be disaggregated into:
(i) mass consumer goods;
(ii) luxury consumer goods;
(iii) goods manufactured for export; and,
(iv) intermediate capital goods.
In this study, the types of products manufactured by the agro-based industries in Kisii
District have been grouped into three major categories, namely: consumer goods, intermediate
goods, and export goods.
Table 6.6 shows the types of goods manufactured by agricultural food and 3a
non-food industries.
TABLE 6.5= T Y P E S O F PRODUCTS MANUFACTURED BY AG RO -BASED
M A N U F A C T U R E INDUSTRIES IN KISII DISTRICT
Source: Research Data

207
Research data indicates that 69 70 Derr^nt ^ ,'U Per Cent of “gncultural food manufacturing mdustrtcs
process and/or fabricate consumer goods. 18.18 per cent of the industries produce export good,.
while 12.12 per cent manufacture both export and consumer goods. None of these tndustncs
produces intermediate goods.
As far as agro-based non-food industries are concerned, 65.62 per cent produce consumer
goods and 34.38 per cent manufacture both export and intermediate goods. None of these
industries manufactures purely export and intermediate goods.
In total, 67.69 per cent of agro-based industries manufacture consumer goods. 9.23 per
cent manufacture export goods, 6.15 per cent export/consumer goods and 16.92 per cent of the
establishments manufacture export/intermediate goods.
6.4.1.1 HYPOTHESIS TESTING
It is of interest to this study to determine the extent to which the apparent differences between
agro-based food and agro-based non-food industries, in terms of the types of goods
manufactured, are statistically significant. The chi-square non-parametric test has been used to
determine this.
The null hypothesis to be tested states that ‘there is no significant difference in the types
of commodities manufactured by agro-based food and agro-based non food industries'. The
alternative hypothesis states that ‘there is a significant difference in the types of commodities
manufactured by agro-based food and agro-based non food ind
Table 6.6 shows the observed and expected frequencies.

208
TABLE 6 .6 : O B S E R V E D A N D EXPECTED FREQUENCIES
Industrial Group
Types of Goods
TotalConsumer Goods Export/ Consumer/ Intermediate Goods1
Observed Expected Observed Expected
Agro-foodprocessing
23 22.34 10 10.66 33
Agro-non-foodmanufacturing
21 21.66 11 10.34 32
Total 44 21 65
Source: Research Data 1994
The computation of chi-square is as follows:
(3-22.34)2 (10-10.66)2 , (21-21.66)2 (11-10.34)22 2 3 T + T O T + 2 iM ~ io .34
= 0.12
At 0.05 significance level and with one degree of freedom, the calculated chi-square
value is 0 .12 while the critical value is 3.84. Therefore the null hypothesis that 'there » no
significant dtfference in the types of goods manufactured by both agro-based food and agro-based
non-food industries’ is accepted. The apparent differences between the two categories of
industries are most likely due to chance. *
* , cells with more observations and hence‘Categories have been combined fo p ro d aw requirements of chi-square test.
Sher expected frequencies (higher than 5) to M "

209
Research results clearly indicate a preponderance of consumer goods among the types of
goods produced by the agro-based food industries and agro-based non-food establishments (see
figures 32 and 33).

210
FIG U R E32: T Y P E S O F PRODUCTS/COMM ODITJESM AM F A C T! BI T )
BV AGRO-BASED FOOD ESTABLISHMENTS IN KISII DISTRICT
FIGURE 35: TATES OFPRODUCTS/COMMODITIKSMANLTACTl RHI)
BY AGRO-BASED NON-FOOD ESTABLISHMENTS IN KISII DISTRICT
S ou r c e : 6 o se d on r e s e a reft d o t o , 199^

211
Some of the industries that are well represented in the consumer goods sector include:
grain milling, furniture and fixtures fabrication, manufacture of wearing apparel, bakery
products, meat products, etc. This can be explained by the fact that the types of g<xxls
produced by these industries respond faster to consumer demand and therefore generate more
profits. Moreover, these industries are easy to initiate since they require little capital, compared
to the export and intermediate goods sectors. Capital is a very essential prerequisite for industrial
development especially, in developing countries, including Kenya. There are two types of
capital, fixed capital and financial capital. Financial capital refers to the money needed to
establish and manage an industrial establishment while fixed capital is the fixed capital
equipment, such as land, machinery, buildings, and other kinds of physical plant.
Immediately after independence, The Kenya Government realized the need to develop a
financial infrastructure capable of providing a base for industrial development.
encouraging the growth of commercial banks, non-financial institutions and insuranc P*
the Government embarked on a deliberate policy of establishing development finance msmut.ons
to specifically promote industrial development in the country. Some
to.lopm.rn Fio.no, Cnmp.n, <0™ - l*'.l»pmc«
o , Kenya < , O C > , « > * * ' * - » - “ ~ “ “ “, , ,^,1 c.fates Limited, which was established at
Estates Limited (HE). The Kenya Industrialriv*nreneurs with opportunities to enter into the
independence to provide small indigenous en p• in the study area. It provides premises for
manufacturing sector, is especially importan• vprnka town), as well as financial assistance to
industries, (for instance, the H E bakery in
viable industrial projects.

The export commodities sector is not whi jnot well represented especially among the agricultural
non-food manufacturing sector. It would annear that fl0m ,appear mat agro-based non-food establishments that
produce export-cum-intermediate commodities and not export productsptr se. Tins is especially
the case with saw milling establishments, hides and skins and some furniture and fixtures
establishments. On the other hand, some agro-based food establishments produce solely for
export to other regions outside the study area. This category includes coffee and tea processing
establishments. Most o f the processed tea is sold to Mombasa from where various agents export
to other parts of the world including Europe, Middle East, and Africa. Coffee beans arc
exported from Kisii District to Nairobi for further processing and then exported to other parts
of the globe
The intermediate goods sector is not well represented among the industries that were
visited. This is probably due to the fact that more working capital is involved in the production
of intermediate goods than other sectors for example the consumer goods sector. Moreover, in
the short run, the profit margins from intermediate goods are relatively less.
The export-cum-consumer goods sector is represented by agro based food processing
establishments. Industries included in this category were bakery products processing, fruit juice
making, as well as soft drinks and carbonated water. These industries sell their products in Kisii
District as well as other neighbouring Districts such as Nyamira District. *•
212
*•4.2 M A R K E T S F O R M ANUFACTURED COMMODITIES
. r/vslirK 0f industries has implications for regional A study of markets for manufactured p
. . there is need to manufacture bothdevelopment. Ideally, for purposes of regional deve p

213
for export and for local (internal) use,
paribus, through:
This is likely to facilitate regional development, e a r n s
(1) generation of income from exported goods. Such income may be used to unprove the
standards of living of the people in the study area, through, say. investment of income
in the productive sectors of the study area’s economy. Such income may also be used
to procure goods and services not available in Kisii District;
(2) satisfaction of local (regional) wants through goods produced for the local market; and.
(3) savings of foreign exchange made possible by local manufacture (some type of import-
substitution).
Table 6.7 below shows research results as far as the markets for manufactured products arc
concerned.
TABLE 6.7: MARKETS FOR MANUFACTURED PRODICTS 01* AGRO-BASM)
e v d u s t r ie s IN KISII DISTRICT

214
Research results indicate that 72.72 percent of all agro-based food industries produce for
the local market (Kisii District). 18.18 per cent of the industries produce for die external
market, while 9.09 per cent produce for the external and local market.
As far as agricultural non-food industries are concerned, 65.63 percent manufacture for
the local market, 3.13 per cent for the external market, while 31.25 per cent of the
establishments produce both for the external and local market.
In total, 69.23 per cent of the establishments interviewed in the study area produce for
the local market. 10,77 per cent manufacture products for the external market w hile 20 per cent
of the establishments produce for local and external markets.
6.4,2.1 HYPOTHESIS TESTING
There are apparent differences between agro-based food and agro-based non-food
establishments in terms of markets for manufactured goods. For instance, more agro-based food
industries produce for the local and external markets than agro-based non food
the other hand, more agro-based non-food industries produce for the local-cum-csport markets
than agro-based food industries. To determine the significance of these differences, the chi-
square non-parametric test has been used.. , no Sienificant difference between
The null hypothesis to be tested states tha, M industries in terms of market for manufactured
agro-based food and agro-based non-foodh . .,>.ere is a significant difference between agro-
Products.’ The alternative hypothesis states th• in rerms of market for manufactured products
based food and agro-based non-food industries
Table 6.8 be,..

215
TABLE 6.8: O B S E R V E D AND EXPECTED FREQUENCIES
Industrial Group Market For Goods TotalLocal Local / External'
Observed Expected Observed ExpectedAgro-foodprocessing
23 22.34 10 10.66 33
Agro-non-foodManufacturing
21 21.66 11 10.34 32
Total 44 21 65
Source: Research Data 1994
The chi-square value is computed below:
(24-22.85)2 , (9-10.15)2 , (21-22.15)= ^ (11-9 35)=22.85 + 10.15 + 22.15 9.85
= 0.38With a significance level of 0.05 and one degree of freedom, the calculated x: is O.j S
The critical x= value is 3.84. The null hypothesis that 'there is no significant difference between
agro-based food and agro-based non-food industries in terms of market for manufactured
products’ is accepted.
Data from the field suggests that both agro-based food and agro-based non-f«M
establishments process and/or fabricate goods mainly for local market (sec figure j 3). D us
would be explained in the light of the fact that most industries operate at a very smal, scale.
Producing mainly for the local market, for instance, grain milling, furniture and fixtures, meat
products processing, sugar processing and so on,The desire to operate at a small scale by most
. a p fewer cells wM more observationsCategories have been combined to pro uc requirements of the chi-s
?her expected frequencies (higher than S) to J W
a n d h e n c e square test.

216
of the i n d u s t r i a l i s t s is r e l a t e d t o v a r io u s fa c to rs , imeralia. lack o f su ffic ien t capital r e v . w o .
lack o f p o w e r ( e l e c t r i c i t y ) to f a c il i ta te la rg e sca le p ro du ction a n d lack o f th e necessary
entrepreneurial knowledge and skills.
Some of the industrialists interviewed produced exclusively for the external market. Tins
was especially the case with agro-based food processing industries, including coffee and tea
processing, This can be partly explained in terms of the need for further processing of the
produce, as in the case of coffee processing where coffee beans are sent for further processing.
Explanations can also be couched in terms of the apparent lack of local market as well as the
desire to gain external revenue, as is the case with tea which is transported to Momhasa for
export to various parts of the world, including Europe, Middle East and Africa.
It will be noted that some establishments interviewed sold their products in both local and
external markets. Establishments in this category included, bakery products processing,
drinks and carbonated water, fruit juice making, saw milling and furniture and tixturcs
establishments. This can be explained in terms of the desire to capture both local and externa
markets so as to increase profit margins.

F,CURE M :N IARKETSFORMtot KAt.a ,i|;|,|,|iolil.( .is ( i r i ( i ! i i
BASED IN D U S TR IE S IN KISII DISTRICT
AFP = A.N.F.Hr
A9ro-b»« «..« f '" '” 1"’A9ri^»4
ATP
Local market
External market
Local /external 'T*arhet
anFMLet el mvW*
market
LocaI/«»ttrn*1 0'**'l*,
So urce : Based on r e s e a rc h do1994

6.5 SCALE OF PRODUCTION
This is the final industrial structural characteristic examined in this chapter.
The scale of production of an industry determines how many people arc and/or can be employed
by that industry. Scale of production is closely related to technological orientation and both have
ramifications for socio-economic development of a region and/or nation, because they, inter alui,
influence employment levels. There are several indices that can be used to measure scale of
production. This study has used an index that is commonly used in Kenya, that is, the number
of operatives engaged. Accordingly, the various industrial establishments in Kisii District have
been categorized as follows:
218
(i) 1 - 4 Very small
(ii) 5 - 1 9- Small scale
(iii) 20 - 49 ^
(iv) 50 - 99 ,
(v) 100 - 199 Medium scale
(vi) 200 - 499 -
Table 6.9 shows the scale of production of agro-based industries in Kisii District.

219
TABLE 6.9: SCALE OF PRODUCTION' OF AGRO-BASED INDUSTRIES IN KISH
d is t r i c t
Industrial Group Scale of Production
Total1 4 5-19 20-49 50-99 100-199 200499Agro-foodprocessing
20 6 2 2 - 3 33
Agro-non-foodmanufacturing
15 7 6 1 3 - 32
Total 35 13 8 3 3 3 65
Source: Research Data 1994
Research data indicates that 60.61 per cent of alt agro-based fcxxl manufacturing
establishments each employs 1-4 operative(s). 18.18 per cent of the establishments each cmplov-s
5-19 operatives, while 6.06 per cent^employs 2049 operatives. Another 6.06 per cent of the
establishments each employs 50-99 operatives. The 100-199 operatives catcg< ry
establishments is not represented in the agro-based food processing industry. 9,09 per
the establishments employ 200499 operatives each.
The p ro p o rtio n o f .g r o - b » d . * ! « — » « « J
recounted fo r 4 6 ,8 8 percent. 21 -S3 p«r cent of rfieestablisftmcnts each em ploy. 5TO rperarher
» « . 1 8 .7 5 p e , cent „ e h e n rp l.f .
e s ta b l i s h m e n ts i s r e p r e s e n te d b , » 3 « * — “ m m ' “
----------------------------------------------------------------- a • <Uktries is measured in terms the number ofThe scale o f production fo r agro-base in . various categories such as Mrtves engaged. The operatives have been grouped Hives, 5-19 operatives, 20-49 operatives,

220
represented by 9.38 per cent. None of the establishments employ opera.,v« m the
operatives category.
In total, 53.85 per cent of the establishments each employs I-I operatives. 20 per tent
and 12,30 per cent of the establishments each employs 5-19 and 20-49 operatives, respectively.
The 50-99, 100-199 and 200-499 operatives categories are each represented by 4.62 per ccr.t of
the agro-based manufacturing establishments.
6.5.1 HYPOTHESIS TESTING
To test whether there is any significant statistical difference between the various
categories o f industries in terms of the scale of production, the chi-square lest has been utilized.
The null hypothesis states that ‘the scale of production of agro-based food and aero-based
non-food industries is not significantly different.’ The alternative hypothesis states that the scale
of production o f agro-based food and agro-based non-food industries is significantly different.
Table 6.10 shows the observed and expected frequencies.

221
TABLE 6.10: OBSERVED AND EXPECTED FREQUENCIES
Scale of ProductionIndustrial Group Below 5 5-199' Total
Observed Expected Observed ExpectedAgro-foodprocessing
20 17.77 13 15.83 33
Agro-non-foodManufacturing
15 17.23 17 14.77 32
Total 35 30 65
Source: Research Data 1994The chi-square value is computed as follows:
(20-17.77)2 , (13-15.23)2 ^ (15-17.23)2 x (17-14.77)*17.77 + 15.23 17.23 14.77
= 1.23
At 0.05 significance level, and with 1 degree of freedom, the computed chi-squarc value
is 1,23 while the critical value 3.84. Therefore, the null hypothesis that ‘the scale of production
of agro-based food and agro-based non-food industries is not significantly different is a p
Research findings indicate a predominance of very small and small scale industries m
Kisii District (Figures 35 and 36). Some of the reasons put forward by the industrialist, to
explain why they operate at such very small and small scales include.
(0 lack o f sufficient financial resources,
------------------------------- . a fewer cells with more observations and henceCategories have been c o m b a t “‘foments of the chi-square test.r expected fr e q u e n c ie s to f u l f i l tne q

222
lack o f po w er (electricity) to enable large scale production, forinstance in some of the
furniture and fixtures industries;
(iii) lack o f sufficient market;
(iv) lack o f su fficien t raw materials, as was the case in fruit juice processing W ,
(v) ease with which small establishments are managed

223
FIGURE 35: SCALE OF PRODUCTION OF agrO-baski,
IN KISII DISTRICTIM)l SI KIES
FIGURE 36: SCALE OF PRODUCTION OF NON-AORO-IIASK!)
INDUSTRIES LN KISII DISTRICT
Source: Bosed on rese arch dolo p 199^

224
From the foregoing discussion of industrial iindustrial structural aspects the followmg ,unenarv
observations emerge:
(a) The type of technology utilized in both agro-based food and agro-based non-food
establishments in Kisii District is predominantly labour-intensive.
(b) The raw materials utilized by agro-based industries in Kisii District arc mamly
obtained mainly locally.
(c) Field results indicate that agro-based establishments manufacture predominantly
for the local market with little being manufactured for external markets. Hence,
little income is generated from exports to other regions. Such income is essential
since it can be invested in the productive sectors of the economy of the study
area, for instance, the agricultural sector. Such income can also be utilized to
purchase goods and services not available in the study area. It is essential to
(d )
diversify markets in order to attain regional development.
Agricultural manufacturing industries in Kisii District operate mainly at small
scale. This has negative implications in terms of the number of operatives these
industries can employ. However, it should be noted that.
(i) According to the ‘flexible specialization' model, small scale industries have .her
own specific niches, especially in developing countries. Accordingly, this role is
bound to increase for a variety of reasons. These include: the smaU
, , hilitv t0 be innovative, and both emrcpreneurially andestablishments’ assumed ability to De
organisationally flexible in their outlook (Milne 1991):

225
(ii) As long as the small scale industries expand horizontally, (that u. ihrough
integration with other establishments, both small and large stale, in terms of
subcontracting, outsourcing, and other linkages), employment oppo mini ties will
be generated.
Agricultural manufacturing industries in the study area produce mainly consumer
commodities, so that intermediate goods are not well represented in the categories
of goods manufactured.
6.6 IMPLICATIONS OF THE PREVAILING INDUSTRIAL STRUCTURE 0* KISH
DISTRICT’S AGRO-BASED INDUSTRIES
In evaluating the selected aspects of structure of agricultural manufacturing irvlustr.es in
Kish District, a major conclusion that can be drawn is that the selected aspects of structure of
t e e industries, tested in this study, are inappropriate and hence do no, seem ,o significantly
contribute to the desired kind of regional development. Views emanating from discuss,orvs ss r.h
industrialists and/or their assistants as well as individuals concerned with mdusmal dcselopment
in Kisii District tend to support this conclusion.^ _ nf technology utilized by various agro-based
It is apparent that the predominant type of- „ This implies that agro-based manufacturing
establishments in the study area is labour-mtensi •, fnr the study area which has a high
industries in K isii D istrict are a source of employmentxnd high population density (over 700 persons per sq.
population growth rate (3.6% per annum) potentialu f f he to ta l p o p u la tio n consis ts Of young p e o p le , a r o te . .„ a l
tel in 1994). About 50 per cent of the to ’ ^ ^ ^ agricu,rural sector.
labour force. Yet, employment opportunities in th

226
which has been a significant employer in the past, can no longersupport the increasing labour
the responsibility of absorbing the surplus manpower in order
coupled, in this case, with the usual rural to urban migration together with it, related problems
One other observation made on the basis of research results is that agro-based industries
in Kisii District mainly use locally available raw materials. In a situation as this, local people
are likely to earn some income which may ultimately be used to improve their standards of
living. This is a positive industrial structural characteristic, as far as the development of Kimi
District is concerned. For instance, the tea fanners in Kisii and Nyamira District earned Ksh.
1.4 billion in 1994*. However one nagging problem that has especially afflicted the tea industry
in the study area is related to transportation of the green leaf. There has been a lot of hue and
cry from farmers and leaders alike over delays in the collection of green leaf from the busing
centres. During the research period this writer noted with, a lot of concern, that some buying
Development Authority (KTDA) vehicles. This problem is especially acute when production is
high during the months of April, August, November and December. These dcla>s imply that
centres were going for up to three days without the tea being collected by the Kenya Tea
less income is earned by farmers monthly and from the annual bonus. Delays in leaf collection
have been attributed to lack of enough vehicles and impassable roads especially during (he
season. Clearly it is imperative thatthese problems are urgently addressed for the sake of
industrial and overall equitable development of Kisii District.
j n j t i s j l J m - ,7 th

227
In terms o f commodities manufactured, it has been observed dm .here » a preponderance
0f consumer goods. Export and intermediate goods are not well represented in the comm.xl.ties
produced. Such a scenario has negative implications in terms of equitable regional development
One such implication is that little is produced for export and hence little export earnings. Export
earnings are important since they can be invested in the productive sectors of the economy of
a region. For instance, in Kisii District, they (the earnings) can be invested in the industrial and
agricultural sectors. Moreover, export earnings can be used to purchase goods and services not
available locally in Kisii District, for example, intermediate/producer goods.
The intermediate goods category is not well represented in the industrial sector of the
study area, as already noted. This category of goods plays an important role because they
(goods), inter alia, could be used to produce other more high value goods. For instance, textile
goods can be used in the manufacturing of wearing apparel and sawn timber used
manufacture o f furniture and fixtures. This lack of sufficient representation of the intermediate
goods sector in Kisii District, is a serious flaw in the study areas industrial development.
(flaw) needs to be addressed by planners and policy makers and other relevant author,ties. One
possible solution is for the Government (through the relevant ministries and institutions such a,
■ f- mvtds This is because among theKIE) to subsidize manufacturers who produce mte
. • for n o t m a n u f a c t u r i n g e s p e c i a l l y
sentiments expressed by the industrialists and/or their• . canital input than consumer goods,
intermediate goods, is that these goods require m P• i 1 manufacturing establishments in Kisu DistrictIt has also been noted that agricultural manufactu
w Littie is produced for export. This implies that .m.cproduce mainly for the local market.
of regional development it is important toincome is generated from exports. For purpo

228
diversify the market of goods manufactured by industries. Ideally a balance should be forged
between production for export and production for the local market.
In terms o f scale of production, a disturbing conclusion emerges, namely, that agro-bascd
industries in Kisii District operate predominantly at both "very small scale" and a 'small scale*.
This has ramifications in terms of number of people these industries can and/or are able to
employ. In this case, agricultural establishments in the study area are not likely to be generating
adequate employment opportunities. Some of the possible solutions to this problem have been
addressed in the section on technological orientation. Apart from these, there is need for a
detailed survey, by researchers and planners, to determine the bottlenecks that hinder large scale
operations and in view of these (bottlenecks), solutions should be sought.
Appropriate industrial structural characteristics are, however, not a panacea for solving
all equitable regional development problems. Nonetheless, it is imperative that measures arc put
in place to ensure that all the relevant aspects (see pages i t — fa*?) of the industrial structure
of agro-based industries in Kisii District are attended to in order to contribute signific y
realistic equitable development for the sake of present generations and for posterity.
i

229
CHAPTER SEVEN
SUMMARY OF RESEARCH FINDINGS, REUSED CONTUSIONS
AND RESULTANT RECOMMENDATIONS
7.1 IN T R O D U C T IO N
This is th e concluding chapter o f this study. It deals with a summary of the research
findings, related conclusions and the resultant recommendations. The research findings,
conclusions and recommendations are provided in view of the objectives and hypotheses of the
study.
The main objectives of this study are outlined as follows:
h To describe and portray cartographically, die spatial industrial patterns of Kisii District
agricultural manufacturing industries; T •
2- To evaluate the nature of the variables th<U have influenced the location of agricultural*
manufacturing industries in Kisii District; and
To determine whether the agro-based industrial structure of Kisii District
significantly to regional development.
Ttle above o b jec tiv es have been recast into respective null hypotheses, a
'• There is n o sign ifican t agro-based industrial location in Kisii D istnc.

230
, E conom ic variables are not the main determinants of the location of ag, ,b a * d
manufacturing industries in Kisii District.
3. The d iffe ren ces betw een agro-based food and agro-based non-food establishments. ,n
terms of technological orientation, are not significant.
4. The sources of raw materials for both agro-based food and agro-based non-food
manufacturing industries are not significantly different.
5. There is no significant difference in the types of commodities manufactured by agro-
based food and agro-based non-food industries.
6. There is no significant difference between agro-based food and agro-based non-food
industries in terms of market for manufactured commodities.
7. The scale of production of agro-based food and agro-based non-food industries is not
significantly different.
7.2 RESEARCH FINDINGS ON:
7.2.1 INDUSTRIAL SPATIAL PATTERNS
t a r c l . fin d in g . d o * M M * « « * » “ >
“ m ufaew ring iadiK trks in Kisii D ia re i . TO* d K m u w d o i U*c t o . o '
® P l o y « » an d f e „ n . t e „ f ” ”a*a the highest percentage of total
manufacturing em ployment, the Municipality common• ,30.3397% and 8.6781 S) in agro-
enaployees in each category of agricultural manufac g• iv). Computed location quotient values
baSed food an d agro -based non-food mdusmes, respecti ^ Municipality- In
wdicated co n cen tra tio n o f agro-based food manufacturing w

231
terms of the n u m b er o f agro-based establishments in the study area Kisi
the divisions as w ell as K eroka Town Council. It had 55 establishments
area, Kisii M unicipality led all
• employing U60A a*
compared to the nex t nearest division, Marani with 27 establishments, employing 153 o p e ra te s .
7.2.2 IN D U S T R IA L L O C A T IO N VARIABLES
Data analysis of the industrial location variables was undertaken using the factor analysis
procedure of the principal axis type. The following are the findings that emerged.
Four factors made up of various constituent variables emerged as the most important in
influencing the location of agricultural manufacturing industries in Kisii District. The factors
include:
(i) Personal preferences;
(ii) Market accessibility;
(iii) Industrial support infrastructure-cum-urban economies, and
(iv) Government influence-cum-labour-water supply*
However, there are ot___
because they tended to cloud the results and/or their
location in the study area was indirect.
These factors
ir influence(s) on agro-based industrial

232
7.2.3 INDUSTRIAL STRUCTURAL CHARACTERISTICS
T . M k d * U U 0, K.sii ^ j t m | M
industries, manufacturers were interviewed on a few selected structural characeruncs.
The results were analyzed using descriptive statistics as well as chi-square as a non-
parametric goodness of fit test.
The following findings emerged from the analysis:
(a) The predominant type of technology utilized in both agro-based food and agro-based non
food establishments is labour-intensive;
(b) The raw materials utilised by agro-based industries are mainly obtained locally from the
study area;
(c) There is an overwhelming preponderance of consumer goods with little being
manufactured for export. Intermediate goods were also not well represented in the
categories of goods manufactured;
(d) Goods are mainly manufactured for the local market in Kisii District. Very few
industrialists interviewed processed and/or fabricated for the external mark
(e) Agro-based industries in the study area are predominantly of very small and small scales.
Medium scale industries are not well reputed and large scale indusmes arc no,
represented in Kisii District.

233
7.3 CONCLUSIONS BASED ON THE FOREGOING FINDINGS AND DIRECTLY FROM
THE FIELD:
7,3.1 INDUSTRIAL SPATIAL PATTERNS
Research findings clearly indicate that there is industrial localisation in Kisii
Municipality, as far as agro-based industries are concerned. It would thus seem that a core-
periphery type o f development pattern is prevalent in Kisii District. Kisii Municipality is the core
while the rest o f the District is the periphery. Although this development pattern is likely to be
subtle when compared with the core-periphery pattern operating at the national space economy,
it is nevertheless significant, in view of the fact that it implies polarisation which (polarisation)
is associated with inequalities.
7.3.2 INDUSTRIAL LOCATION VARIABLES
The most important variables influencing the location of agro-based industr.es in Ms,.
District can b e m eaningfully collapsed into fonr factors which have been identified as persona.
preferences, m ark e t accessibility, indnstria. support infrasnucturc-cum-urban cconom.c,
i These factors and their constituent variablesgovernment influence-cum-labour-water supp y*
. . t t r Thus it can be concluded Ihat the predominant variablesare essentially economic in character. Th ,
. , • Kisii District are mainly economic ininfluencing the location of agro-based industries
■ to tak e into a c c o u n t m a i n l y e c o n o m i c
character. The implication of this is that industna is
variables when establishing industries.

234
7,3.3 IN D U ST R IA L STRUCTURAL CHARACTERISTICS
In view of research findings, based on a few klelected variables, it is apparent that the
industrial structure of Kisii District agricultural ■ ■ *gnmiiurat manufactunng industries is largely centre-
periphery o r ie n ta te d and hence inappropriate for regional development.
7.4 R E C O M M E N D A T IO N S BASED ON BOTH THE FINDINGS AND RELATED
C O N C L U S IO N S :
7.4.1 IN D U S T R IA L SP A T IA L PATTERNS
I PLA N N ER S A N D PO LIC Y MAKERS
It is imperative that measures are taken to rectify the polarised type of development
pattern that evidently exists in Kisii District. Measures should be taken to discourage the
localisation o f industries in Kisii Municipality and encourage industrial development of other
parts of the Districts. Such measures would include:
(i) An incentive package to encourage selective industrial development that gi\cs
emphasis to other parts of the District apart from Kisii town. Such inccnti
would include: provision of industrial support infrastructure (power supply, land,
factory premises, etc.); budgetary controls (credit restrictions, differential taxation
and licensing, government expenditure, etc.); financial assistance, and so on.
These incentives among other things, are
development in the study area. There is
likely to encourage equitable industrial
is definitely need for more industries in the

235
O
(iv)
(V)
District, including tea factories, f t * processingmaize milling.
and so on.
H e r e is need to divert the inflow „f d e v e lo p * , factor.dc.crm uum s
(p articu la rly societal innovation and decision- making) from the Kisii town core
zone to other parts of the District. Such a measure is likely to reduce regional
inequalities.
Effective internal demand should be built and the creation of dynamic societal
structures encouraged in peripheral regions of Kisii District. People in these
regions should be encouraged to retain in the relevant divisions of the study area
their returns (such as wages and salaries, etc.) in order to create adequate internal
demand.
Those people employed in Kisii Municipality should be encouraged to send part
of their financial returns to their relatives and friends in peripheral areas. This
is likely to boost demand in those regions, and hence provide a basis for regional
service and manufacturing industries.
Societal structures that are anti-development, (for instance, unwillingness to
educate ch ild ren by some parents), should be highly discouraged in the .
area.
ii) Kisii District is endowed with various resources, especially agricultural sources.
Various crops such as tea, coffee, pyrethrum, sugarcane etc. do well in the
tL..rp are other developable nonvarious agro-ecological zones. Furthermore
/ c h as s o a p s to n e mined in Tabaka m agricultural industrial resources, (s

Nyamarambe Division) which could be utilized r, ■. ■■ It is important that the external
demand for f a , i, « liM M ^ ^
" * “* ” d>' “ • “ “ * * » m m ,
and markets. Exploitation and marketing of dtese extra resource,, u su a lly
soapstone which is a very important non-agricultural resource should be improved
and streamlined.
(viii) Formation of interest groups’ in peripheral regions which (groups) have the
capacity for mobilizing and utilizing resources is another suitable measure. Such
groups would include: regional businessmen, regional intellectuals and regional
politicians. These groups should identify themselves with the interests of the
regions and should be capable of pressing for the regions’ interests with outside
decision makers. II
236
II RESEARCHERS A N D SCHOLARS
(i) Researchers and scholars will find of practical use and interest, the methods used in this
study to map manufacturing to derive industrial spatial patterns. Manufacturing activ mes
in the study area have been mapped using manufacturing employment and Ok numher
o f manufacturing establishments. Ike two methods have been used for com p an d
■ • U, in ,he industrial spatial patterns. Scholars and purposes in order to gain a deeper insig
., _j<. However, it should be noted thatresearchers will no doubt benefit from these me
n Tv used to map manufacturing activities and there are a number of other methods that can be

(ii)
237
w h ic h should be fully exploited. More specifically ,h«y. this researcher is recommend mg :.‘x
mapping o f manufacturing activities using differs,$ ifferent indices (such as: value added hy
manufacturing, number of man-hours canimi ^ , .’ ap,Ul HPende<10I>ncw development, sire, value
of payroll, etc.) in order to facilitate comparisons between theemerging industrial ipatul
patterns.
It could be o f interest to researchers to investigate the spatial patterns of manufacturing
and allied service sector industries not only in Kisii District but also in other pans of the
country to enable comparisons with the current study and to arrive at a more
comprehensive picture of the spatial patterns of industries in Kenya. Such findings will
no doubt be useful for planning and policy making.
7.4.2 INDUSTRIAL LOCATION VARIABLES
I POLICY MAKERS AND PLANNERS
(i) This study has clearly established that the variables that influence the location of agro-
based industries in Kisii District are mainly economic in nature. These variables have
been collapsed in four factors namely; personal preferences, market accessibility
industrial support infrastructure-cum-urban economies and government support cum
labour-water supply. These factors (with their constituent variables), among others.
Should be used as a policy instruments to influence equitable industrial (and. uxiccd.
regional and/or national) development.
» „ Mp-O.. * - —
District. T ie p o o r store ef rod

ch a llen g e to any m eaningful equitable industrial Im amal (and ^ overall rcgnuul aM .-r
na tional) developm ent in the study area, and therefore need urgent rev,e-,
TT RESEARCHERS AND SCHOLARS
(i) Industrial location, just as many other aspects of industry, is dynamic, which call, for
constant evaluation. This is necessary, so as to keep abreast with the development, ,n
this sector. There is this need for constant research activities,
(ii) There is need to carry out studies on: the location variables influencing non-a pro-based
manufacturing and allied service sector industries in Kisii District and other parts of the
country
238
7.4.3 INDUSTRIAL STRUCTURAL CHARACTERISTICS
i p l a n n e r s a n d p o l i c y m a k e r s
(i) There is need to encourage (through assistance, support, incentives, etc.) the
development of carefully selected intermediate and export goods industries tn Kimi
District This will ensure production of producer goods apart from 3*n«r.ici.,,
fo r e ig n Currency for the Dis tr ic t .
Industrialists in Kisii District should be encouraged to diversify the m
produce. They should be encouraged to be outward looking by producing r°
market in addition to the local market. This is likely to generate mor r
employment and definitely, a higher standard of living in

239fl cfHOLARS AND RESFARPh ppc
» * * * ' « * * i . * « , „ „ „
“ - * * • * - “ “ ~ w i . » . „ „ „
“ * O t m in the m S m f c 1 M m |
t o t e n s f c , h m shcnkl interest ^
industries are public (mainly parastatal or Government) owned industries, public i non
government) cooperatively owned industries, and privately owned local ,r lorccn
(multinational or transnational)]; activity radii of industries [whether industries have a
long, (or nationwide) activity radius, moderate potential radius and short activity radius
industry]; development-inducing industries (that is, industries which plough back
development funds especially into the rural areas and, hence, centrifugal in** effects)
and/or development-supporting industries (that is, industries which aid and/or plough
back development funds especially into the rural areas); diversification of industries; rate
of growth of industries (whether industries are very fast growing industries, fast growing
industries, slow growing industries and very slow growing industries); quality of goods
processed and/or fabricated by industries (whether the goods are high quality co<x,s. 1>
quality goods and/or dangerous component(s) goods and low-quality pharmaceutical
related goods); and, industrial linkages [whether industries are capable of establish,nc
extensive (forward or backward) linkages, industries with little or very limited .forward
and b ack w ard ) linkages, and leading and/or key industries) (see paces
«> Findings o f th is study also act as evidence to scholars of the fact that the structure of
industries in K isii D istrict (as is likely to be the case in other parts of Kenya. ,s larc.l.

240
(iii)
p erip h e ry orientated and hence, inappropriate 3„h aPPrapnate and does not significantly c o n t r i t e
regional development.
It is a lso o f significance to conduct detailed studies into the structure of uaiustry
in o th e r parts o f Kenya in order to determine whether the structure of Ok
industries contributes significantly to the development of the equ,table regtotul
and (overall) national development.
7.5 OTHER GENERAL RECOMMENDATIONS
1 PLANNERS AND POLICY MAKERS
(i) There is need to compile a comprehensive database for purposes of regional
development planning. Such a database should cover the whole, District by
District, or even better (say, division by division). The quality of regional
databases should also be looked into, and updated from time to time. This is
because the quality of a database is a major influence in defining, analyzing and
planning o f regions.
(ii) The elements of Ogendo’s centrifugal model, (refer to pages & Si arc cry
useful for comprehensive equitable regional and urban development planning
is th e re fo re recom m ended that these elements should be taken into account when
planning.

241
tT cfFTOLARS AND RESF.ARPHBPg
® T h - 15 “ « * t0 in greater deta,l those aspects of i ^ smcs ^ bv
this study, for example: the impact of industrial development on the environment,
the role o f multinational corporations in the development of developing count,*,,
especially Kenya; the appropriateness of current industrial technology in Kenya;
planning for Kenya s industrial development; attracting investment in industry,
industrial restructuring in developing countries, among other topics.
(ii) There is need to further establish the role of industrial establishments employing
(1-4) operatives in the process of equitable regional and (overall) national
development.
7.6 CONTRIBUTIONS MADE BY THE STUDY
The findings highlighted by this study should be considered in total as major contributions
the study has made to work in the field of industrial geography and specifically to the
understanding and general knowledge of the industrial geography of Kisii District.
One of the models that has recently been formulated for equitable regional development
planning is the centrifugal model,(Ogendo 1988,1989, see pages
principal objectives of the model and how it (model) aims
66-82XThis study has outlined
to achieve the objectives. This
work, diagrammatically, models the centrifugal regional development planning mod
first time (Figure 7) All the elements of the model are included in the diagram. Tim is
development planning as a whole.

242
G eo g rap h ers , econom ists and planner may be i n t e r s in ,’ mterested ui determining ind cupp;
spatial distribution of manufacturing activities. H e technics and wdices used m du,
provide excellent methodology. To establish industrial spatial patterns. t*0 techniques are used.
namely: the coefficient of localization and the location quotient. To map the patterns, the .ndtcct
of manufacturing employees and number of establishments are utilized. He major comr.bw.on
of this study is the application of more than one technique and index to establish and map
manufacturing activities. This is useful not only for comparisons purposes in order to gam a
deeper insight in the industrial spatial patterns.
Most of the maps used to illustrate various aspects of the study have been prepared for
the first time and derive their origin from this study. These include: the industrial spatial patterns
map of Kisii District (Figure 21); the map on number of manufacturing establishments in Kisti
District in 1994 (Figure 22); maps showing the relationship between industrial location and road
network; and, industrial location and power supply (Figures 26 and 27, respectively). All the
maps, diagrams and the tables accompanying the material covered in this thesis must be
considered contributions the study has made to the knowledge and understanding of industrial
geography. The maps, tables and diagrams are useful sources of information and hence can
used as source materials for further analysis and general reference
. , oil thf» contributions made in chapters 1*3. Finally, it is important to observe that a
u,„j alt (he work done in the otherParticularly in chapter 1 have greatly helped to spear
remaining chapters 4-7. Indeed, chapters 2 and 3 have also greatly benefitted
Moreover, the references, select bibliography and all the appendices ry
Several aspects o f chapters 1-3.

243It is justifiably correct, therefore,
to state that, without chapter I,
extent chapters 2 and 3, this thesis could not have materialized.ind to a com;Cc

244
REFERENCES AND BIBLIOGRAPHY
gEFERENCES
1. Alexander, J.W. (1963)
2. Alonso, W (1964)
3. Awuor, R.O. (1979)
4. Baily, M A. (1976)
Ee2a2mi^ S 22raEhL New Jersey. Prea.ce Hell.
L2® ^nM U niU se, Harvard Univ. Press
Relationship of Kisutnn’s industrial section tn rh<y hinterland: A case study of Kisumu Milt*Unpublished M.A. Thesis.
Capital Utilization in Kenya Manufacturing Industry’ in Discussion Paper No. 206 IDS, UON.
5. Bale, J, (1981) The Location of Manufacturing Industry, Conceptual Frameworks in Geography. Oliver and Boyd.
6. Barker, C E. et aL (1977) ‘The Structure and Balance of Industrial Production in Tanzania’ in Utafiti Vol. II No. 1
7. Blalock, H.M. (1979)
8. Boudeville, R.J. (1966)
9. Cattel, R.B. (1966)
10. Chapman, K. and Walker, D. (1991)
U. Chorley, R. J. and Haggett, P. (eds.)(1967)
12. Collins, L. and Walker, D.F.(1975)
13. Coughlin, P. and Iftara, G.K. (1988)
14- Draper, N. and Smith, H. (1981)
Social Statistics. McGraw-Hill Publishing Company.
Problem s of regional development planning. Edinburgh University Press
‘The scree test for the number of factors' in Rphavinural Research, Vol. 1 PP. 245-276
Industrial location: Principles and Policies, Basil Blackwell.
M o d d iiru e o g ra p h ^ Methuen, London.
jftiamirs of Manufacturing iley, London.
■n r>nvr Tn *earch of ainn in rNenYjj------ -enya.

24515. Estall, R.C.and
Buchanan, R. O. (1973)
16. Ebdon, D. (1985)
17. Friedmann, J.R. (1966)
18. Friedmann, J.R. and Alonso W. (eds.) (1966)
19. Greenhut, J.R. (1972)
20. Greenhut, M .L. (1956)
Regional Development and Planning - reade-E Press, Cambridge Mass.
A general theory of polarized development* in Hansen. N *M*(ed-). Growth Centres in Rrpomj F ^ r m it Development, The Free Press, New York.
Plant location in Theory and Practice. New York.
21. Gregory, S. (1978) Statistical Methods and the Geographer. LongmanScientific and Technical.
22. Hamilton, F .E .I. (1974) ‘A View of Spatial Behaviour, Industrial Organizations andDecision Making’ in Hamilton F.E.I. (ed.) Sc?-tial Perspectives On Industrial Organization and Decision Making. John Wiley and Sons.
23. ------------------- (1967) ‘Models of Industrial Location’ in Chorley, R.J. andHaggett, P. (eds.) Models in Geography. Methuen.London.
24. Hammond, R and McCullagh, P.S. (1978)
25. Harper, W .M . (1977)
26- Hermansen, T. (1972)
27• Hirschman, A .O . (1958)
nmnriiative Ter^ T ” in Geography: An Intrcduttlfll. Clarendon Press, Oxford.
cs, M . and E . Handbooks.
anment poles and development centres in national IT development: Elements of a theoretical igional development.
r f in
Th. stmteev ofj c a a o a i c j g i s l i ^
New York.
McGraw-Hill,

24628. Hoover, E.M . (1937)
29. Hosking, P.L. and Clark, W .A.V. (1986)
30. Isard, W. (1956)
31 Isard, W (1960)
32. Jaetzold, R. and Schmidt, H. (1982)
33. Jhingan, M .L. (1989)
34. Johnston, R.J.(1978)
35. Kaiser, H.F. (1960)
36. Kaplinsky, R. (ed.) (1978)
37. Katona, G. and M organ, J.N. (1992)
38- Kenya, Republic o f (1969)
39' -----------------(1974)
40' — ________ (1978)
41' -----------------(1983)
42A (1989)
John Wiley and Vr.,
and Space Economy M.I.T. Press.
Farm Management Handbook Vol, U/A• W> 1Ministry of Agriculture, Kenya.
The Economics of Development Planning. Korurlc Publishers, PVT Ltd.
Multivariate Statistical Analysis in Geography. Longman. London.
‘The application of electronic computers in factor analysis’ in Education and Psychological Measurement, Vol. 20 PP 145-151.
Readings in Multinational Corporation in Kenya. Oxford University Press.
‘The Quantitative Study of Factors Determining Business Decisions’ i- nmrteriv Journal of Economy. V oi. 66 i 1
67-90.
T w in m ie n t Plan 1970-74, Government Printer.
rwlonment Plan 1974-78. Government Punter.
Develo0nenL2!sn 1979 - 83. Government Printer.
DevelocmentBan 1984-88, Government Primer.,
n — entP lan 1989-93. Government Printer.
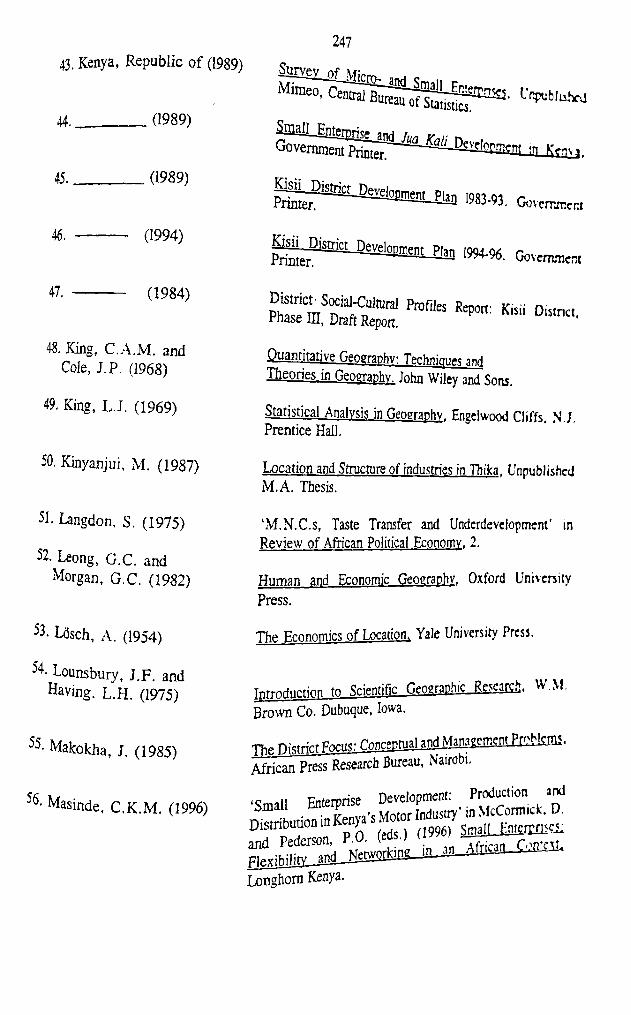
43. Kenya, Republic o f (1989)247
44. H989>
45. _ <19891
46. -------— (1994)
Small cI'npBWuhcJ
2ialL_Entemrise anH / „G o v er iu ra ^ ^
KLsii District Developm,,.. ph Printer. ~ 1994-96. Government
47. ----------- (1984)
48. King, C.A.M . and Cole, J.P. (1968)
49. King, L.J. (1969)
iJistnct' Social-Cultural Profiles Rep< Phase IH, Draft Report. Kisii District,
Quantitative Geography: Techniques .mH Theories in Geography. John Wiley and Sons.
Statistical Analysis in Geography. Engelwood Cliffs. N.J. Prentice Hall.
50. Kinyanjui, M. (1987) Location and Structure of industries in Thika. Unpublished M.A. Thesis.
51. Langdon, S. (1975)
52. Leong, O.C. and Morgan, G.C. (1982)
‘M.N.C.s, Taste Transfer and Underdevelopment* in Review of African Political Economy. 2.
Human and Economic Geography. Oxford University Press.
53. Losch, A. (1954)
54. L ounsbury, J.F. and Having. L.H. (1975)
55- Makokha, ]. (1985)
S6- Masinde, C.K.M . (1996)
The Economics of Location, Yale University Press.
Introduction to .Scientific Oniiraphic Research. W.M Brown Co. Dubuque, Iowa.
ThP District Fncwt Conceptual and ManagementPlgt lgm. African Press Research Bureau, Nairobi.
Enterprise Development: Production andmion in Kenya's Motor Industry’ m McCormick. D.. p n reds) (1996) S m a L i E i a E D ^ iderson, P.O. leasi ; ^ ~ T ? Z rc \i.
j1TTff fJ hvnrlring ULjjL-^lHcan V ^

24857. Mathews, J.A. (1981)
58. McCormick, D. (1988)
59. McCormick, D. (1991)
60. Milne, S. (1991)
61. Misra, R.P. et al. (1974)
62. Moser, C .A . and Kalton, G. (1971)
mcncal Manual, Pergamon Press. "
^ ^ ^ a a g -Bnterpnses in ....... . ....^ f f a o L D e a d J n d , Unpublished PhlTTSsT^Tuonme John Hopkins University, Baltimore.
Success in Urban Small-scale Manufacturing: Implications for Economic Development’ in Coughlin. P. and Ikiara. G.
Ksnya s Industrialisation Dilemma. Hcmcmann Kenya Ltd.
Small firms, industrial reorganisation, and space: the case of UK high fiderity audio sector' in Environment and Planning Vol. 23, PP 833-852.
Regional Development Planning in India: A new strategy. Vikas Publishing House, P.V.T. Ltd, Delhi.
Survey Methods in Social Investigation. Hemmann Educational Books.
63. Morrison, D .D . (1967)
64. Myrdal, G. (1957)
65. North, D.J. (1974)
66. Nixson, F.I. (1973)
67, Obara, D. A. (1983)
68. Obiero, J, C. A. (1980)
Multivariate Statistical Methods McGraw-Hill Book Co.
Economic Theory and Underdeveloped Countries. Methuen and Co. Ltd, London.
‘The Process of Locational Chance in Different Manufacturing Organizations’ in Hamilton E.L.Licd ) (1974) Spatial Perspectives on Industrial Org.3n.i?ail2JlJB*J rvrkion Making, John Wiley and Sons.
F --------- - Tn^raion and J n d u a m L L i^ . Longman.
London.

24969. Ogendo, R.B. (1966)
70. __________ (1970)
71. __________(1971)
72. __________(1972)
industries" 72kT* T ,u ,wM o u t o n a n d C o ^ ^ ^ - ^ 11^ 23 '
hived A VI
— e location and structure of Km T j _giocessin industries, Unpublished PhD Thesis
l i ’ f -if
The Location and Structure of Kenya's Industries* in Ominde, S.H. (ed.) Studies in East African f y T P rh_v ,p.) development, Oxford University Press.
Industrial Geography of Kenya. East African Pubhditng House.
73. __________(1980) "Economic Planning and Development in Last Africa* in Hekima. Journal of Humanities and Social Sciences, No. I
74. Ogendo, R .B .(1989) Eldoret and Its Regions: A Geographical AlUlllLS. Pape*presented at the First National Workshop on Planning and Development of Eldoret and Its Environs, Sinkwa Hotel, Eldoret.
and Ojany, F .F . (1988) Kenya: A Study in Physical and. Humaq_fom rll£ .Longman, Kenya.
76. Ominde, S. H. (1975) "Regional patterns of fertility in Kenya in Ih sJta iynGeography, Vol.l No. 1.
77. Onyemelukwe, C.O.J. (1974)
78. Opondo, M. (1989)
‘Industrial Location in Nigeria’ in Hamilton. I* M i. ted > s patial Perspectives on Industrial— Q ipn iza tivn— 1 TVrision Making, John Wiley and Sons.
^^^^l^gj^2Q£aj_^haractenslic5j2l^ in Kknmu Municipality, M.A. Thesis.
^9. Pearson, D .S . (1969)
SO. Pred, A.R. (1967)
f c d u s t r i a l D e ^ ^Press, Nairobi.
„A ,^finn- foundatipnii^a^cm^r^yJ^gcoer.irh> •
rlypamir theory, Parl •B, 27.
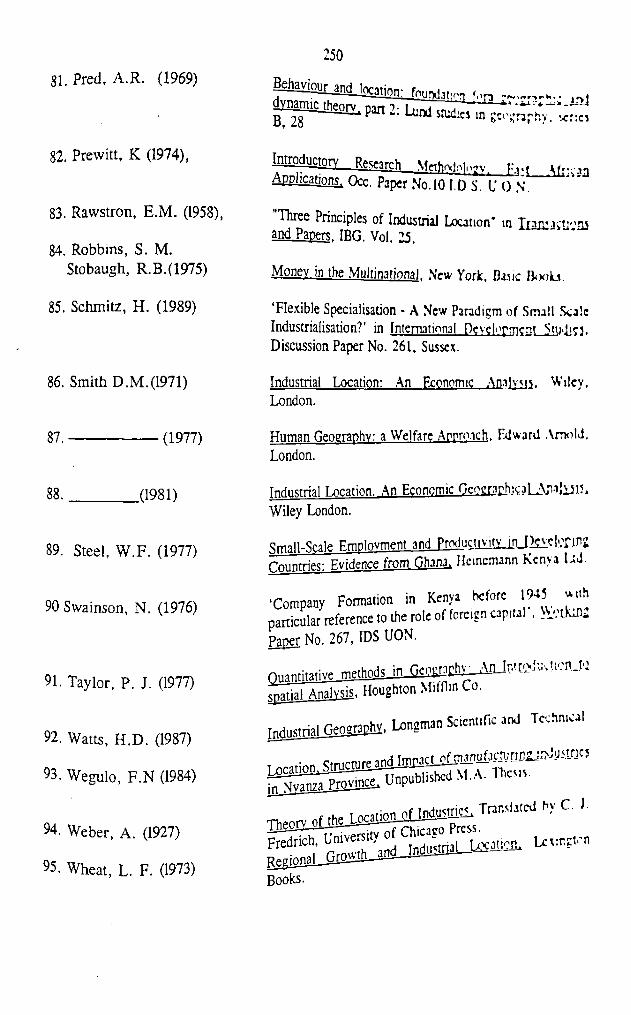
250SI. Pred, A .R . (1969)
82. Prewitt, K (1974),
83. Rawstron, E.M. (1958),
84. Robbins, S. M. Stobaugh, R.B.(1975)
85. Schmitz, H. (1989)
86. Smith D.M.(I971)
7 ^ ® ~ O n < L l2 ca ^ --------- . . . . . .dynamic thpnrv i . ~
pan 2. Lund s t u t o m gcrgmphy. «::«
Introductory— Research Methndn|ngV| pr . Application. Occ. Paper No. 10 I D S. L* 0 N.
Allman
Three Principles of Industrial Location* m and Papers. IBG. Vol. 25.
Money in the Multinational. New York, Basic B<x>b.
‘Flexible Specialisation - A New Paradigm of Small Scale Industrialisation?’ in International Development Studies. Discussion Paper No. 261, Sussex.
Industrial location: An Economic Analysts. Wiley. London.
87. ------------- (1977)
88. _______(1981)
89. S teel, W .F . (1977)
90 Sw ainson, N . (1976)
91. Taylor, P. J. (1977)
92. W atts , H .D . (1987)
93. W eg u lo , F .N (1984)
94. Weber, A. (1927)
95. Wheat, L. F. (1973)
Human Geography: a Welfare Approach. Edward Arnold,London.
dustrial Location. An Economic O eggoc t o LAPi Ji5 15* iley London.
nall-Scale Employment and ProducjiyjiyjrUj£Yyton£ Hintriw Evidence from Ghana. Hcincmann Kenya UJ
ompany Formation in Kenya before 1945 with nicular reference to the role of foreign capital , W ptta . per No. 267, IDS UON.
nnrir r “ in Geomite.iVaJn'ro'lu.'.ionJ':..ini Analysis, Houghton Mifflin Co.
s jM Geography. Longman Scicnttfic and Tcchntcal

SELECT BIBLIOGRAPHY251
1. Alonso, W.(1967)S ™ 1* ™ of classi«> Uwuon Theory « u Kcla,„.n . Kent Ineory in Papers. R.S.a . 19 23-u.
2. Cameron, G. C. and Clark, B. D. (1966)
Industrial Movement and it*. p>f p -,[Problem, University of Glasgow Social Economic Studies. rx-c PaPer 5 Oliver and Boyd, Edinbury.
3. Dennison, S.R. (1939) The location of industry and the depressed i r ^ , Linden. OxfordUniversity Press, New York.
4. Fetter, A. (1924) The Economic Law of market Area" in Quarterly Journal ofEconomics. 38 1924.
5. Gilbert, A. (1974) "Industrial Location Theory: Its Relevance to an Industriali/mgNation " in Hoyle,B.S. (ed) Snatial Aspects of Pcvc!<_Trccntf Wiley.
6. Glasson, J.(1978) An Introduction to Regional Planning. Hutchinson. Lmdon.
7. Hamilton, F.E.I.(ed.) (1978) Industrial Change, Longman. London.
8. Hewing, G.J.D. (1977) Regional Industrial Analysis and Development. Methuen. London
9. Hoover, E. M. (1936)
10 . ___________ (1937)
11. ___________(1975)
12. Hotelling, H (1929)
13. Hoyle, B .S.(ed.) (1974)
14. Kingoriah, G.K. (1981)
"The Measurement o f Industrial Location in B^i£w_o_LL.^vn(. and Statistics, 18, P P .162-171.
Tlv>T oration ofFrnnnmic Activity. McGraw-Hill New York.
Tntr/vtnr'tinn to RegionalEcgnamia MeGraw-llill New W
-chiUn, in competitiaa: in Economic Journal Vnl. 39 41-5.
gpstiai Aspects _of_Bey£lgCffl£ffl.London, Wiley.
■•Econom ic D ev e lo p m en t and Indusma. U K a tio n in Kcn>a‘ ,»
A RD H I Vol. 1.

252
15. McConnick, D. (1987) ‘Fundis and Formality: Vcn Small Ma, f .M. Schatzberg, (ed 10987^^ d ^ in Nl:^ ' ,nPraeger, New York ^ ^ - ^ L h a ^ L K ^ .
15. Moseley, M.JT.(1974)
16. Mountjoy, A. B. (1978)
g£gflL-centres i" T O HUllllBilg. 0xford, Peri!lnon PrcM
Industrialization and rwinp,™ ,p.. i ^ onHutchinson.
17. National Christian Council of Kenya (1968) Who control' ln,imm, |u „African Publishing House, Nairobi.
18. O’Connor, A .M .(1966) An Economic Geography of FnsfAfrica. London, Bell.
19. Onyemelukwe, C.O.J. (1966) Problems of Industrial planning and management ;nNigeria. Longman.
20. Perroux F. (1955) "Economic space: Theory and Application* in Friedmann J R. arvlAlonso W. (1964) Regional Development- A Reader, M I T Press, Cambridge Mass.
21. Schmitz, H. (1990) ‘Small Firms and Flexible Specialization in Developing Coumnci* in labour and Society Vol. 5, No. 3, pp. 257-..S5.
21. Soja, E.W . (1968) T h e n p n f r fa n h v of ModernizaJM L A JrJ lili^ n'feisj.'(J'Ni'-' wnuninif. and political change, Syracuse Imvcrsuy rcss.
22. S w ain so n . S.N. (1980) The_DeydoErr^ ‘Heinmann Nairobi.
23. Taylor. M. J . (1970) -Location Decsions of Small firms’ in m No 2 M -M .
24. T o d a ro , M . P. (1977) E c o i w m « J o ^ ^
25. Yankson, P.W.K. (1996) j g g *
D. and P ed erson , P-O- v f r i r , n ContcjiLF]exibi!itY__2aE-HelS^^Longhorn Kenya.

25. Yeats, M . (1968) ^ a a d a c U Q n ja j jg j^ n ^ McGraw-Hill, New York.

254
LIST OF APPfvnjr r
APPENDIX 1
r e c o r d i n g ~ w
Name o f establishment ........................................Year When started ...................................................Location (division) .......................................................Date o f interview .....................................................................
I, Which o f the variables listed below influenced your decision to locate this c taMnhncr.t in this place? (Rank your variables in order of importance using the scale give below)
Rank Scale Rank description
1 Very important variable in influencing location of this establishment.
3 Important variable in influencing locationof this establishment.
7 Fairly important variable in influencinglocation of this establishment.
jq Least important variable in influencinglocation of this establishment.
Variables
1. Local availability of raw materials .................
2. Availability of local capital for investment in manufacturing
3. Proximity to other local e s t a b l i s h m e n t s *
4. P resen ce of urban economics (banktng insurance, secunty etc.)............
5. i) Accessibility to local market • ■ • * .........ii)Anticipation of market in the near
6. Low transport costs •

7. N earness to hom e and familiarity with the area i„ which the m f e n „
8. i)Availability of abundant supply of powerii) Availability of cheap power .......... ..............................
9. Suitable underlying rock structure
10. Suitable surface configuration (flat surface etc.)
11 i) Availability of cheap land for expansion.....................................ii) Adequate land for expansion ...........................................
12. In f lu e n c e o f governm ent (through provision of subsidies, low taxes, market fore t c . ) . . . . . . . . . . . . . . . . . . . . . . . . . . . . . . . . . . . . . . . . . . . . . . . . . . . . . . . . . . . . . . . . . . . . . . . . . . . . . . . . . . . . . . . . . . . . .
13. Influence o f local politics .....................................................................................
Ili) Are there any other variables that have influenced your decision to locate y<’ur establishment at this place? (Tick where appropriate)
255
Yes No.
ii) If yes, specify and rank

256
APPENDIX 2RECORDING SCHEDULE FOR THE E SD tvnm i c*™.
DISTRICT’S AGMCULTOAl.
Name o f establishm ent...........Year when s ta r te d ....................location (division).................Date o f interview ....................
1. Technology utilized
a) Do you own a power generator or a similar source of power? (Tick where appropriate)
Yes No
If Yes, which o f the following do you own? (Tick where appropriate)
(i) Petrol/ diesel generator
(ii) Hydro-electric power
(iii) Thermal power plant
(iv) Any other source (specify) .......................................................
If No where do you obtain your power from ..................
(b) What is your approximate monthly power costs(c) What technology do you mainly use in producing goods in your cstablishmc
appropriate)
M ain ly capital-intensive (use of machines)
M ain ly labour-intensive (use o f labour)

(i) Give reasons for this
257
2. Commodities produced and their raw
W hat commodities are produced in your establishment1
(a) (i) Consumer goods; (Tick where appropriate)
Foods (specify) ...............................................................Textile (specify) ............................................................Wood products (specify) ..............................................Others (specify) . , .......................................................
(ii) What raw materials are used in the production of the abovegoods?
Raw materials
(iii) What is the main source of the raw materials already mentioned? (Tick where appropriate)
Obtained locally (within Kisii District)
Obtained from other parts of Kenya
Obtained from outside Kenya
a week(iv) What is the volume of production inor a month ...............or a y e a r ................* *
(State in m etric tons o r any other appropriate measur
(b) (i) Intermediate(Tick where appropnate)
Textiles (specify)..........

259
3 Scale o f production
(a) How many people are employed in your establishments? (Tick where appropriate)
(i) 5 * 49
(ii) 50 - 99
(iii) 200 -999
(iv) 1000+
(b) Of the total, how many are unskilledsemi-skilled . sk illed ............
(c) Which are your main sources of employees (tick where appropriate)
Unskilled labour(i) Kisii District(ii) Outside Kisii District
Semi-skilled labour
(i) Kisii District(ii) Outside Kisii District
Skilled labour(i) Kisii District(ii) Outside Kisii District.
(d) Are there any plans of expanding this establishment ?
(tick where appropriate)
Yes No

260
If yes what will the expansion involve ? Tick where appropriate
An increase in floor space An increase in number of employees An increase in rate of production All the above
Others (specify)
4. Market for products / commodities
(a) Where are your products sold ? (Tick in order of volume of sales)
(i) Within Kisii and Gucha Districts(ii) Other parts of Kenya(iii) Other parts of the world
<b) W hat a re y o u r m ain sources o f custom ers ? List in o rder of importance b\ volume of u!cs
(i) Kisii District(ii) other pans of Kenya(iii) Other pans of the world
ENDTHANK YOU.

261
APPENDIX 3
IN D U S T R IA L EST A B L ISH M EN TS VISITED FO R RESEARCH PURPOSES. 1994
E S T A B L IS H M E N T1 Gesusu Butchery2. Kisii Urban Council Slaughter
House3. Sungrown Products Ltd4. Nyamache Coffee Factory5. Kisii Coffee Factory6. Kiamokama Coffee Factory 7 Kenyenya Millers8. Oyabi Posho Mill
9. Mobamba Women Group (Mogonga) Posho Mill
10. Getare Posho Mill
PRODUCTS Fresh Meat
Fresh Meat Passion Fruit Juice Coffee Beans Coffee Beans Coffee BeansMaize Flour, Wheat Flour Maize Flour, Millet Flour, Wheat Flour
Maize Flour, Millet Flour Maize Flour, Millet Flour
(U.n.) lsm.c 4-Dfc;n coni; 3111
311131123116f A)
3116(B)
11. Mosache Posho Mill12. Riokibeni Posho Mill13. Itumbe Posho Mill14. Nyanturago Posho Mill15. Riokindo Posho Mill16. Btago Posho Mill17. C16 Posho Mill
18. Bntakana Millers19. Ekona Posho Mill20. Gesonso Posho Mill
21. Modem Posho Mill
22. Truphena Kebati Posho Mill
23. Ogembo Millers
24. Masimba Posho Mill
25. Masimba Super Carpenters
Maize FlourMaize Flour, Wheat F'lour Maize Flour, Millet F'lour Maize Flour, Millet Flour Maize Flour, Millet Flour Maize Flour, Millet Flour Maize Flour. Wheat Flour, Millet Flour Maize Flour, Millet Flour Maize Flour, Millet Flour Maize Flour, Wheat Flour, Millet Flour Maize Flour, Wheat Flour, Millet Flour Maize Flour, Wheat Flour, Millet Flour
Maize Flour, Wheat Flour, Millet Flour Maize Flour, Wheat Flour, Millet Flour Furniture of all types

262
E S T A B L IS H M E N T PRODUCTS
26. Mobamba Women Group (Borangi) Posho Mill
27. Sansora Bakery Ltd28. K .I.E Bakery29. Kisii Bakeries30. Kiamokama Tea Factory31. Nyamache Tea Factory32. Ogembo Tea Factory33. Nyakoe Malt Sugar Co.34. Kisii Bottlers35. Nyabonyi Weaving and
Spinning
36. Gekanana Knitting and Weaving
37. Kurm Garments38. Nyambunwa Tailors39. Mamu Tailoring and
Dress Making40. Gesusu Tailors41. Okemwa Tailoring Shop42. Industrial Hides and Skins
43. Timsales (Kisii Branch)44. Oriental Mills45. Kisii Sawmills46. Riseta Furniture and Wood
Turning
Maize Flour, Wheat Flour, Millet Flour Bread, Cakes BreadBread, Cakes Black Tea Black Tea TeaJaggery Soft Drinks
Mats, Baskets, Ropes and Twine
Knitted GarmentsClothesC lo thes
C lo th es Cloth*, s C lo th esRaw and Semi Tanned HidesSawn Timber Sawn Timber Sawn Timber
All types of furniture
47. Oisebe Workshop48. Gesonso Furniture and Repair49. Kwach Akal50. Jogoo Workshop51. Nyamataro Carpentry52. Birongo Central Workshop53. Siocha Carpentry54. Anyona Carpentry55. Usalama Workshop56. Gekomu Carpentry57. Nyamache Carpenters
Furniture and Fixtures FurnitureFurniture and Fixtures All types of furniture Furniture FurnitureFurniture and Fixtures All types of furniture FurnitureFurniture and Fixtures Furniture
a'.N.)LSJ.C4-nK;rrn)i)i
3117
3121(A)
3121(D)3134
3211(D)
32133220
32313311
3320

263
ESTABLISHMENT PRODUCTS (U.N.) I.S.I.C 4-DI0n COD!
58. Nyangusu Carpentry Workshop59. James Anyona Carpentry60. Keroka Furniture Makers61. Daraja Mbili Furniture Makers62. Kereri Carpenters63. Mose Furniture Makers64. Nyabigege Carpenters65. Ibacho Furniture Workshop
Furniture 3320 All types of furniture All types of furniture Furniture of all types FurnitureFurniture and Fixtures FurnitureAH types of furniture

264
APPENDIX 4
C A T E G O R IE S O F ESTA BLISH M EN TS V ISITED FOR RESEARCH PURPOSE
A G R IC U L T U R A L FO O D M ANUFACTURING ESTABLISHM ENTS
E s ta b l is h m e n t N um ber visited
Tea processing 3Coffee processing 3Sugar processing 1Meat processing 1Grain milling 20Bakery products processing 3Soft drinks and carbonated 1Other food products not elsewhere classified 1Total establishments visited 33
A G R IC U L T U R A L N O N -FO O D M ANUFACTURING ESTA R LIS H MENTS
E s ta b lish m e n t N um ber \isited
Furniture and fixtures fabrication MSaw milling JManufacture of wearing apparel 5Spinning and weaving 1Knitting jHides and skins *T o ta l es tab lish m en ts visited 3 -
Total number of agricultural manufacturing establishments visited is 33 + 32 = 65 establishments.

65
APPENDIX 5TABLE OF RANDOM NLMBF.RS
10 09 73 25 3337 54 20 48 0508 42 26 89 5399 01 90 25 2912 80 79 99 70
G6 06 57 47 1731 06 01 08 0585 26 97 76 0263 57 33 21 3573 79 64 57 53
98 52 01 77 6711 80 50 54 3183 45 29 96 34
88 68 54 02 00
99 59 46 73 48
6 5 48 11 76 74
8 0 12 43 56 35
74 35 09 98 17
6 9 91 62 68 03
0 9 89 32 05 05
91 49 91 45 23
8 0 33 G9 15 98
44 10 48 to 40
12 55 07 37 12
63 60 64 93 29
61 19 69 04 46
15 47 44 52 66
94 55 72 85 73
42 48 11 62 13
23 52 37 83 17
04 49 35 24 94
00 54 99 76 54
35 96 31 53 07
59 80 80 83 91
46 05 88 52 36
32 17 90 05 97
69 23 46 14 06
19 56 54 14 30
45 15 51 49 38
94 8G 43 19 94
98 08 62 48 26
33 13 51 62 32
80 95 10 04 06
7 9 75 21 91 40
18 63 33 25 37
74 02 94 39 02
54 17 81 56 11
11 66 44 98 83
48 32 47 79 28
69 07 49 41 38
Reproduced fromMiin
76 52 01 35 86 34 67 35 48 7664 89 47 42 96 21 80 52 10 5719 64 50 93 03 23 20 90 25 Oil09 37 67 07 15 33 51 13 11 6.580 15 73 61 47 64 03 23 66 5.3
34 07 27 68 50 36 69 73 61 7045 57 18 21 06 35 50 54 26 1 102 05 16 56 92 63 66 57 48 1805 32 54 70 48 90 65 35 75 1803 52 96 47 78 35 80 83 12 82
14 90 56 36 07 22 10 94 0.5 3839 80 32 77 32 50 72 56 82 1806 28 89 80 83 111 74 67 00 78
86 50 75 84 01 36 76 66 79 51
87 51 7G 49 69 91 82 60 89 28
17 46 85 09 50 58 04 77 69 74
17 72 70 80 15 45 31 82 23 71
77 40 27 72 14 13 23 60 02 10
6G 25 22 91 13 36 93 68 72 03
14 ■» 55 85 14 46 42 75 67 88
68 47 92 76 86 16 16 28 35 51
26 94 1)3 68 58 70 29 73 11 5.5
85 15 74 79 54 32 97 92 65 75
11 10 00 20 40 12 86 f)7 16 97
Hi 50 53 41 31 10 21 95 25 63
26 45 71 77 71 51 92 15 37 29
95 27 07 99 53 59 56 78 58 18
67 89 75 13 87 51 62 21 11 .11
97 34 40 37 21 16 ■Sil 14 87 67
73 20 88 98 37 68 93 59 11 16
75 24 63 38 24 (5 H6 25 10 -J5
61 05 18 81 5!) U6 1 1 96 38 96
26 89 30 93 54 33 3*5 13 51 i*2
45 42 72 68 12 83 60 94 97 00
01 39 Hi) 22 86 77 28 14 to 77
37 37 92 52 41 05 56 70 70 07
20 11 74 52 04 15 95 66 i)0 (lO
01 75 87 53 79 10 41 92 154.5
6-5
19 47 60 72 16 43 66 79 1.3
36 16 81 08 51 31 88 88 15 53
45 21 02 81 01 41 9!) 90 88 96
4 1 96 71 98
94
389614
15271250
09078265
19710671
89201193t
1315S601
51121002
8.683i '
16
81 87 91 71
77 55 73 22 70 97 79 o lr. 1
71
29
1969
30
52
31 87
99072463
33
989679
71484719
432710
76
05
590235
33
5829
• ) l175310
1568i t
■ i 1
5970ol
T he HA N D (V p-riiiM 'fl-3
-0 1 ; * j P i * 4
20 61 „f 1
o t 0 : ; i7 M
"* +
■ *
' 3 47 i ; ,7 ! i ; , ; , ' t
9 8 95 II '.8 *7 I 2 " ■ :
05 M 53 -3 -4 11 : > ; M i-0 '-0 ‘ t 10 2 1 i j ; j ’ * ^7 1 > *5 i t 52 (7 , t : .* ■ * " i
28 16 «2 ■" • ■ 9 • 1 i * ; : . 160 93 42 o l I t :* "4
00 97 90 !1 3.1 40 * i •#? ' 4 *
20 10 32 12 ■il 42 77 m; n * L13 47 1 <■<. :o - 1 * 1 ; : m * ; *
90 56 17 9 l " I 20 >j ►: ' J
93 73 56 1 I |.8 2) i m \ v ' )
73 03 95 *1 *6 to -m • 1 1
2! 11 47 '•J 4 1 : i ; h * *
45 '■> )6 U ;; •6 ^ '*<
76 62 11 19 »J *( i i ■'* . 4 ;«
96 24 77 *3 22 ' t i \ *
91 * t fIS 99 23 ;7 1 *53 11 o j :i to 12 ,1* : : i l
57 1,0 (if 18 81 2 2 j j . * M i l
96 /VI 18 "1 19 * > 4 1 ;
1 1 64 17 70 ’ 3 ; \ H; * * ' k
65 10 1.4 '>4 ■J I 12 ' 4 '* -
82 10 1,1 o | 9 > I -
91 19 o l 24 ■'2 'i j ■j ‘ i ' * 1
03 * b-7 11 29 .49 2-4 ’ i n , t , * \
26 2 4 22 "• i 1 i14 y ■ J
6 | "6 J7 111 . i n : i
4 1 i,0 29 2 1 0 * i ■;
. 14 *
13 ilj
15 l;0i j ' 3 ' -1 ■ ;
93 "1 n.3 5i, iT Nr m i M t i, . 0 1 | ! ; 4 486 71 M J i ,
13 71 50 21 21 11 * l \ i
66 67 13 44 >■6 *' - *
54 Of 73 "9 71 * . 1 ' *. 4 i
o l 54 Ol 51 4 6 i r .
59 o9 (7 51 17 i l l ! : a * l
-8 6.) 41 19 0 1 < .4 -T * * n
jr» Ol 62 *2 ''3 i t J {-• M * *
,., . 11 ' 4 .1* i
r>: > . O] - F i ,
j jT 0, ,1 ■■r
52 75 '0 21 - I Tl ; 4
„ L 11 - 1 - s. * 1 *■ ■ *• ^,ii : *- .
oO 1 k 7 S3 51 11 •i S *'
. , , |.12 :n 7 i * 1 ;6 ' ’ *
10 Al ■*2 r> ■M
i”f H ■ ’ ; ■I "* ’ ■ . . i t : * '
1

266
APPENDIX 5TABLE OF RANDOM NUMBERS CONTI).
0 0 18 82 00 97 32 82 53 95 27 010 0 0 4 58 54 97 51 93 15 06 54 947 3 18 95 02 07 47 67 72 62 69 627 5 7 0 87 64 90 20 9; 18 17 19 905 4 0 1 64 40 56 66 28 !3 10 03 00
0 8 3 5 86 99 10 73 54 :’4 27 85 132 8 3 0 60 32 64 81 33 i 05 9! 405 3 84 08 62 33 31 59 41 36 28 519 L 7 5 75 37 41 61 61 36 22 69 508 9 4 1 59 26 94 00 39 75 83 91 12
7 7 51 30 38 20 36 83 42 99 01 6819 5 0 23 71 74 69 97 92 02 88 552 1 81 85 93 13 93 27 88 17 57 0551 47 46 64 99 68 10 72 36 21 940 9 5 5 96 83 31 62 53 52 41 70 69
3 3 71 34 80 07 93 58 47 28 69 51
8 5 27 43 68 93 11 30 32 92 70 28
8 4 13 38 96 40 44 03 55 21 66 73
5G 73 21 62 34 17 39 59 61 31 10
0 5 13 85 68 06 87 64 88 52 61 34
3 3 0 0 10 21 76 81 71 91 17 11 71
3 7 4 0 2 9 63 97 01 30 47 75 86 56
9 7 12 54 03 48 87 03 33 14 17 21
21 8 2 64 11 54 47 14 33 40 72 64
7 3 13 54 27 42 95 71 90 90 35 85
0 7 6 3 8 7 79 29 03 06 11 80 72 96
0 0 5 2 8 8 34 41 07 95 41 98 14 59
8 3 5 9 63 56 55 06 95 89 29 83 05
10 8 5 06 27 46 90 59 91 05 07 13
3 9 8 2 09 89 52 43 62 26 31 47 64
5 9 5 8 00 64 78 75 56 97 88 00 88
3 8 5 0 80 73 41 23 79 34 87 63 90
3 0 0 9 27 06 68 94 68 81 61 27 56
0 5 14 39 56 59 18 28 82 71 37 19
27 2 0 75 02 64 13 19 27 22 94 07
91 3 0 70 09 91 19 07 22 42 10 36
0 8 43 49 46 88 84 47 31 36 2291
62
4 8 0 0 81 58 77 54 74 52 45 35
(Hi 91 34 51 97 42 67 27 86 01 11
10 45 51 60 19 14 21 03 37 12 91
1 221190 70 0
3 87752245 8
3983355544
7309952673
4376 15 7077
6538653507
0280125850
7673253103
1169966579
8461596392
0431867945
5 3 8 5 34 13 77 36 06 69 48 50 58
2 48 3106 0
6 3US447 9
730142
01
87
2143
81
36513457
74383657
38991517
4822
1936
93289057
'12157362
0727
11
220863 01 3323 23 *1 74 •ij II ' J9388 1937 91 37i;7 5 i V / *.3i:2906 1161 27 12 167 ) 13 I! _,
4291 22 ;■» 95 lf7 V) 5.3 '1 :« _,6822739H 2') 71 16 ■ ,.f *5 ' 1i ^ ‘ 3 ;i66 1588 73 0461 8') 7551 it ‘ 1. i51007893 3200 (601 'I r i I 1 * )215902 30 28 (66,6876*6 ;; -f; /;26 3902 12 5573 1765 it 8148 : i ' ) * %
6071 76 46 4891 97 21(Vi ji 51 :; ‘ t a
41 1827 71 51 [3>81 31 ‘0 -) *210297 73 71 23 17 * i ■/. ; i )■ 74686731 36 h i 23 5o i'l :i *5 ■4' *0499 13 16 128360 31'*1 8 71' i t i
7771 28 ID71 91 9/ ■M12 1 1 ,'8 ' i926647 21 5350 32 rM25 Jl ; ; 1I ' L
8343 1137 7151 53Ml "0 71 1 4*1 \ \
65270091 61 22 26 I . ' 6t 62 '2 ‘ 41239 1622 65 1965 75*-) 8 1■ ..111 ■ 4M31365861 1637 52 l 0 ) 1 (■ 44 4 '*60292937 71 21 96 n to i,5 '8 11 V, ■A
27110086 (7 33 ■Hi 26o5 10 M' 1'4 ; a815392 50 23 76 20 47 15'0 *2 *'*63885902 19 13■JOill (1 01 "5 ' ' (5 ' *7947 1296 0375 93 8 I 56 •it < i 11 ' ■ *2074 It 56 2382 ;:i '*5 73 4:t r, ■ 1n17520695 0553 3.5 Vi i'l 21 201 4 ■1128097 19 77 1335 17« 1 '*2 \. i *4 m
■199063 19 5307 57 H 10 > i*i It ■ 1 1) r 2
42 1803 11 4380DO93 51 11 ;- 17 118355 II 86 2376 806156 1111 ; ) s 1 \
H22970 1771 90 12■)7 o'* 11 *1 119 680091 3206 76 31i.o '■ ’ I'i6322 10 II 0333 76 .56
11* '
* ■1774 1606 1793 51 «'.) 111 i [6995 37 29 2882 53 57 < V*
4 ln'f 7
* *i : * *127088
690030
311795
035423
128363
818201
131519 «>
9)i i'll
51 It it 1
.8
4 • pi itt
342378 21 33 32 53n3 51 1128 50 1392 1797 11 5l i)871 8 1*■ i : i64282413
91366842
20820665
1)6588629
63697626
23571676
102133o3
2' I 37 4236
k i
9«2217
i41
1 1* i* i ■4
*il
; 1 44
83 87 62 30
5873
5992
1912
3656
4791
31i'i’
5 121*1
1* 8 ‘ 8
* 7
7549
9537
170959
97.85
3713u3 2-552
7951 a I (' * 1
161735 76 4651 ' 1 j *" '

267A P P E N D IX 6
IN D U S T R IA L LOCATION VARIABLES AND T m iK (
V A M A B L E c o m :
V01 Local availability of raw materials K VM xV02 Availability of local capital for investment pix'AV03 Proximity to other establishment PROXIV04 Presence o f urban economies y rj ■ p()V05 Availability of local market l.OMAV06 Low transport cost TKACOV07 Nearness to home HOMRV08 Access to power supply post.’V09 Suitable underlying rock structure ROCKV10 Suitable surface configuration Sl.T'OV ll Availability of cheap land for expansion LANDV12 Influence of government GOYHV13 Influence of local politics LOPOV14 Adequate water supply WASfV15 Labour supplyV16 Influence of personal considerations W
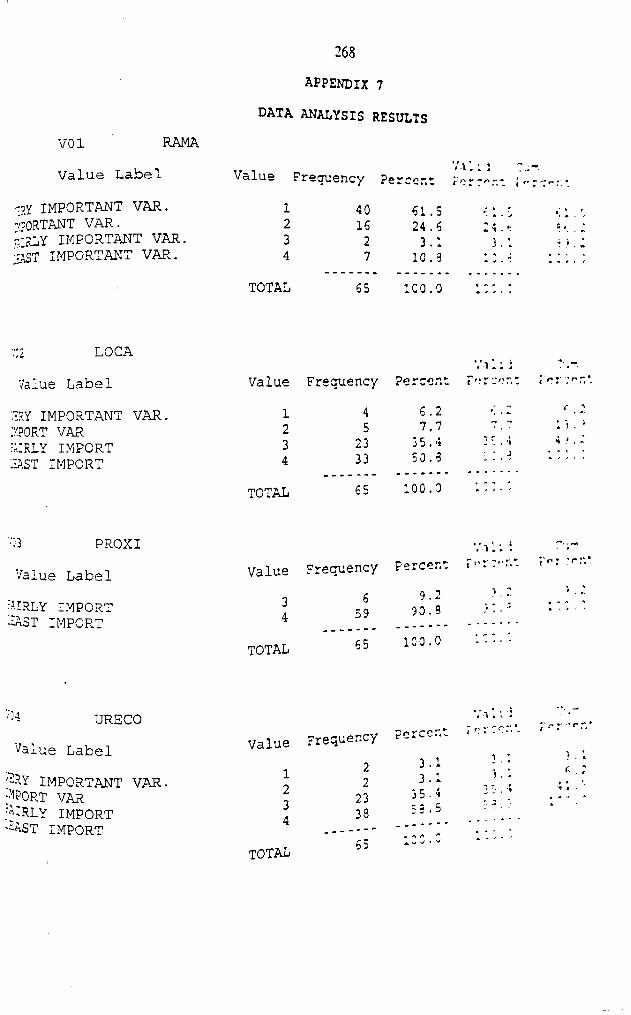
268
APPENDIX 7
DATA ANALYSIS RESULTS
V01 RAMA
Value Label Value Frequency 7.1.; : 7-*-.Percent Per r r.t \ ” r \
oy IMPORTANT VAR. 1 40 61.5 61.3 613".'"ORTANT VAR. 2 16 24.6 2 4,6 s *, 2::IRLY IMPORTANT VAR. 3 2 3.1 3,1 3).;•r ST IMPORTANT VAR. 4 7 10.8 i:.6 i::. ;
TOTAL 65 ico.o i o o.:
:2 LOCA Vi 11 iValue Label Value Frequency Percent Percent I n z '* r,
3 Y IMPORTANT VAR. 1 4 6.2 r ~ r 2
."TORT VAR 2 5 7.7 * , • j «
:.;:rly i m p o r t 3 23 3 5.4 3 5.4 4 * ,EAST IMPORT 4 33 50.8 j - * > * * ‘ *
TOTAL 65 100.0 13 3. .
03 PROXI
Value Label Value Frequency Percent p t 'Z V 'T . 'L P*:
"Ur l y IMPORT - AST IMPORT
34
659
9.290.9
i, 2. » . .3 3 3V 133.3
TOTAL 65 100.0 13 3..
',J* URECO
V a lu e L a b e l
i^Y IMPORTANT VAR. ^PORT VAR AIRLY i m p o r t '-AST IMPORT
Value Frequency
1234
TOTAL
22
2338
65
r c c r*
3 .13 .1
35.458.5
■ n ;■ 7 C T, t
i .; i i c
> a

269
LOMA
V a lu e L a b e l V a lu e E re c u e r.cv■ i . . ;
3 V IMPORTANT VAR. l 23 3 5 . ; , ,7P0RT VAR uiRLY IMPORT
23
126 *4 ^
RAST IMPORT 4 24 3 6 .9 3 *;. >
TOTAL 65 ICC .3 : : : . :
706 TRACOv i l : i
V a lu e L a b e l V a lu e F re q u e n c y ? p r c o r, t
VERY IMPORTANT VAR. 1 12 1 3 .5 * * , „IMPORT VAR 2 15 2 9 .2 2770FAIRLY IMPORT 3 7 ' 3 10.-;LEAST IMPORT 4 27 4 1 .2 t * - ,
TOTAL 65 ICC . 0 10 0. 0
707 HOME
V a l u e L a b e l V a lu e F re q u e n c y r ror, , \ . : :
TRY IMPORTANT VAR. IMPORT VAR
12
1216
1 3 .3 24 . 4 <1. ‘I ,
A IR L Y IMPORT -EAST IMPORT
34
l ) 13
TOTAL 65 'CO o . . . . .
Y3 POSUVi * ; »
V a l u e L a b e l V a lu e F re q u e n c y r ^ ^ t C ' - 2 f * *
TRY IMPORTANT VAR- 12
14IB
r* * -t ; 2 -
IMPORT VAR 3 9 1 3 .0A i r l y i m p o r t 4 24 3 6 .9 ' *'' •-EAST IMPORT ------ ------ - - - - - - -
t o t a l 6 5 » w J * >
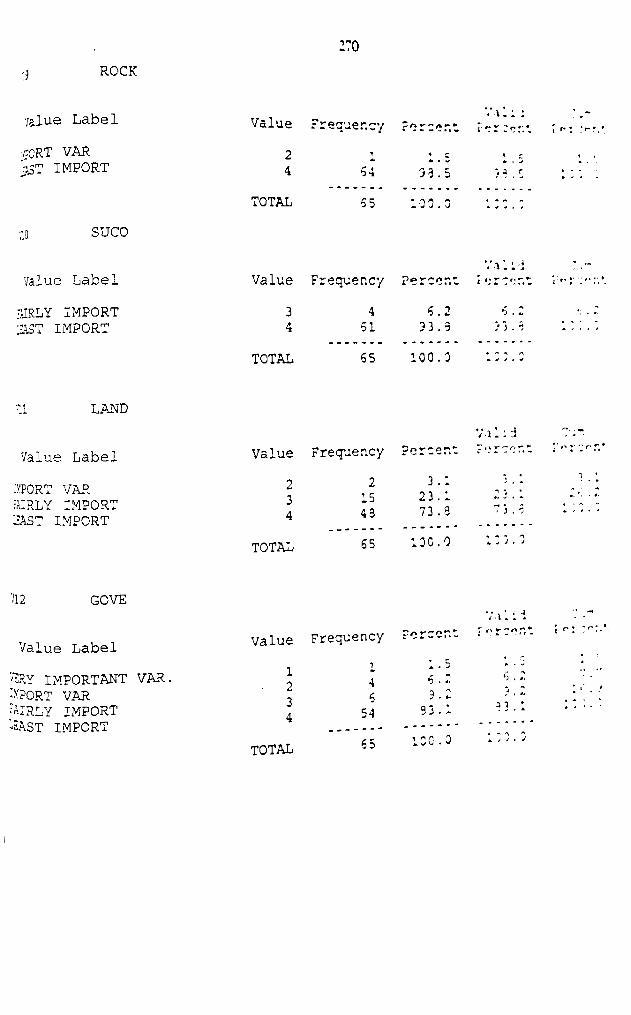
270
'j ROCK
Value L a b e l V a lu e F re q u e n c y
:/:0RT VAR c£T IMPORT
24 64 3 9 .
TOTAL 65 10 0 .
:o SUCO
V alue L a b e l V a lu e F re q u e n c y P e r c e
■URLY IM PORT FAST IMPORT
34
461
6 . 33 .
TOTAL 65 100 .
11 LAND
V a lu e L a b e l V a lu e F re q u e n c y P e rc e i
IMPORT VAR AIRLY IMPORT HAST IMPORT
234
21549
3 . 23 . 73 .
TOTAL 65 1 0 0 .1
12 GOVE
V a lu e L a b e l V a lu e F re q u e n c y P e rc e i
';SRY IMPORTANT VAR IMPORT VAR ?AIRLY IMPORT -aAST IMPORT
46
54
65
1. 6 . : 3 . 2
9 3 . i
ICC . 3
ij ri rc
7V_: i
6 . : } j . 9
: : : . o
' ■ Ai . :
j ,
4 \
*) , 1
93. :
t o t a l
u> tn

271
LOPO
;a lu e L a b e l Value Frequency PercentValidPercent
CuePercent
jy IMPORTANT #}RT VAR iRLY IMPORT i ST IMPORT
VAR. 1234
51356
7.71.54.6 66.2
7.71.54.6 66.2
7.79.;1)6* i V V . V
TOTAL 65 100.0 100.0
y w a s u
Valid CunValue L a b e l Value Frequency Percent Percent Percent
TRY IMPORTANT VAR. 1 1 1.5 1.5 1.5IMPORT VAR 2 4 6.2 6.2 7.7>:rly i m p o r t 3 7 10.6 10.6 16.5IAST IMPORT 4 53 81.5 e : . s 100.c
TOTAL 65 100.0 10C.0
<15 LASU
Valid CunValue L a b e l Value Frequency Percent Percent Percent
IMPORT VAR &IRLY IMPORT
23
12143
1.532.366.2
1.532.366.2
1.533.61CC.C
--AST IMPORT 4TOTAL 65 100.0 100.c
PECOValid Cur
^ 'a lu e L a b e l Value Frequency Percent Percent Percent
'^ Y IMPORTANT VAR. 1 522
7.733.6
7.733.6
7.741.5
:tt?0RT VAR 2 24 36.9 36.9 78.5MlRLY IMPORT 3
A 14 21.5 21.5 100. c"^ST IMPORT H
TOTAL 65 100.0 100.c

C O R R E L A T IO N ’ M A T R IX
Correlations V01 * Z Zi 70 3V01 VO 2
1.00 00 - . 1S 2 0 * r r * i* . U w J
V03 . i 6 s o " . * _* *> 'j « '■ >VOS -.1039 0 : ' 7 ‘ Z' ** *V06 .9000 .02 3 3 r ^VO 7 .0799 . 3*74 * * tVC 6 - .1166 .CSC 7 * i : *?VI1 .2588 - . 164 2 .222 3VI2 . 1257 - , ? 4 » 7 . 2 : 0VI 2 . 1650 -.13 4 S - .0 6 3 3VI4 .2125 ~ ^ f4 1 .270 1VIS .1412 - . 0216 1 1 n
vie .611 5 . 0 ‘ - 4 2 - .19 2 3V04 . 0884 - . 04V 6 j_4 4; 3.VC 9 . 0714 -.ice7 jC! 3 . 5VI 0 . 0702 -.1001 4! 4 f,
Correlations V08 Vll t f ■
VO 8v:i
1 . OOCO - .1286 1 . 0 0 0 0
VI2 .0364 . 1666 1.0000V 13 - .1179 .0910 K ' C
VI4 .5484 . 114 0 - . 1 2 2 2
VI 5 - . 2343 . 1975 - .12 21VI 5 . 1105 - . 23 3 3 - , 0 2 9 5
VC 4 .4144 . 1005VC 9 - . 1102 . 24 00 . 9 2 7 *
VI 0 - .1021 .2100 . 3 11 0
Correlations V16 VO 4 VO 9
VI6 VO 4
1 . 0000 - .3049 1.0000
VO 9 - . 1945 . 0992 1.0000V10 - .2105 . 1092 0.6015
Copyright © 2022 FDOKUMEN


![[Variables associated with leisure-time physical inactivity and main barriers to exercise among industrial workers in Southern Brazil]](https://static.fdokumen.com/doc/165x107/633b13fd09567e180305ca03/variables-associated-with-leisure-time-physical-inactivity-and-main-barriers-to.jpg)