Industrial location, spatial discrete choice models and the need to account for neighbourhood...
27
1 Industrial location, spatial discrete choice models and the need to account for neighbourhood effects by Artal-Tur A*, Alamá-Sabater L**, Navarro-Azorín JM*** Abstract. This research, following the pioneering contributions of Autant- Bernard (European Planning Studies 14:1187-1208, 2006) and Vichiensan et al. (Journal of the Eastern Asia Society for Transport Studies 6:3789-3802, 2005), extends the spatial conditional logit model in order to account for the role that neighbourhood effects play in the firms’ location choices, defining a theoretical model where externalities or spillover effects now enter the decision-maker’s information set. We apply this new methodology to a sample of 8,000 industrial establishments at the municipality level, with our results showing that supply-side location factors, such as human capital and agglomeration economies, together with institutional factors, i.e. industrial land availability, are the main forces driving entrepreneurs’ decisions. Furthermore, results on the spatial component of the model show that inter-municipal spillovers have a remarkable influence on the location decisions of the firms. Particularly, we observe that attributes of neighbouring municipalities are found to exert nearly the same influence as those of the chosen municipality in guiding one firm’s choice, thus confirming the need to account for such spatial interdependences when studying location choices of industrial companies at a local level. JEL Classification : R12, R30 Keywords : industrial location, spatial conditional logit, neighbourhood effects, inter-municipal spillovers (*): Artal-Tur, Andrés (corresponding author) Departamento de Economía - Universidad Politécnica de Cartagena Pº Alfonso XIII, 50, 30203 Cartagena (Spain) Phone: +34 968 32 56 47 E-mail: [email protected] (**): Alamá-Sabater, Luisa Departamento de Economía - Universitat Jaume I Campus del Riu Sec, E-12071 Castelló de la Plana (Spain) Phone: +34 964 72 86 12 E-mail: [email protected] (***): Navarro-Azorín, José Miguel Departamento de Economía - Universidad Politécnica de Cartagena Pº Alfonso XIII, 50, 30203 Cartagena (Spain) Phone: +34 968 32 56 64 E-mail: [email protected]
Transcript of Industrial location, spatial discrete choice models and the need to account for neighbourhood...
1
Industrial location, spatial discrete choice models and the need to
account for neighbourhood effects by Artal-Tur A*, Alamá-Sabater L**, Navarro-Azorín JM***
Abstract. This research, following the pioneering contributions of Autant-Bernard (European Planning Studies 14:1187-1208, 2006) and Vichiensan et al. (Journal of the Eastern Asia Society for Transport Studies 6:3789-3802, 2005), extends the spatial conditional logit model in order to account for the role that neighbourhood effects play in the firms’ location choices, defining a theoretical model where externalities or spillover effects now enter the decision-maker’s information set. We apply this new methodology to a sample of 8,000 industrial establishments at the municipality level, with our results showing that supply-side location factors, such as human capital and agglomeration economies, together with institutional factors, i.e. industrial land availability, are the main forces driving entrepreneurs’ decisions. Furthermore, results on the spatial component of the model show that inter-municipal spillovers have a remarkable influence on the location decisions of the firms. Particularly, we observe that attributes of neighbouring municipalities are found to exert nearly the same influence as those of the chosen municipality in guiding one firm’s choice, thus confirming the need to account for such spatial interdependences when studying location choices of industrial companies at a local level.
JEL Classification: R12, R30
Keywords: industrial location, spatial conditional logit, neighbourhood effects,
inter-municipal spillovers
(*): Artal-Tur, Andrés (corresponding author) Departamento de Economía - Universidad Politécnica de Cartagena Pº Alfonso XIII, 50, 30203 Cartagena (Spain) Phone: +34 968 32 56 47 E-mail: [email protected]
(**): Alamá-Sabater, Luisa Departamento de Economía - Universitat Jaume I Campus del Riu Sec, E-12071 Castelló de la Plana (Spain) Phone: +34 964 72 86 12 E-mail: [email protected]
(***): Navarro-Azorín, José Miguel Departamento de Economía - Universidad Politécnica de Cartagena Pº Alfonso XIII, 50, 30203 Cartagena (Spain) Phone: +34 968 32 56 64 E-mail: [email protected]
2
1 Introduction
When deciding to start a new business, the choice of where to locate the facilities
is one of the most crucial steps of the process. This decision is so important that it
could determine the success not only of the firm’s current activity but also its
future (Strotmann 2007). Increasing complexity is undoubtedly a feature of
today’s international economy with many variables affecting location decisions,
making this a key issue in the firms’ strategies. In this context, it is not difficult to
understand why we have seen a renewal of interest in location studies in recent
decades (McFadden 2001; McCann and Sepphard 2003).
Empirical studies of industrial location have been one of the most active lines of
research in this field since the late 1980s, with academic contributions trying to
identify the main factors driving firms’ choices. From a methodological point of
view, the study of the determinants of industrial location follows two different
econometric approaches, namely Discrete Choice Models (DCMs) and Count
Data Models (CDMs) (Arauzo et al. 2006). On one hand, DCMs analyse the way
in which the characteristics of the decision-maker, such as firm size, sector of
activity, etc., affect the choice itself, constrained to the set of geographical
alternatives available (Mc Fadden 1974; Carlton 1983). On the other hand, CDMs
confront the decision problem by investigating which of the characteristics of an
area affect the number of companies established in that particular location for a
certain period of time (Becker and Henderson 2000).
In terms of computational requirements, both approaches have their own pros and
cons, with DCMs allowing for a richer information set combining both firm/plant
and spatial unit characteristics, while CDMs appear more tractable in order to
compute the likelihood function if the number of alternatives becomes too large.
However, both approaches rely on the same theoretical framework, a profit
maximisation problem in which the firm chooses the location that reports the
higher expected profit, given standard constraints (Mc Fadden 2001; Mc Fadden
1978; Carlton 1983). As some authors have noted, we can even think of both
models as reduced-form results coming from the same location choice structural

3
model. For this reason, this methodological framework has proved extremely
useful, given the flexibility and degree of generality that it allows, becoming a
standard in the literature (Guimarães et al. 2004; Becker and Henderson 2000).
It is worth noting that in this theoretical framework the decision-maker simply
uses information on every individual location when computing the expected profit
from locating in that particular spatial unit. However, as the spatial economy
literature highlights, the value achieved by a variable (i.e. profits) in one particular
location may be affected by the realisation of the same, or other, variables in
nearby locations because of spatial dependence effects (Anselin 1988) and the
presence of external economies and spillovers (Ellison and Glaeser 1997; Fujita
and Thisse 2002). On this point, it seems reasonable that a more appropriate
location choice model should incorporate these potential spatial effects into the
decision-making process.
Despite the importance that the topic of location choices has shown in guiding the
decisions of entrepreneurs, managers and policy makers, and although this has
proved to be a very fertile field of research, little work has been done to date on
incorporating spatial dependence in location choice models, particularly for the
discrete choice framework (Fleming, 2004). Early contributions in this literature
take the simple form of spatial binary choice models (Murdoch et al. 2003; Marsh
et al. 2000), with recent developments of spatial probit models (Coughlin et al.
2004; Holloway et al. 2002) since the launch of the Spatial Econometrics toolbox
for MATLAB by professor James P. Le Sage. Other recent contributions include
the use of spatial multinomial logit models, with interesting applications to
environmental and transport planning studies (Nelson et al. 2004; Mohammadian
et al. 2003), but the literature is clearly at a very early stage concerning the use of
spatial conditional logit models, the family of DCMs usually employed in
industrial location studies.
To the best of our knowledge, only two references appear in the literature. The
first one is the paper by Vichiensan, Miyamoto and Tokunaga (2005), which
extends the conditional logit model by considering a spatial autoregressive
structure in both the deterministic and the stochastic part of the model

4
specification. The idea is to capture external economies that influence the
decision-maker in his/her location choice. However, the exercise is devoted to a
residential choice analysis in Senday City (Japan), and its focus is more on
identifying how the geographical dispersion of alternatives affects the decision-
maker’s choice. In their exercise, the significance of the spatial variable of the
model appears to be highly dependent on the spatial pattern that characterises
location alternatives. The main drawbacks of this approach stem from the
computational difficulties it poses with a large set of alternatives, as estimation
would turn into a very complex, maybe unfeasible, task.
The second reference is that of Autant-Bernard (2006), who implements a
conditional logit model in order to search for the location determinants of R&D
laboratories in France. The unit of analysis is the administrative region (NUTS 2)
and the model incorporates a spatially lagged term for every explanatory variable
in order to determine the spatial scope of knowledge spillovers. The estimation
results show that only private R&D expenditure appears to generate inter-regional
knowledge spillovers that influence location decisions of R&D labs in France.
In this context, the aim of our paper is to continue extending the spatial
conditional logit framework for industrial location studies. Two contributions are
made to the literature. The first one is analytical, consisting in using
municipalities as the geographical unit of analysis, which allows us to better
account for the existence of spatial spillovers from a firm’s perspective, as recent
contributions have noted (Arauzo 2008; Holl 2004). The second one, which
constitutes the real core of the paper, is methodological, and seeks to specify a
theoretical model where externalities or spillover effects enter the decision-
maker’s information set. But, in line with the spatial econometrics approach and
departing from previous contributions, we propose to approach these
neighbourhood effects using a synthetic measure combining both social and
economic characteristics linked to nearby areas, specifying in this way a unique
source of spillovers that captures all of the spatial effects affecting the firm’s
choice; an approach we think is closer to the theoretical concept of spatial
dependence.

5
To this purpose, we develop a new framework that accounts for spatial effects in
the firms’ decision process. After that, we apply our new methodology, studying
the factors driving location choices of more than 8000 industrial establishments in
the Spanish NUTS 2 Region of Murcia. Availability of detailed micro-data
containing the main characteristics of industrial firms and territorial units
(municipalities) for this region offers an excellent opportunity for obtaining
empirical evidence on the performance of our new methodological proposal. To
anticipate some of the results, we find that human capital, agglomeration
economies and industrial land availability are the main forces driving location
decisions for industries in this region, with results on the spatial component of the
model showing that external economies or spillovers have a remarkable influence
on firms’ location decisions. Attributes of neighbouring municipalities are found
to exert nearly the same influence as those of the chosen municipality in guiding
the decision-maker’s choice, thus confirming the need to account for such spatial
interdependences when studying location choices of industrial companies at a
local level.
After this introduction, the rest of the paper is organised as follows. In section 2
we develop our theoretical model. Section 3 includes the discussion of the
database, presents the econometric model and includes the empirical results of the
paper, while section 4 reports the conclusions of the research.
2 Spatial discrete choice models and location processes
Our theoretical model builds on the standard random utility maximisation (RUM)
framework employed to analyze the firms’ location behaviour. In this framework,
firm i decides where to locate, among a finite set of J location alternatives
(municipalities), according to the expected profit that every location j is reporting.
The choice could be described as a maximisation problem of the profit function of
the firm, a function given by:
, 1,..., ; 1,...,ij j ijX i N j Jπ β ε= + = = . (1)
6
where jX is a 1 M× vector of local geographic and economic conditions, β is a
vector of parameters, and ijε is a random error term capturing the characteristics
of the decision-maker or unobservable attributes of the choices.1 Under profit-
maximising behaviour, location in municipality j is chosen by the firm i
whenever,
, , 1,...,ij ik k j k Jπ π≥ ∀ ≠ = . (2)
that is, the alternative j is chosen when its attributes ensure the greatest expected
profits to the firm. Therefore, the probability that a firm i is located in the
municipality j, given its characteristics and those of the alternative locations,
yields
( )Pr , , 1,...,j ij ikP k j k Jπ π= ≥ ∀ ≠ = . (3)
It can be shown that, if disturbances are independent and identically distributed
following a Weibull distribution, then the probability that the firm i chooses
alternative j is (Greene 2008),
( )( )1
exp
expj
j Jkk
XP
X
β
β=
=∑
. (4)
At this point, it should be noted that in the standard (conditional logit) framework
the firm uses information on both the characteristics of the chosen location (j) and
those of the alternatives (k =1,…,J) when taking its choice (see equation (4)).
However, when computing the profits function of locating in municipality j, the
decision-maker is using only information on that individual location, losing all
other information sourced by neighbouring locations (see equation (1)). By
contrast, empirical evidence and the same literature on industrial location
determinants suggest that expected profits from locating in a particular
municipality are also influenced by economic and social activity taking place in
the neighbouring areas, given the potential existence of externalities or spillovers
(Arauzo et al 2006; Fujita and Thisse 2002; Arbia 2001), the same effects hitherto
neglected by the standard theoretical model of (industrial) location choice.
1 The error term is assumed to be uncorrelated across choices, what leads to the usual assumption on the independence of irrelevant alternatives (Carlton 1983; McFadden 1974).
7
In this context, our approach pursues introducing this stylised fact in the
theoretical framework by accounting for the influence of these “neighbour area
attributes” on the firm’s profit function and consequently on its location choice,
entering the model as an important component of the decision-maker’s
information set.2 In order to introduce this “neighbourhood” component in
location models, we propose to modify the systematic part of equation (1) by
including a term that captures the potential spillovers influencing the decision of
the firm as follows:3
1
, 1,..., ; 1,...,J
ij j jl l ijl
X w X i N j Jπ β δ β ε=
= + + = =∑ , (5)
where { }1, ,jl l J
w= K
is a weighting sequence defined in terms of the distance
between municipalities j and l. In general, we still do not address any precise
definition of distance, which could be based on economic, geographic, or socio-
cultural considerations.4
The proposed extension of the model shows, as seen in equation (5), that now the
expected profits of locating in municipality j would depend not only on the
attributes collected by jX , but additionally on the spatially weighted average of
the attributes of alternative locations. Consequently, the parameter δ would be,
by definition, a synthetic measure of the strength that neighbourhood effects
detent when affecting the choice of firm i, by influencing its expected profits’
function. This approach clearly departs from previous contributions in the
literature, improving them in two ways: first theoretically, allowing for the
inclusion of these neighbourhood effects as an extension of the model (McFadden
2001; McFadden 1978; Carlton 1983), and second empirically, providing an
estimate of a single quantitative value which summarises the influence that this
local dependence pattern has on the firm’s choice. It is worth noting that a similar
2 It is important to note that although dozens of social and economic characteristics of nearby locations could influence the firm’s behaviour, we are interested in including in our extended model only those that have a direct impact on the firm’s expected profits, because only these would matter when constructing the firm’s choice probability function (Train 2003). 3 Note that this specification for the expected profits resembles the spatial cross-regressive model (Anselin 2003; Florax and Folmer 1992). 4 Note that this offers the theoretical model an opportunity of becoming a valid framework for different types of location studies, as, i.e., those devoted to industrial location, marketing or even industrial organisation studies.

8
measurement which allows for retrieving the spatial dimension in location models
is not present in this literature (Autant-Bernard 2006; Vichiensan et al. 2005).
Empirically, a positive value of the spatial parameter, 0δ > , would be implying
that external economies play a significant role in the firm’s choice, while a
negative value of the parameter, 0δ < , would be reflecting the existence of
congestion/dispersion externalities in the chosen municipality which affect the
firm’s profits (Viladecans 2004).
Furthermore, if we assume that the error terms in equation (5) are independent and
identically distributed following a Weibull distribution, the probability of firm i
to choose municipality j is now:
( )
( )1
1 1
exp
exp
Jj jl ll
j J Jk kl lk l
X w XP
X w X
β δ β
β δ β
=
= =
+=
+
∑∑ ∑
, (6)
from which it is straightforward to compute marginal effects as:
( )( )1 if
1 if
j jj
l j jl j l
P P l jPX P w P P l j
β
δ β
⎧ − =∂ ⎪= ⎨∂ ⎡ ⎤− − ≠⎪ ⎣ ⎦⎩ (7)
We can also define marginal effects with respect to the spatially weighted
attributes, denoted by 1
Jj jl ll
WX w X=
=∑ ,5 as:
( )1jj j
j
PP P
WXδ β
∂= −
∂. (8)
By comparing expressions (7) and (8) for l j= we can conclude that, for the m-th
attribute,
,
,
, 1, ,j j m
j j m
P WXm M
P Xδ
∂ ∂= =
∂ ∂K , (9)
which means that the parameter δ is by construction measuring the relative
importance that neighbourhood attributes have as compared to specific local
attributes (of the chosen j-th alternative) in the decision-making problem. A value
of δ greater than one would now imply that the neighbourhood attributes
5 Note that under this notation we can rewrite the expected profit of a firm i of establishing itself in municipality j as , 1, ..., ; 1, ...,ij j j ijX WX i N j Jπ β δ β ε= + + = = .
9
affecting the decision of a firm located in the municipality j appear to be of greater
importance than those of municipality j itself; that is, the firm locating in
municipality j is intending to benefit more from neighbourhood advantages than
from its own local advantages. By contrast, a positive value of δ below one
implies that, even though spatial effects are important for the firm, they seem less
important as location attractors than the specific attributes of the chosen location,
what appears to be a more plausible result.6
3 Empirical results
3.1 Data
Having defined our new theoretical model, we are now interested in identifying
the factors that are influencing the firms’ location choices, and capturing the role
that external economies are playing in this process through spatial spillovers. Our
dependent variable is the number of industrial establishments operating at the
municipality level in the Spanish Region of Murcia in 2006. This information is
obtained from the Business Directory (DAERM) of the Regional Statistical Office
of Murcia, which reports information on 8429 industrial establishments classified
by municipality of location and sector of activity.
Using the municipality as the geographical unit of analysis is a novelty in spatial
logit models, and also seems the appropriate approach in order to capture spatial
local spillovers that influence decision-makers in their location choices. By
applying this geographical focus we look to overcome a common error in spatial
analysis, the so-called error measurement problem, which appears when the
spatial dimension of the variable we want to measure does not properly match that
of the chosen spatial unit of analysis in the research (Haining 1995; Rosenthal and
Strange 2003). Moreover, as some authors have noted, this approach usually
reports the most robust results on location analysis when employing
6 Note, however, that this extended framework would open interesting research possibilities to studies analyzing the effects of congestion or negative spatial externalities on location choices, a type of study which is still rare in this literature (see, i.e., Arauzo 2006, footnote 14).

10
characteristics of areas as explanatory factors of location choices, as we do
(Arauzo and Manjón 2004; Arauzo 2008).
The dataset also comprises information on the geographic and economic treats
characterising the 45 municipalities making up the Spanish Region of Murcia,
obtained from the Regional Statistical Office of Murcia, which allows us to
conform the explanatory variables set of the model. Detailed information on social
and economic characteristics of small territorial units is not usually available with
such a degree of detail, so the existence of a richer dataset in this respect for the
Region of Murcia has guided our decision to apply the new theoretical framework
to the analysis of industrial location choices in this region.
We begin by introducing agglomeration variables in the explanatory set, given
their central role in the literature on industrial location. In general, agglomeration
effects can be defined as external effects including all economies that are an
increasing function of the number of nearby firms (Head and Swenson 1995). If
the firms belong to the same industry, we define these economies as localisation
economies, but in case they belong to different industries they are termed
diversity economies.7
The concept of localisation economies is intended to capture all firm’s advantages
generated by the concentration of industries from the same sector near one
another, due to the existence of information spillovers derived from informal
contacts between the staff of the firms or whatever other externalities arising
because of the firms’ proximity (Arauzo et al. 2006; Figueiredo et al. 2002; Head
and Swenson 1995). This type of agglomeration economy is generally identified
in the recent literature as Marshall-Arrow-Romer (MAR) externalities (Glaeser et
al. 1992). To measure localisation economies we use a standard index capturing
the degree of industrial specialisation of municipality j, in terms of employment,
7 A general characterisation of agglomeration economies is due to Hoover (1936), whom defined localisation economies as those arising because of the concentration of firms from the same sector of activity, while terming as urbanisation economies to those deriving from a concentration of economic activity, whatever their source. In order to differentiate from localisation economies, we have preferred to use the concept of diversity economies furtherly developed by Jacobs, given the importance shown by this type of externality in today’s post-industrial economies (see, e.g., Jacobs 1969).

11
in comparison with the specialisation that characterises the whole regional area
(LOC).8
On the other hand, the existence of a considerable number of different industrial
activities in the same location generates diversity economies, also named Jacobs’
external economies (Jacobs 1969; Duranton and Puga 2000). The concept
captures the external economies improving the firm’s performance that stem from
the diversity of industries (or services) surrounding the firm. Externalities arise
because of enhanced local competition or due to the added-value it provides to the
activities of the firm by improving access to new industrial inputs or services. In
this paper, industrial diversity economies are captured by an index (DIV)
computed as one minus the Herfindalh-Hirschman concentration index. Higher
values of this index are associated with a more diversified local industrial
environment.
Secondly, together with the agglomeration forces, as the literature on industrial
location studies conveys, we must also include some supply-side location factors
in our explanatory variables set. This kind of location factor is captured here by a
human capital variable (HC), computed as the percentage of the labour force that
has completed secondary and tertiary level education in every municipality
(Coughlin et al. 1991; Coughlin et al. 2000). The importance of human capital,
proxied by levels of education among the local workforce, for firms’ location
choices is well documented in the empirical literature. Some contributions even
note the important role played by this variable in attracting industries with high
knowledge content (Audrestch and Lemman 2005).
Thirdly, other municipal characteristics are included as explanatory variables,
such as the total local population (TPOP) which acts as a demand-side variable,
the ratio of local industrial employment to regional industrial employment
(NIND) and the corresponding measure for the service sector (NSERV), both as
factors reinforcing the role of sectoral specialisation of the municipality on
industrial location choices, and the availability of industrial land (INDSURF)
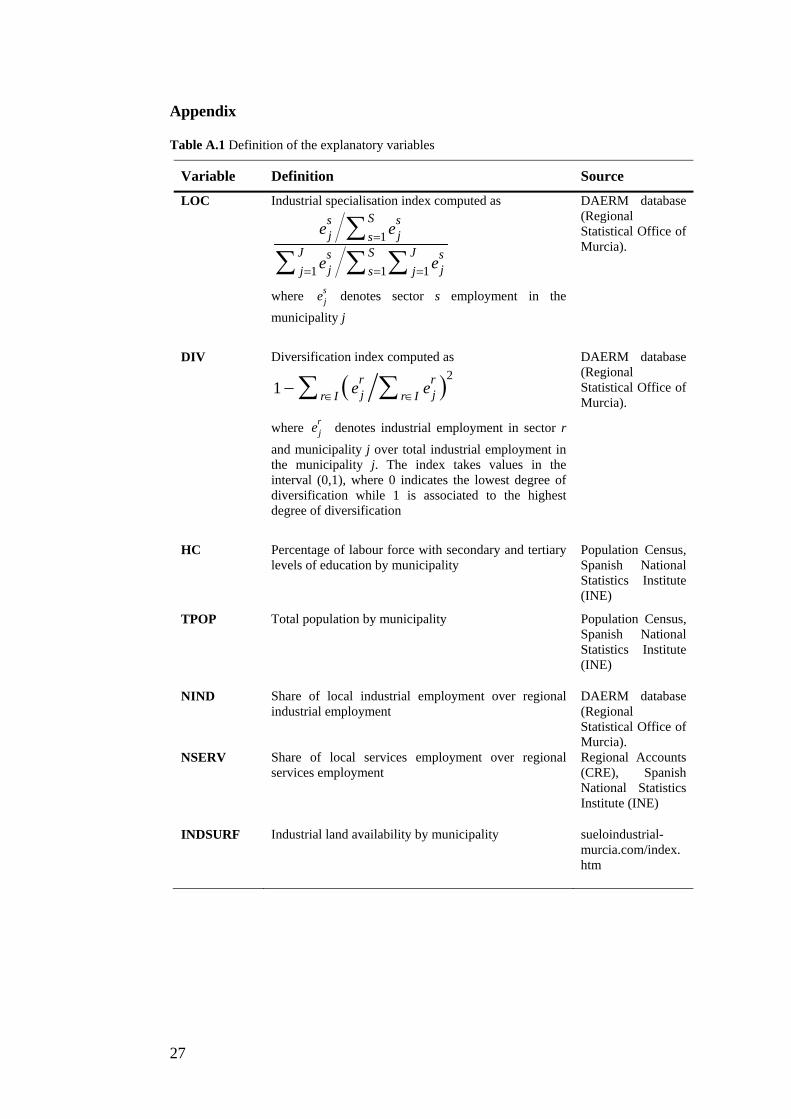
8 See the Appendix for a more detailed description of the explanatory variables and statistical sources employed in the econometric study.
12
serving as an endowment variable reflecting local and regional efforts to provide
the necessary conditions for attracting new industries (Woodward 1992;
Guimarães et al. 1998). As one can see, our pool of locational factors basically
includes neoclassical factors, as we are embedded in a profit maximising
framework, but also includes an endowment factor in order to account for
institutionally-driven factors (Arauzo et al. 2006).
All expected coefficients for the explanatory variables of the model are assumed
to be positive, as all of them strengthen the relative position of a municipality as a
potential location for firms, as pointed out by the literature (Arauzo et al. 2006;
Viladecans 2004).
Our final specification for the expected profit of firm i when establishing in
municipality j is then given by,
1 2 3 4 5 6
7 1 2 3 4
5 6 7
()
ij j j j j j j
j j j j j
j j j ij
LOC DIV HC TPOP NIND NSERV
INDSURF WLOC WDIV WHC WTPOP
WNIND WNSERV WINDSURF
π β β β β β β
β δ β β β β
β β β ε
= + + + + +
+ + + + +
+ + + +
(10)
where the spatially weighted averaged variables are computed using a weight
matrix W, what constitutes a standard of the spatial econometrics approach
(Anselin 1988).
The weighting scheme of our neighbourhood attributes will obviously depend on
the definition of distance used. Here we adopt a standard spatial econometrics
approach by defining the weights in terms of the inverse Euclidean distance
between municipalities. The exact definition then yields:
1
11
( )
( )
0 if
if jl
jlJ
jll
jl
jl
d R
d R
j ldw j l
d
−
−=
≤
≤
=⎧⎪⎪= ⎨ ≠⎪⎪⎩∑
1
1
where jld is the Euclidean distance between municipalities j and l; ( )1 is an index
function that equals 1 when the municipality l is within a circle with radius R and
centre in the municipality j, and zero otherwise. It is equally important to note that
this definition of distance implies that in the decision of locating in municipality j,
13
the firm is just taking into account the characteristics of the nearby municipalities
which lie inside the defined circle, which we term as neighbours. This approach
allows us to calibrate the extent to which spillovers exert an effect on the firm’s
profits function, adding some rationale in line with the most recent industrial
location literature on spatial spillovers (Arauzo 2005).
3.2 Some econometric issues about the estimation procedure
The parameters β and δ in equation (10) can be estimated by maximising the
log-likelihood function,
1 1 1
log log logN J J
cl j j ji j j
L P n P= = =
= =∑∑ ∑ , (11)
where jn is the number of firms which have chosen municipality j.
As we have mentioned, from a computational point of view, estimating the
resulting spatial conditional logit by maximum likelihood methods may be
cumbersome, especially when the number of alternatives or locations becomes
large enough. Although this is not now the case, we decide to follow the
estimation procedure proposed by Guimarães et al. (2003) when estimating our
spatially extended model, consisting of recovering conditional logit parameter
estimates from CDMs results, given that the main contribution of the paper is
methodological and in this way it could easily be generalised to other empirical
studies which certainly share this problem.
As these authors demonstrate, there is an equivalence relationship between the
conditional logit and Poisson likelihood functions. In this way, if we assume that
jn is Poisson distributed variable, with mean
( )1
E expJ
j j jl ll
n X w Xα β δ β=
⎛ ⎞= + +⎜ ⎟⎝ ⎠
∑ . (12)
then the (concentrated) likelihood function for this Poisson regression model is,
1 1
log log log log( !)J J
p j j jj j
L N N N n P n= =
= − + + −∑ ∑ , (13)
where the third term exactly matches the likelihood function of the spatial
conditional logit model and the other three terms do not depend on the parameters
vector, remaining constant for a particular dataset. It then would follow that the

14
parameters in the spatial conditional logit model (5) can be estimated departing
from those using a Poisson regression. After applying this methodological
proposal, in the next subsection we discuss the estimation results of our
econometric model.
3.3 Results
A first look at the distribution of industrial establishments in the Region of Murcia
shows the existence of an important degree of firm clustering, with four
municipalities, Murcia, Cartagena, Lorca and Yecla, accounting for more than
half (56%) of the total number of establishments (DAERM database). This
clustering pattern is equally reflected by the percentile map in Figure 1, which
includes information on the distribution of industrial establishments over regional
municipalities. One municipality, the city of Murcia, stays in the upper percentile,
thus appearing to be the more attractive location for establishing an industrial
company, while other four municipalities – Cartagena, Lorca, Yecla and Molina
de Segura – are situated in the percentile range immediately below it, sharing a
similar capacity to attract industries.9 The other regional municipalities are not so
important in the regional arena, although we must distinguish between the
intermediate group, made up of 19 municipalities, and the three other percentile
groups occupying the last positions in the distribution of regional industries, with
21 municipalities – nearly half of the total of 45 in the region – accounting for just
10% of total regional establishments (DAERM database). Table 1 shows us the
important degree of sectoral specialisation that characterises the regional industry,
in which just three sectors account for 50.5% of total industrial establishments:
food industries, steel and metal products, and furniture and other manufactured
goods. These industries are largely established in the city of Murcia and
Cartagena, with the furniture industry mainly established in Yecla and the food
industry showing an important presence in Cartagena and Lorca.
9 The city of Murcia is the red-coloured municipality in Figure 1, with Molina de Segura located just above this municipality, Cartagena just below, Lorca on the left and Yecla right at the top of the map.
15
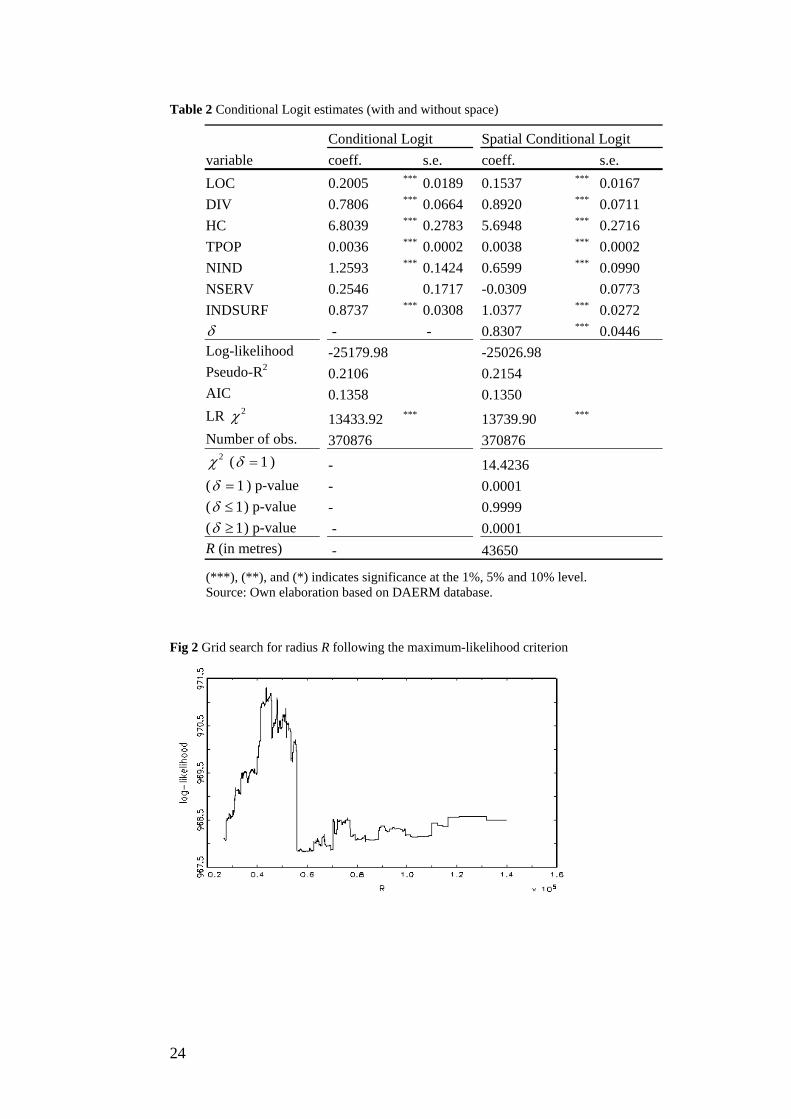
The results of estimating the conditional logit model are shown in Table 2.10 The
first and second columns summarise the estimation results obtained from applying
the standard conditional logit specification; that is, without including cross spatial
dependences between firms. On the other hand, the third and fourth columns
include estimates of the model once a spatially weighted average of the
neighbour’s attributes has been incorporated as an additional explanatory variable,
as described in the previous section. Table 2 also reports a collection of statistical
measures of the goodness-of-fit of the model, also testing some hypotheses on the
correspondent value of our spatial parameter of interestδ .
Regarding the value of the radius R used to compute the spatial weight sequence,
and given that we do not have any a priori information on the true value of the
parameter, we decide as a criterion of selection to choose the value of the
parameter that maximised the likelihood function for the proposed specification of
the model. After implementing this grid search procedure over a range from
25 km to the maximum distance between municipalities in the region, the
preferred specification has been those one with a correspondent value for radius R
of 43.6 km (see Figure 2).11
Turning now to the estimation results (Table 2, columns 1 and 2), it is remarkable
that, except for the case of NSERV, the sign for the locational factors is consistent
with the industrial location theory in all cases (Arauzo et al. 2006), and all
estimated coefficients appear to be highly significant. Goodness-of-fit measures
are in line with other empirical contributions in the literature, with an important
level of significance for the joint model. In general, the standard (conditional
logit) model results show that neoclassical factors continue to play an important
role in influencing firms’ choices at the local level. Agglomeration economies,
both localisation and diversity ones, appear as key variables in driving this
10 Estimation was carried out by using the GAUSS CML module. 11 Looking more deeply for reasons affecting this issue, we must note that the average distance between the municipalities in the Region of Murcia is of 45.3km, so our modelling approach to the issue seems to work reasonably well in empirical terms. Alternatively, two studies on the Spanish economy estimate an average radius of 15-30km. for the local markets of the municipalities of Catalonian and Valencian regions (Viladecans 2001, 2004). In this respect, and given that the municipalities of the Region of Murcia are slightly larger in terms of average spatial dimension than those in the two regions mentioned, our estimated value for radius R again appears a plausible one.

16
process, with our results showing that traditional, locally bounded, spillovers have
an important attraction capacity over industrial firms. The principal urban centres
of the region generate important agglomeration forces due to the existence of
consolidated industrial clusters, as it is the case of Yecla concerning the furniture
industry, or Lorca and Cartagena for the agri-food industry. However, diversity
economies appear as the most salient agglomeration factor in the region, which
denotes the importance of the existence of a diverse industrial environment when
choosing the location of a new industrial firm. In this respect, the two urban
centres with more than 100,000 inhabitants in the region, the city of Murcia and
Cartagena, reveal themselves as the main destinations of industrial firms,
reinforcing the result concerning the importance of diversity economies as a
location factor. This finding is also reinforced by the results obtained for the
variable NIND. Indeed, an important specialisation on industrial activities of the
chosen municipality acts as another relevant factor of attraction for new industrial
firms, so companies in this region seem to prefer locations with an important
presence of industrial firms and industrial employment. In addition, the variable
NSERV is not statistically significant, which seems to reflect the fact that the
presence of an important specialisation in services activities and a good pool of
employment in this sector of activity have a very limited role in the location
choices for the industries of the region.
Qualification of the labour force in the upper levels of the education system also
appears to be a very important factor for firms. Most populated municipalities are
preferred to less populated ones, with this variable (TPOP) acting as a demand-
side location factor. Finally, our institutional locational factor, the availability of
industrial land in municipalities where the firm’s plant is built, is found to be
another important factor influencing location decisions, with this result reflecting
the important role that public authorities could play in managing local and
regional development policies by providing a suitable environment where
industrial firms can start and consolidate their activities.
Extending the conditional logit by introducing space allows us to test for the
influence of neighbourhood spillovers in firms’ location choices. Results from
estimating the spatial conditional logit model are collected in Table 2 (columns 3
17
and 4). In general, we observe that the results for the extended model closely
follow those of the non–spatial one, except for the NSERV variable which now
shows a negative sign in its coefficient, although it continues to be insignificant.
Quantitatively, all coefficients appear to be highly significant, showing a
reduction in their absolute values in comparison with those of the non-spatial
model, except for INDSURF and DIV variables which show a slight increase in
their estimated values. In this respect, including an explicit spatial component in
the model would be contributing to obtain more accurate estimates of the
coefficients for the specified locational factors, this being an important result of
the research. As a summary, we can conclude that the spatially extended model
performs well, and all of the specified locational factors appear to be playing an
important role in informing the firm’s choice in our empirical exercise, in this way
confirming the importance given to them in the literature (Arauzo et al. 2006).
Regarding the spatial coefficient of interestδ , we obtain an estimated value of
0.83 which is highly significant. Moreover, we have tested whether the value of
the spatial coefficient is above or below one, and we were unable to reject the
hypothesis that it is equal to or below one, that is, 1δ ≤ , what reinforces our
theoretically-informed perception on what this value should be (Table 2).12
According to the theoretical model, this value implies that the characteristics of
the chosen municipality appear to be more relevant than those of the
neighbourhood for the decision-maker’s choice, what seems to be a plausible
result. In comparison with the results of Autant-Bernard (2006), and although we
do not share the same methodological approach, a pseudo-δ can be inferred in her
paper, for the only particular spatially lagged location factor that appears to be
statistically significant, of around 0.25-0.33 for the regional case. Combining her
and our results, we would infer that spillovers are more important (three times as
important) at a local (municipal) level than at a regional one, which, in Autant-
Bernard’s own words, would add new evidence “supporting the hypothesis of a
decline of knowledge [or whatever spatial effects] diffusion over space” (ibid, p.
1196). This is a pivotal result of this research because it confirms the usefulness
12 Robustness tests are carried out along the empirical study, with all of our slightly modified specifications showing similar results.

18
of the parameter δ when employed as a direct measure of the empirical relevance
of space in industrial location decisions.
Further analysis was carried out by computing elasticities for the estimated
model.13 Elasticities are common in economics, providing unit-free measures of
the degree of responsiveness of one variable to changes in another. In our case,
computed elasticities gives the percentage change in the probability of a firm
locating in a given municipality as a result of a 1% increase in one of the
municipality’s attributes. Note that we have calculated elasticities for both the
standard conditional logit (Table 3) and the spatially extended model (Table 4). A
detailed analysis of the elasticities by municipalities provides us with richer
information on the relevance that the different locational factors play in
influencing firms’ choices. Our results suggest that the most important factor at
municipal level is the existence of an important stock of human capital; that is, the
pool of qualified workforce. In fact, the estimated elasticity for this variable (HC)
is above 2 for all the municipalities, according to the spatial conditional logit
model. The second variable in terms of importance for the firm’s choice is the
ability to benefit from agglomeration economies, with diversity economies
playing a more important role than specialisation ones.
It is worth noting that availability of industrial land (INDSURF) is also a very
important location factor, particularly for firms establishing in several
municipalities of the region, such as Lorca, Jumilla or Moratalla, which are rather
distant from the administrative centre of the region (city of Murcia). On the other
hand, the presence of a considerable number of industrial jobs in the municipality,
reflecting some municipal specialisation in the industrial activities, and demand-
side variables, represented by local population, turn out to be the least important
factors in driving firms’ choices, although the existence of a large enough local
market where firms could sell their industrial products appears to be of major
importance for companies located in the most populated municipalities of the
region: Lorca, Cartagena and the city of Murcia, which show a value for their
respective elasticities of 0.3, 0.7, and 1.0 for this factor. Comparing elasticities for
13 Elasticity values are computed employing (evaluating) the observed value of every explanatory variable in the correspondent municipality.

19
the spatial and non-spatial specifications, one can see that, in general, the
introduction of space results in an increase in the value of estimated elasticities for
DIV and INDSUR variables, and a reduction in the value for the other elasticities,
where the change in the case of the NIND variable is particularly remarkable.
Finally, we retrieved the estimated value of the probability of locating in every
individual municipality of the region, and these are displayed in the last column of
Tables 3 and 4. From these probabilities, and as a corollary of the research, we
conclude that the main urban locations appear to maintain a higher capacity of
attracting new industrial firms, with probabilities ranging from 30 per cent of the
city of Murcia and 8 and 6 per cent for Yecla and Cartagena. In general, these
municipalities also usually show higher elasticity values for each individual
location factor included in the model.
4 Concluding remarks
By using detailed data on more than 8,000 firms located in the municipalities of
the Spanish Region of Murcia, this paper is intended to improve the understanding
of the role that spatial spillovers play in influencing location choices of industrial
establishments. Departing from the traditional theoretical framework
characterising industrial location literature, this research looks to test whether the
decision-maker’s choice may be influenced not only by the characteristics of a
certain location, but also by those of the surrounding or neighbouring areas, given
the presence of important spatial dependence patterns at a local level. Accounting
for such spatial effects has required extending the conditional logit framework by
specifying a new model that relates the probabilities of locating in one
municipality to a set of potential driving factors, together with the inclusion of the
local spatial effects. As a novelty, we define a spatial coefficient as a synthetic
measure quantifying the strength of neighbourhood effects in the firms’ choice,
thus allowing for a better understanding of the role played by spatial effects at a
local, sub-regional, level.
Our results are largely consistent with previous studies. Estimates of the spatial
conditional logit show the important role played by local attributes, such as the

20
existence of agglomeration economies, the presence of supply-side factors,
captured by a human capital measure, and some institutional factors, such as the
availability of industrial land, in increasing the attractiveness of a given location
for firms. Furthermore, our findings have shown that local spatial effects are
remarkably important in determining location choices, with attributes of
neighbouring municipalities showing nearly the same importance as those of the
chosen municipality itself for the decision-maker, confirming the need to account
for such spatial effects when analysing industrial location choices. Similarly, our
results have shown that local spatial spillovers are more important in influencing
firms’ choices than those appearing on a regional scale, again reinforcing the
empirical evidence on the existence of a decline in spillovers over space. In this
sense, the use of the municipality as the geographical unit of analysis has proved
appropriate in order to capture spatial spillovers in discrete choice models.
Finally, our results have important implications in terms of regional policy.
Firstly, they highlight the need to continue improving supply-side factors in order
to push industrial development at a regional scale, showing that improving the
qualifications of the labour force appears as the most salient policy a locality
could pursue. Secondly, agglomeration economies and other spatial spillovers not
locally-bounded continue to be first order factors influencing industrial location,
so policies directed to promote spatial clustering of firms continue to be important
as an instrument to consolidate industrial areas at a local level. Promoting a rich
and diverse industrial environment has been equally pointed out as a relevant
factor in attracting new industries. Institutional factors also appear to be
important, so industrial policy at a regional and local level should be more
proactive if it wants to affect location choices. And, thirdly, demand-side factors,
such as the magnitude of potential demand, are shown again to be important once
a certain threshold level has been exceeded. In summary, the results of the
research show that this new framework of analysis for empirical studies on
location choices performs remarkably well.
21
References
Anselin L (1988) Spatial econometrics: methods and models. Kluwer Academic Publishers,
Dordrecht
Anselin L (2003) Spatial externalities, spatial multipliers, and spatial econometrics. Int Reg Sci Rev 26:153-166
Arauzo J M (2005) A note on spatial autocorrelation at a local level. Universitat Rovira-i-Virgili WP 03/2005
Arauzo J M (2008) Industrial location at a local level: Comments on the territorial level of analysis. Tijdschr Econ Soc Geogr- J Econ Soc Geogr 99:193-208
Arauzo J M, Manjón M (2004) Firm size and geographical aggregation: and empirical appraisal in industrial location. Small Bus Econ 22:299-312
Arauzo J M, Liviano D, Manjón M (2008) Empirical studies in industrial location: An assessment of their methods and results. Universitat Rovira-i-Virgili WP 06/2008
Arbia G (2001) The role of spatial effects in the empirical analysis of regional concentration. J Geograph Systems 3:271-281.
Audretsch D, Lehmann E (2005) Does the knowledge spillover theory of entrepreneurship hold for regions?. Res Pol 34:1191-1202
Autant-Bernard C (2006) Where do firms to locate their R&D? A spatial conditional analysis on french data. Europ Plan Stud 14:1187-1208
Becker R, Henderson V (2000) Effects of air quality regulations on pollution industries. J Polit Economy 108:379-421
Carlton D (1983) The location and employment choices of new firms: An econometric model with discrete and continuous endogenous variables. Rev Econ Statist 65:440-449
Coughlin C C, Segev E (2000) Location determinants of new foreign-owned manufacturing plants. J Reg Sci 40:323-351
Coughlin C C, Terza J V, Arromdee V (1991) State characteristics and the location of foreign direct investment within the United States. Rev Econ Statist 73:675-683
Coughlin C, Garret T, Hernández-Murillo R (2004) Spatial probit and the geographic pattern of state lotteries. Working Paper Series 2003-042, The Federal Reserve Bank of St. Louis
Duranton G, Puga D (2000) Diversity and specialisation in cities: why, where and when does it matter?. Urban Stud 37:533-555
Ellison G, Glaeser E (1997) Geographic concentration in US manufacturing industries: A dartboard approach. J Polit Economy 105:889-927
Figueiredo O, Guimarães P, Woodward D (2002) Home-field advantage: location decisions of Portuguese entrepreneurs. J Urban Econ 52:341-361
Fleming M (2004) Techniques for estimating Spatially Dependent Discrete Choice Models. In: Anselin L, Florax R, Rey S (eds.) Advances in spatial econometrics, Springer, Amsterdam, pp 145-167
Florax R, Folmer H (1992) Specification and estimation of spatial linear regression models: Monte Carlo evaluation of pre-test estimators. Reg Sci Urban Econ 22:405-432
Fujita M, Thisse J F (2002) Economics of agglomeration. Cities, industrial location and regional growth. Cambridge University Press, Cambridge
Glaeser E, Kallal H D, Scheinkman J A, Scheleifer A (1992) Growth in cities. J Polit Economy 100:1126-1152
Greene W H (2008) Econometric analysis. 6th edn. Prentice Hall, New York
Guimarães P, Rolfe R J, Woodward D (1998) Regional incentives and industrial location in Puerto Rico. Int Reg Sci Rev 21:119-138
22
Guimarães P, Figueiredo O, Woodward D (2003) A tractable approach to the firm location decision problem. Rev Econ Statist 85:201-204
Guimarães P, Figueiredo O, Woodward D (2004) Industrial location modelling: Extending the random utility framework. J Reg Sci 44:1-20
Haining R P (1995) Data problems in spatial econometric modelling. In: Anselin L, and Florax R J G M (eds) New Directions in Spatial Econometrics, Springer, Berlin, pp 156-171
Head K, Swenson D (1995) Agglomeration benefits and location choice: evidence from japanese manufacturing investments in the United States. J Int Econ 38:223-247
Holl A (2004) Transport infrastructure, agglomeration economies, and firm birth. empirical evidence from Portugal. J Reg Sci 44:693-712
Hoover E M (1936) The measurement of industrial location. Rev Econ Statist 18:162-171
Jacobs J (1969) The Economy of cities. Random House, New York
Le Sage J (2000) Bayesian estimation of limited dependent variable spatial autoregressive models. Geogr Anal 32(1):19-35
McCann P, Sheppard S (2003) The rise, fall and rise again of industrial location theory. Reg Stud 37:649-663
Mc Fadden D (1974) Conditional Logit Analysis of Qualitative Choice Behaviour. In: Zarembka P (ed) Frontiers in Econometrics, Academic Press, New York, pp105-142
Mc Fadden D (1978) Modelling the choice of residential location. In: Karlqvist A, Lundqvist L, Snickars F, Weibull J (eds) Spatial interaction theory and planning models, North Holland, Amsterdam, pp 75-96
Mc Fadden, D. (2001) Economic choices. Amer Econ Rev 91: 351-378
Marsh T, Mittelhammer R, Huffaker R (2000) Probit with spatial correlation by filed plot: Potato leafroll virus net necrosis in potatoes. J Agric Biol Environ Stat 5(1):22-38
Murdoch J, Sandler T, Vijverberg W P M (2003) The participation decision versus the level of participation in an environmental treaty: A spatial probit analysis. J Public Econ 87:337-362
Nelson G, De Pinto A, Harris V, Stone S (2004) Land use and road improvements: A spatial perspective. Int Reg Sci Rev 27(3):297-325
Rosenthal S S, Strange W C (2003) Geography, industrial organization and agglomeration. Rev Econ Statist 85:377-393
Strotmann, H (2007) Entrepreneurial survival. Small Bus Econ 28:87-104
Train K (2003) Discrete choice methods with simulation. Cambridge University Press, Cambridge.
Vichiensan V, Tokunaga Y, Miyamoto K (2005) Mixed logit model framework with structuralized spatial effects: a test of applicability with area unit systems in location analysis. J East Asia Soc Transp Stud 6: 3789-3802
Viladecans E (2004) Agglomeration economies and industrial location: City-level evidence. J Econ Geogr 4:565-580
Viladecans E (2001) La concentración territorial de las empresas industriales: un estudio sobre el tamaño de las empresas y su proximidad geográfica. Pap Econ Española 89/90:308-319
Woodward D (1992) Locational determinants of Japanese manufacturing start-ups in the United States. Southern Econ J 58:690-708

23
Tables and figures
Fig 1 Percentile Map on the distribution of industrial firms by municipality in the Region of
Murcia (Spain)
Table 1 Number of firms by sectors
Sectors Number of firms
NACE Rev.1 classif. (R93)
FOOD, DRINKS AND TOBACCO 1500 15+16 TEXTILES 319 17(p) CLOTHING 350 17(p) LEATHER AND SHOES 290 18+19 WOOD AND CORK PRODUCTS 552 20 (p)+36 PRINTING, AND PUBLISHING 515 21+22 +23 CHEMICAL 332 24 RUBBER AND PLASTIC 247 25 NON METALLIC MINERALS 637 14 STEEL AND METAL PRODUCTS 1458 13+27+28 AGRICULTURAL AND INDUSTRIAL MACHINERY 611 29
OFFICE MACHINERY, ELECTRIC AND ELECTRONIC PRODUCTS 315 30+31+32+33
FURNITURES AND OTHER MANUFACTURES 1303 20(p) + 26
TOTAL 8429
Source: DAERM database.
24
Table 2 Conditional Logit estimates (with and without space)
Conditional Logit Spatial Conditional Logit variable coeff. s.e. coeff. s.e. LOC 0.2005 *** 0.0189 0.1537 *** 0.0167 DIV 0.7806 *** 0.0664 0.8920 *** 0.0711 HC 6.8039 *** 0.2783 5.6948 *** 0.2716 TPOP 0.0036 *** 0.0002 0.0038 *** 0.0002 NIND 1.2593 *** 0.1424 0.6599 *** 0.0990 NSERV 0.2546 0.1717 -0.0309 0.0773 INDSURF 0.8737 *** 0.0308 1.0377 *** 0.0272 δ - - 0.8307 *** 0.0446 Log-likelihood -25179.98 -25026.98 Pseudo-R2 0.2106 0.2154 AIC 0.1358 0.1350 LR 2χ 13433.92 *** 13739.90 *** Number of obs. 370876 370876
2χ ( 1δ = ) - 14.4236 ( 1δ = ) p-value - 0.0001 ( 1δ ≤ ) p-value - 0.9999 ( 1δ ≥ ) p-value - 0.0001 R (in metres) - 43650
(***), (**), and (*) indicates significance at the 1%, 5% and 10% level. Source: Own elaboration based on DAERM database.
Fig 2 Grid search for radius R following the maximum-likelihood criterion

25
Table 3 Conditional Logit model: elasticities
Explanatory variables (Xj) Municipality (j) LOC DIV HC TPOP NIND NSERV INDSURF Prob. ABANILLA 0.3368 0.6573 2.8063 0.0227 0.4295 0.1154 0.2054 0.0083 ABARAN 0.1202 0.5598 3.3075 0.0465 0.0872 0.1759 0.0989 0.0069 AGUILAS 0.0673 0.5176 3.6184 0.1168 0.0996 0.1319 0.2179 0.0102 ALBUDEITE 0.0728 0.4560 2.7197 0.0051 0.4517 0.0609 0.0148 0.0037 ALCANTARILLA 0.3351 0.6320 3.9319 0.1362 0.5309 0.0875 0.0136 0.0281 ALEDO 0.1825 0.0000 3.0274 0.0036 0.6469 0.0981 0.0435 0.0046 ALGUAZAS 0.4433 0.3173 3.2806 0.0295 0.5968 0.0936 0.0208 0.0103 ALHAMA 0.6740 0.3360 3.3415 0.0672 0.2557 0.1705 0.2686 0.0148 ARCHENA 0.2002 0.5203 3.7612 0.0598 0.4068 0.1175 0.0138 0.0143 BENIEL 0.3610 0.5156 3.4333 0.0363 0.3622 0.1342 0.0086 0.0111 BLANCA 0.1651 0.5529 3.1974 0.0220 0.3911 0.1022 0.0754 0.0077 BULLAS 0.2548 0.2160 3.0548 0.0430 0.1635 0.0717 0.0714 0.0040 CALASPARRA 0.3374 0.2989 2.7199 0.0361 0.5774 0.0603 0.1616 0.0056 CAMPOS DEL RIO 0.8138 0.0773 3.1479 0.0075 0.9310 0.0272 0.0405 0.0137 CARAVACA 0.3439 0.5502 3.6377 0.0874 0.6507 0.0813 0.7143 0.0483 CARTAGENA 0.1076 0.1951 3.9902 0.7120 0.6516 0.0769 0.4584 0.0597 CEHEGIN 0.3882 0.5485 3.3239 0.0556 0.6803 0.0753 0.2563 0.0188 CEUTI 0.4905 0.4763 3.9409 0.0315 0.5412 0.0629 0.0085 0.0244 CIEZA 0.1388 0.6371 3.2752 0.1247 0.1871 0.1014 0.3173 0.0103 FORTUNA 0.3565 0.6262 2.6482 0.0314 0.5843 0.0471 0.1293 0.0071 FUENTE ALAMO 0.3428 0.5371 3.1798 0.0513 0.4624 0.0732 0.2366 0.0115 JUMILLA 0.2791 0.6482 3.3654 0.0854 0.1976 0.1207 0.8283 0.0236 LA UNION 0.1280 0.6066 3.4656 0.0579 0.2993 0.0948 0.0216 0.0092 LAS TORRES 0.6178 0.4878 3.5339 0.0665 0.8148 0.0466 0.0332 0.0259 LIBRILLA 0.2425 0.5400 2.5435 0.0152 0.5904 0.1014 0.0496 0.0050 LORCA 0.1767 0.6364 3.2818 0.3086 0.2287 0.1205 1.3841 0.0542 LORQUI 0.3396 0.6307 3.3279 0.0233 0.5285 0.1077 0.0138 0.0127 LOS ALCAZARES 0.0752 0.5769 3.9380 0.0480 0.1358 0.1648 0.0173 0.0125 MAZARRON 0.0527 0.5874 3.4644 0.1108 0.0585 0.1209 0.2762 0.0092 MOLINA 0.3037 0.6432 4.0433 0.2000 0.4984 0.1107 0.1426 0.0403 MORATALLA 0.4099 0.4428 2.8927 0.0298 0.8785 0.0266 0.8153 0.0228 MULA 0.3115 0.3116 3.4656 0.0582 0.4594 0.0712 0.5447 0.0167 MURCIA 0.0832 0.4731 3.2862 1.0432 0.1358 0.1204 0.5335 0.3108 PLIEGO 0.1390 0.3461 2.6446 0.0134 0.0219 0.1447 0.0253 0.0023 PTO LUMBRERAS 0.1059 0.6458 3.1490 0.0465 0.1335 0.1166 0.1259 0.0064 RICOTE 0.1536 0.4355 2.9494 0.0054 0.1568 0.0127 0.0766 0.0037 SAN JAVIER 0.0757 0.6167 4.1262 0.0985 0.0935 0.1517 0.0644 0.0168 SAN PEDRO 0.1030 0.5333 3.4407 0.0764 0.1404 0.1609 0.0191 0.0075 SANTOMERA 0.2255 0.6744 3.6588 0.0497 0.3077 0.1563 0.0379 0.0147 TORRE-PACHECO 0.1260 0.6312 3.4728 0.1014 0.1193 0.1052 0.1635 0.0097 TOTANA 0.2272 0.6054 3.0009 0.1022 0.3170 0.1071 0.2503 0.0086 ULEA 0.3073 0.0000 3.4147 0.0036 0.0534 0.1456 0.0348 0.0044 VILLANUEVA 0.0607 0.0000 3.7458 0.0069 0.0256 0.1190 0.0113 0.0044 YECLA 0.6703 0.3181 3.6592 0.1166 0.8229 0.0601 0.4979 0.0550
Elasticities are computed as: ( ),,
,
1j m jj m m j
m j j
P XP X
X Pβ
∂= −
∂.

26
Table 4 Spatial Conditional Logit model: elasticities
Explanatory variables (Xj) Municipality (j) LOC DIV HC TPOP NIND NSERV INDSURF Prob. ABANILLA 0.2579 0.7505 2.3465 0.0237 0.2250 -0.0138 0.2437 0.0091 ABARAN 0.0922 0.6400 2.7696 0.0487 0.0457 -0.0210 0.1175 0.0063 AGUILAS 0.0515 0.5902 3.0218 0.1219 0.0521 -0.0157 0.2583 0.0123 ALBUDEITE 0.0558 0.5211 2.2759 0.0053 0.2368 -0.0073 0.0176 0.0037 ALCANTARILLA 0.2575 0.7240 3.2992 0.1429 0.2791 -0.0105 0.0162 0.0255 ALEDO 0.1400 0.0000 2.5352 0.0038 0.3394 -0.0117 0.0517 0.0039 ALGUAZAS 0.3398 0.3628 2.7466 0.0308 0.3131 -0.0112 0.0247 0.0099 ALHAMA 0.5183 0.3853 2.8061 0.0706 0.1345 -0.0205 0.3201 0.0114 ARCHENA 0.1540 0.5969 3.1599 0.0628 0.2141 -0.0141 0.0164 0.0104 BENIEL 0.2765 0.5889 2.8716 0.0379 0.1898 -0.0160 0.0103 0.0117 BLANCA 0.1267 0.6328 2.6802 0.0230 0.2054 -0.0122 0.0897 0.0061 BULLAS 0.1952 0.2468 2.5561 0.0450 0.0857 -0.0086 0.0847 0.0042 CALASPARRA 0.2587 0.3417 2.2772 0.0378 0.3029 -0.0072 0.1920 0.0051 CAMPOS DEL RIO 0.6273 0.0889 2.6500 0.0079 0.4910 -0.0033 0.0484 0.0079 CARAVACA 0.2654 0.6330 3.0654 0.0921 0.3436 -0.0098 0.8542 0.0417 CARTAGENA 0.0827 0.2237 3.3505 0.7476 0.3428 -0.0092 0.5463 0.0565 CEHEGIN 0.2985 0.6290 2.7915 0.0584 0.3579 -0.0090 0.3055 0.0154 CEUTI 0.3784 0.5479 3.3200 0.0332 0.2856 -0.0076 0.0102 0.0179 CIEZA 0.1063 0.7279 2.7407 0.1304 0.0981 -0.0121 0.3769 0.0104 FORTUNA 0.2731 0.7153 2.2151 0.0328 0.3062 -0.0056 0.1534 0.0076 FUENTE ALAMO 0.2622 0.6126 2.6562 0.0536 0.2420 -0.0087 0.2805 0.0134 JUMILLA 0.2139 0.7410 2.8175 0.0894 0.1036 -0.0144 0.9841 0.0233 LA UNION 0.0977 0.6901 2.8874 0.0603 0.1562 -0.0113 0.0256 0.0136 LAS TORRES 0.4763 0.5609 2.9759 0.0700 0.4298 -0.0056 0.0397 0.0198 LIBRILLA 0.1858 0.6171 2.1285 0.0159 0.3095 -0.0121 0.0589 0.0050 LORCA 0.1362 0.7317 2.7631 0.3250 0.1206 -0.0145 1.6538 0.0485 LORQUI 0.2604 0.7212 2.7870 0.0244 0.2773 -0.0129 0.0164 0.0120 LOS ALCAZARES 0.0574 0.6572 3.2855 0.0501 0.0710 -0.0196 0.0204 0.0155 MAZARRON 0.0403 0.6690 2.8897 0.1155 0.0306 -0.0144 0.3269 0.0125 MOLINA 0.2345 0.7406 3.4094 0.2109 0.2633 -0.0133 0.1706 0.0330 MORATALLA 0.3136 0.5052 2.4169 0.0311 0.4598 -0.0032 0.9667 0.0245 MULA 0.2397 0.3575 2.9119 0.0611 0.2418 -0.0085 0.6495 0.0127 MURCIA 0.0636 0.5392 2.7428 1.0888 0.0710 -0.0144 0.6319 0.3127 PLIEGO 0.1065 0.3953 2.2122 0.0140 0.0115 -0.0173 0.0300 0.0028 PTO LUMBRERAS 0.0807 0.7341 2.6215 0.0484 0.0696 -0.0139 0.1487 0.0116 RICOTE 0.1177 0.4976 2.4680 0.0057 0.0822 -0.0015 0.0910 0.0038 SAN JAVIER 0.0579 0.7031 3.4450 0.1028 0.0489 -0.0181 0.0763 0.0191 SAN PEDRO 0.0786 0.6073 2.8693 0.0797 0.0733 -0.0192 0.0226 0.0110 SANTOMERA 0.1728 0.7706 3.0616 0.0520 0.1613 -0.0187 0.0450 0.0148 TORRE-PACHECO 0.0960 0.7174 2.8906 0.1055 0.0622 -0.0125 0.1932 0.0150 TOTANA 0.1741 0.6915 2.5104 0.1069 0.1661 -0.0128 0.2972 0.0090 ULEA 0.2359 0.0000 2.8623 0.0038 0.0280 -0.0174 0.0414 0.0028 VILLANUEVA 0.0465 0.0000 3.1396 0.0072 0.0134 -0.0142 0.0135 0.0029 YECLA 0.4981 0.3525 2.9695 0.1184 0.4184 -0.0070 0.5734 0.0836
Elasticities are computed as: ( ),,
,
1j m jj m m j
m j j
P XP X
X Pβ
∂= −
∂.
27
Appendix
Table A.1 Definition of the explanatory variables
Variable Definition Source
LOC Industrial specialisation index computed as
1
1 1 1
Ss sj js
J S Js sj jj s j
e e
e e
=
= = =
∑∑ ∑ ∑
where s
je denotes sector s employment in the municipality j
DAERM database (Regional Statistical Office of Murcia).
DIV Diversification index computed as
( )21 r r
j jr I r Ie e∈ ∈− ∑ ∑
where rje denotes industrial employment in sector r
and municipality j over total industrial employment in the municipality j. The index takes values in the interval (0,1), where 0 indicates the lowest degree of diversification while 1 is associated to the highest degree of diversification
DAERM database (Regional Statistical Office of Murcia).
HC Percentage of labour force with secondary and tertiary levels of education by municipality
Population Census, Spanish National Statistics Institute (INE)
TPOP Total population by municipality Population Census, Spanish National Statistics Institute (INE)
NIND Share of local industrial employment over regional industrial employment
DAERM database (Regional Statistical Office of Murcia).
NSERV Share of local services employment over regional services employment
Regional Accounts (CRE), Spanish National Statistics Institute (INE)
INDSURF Industrial land availability by municipality sueloindustrial-murcia.com/index.htm