Spatial distribution and temporal trends of mean precipitation and extremes in the arid region,...
12
Spatial distribution and temporal trends of mean precipitation and extremes in the arid region, northwest of China, during 1960–2010 Huaijun Wang, 1,2 Yaning Chen 1 * and Zhongsheng Chen 1 1 State Key Laboratory of Desert and Oasis Ecology, Xinjiang Institute of Ecology and Geography, Chinese Academy of Sciences (CAS), Urumqi, Xinjiang, 830011, China 2 Graduate School of Chinese Academy of Sciences, Beijing 10049, China Abstract: On the basis of daily precipitation records at 76 meteorological stations in the arid region, northwest of China, the spatial and temporal distribution of mean precipitation and extremes were analysed during 1960–2010. The Mann–Kendall trend test and linear least square method were utilized to detect monotonic trends and magnitudes in annual and seasonal mean precipitation and extremes. The results obtained indicate that both the mean precipitation and the extremes have increased except in consecutive dry days, which showed the opposite trend. The changes in amplitude of both mean precipitation and extremes show seasonal variability. On an annual basis, the number of rain days (R0.1) has significantly increased. Meanwhile, the precipitation intensity as reflected by simple daily intensity index (SDII), number of heavy precipitation days (R10), very wet days (R95p), max 1-day precipitation amount (RX1day) and max 5-day precipitation amount (RX5day) has also significantly increased. This suggests that the precipitation increase in the arid region is due to the increase in both precipitation frequency and intensity. Trends in extremes are very highly correlated with mean trends of precipitation. The spatial correlation between trends in extremes and trends in the mean is stronger for winter (DJF) than for annual and other seasons. The regional annual and seasonal precipitation and extremes are observed the step jump in mean in the late 1980s. Overall, the results of this study are good indicators of local climate change, which will definitely enhance human mitigation to natural hazards caused by precipitation extremes. Copyright © 2012 John Wiley & Sons, Ltd. KEY WORDS mean precipitation; extremes; trends; jump; the arid region Received 30 August 2011; Accepted 11 April 2012 INTRODUCTION Precipitation extremes will bring huge disaster to human society and nature ecosystem. The Fourth Assessment Report (AR4) of the Intergovernmental Panel on Climate Change (IPCC) pointed out that the heavy precipitation events (HPE) in many mid-latitudes were likely to increase, and the total area affected by drought since the 1970s has been likely to increase (Alexander et al., 2006; IPCC, 2007; Li et al., 2010). Water is the foundation of composition, development and stability of oasis ecosystems in arid areas and determines the evolution of the ecological environment (Chen et al., 2007). Precipitation is the main source of water in arid regions, and flood caused by rainstorm also increases water in the arid regions (Shi et al., 2007). Extreme precipitation events can influence flood and soil erosion differently with changes in frequency versus intensity. Assessing changes in extreme climate events at the regional scale can identify indicators that cause environmental and other problems and help us to obtain positive information for rational countermeasures. Precipitation extremes have been studied in many regions around the world, such as in South Asia (Endo et al., 2009), Emilia–Romagna (Pavan et al., 2008), India (Pal and Al-Tabbaa, 2011), Greece (Kioutsioukis et al., 2010), Southern and West Africa (New et al., 2006), Indo-Pacific (Caesar et al., 2011), South Portugal (Durao et al., 2010), Northern central Italy (Di Baldassarre et al., 2006) and Germany (Hundecha and Bardossy, 2005; Tromel and Schonwiese, 2007; Zolina et al., 2008). Global changes in daily climate extremes also have been analysed (Alexander et al., 2006; Frich et al., 2002; Kiktev et al., 2003). These studies concluded that the changes in precipitation extremes present mix pattern and regionally dependent variations; for example, significant downward trends in extreme precipitation events have been found in some areas of Germany but no trends in Southern and West Africa. In China, Wang and Zhou (2005) found that the annual extreme precipitation events increased in east and northwest China and decreased in central, north and northeast China; significant increasing trends in extreme precipitation events in northwest China occurred in summer. You et al. (2011) comprehensively analysed the characteristics of daily precipitation indices at 303 meteorological stations in China and showed that regional annual total precipitation exhibited an increasing trend, and most precipitation indices were strongly *Correspondence to: Yaning Chen, State Key Laboratory of Desert and Oasis Ecology, Xinjiang Institute of Ecology and Geography, Chinese Academy of Sciences (CAS), Urumqi, Xinjiang, 830011, China E-mail: [email protected] HYDROLOGICAL PROCESSES Hydrol. Process. 27, 1807–1818 (2013) Published online 12 May 2012 in Wiley Online Library (wileyonlinelibrary.com) DOI: 10.1002/hyp.9339 Copyright © 2012 John Wiley & Sons, Ltd.
-
Upload
independent -
Category
Documents
-
view
0 -
download
0
Transcript of Spatial distribution and temporal trends of mean precipitation and extremes in the arid region,...

HYDROLOGICAL PROCESSESHydrol. Process. 27, 1807–1818 (2013)Published online 12 May 2012 in Wiley Online Library(wileyonlinelibrary.com) DOI: 10.1002/hyp.9339
Spatial distribution and temporal trends of mean precipitationand extremes in the arid region, northwest of China, during
1960–2010
Huaijun Wang,1,2 Yaning Chen1* and Zhongsheng Chen11 State Key Laboratory of Desert and Oasis Ecology, Xinjiang Institute of Ecology and Geography, Chinese Academy of Sciences (CAS), Urumqi,
Xinjiang, 830011, China2 Graduate School of Chinese Academy of Sciences, Beijing 10049, China
*COaAcE-m
Co
Abstract:
On the basis of daily precipitation records at 76 meteorological stations in the arid region, northwest of China, the spatial andtemporal distribution of mean precipitation and extremes were analysed during 1960–2010. The Mann–Kendall trend test andlinear least square method were utilized to detect monotonic trends and magnitudes in annual and seasonal mean precipitationand extremes. The results obtained indicate that both the mean precipitation and the extremes have increased except inconsecutive dry days, which showed the opposite trend. The changes in amplitude of both mean precipitation and extremes showseasonal variability. On an annual basis, the number of rain days (R0.1) has significantly increased. Meanwhile, the precipitationintensity as reflected by simple daily intensity index (SDII), number of heavy precipitation days (R10), very wet days (R95p),max 1-day precipitation amount (RX1day) and max 5-day precipitation amount (RX5day) has also significantly increased. Thissuggests that the precipitation increase in the arid region is due to the increase in both precipitation frequency and intensity.Trends in extremes are very highly correlated with mean trends of precipitation. The spatial correlation between trends inextremes and trends in the mean is stronger for winter (DJF) than for annual and other seasons. The regional annual and seasonalprecipitation and extremes are observed the step jump in mean in the late 1980s. Overall, the results of this study are goodindicators of local climate change, which will definitely enhance human mitigation to natural hazards caused by precipitationextremes. Copyright © 2012 John Wiley & Sons, Ltd.
KEY WORDS mean precipitation; extremes; trends; jump; the arid region
Received 30 August 2011; Accepted 11 April 2012
INTRODUCTION
Precipitation extremes will bring huge disaster to humansociety and nature ecosystem. The Fourth AssessmentReport (AR4) of the Intergovernmental Panel on ClimateChange (IPCC) pointed out that the heavy precipitationevents (HPE) in many mid-latitudes were likely to increase,and the total area affected by drought since the 1970s hasbeen likely to increase (Alexander et al., 2006; IPCC, 2007;Li et al., 2010). Water is the foundation of composition,development and stability of oasis ecosystems in arid areasand determines the evolution of the ecological environment(Chen et al., 2007). Precipitation is the main source of waterin arid regions, and flood caused by rainstorm also increaseswater in the arid regions (Shi et al., 2007). Extremeprecipitation events can influence flood and soil erosiondifferently with changes in frequency versus intensity.Assessing changes in extreme climate events at the regionalscale can identify indicators that cause environmental andother problems and help us to obtain positive informationfor rational countermeasures.
orrespondence to: Yaning Chen, State Key Laboratory of Desert andsis Ecology, Xinjiang Institute of Ecology and Geography, Chineseademy of Sciences (CAS), Urumqi, Xinjiang, 830011, Chinaail: [email protected]
pyright © 2012 John Wiley & Sons, Ltd.
Precipitation extremes have been studied in manyregions around the world, such as in South Asia (Endoet al., 2009), Emilia–Romagna (Pavan et al., 2008), India(Pal and Al-Tabbaa, 2011), Greece (Kioutsioukis et al.,2010), Southern and West Africa (New et al., 2006),Indo-Pacific (Caesar et al., 2011), South Portugal (Duraoet al., 2010), Northern central Italy (Di Baldassarre et al.,2006) and Germany (Hundecha and Bardossy, 2005;Tromel and Schonwiese, 2007; Zolina et al., 2008).Global changes in daily climate extremes also have beenanalysed (Alexander et al., 2006; Frich et al., 2002;Kiktev et al., 2003). These studies concluded that thechanges in precipitation extremes present mix pattern andregionally dependent variations; for example, significantdownward trends in extreme precipitation events havebeen found in some areas of Germany but no trends inSouthern and West Africa. In China, Wang and Zhou(2005) found that the annual extreme precipitation eventsincreased in east and northwest China and decreased incentral, north and northeast China; significant increasingtrends in extreme precipitation events in northwest Chinaoccurred in summer. You et al. (2011) comprehensivelyanalysed the characteristics of daily precipitation indicesat 303 meteorological stations in China and showed thatregional annual total precipitation exhibited an increasingtrend, and most precipitation indices were strongly

1808 H. WANG, Y. CHEN AND Z. CHEN
correlated with annual total precipitation. There were alsoregional studies such as in the karsts region of Guizhouprovince (Zhang et al., 2010), Zhujiang River Basin(Gemmer et al., 2011), Yangtze River Basin (Su et al.,2006), eastern and central Tibetan Plateau (You et al.,2008) and Loess Plateau (Li et al., 2010); precipitation-based index showed more mixed pattern of change, andfew stations had significant trends.The arid region of China is located in the innermost centre
of the Eurasia continent. The long distance to thesurrounding oceans causes a more or less dry climate. Thehigh mountains with high orographic precipitation such asTianshan Mountains, Kunlun Mountains and QilianMountains block atmospheric circulation and thus createvast desert basins in the rain shadows, such as the TarimBasin and the Junggar Basin. Both arid basins andhumid mountains are sensitive to climate change(Shi et al., 2007). The temperatures in the arid regions haverisen by 0.39�C/10a, which is 1.39 times that of China and2.78 times the global temperature; the precipitation is lessthan 150mm in most of arid regions (Chen et al., 2012).Drought is the major character over here, but in somemountain areas, flood caused by rainstorm also haveincreased. From the end of the Little Ice Age to about1980, the climate in northwest China has been warm–dry.During the past 20 years, it has changed to warm–wet.Whether the climatic extremes have changed in accordancewith the changes of the average temperature andprecipitation is also not clear. There is a common view thatthe total precipitation has significantly increased, andprecipitation extremes also have changed in northwestChina (Zhai et al., 2005). However, precipitation extremesin the hyper-arid regions separated from northwest Chinahave never been analysed in detail. The objective of thisstudy was to identify whether the frequency or intensity ofextreme events has increased with climate warming in thearid region of China through analysing the spatialdistribution and temporal trends of precipitation extremes.We also assessed the relationships between means andextremes of precipitation at all stations and all seasons. Thestep jump in mean for regional mean precipitation andextremes was also calculated using a statistical method test.This paper is divided into the following sections: the Dataand Methods section presents the study area, methods anddata set; the Results section analyses the yearly and seasonalmean precipitation and extreme changes and discussesthe relationships between mean precipitation and extremes;and the last two sections are the Discussion andConclusions, respectively.
DATA AND METHODS
Study area
This arid region of China is distributed in thenorthwestern part of China ranging from 34� to 50� Nand from 73� to 108� E including the provinces ofXinjiang, Gansu, the western part of Inner Mongolia andthe northern part of Ninxia. China’s northwestern aridendorheic drainage basins cover a considerable area of
Copyright © 2012 John Wiley & Sons, Ltd.
2.53� 106 km2. These basins lie west of the HelanshanMountains in the Ningxia Hui Autonomous Region andwest of the Ushaoling Mountains in Gansu Province.There are many endorheic drainage basins including theTarim Basin, Tsaidam Basin, Badanjilin Desert, TenggerDesert and other endorheic drainage basins in northernXinjiang Uygur Autonomous Regions, the Alashangqidesert in western Inner Mongolia and Hexi Corridor GobiDesert in Gansu Province. The climate of the arid regionis typical of inner-continental land masses, with a widetemperature range, low precipitation and low humidity.The climate is dominated by continental arid conditionswith lesser effects from the East Asian Monsoon(Liu et al., 2010). In winter, the northwest current, whichis cold and dry, prevails here and brings very littleprecipitation. In summer, the southwestern oceaniccurrent, which comes from the Indian Ocean, does notusually reach here because of the obstruction of theTibetan Plateau. Meanwhile, the southeastern current,which comes from the Western Pacific Ocean, also varieswith years and seasons according to the differences in theintensity and location of the subtropical high (Liu et al.,2009). In order to describe the spatial distribution ofprecipitation indices clearly, the present study divides thearid region into four parts (Figure 1): the NorthernXinjiang (NS), the Tianshan Mountainous Area (TSMA),the Southern Xinjiang (SX) and the Hexi–AlashanArea (HAA).
Data
Daily, monthly and yearly precipitation data covering thearid region of China were provided by the National ClimateCenter of ChinaMeteorologicalAdministration (CMA). Forthis area, 84 stations passed the internal homogeneity checkof the China National Meteorological Center, including themoving t-test (Peterson et al., 1998), the standard normalhomogeneity test (Alexandersson, 1986) and the departureaccumulating method (Buishand, 1982). Stations that wereinstalled after 1960 and those with data gaps were excluded.As a result, 76weather stationswith precipitation records for51 years (1 January 1960 to 28 February 2011) wereselected. About the data gap, monthly indices werecalculated if no more than 3 days are missing in the month,and annual values, if nomore than 15 days aremissing in theyear. However, an annual value will also not be calculated ifany month’s data are missing. Data were analysed using theRclimDex package (soft and documentation available fordownload from http://cccma.seos.uvic.ca/ETCCDMI),which can calculate 11 precipitation extremes on the basisof daily precipitation amount. In those indices, some werecalculated on the basis of station-related thresholds whereasothers on the basis of fixed thresholds or absolute peakvalues. Table I lists the indices that have been used in thisstudy. It should be noted that some of the indicesrecommended by ETCCDMI are not relevant for the aridregion of China. R20 (days above 20mm) was notconsidered because the index R10 (days above 10mm) isdeemed sufficient for our study. R99p (extremely wet days)
Hydrol. Process. 27, 1807–1818 (2013)
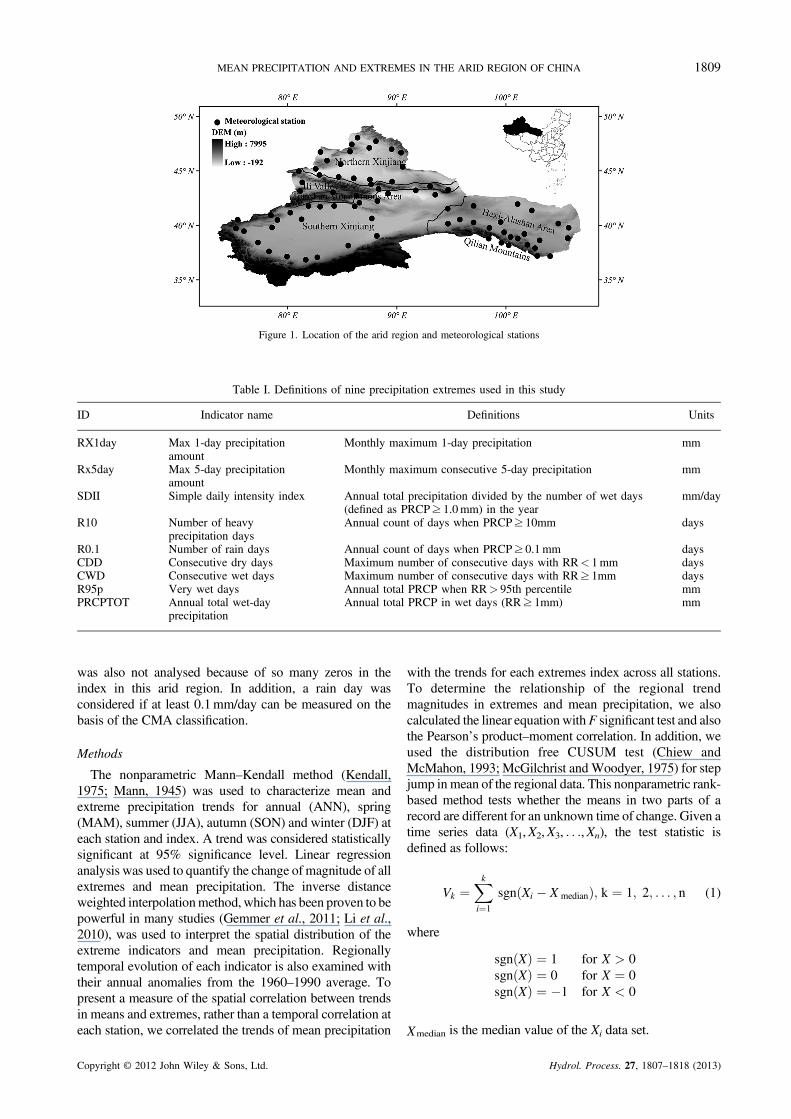
Figure 1. Location of the arid region and meteorological stations
Table I. Definitions of nine precipitation extremes used in this study
ID Indicator name Definitions Units
RX1day Max 1-day precipitationamount
Monthly maximum 1-day precipitation mm
Rx5day Max 5-day precipitationamount
Monthly maximum consecutive 5-day precipitation mm
SDII Simple daily intensity index Annual total precipitation divided by the number of wet days(defined as PRCP≥ 1.0mm) in the year
mm/day
R10 Number of heavyprecipitation days
Annual count of days when PRCP≥ 10mm days
R0.1 Number of rain days Annual count of days when PRCP≥ 0.1mm daysCDD Consecutive dry days Maximum number of consecutive days with RR< 1mm daysCWD Consecutive wet days Maximum number of consecutive days with RR≥ 1mm daysR95p Very wet days Annual total PRCP when RR> 95th percentile mmPRCPTOT Annual total wet-day
precipitationAnnual total PRCP in wet days (RR≥ 1mm) mm
1809MEAN PRECIPITATION AND EXTREMES IN THE ARID REGION OF CHINA
was also not analysed because of so many zeros in theindex in this arid region. In addition, a rain day wasconsidered if at least 0.1mm/day can be measured on thebasis of the CMA classification.
Methods
The nonparametric Mann–Kendall method (Kendall,1975; Mann, 1945) was used to characterize mean andextreme precipitation trends for annual (ANN), spring(MAM), summer (JJA), autumn (SON) and winter (DJF) ateach station and index. A trend was considered statisticallysignificant at 95% significance level. Linear regressionanalysis was used to quantify the change of magnitude of allextremes and mean precipitation. The inverse distanceweighted interpolationmethod, which has been proven to bepowerful in many studies (Gemmer et al., 2011; Li et al.,2010), was used to interpret the spatial distribution of theextreme indicators and mean precipitation. Regionallytemporal evolution of each indicator is also examined withtheir annual anomalies from the 1960–1990 average. Topresent a measure of the spatial correlation between trendsin means and extremes, rather than a temporal correlation ateach station, we correlated the trends of mean precipitation
Copyright © 2012 John Wiley & Sons, Ltd.
with the trends for each extremes index across all stations.To determine the relationship of the regional trendmagnitudes in extremes and mean precipitation, we alsocalculated the linear equationwithF significant test and alsothe Pearson’s product–moment correlation. In addition, weused the distribution free CUSUM test (Chiew andMcMahon, 1993; McGilchrist andWoodyer, 1975) for stepjump inmean of the regional data. This nonparametric rank-based method tests whether the means in two parts of arecord are different for an unknown time of change. Given atime series data (X1,X2,X3, . . .,Xn), the test statistic isdefined as follows:
Vk ¼Xk
i¼1
sgn Xi � X medianð Þ; k ¼ 1; 2; . . . ; n (1)
where
sgn Xð Þ ¼ 1 for X > 0sgn Xð Þ ¼ 0 for X ¼ 0sgn Xð Þ ¼ �1 for X < 0
Xmedian is the median value of the Xi data set.
Hydrol. Process. 27, 1807–1818 (2013)

1810 H. WANG, Y. CHEN AND Z. CHEN
The distribution of Vk follows the Kolmogorov–Smirnov two-sample statistic (KS = (2/n)max|Vk |) withthe critical values of max|Vk| given by
a ¼ 0:10 1:22ffiffiffin
pa ¼ 0:05 1:36
ffiffiffin
pa ¼ 0:01 1:63
ffiffiffin
p
A negative value of |Vk| indicates that the latter part of therecord has a higher mean than the earlier part and viceversa, and max|Vk| indicates the most likely mean jumpyear.
RESULTS
Spatial distribution
Spatial patterns of mean precipitation. The highprecipitation in ANN, MAM, JJA and SON is locatedin the North Xinjiang (NX), the western part of TianshanMountain Area (TSMA) and also the southeast ofthe Hexi-Alashan Area (HAA). Annual precipitation(Figure 2(a)) ranges from 15.1 to 505.8mm with highvalues (300–530mm) from the Ili Valley (westernTSMA) and the Qilian Mountainous Area (northernHAA) and with low values (0–80mm) from the SX andwestern and the northwestern HAA. The precipitationpatterns in MAM, JJA and SON are consistent with thespatial pattern of ANN. The reasons forming thisdistribution are mainly due to the larger-scale atmosphericcirculation, in which NX is primarily affected by theArctic Ocean and the west flow, whereas the southeast ofHAA lies under the southeasterly airstreams and thesouthwesterly airstreams, which may bring abundantprecipitation in those areas. The Southern Xinjiang (SX)area with low precipitation is located inland away fromthe ocean, with the Tianshan Mountain acting as a barrierof the wet air that comes from the Arctic Ocean and theTibetan Plateau also blocking off the warm and moist airfrom the Bay of Bengal, as well as the water vapour fromthe west wind. The precipitation in the western andnorthwestern HAA is dominated by wet wind andinfluenced by monsoon, but when these circulationsreach these regions, they become weaker and weakerbecause of the far-flung trip, and so they only bring littlewater vapour. The precipitation in DJF (Figure 2(b)) isunique with high values (24–60) from the Ili Valley and
Figure 2. Annual and seasonal spatial precipitation
Copyright © 2012 John Wiley & Sons, Ltd.
the northern NX, whereas the precipitation is very low(0–6mm) in the whole SX and HAA. In this period, watervapour is mainly from the latitudinal Arctic Ocean and iscarried by west wind; it enters into the NX and transformsto the eastern part. No water vapour origins form the Bayof Bengal and the South China Sea because of the lowprecipitation in the southeastern HAA, and this situationwill continue until the formation of the monsoon(Liu et al., 2009).
Spatial patterns of precipitation extremes. The highestvalue (300–490) of annual total wet-day precipitation(PRCPTOT) is distributed from the Ili Valley and theQilian Mountainous Area, which is consistent with theannual precipitation. This phenomenon can be clearlyunderstood to form the definition of PRCPTOT, and assuch, some studies also used this index instead of theannual precipitation to investigate the spatial correlationswith the other extremes (Alexander et al., 2007). Raindays (R0.1) (Figure 3(a)) with high values (70–140 days)is mainly distributed from the Northern Xinjiang (NX),the Ili Valley and the Qilian Mountainous Area; the SXand western and northern HAA are dominated by lowvalues (0–50 days). The eastern HAA has the highervalues for simple daily intensity index (SDII), whereasthe lower values were from the NX. The HPE, which maybring huge economic and property losses, are distributedfrom the Ili Valley, the Qianlian Mountainous Area andalso the southeastern HAA, which can be reflected byR10 (Figure 3(c)), R95p, RX1day and RX5day (notshown). It is very interesting that the distribution of thePRCPTOT is consistent with that of the R0.1 and theheavy precipitation indices (R10, R95p, RX1day andRX5day) but varies in SDII in some areas. The NorthXinjiang (NX) is with high values for PRCPTOT andR0.1 but with low value for SDII (Figure 3(b)), whichindicates that the high yearly precipitation amount in NXis mostly because of high rain days (R0.1), and the lowerHPE relative to the Ili Valley, the Qianlian MountainousArea and the southeastern HAA also further reinforce thisconclusion. The precipitation amount in the Ili Valley andQilian Mountainous Area and also in the southeasternHAA is subject to both frequency and intensity ofprecipitation, with high R0.1, HPE and also higher SDII.We can also derive the result that heavy precipitation willaccount for a larger proportion in those three areas.
in the arid region of China, during 1960–2010
Hydrol. Process. 27, 1807–1818 (2013)
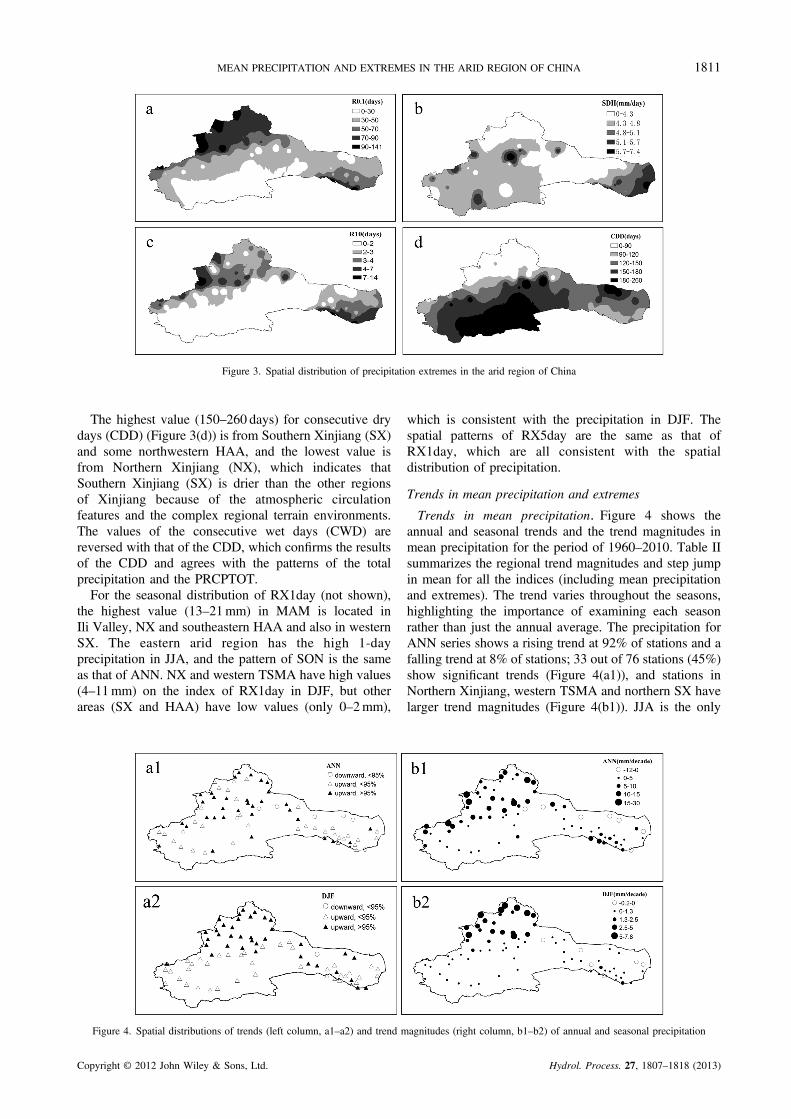
Figure 3. Spatial distribution of precipitation extremes in the arid region of China
1811MEAN PRECIPITATION AND EXTREMES IN THE ARID REGION OF CHINA
The highest value (150–260 days) for consecutive drydays (CDD) (Figure 3(d)) is from Southern Xinjiang (SX)and some northwestern HAA, and the lowest value isfrom Northern Xinjiang (NX), which indicates thatSouthern Xinjiang (SX) is drier than the other regionsof Xinjiang because of the atmospheric circulationfeatures and the complex regional terrain environments.The values of the consecutive wet days (CWD) arereversed with that of the CDD, which confirms the resultsof the CDD and agrees with the patterns of the totalprecipitation and the PRCPTOT.For the seasonal distribution of RX1day (not shown),
the highest value (13–21mm) in MAM is located inIli Valley, NX and southeastern HAA and also in westernSX. The eastern arid region has the high 1-dayprecipitation in JJA, and the pattern of SON is the sameas that of ANN. NX and western TSMA have high values(4–11mm) on the index of RX1day in DJF, but otherareas (SX and HAA) have low values (only 0–2mm),
Figure 4. Spatial distributions of trends (left column, a1–a2) and trend m
Copyright © 2012 John Wiley & Sons, Ltd.
which is consistent with the precipitation in DJF. Thespatial patterns of RX5day are the same as that ofRX1day, which are all consistent with the spatialdistribution of precipitation.
Trends in mean precipitation and extremes
Trends in mean precipitation. Figure 4 shows theannual and seasonal trends and the trend magnitudes inmean precipitation for the period of 1960–2010. Table IIsummarizes the regional trend magnitudes and step jumpin mean for all the indices (including mean precipitationand extremes). The trend varies throughout the seasons,highlighting the importance of examining each seasonrather than just the annual average. The precipitation forANN series shows a rising trend at 92% of stations and afalling trend at 8% of stations; 33 out of 76 stations (45%)show significant trends (Figure 4(a1)), and stations inNorthern Xinjiang, western TSMA and northern SX havelarger trend magnitudes (Figure 4(b1)). JJA is the only
agnitudes (right column, b1–b2) of annual and seasonal precipitation
Hydrol. Process. 27, 1807–1818 (2013)
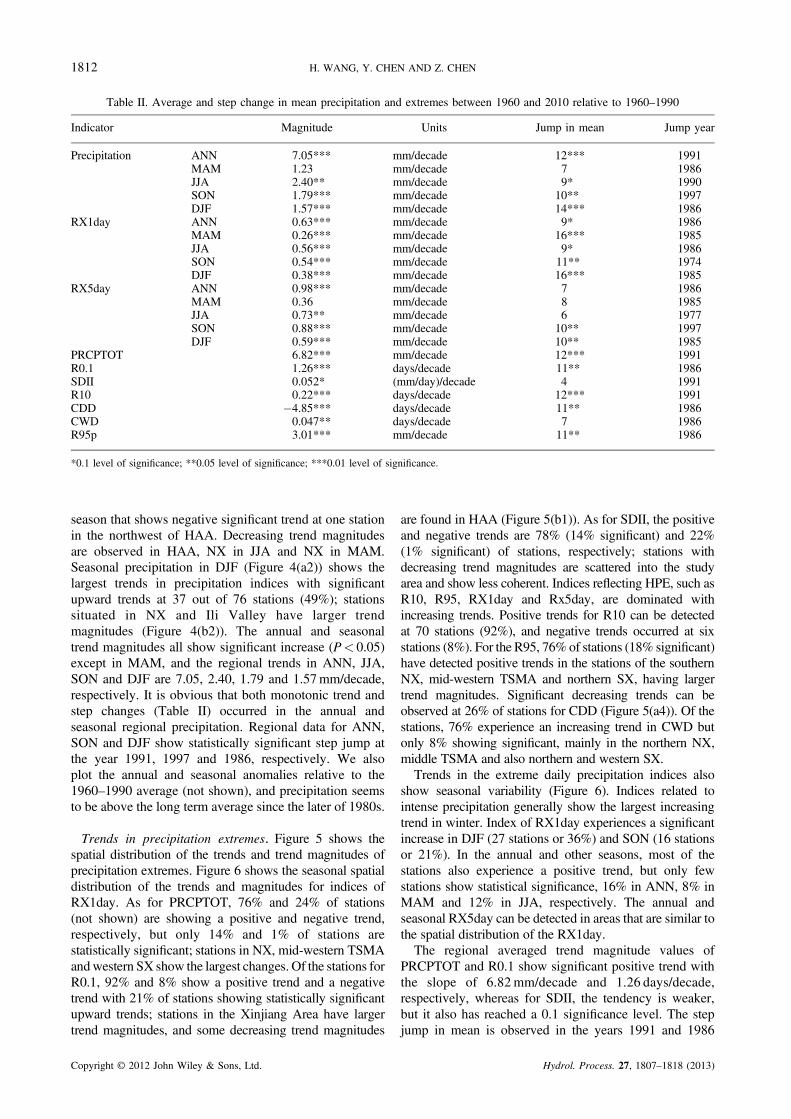
Table II. Average and step change in mean precipitation and extremes between 1960 and 2010 relative to 1960–1990
Indicator Magnitude Units Jump in mean Jump year
Precipitation ANN 7.05*** mm/decade 12*** 1991MAM 1.23 mm/decade 7 1986JJA 2.40** mm/decade 9* 1990SON 1.79*** mm/decade 10** 1997DJF 1.57*** mm/decade 14*** 1986
RX1day ANN 0.63*** mm/decade 9* 1986MAM 0.26*** mm/decade 16*** 1985JJA 0.56*** mm/decade 9* 1986SON 0.54*** mm/decade 11** 1974DJF 0.38*** mm/decade 16*** 1985
RX5day ANN 0.98*** mm/decade 7 1986MAM 0.36 mm/decade 8 1985JJA 0.73** mm/decade 6 1977SON 0.88*** mm/decade 10** 1997DJF 0.59*** mm/decade 10** 1985
PRCPTOT 6.82*** mm/decade 12*** 1991R0.1 1.26*** days/decade 11** 1986SDII 0.052* (mm/day)/decade 4 1991R10 0.22*** days/decade 12*** 1991CDD �4.85*** days/decade 11** 1986CWD 0.047** days/decade 7 1986R95p 3.01*** mm/decade 11** 1986
*0.1 level of significance; **0.05 level of significance; ***0.01 level of significance.
1812 H. WANG, Y. CHEN AND Z. CHEN
season that shows negative significant trend at one stationin the northwest of HAA. Decreasing trend magnitudesare observed in HAA, NX in JJA and NX in MAM.Seasonal precipitation in DJF (Figure 4(a2)) shows thelargest trends in precipitation indices with significantupward trends at 37 out of 76 stations (49%); stationssituated in NX and Ili Valley have larger trendmagnitudes (Figure 4(b2)). The annual and seasonaltrend magnitudes all show significant increase (P< 0.05)except in MAM, and the regional trends in ANN, JJA,SON and DJF are 7.05, 2.40, 1.79 and 1.57mm/decade,respectively. It is obvious that both monotonic trend andstep changes (Table II) occurred in the annual andseasonal regional precipitation. Regional data for ANN,SON and DJF show statistically significant step jump atthe year 1991, 1997 and 1986, respectively. We alsoplot the annual and seasonal anomalies relative to the1960–1990 average (not shown), and precipitation seemsto be above the long term average since the later of 1980s.
Trends in precipitation extremes. Figure 5 shows thespatial distribution of the trends and trend magnitudes ofprecipitation extremes. Figure 6 shows the seasonal spatialdistribution of the trends and magnitudes for indices ofRX1day. As for PRCPTOT, 76% and 24% of stations(not shown) are showing a positive and negative trend,respectively, but only 14% and 1% of stations arestatistically significant; stations in NX, mid-western TSMAandwestern SX show the largest changes. Of the stations forR0.1, 92% and 8% show a positive trend and a negativetrend with 21% of stations showing statistically significantupward trends; stations in the Xinjiang Area have largertrend magnitudes, and some decreasing trend magnitudes
Copyright © 2012 John Wiley & Sons, Ltd.
are found in HAA (Figure 5(b1)). As for SDII, the positiveand negative trends are 78% (14% significant) and 22%(1% significant) of stations, respectively; stations withdecreasing trend magnitudes are scattered into the studyarea and show less coherent. Indices reflecting HPE, such asR10, R95, RX1day and Rx5day, are dominated withincreasing trends. Positive trends for R10 can be detectedat 70 stations (92%), and negative trends occurred at sixstations (8%). For the R95, 76% of stations (18% significant)have detected positive trends in the stations of the southernNX, mid-western TSMA and northern SX, having largertrend magnitudes. Significant decreasing trends can beobserved at 26% of stations for CDD (Figure 5(a4)). Of thestations, 76% experience an increasing trend in CWD butonly 8% showing significant, mainly in the northern NX,middle TSMA and also northern and western SX.Trends in the extreme daily precipitation indices also
show seasonal variability (Figure 6). Indices related tointense precipitation generally show the largest increasingtrend in winter. Index of RX1day experiences a significantincrease in DJF (27 stations or 36%) and SON (16 stationsor 21%). In the annual and other seasons, most of thestations also experience a positive trend, but only fewstations show statistical significance, 16% in ANN, 8% inMAM and 12% in JJA, respectively. The annual andseasonal RX5day can be detected in areas that are similar tothe spatial distribution of the RX1day.The regional averaged trend magnitude values of
PRCPTOT and R0.1 show significant positive trend withthe slope of 6.82mm/decade and 1.26 days/decade,respectively, whereas for SDII, the tendency is weaker,but it also has reached a 0.1 significance level. The stepjump in mean is observed in the years 1991 and 1986
Hydrol. Process. 27, 1807–1818 (2013)

Figure 5. Spatial distribution of trends (left column, a1–a4) and trend magnitudes (right column, b1–b4) of precipitation extremes
Figure 6. Seasonal spatial trends (left column, a1–a2) and trend magnitudes for RX1day (right column, b1–a2)
1813MEAN PRECIPITATION AND EXTREMES IN THE ARID REGION OF CHINA
for PRCPTOT and R0.1, respectively. As for SDII,statistically significant jump in mean is observed in theyear 1991. The results on the HPE for R10, R95, RX1day
Copyright © 2012 John Wiley & Sons, Ltd.
and RX5day are also dominated by positive trends.The indices for R10 and R95 are found step jump inmean (P< 0.01) in the years 1991 and 1986, respectively.
Hydrol. Process. 27, 1807–1818 (2013)

Table IV. Spatial correlations between annual and seasonal trendsin precipitation indices and trends in mean precipitation
Indicator Ann MAM JJA SON DJF
RX1day 0.6078 0.7145 0.6871 0.8216 0.8642RX5day 0.7255 0.7894 0.8067 0.8165 0.8712PRCPTOT 0.9537R0.1 0.5375SDII 0.5689R10 0.6369CDD �0.4657CWD 0.5124R95p 0.6019
All the correlations are significant at 99% confidence level.
1814 H. WANG, Y. CHEN AND Z. CHEN
The total precipitation reflected by annual precipitationand PRCPTOT has changed significantly with the changeof rain days (R0.1), HPE (R10, R95, RX1day andRX5day) and also mean SDII. Those results indicate thatthe increasing precipitation is the combination ofincreasing rainfall frequency and intensity. RegionalCDD and CWD show a significant decreasing trend(�4.85 days/decade) and an increasing trend (0.047 days/decade), and both CDD and CWD test mean jump in theyear 1986, although only the CDD shows significance.Regional significant upward trends of RX1day andRX5day are found except in MAM for RX5day; stepjump in mean are also found around 1986 in DJF for bothindices.The correlations between regional extreme time series are
shown in Table III. The indices of HPE are correlatedsignificantly with each other, and the R0.1 also has a goodcorrelation with CDD and CWD, but not significantly withHPE. In addition, SDII highly correlate with the indices ofHPE and has an insignificant relationship with R0.1. Theseresults show that each HPE and SDII has the same changesign but inconsistent with the pace of R0.1, CDD andCWD.PRCPTOT has a stronger correlation with most otherindices, indicating that annual total precipitation is wellcorrelated with precipitation extremes.
Precipitation extremes correlated with mean precipitation
Table IV shows that trends in precipitation extremes arehighly spatially correlated with total precipitation trends.This is particularly true for PRCPTOT, RX1day, RX5day,R10mm and R95p. CDD, CWD and SDII show lesscorrelations but also reach the 99% confidence level, whichis in agreement with the findings of Alexander et al. (2007)in studying Australia. The correlations are also high in theseason relationship for the indices RX1day and RX5day,which can be defined seasonally, and the correlationcoefficients all show larger values than the annualcorrelation. The seasonal correlations are higher than theannual correlations because as the sample size reduces(e.g. from annual to seasonal), the influence of theseextremes on the total precipitation is much greater(Alexander et al., 2007). A linear regression equation oftrend magnitudes is established between precipitationextremes and mean precipitation at individual stations,
Table III. The correlation coefficient of precipitation indices (n=correlations are m
Indicator RX1day Rx5day PRCPTOT R0.1
RX1day 1.00RX5day 0.8098 1.00PRCPTOT 0.5623 0.6879 1.00R0.1 0.0903 0.1805 0.4694 1.00SDII 0.7843 0.7190 0.5480 �0.135R10 0.6531 0.6680 0.6221 0.078CDD �0.1234 �0.1915 �0.4532 �0.541CWD 0.1986 0.3226 0.4893 0.447R95p 0.8402 0.7391 0.5488 0.032
Copyright © 2012 John Wiley & Sons, Ltd.
and the results are shown in Figures 7 and 8. Trends in meanand extremes have significant positive correlations exceptfor CDD and CWD at 99% confidence level, especially forthe indices of R95, R10, RX1day and RX5day, whichindicates the heavy rainfall events. With the increase inseasonal precipitation trend magnitudes, seasonal RX1dayand RX5day will increase significantly. The largest increasein extreme precipitation is observed in MAM (the slope of0.2511 and 0.4516 for RX1day and RX5day, respectively)and SON (0.2951 and 0.4438), but the DJF is the mostsensitive season with respect to mean precipitation, with R2
reaching 0.806 and 0.8607 for RX1day and RX5day,respectively.
DISCUSSION
We have compared the change of extremes with otherregions in the world (Table V). Patterns in the arid regionof northwest China are broadly similar, but there are alsosome differences. Although in some indices, the trendmagnitudes show less than other regions, for example, thevalue of PRCPTOT is less than the global value and thatof Central and South Asia, but we should need to considerthe absolute rainfall. Comparing with the arid zone ofMiddle East, precipitation extremes have increasedsignificantly. All extreme indices in the arid region ofChina are expressed as significant trend, and other regionsshowed less significance, which indicates that the
51, when r = 0.2257, p= 0.05; r= 0.2938, p= 0.01; significantarked in bold)
SDII R10 CDD CWD R95p
0 1.001 0.7384 1.004 0.0320 �0.1140 1.002 0.0321 0.1211 �0.4033 1.001 0.8064 0.6935 �0.0956 0.1983 1.00
Hydrol. Process. 27, 1807–1818 (2013)

Figure 7. Annual trend magnitudes (days/decade for CDD, R0.1, R10; ((mm/day)/decade) for SDII) plotted against annual trend magnitudes(mm/decade) in mean precipitation
Figure 8. Seasonal trend magnitudes (mm/decade) in RX1day plotted against seasonal trend magnitudes (mm/decade) in mean precipitation
1815MEAN PRECIPITATION AND EXTREMES IN THE ARID REGION OF CHINA
Copyright © 2012 John Wiley & Sons, Ltd. Hydrol. Process. 27, 1807–1818 (2013)
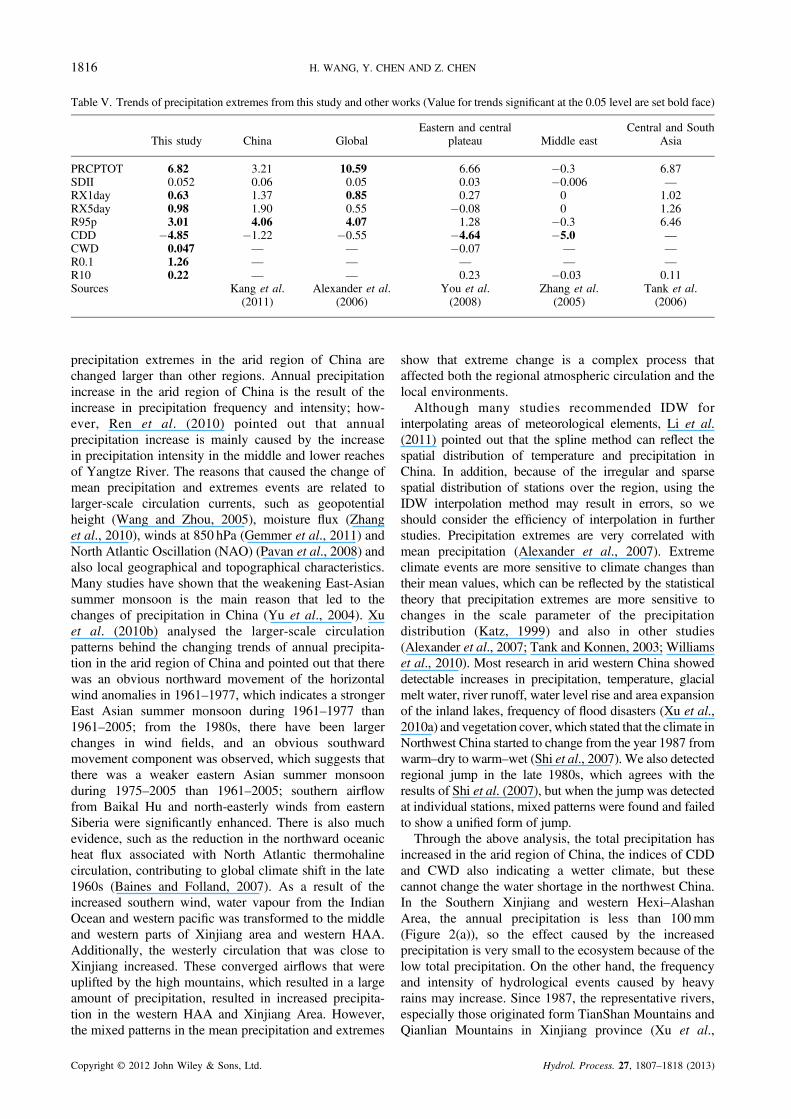
Table V. Trends of precipitation extremes from this study and other works (Value for trends significant at the 0.05 level are set bold face)
This study China GlobalEastern and central
plateau Middle eastCentral and South
Asia
PRCPTOT 6.82 3.21 10.59 6.66 �0.3 6.87SDII 0.052 0.06 0.05 0.03 �0.006 —RX1day 0.63 1.37 0.85 0.27 0 1.02RX5day 0.98 1.90 0.55 �0.08 0 1.26R95p 3.01 4.06 4.07 1.28 �0.3 6.46CDD �4.85 �1.22 �0.55 �4.64 �5.0 —CWD 0.047 — — �0.07 — —R0.1 1.26 — — — — —R10 0.22 — — 0.23 �0.03 0.11Sources Kang et al.
(2011)Alexander et al.
(2006)You et al.(2008)
Zhang et al.(2005)
Tank et al.(2006)
1816 H. WANG, Y. CHEN AND Z. CHEN
precipitation extremes in the arid region of China arechanged larger than other regions. Annual precipitationincrease in the arid region of China is the result of theincrease in precipitation frequency and intensity; how-ever, Ren et al. (2010) pointed out that annualprecipitation increase is mainly caused by the increasein precipitation intensity in the middle and lower reachesof Yangtze River. The reasons that caused the change ofmean precipitation and extremes events are related tolarger-scale circulation currents, such as geopotentialheight (Wang and Zhou, 2005), moisture flux (Zhanget al., 2010), winds at 850 hPa (Gemmer et al., 2011) andNorth Atlantic Oscillation (NAO) (Pavan et al., 2008) andalso local geographical and topographical characteristics.Many studies have shown that the weakening East-Asiansummer monsoon is the main reason that led to thechanges of precipitation in China (Yu et al., 2004). Xuet al. (2010b) analysed the larger-scale circulationpatterns behind the changing trends of annual precipita-tion in the arid region of China and pointed out that therewas an obvious northward movement of the horizontalwind anomalies in 1961–1977, which indicates a strongerEast Asian summer monsoon during 1961–1977 than1961–2005; from the 1980s, there have been largerchanges in wind fields, and an obvious southwardmovement component was observed, which suggests thatthere was a weaker eastern Asian summer monsoonduring 1975–2005 than 1961–2005; southern airflowfrom Baikal Hu and north-easterly winds from easternSiberia were significantly enhanced. There is also muchevidence, such as the reduction in the northward oceanicheat flux associated with North Atlantic thermohalinecirculation, contributing to global climate shift in the late1960s (Baines and Folland, 2007). As a result of theincreased southern wind, water vapour from the IndianOcean and western pacific was transformed to the middleand western parts of Xinjiang area and western HAA.Additionally, the westerly circulation that was close toXinjiang increased. These converged airflows that wereuplifted by the high mountains, which resulted in a largeamount of precipitation, resulted in increased precipita-tion in the western HAA and Xinjiang Area. However,the mixed patterns in the mean precipitation and extremes
Copyright © 2012 John Wiley & Sons, Ltd.
show that extreme change is a complex process thataffected both the regional atmospheric circulation and thelocal environments.Although many studies recommended IDW for
interpolating areas of meteorological elements, Li et al.(2011) pointed out that the spline method can reflect thespatial distribution of temperature and precipitation inChina. In addition, because of the irregular and sparsespatial distribution of stations over the region, using theIDW interpolation method may result in errors, so weshould consider the efficiency of interpolation in furtherstudies. Precipitation extremes are very correlated withmean precipitation (Alexander et al., 2007). Extremeclimate events are more sensitive to climate changes thantheir mean values, which can be reflected by the statisticaltheory that precipitation extremes are more sensitive tochanges in the scale parameter of the precipitationdistribution (Katz, 1999) and also in other studies(Alexander et al., 2007; Tank and Konnen, 2003; Williamset al., 2010). Most research in arid western China showeddetectable increases in precipitation, temperature, glacialmelt water, river runoff, water level rise and area expansionof the inland lakes, frequency of flood disasters (Xu et al.,2010a) and vegetation cover, which stated that the climate inNorthwest China started to change from the year 1987 fromwarm–dry to warm–wet (Shi et al., 2007). We also detectedregional jump in the late 1980s, which agrees with theresults of Shi et al. (2007), but when the jump was detectedat individual stations, mixed patterns were found and failedto show a unified form of jump.Through the above analysis, the total precipitation has
increased in the arid region of China, the indices of CDDand CWD also indicating a wetter climate, but thesecannot change the water shortage in the northwest China.In the Southern Xinjiang and western Hexi–AlashanArea, the annual precipitation is less than 100mm(Figure 2(a)), so the effect caused by the increasedprecipitation is very small to the ecosystem because of thelow total precipitation. On the other hand, the frequencyand intensity of hydrological events caused by heavyrains may increase. Since 1987, the representative rivers,especially those originated form TianShan Mountains andQianlian Mountains in Xinjiang province (Xu et al.,
Hydrol. Process. 27, 1807–1818 (2013)

1817MEAN PRECIPITATION AND EXTREMES IN THE ARID REGION OF CHINA
2010a) and Hexi Corridor (Shi et al., 2007), hadmore floods than before. The frequency of rainstormfloods has also increased significantly since the 1980s,and the frequency of snowstorm is 0.2 times per year atthe 1900s but increased to 18.7 times per year at the2000s (Sun et al., 2011). The influence mechanismbetween precipitation extremes and floods and droughtsneed further study in the future.
CONCLUSIONS
In this study, we studied the spatial distribution andtemporal trends of precipitation extremes in the aridregion, northwest of China, during 1960–2010. Thefollowing conclusions can be drawn on basis of theresults of this study:
1. The high precipitation in ANN, MAM, JJA and SONis located in the North Xinjiang (NX), western partof Tianshan mountainous Area (TSMA) and alsothe southeast of Hexi–Alashan Area (HAA). Theprecipitation patterns of MAM, JJA and SON areconsistent with ANN. The precipitation in DJF isunique with high values from the Ili Valley andnorthern NX, whereas the precipitation is very low inthe whole SX and HAA. The spatial trends of annualand seasonal precipitation dominate with upwardpositive trends, with stations in Northern Xinjiangfor ANN, MAM and DJF having larger trendmagnitude.
2. The spatial distribution extreme indices (PRCPTOT,R0.1, R10, CWD, R95, RX1day and RX5day) areconsistent with the distribution of precipitation. Theseasonal distribution of RX1day and RX5day is alsoconsistent with the seasonal distribution of precipitation.It is very interesting that the distribution of PRCPTOT isconsistent with R0.1 and heavy precipitation indices(R10, R95p, RX1day and RX5day) but varies in SDII insome areas. The North Xinjiang (NX) is with high valuefor PRCPTOT and R0.1 but with low value for SDII,which indicates that the high yearly precipitation amountin NX is mostly because of high rain days (R0.1) and thelower HPE relative to Ili Valley, Qianlian MountainousArea and southeastern HAA, further reinforcing thisconclusion. The precipitation amount in the Ili Valley andQilian Mountainous Area and also in southeastern HAAis subject to both frequency and intensity of precipitation,with high R0.1, HPE and also higher SDII. The spatialdistributions of precipitation extremes are dominated bypositive trends, while the CDD is exhibiting a downwardtrend. The spatial trend patterns of seasonal RX1day andRX5day are consistent with the spatial distribution ofseasonal precipitation; most of the stations show positivetrend, especially in the winter. The regional series ofPRCPTOT shows strong correlation with other indices,indicating that the precipitation increase in the arid regionof China is due to the increase in both precipitationfrequency and intensity.
Copyright © 2012 John Wiley & Sons, Ltd.
3. The regional trends of annual and seasonal meanprecipitation and extremes all show a significant change,except the annual precipitation and RX5day inMAM. The mean trends for annual precipitation andPRCPTOT have increased by 7.05 and 6.82mm/decade,respectively, and R95p and SDII have increasedby 3.01 mm/decade and 0.052 (mm/day)/decade,respectively. The RX1day and RX5day also exhibitsignificant increasing trends at the rate of 0.63 and0.98mm/decade, respectively. Over the same period, thenumber of R0.1 and R10 shows statistically significantincreasing trends of 1.26 and 0.22 days/decade. Adecreasing trend is found for CDD by the rate of�4.85 days/decade. Step jump in mean are found in thelate 1980s; data in later years are higher than the earlieryears except CDD. Those changes in precipitationindices indicate that the arid region of China is becomingwetter.
4. Trends of precipitation extremes are highly correlatedwith trends of mean precipitation. The linear trend ofmean precipitation and extremes fit better, especially inautumn (SON) and winter (DJF). With the increase inprecipitation, extreme events also have changedsignificantly.
ACKNOWLEDGEMENTS
The research is supported by the National Basic ResearchProgram of China (973 Program: 2010CB951003).Assistance on data processing and paper writing fromYongbo Liu is greatly appreciated. The authors thankthe National Climate Central, China MeteorologicalAdministration for providing the meteorological data forthis study.
REFERENCES
Alexander LV, Zhang X, Peterson TC, Caesar J, Gleason B, Tank A,Haylock M, Collins D, Trewin B, Rahimzadeh F, Tagipour A, KumarKR, Revadekar J, Griffiths G, Vincent L, Stephenson DB, Burn J,Aguilar E, Brunet M, Taylor M, New M, Zhai P, Rusticucci M,Vazquez-Aguirre JL. 2006. Global observed changes in daily climateextremes of temperature and precipitation. Journal of GeophysicalResearch—Atmospheres 111(D5). DOI: 10.1029/2005jd006290.
Alexander LV, Hope P, Collins D, Trewin B, Lynch A, Nicholls N. 2007.Trends in Australia’s climate means and extremes: a global context.Australian Meteorological Magazine 56(1): 1–18.
Alexandersson H. 1986.A homogeneity test applied to precipitation data.J Climatol 6(6): 661–675.
Baines PG, Folland CK. 2007. Evidence for a rapid global climate shiftacross the late 1960s. Journal of Climate 20: 2721–2744.
Buishand TA. 1982. Some methods for testing the homogeneity of rainfallrecords. Journal of Hydrology 58(1–2): 11–27.
Caesar J, Alexander LV, Trewin B, Tse-Ring K, Sorany L, Vuniyayawa V,Keosavang N, Shimana A, Htay MM, Karmacharya J, JayasinghearachchiDA, Sakkamart J, Soares E, Hung LT, Thuong LT, Hue CT, Dung NTT,Hung PV, Cuong HD, Cuong NM, Sirabaha S. 2011. Changes intemperature and precipitation extremes over the Indo-Pacific regionfrom 1971 to 2005. International Journal of Climatology 31(6): 791–801.DOI: 10.1002/joc.2118.
Chen YN, Li WH, Xu CC, Hao XM. 2007. Effects of climate change onwater resources in Tarim River Basin, Northwest China. Journal ofEnvironmental Sciences (China) 19(4): 488–493.
Hydrol. Process. 27, 1807–1818 (2013)

1818 H. WANG, Y. CHEN AND Z. CHEN
Chen YN, Yang Q, Luo Y. 2012. Ponder on the issues of waterresources in the arid region of northwest China. Arid Land Geography35: 1–9 (in Chinese).
ChiewFHS,McMahonTA. 1993. Detection of trend or change in annualflowof Australian rivers. International Journal of Climatology 13: 643–653.
Di Baldassarre G, Castellarin A, Brath A. 2006. Relationships betweenstatistics of rainfall extremes and mean annual precipitation: anapplication for design-storm estimation in northern central Italy.Hydrology and Earth System Sciences 10(4): 589–601.
Durao RM, Pereira MJ, Costa AC, Delgado J, del Barrio G, Soares A.2010. Spatial–temporal dynamics of precipitation extremes in southernPortugal: a geostatistical assessment study. International Journal ofClimatology 30(10): 1526–1537. DOI: 10.1002/joc.1999.
Endo N, Matsumoto J, Lwin T. 2009. Trends in precipitation extremesover Southeast Asia. Sola 5: 168–171. DOI: 10.2151/sola.2009-043.
Frich P, Alexander LV, Della-Marta P, Gleason B, Haylock M,Tank AMGK, Peterson T. 2002. Observed coherent changes in climaticextremes during the second half of the twentieth century. ClimateResearch 19(3): 193–212.
Gemmer M, Fischer T, Jiang T, Su BD, Liu LL. 2011. Trends inprecipitation extremes in the Zhujiang River Basin, South China.Journal of Climate 24(3): 750–761. DOI: 10.1175/2010jcli3717.1.
Hundecha Y, Bardossy A. 2005. Trends in daily precipitation andtemperature extremes across western Germany in the second half of the20th century. International Journal of Climatology 25(9): 1189–1202.DOI: 10.1002/joc.1182.
IPCC. 2007. Intergovernmental panel on climate change. Climate Change2007. Synthesis Report[EB/OL].[2007]. http://www.ipcc.ch.
Kang SC, You QL, Aguilar E, Pepin N, Flugel WA, Yan YP, Xu YW,Zhang YJ, Huang J. 2011. Changes in daily climate extremes in Chinaand their connection to the large scale atmospheric circulation during1961–2003. Climate Dynamics 36(11–12): 2399–2417.
Katz RW. 1999. Extreme value theory for precipitation: sensitivity analysisfor climate change. Advances in Water Resources 23(2): 133–139.DOI: 10.1016/s0309-1708(99)00017-2.
Kendall MG. 1975. Rank Correlation Measures. Charles Griffin: London;202.
Kiktev D, Sexton DMH, Alexander L, Folland CK. 2003. Comparison ofmodeled and observed trends in indices of daily climate extremes.Journal of Climate 16(22): 3560–3571.
Kioutsioukis I, Melas D, Zerefos C. 2010. Statistical assessment ofchanges in climate extremes over Greece (1955–2002). InternationalJournal of Climatology 30(11): 1723–1737. DOI: 10.1002/joc.2030.
Li Z, Zheng FL, Liu WZ, Flanagan DC. 2010. Spatial distribution andtemporal trends of extreme temperature and precipitation events on theLoess Plateau of China during 1961–2007. Quaternary International226(1–2): 92–100. DOI: 10.1016/j.quaint2010.03.003.
Li ZX, He YQ, Wang CF, Wang XF, Xin HJ, Zhang W, Cao WH. 2011.Spatial and temporal trends of temperature and precipitationduring 1960–2008 at the Hengduan Mountains, China. QuaternaryInternational 236: 127–142.
Liu JR, Song XF, Sun XM, Yuan GF, Liu X. 2009. Isotopic compositionof precipitation over Arid Northwestern China and its implications forthe water vapor origin. Journal of Geographical Sciences 19: 164–174.
Liu CM, Chen YN, Xu ZX. 2010. Eco-hydrology and sustainabledevelopment in the arid regions of China. Hydrological Processes24(2): 127–128.
Mann HB. 1945. Non-parametric tests against trend. Econometrica13: 245–259.
McGilchrist CA, Woodyer KD. 1975. Note on a distribution-free CUSUMtechnique. Technometrics 17(3): 321–325.
New M, Hewitson B, Stephenson DB, Tsiga A, Kruger A, Manhique A,Gomez B, Coelho CAS, Masisi DN, Kululanga E, Mbambalala E,Adesina F, Saleh H, Kanyanga J, Adosi J, Bulane L, Fortunata L,Mdoka ML, Lajoie R. 2006. Evidence of trends in daily climateextremes over southern and west Africa. Journal of GeophysicalResearch—Atmospheres 111(D14). DOI: 10.1029/2005jd006289.
Pal I, Al-Tabbaa A. 2011. Assessing seasonal precipitation trends in Indiausing parametric and non-parametric statistical techniques. Theoretical andApplied Climatology 103(1–2): 1–11. DOI: 10.1007/s00704-010-0277-8.
Pavan V, Tomozeiu R, Cacciamani C, Di Lorenzo M. 2008. Dailyprecipitation observations over Emilia-Romagna: mean values andextremes. International Journal of Climatology 28(15): 2065–2079.DOI: 10.1002/joc.1694.
Peterson TC, Easterling DR, Karl TR, Groisman P, Nicholls N, PlummerN, Torok S, Auer I, Boehm R, Gullett D, Vincent L, Heino R,Tuomenvirta H, Mestre O, Szentimrey T, Salinger J, Forland EJ,
Copyright © 2012 John Wiley & Sons, Ltd.
Hanssen-Bauer I, Alexandersson H, Jones P, Parker D. 1998.Homogeneity adjustments of in situ atmospheric climate data: a review.International Journal of Climatology 18(13): 1493–1517.
Ren G, Feng G, Yan Z.2010. Progresses in observation studies of climateextremes and changes in mainland China. Climatic and EnvironmentalResearch 15(4): 337–353 (in Chinese).
Shi YF, Shen YP, Kang E, Li DL, Ding YJ, Zhang GW, Hu RJ. 2007.Recent and future climate change in northwest China. Climatic Change80(3–4): 379–393. DOI: 10.1007/s10584-006-9121-7.
Su BD, Jiang T, Jin WB. 2006. Recent trends in observed temperature andprecipitation extremes in the Yangtze River basin, China. Theoreticaland Applied Climatology 83(1–4): 139–151. DOI: 10.1007/s00704-005-0139-y.
Sun GL, Chen YN, Li WH. 2011. Interannual and interdecadal variationsof extremes hydrological events and responses to climate change inXinjiang. Science Geographica Sinica 31: 1389–1395 (in Chinese).
Tank A, Konnen GP. 2003. Trends in indices of daily temperature andprecipitation extremes in Europe, 1946–99. Journal of Climate 16(22):3665–3680.
Tank AMGK, Peterson TC, Quadir DA, Dorji S, Zou X, Tang H,Santhosh K, Joshi UR, Jaswal AK, Kolli RK, Sikder AB, DeshpandeNR, Revadekar JV, Yeleuova K, Vandasheva S, Faleyeva M,Gomboluudev P, Budhathoki KP, Hussain A, Afzaal M, ChandrapalaL, Anvar H, Amanmurad D, Asanova VS, Jones PD, New MG,Spektorman T. 2006. Changes in daily temperature and precipitationextremes in central and south Asia. Journal of Geophysical Research—Atmospheres 111(D16). DOI: 10.1029/2005JD006316.
Tromel S, Schonwiese CD. 2007. Probability change of extremeprecipitation observed from 1901 to 2000 in Germany. Theoreticaland Applied Climatology 87(1–4): 29–39.
Wang YQ, Zhou L. 2005. Observed trends in extreme precipitation eventsin China during 1961–2001 and the associated changes in large-scalecirculation. Geophysical Research Letters 32(9). DOI: 10.1029/2005gl022574.
Williams CJR, Kniveton DR, Layberry R. 2010. Assessment of a climatemodel to reproduce rainfall variability and extremes over SouthernAfrica. Theoretical and Applied Climatology 99(1–2): 9–27.DOI: 10.1007/s00704-009-0124-y.
Xu CC, Chen YN, Yang YHI, Hao XM, Shen YP. 2010a. Hydrology andwater resources variation and its response to regional climate change inXinjiang. Journal of Geographical Sciences 20(4): 599–612.DOI: 10.1007/s11442-010-0599-6.
Xu L, Zhou H, Liang C, Du L, Li H. 2010b. Spatial and temporalvariability of annual and seasonal precipitation over the desert region ofChina during 1951–2005. Hydrological Processes 24(20): 2947–2959.DOI: 10.1002/hyp.7708.
You QL, Kang SC, Aguilar E, Yan YP. 2008. Changes in daily climateextremes in the eastern and central Tibetan Plateau during 1961–2005.Journal of Geophysical Research—Atmospheres 113(D7).DOI: 10.1029/2007jd009389.
You QL, Kang SC, Aguilar E, Pepin N, Flugel WA, Yan YP, Xu YW,Zhang YJ, Huang J. 2011. Changes in daily climate extremes in Chinaand their connection to the large scale atmospheric circulation during1961–2003. Climate Dynamics 36(11–12): 2399–2417. DOI: 10.1007/s00382-009-0735-0.
Yu RC, Wang B, Zhou TJ. 2004. Tropospheric cooling and summermonsoon weakening trend over East Asia. Geophysical ResearchLetters 31(22). DOI: 10.1029/2005JD006181.
Zhai PM, Zhang XB, Wan H, Pan XH. 2005.Trends in total precipitationand frequency of daily precipitation extremes over China. Journal ofClimate 18: 1096–1108.
Zhang XB, Aguilar E, Sensoy S, Melkonyan H, Tagiyeva U, Ahmed N,Kutaladze N, Rahimzadeh F, Taghipour A, Hantosh TH, Albert P,Semawi M, Ali MK, Al-Shabibi MHS, Al-Oulan Z, Zatari T, Khelet IA,Hamoud S, Sagir R, Demircan M, Eken M, Adiguzel M, Alexander L,Peterson TC, Wallis T. 2005. Trends in Middle East climate extremeindices from 1950 to 2003. Journal of Geophysical Research—Atmospheres 110(D22). DOI: 10.1029/2005JD006181
Zhang QA, Xu CY, Zhang ZX, Chen X, Han ZQ. 2010. Precipitationextremes in a karst region: a case study in the Guizhou province, southwestChina. Theoretical and Applied Climatology 101(1–2): 53–65.DOI: 10.1007/s00704-009-0203-0.
Zolina O, Simmer C, Kapala A, Bachner S, Gulev S, Maechel H. 2008.Seasonally dependent changes of precipitation extremes over Germanysince 1950 from a very dense observational network. Journal ofGeophysical Research—Atmospheres 113(D6). DOI: 10.1029/2007jd008393.
Hydrol. Process. 27, 1807–1818 (2013)