Survey of Current Business February 1960
72
FEBRUARY 1960 survey of CURRENT----- BUSINESS---- U.S. DEPARTMENT OF COMMERCE OFFICE OF BUSINESS ECONOMICS I ANNUAL REVIEW NUMBER I
-
Upload
khangminh22 -
Category
Documents
-
view
2 -
download
0
Transcript of Survey of Current Business February 1960
FEBRUARY 1960
survey of
CURRENT----BUSINESS----
U.S. DEPARTMENT OF COMMERCE
OFFICE OF BUSINESS ECONOMICS
I ANNUAL REVIEW NUMBER I
SURVEY OF CURRENT BUSINESS
FEBRUARY 1960 VOL. 40, NO. 2
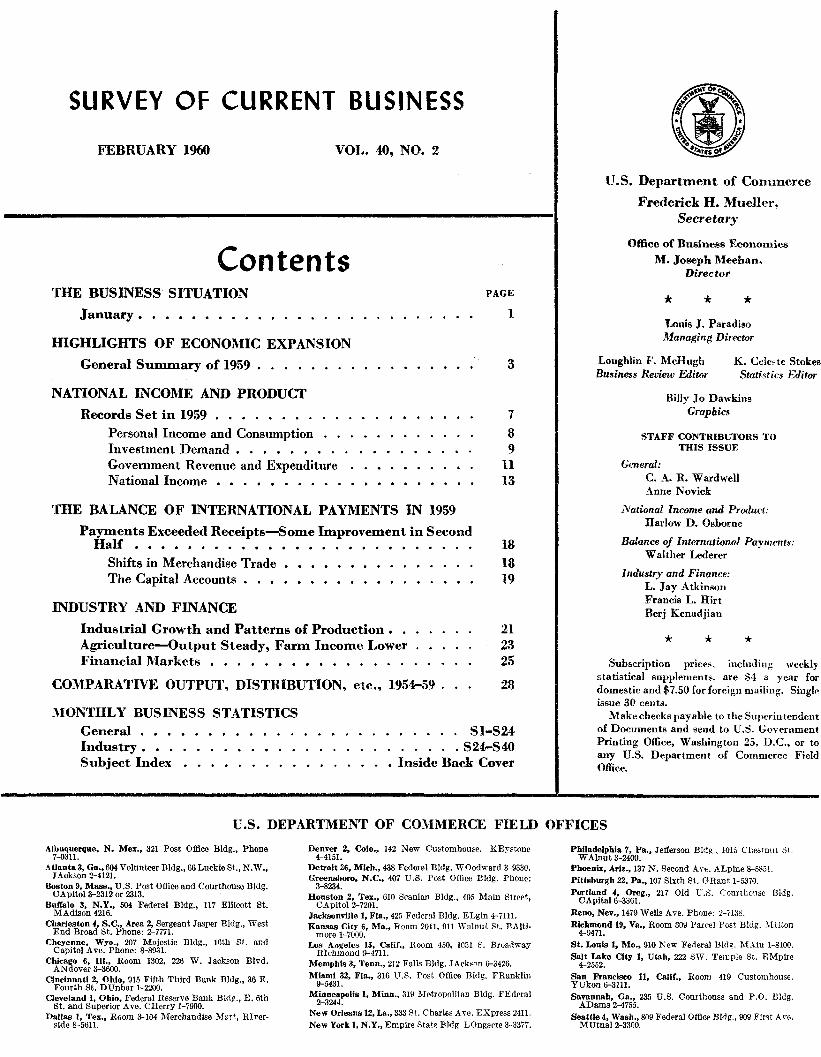
Contents THE BUSINESS SITUATION
January • ..••....
HIGHLIGHTS OF ECONOMIC EXPANSION
General Summary of 1959 .....
NATIONAL INCOME AND PRODUCT
Records Set in 1959 • • . . • • • . Personal Income and Consmnption Investment Demand • • • • • • . • Government Revenue and Expenditure National Income • • • • • • • • • • • • • •
THE BALANCE OF INTERNATIONAL PAYMENTS IN 1959
Payments Exceeded Receipts-Some Improvement in Second Half . . . . . . . . . . . . . . . . . . . . .
Shifts in Merchandise Trade The Capital Accounts
INDUSTRY AND FINANCE
Industrial Growth and Patterns of Production • Agriculture-Output Steady, Farm Income Lower Financial Markets • . • . . . • • • . . . .
COMPARATIVE OUTPUT, DISTRIBUTION, etc., 1954-59
PAGE
1
3
7 8 9
11 13
18 18 19
21 23 25
28
:\IONTHLY BUSINESS STATISTICS General ••• Industry ••..
..... S1-S24
..... S24-S40 Subject Index • Inside Back Cover
U.S. Department of Commerce
Frederick H. Mueller, Secretary
Office of Business Economics
l\1, Joseph l\feehan. Director
* * * Louis J. Paradiso Managing Director
Loughlin F. McHugh Bu.1iness Review Editor
K. Celc~te Stokes Statistics Editor
Billy Jo Dawkins Graphics
STAFF CONTRIBUTORS TO THIS ISSUE
G..>neral: C. A. R. Wardwell Anne Novick
J\'atwnal Income and Product: Harlow D. Osborne
Balance of Intematwnal Payments: Walther Lederer
Industry and Finance: L. Jay Atkinson Francis L. Hirt Berj Kenadjian
* * * Subscription prices, including weekly
statistical supplements, are $4 a year for domestic and $7.50 for foreign mailing. Single issue 30 cents.
Make checks payable to the Superiutendent of Documents and send to U.S. Government Printing Office, Washington 25, D.C., or to any U.S. Department of Commerce Field Office.
U.S. DEPARTMENT OF COMMERCE FIELD OFFICES
Albuquerque, N. Mex., 321 Post Office Bldg., Phone 7-Q311.
Atlanta 3, Ga., 604 Volunteer Bldg., 66 Luckie St., N .W., JAckson 2-4121.
Boston 9, Mass., U.S. Post Office and Courthouse Bldg. CApltol3-2312 or 2313.
Buffalo 3, N.Y., 504 Federal Bldg., 117 Ellicott St. MAdison 4216.
Charleston 4, S.C., Area 2, Sergeant Jasper Bldg., 'Vest End Broad St. Phone: 2-7771.
Cheyenne, Wyo., 207 Majestic Bldg., 16th St. and Capitol Ave. Phone: 8-8931.
Chicago 6, 1!1., Room 1302, 226 W. Jackson Blvd. AN dover 3-3600.
Cincinnati 2, Ohio, 915 Fift.h Third Bank Bldg., 36 E. Fourth St. DUnbar 1-2200.
Cleveland I, Ohio, Federal Reserve Bank BldJZ., E. 6th St. and Superior Ave. CHerry 1-7900.
Dallas I, Tex., Room 3-104 :lferchandise Mart, Riverside 8-5611.
Denver 2, Colo., 142 New Custombou;~. KEystone 4-4151.
Detroit 26, Mich., 438 Federal Bldg. WOodward 3-9330. Greensboro, N.C., 407 U.S. Post Office Bldg. Phone:
3-8234. Houston 2, Tex., 610 Scanlan Bldg., 405 Main Street,
CApitol 2-i201. Jacksonville I, Fla., 425 Federal Bldg. ELgin 4-illl. Kansas City 6, Mo., Room 2011, 911 Walnut St. BAlti
more 1-7000. Los Angeles 15, Calif., Room 450, 1031 S. Broadway
Richmond 9-4711. Memphis 3, Tenn., 212 Falls Bldg. JAck>on 6-3426. Miami 32, Fla., 316 V .S. Post Office Bldg. FRanklin
9-5431. Minneapolis I, Minn., 319 Metropolitan Bldg. FEderal
2-3244. New Orleans I2, La., 333 8t. Charles A >e. EXpress 2411. New York I, N.Y., Empire State Bldg. LOngaere 3-3377.
Philadelphia 7, Pa., Jeff~rson Bldg., 1015 CheMmll ,;t. WAlnut 3-2400.
Phoenix, Ariz.,137 N. Second A\"e. ALpine 8-5851. Pittsburgh 22, Pa., 107 Sixth St.. GRant 1-5370.
Portland 4, Oreg., 217 Old C.S. Courtl;onsc Bldg. CApltal&-3361.
Reno, Nev., 1479 Wells Ave. Phone: 2-ila8.
Richmond 19, Va., Room 309 Pare€! Post Bldg. :\llllon 4-9471.
St. Louis 1, Mo., 910 New Federal Bldg. MAin 1-8100. Salt Lake City I, Utah, 222 SW. Temple St. EMpire
4-2552. San Francisco 11, Calif., Room 419 Customhouse. YUkon 6-311I. Savannah, Ga., 235 U.S. Courthouse and P.O. llldg.
ADams 2-4755. Seattle 4, Wash., 809 Federal Office Bing., 909 Fim A "0·
MUtual 2-3300.
Budinedd Situation in Januarg
BusiNESS continued to expnml in the opening month of 1960. The broad ,.;easonally adjusted economic indicators-employment and personal income-were up.
Retail sales continued high, with the .January movement in the total again rpflecting the shift in new auto sales. ( 'onsumer buying continues to be sustained by the advance in income, which in .January was again concentrated in highl'r wage and salary payments.
Pl:'rsonal income-which is the most comprehensive monthly measure of business movements and consumer buying power-was at a seasonally adjusted annual rate of $:393 billion in January, up $1 billion from December. Income was 6)f percent above January 1959. Output and resulting employment gains provided the basis of the improvement. The total of wage and salary disbursements in January, corrected for the usual seasonal influences, was up $2 billion from December. Increased taxes under the social insurance programs were a partial ofl'set.
Nonfarm employees nmnbered 52.8 million in .January, down less than seasonally from Decem her. -" f au ufaeturing employment-- all(! more paro.icularly tbe metal producing and using industries---provided the major rise in ,January, bringing the number on factory payrolls once again close to the 1959 high.
Indnstrial groups with employees roughly equal to or higher than the top in 1959, include the utilities, finance, services, trade, and the combined government figure. Together these
By the Office of Business Economics
account for ovt-r :n million employees, or three-fifths of total off-farm employment..
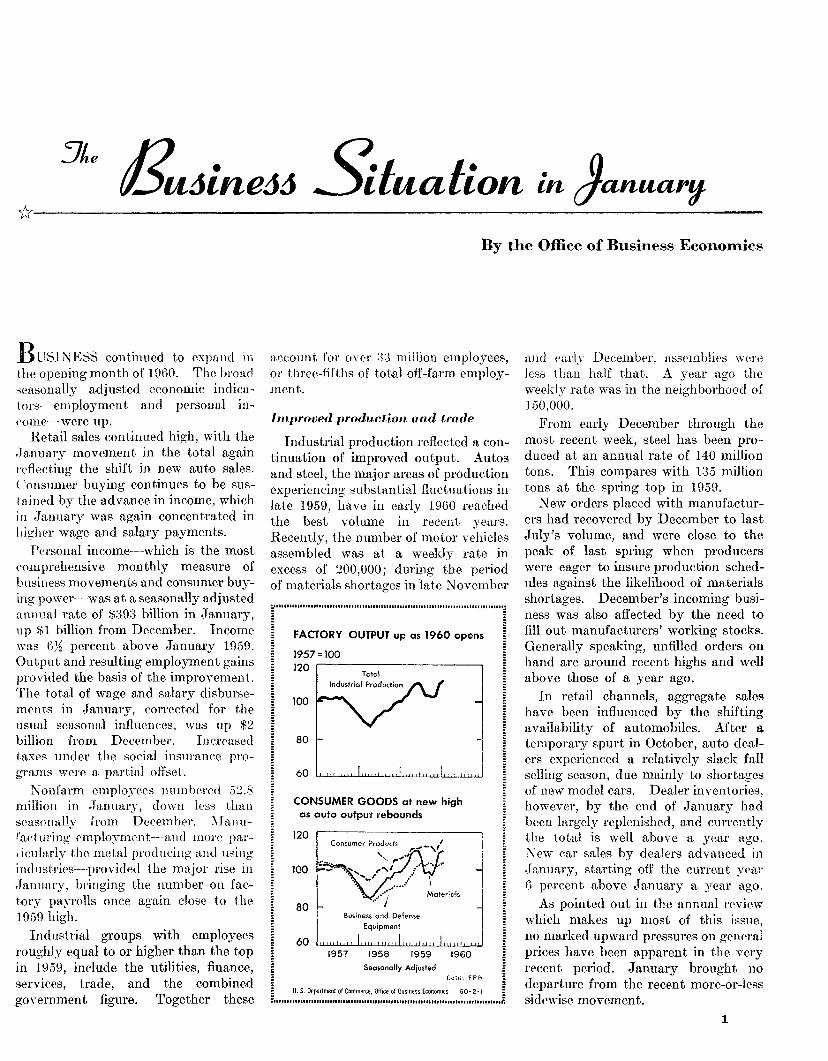
Improved production and trade
Industrial production reflected a continuation of improved output. Autos and steel, the major areas of produetion experiencing substantial fluctuations in late 1959, have in early 1960 reached the best volume in recent years. Recently, the number of motor vehicles assembled was at a weekly rate in exeess of 200,000; during the period of materials shortages in late November
1957=100 120
100
80
60
Tolal
CONSUMER GOODS at new high as auto output rebounds
120
100
80 Business and Defense
Equipment
Mate6ors
60 ~~llll~~L~~WW~llW~ 1957 1958 1959 1960
~=.· Seasonally Adjusted Doto, FRB
U.S. Department of Commerce, Office of Business Economics 60·2·1 :nlltfltiiiiiUIIIIIIUIIUUIIIUIUUIUIUIIIIUIIIIIIIIIIIIIIIIUtrltltlllltllllll':
nnd l'nrly Decemlwr, asst<mblics wore kss than half that. A year ago the weekly rate was in the neighborhood o! 1.50,000.
From early December through the most recent week, steel has been produced at an annual rate of 140 million tons. This eompares with 135 million tons at the spring top in 1959.
New orders placed with manufacturers had recovered by December to last July's volume, and were close to the peak of last spring when producers were eager to insure production schedules against the likelihood of materials shortages. Deeember's incoming business was also affected by the need to fill out manufacturers' working stocks. Generally speaking, unfilled orders on hand are around recent highs and well above those of a year ago.
In retail channels, aggregate sales have been influenced by the shifting availability of automobiles. After a temporary spurt in October, auto dealers experienced a relatively slack fall selling season, due mainly to shortages of new model cars. Dealer inventories, however, by the end of January had been largely replenished, and currently the total is well above a year ago. New car sales by dealers advanced in .Janua.ry, starting off the current year (\ percent above January a year ago.
As pointed out in the annual review which makes up most of this issue, no marked upward pressures on general prices have been apparent in the very recent period. January brought no departure from the recent more-or-less sidewise movement.
1
2
Shifts infinanciul markets
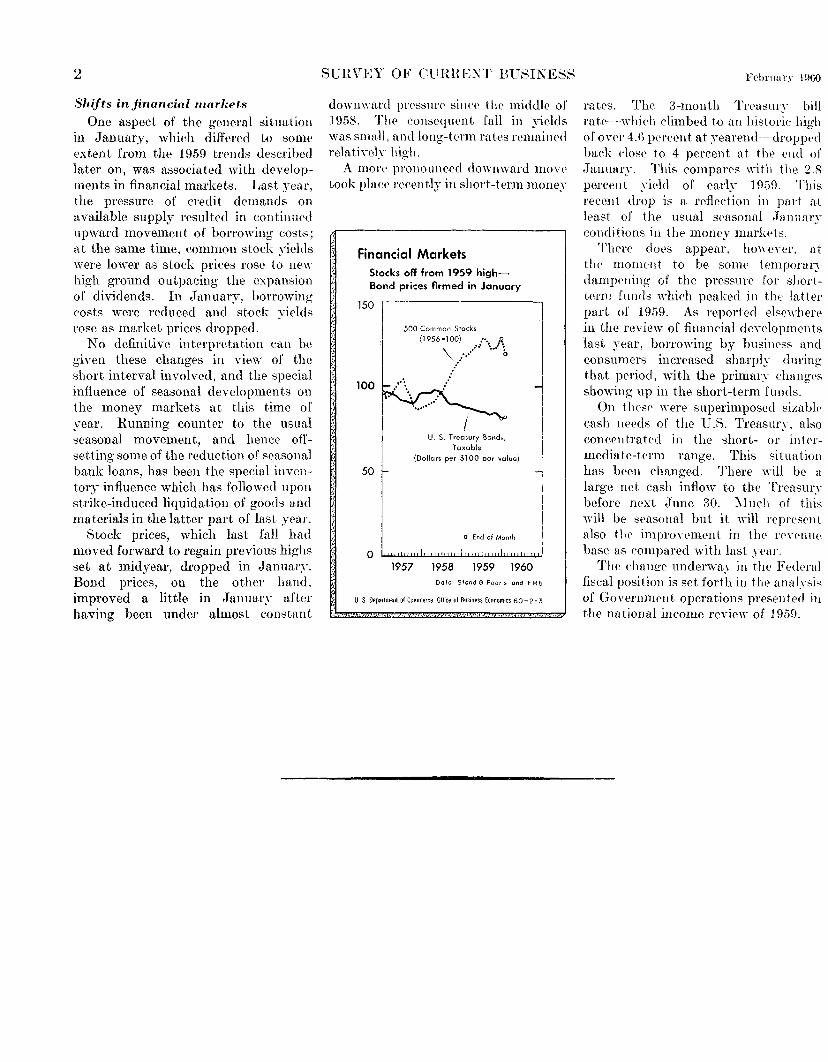
One aspect of the general situation in January, which differed to some t•xtent from the 1959 trPnds dPscribC'd later on, was associated with developments in financial markets. Last year, the pressure of credit demands on available supply resulted in continued upward movement of borrowing costs; at the same time, common stock yields were lower as stock prices rose to new high ground outpaeing the expansion of dividends. In ,Tanuar~-, borrowing costs were reduced and stock yields rose as market prices dropped.
No definitive interpretation can be given these changes in view of the short interval involved. and the special influence of seasonal developments on the money markets at this time of year. Running count0r to the usual seasonal movement, and hence offsetting some of the reduction of sC'asonal bank loans, has been the special inventory influence which has follo\ved upon strike-induced liquidation of goods and materials in the latter part of last year.
Stock prices, which last fall had moved forward to regain previous highs set at midyear, dropped in Januar,,·. Bond prices, on the other hand, improved a little in January after having been under almost constant
SURVEY OF CFRHE:XT BUSI~ESS
dowmn1rd pressure sinre the middle of 1958. ThP con seq ucnt fall in yields was small, and long-term rates remained relatiYely higll.
A mon· prououncecl downward moY<' took plac!' recently in short-term money
Financial Markets Stocks off from 1959 highBond prices flrmed in January
150
I """"'OM '"'" l 'I '""~'', ...... .;v\ ~ 100~
I U. S. Tre!,ury Bond;, Taxable
(Dollars per $100 par value)
50 -
0 End of Month
0 ,I, ,I ,1
1957 1958 1959 1960 Data: Stand 8 Poor s and FRS
U.S. Department of Commerce, Office of Business Economics 60-2-3
Febrnn ry Hl60
rates. The 3-month Treasury bill rate--which <·limbed to an historic high of over 4.() percent at .nareml-- dropped back close to 4 percent at thP tnd of Januar.\-. This compares with the 2.8 percellt yield of early 1959. This recent drop is a reflertion in part at }past of the usual seasonal .January conditions in the money markets.
There cloPs appear, howeYer, at the moment to be some temporary dam1wning of the pressurE' for shorttprm funds which peaked in the latter part of 1959. As reported else"·hf'n' in the rrview of financial dcYelopments last year, borrowing by business and consumers increased sharply during that period, with tl1e primm·.'- changes showing up in the short-term funds.
On thesf' \Yere superimposed siza hlP cash needs of the li.S. Treasury. also concentrnted in the short- or intermediate-term range. This situation has been changed. There ,,-ill he a large net rash inflow to the Treasury before next June 30. :\Iuch of this will be seasonal but it will l'('PJ'('SE'Ilt also thP improYernent in the ren'!Hl(' base as eompared with last year.
The changr underway in the Fedural fiscal position is set forth in the analysi" of Govemmcnt operations presented in the national income review of 1959.
JJ.ig~/ig/dd o/ Gconomic Gxpandion . . .
.A Jeview o/ 1959
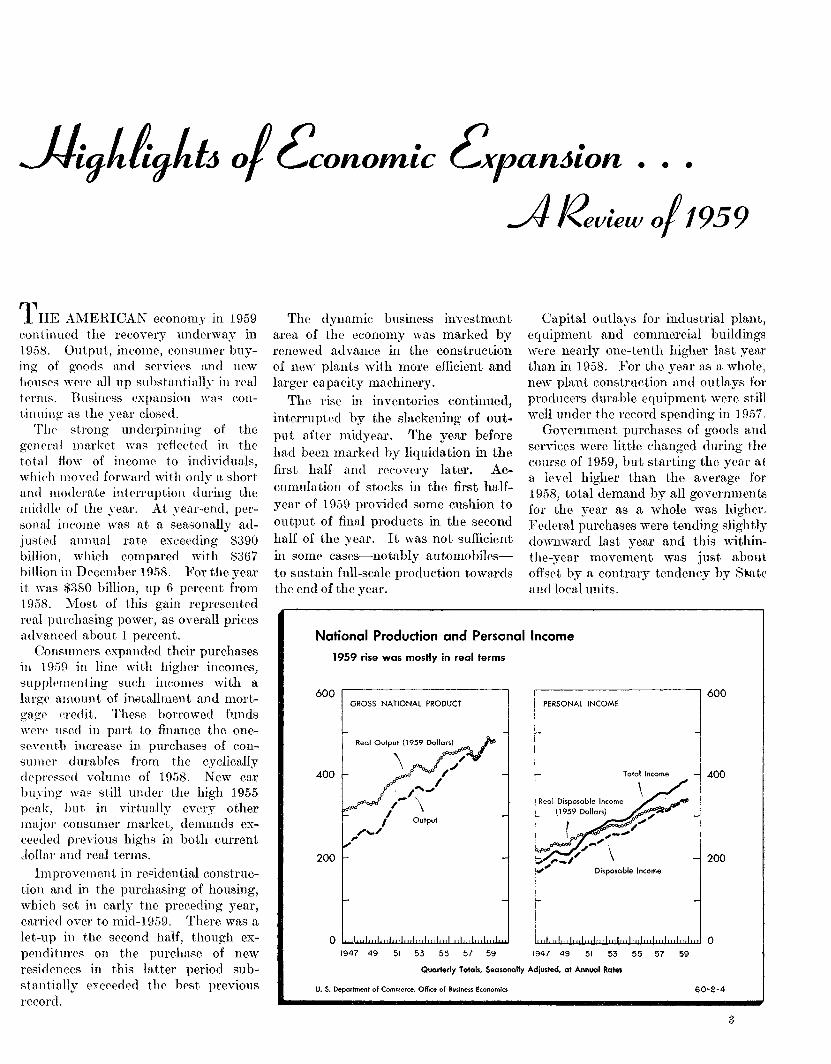
THE Al\fERICAN economy in 1959 continued the recovery und0rway in 1958. Output., income, consumer buying of goods and serviet's and new houses w0re all up substantinll.'· in real terms. Business expansion wns eontinuing as the year closrcl.
The· strong underpinning of the g<'JH'rnl market was rdic•eted in the total How of inconw to individuals, which moved forward with only a short and moderate interruption during the middl(' of the year. At year-end, personal ineomc was at a seasonally adjuskd annual rate exceeding $390 billion, which compared with $367 billion in December 1958. For the year it was $:)80 billion, up 6 percent from 1958. .Most of this gain represented rf'al purehasing power, as overall prices advanced about 1 percent.
Consumers expanded their purchases in 1909 in line with higher incomes, supplPmcnting such incomf's with a large n.mount of installment and mortgngf' <Tcdit.. These borrowed funds were used in part to finance the oneS<'Ycnth increase in purchases of consumer durables from the cyclically (kpressed volume of 1958. New car buying wat' still under the high 1955 pt>nk, hut in virtually every other major eonsurner market, demands exceeded previous highs in both current Jollar and real terms.
Improvement in ref'idential eonstruction and in the purchasing of housing, which set in early tno preceding year, earric•d over to mid-1959. There was a let-up in the second half, though expenditures on the purehase of new residences in this latter period substantially exc!'eded the best previous record.
The dynamic business invt'stment area of the economy was marked by renewed advance in the construction of new plants with more efficient and larger capucity machinery.
The rise in inventories continued, interrupted by the slackening of output after midyear. The year before had been marked by liquidation in the first half and roC'ovory later. Accumulation of st.ocks in the first halfyear of 1959 provided some cushion to output of final products in the second half of the year. It was not sufficient in some cases-notably automobilesto sustain full-scale production towards the end of the year.
Capital outlays for industrial plant, equipment and commcrcitd buildings were nearly one-tenth higher last year than in 1958. For the year as a wlwk new plant construction and outlays for producers durable equipment W!'rc still well under the record spending in 1 957.
Government purchases of goods nnd services were little ehanged during the course of 1959, but starting the year n.t a level higher than the averagP for 19fi8, total demand by all government.s for the year as a whole was higher. Federal purchases were tending slightly dowmvard last year and this withinthe-year movement was just about offset by a contrary tendency by SM.tc n11d local units.
National Production and Personal Income
1959 rise was mostly in real terms
600 600 GROSS NATIONAL PRODUCT PERSONAL INCOME
1947 49 51 53 55 57 59 1947 49 51 53 55 57 59
Quarterly Totals, Seasonally Adjusted, at Annual Rates
U. S. Deportment of Commerce, Office of Business Economics 60-2-4
4
Employment and wages up
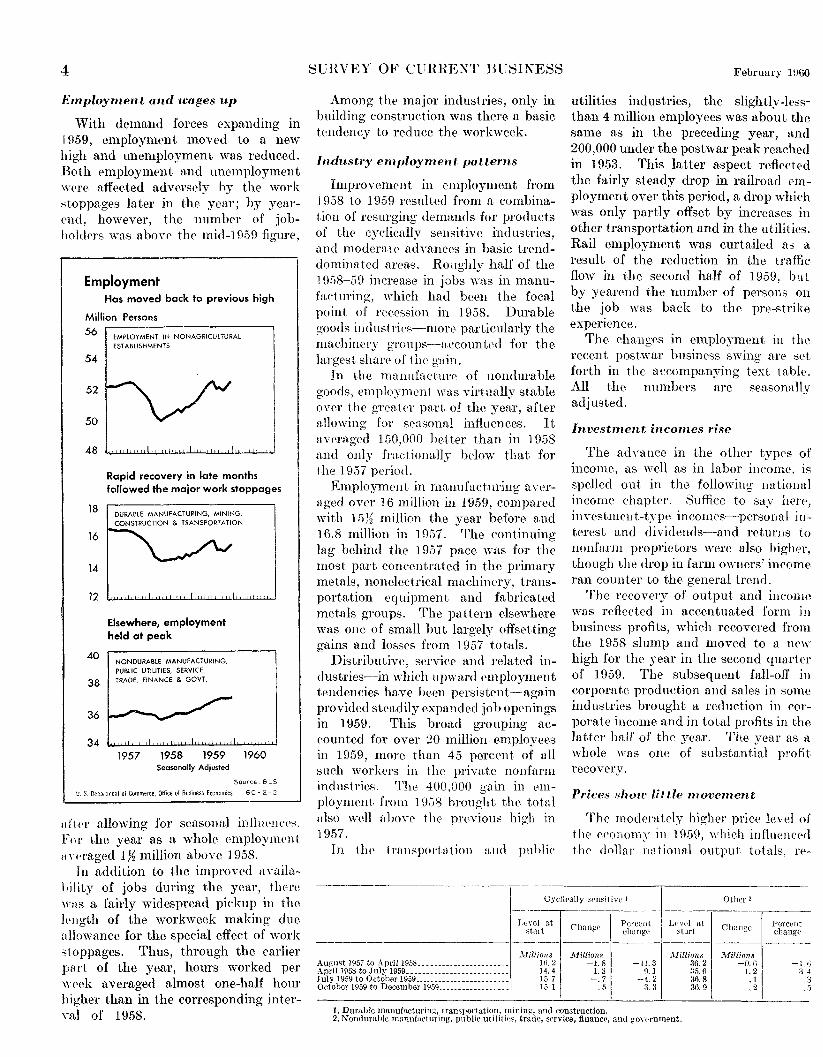
With demand forces expanding in 19.59, employment moved to a new high and unemployment was reduced. Both employment and unemployment WPre affected advt'rsdy by the work :-;toppages later in the year; by yearend, however, the number of jobholdt>rs was abon' the mid-Hl?i9 figure,
Employment Has moved back to previous high
Million Persons 56 EMPLOYMENT IN NONAGRICULTURAL
ESTABLISHMENTS
54
52
50
48
18
16
14
12
40
38
36
34
Rapid recovery in late months followed the major work stoppages
Elsewhere, employment held at peak
NONDURABLE MANUFACTURING,
PUBLIC UTILITIES, SERVICE, TRADE, FINANCE & GOVT.
1957 1958 1959 1960 Seasonally Adjusted
Source. 8L5
U. S Department of Commerce, Offtce of Business Eccnomics 6 0 - 2- 2
nftt•r allowing for seasonal inliuPIH'('S. For the year as a whole employment <n Praged 1 Yz million above 1 958.
In addition to the improYed <lY<1ilahility of jobs during the year, there wns a fairly widespread pickup in the ]pngth of the workweek making due allowance for the special effect of work stoppages. Thus, through the earlier part of the year, hours worked per "'(•ek averaged almost one-half hour higher than in the corresponding inter\·al of 1958.
SliHVEY OF CliRREXT BUSIXESS
Among the major industries, only in building construction was there a basic U·ndency to reduce the workweek.
Industry employment patterns
Improvement in employment from 1958 to 1959 resulted from !1 combination of rcsurging demands for products of the cyelicallv sensitive industries . ' and moderat<' adYances in basic trend-dominated areas. Roughly half of the 19{)8-59 increase in jobs was in manufaduring, which had been the focal point of n'ccssion in 1958. Durable goods industries-more' particularly the machinery groups-aecountNl for the largest share of the gain.
In the manufacture of nondurable goods, employment \Yas virtually stable over the gTentN part of the year, after allowing for sensonal influences. It nYeraged 150,000 better than in 1958 and only fractionally bdo\\' that for the 1957 period.
Employment in manufacturing avernged owr 1 6 million in 1959, compared with 1 57~ million the year before and 16.8 million in 1957. . The continuino·
b
lag behind the 1 957 pace was for the most part concentrated in the primary metals, nonelectrical machinery, transportation equipment and fabricated metals groups. The pattern elsewhere was one of small but largely offset.ting gains and losses from 1957 totals.
Distributive, service and related industries--in which upward employment tendencies have been persistent-again provided steadily expanded job openings in 1959. This broad grouping aceounted for over 20 million employees in 1959, more than 45 percent of all such workers in the private nonfarm industries. The 400,000 gain in employment. from 1 958 hroug]Jt, the totnl nlso well n hove tlH' pn;vious high in 1957.
In the transportntion and pnhlic
February 1000
utilities industries, the slightly-lessthan 4 million employees was about the same as in the preceding year, and 200,000 under the postwar peak reached in 1953. This latter aspect reflected the fairly steady drop in railroad employment over this period, a drop which was only partly offset by increases in other transportation and in the utilities. Rail employment wa.s curtailed as a result of the reduction in the traffic flow in the second half of 1959. but by yearend the number of persons on the j_ob was back to the pre-strike expenence.
The changes in employment in the recent postwar business swing are set forth in the accompanying text tabll:'. All the numbers are seasonnlly adjusted.
Investment incomes rise
The adYance in the other types of income, as well as in labor income. is spelled out in the following national income chapter. Suffice to sav here . . ~ ' uwestmcut-type mcomes-personal in-terest and dividends-and returns to nonfarm proprietors were also higher, though t.he drop in farm 0\vners' ineome ran counter to the general trend.
The recovery of output and income was reflected in accentuated form in business profits, which recovered from the 1958 slump and moved to a new high for the year in the second quarter of 1959. The subsequent fall-off in corporate production and sales in some industries brought a reduction in eorporate income and in total profits in the latter half of the year. The vear as a \',dwle was one of substantial profit recovery.
Prices show little moventent
The moclemtely higher price level of the economy in 19.59, which influenced tlH' dollar nntional output totals. rP-
----------------------------·--·-·------------.-----------Cydieally sensitive 1
J,~')~~~t at Change Perce1tt change
Level at start
Other 2
Change Percen: change
-----------------~ -~ -- ----- --------1----1--·---- -----JfiztiO!I8
August 1957 to April1958 ..... ---·-· .. ··-·· .... -, !fi. 2 April1958 to July 1959·-··--···-···········--·-- 14.4 July 1959 to October 1959.·--·-·····-- ... - ... -... 15.7 Oetoh0r Hl59 to December 1959 .... -- .. -··- .. ---·1 15.1
.Millions -1.8
1.3 -. 7
.5
l. Durahle manufncturing, transportation, mining, and construction.
-11.3 9.1
-4.2 3. 3
Afillions 36.2 :>5. 6 36.8 36.9
2. Nondurable mannf£1ctnring, public utilities, trade, service, financr, and. gon-'rnment.
1\Iillions -0.6
1.2 . 1 .2
February 1960
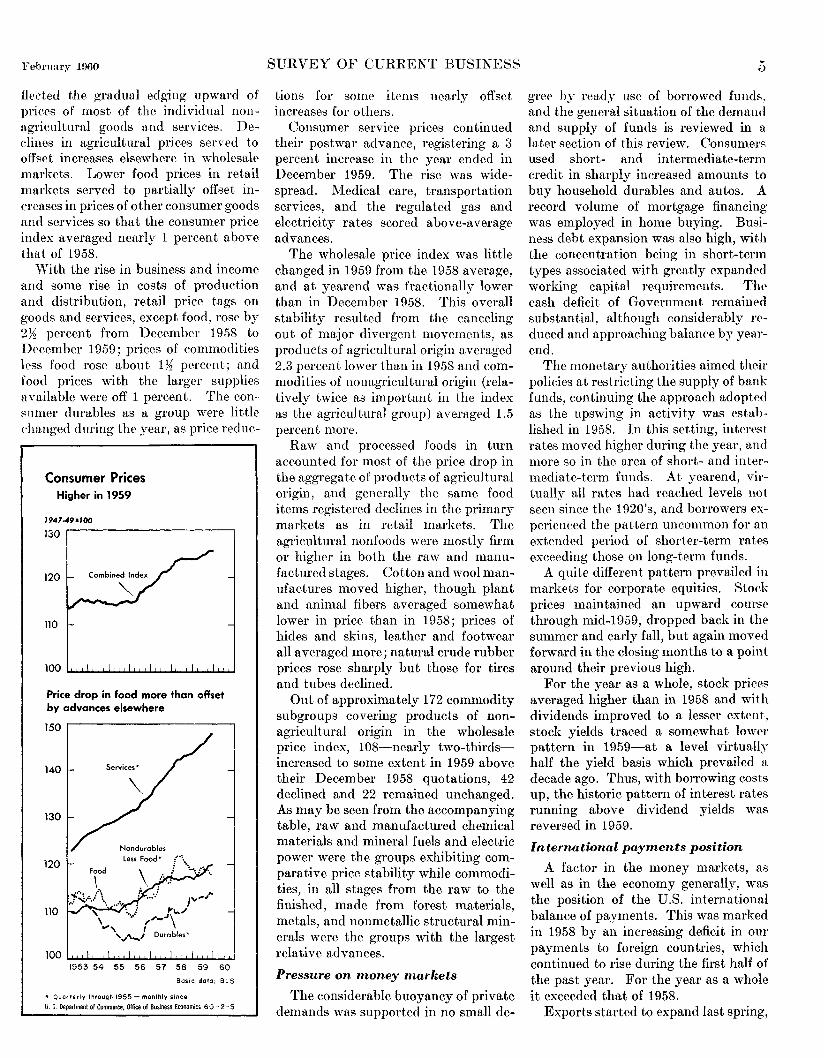
fleeted the gradual edging upward of prices of most of the individual nonagricultural goods and services. Declines in agricultural prices served to offset increases elsewhere in wholcsalP markets. Lower food prices in retail markets served to partially offset increases in prices of other consumer goods and services so that the consumer price index averaged nearly 1 percent above that of 1958.
With the rise in business and income and some rise in costs of production and distribution, retail price tags on goods and services, except food, rose by 2Yz percent from December 1958 to December 1959; prices of commodities less food rose about 1 Yz percent; and food prices with the larger supplies aYailable were off 1 percent. The consumer durables as a group were little changed during the year, as price reduc-
Consumer Prices Higher in 1959
Price drop in food more than offset by advances elsewhere
1953 54 55 56 57 58 59 60
Basic data: BLS
~t Quarterly through 1955- monthly since
U. $.Department of Commerce, Office of Business Economics 60-2-5
SURVEY OF CURRENT BUSINESS
tions for some items nearly offset increases for others.
Consumer service prices continued their postwar advance, registering a 3 percent increase in the year ended in December 1959. The rise was widespread. Medical care, transportation services, and the regulated gas and electricity rates scored above-average advances.
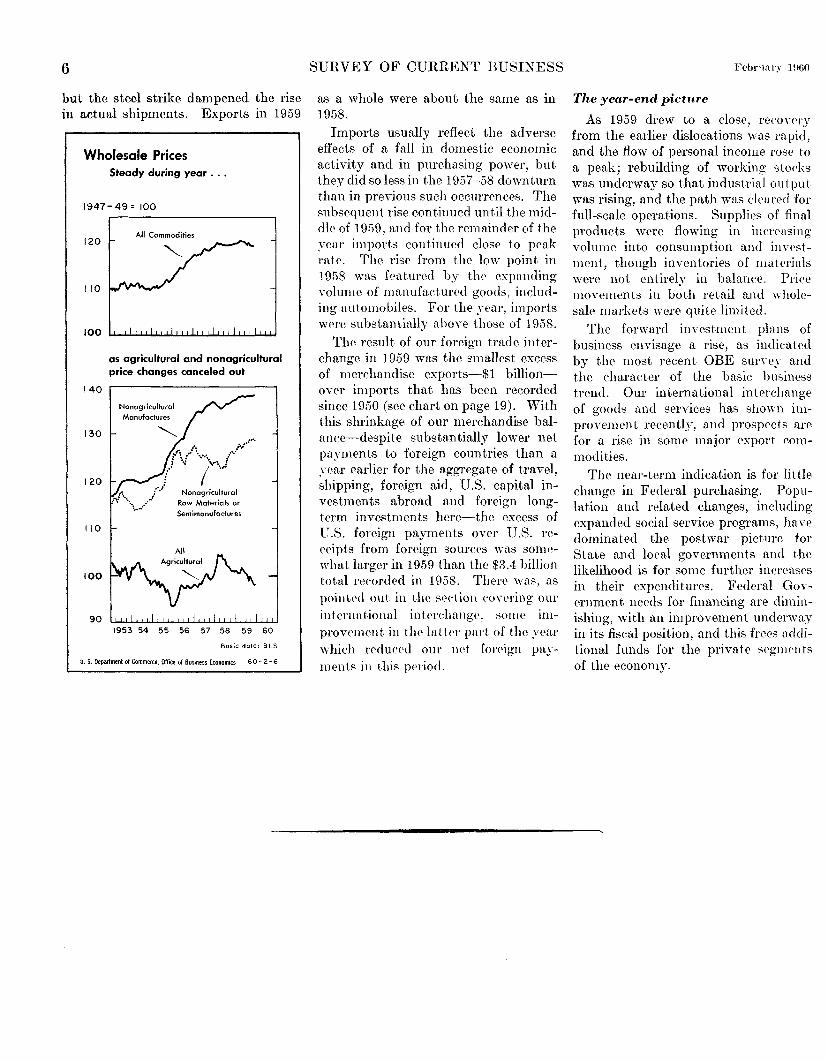
The wholesale price index was little changed in 1959 from the 1958 average, and at yearend was fractionally lower than in December 1958. This overall stability resulted from the canceling out of major divergent movements, as products of agricultural origin averaged 2.3 percent lower than in 1958 and commodities of nonagricultural origin (relatively twice as important in the index as the agricultural group) averaged 1.5 percent more.
Raw and processed foods in turn accounted for most of the price drop in the aggregate of products of agricultural origin, and generally the same food items registered declines in the primary markets as in retail markets. The agricultural nonfoods were mostly firm or higher in both the raw and manufactured stages. Cotton and wool manufactures moved higher, though plant and animal fibers averaged somewhat lower in price than in 1958; prices of hides and skins, leather and footwear all averaged more; natural crude rubber prices rose sharply but those for tires and tubes declined.
Out of approximately 172 commodity subgroups covering products of nonagricultural origin in the wholesale price index, 108-nearly two-thirdsincreased to some extent in 1959 above their December 1958 quotations, 42 declined and 22 remained unchanged. As may be seen from the accompanying table, raw and manufactured chemical materials and mineral fuels and electric power were the groups exhibiting comparative price stability while commodities, in all stages from the raw to the finished, made from forest materials, metals, and nonmetallic structural minerals were the groups with the largest relative advances.
Pressure on money markets
The considerable buoyancy of private demands was supported in no small de-
5
gree by ready use of borrowed funds, and the general situation of the demand and supply of funds is reviewed in a later section of this review. Consumers used short- and intermediate-term credit in sharply increased amounts to buy household durables and autos. A record volume of mortgage financing was employed in home buying. Business debt expansion was also high, with the concentration being in short-term types associated with greatly expanded working capital requirements. Tlw cash deficit of Government remained substantial, although considerably reduced and approaching balance by yearend.
The monetary authorities aimed tlwit· policies at restricting the supply of bank funds, continuing the approach adopted as the upswing in activity was established in 1958. In this setting, interest rates moved higher during the year, and more so in the area of short- and intermediate-term funds. At yearend, virtually all rates had reached levels not seen since the 1920's, and borrowers experienced the pattern uncommon for an extended period of shorter-term rates exceeding those on long-term funds.
A quite different pattern prevailed iu markets for corporate equities. Stock prices maintained an upward course through mid-1959, dropped back in the summer and early fall, but again moved forward in the closing months to a point around their previous high.
For the year as a whole, stock priees averaged higher than in 1958 and with dividends improved to a lesser extent, stock yields traced a somewhat lower pattern in 1959-at a level virtually half the yield basis which prevailed a decade ago. Thus, with borrowing costs up, the historic pattern of interest rates running above dividend yields was reversed in 1959.
International payments position
A factor in the money markets, as well as in the economy generally, was the position of the U.S. international balance of payments. This was marked in 1958 by an increasing deficit in our payments to foreign countries, which continued to rise during the first half of the past year. For the year as a whole it exceeded that of 1958.
Exports started to expand last spring,
6
but the steel strike dampened the rise in actual shipments. Exports in 1959
Wholesale Prices Steady during year ...
1947-49= 100
120
110
140
130
120
110
100
90
All Commodities
as agricultural and nonagricultural price changes canceled out
Nonagricultural
Manufactures
,. . .. l-.. .. ..... .., .. : ... r \.f ····\.--.. 1 ( I .. ,
(·' Nonagricultural
·-.. .......... .: Raw Materials or
Semi manufactures
1953 54 55 56 57 58 59 60
Basic doto: BLS
U.S. Department of Commerce, Office of Business Economics 60- 2-6
SURVEY OF CURRENT BUSINESS
as a whole were about the same as in 1958.
Imports usually reflect the adverse effects of a fall in domestic economic activity and in purehasing power, but thE'y did so less in the 1957-58 downturn than in previous such oceurrences. The subsequent rise continued until the middle of 1959, and for the remainder of the year imports con t.inued close to peak rate. The rise from the low point in 1958 wns featured by the expnnding volume of mnnufnctured goods, including automobiles. For the yenr, imports wen' substnntially above those of 1958.
The result of our foreign trade interchange in 1959 was the emallest excess of merchandise exports-$1 billionover imports that has been recorded since 1950 (see chart on page 19). With this shrinkage of our merchandise balance-despite substantially lower net payments to foreign countries than a n-ar earlier for the aggregate of travel, ~hipping, foreign aid, U.S. capital investments abroad and foreign longterm investments here-the excess of U.S. foreign payments over U.S. receipts from foreign sources was some"·hat larger in 1959 than the $3.4 billion total rec>ord<>d in 1958. Ther<> was, as point.('(l out in the st•etion eon•ring our international int<>n·hangt', some improv<>m<>nt in th<> lattt'r pnrt of the year which reduced our m't forrign paym<>nts in this ]Wriod.
Febrnn ry 1 HfiO
The year-end picture
As 1959 drew to a close, recoYery from the earlier dislocations was rnpid, and the flow of personal income rose to a peak; rebuilding of working stocks was underway so that industrial output was rising, and the path was ekared for full-scale operations. Supplies of final products were flowing in increasing volume into consumption and inn•stment, though inventories of materials were not entirely in balance. Price movements in both retail and wholesal<> markets were quite limited.
The forward investment plans of business envisage a rise, as indicated by the most recent OBE surny and the character of the basic husiness trend. Our international interchange of goods and services has shown improvement recently, and prospects are for a rise in some major export commodities.
The near-term indication is for little change in Federal purchasing. Population and related changes, including expanded eocial service programs, have dominated the postwar picture for State and local governments and the likelihood is for some further inereases in their expenditures. Federal GoYernment needs for financing are climinishing, with an improvement underway in its fiscal position, and this frees additional funds for the private segnH'nts of the economy.
National Income and Product
'fHE CYCLICAL upswing in business :tctivity last year raised the gross national product to a record of nearly $480 billion for the year-$38 billion or 8% percent over that of 1958. The gttin mts mostly in physical volume.
Real output was more than 4 percent above the previous top reached in 1957. In evaluating the net advance, it should be noted that the summer of 1957 saw the high point of a 3-year upswing, whereas 1959 was only one year away from the low point from which the current upswing dates.
Character of the expansion
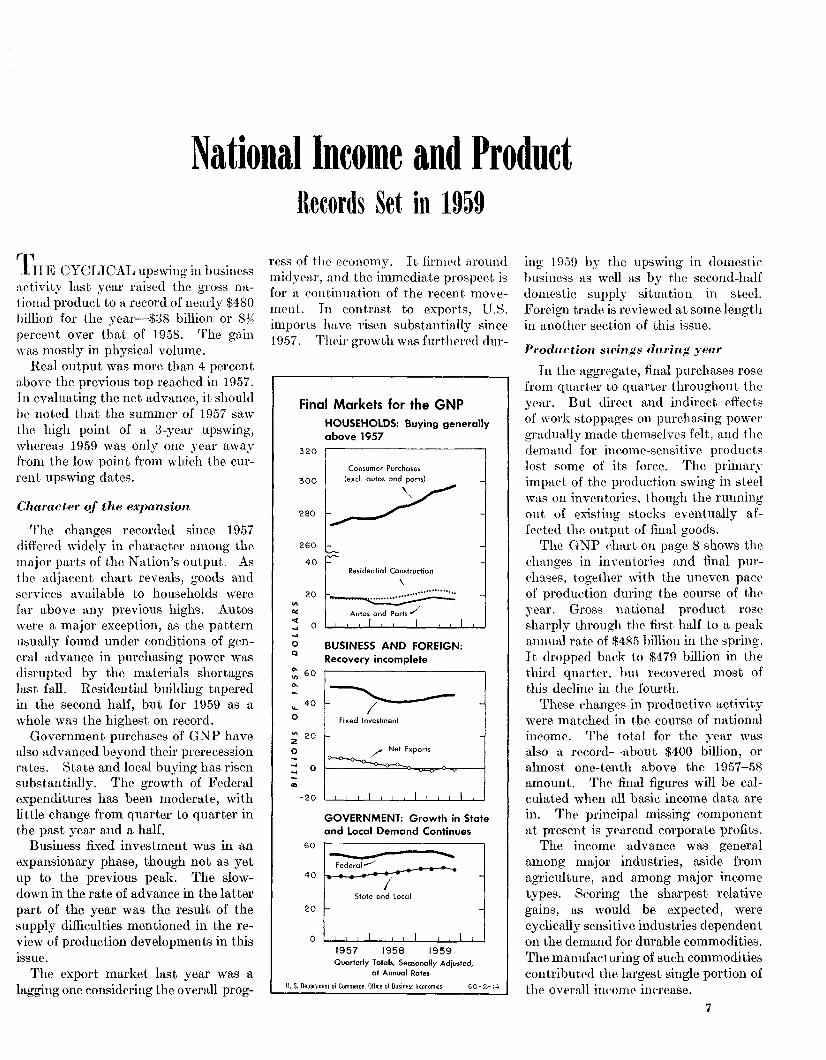
The changes recorded since 1957 differed widely in character among the major parts of the Nation's output. As the adjacent chart reveals, goods and services available to households were far above any previous highs. Autos were a major exception, as the pattern usually found under conditions of general ad vance in purchasing power was disrupted by the materials shortages last fall. Residential building tapered in the second half, but for 1959 as a whole was the highest on record.
Government purchases of GNP have also advanced beyond their prerecession rates. State and local buying has risen substantially. The growth of Federal expenditures has been moderate, with little change from quarter to quarter in the past year and a half.
Business fixed investment was in an expansionary phase, though not as yet up to the previous peak. The slowdown in the rate of advance in the latter part of the year was the result of the supply difficulties mentioned in the review of production developments in this ISSUe.
The export market last year was a lagging one considering the overall prog-
Records Set in 1959
ress of th(' eeonomy. It firmPd around midy('ar, and the immediate prospcet is for a eontinuation of the recent movement. In contrast to exports, U.S. imports have risen substantially since 1957. Their growth was furthered dur-
Final Markets for the GNP
320
300
280
260
40
20
"' "' "( 0
0 Q
~ 60
"' ... 40
0
"' :z 20
0
0
., -20
60
40
20
0
HOUSEHOLDS: Buying generally above 1957
Consumer Purchases (excl. autos and parts)
~ -F 1-
Residential Construction
t-.,. ............... ~ .... ::.:: Autos and Parts /
I I I
BUSINESS AND FOREIGN: Recovery incomplete
-;------Fixed Investment
~ / Net Exports
~
I I I
GOVERNMENT: Growth in State and Local Demand Continues
- -- ~ Federal-' .....
I State and local
I I I 1957 1958 1959 Quarterly Tala is, Seasonally Adjusted,
at Annual Rates
U. S. Department ot Commerce, Office of Business tconomics 60-2.--i4
ing l 939 by the upswing in domestic business as well as by the second-half domestic supply situation in steel. .Foreign trade is reviewed at some length in another section of this issue.
Produetion swings during year
In the aggregate, final purchases rose from quarter to quarter throughout the year. But direct and indirect effects of work stoppages on purchasing power gradually made themselves felt, and the demand for income-sensitive products lost some of its force. The primary impact of the production swing in steel was on inventories, though the running out of existing stocks eventually affected the output of final goods.
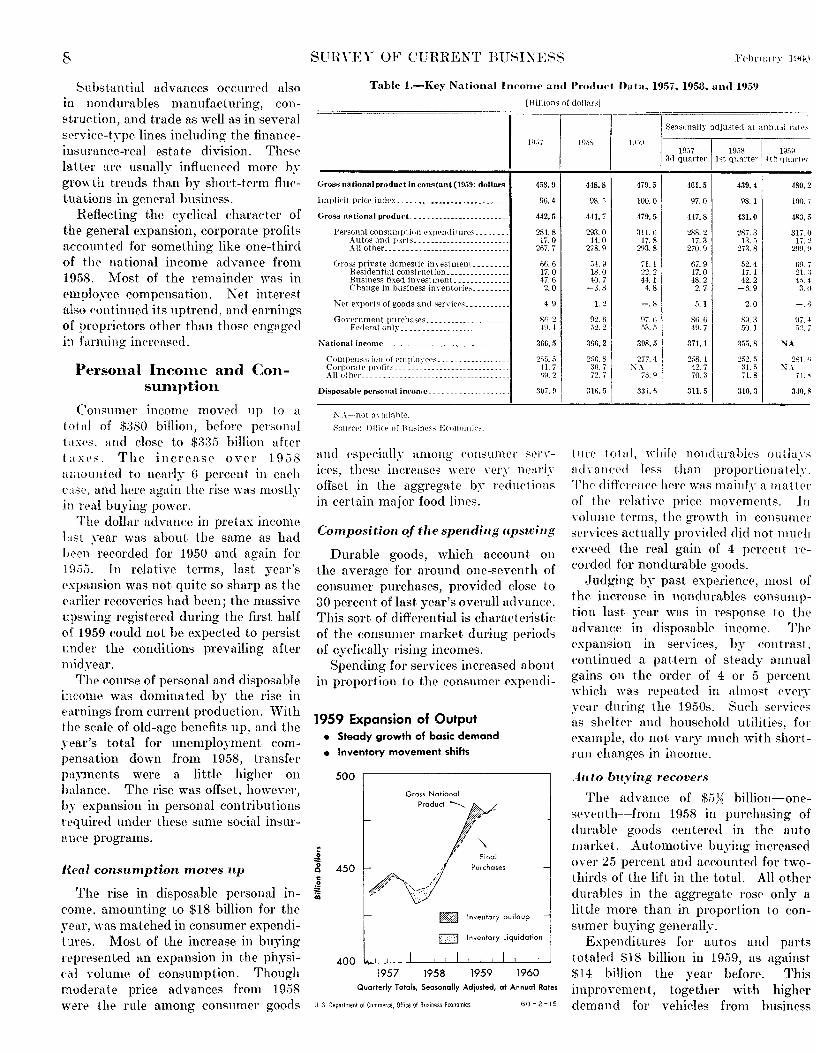
The GNP chart on page 8 shows the ehanges in inventories and final purchases, together with the uneven pace of production during the course of the year. Gross national product rose sharply through the first half to a peak annual rate of $485 billion in the spring. It dropped back to $479 billion in the third quaxter, but recovered most of this deeline in t hf' fourth.
These changes in productive activity were matched in the course of national income. The tota.l for the year was also a record-about $400 billion, or almost one-tenth above the 1957-58 amount. The final figures will be calculated when all basic income data are in. The principal missing component at present is yearend corporate profits.
The income advance was general among major industries, aside from agriculture, and among major income types. Scoring the sharpest relative gains, as would be expected, were cyelically sensitive industries dependent on the demand for durable commodities. The manufacturing of such commodities contributed the largest single portion of the overnll ineome increase.
7
8
Substantial advances occurred also in nondumbles manufacturing, coustruction, and trade as well as in several service-type lines including the financeinsurance-real estate division. These latter arc usually influenced more b.Y growth trends thttn by short-term fluctuations in general business.
Reflecting the cyclical ch<Hacter of the general expansion, corporate profits accounted for something like one-third of the national income advance from 1958. .Most of the remainder was in employee compensation. Ket interest nlso continued its uptrend, and earnings of proprietors other than those engag0d in ftlrming increased.
Personal lncon1e and Consun1ption
Consumer income movt'd up to a
tottd of $080 billion, before personal t <tXt'S, and close to $:t35 billion after t a xp,;. The increase over 1958 nmoullted to nearly 6 percent in each case. and here again the rise was mostly in rt'al buying power.
The dollar advance in pretax income Ltst year was about the samE' as had been recorded for 1950 and again for J9,)5. In relative terms, last year's expansion was not quite so sharp as the e:trlier recoveries had been; the massive upswing registered during the first half of 1959 could not be expected to persist under the conditions prevailing after midyear.
Tlw eourse of personal and disposable income was domina ted by the rise in e;u·nings from current production. \iVith the scale of old-age benefits up, and the year's total for unemployment compensation down from 1958, transfer ptiyments were a little higher on blllance. The rise was offset, however, by expansion in personal contributions required under these snme social insurnnce programs.
Real consumption moves up
The rise in disposable personal income, amounting to $18 billion for the .Htlr, was matched in consumer expenditures. Most of the increase in buying represented an expansion in the physical volume of consumption. Though moderate price advances from 1958 were the rule among consumer goods
SURVEY OF CURRENT HU~IXEt'S
Table 1.-Key National Income and Protluet Data, l95i, 1958, antll959
[Billions of dollarsj
Gross national product in constant (1959) dollars_
Implieit price index_ ___ .• __ -------------- _____ _
(~ross national product. _______________________ _
Personol consumption expenditures _______ _ Antos and parts _______________________ _ All other_ _____________________________ _
Gro:::;s private donwst.ic inyestmeut ---------Residential construction _______________ _ Business fixed investment_ ____________ _ Change in business inventorie:.- ______ ~~-
1\"et exports of goods and serder:' __________ _
GoYPrnmt=Hlt purchnsrs ___ ------------------Feclfm_tl on I~- ___ ----------------------
1\ational income_--------------------------- ___ _
Compens~1t ion or pmployt>e~- _____ ---------- __ CorrJOrafp profits ___________ ---------- _______ _ All othrr ____________________________________ _
Disposable personal income __
:\\-·not a\ ailnhle.
458.9
\lG. 4
H2.5
284.8 17.0
267.7
6fi. 6 17.0 47. 6 2.0
4. 9
Sl.'. 2 -ln. 4
366.5
2.~.). 5 -11.7 ti\1. 2
3iJ>. 9
and especially among consumer spn·ices, these increases were Yery nenrly offset in the aggregate by reductions in certain major food lines.
Composition of the spending upswiug
Durable goods, \vhich account ott the average for around one-seventh of consumer purchases, provided close to 30 percent of last year's overall ad vance. This sort of differential is characteristic of the consumer market during periods of cyclically rising incomes.
Spending for services increased about in proportion to the eonsumer expendi-
1959 Expansion of Output • Steady growth of basic demand
• Inventory movement shifts
500
Gross National Product ---...__
Final Purchases
- Inventory buildup
[IJ Inventory Liquidation
400 1957 1958 1959 1960
Quarterly Totals, Seasonally Adjusted, at Annual Rates
U. S. Department of Commerce, Office of Busilless Economics 60-2-15
Sensonally adju~ted at annncll rart--.
1~.)~ lt/.-fil 19o7---~ -1Dos---~--19o;~ 3d quartPr 1st quarter, Hh quarft>l
448.8 .fi9.5 461.5 439.4 180.2
98.5 100.0 97.0 ~8. 1 100.'
4H.7 479.5 447.8 431.0 483.ii
293.0 311.6 288.2 287.3 317. () 14.0 !i. 8 17.3 13. ,) 17.:!
278.9 293.8 270.9 273.8 29R H
.)l. 9 71. 1 67.9 52.4 69.7 18.0 22.2 17.0 17.1 21. :{ 40. 7 44. 1 48.2 42.2 4:\ 4
-3.8 4. 8 2. 7 -6.9 3. <)
1.:? -.8 5. 1 2.0 -,!)
92.6 97. ti 81>. 6 89.3 97. -l .12. 2 ;)3. ,:; 49.7 50. 1 fi:!. j
356.2 398.5 371.1 355.8 NA
2.Stl. 8 277. 4 2;)8. 1 2fi2.;:, 2oJ.i; 3f). 7 ~.\ 42. 7 :n. ·' K.\ 72. 7 73. q 70.3 71.8 7-1- .....
316.5 331.5 311.5 310.3 3!0, ~
tun• total, \\-hik nondurahll's outla.'·" ndnlii('C•d less than proportionately. The difference here was mainly a mattc'r of the relative price movements. I'' \·olume tf'rms, the growth in consumPr sen-ices actually provided did not mud1 exC'eed the real gain of 4 perC'ent recorded for nondurable goods.
,Judging by past experiencr, most of the increase in nondurables consumption last yrar was in response to tlH' advance in disposable income. The 0xpans1on in serviees, b~r contrast. eontinued a pattern of steady annual gains on thr order of 4 or 5 pereent which was repeated in almost every _v-ear during the 1950s. Such services as shelter and household utilities, for example, do not vary much with shortrun C'hangrs in income.
A11to buying recovers
The advanee of $5~~ billion--oneseventh--from 1958 in purchasing of durnblr goods eentered in the auto market. Automotive buying increased over 2.5 percent and aecounted for twothirds of the lift in the total. All other durables in the aggregate rose only a little more than in proportion to consumer buying generally.
Expenditures for autos and parts totaled $18 billion in 1959, as against $14 billion the year before. This improvement, together with higher demand for vehides from business
FPbrnary 1960
firms, pushed sales of new U.S. cars up from 4}~ million units in 1958 to 5% million last year.
The course of auto purchases during 1959 was far different from that of 1958, 'vhen the low established as the year opened was not bettered until the fall. The 1959 models were well received
Table 2.-Expenditures on New Plant and Equipment by U.S. Business,1 1957-59
[Millions of dollars]
119.)7 1 1958 11\159,
:\fanufacluring ___________________ 15,959 11,433 12,056
Durable ~oods industries________ 8,032 5, 41)9 ;;, 769
Primary iron and steeL_____ 1, 722 I, 192 1,021 Primary nonf€frous meta1s_ _ _ 814 441 327 Electrical machinery and
•qniprnent________ 599 4.59 .103 :\I arhinery, exc('pt electrical__ 1, 275 915 929
\Iotor vehicles and equip-ment____________________ _ 1,058 558 1124
Transportation equipment, excluding motor vehicles____ 544 370 387
Stone, clay, and glass prod-ucts_________________________ 572 :399 547
Other durable goods ......... _ I, 438 1, 135 1, 4:H
:"ondurahle goods industries ___ 7, 937 5, 964 6, 287
Food and beverages___________ 850 742 829 Textile-mill products__________ 408 288 408 Paper and allied products_ ___ 811 578 625 Chemicals and allied products_ 1, 724 I, 320 1, 234
Petroleum and coal products_ 3, 4.53 2, 431 2, 482 Rubber products______________ 200 134 194 Other nondurable goods_._ 491 471 515
Mining __________________________ _ Railroads ........................ . Transportation, other than raiL __ _ Public utilities __________________ _ Communications _______________ _ Commercial and other ___________ _
1,243 1,396 I, 771 6,195 3,032 7,366
941 754
1,500 6,088 2,615 7,195
988 934
2,044 5, 745
} 10,874
TotaL _____________________ 36,962 30,526 32,641
I. See text for items excluded. 2. Includes anticipated expenditures for fourth qunrter
1!)59.
Sources: Oilicc of Business Econ0mics, and Srcuritie:; nnd Exchange Commis~ion.
from the beginning, ns buyers' economic outlook brightened and tlwir willingness to borrow incrpnsed. The usual miclwinkr decline was moderate in 1959, and n greater-than-seasonal rise that began early in the spring continued through June.
Sonw eon traction follmYecl in t.he second half. This 'vas due mainly to supply conditions that hampered production of the 1960 models, though uncertainty about incomes also played a role. High in October, sales were drastically curtailed in the closing months of the year. Because of the situation which prevailed, this period could not afford a clear test of the underlying strmgth of demand for the 1960 Clll'S.
ti~!l42G-60-~2
SUHVEY OF CUHRENT BU~IXESS
Nondnrables and services
Most of the chief nondurable and service items of personal consumption rose 4 or 5 percent last year in real terms and slightly more on a current-dollar basis.
Expenditures for food moved up relatively less than in 1958. (See Table II ~6 among the regular quarterly national income and product tables at the end of this section.) In real terms the increase was perhaps 4 percent, a gain consistent with experience in previous periods of cyclically rising real income. Food prices were clown, on the average, and consumers obtained this larger food requirement without raising their expenditures quite in proportion.
Housing expense registered the greatest increase shown for any major service category, both relatively and in dollar rm<gnitucle, as an unusually large number of new units was added to the housing stock and rather promptly occupied.
Investment Demand
Fixed investment and the inventory buildup each contributed around $8 billion to the GNP advance from 1958.
Moving above $70 billion for the first time, the overall total of such spending accounted for one-seventh of the national output. This fraction has varied in the range of one-sixth to one-eighth in recent years, moving with the cyclical ''ariation of business.
Last year's outlays involved a further advance in prices for construction and equipment, but here again most of the t>xpansion was clue to increases in physical volume. In real terms, residential building was the highest on record; the volume of plant and equipment put in place, however, was lower than in 1955~
J'ariation in residential bnihling
Residential construction work was valued at over $22 billion, with between 1 .3 and 1.4 million new nonfarm clwt>llings completed during the year; in addition, the total inelucl0cl a. large amount of home improvement activity. In the best prior year, 19.5.5, the value of "·ork done had been less than $19
9
billion, though that amount purelwsed more housing than it does now.
The favorable record for 1959 as a whole stemmed from a rapid upswing in building starts which took place during the last three quarters of 1958, and a consequent rise in activity through the spring of last year. A gradual decline followed in the second half.
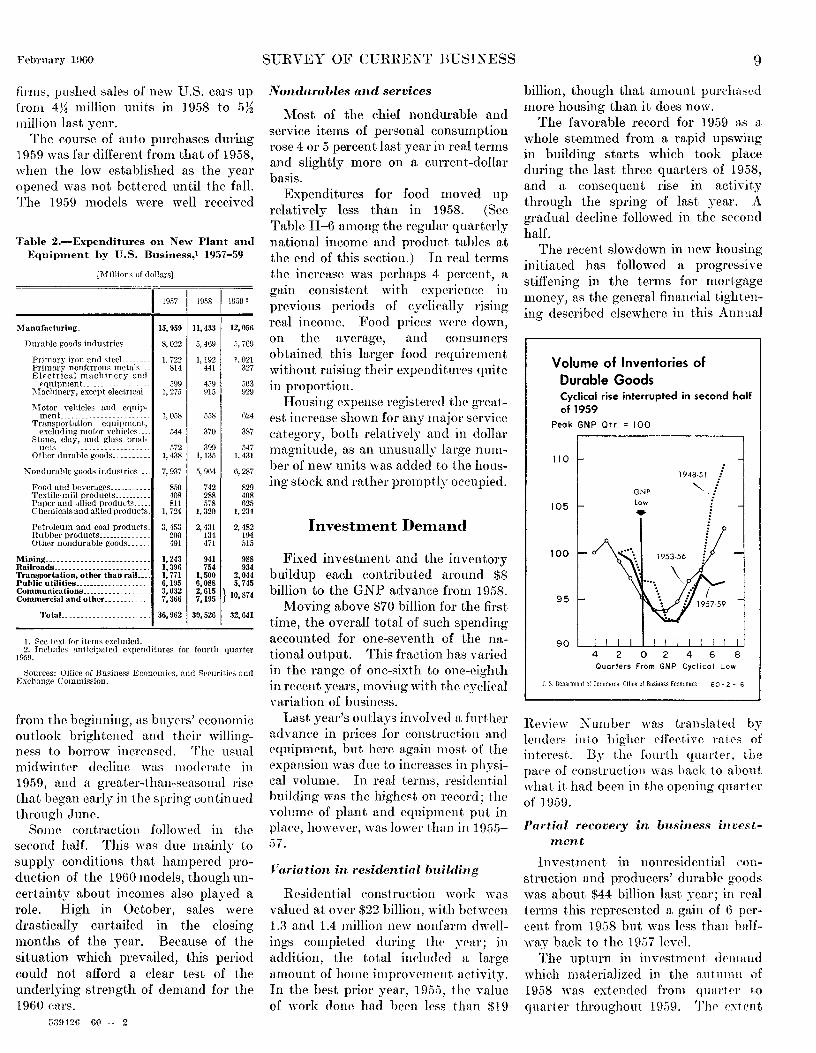
The recent slowdown in new housing initiated has followed a progressive stiffening in the terms for mortgage money, as the general financial tightening describ0d elsewhere in this Annual
Volume of Inventories of Durable Goods Cyclical rise interrupted in second half ofl959
Peak GNP Qtr_ = 100
110
105
100
95
90 42 0246 8 Quarters From GNP Cyclical Low
lJ S. Department of Commerce. Office of Business Economics 60-2 -16
Review Xumber was translated by lenders into higher effective rntes of interest. By the fourth quarter, the pace of construction wn.s hack to about what it had been in the opening quarter of 1959.
Partial recovery in business investrnent
Investm<?nt in nonresidential construction and producers' durable goods was about $44 billion last year; in real terms this represented a gain of t) percent. from 19.58 but was less than halfway back to the 19.57 level.
The upturn in investment demand which materialized in the autnmn of 1958 was extPnded from quarter to quarter throughout 1909. Tlw rxtent
10
of the improvemt>nt in rt>ce-nt months has been partly masked by temporary conditions which have tended to limit both plant construction and equipment deliveries. The OBE---SEC surveys (which cover all surh investment entering the capital aeeounts of nonfarm businesses except in certain branches of the finance-insurance-real estate division and in the indepPndcnt professions) show the annual rate of outla.'--s in the s0eond half of the .'·ear to have been considerably less than wus anticipated last summer. Spending by primm·_,. metals producers was su hst an tially under expectations; gas u tilit.'· and petroleum company progTHillS were SPt hack by the shortage of steel mill prodnets; and railroad innstuwnt anticipations ,,.·ere also revisc•d slwrpJ_,. ns profits took an ndvPrse turn.
Table 3.-Federal G<Hel"Hnwnt Ht•ceipts and Expen•litur.-s. 19:19-61
[BillwtJS 11f doiLw..:l
Administrative budget: I I Ht•eripts ________________ !)") ;j I /.'S.Ii 81.0
ExJll'Tl(iitures __ ... o. 7 I 7S. + i:!. ~ Snrplns or detkit \ -· '···· ----- -1::!.--t .2 -t 2
Cash budget: HL'C'I_'ipts _____ -~ ____ ~. ~ _________ 'il. 7 \•±. s 102. :2 E·qwnditun~s __ ~l-l. s tt1. ;j Hti. :1 Burplns or deficit_i,_-=._-1-_~~~------ -- J:J. 1 - .. :::. ii.\J
National income and produ{'t ac-count: Heceipts. __________ .. ____ . __ ... 'i4. 4 ua. n 1n1.o Expenditures ___ ..... _ ......... 'iq. ~I n:;.o 11·1.0
c toods and srrvicP~ __ .~:1. R .12. 5 5a. 5 Other-··-····-·-· .... ::::::: :~t \. 1 10 . .j -10. ;)
Surplus or defieit (-' -i'i.l"\ .0 7. ()
XOTE.-'l'he diffPrPllt'(' twtWt'ell til(' ,,druinistratJ\·0 hudg f•t and the cf1..o;;;b. budget is largoly aecounted for by the inclusion in the latter of tmst fund transactions. The national inc01ne and product account inclw:les trust fund transactions, but differs in definition from the cash budget in several important respects. Corporate profits taxes arc recorded on au accrual rather than a cash collections basis: loan transactions are rither omitted or involve diff(_•rences in timing; the <tcquisition of financial and S8cond-hand assets are px('}n<lrd: and. an adjustment for the lag h('tWi·r•n df'lin•rk~ and pnyments for goods is Incorporated.
Sources: Administrative· <JIHi (~<L~h hwig1·T~ from F!udgt! of the U.S. GolJernment for the Fh;ctzl J.Tf'flr F..'udifi{J Jllne SO, 1.961; national income and produc·t dau. Olli(·:_· 11i nnsin(·ss Economics, ha:wd on f'":"tim:lt~·" in thP Nud(let.
By comparison with J9;)7, last year's totals were generally lowest for the metal products industries and the associated rail and mining groups. Utilit.y outlays were off significant!.'~ from the high rates reached in the two preceding years. Investment in construction materials manufacturing \Vas dose to prerecession rntes, in currentdollar t<:'rms, as werr· ('X!Wlldit un•s in most nondurable.;;; manufacturing linE's
SUHVEY OF ( THIU:XT BU8IXESS Fehrnary l!lliO
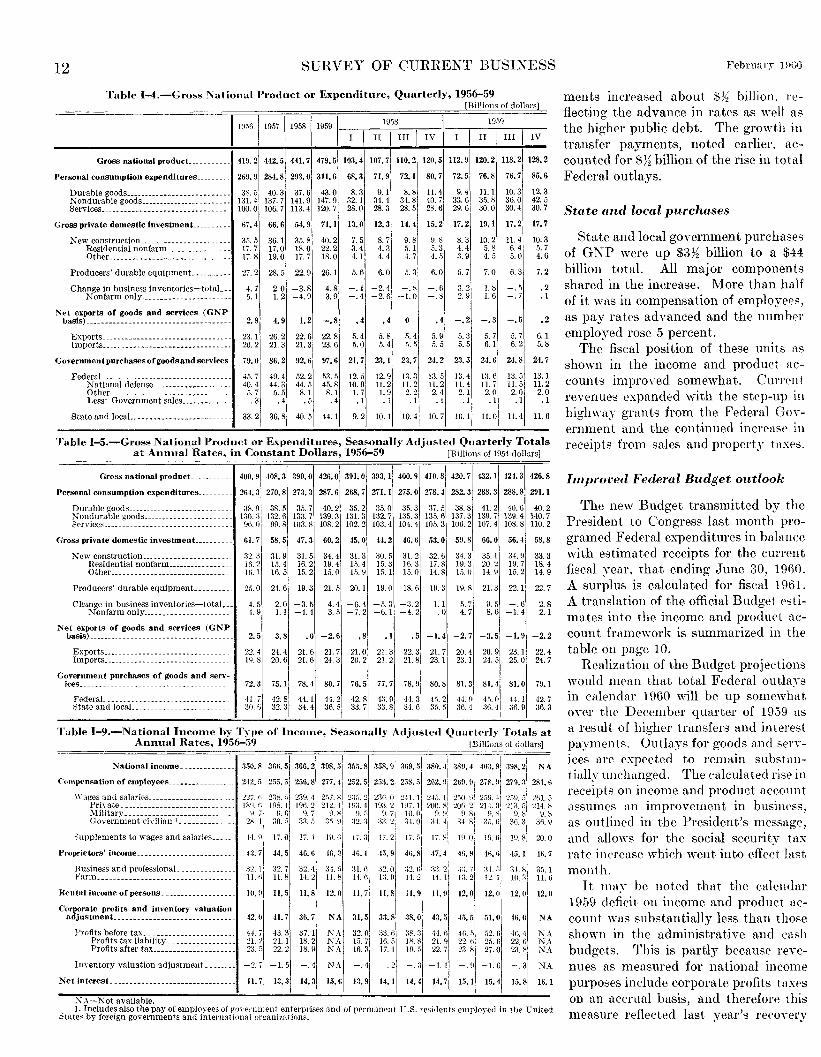
Tahlt> 1.-Employment, Payrolls, and Average Annual Earnings by l\lajor Industrial Division, 1957-59
·---~~-- .Kumiwr of full-time I Wages and salaries Average annual earnings per full-time eqniYalent employees employees
~-~1aia !;thousands -:--;~~ Dollars I Percent changes
___ [1\1.17-~~\J;,s r~~J--~.)7-[~~~-~09 1957 -~:-~~~-,~~~:~110:\s:~ All industries. total · 5G,i:l0 I !;5,10J 56,380 2~8,530 2:!9,3.891257,82414,205 4,344 4,57:3 I 3.3
1
! 5.3
.Agriculture1 forestry, and : fisheries_··--·········-···· 2, 053 2.111.1 ?., 07.1 3. 290 3, JOG 3. o:;s 1 l, f\03 I, Gl3 1. 705 i . G 5. 7
Mining______________________ 812 72:1 t\90 4,2:!7 3.7H I :l.810 1 f>,218 5.220 5.522 .0 I .1.8 Contract c0nstt uetion __ . _. _ _ 2, 853 2. 7;i\l 2. 890 14,046 13. 9t\9 1.1. 3\1:; 1 4. 923 5, 0113 5. 320 2. 8 5. 2
l\1anufaeturing__________ Hi. 8f\\J ].\. o:l5 11\,221\ 80, !\41 71>. 674184.578 4, 781 4, 936 5. 212 3. 2 5. I} Wholesale and retail tra•h'.. 10. :\3\l 11\.413 10,03\1 42. :>01 4:;, 01\0 45,882 4. 014 4. 135 ·1. 31o 3. 0 ·4. 3 Finance, insurance, nwl n~<tl
estate.______ z.ai4 2,421 2,471 10,221 JO,>l.lr> 11.1\74 4.30,\ 4.484 4. 72·1 4.2 5.4
Transportation 2, G54 2, 4:l2 2. 431 18. \Jl(\ Communieation::> and J 1U hlic·
ntilities ______ ....... . .. 1, 493 1. -t;li J.-l:lO 7. 18H Sen·iees __ . __ -.---- ---------- 7,HH 7, 27:{ 7, 41~ 22,520
Government_ __ ~~ ____________ 9, ~l22 9. 9S7 11).109 '10, 1G9 Addendum:
All private industries .... 41\,808 4.). 117 4f>. 271 198.31\1 All pri,·ate nonfnrm in-
dnstri':'~----------· ____ 44. 9l:l 43. lli2 ll. :l4f\ I Hl.~. ill~!
-~~----· --------- -- ·- ---~--Source: 01lh-t• of Bu:-:inPs~ Ec·onomic~.
outside of elH•mieals and IWtrokum. Th<• only substantial advnncps
beyotHl 1 \);)/ \non• those reportE'd by the airlines with tlwir big jet programs, awl hy <·nmmetTinl Pnterpriscs.
Role of inventories
Business i.nv<•ntories moved up sharply in the first half of 1959. In part the inen•ase represE'ntNl a c_\·clieal buildup of holdings, Pspecinlly in durn hie-goods li lit'S, such as generally begins tltn•e or four quarters after nlo"· is passed in G.\'P. (See chart.) Also impol"tnn t \Y<1S n n ar<·mnuln tion of primar.'- md<tls n1Hl rdnt!'d products aimed n t forestalling t h<' d0vdopnwnt of shortage's which would hampPr production nftN mid.'"ear.
As has been notPd <:'arlier, the firsthalf accumulation added substantially to the demand for GNP, and the accompanying fillip to consumer and busirwss income provided a stimulus ill other markets for the Nation's output.
After midyear, the holdings of m<:'tals and metal products accumulated in the first half WPrt> rapidly drawn down. The swings in these holdings dominated the overallmovt>ment of durable-goods stocks last year, and emPrge strikingly in the chart on pngP 9. ThP selloff by mPtal goods manufacturers partly offset tlw restocking which rontinued in most other segmPnts of the eeonom.'· in the second half.
Thl' shift from substantial a<·cumtllntion in the srcond quarter to liquidation
1:1.:H8 13. Pfl2 5. 243 5, 48R 5. 756 I 4. 7 4. 9 I
5. :l91
I f) .f) 7. :11\0 7. 70H 4. 813 -5. Oii9
I 5.1
2:~. 722 2.1 .. ~40 :;, 145 :l. 2(\2 3. 443 3. 7 5. 5
!'l. 22f' ·1i">, /0~ I
4. 048 4. 328 I -1, 522 r..? 4. 5 :
I I
I 1\JH, lil-t 1:.!12, 1113 l -1.238 4.:H8
I 4 •. 184 I 2. 6
I 5. 4
I l ~!:-{. :{I -: 1 ·!09,1:10 -t.:{;);)
I 4. 479 4. 716
! 2. 8
! 5. ;{
----------------
lll t h<· t h irLl rdl(•ctl'd a consi(lerabll' eut in production rf:'lative to final dc•ma 1Hl. Thl' dPelitw in emTrnt earnings whi('h rPsnltPd nftPr mid_\·enr is <kserilwd dsP\Yhere.
Fourth-qunrtPr dPvdopmrnts in inventoril's were• mixed. Th0 sdlofl" tapc·n·d in );ovt>rnber. with stel'l production l't'("OVl'ring: and consumption in auto and othc·r manufacturing usps eut. back due to thl' continuing shortages. In DPcPmlwr then· \\·as a markNl shift to stock rPlmilding.
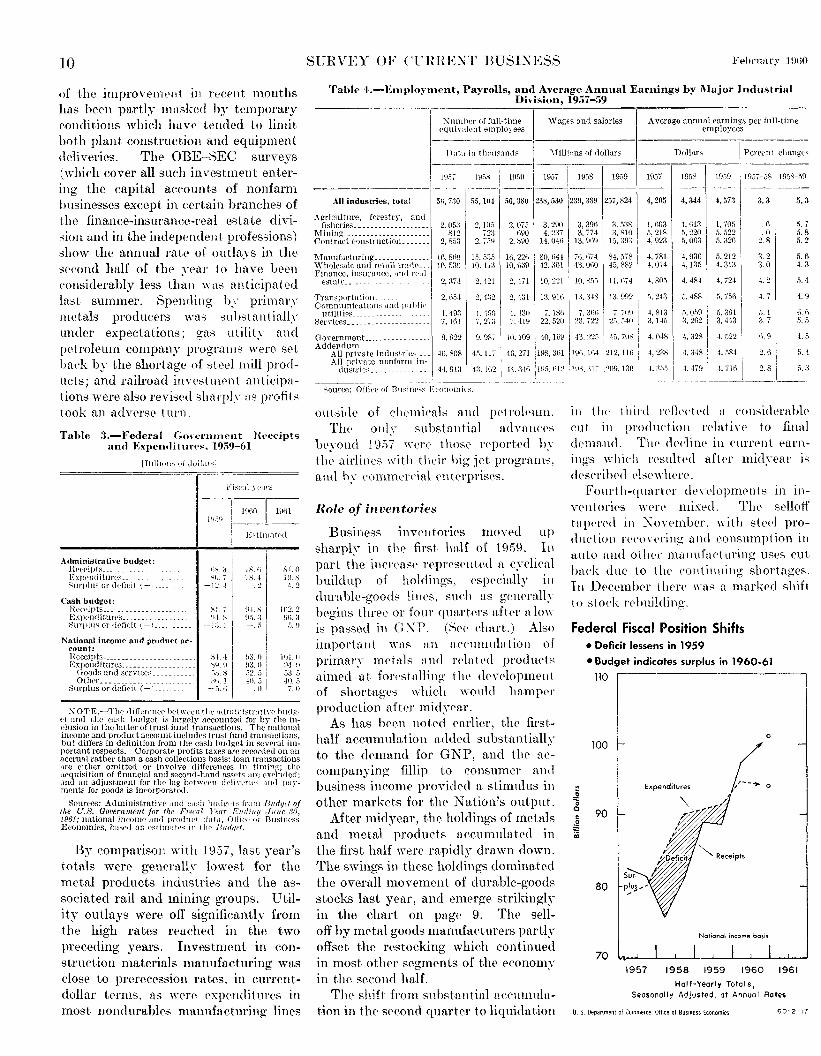
Federal Fiscal Position Shifts • Deficit lessens in 1959
j 0 Cl c .!! :::: ;;;
• Budget indicates surplus in 1960-61
110
100
90
80
70
0
Notional income bosis
1957 1958 1959 1960 1961
Half-Yearly Totals, Seasonally Adjusted, at Annual Rates
U. S. Department of Commerce, Ofhce of Business Economics 60-2-17
ln spite of the dPvelopments after midyear, a major part of the first-half expansion in durable goods holdings was reflected in the full-year results. As usual in periods of cyclical expansion, durables accounted for more than their proportionate share of the overall ris0 in nonfarm inventories. l'viost of the hard-goods accumulation was in manufacturing; the largest dollar inerPases were those reported for the maehinery groups, which operated against a big backlog of orders throughout the year.
Inventories of nondurable goods manufacturers and distributors rose last yE•ar, to cancel the 1958 decline in book value.
Inventory ratios
In relation to the constant-dollar GNP, the physical volume of business inventories is currently about the same as during 1955. 'l'he ratio is a percentag0 point lower than in the prosperous 1956-57 quarters. If inventories are compared with sales and unfilled orders in particular industries, they appear low in primary metals manufacturing and in most of the major steel-using groups. Stock-sales ratios are down from recent-year levels in nondurables manufacturing also.
Government Revenue and Expenditure
As reflected in the income and product accounts, the fiscal position of the Federal Government improved markedly. These accounts show a $9 billion deficit in 1958 reduced to $2 billion in 1959, with receipts up $10~ billion and expenditures rising $3}~ billion.
The substantial rise in receipts was a reflection of the economic recovery from the 1958 lows. Close to half of the revenue increase came from the additional corporate income tax liabilities which accrued with the upward move of profits; and individual income taxes and contributions going into the social insurance funds were up by about $2% billion each. The latter reflected in part the statutory rate increase and higher maximum taxable earnings base which became effective January 1 last year.
The major portion of the increase in
SURVEY OF CURRENT BUSIKESS 11
expenditures stemmed from higher defense outlays for goods and services, and larger grants to the StatP and local governments.
Federal operations
Defense spending rose moderately in the first and second quarters of 1959, but tapered after mid)'ear to a fourth quarter rate litth• cliffprent from that registered a )'em· eat·lier. Tlw 1959 total \Yas close to $46 billion, up about $1~ billion from I 958. The major increases were in military outlays, but expenditures for atomic energy development were also up, and purchases for the space exploration program advanced sharply to total a quarter-billion dollars for the year.
Orders placed by the Defense Department for major equipment items such
as aircraft, guided missiles, and ships continued at the 1958 figure of about $15% billion.
Aside from defense buying, Federal purchases remained unchanged from 1958 in the aggregate. Expenditures for the conservation of land and Wlitt•r resources and the promotion of aviation fac-ilities were up for the year. The risr was offset by a $~billion decline in net purchases made by the Commodity Credit Corporation under the farm price support program. The Corporation's holdings of most crops other than cotton leveled oft' after having risen during 1958.
Expenditures other than for goods and services rose $2 billion, with $1 billion of this going to assist State and local government programs, primarily for highway construction. Interest pay-
The numbering of the following tables conforms to that introduced last year in U.S. Income and Output, a supplement to the SuRVEY (see announcement on outside back cov('r of this issue). That volume presents a full explanation of the m•w quarterly reporting system, as well as detailed data for 19 !6--55. The corresponding estimates for HJ56-58 appear in the .r uly 1\!59 National Income Number of the SuRVEY.
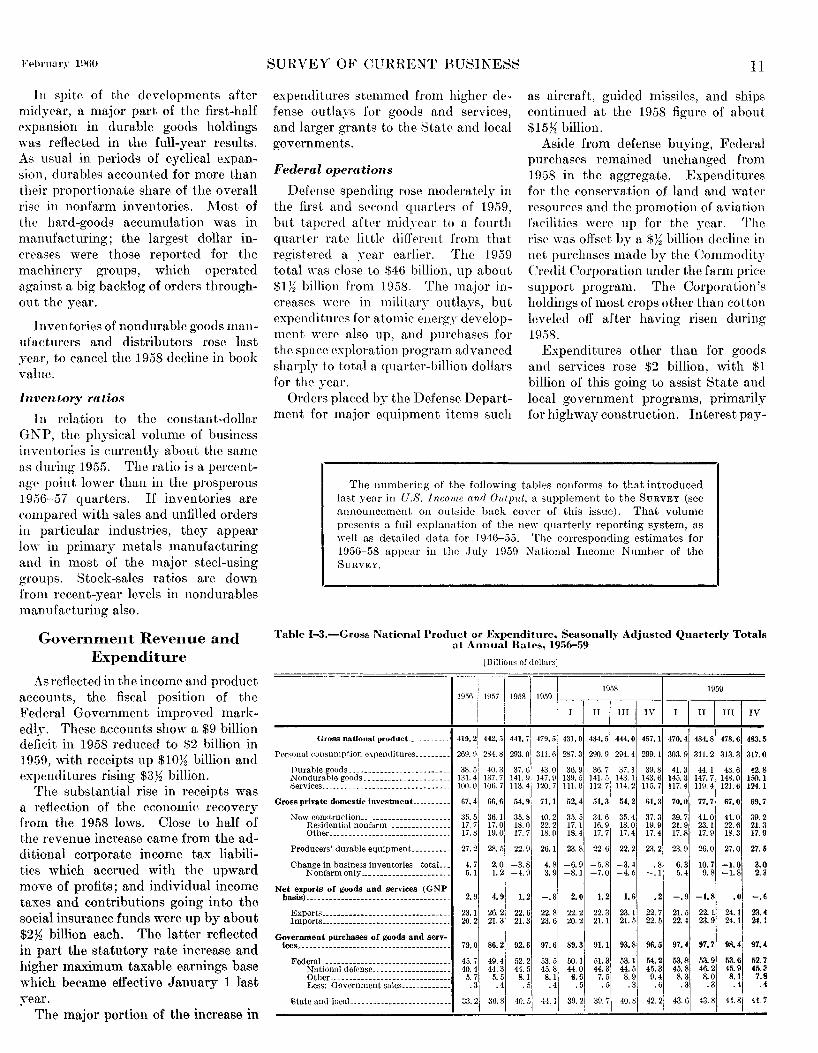
Table 1-3.-Gros» Natic:-nal Product or Expenditure, Seasonally Adjusted Quarterly Totals at Annual Rates, 1956-59
[Billions of dollars]
1958 1959 1956 1957 1958 1959
-~-~-II-~~~ -~-~~
Gross national product__ -- 419.2 442.5 441.71 479.5 431.0 434.5 444.0 457.1 470.4 484.8 478.6 483.5
Personal eonsumption expenditures--~------ 269.0 284.8 293.0 311.6 287.3 290.9 294. 4 299.1 303.9 311.2 313.3 317.0
Durable goods_,--·-·-·--·--,--·-----· __ 38.5 40.3 37.6 !3. 0 36.9 36. 7 37.1 39.8 41.3 44. 1 43.6 42.8 Nondurable goods __ ------·------------- 131.4 137. 7 141.9 147.9 139.5 141.5 143.1 143.6 145.3 147.7 148.0 150.1 Services __________________________ -___ - __ 100.0 106.7 113.4 120.7 111.0 112.7 114.2 115. 7 117.4 119.4 121.6 124.1
Gross private domestic investment_ _________ 67.4 66.6 54.9 71.1 52.4 51.3 54.2 61.3 70.0 77.7 67.0 69.7
New construction _______________________ 35.5 36.1 35.8 40.2 35.5 34.6 35.4 37.3 39.7 41.0 41.0 39.2 Residcmtial nonfarm ________________ 17.7 17.0 18.0 22.2 17.1 16.9 18.0 19.9 21.9 23.1 22.6 21.3 Other"_-----"'·--···-·-----·-----" 17.8 19.0 17.7 18.0 18.4 17.7 17.4 17.4 17.8 17.9 18.3 17.9
Producers' durable eqnipmenL ......•. - 27.2 28.5 22.9 26.1 23.8 22.6 22.2 23.2 23.9 26.0 27.0 27.5
Change in business inventories-totaL .. 4. 7 2.0 -3.8 4.8 -6.9 -5.8 -3.4 .8 6. 3 10.7 -1.0 3.0 K on farm only'"·-----·--·-·-------·, 5.1 1.2 -4.9 3.9 -8.1 -7.0 -4.5 -.1 5. 4 9.8 -1.8 2.3
Net exports of goods and services (GNP basis)·--_.--.-------.-------.-- .. -------.- 2. 9 4. 9 1.2 -.8 2.0 1. 2 1.6 .2 -.9 -1.8 .o -.~
Exports_. __ • __ •••• _ •• ____ • __ •••• __ •• _. __ 23. 1 26.2 22.6 22.8 22.2 22.3 23.1 22.7 21.5 22.1 24.1 23.4 Imports ...•. ------ .• ··----------.----- .. 20.2 21.3 21.3 23.6 20.2 21.1 21.5 22.5 22.4 23.9 24.1 24.1
Government purchases of goods and serv-Ices •.......• ·--·--··-----··---··--·-··---- 79.0 86.2 92.6 97.6 89.3 91.1 93.8 96.5 97.4 97.7 98.4i 97.,
FederaL ____ ._ .. _______ ------ •• ----- .. __ 45. 7 49.4 52.2 53.5 50. 1 51.3 53. 1 54.2 1\3.8 53.9 53.6 52.7 National defense"----------------·. 40.4 44.3 44.5 45.8 44.0 44.3 44.5 45.3 45.8 46.2 45.9 45.3 Other ____ .------ ___ -----·-·-------·. 5. 7 5. 5 8. 1 8.1 6.6 7. 5 8.9 9.4 8.3. 8.0 8.1 7.8 J,ess: Government sales ..•. '"----·-- 0 3 .4
0 51 0 4 .5 .5 .3 .6 .3 0 3 .4 .4
State and locaL. ........•.....•.••.•.•.. 33.21 36. sl 40. [,I 44.11 39.21 39.71 10. sl 42.2 43.61 43.8 44.81 44.7
12 SURVEY OF CURRENT BUSINESS
Table 1-4 .. -Gross 1'1\ational Product or Expenditure, Quarterly, 1956-59 [Billions of dollars]
1 1~1\6 1 1957ll958ll959l 1958 I 1959
i I I II I III I IV I I II I III I IV
GrossnationalproducL ......... 419.2 442,5 441.7 479.5 103.4 107) 110.2 120,5 112.9 120.2 118.2 128.2
Personalconsumptionexpenditures ......... 269,9 284.8 293.0 311.6 68.3 71.9 72.1 80.7 72.5 76.8 76.7 85,6
Durablegoods ..........•••••..••.•.••... :l8.5 40.3 37.6 43.0 8.3 ~ondurable goods........................ 131. 4 137.7 141.9 147.9 32. 1 Services ........••.......••.•..•••....... 100.0 106.7 113.4 120.7 28.0
~- 1 8. 8 11. 4 9. 4 11. 1 10. 3 12. 3 ~4 ~8 ~7 ~6 MS ~0 ~5 ~3 ~5 ~6 ~6 ~0 ~4 ~7
Grossprivatedomesticinvestrnent.. ........ 67.4 66.6 54,9 71.1 13.0 12.3 14.4 15.2 17.2 19,1 17.2 17,7
~ew construction....................... 3.5. 5 36.1 35.8 40.2 7. 5 8. 7 9. 8 U. 8 8. 3 10. 2 11. 4 10. 3 Residential nonfarm................. 17.7 17.0 18.0 22.2 3. 4 4. 3 5. 1 5. 3 4. 4 5. 8 6. 4 5. 7 Other ........•.•............•....... 17.8 19.0 17.7 18.0 4.1 4.4 4.7 4. 5 3. 9 4. 5 5. 0 4. 6
Producers' durable equipment.......... 27. 2 28. 5 22. 9 26. 1 5. 6 6. 0 5. :3 6. 0 5. 7 7. 0 6. 3 7. 2
Change in business inventories-totaL.. 4. 7 2. 0 -3.8 4. 8 -.1 -2.4 -. t' -. 6 3. 2 1. 8 -. 5 . 2 Nonfarmonly .............•......... 5.1 1.2-4.9 3.9 -.4-2.6-1.0 -.8 2.9 1.6 -.7 .1
X et exports of goods and services (GNP basis)..................................... 2.9 4.9 1.2 -.8 ,4 ,4 0 .4 -.2 -.3 -.5 .2
6.1 5. 8
Exports................................. 2:l. 1 26. 2 22. 6 22. 8 Imports ........•.•......••.•••••........ 20.2 21.3 21.3 23.6
5. 4 5.0
5. 8 5. 4
5. 9 5. 5
,), 3 5. 5
5. 7 6.1
5. 7 6. 2
Government purchases of goods and services_
FederaL ......................••........ National defense ........•••......... Other ....................••......... Less: Government sales .....•.•.•...
State and locaL ...•••...•.•.••.........
79.0 86,2 92.6 97.6 21.7 23.1
.j,), 7 49. 4 52. 2 53. 5 40. 4 44. 3 44. 5 45. 8 .>.7 .).5 8.1 8.1 . 3 . 4 . 5 .4
33. 2 36. 8 40. 5 44. 1
12.5 12.9 10.9 II. 2 1.7 1.9 .1 .I
9. 2 10.1
13.3 11.2
2. 2 .1
10.4
24.2[ 23.5
13.5 13.4 11.2 11.4
2. 4 2.1 . 1 . 1
10. 7 10. 1
24.6 24.8 24.7
13.61 11. 7
2:~1 11.(11
13. 5 13. 1 11. 5 11. 2 2.0 2.0 '1 . 1
11.4 11. 6
Table 1-5.-Gross National Product or Expenditures, Seasonally Adjusted Quarterly Totals at Annual Rates, in Constant Dollars, 1956-59 [Billions of 1954 dollars]
Gross national product_ ______ _
Persona] consumption expenditures _______ _
Dmable goods ....................... __ . Sondurable goods ....... ···········----. Services ___________________________ _
(;ross private domestic investment_ _______ _
New construction ______ -------------- __ Hesidential nonfarm ...•.......... _._ Other ........................... .
Producers' durable equipment ...... __ .
400,91408.3
264. 31 270. 8
1:1~ ~~~~~~: g \16. f) \!9. 8
61.7
32.3 16.2 Hi. I
58.51
31.9 15.4 16.5
25.0 24. 6
399.0 426.0 391.0 393, I 400.9 410.8 420. 7 432. I 424.3 426.8
~3m6R7mi~Om4~3R3R8~1
35. 7 40. 2 35. 2 :l5. 0 133. 7 139. 3 131. 3 132. 7 103. 8 108. 2 102. 2 103. 4
47.3 60.2 45.0 44.2
31. 5 34. 4 31. 3• 30. 5 16.2 19.4 15.4 15.3 15. 2 15. 0 15. \i 15. 1
19. 3 21. 5 20. I 19. 0
3.\. 3 37.5 135. 3 13.\. 6 104. 41105. 3
46.61 53.0
31.2 32. 6 Hi. 31 li. 8 15.0 14.8
18.6 19.3
38. 8 41. 2 40. 6 40. 2 137.3 139.7 139.4 140.7 106. 2 107. 4 108. 8 110. 2
59.8 66.0 56.41
34. 9 19.7 15.2
~l4. 3 19.3 15.01
19.81
35.1 20.2 14.9
21.3 22.1
58.8
33.3 18.4 14. 9
22.7
Change in business inventories-total... 4.5 2.0 -3.5 4.4 -6.4 -5.3 -3.2 1.1 5.7 1!.5 -.6 2.8 Nonfarmonly....................... 4.9 1.1 -4.4 3.5 -7.2 -6.1 -4.2 .0 4.7 8.6 -1.4 2.1
Net exports of goods and services (GNP basis)..................................... 2.5 3.8 .o -2.6 .8 • I .5 -1.4 -2.7 -3.5 -1.9 -2.2
Exports ....................•............ Imports ............................. .
Government purchases of goods and serv-ices _____________________________________ _
FederaL ... _ .. _ ....... _._ ......... _ .. State and locaL. ................... .
22. 4 24. 4 21. 6 21. 7 I 9. 8 20. 6 21. 6 24. 3
72.3
41. ,I ao. 61
75. 1 78. 4 80. 7
42. 8 44. 1 44. 2 32. 3 34. 4 36. 51
21.0 20.2
76.51
42.81 3:J. 7
~.3 na ~7 ~4 ~9 ~~ n4 ~.2 ~.8 ~1 ~1 ~5 ~0 ~7
77. 7 78. 9 80. 8
4:1. 9 44. 31 45. 2 33. 8 31. 61 35. 5
81.31 44. \1 :l6. 41
81.4 81.0 79.1
42.7 36.3
Table 1-9.-National Income by Type of lncmne, Seasonally Adjusted Quarterly Totals at Annual Hates, 1956-59 [Billions of dollars]
i I I I I I i : I i National income ............. _ :J-50. 8, 361l. 51 366,2 :!98, 51 355.8 ,358, 91 ~li9, ,;, :!80. -li :!8!1. 4, 403. 9• :!98. 2
1
. N A ' ' ' I I I I Comp(>nsationofemp1oyees______________ z.t2,!): 2:'>5.5j 256.8 277.41 2:32.5 23~ •. 2~ 2:i8.fi 2G2.!ll' 2H9,\1
1
278.9i 279.3·
1
281.H
\\"ages and salaries ______________________ 2:!7.11: :t~b.:il239.·1 2il'i.sl :.::~;-;,2~ 2:{n o: :2-H.Jj :2--tr).l 2;10.tl 2ti9.--l1 :?.~u.s 2fil.5 Private ............................ 1o\l.l:i Hl8.4j l\!6.2 21~.1; 1!>3.41llio.2i l\17.1j200.Si zon.zlznolzn.:;l214.8 ~vlilitary ___________________________ \l_;j n.nl \).7 :l.~j n_;\
1
r).ii Jn.o·~ ~1.:1! n.s1
\l.si 9.:-;1
B.:-.; Governmentcidlian'--········· z,;.~~ 30.0 :J:l,;; :J.S.!Ii :12.:1 :1:1.21 ~4.0j :H.4i ~4.s, 35.n
1
3u.:l 3o.9
Supplements to wages and salarie,_____ 14. !li' 17. o' 17, .,! 1!1.1;\ 17.:11 17.2117. ''i 17. k! mol HI. fi Hl. 8 20.0
Proprietors'income ........................ 4:!.7 44.5 46.1i 16.:J 41i,11·1i'i.9 Hi.SI 47.41 Hi.91 46.1il45.1 41l,7
Business and professional.............. :12 1
1
32.7 32.4 :H.;, :n Ill :Jo ol :l" nl :l:l ·o1 :n. 7 :ll ,, :l4.1-il 3:i.1 Farm.................................. ll: fi 11.8 14. 2 II. H u: li 1i l''l 1 i: 2 u: i J:l. 2 12: II HU 11.1)
Rental incomeofpersons.................... 111,91 11.5 11.8 12.0 11.7 11.8 11,9 ll.ll 12.0 12.01 12.0 12.0
Corporate profits and inventory valuation I I I I adjustment............................... 42.11 ll. 7 :36. 7' NA 31,5 3:l.~ 38,0 43.5 H.~' ~1.01 -16,0 NA
l'rofitsbeforetax .....•..•.•............ 44.7 43,3 37.1 NA 32.0 .l3.r, 1 38~l 44.fi 4h."I·'2.G 41i.4 NA Profitstaxliability ....•••......•... 21.2 21.1 18.2 NA Vi.7 lli.!i JX:o
1
21.9 22.1: 2.1.fi 22.6 NA Profits after tax..................... n. ,o 22.2 18.9 N A 16.3 17.1 10. ii n. 7 2:3.81 27. o 23. s KA
Jrn·entoryvaluationadjustment. ....... -2.71-1.5 -.4 NA -.4 .2 -.,lj -1.1 -.\1 -1.6 -.3 NA
Netinterest. ...•..••...........•........... 11.71 13.3 14.3 15.6 13.9 14.1 14.41 14.7 15.1115.4 15,8 16.1
N.\ Not available. , I. Tncluue~ also the pay of empl~yees of gorernment enterprises and of permanent CS. residents employed in the United ~tate:-. hy foreign governments and mternat10nal orJ!nmzatwns.
Febrnar:r 1 \H'.O
ments increased about $}f billion. n·flecting the advance in rates as well as the higher public debt. The growth in transfer payments, noted earlier. accounted for$% billion of the rise in total Federal outlays.
State and local purchases
State and local government purchases of GNP were up $3% billion to a $44 billion total. All major components shared in the increase. l\1ore than half of it was in compensation of employees, as pay rates advanced and the number employed rose 5 percent.
The fiscal position of these units <1S
shown in the income and product accounts improved somewhat. Current revenues expanded with the step-up in highway grants from the Federal GoYernment and the continued increase in receipts from sales and property taxes.
lmprored Federal Budget outlook
The new Budget transmitted by the President to Congress last month programed Federal expenditures in bahmce with estimated receipts for the current fiscal year, that ending June 30, 1960. A surplus is calculated for fiscal 1961. A translation of the official Budget estimates into the income and product account framework is summarized in the table on page 10.
Realization of the Budget projections would mE:>an that total Federal outlays in calendar 1960 will be up somewhn t over the December quarter of 1959 as a result of bigher transfers and intE:>rest payments. Outlays for goods and sen·ices are expected to remain substantially unchanged. The calculated rise in receipts on income and product account assumes an improvement in business, as outlined in the President's mE:>ssage, and allmYs for the social security tax rate increase which went into effect last month.
It may be noted that the calenJ.ar 1959 deficit on income and product account was substantially less than those shown in the administrative and cash budgets. This is partly because revenues as measured for national income purposes include corporate profits taxes on nn accrual basis, and therefore this measure reflected last year's recoyery
Febrnm·y 1000 SURVEY OF CURREXT BUSINESS
Table 1-ll.-National Income by Industry Division, Seasonally Adjusted Quarterly Totals at Annual Rates, 1956-59
[Billions of dollars]
I ' I
19ii611957119.58 1959 --~~---j----1::0:'_ __ ---
I I II I III I IV I I I [ I III I IV I I
All industries, totaL ___________ 350.81366.5 366.2 398.5 355.8 358.9 369,5 380.4 389.4 403.9 398.2 NA
Agriculture, forestry, and fisheries .. -------- 111. 1 16. 4 19.0 16.8 19. 1 18. 7 19.0 19. 1 18.2 17.2 15.2 NA
Manufacturing ______ ------------- ___________ 109.3 112.6 103.7 119.0 100. 3 99.8 104.3 no. 5 115.5 124. 6 118.4 NA Durable-goods industries _______ . __________ 65.9 68.8 61.0 NA 59.1 58.0 60.8 66.1 69.4 76.8 70.4 NA Nondurable-goods industries ... __ .. __ .. ___ 43. 4 43.8 42.7 NA 41.3 41.8 43.5 44.4 46.1 47.8 47.9 NA
Wholesale and retail trade ___________________ .18. 2 60.4 60.5 66.5 57.9 59. 5 61.7 62.9 64.5 66.6 67.3 NA Finance, insurance, and real estate __________ 32.4 34.7 36.6 39.5 36.0 36.3 36.7 37.4 38.2 39.0 40.1 NA Transportation ___________________________ .. __ 16.8 17. 2 16.4 17. 5 16.0 15.9 16.5 17.1 17.5 17. 7 17.3 NA Communications and public utilities ________ 12. 7 13.5 14.4 15.6 14.0 14.3 14.4 14.7 15.2 15.5 15.6 NA
Services ...... ----------------_ .............. 37.3 40.0 41.6 44.7 40.7 41.3 42.0 42.5 43.2 44,3 45.1 NA Oovernment and government enterprises ____ 40.4 43.2 46.7 49.5 45.2 46.2 47.5 48.0 48.3 49.2 49.9 NA (lther _______________________________________ 27.8 28.6 27.3 29.5 26.5 26.8 27.4 28.2 28.6 29.8 29.5 NA
I
:-;.\-Not available.
Table 1-14.-National lncotne by Corporate and Noncorporate Form of Organization, Seasonally Adjusted Quarterly Totals at Annual Rates, 1956-59
[Billions of dollars]
I
19.51) I 1957 1958 Wli9 --
I I
National income _______________ 350.8 366,5 366.2 398.5 355.8
Income originating in corporate business ____ 195,2 203.1 194.4 218.8 187.7
Compensation of employees _____________ 154. 6 162.7 158.9 172.8 157.3 Wages and salaries __________________ 143.8 150.6 146.9 159.2 145.2 Supplements to wages and salaries .. 10.9 12.2 12.1 13.7 12.1
Corporate profits and inventory valua-tion adjustment'-------.-------------- 40.2 39.8 34. !J NA 29.9
Profits before tax'------------------- 42.9 41.4 35.3 NA 30.3 Profits tax liabilitY----------·--- 21.2 21.1 18.2 NA 15. 7 Profits after tax'---------------- 21.7 20.3 17. 1 NA 14.6
Inventory valuation adjustment. ... -2.7 -1.5 -.4 NA -.4
Ket interest. .... ------------ _________ . __ . 3( .6 .6 . 7 .6
Income originating outside corporate busi-155.71 ness ____ ----------------------------------- 163.4 171.8 179.6 168.0
'\.-\-Not available. 1. Excludes corporate profits originating in the rest of the world sector.
1958
II I III I IV I
358.9 369,5 380.4 389.4
189,0 196.2 204.8 212.5
156.3 159.5 162.6 168.2 144.4 147.4 150.4 154.9 11.9 12.0 12.2 13.3
32.1 36.1 41.6 43.7 31.8 36.4 42.7 44.6 16.5 18.8 21.9 22.6 15.4 17.6 20.8 22.0
.2 -.3 -1.1 -.9
.6 .6 .6 . 7
169.9 173.3 175.6 176.9
1959
I II I
III I 403.9 398.21
224.6 218.~
174.6 173. 9 161.0 160.1 13.7 13.8
49.3 44.2 50.9 44.5 25.6 22.6 25.3 21.9
-1.6 -.3
. 7 . 7
179.3 179.5 I
IV
N A
NA
174. 160.
6 7
13.9
NA NA NA NA NA
• 7
182.9
Table 1-18.-Relation of Gross National Product, National Income, and Personal Income, Seasonally Adjusted Quarterly Totals at Annual Rates, 1956-59
[Billions of dollars]
I .. , 1958 1959 1957 1~.>8 19.59
--~--~-r-;~--~~- --~--,-~0~1~
Gross national product_ ____________________ 419.2 442.5 441.7 479.5 431.0 434.5 444.0 457.1 470.41 484. 8 478.6 48.1.5
I~ss: Capital consumption allowances ..... 34.4 36.9 37.9 40.2 37.5 37.6 38.0 38.5 39.3 39.9 40.5 41.2 Indirect business tax and nontax lia-bility ______________________________ . 3.5. i 38.1 39.0 42.0 38.3 38.9 39.1 39.9 40.7 41.7 42.3 43.1 Business transfer payments.---------- 1.6 1.7 1.7 1.7 1.7 1.7 1.7 1.7 1.7 1.7 1.7 1.7 Statistical discrepancy-------- __ . __ .. _ -2.4 . 5 -2.1 -2.3 -1.2 -1.5 -3.3 -2.4 . 2 -1.7 -3.6 N:\
Plus: Subsidies less current surplus of gov-ernment enterprises ___________ ----._ . 9 l.l 1.0 . 7 1.1 1.1 1.0 1.0 .8 . 7 .6 . 6
Equals: National income ____________________ 350.8 366.5 366.2 398.5 355.8 358.9 369.5 380.4 389.4 403.9 398.2 NA
Less: Corporate Jlrofit.s and inventory val-uation a justment __________________ 42.0 41. 7 36.7 NA 31.5 33.8 38.0 43.5 45.5 51.0 46.0 NA
Contributions for social insurance ..... 12.6 14.6 15.1 17.9 14.8 14.8 15.3 15.5 17.5 17.9 18. 1 18.2 Excess of wage accruals over disburse-
ments .. ---------------------------- .0 .0 .0 .0 .6 .6 -1.3 .0 .0 .0 .0 .0
Plus: Government transfer payments to persons ____________________________ 17.2 20.0 24.4 25.1 22.8 24.9 25.4 25.1 24.7 24.8 24.8 26.0 Net interest paid by government. .... .). 7 6. 2 6.2 6.8 6.2 6.2 6.1 6.1 6. 3 6.6 7.0 i. 4 Divi<lends .. --------- ________________ 1I:hl 1i: ~ 12.4 13.2 12.7 12.6 12.6 12.0 12.8 13.0 13.4 13.6 Business transfer payments ... -------· 1.7 1.7 1.7 1.7 1.7 1.7 l. 71 1. 7 l.i 1.7
Equals: Personal income ____________________ 332. 91 350.6 359.0 380.2 ~52. 2 355,0 363.4 366.3 371. 8, 381.1 381.0 .386. 8 i i I '
:-;- .\--:-;-ot availahle.
13
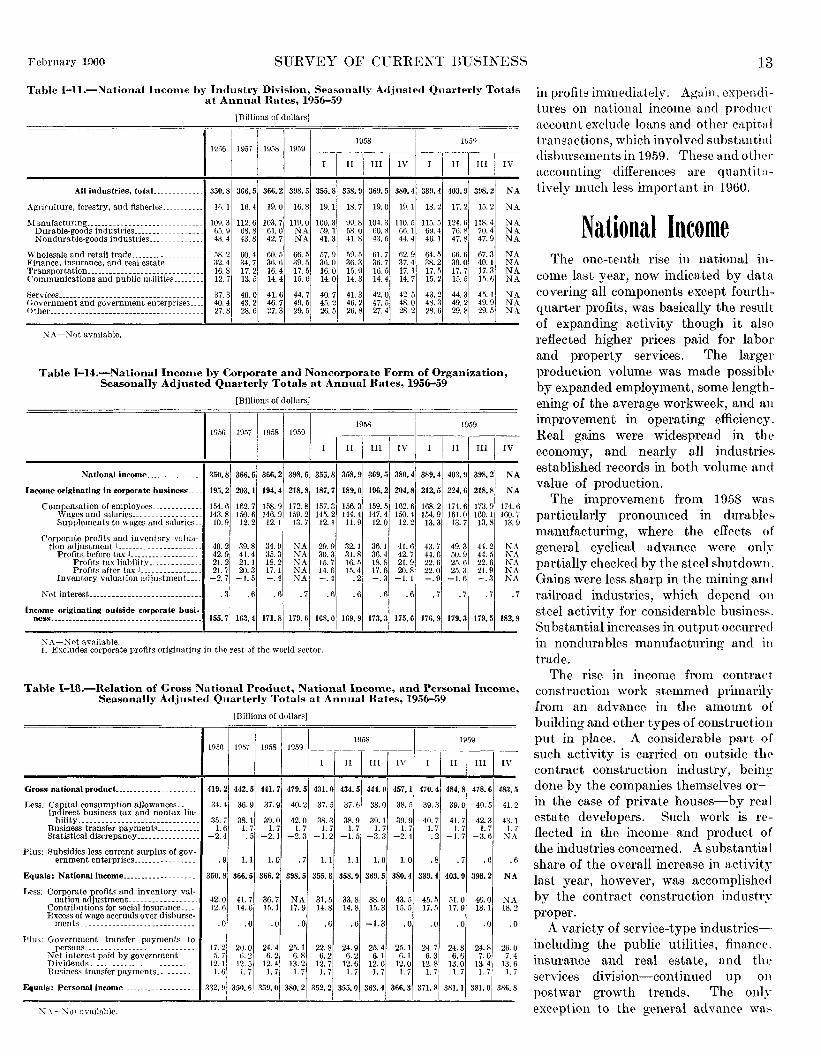
in profits immediately. Again, expenditures on national income and product account exclude loans and other capital transactions, which involved substantial disbursements in 1959. These and otlwr accounting differences are quantitatively much less important in 1960.
National Income The one-tenth rise in national iu
come last year, now indicated by data covering all components except fourthquarter profits, was basically the result of expanding activity though it also reflected higher prices paid for labor and property services. The larger production volume was made possibh· by expanded employment, some lengthening of the average workweek, and an improvement in operating efficiency. Real gains were widespread in tht• economy, and nearly all industries established records in both volume and value of production.
The improvement from 1958 was particularly pronounced in durablt>s manufacturing, where the effects of general cyclical ad vance were only partially checked by the steel shutdown. Gains were less sharp in the mining awl railroad industries, which depend on steel activity for considerable business. Substantial increases in output occurred in nondurables manufacturing and in trade.
The rise in income from contract construction work stemmed primarily from an advance in the amount of building and other types of construction put in place. A considerable part of such activity is carried on outside tht> contract construction industry, bein~ done by the companies themselves or-in the case of private houses-by real estate developers. Such work is reflected in the income and product of the industries concerned. A substantial share of the overall increase in activity last year, however, was accomplished by the contract construction industry proper.
A variety of service-type industriesincluding the public utilities, finance. insurance and real estate, and the services division-continued up on postwar growth trends. The only exception to the general advance w:b
14 SURVEY OF CURRE~T BUSIXESS
Table 11-2.-Personal Income and Its Disposition, Seasonally Adjusted Quarterly Totals at Annual Rates, 1956-59 [Billions of dollars]
i 19.}6 11~.57
1958 195~
I I I! I III I IV
Personalincome ___________________________ 332.9 350,6 359,0 380,2 352.2 355,0 363.4 366.3 37l.S 381.1 381.0 386.8
Wage and salary disbursements ________ _ Commodity-producing industries .. _
Manufacturing only ____________ _ Distributive industries ............. _ Service industries ... ____ --------- .. _ Government. ______________________ _
Other labor ineome ____________________ _
Proprietors' income ____________________ _ Business and professionaL _________ _ Farin _____________________________ _
!\ental iueome of persons _______________ _ Dividends .. __ --·--------- .. _._. ________ _ Personal interest income _______________ _
Transfer payments ..... ________________ _ Old-age and survivors insurance
benefits _________________________ _ State unemployinent insuranre
benefits. ___________ ... _ .... _ ..... . \'eterans' benefits. _______________ . Other ______ .... ___________________ _
Less: Personal contributions for sof'ial insurance ____________________________ _
Le,;s: Personal t.ax and non tax payments .... Federal. ___________ .... ______ ._. ___ _ State and locaL _________________ _
~6~5~4~8~H~4~3~1~Rm4ms~.5 ~7~2 ~8~3 ~3 M8 ~2~9~2~6~6~9 n7 ~8 ffi7 ~6 Th8 U9 ffi9 m1 ~I ~4 MD ~8 003 ~4 ~8 ~6 ~4 ~I Ml M5 MD ~4 ~3 ~6 ~5 ~7 M6 ~2 ~7 M3 M9 M3 ~D ~D ~6 ~3 ~D ~2 ~2 ~7 U2 ~2 ~2 K3 K7 ~4 ~0 ~7
8. I 9. 1 9. 3 10. 0 9. 3 9. 3 9. 3 9. 4 9. 7 9. 9 10. I 10. 3
~7 K5 ~6 ~3 ~I ~9 ~8 ~4 ~9 ~6 ~I ~7 32. I 32. 7 32. 4 34. 5 31. 6 32. 0 32. 8 33. 2 33. 7 3!. 5 34. 8 35. 1 11.6 11.8 14.2 11.8 14.6 13.9 14.2 14.1 13.2 12.1 10.3 11.6
10.9 11.5 11.8 12.0 11.7 JI.S 11.9 12. I 12.5 12.4 13.2 12. 7 12.6 12. ii 17 .. 1 19. -1 20. 4 22. 4 20. 2 20. 3 20 .. 1
~8 n7 Zl Z8 R4 ZH n1
5. 7 7. 3 8. 5 10. I 7. 9 8. 6 8. 7
1.4 4. 2 7. 5
1.8 3.9 2.5 3.1 4.4 4.6 4.4 4.6 8. 3 9. I 9. 7 8. 9
4. 2 4. 8 4. 6 4. ,, 9. 2 9. I
11.9 12.0 12.D 12. ()I 12.8 I:J. 0 20. ~ 21. 3 22. D
26. 8 26. 4 26. 5
8. 8 9. 4 10.2
4. 2 2. 9 2. 2 4.5 4.5 4.ii 9. 3 9. 5 9. 6
12.0 12.0 13.4 13.6 22. 7 23 .. 1
26. 5 27. 7
10.4 10. ii
2. D 2. 8 4. 3 4. 4 9. 8 9. 9
5. 8 0. 7 7. 0 8. :l 6. 9 0. 9 7. I 7. I 8. I 8. 3 8. 4 8. 4
40.0 42.7 3-\ 2 37.4
4. 8 5. 4
42. 6 4.) .. ) 36. 7 39.2
5. 8 6. 3
41.9 36.2
5. 7
42. I 42. 9 43. 4 36. 3 37. I 37. 4
fl. 8 .), 9 6. 0
44. 4 4.1. 8 4i\. 9 38. 2 39. ,) 39. 5 6.2 6.3 6.4
46. I 39.7
6. 4
Equals: Disposable personal income________ 292.9 307.9 :316.5 334.6 310,3 312. 9 320,4 322.9 327.4 335.3 335.1 340.8
Less: Personal consumption, e>penditures 269. 9 284. 8 293. 0 311. 6 287. 3 290. 9 294. 4 299. 1 303. 9 311. 2 313. 3 317.0
Equals: Personal saving ... _________________ 23,0 2-3.1 2.3.5 23.1 22,9 22,0 26.0 23.7 23,5 24.1 21.9 2-3.7
.-hWendum: Disposable personal income in ronstant (1954) dollars.. __________________ 286.9 292.9 29ii.2 309.0 290.0 291.6 299.2 300.4 3D4.3 310.7 308.9 312.9
Table II-6.-Personal Consumption Expenditures by 1\Iajor Type, Seasonally Adjusted Quarterly Totals at Annual Hates, 1956-59 [Billions of dollars]
Hom ""' I '"·• ww 19-58
I
Goodsandservices, totaL ________ 269.9 284.8 2!13.0 311.6 287.31290.9
36.9 36.7 13.5 13.6 17.2 17.0 6. I 0.1
294. 41299, I I' 303. 9
37. I 39. 8 4 I. 3 13. 21 15. 7 , I 7. 2 Ii.H 17.S 17.7 6.3 6.:; 6.4
Hurable goods, totaL ...... _______________ _ .\ utomo biles and parts ...... ______ .. __ _ Furniture and household ~qnipmenL ( lth~r. .. ---------------------------
Nunducable goods, tota[_ _________________ _ Food and beverages .. _________________ _ CLothing and shoes __ • _________________ _ n-usoline and oil _______________________ _ Other ... ____ ... _ ....... ____ ........ _._-
38.5 40,3 37.6 43.0 15.8 li.O 14.0 17.8 17.4 17.4 17.4 18.!\ 5.3 5.8 6.2 tl.6
131. 4 137. i 141.9 147.9 71. 2 7 4. 3 76. 6 78. 8 24. 5 2:3. -1 26. 1 27. 7 9.6 10.4 10.5 11.2
26. 2 27. G 28. 7 30. 2
139.5 141.5 7.1.8 77.0 25. 3 2.5. 7 10. ;; 10.4 28. 1 28. 3
143. I 143. 6 145.3 itl. G 77. 0 77. S 26. 7 2G. ll 26. 7 10.7 10.7 11.0 29. I 2Y. 3 29. 8
&>rvices, totaL ...... __ ... ------ ___ ........ _ 100.0 19~·71113,4 120.~ ll!.O 1.1~.~ I.U.2 ,1.15.7 ll7.4 Housing________________________________ :32. i llousehold operation________________ H.·' Transportation___________ __ ~-n Olher.. _______________________ ns
.3.>. 2 ; oR 0 40. ; 3;, 0 3;, 1 38. ·I , 39.0 39. 6 1:).8 I W.9 I7.K 10.5 Hi.b 17.0: 17.2 17.:3 8. \) ! 9. 1 I !J. 4 I R. \) I (1. ll ; !1. I I 9. 2 !). 3
lti. ~ i tH. 4 ' fl2.:.;;. I 4K. li I -1!1. 2 ' -N. 7 I -~0. :) 1,' .ll. 1 ' : I i ! ,
IV 59
3ll.2 313.3 317.0
44. I 43. 6 42. 8 18.8 18.2 17.2 18. 8 18. 9 18. 8 G.4 6.5 6.8
147.7 148.0 79. o I 78. s 27. 8 27. 8 11. 1 II. 3 :1'J. 8 30. I
ll9. 4 40.3 17.6
H. 3 ;12. I
121.6 41. () 17.8 9. 5
5:J. I
150.1 7!1. [j 28. :l 11.4 30.9
121.1 41. S 18. 1 9.6
;)~.I)
Tahl<" 11-7.-Peo·sm~al Consumption Expenditures hy .\lajor Type, Quarh·rly, 1956-59 [Bill ion> of doll<Jr']
I 195tl I 1!1.571 19.581 195V lr ' ' '
269. 91 28·1. 81
I
it;, 81 76. 'I Goods and sen·ices, totaL _____ 293.0 311.6 68.31
71. 9 72. I 80.7 -? _: 85. fi '··"I Durable goods, tot.aL ...... ____________ --- :J~. 5 40.3 37.6 4:J. 0 8.3 9, I 8, 8 11.4 s. 4 II. I 10,:!1 12. :j
.\utomobiles and parts ............. 1.\ ~ 17. 01 II. II 17. X 3. 41 3. 7 3. 2 3." 4 .,
.5. ~I 4. :l 4 ., --- • u
>'umitme and household equipment. li. 4 17. 4 17. 4 18. fi J. -~ 1.1 4. ;! :1. 2j :J. g .J..-, Ui t,,tj Other ...... _______ ........ __ ... ______ -- -~- 3 " 'I n. 2 fi.R !.I 1.4 J.;j 2. t: 1.2 1.4 1.4 2.1;
:-!on durable goods, lolaL ...... _____
~~:·.:r 1:37.7 141. !I 147.9 32.11 :34.4 :li.S 40. 'i 3:3,6 35,8 :)6. 0 42.5
Fo<Kl and beverages ___________________ .. 74. :;J 7ti. t) !S, ~~ 17. v lU. I lH. i Hl.\Ji 18. 4 HJ.t1 20.2 :W.ti t' lothing and shoes ....... __ .... _________ 24. ·' 2-\ 4! :lf).l 27. 7 .\2 fi. 2 :i . .S X. U. :"i. 6 n.n 6.1 Y .. i CTH~oline and oiL. _________ ----------. ___ . V.H 111.1! 10 .. 1 I l. 2] 2.:; 2. i> 2.1-i 2. li: q 2. 91 /.:~I 2. ·' OOwr ___ .... _ ...................... - --- 2fi. :zl '27. f)i 2S. 7 :lO. 2) 6. 7 fi.:l tU £1.2'
n. 'I 9. 7
S<>rvkes. lolaL ........................ _ -- 100. o1
106. i' Jl:3. 4 120.71 28,0 28 .. 3 28,51 28,1il 2~. 6[ :JU, o1
:!0. 41 .30. i
II \1.7! I
Housing _________ ---------- _________ . ____ :;2. ;-)i_ 2 "'-11 -hi. I H. 2 ~J. il. hi !J.\Ii 1u. II 10 21 w.:. l!<>usehold oper"tion ___ ...... ___________ H ]1,.1.,! 1n. n 17. x: t ~I 4. 2 :::. gl 4. ;;, i: ~~ t :;: 1.111 4, !i T'ransporl>ltion _________________________ 8. ·"· ~j I \),] ~- .j' 2. :; 2 .. tl 2. :;, :.?. ~ 2. ·\ 2 . .j Other ___________ --------_---------~--- .J:J. -H;. ,~<, -!9. 4 :i2. b; 1',!.0 12.-1 12. -;' 12. :l I') - 1:1.1 l:tlil n:;
Feb rna ry 1 HI)O
in agriculture, where incomes lowered by price declines and production expenses.
\Y(' 1'1'
nsmg
Income in durables manufacturing
Income from the manufacture of durable goods rose almost one-fifth from 1958 to 1959, reaching an annual rate of $73 billion for the first half and approaching this pace in the second. Over a third of the gain in average employment for the economy as a whole in 1959 was in these lines. In addition, opera.ting efficiency improved considerably as production moved up from the uncconomically low rates which had characterized the recession phase of the cycle. Together with some rise in weeldy hours, these elements accounted for most of the income expansion.
Production volume and income were up considerably in every major group. As usual in short-term business swings, the changes in these lines were considerably sharper than in real GNP as a whole .
Despite its unfavorable fourthquarter experience, the auto industry registered a steep rise both in income and in units produced. The real gain in auto manufacturing income and product is traceable to an increase of one-sixth in average employment for the year and a greater-than-average improvement in efficiency as production swung sharply higher. The retarding effects of the steel strike were visible in the comparative record for primary and fabricated metals. Employment and output gains in these, though substantial, were relatively less than in other durables lines.
.~viarked advances were registered by durable goods industries benefiting from the rise in construction activity.
Growth in nondurables
Income from nondurables manufactming. which had declined relatively little in 1958, accordingly rose less last year than did earnings in the more cyclically-sensitive industries. The 19.59 total was around one-tenth-more than $4 billion-above the previous ~-ear.
As elsewhere. the rise stemmed mainly from volume gains, as employnwnt mov!!d up itnd the tenckncy townrds more dficit'nt utilization of labor nnd ffwilities ('Ontinued.
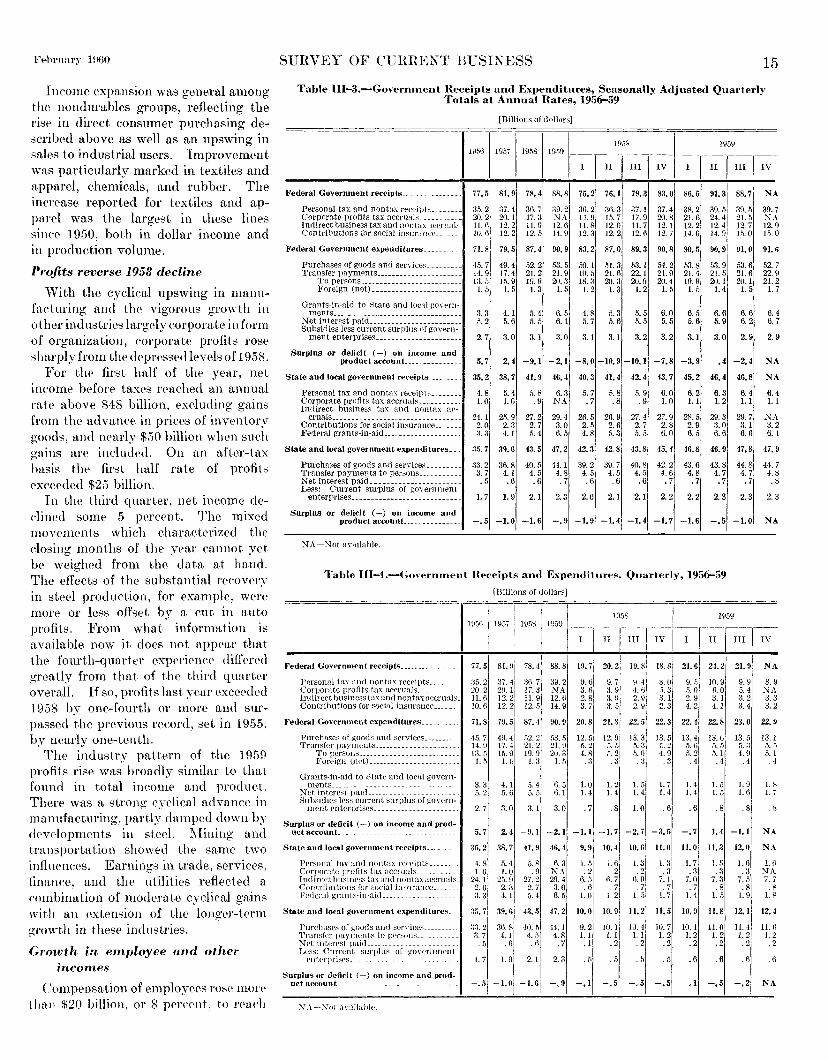
Ft>brnary HI(JO
Income expansion was general among the nondurables groups, reflecting the rise in direct consumer purchasing described above as well as an upswing in sales to industrial users. Improvement \Vas particularly marked in textiles and apparel, chemicals, and rubber. The increase reported for textiles and apparel was the largest in these lines sinee 1950, both in dollar income nnd in production volume.
Profits reverse 1958 decline
With the cyclical upswing in manufacturing nnd the vigorous growth in other industries largely corporate inform of organization, corporatt' profits rose sharply from t.Jw deprpssed levels of 1958.
For tlw first half of the year, net incomt' befort' taxes reached an annual rate above $48 billion, excluding gains from the advance in prices of invcntor~T goods, and m•arly $50 billion when such gains are ineluded. On an after-tax lmsis the first half rate of profits exceeded $25 billion.
In the third quarter, net income declined somP 5 percent. The mixed movements which charaeterizt'd the rlosing months of thP year cannot yet be weighed from the data at hand. The effects of the substantial recovery in steel production, for example, were more or less offset by a cut in auto profits. From what information is available now it does not appear that tlw fourth-quarter expPrit•nce differed gn•atly from that of the third quarter overall. If so, profits last year exccpded I 958 by one-fourth or more and surpassed the previous record, set in 1955, by nearly one-tenth.
The industry pattern of the 1959 profits rise was broadly similar to that found in total ineome and product. There was a strong cyclical a.dvance in manufacturing, partly damped down by developments in steel. ~[ining and transportation showed tlw same two influences. Earnings in trade, services. finance, and the utilities reflected a <'ombination of moderate cyclieal gains with an extension of the longer-tt'rm growth in thesP industries.
Growth in employee and other incomes
Compensation of employees rose mon· than $20 billion, or 8 prrcent, to rra<'b
SURVEY OF ClJHRE:t\T BUSINESS 15
Table 111-3.-Government Receipts and Expenditures, Seasonally Adjusted Quarterlv Totals at Annual Rates, 1956-59 · ·
Federal Government recf'ipts
Personal tax and non tax re('r.ipts __ _ Corporate profits tax accruals_-----····--Indirect business tax an(l non tax nrenwls Contributions for :-;ocial in....,nnm(•e __
Federal Government expenditures ____ .
Purchases of ~wods and services ________ _ Transfer payrnPnts _____________________ _
To persons ____ ----------- __________ _ Foreign (netl---··-···-·---------·--
Grants-in-aid to State and Ioc,ll g-uvenl-
[Billions of ilolhm]
l~5G 1957 1958 1H09
77.5 81.9 78.4
3.1. 2 37. 4 36. 7 20. 2 20. I 17. 3 11.6 12.2 II. 9 10. fj 12. 2 12. 5
ss. sl 75.2
au. 2 36. 2 "A 14.9 12.6 11.8 14. 9 12. 3
1959
I I II I III IV
I ~1 na ~o ~5 na ~7 ~3 ~1 ~4 ~2 ~5 ~5 !.1. 7 17. 9 20. 8 21. 6 24. 4 21. 5 12.0 11.7 12.1 12.2 12.4 12.7 12. 2 12. 6 12. 7 14. 6 14. 9 Vi. 0
NA
39.7 ~A 12.9 15.0
71.8 79.5 87.4 90.9 83.2 87.0 89.3 90.8 90.5 90.9 91.0 91.6
45. 7 ·19. 4 .12. 2 .13. 5 14.9 17.4 21.2 21.9 I:J. 5 15. 9 l!l. 9 20. :; !. 5 !. 5 1. 3 !. 5
50. 1 li I. 3 53. I 54. 2 53. 8 53. 9 S3. 6 52. 7 1\1 .. 1 21. 6 22. I 21. 9 21. 4 21. 5 21. 6 22. !I ma na nu m4 mo m1 m1 n2 1.2 1.3 1.2 1.5 1.5 1.4 1.5 1.7
ments_ .. ______________________________ 3.3 4.1 5.4 6.5 4.8 .5.3 5.5 6.0 6.5 6.6 6.6 6.4 Netinterestpaid ________________________ o.2 5.6 5.5 6.1 5.7 5.6 5.5 5.5 5.6 5.9 6.2 6.7 Suhsidies less current surplus of govern-
mententerprises_·-----·---·--··------ 2.7 3.0 3.1 3.0 3.1 3.1 3.2 3.2 3.1 3.0 2.9 2.9
Surplus or deficit (-) on income and product account__ __ ---------- 5.7 2.4 -9.1 -2.1 -8.0-10.9-10.1 -7.8 -3.9 .4 -2.4 NA
Stateandlocalgovernmentre<·eipts____ ___ 35.2 38.7 41.9 46.4 40.3 41.4 42.4 43.7 45.2 46.4 46.8 NA
Personal tax and non tax reet>ipt s _______ _ Corporate profits tax accruals ___________ _ Indirect business tax and nontnx ae-
cruals ______________________ -------- __ _ Contributions for sociftl insurance _____ _ Federal grants·in-aid ___ ----------------
State and local government expenditures __ .
Purchases of goods and serYicm: ________ _ Transfer payme"!ltS to persons ___________ _ Net interest paid ______________________ _ Less: Current surplus of government enterprises ___________________________ _
Surplus or deficit (-) on income and product account_ __ _
NA-Not avnilahle.
4. 8 1.0
24. 1 2. 0 :J. 3
:)5. 71
5.4 5.8 6.3 5.7 l.G .9 NA .7
25. 9 27. 2 29. 4 26. 5 2.3 2.7 3.0 2.5 4.1 .1.4 6.5 4.8
39.6 43.5 47.2 42.3
5. 8 .8
26. g 2.6 5.31
I 42.8!
5.9 6.0 6.2 6.3 6.4 . 9 I. 0 !. 1 1. 2 !. 1
27. 4 27. 9 2S. 5 29. 3 29. 7 2.7 2.8 2.9 3.0 3.1 5.5 6.0 6.5 6.6 6.6
43. si 45.1 46. s 46.9 47.8
6.4 1.1
KA 3.2 6.-l
47.9
~2 •s ~5 K1 ~2 ~7 ~8 tl2 43. 6 43. 8 44. 8 41. 7 3. 7 4. 1 4. 5 4. 8 4. 5 4. 5 4. 5 4. 6 4. 8 4. 7 4. 7 4. 8 .5 .6 .6 .7 .6 .6 .6 .7 . 7 • 7 . 7 . 8
1. 7 1. 9 2. 1 2. 3 2. 0 2. 1 2.1 2. 2 2.2 2.3 2.3 2.3
-.5 -1.0 -1.6 -.9 -1.9 -1.4j -1.4 -1.7 -1.6 -.5 -1.0 NA
Table 111-4.-Government Heceipts and Expenditures. Quarterly, 1956-59
[Billions of dollars]
Federal Gove-rnment receipts ____ .. __ _
Personal tax <llld non tax recf•ipts_. Coq1orate profits tax accruals. _________ . Indirl'ct business tax and non tax uccruab_ Contributions for social insunlnce ______ _
Federal (~overnment expenditures ________ _
Purchases of goods and scrviees ________ _ Transfer payments _____ -·- ______________ _
To persons __________ ----------· ____ _ Foreign (m•t) ____________ -·- _____ . __ _
Grants-in-aid to State and local govern-nlents ________________________________ _ Net interest paid __________________ ... __ SubsiUies less current surplus of g:on•rn-
nwnt enterprises. ___________________ _
Surplus or deficit (-) on income and prod-uct account_ _____ _
State and local government tE'C'eipts _____ _
Personal tax and non tax receipt::; _______ . Corporate profits tax accruals __ ----~--llHiirect hnsincss tax and non tax <:tecruals_ Contributions for social in~nrance-~ .. Federal grants-in-aid ____ _
State and local government expenditures.
Pnrcha.St'S of goods and services ________ _ Transfer }Ja.yments to pf'rsons __ Net interest paid _______ ....... _______ _ Lt•ss: Current surplus of governnwnt
enterprises ________ _
Surplus or dcfirit (-) on incomE" and prod-uct account. ___ _
N .\--Not an1ilahlP.
I l!l5S I 1959
-~;T ;;; ~-~~:t-~-~~~-T-;;1-~--1957 1
I
1\J!'iS
77.51
%.21 20.2 11.6 10.6
81. nl 37.4
1
20.1 12.2 12.2
I 78.4 ss.sl :Jo. 7 3Y. 2 17.3 NA II. 9 12. fJ 12. 5 14.9
' I I I I I 1!!. 7! 20.2: I!!. 81 18.81 21.6 21.21 21.91 N A
9. 6 u. 711
!i. 4 i h. 01 9. "' 10. 9 9. g· 8. 9
~:~ ~:5 u1. trl g:~~ ~:~ ~:~ ~."t
3. 7 3. 51 2. 9 2. 3 4. 2 4. 1 3. 4 3. 2
71.8
4.1. 7 14. g 1:J. 5
79.5 87.4 90.9 20.8 21. s[ 22. s! 22.3 22.4 22.8 23. o 22. 9
12. n! 1a. 31 13. 5
1..1
4(1. 4 17.4 15.9
1.5
o2. 2 .53. s 21. 21 21.9 19. HI 20.31 1.3 1.5
12.51 5. 2 4. 8 .3
.1. 5, 5. 31 5. 2 13.4
5. () 5. 2
. 4
13. 6 13. 5 5. 5 5. a 5.1 4. (I
. 4 . 4
13.1 5. 5 5.1 .4
3. 3 .5. 2
4. 1 5.6
5. 4 5. 5
6. 5 6.1
1.0 1.4
5:~ ":~lj4:~
1.2 1.5 1.7 1.4 1.5 1.9 !.X L 4 1.-1 I. 4 1. 4 !. 5 !. 6 I. 7
2. 7 3. 0 :;. 1 3. 0 . 7 . 8 1.0 . 6 .6 . 8 .8 .~
5.7 2.4 -9.1 -2.1 -1.1 -1.7 -2.7 -3.5 -.7 1.4 -1.1 NA I
35.2 38.7 11.9 46.4 9.9 10.41 1o.6i
gl u 5:~ ~-,~ !.~~ 1.~~~ L~~ 24. I 25. 9 27. 2 29. 4 6 .. 51 B. 7 <3. 9
1
2. ()I· 2. 3 2. 7 3. o . 61 . 7 . 7 3. 3 4. I .5. 4 6. 5 1. Oi I. 21 I 5
:J5.7· 39.6 43.5 47.2 1o.oi 10.9! 11.2j a:l. 2 36. s 40. s H. I 9. 21 10.11 10 41
3. 7 ·1.1 4. 5 4. 8 1. 1 1 II 1. 11 .5 .6 .6 .7 .11 .21 2
1. 7 1. 9 2. 1 2. 3 . sl . 51 . 5
-.5i -1.01-1.61 -.91 -.11 -.5! -.51
II. 0
1.3 . 3
i.l .7
1.7
II. 5
10.7 1.2 .2
-.5
11.0
1.7
7:~1 . 7 1.4
10.9/
10.1 1.2 . 2
.6
.1
11.3 12.0
1.5 1.6 . 3 . 3
7.3 7. 5 . 8 . 8
!. 5 !. 9
11.8 12.1
11.0 11. 4 I. 2 1.2 • 2 . 2
.6 .6
-.5 -.2
NA
1.6 NA 7. 7 -~ L~
12.4
II.G 1.2 .2
.t3
NA
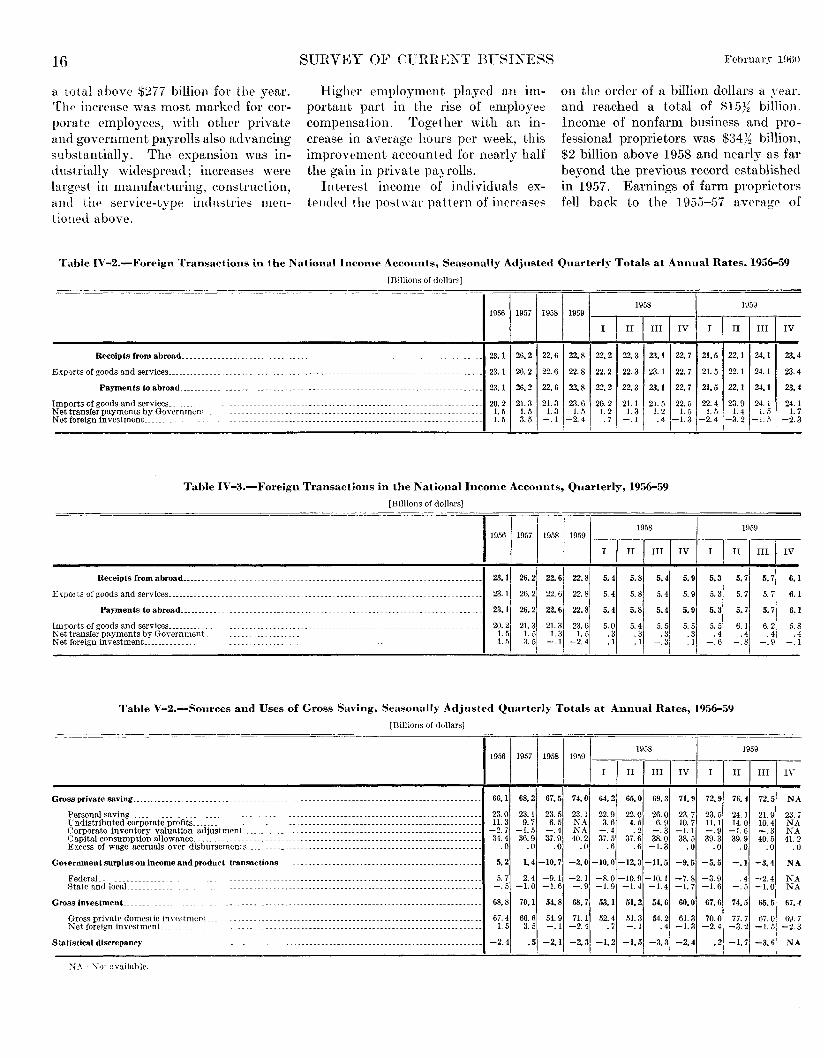
a total above $277 billion for the year. Tlw increase was most marked for corporate employees, with other private and government payrolls also advancing substantialJy. The expansion was industrially widespread; increases were largest in manufacturing, construction, and the service-type industries mentioned above.
SURVEY OF CURREXT BUSIXESS
Higher employment played an important part in the rise of employee compensation. Together with an increase in average hours per week, this improvement accounted for nearly half the gain in private payrolls.
Interest income of individuals extenc!Pd the postwar pattern of inerrascs
February 1000
on the order of a billion dollars a year. and reached a total of $15}f billion. Income of nonfarm business and professional proprietors was $34% billion. $2 billion above 1958 and nearly as far beyond the previous record established in 1957. Earnings of farm proprietors f('ll back to th(' 19.55-57 averag(' of
Table IV-2.-Foreign Transactions in the National Income Accounts, Seasonally Adjusted Quarterly Totals at Annual Rates, 1956-59
(Billions of dollars]
Receipts from abroad .. ____________ . _____________________ _
Exp·Jrts of goods and services ....
Payments to abroad __________ _
Imports of goods and services _______ .. __ Net transfer payments by Government_ N6t foreign investment. _________ _
1958 1959 1956 1957 1958 1959 1--..--.----r---1--r---.---.---
II I III I IV I I II I III IV I
at ~2 R6 R8 R2 R3 at R7 a5 Rt ~t
~1 a2 n6 n8 n2 n3 ~1 n1 n5 n1 ~1
at ~2 R6 R8 R2 R3 at R7 a5 Rt ~t
23.4
23.4
23.4
mz n3 m.3 ~6 mz n1 1.5 1.5 1.3 1.5 1.2 1.3 1.5 3.5 -.1 -2.4 .7 -.1
21. 5 22. 5 22. 4 23. 9 24. 1 24. 1 1.2 1.5 1.5 1.4 1.5 1.7 .4 -1.3 -2.4 -3.2 -1.5 -2.3
I
Table IV-3.-Foreign Transactions in the National Income Accounts, Quarterly, 1956-59
(Billions of dollars]
Receipts from abroad ..... .
E:q1orts of goods and services ____________ _
Payments to abroad __________ _
Imports of goods and services ___________ . Net transfer payments by Government._ Net foreign investment. ...... ______ ..
1958 1959 1956
I
195711958 1959 1--.---.--.....,---1----,,----,-----,---
I I II I III IV I I II I III
23.1 26.2 22.6 22.81
23. 1 26. 2 22. 6 22. 8
23. 1 26. 2 22. 6 22. 8
20.21 1.5 1.5
21.3 21.3 23.6 1. 5 1. 3 1. 5 3.5 -.1 -2.4
5.4
5. 4
5.4
5.0 .3 .1
5.8
5.8
5.8
5. 4 .3 . 1
5.4
5. 4
5.4
5. 5 .3
-.3
5.9
5. 9
5.9
5. 5 .3 .1
5.3
5. 3
5.3
5. 5 . 4
-.6
5.7
5. 7
5. 7
6.1 • 4
-.8
5. 7
5. 7
5. 7
6. 2 . 4
-.9
IV
6.1
6.1
6.1
5.8 .4
-.1
Table V-2.-Sources and Uses of Gross Saving, Seasonally Adjusted Quarterly Totals at Annual Rates, 1956-59
(Billions of dollars)
I 1957,1958
1958 1959 1--.--..---.--- ---.--.--.--
I I II I III IV I In I III
1959 1956
Grossprivatesaving ______________________________________________________________________________ -----·--- 66.t 68.2 67.5 74.0 64.2 65.0 69.3 71.9 72.9 76.4 72,5 NA
Personal saving ____________________________ .. ____ .. ___ . __ . _____ .. _____ . _____ . _______________________ . __ _ Undistributed corporate profits _____________ . ______ . ___ .. __ .. ------- .... __ ----- ..... --.----- ... ---.-- ... . Corporate inventory valuation adjustment. ____________ . _____ . __ ........... ___ ........ __ ---. __ --- __ .. . Capital consumption allowance ______________________________________ -----------------------------------Excess of wage accruals over disbursements _________________ -------------------------------------------
Govet'nment surplus on income and product transactions ____ -----------------------------------------------
Federal .. _________________ _ State and locaL _______ _
Gross investment _________ _
Gross private domestic in\'estment_ __ _ Net foreign investment._
Statistical discrepancy ___ _
~-\-Xot availahle.
23.0 11.3
-2.7 34.4
.0
23.1 9. 7
-1.5 36.9
.o
23.5 6.5 -.4 37.9
.o
23.1 NA NA 40.2
.0
22.9 3. 6
-.4 37.5
.6
22.0 4. 5 .2
37.6 .6
26.0 6. 9
-.3 38.0
-1.3
23.7 10.7
-1.1 38.5
.0
23.5 11.1 -.9 39.3
.o
24. 1 14.0
-1.6 39.9
.0
21.9 10.4 -.3 40.5
.0
23.7 NA NA 41.2
.0
5. 2 t.4 -to. 7 -3.0 -10.0 -t2.3 -11.5 -9.5 -5.5 -.t -3.4 NA
5.7 2.4 -9.1 -2.1 -8.0-10.9-10.1 -7.8 -3.9 .4 -2.4 NA -.5 -1.0 -1.6 -.9 -1.9 -1.4 -1.4 -1.7 -1.6 -.5 -1.0 NA
~8 ~t ~8 ~7 at ~2 ~6 •o ~6 U5 &5 ~4
67. 4 66. 6 54.9 71. 1 1.5 3.5 -.1 -2.4
52.4 . 7
R3 ~2 m.3 mo n1 ~o •• -.1 .4 -1.3 -2.4 -3.2 -1.5 -2.3
-2.4 .5 -2.1 -2.3 -1.2 -1.5 -3.3 -2.4 .2 -1.7 -3.6 NA
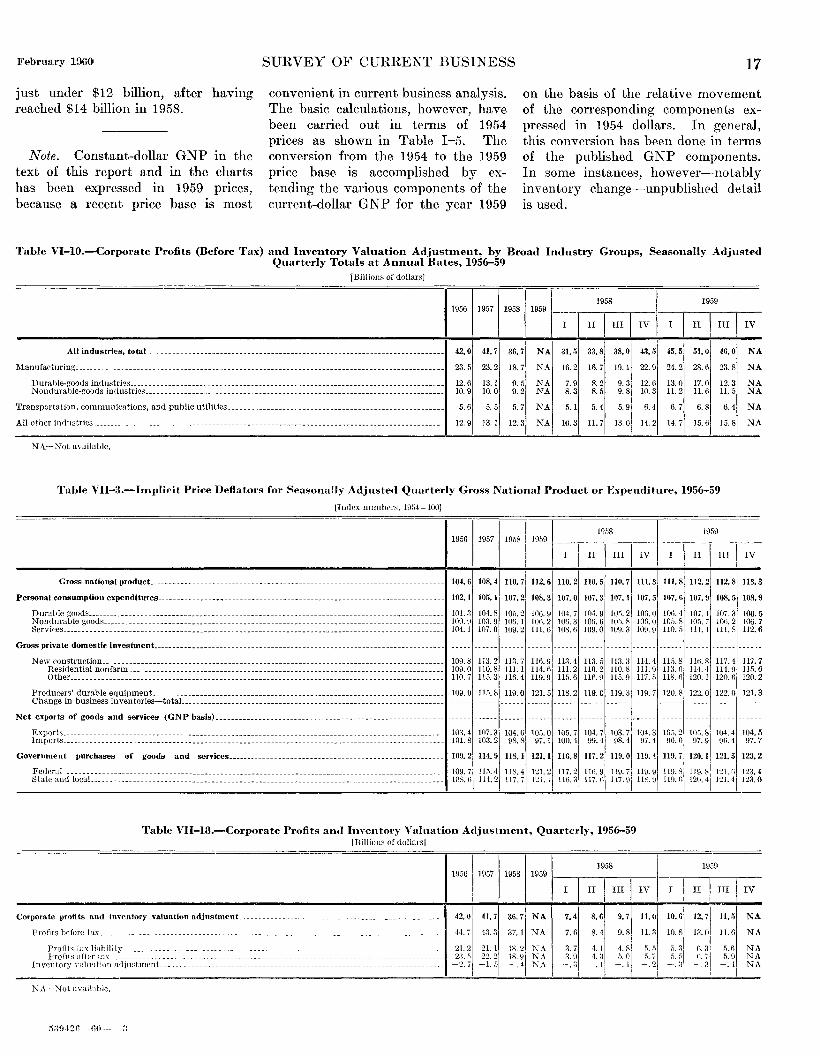
February 1960
just under $12 billion, after having reached $14 billion in 1958.
Note. Constant-dollar GNP in the text of this report and in the charts has been expressed in 1959 prices, because a recent price base is most
SURVEY OF CURRENT BUSINESS
convenient in current business analysis. The basic calculations, however, have been carried out in terms of 1954 prices as shown in Table I -5. The conversion from the 1954 to the 1959 price base is accomplished by extending the various components of the current-dollar GNP for the year 1959
17
on the basis of the relative movement of the corresponding components expressed in 1954 dollars. In general, this conversion has been done in terms of the published GNP components. In some instances, however-notably inventory change-unpublished detail is used.
Table VI-10.-Corporate Profits (Before Tax) and Inventory Valuation Adjustment, by Broad Industry Groups, Seasonally Adjustt"d Quarterly Totals at Annual Rates, 1956-59
[Billions of dollars]
1958 1959 1956 1957 1958 1959
II I III IV I I II I III IV
All industries, tota'---------------------------------------------------------------------------- 42.0 41.7 36.7 NA 31.5 33.8 38.0 43.5 45.5 51.0 46.0 NA
Manufacturing _____________ --------------------------------------------------------------------------------- 23. 5 23.2 18.7 NA 16.2 16.7 19. 1 22.9 24.2 28.6 23. 8 NA
Durable-goods industries________________________________________________________________________________ 12.6 13. 1 9. 5 N A 7. 9 8. 2 9. 3 12.6 13.0 17.0 I2. 3 NA Nondurable-goods industries____________________________________________________________________________ !0. 9 !0. 0 9. 2 NA 8. 3 8. 5 9. 8 !0. 3 11.2 II. 6 II. 5 NA
Transportation, communications, and public utilities_______________________________________________________ 5. 6 5. 5 5. 7 NA 5.1 5. 4 5. 9 6. 4 6. 7 6. 8 6. 4 NA
All other industries _______ _ 12.9 13.1 I2.3 NA 10.3 11.7 13.0 14.2 14.7 15.6 15.8 NA
NA-Not available.
Table VII-3.-Implicit Price Deflators for Seasonally Adjusterl Quarterly Gross National Product or Expenditure, 1956-59
[Index numbers, 10:i4~ 100]
1958 1959 1956 1957 1958 1959 1--,------,--------,--
I I II I III I IV -~T~~;~F Gross national product__ ______________________ --------------------_______________________________ 104. 6 108. 4 110.7 112.61110.21110.5 110. 7 111. 3!111. 81112.2 112.8 113.3
Personal consumption expenditures------------------------------------------------------------------------- 102.1 105.1 107.2 108.3 107.0 107.3 107.1 107.5 107.6• 107.9 108.5 108.9
Durable goods-------------------------------------------------------------------------- __ --------------- 101. 3 104.8 105.2 106. 9 104. 7 104. 9 105.2 !Ofl. 0 106. ·11107. I 107.3 106. 5 Nondurable goods ____________________________________________ ------------------_________________________ 100. 9 lo:l. 9 106. 1 106.2 106.3 !Ofl. 6 10.1. 8 106.0 100. 8 105. 7 106. 2 106. 7 Services ____________________________________________ -------------------------------------------------____ 104. I 107. 0 109.2 Ill. G 108.6 109.0 109. ~1 109.9 110. 5 Ill. I Ill.~ 112. 6
Gross private domestic investment_ ____________________________ --------------------- ______ ----------- ______ _
Ne\~~~fJ!~~f!io~;{arm:::::::::::::::::::::::::::::::::::::::::::::::::::::::::::::::::::::::::::::::: )g~: g m: § m: I ii~:% m: ~ iJU mj iiU m: ~ m: ~I iiU ilk~ Other _______________________________________________________________________________________________ 110.7 115.3 116.4 119.9 115.6 115.9 !1.1.9 117.5 118.fJ 120.1 120.6 120.2
Producers' durable equipment_ _______ ---------------------------------------------- _____ ------------___ 109. 0 115. 8 119.0 121. 5 118.2 119. 0 1!9. 3 1!9. 7 120.8 122. 0 122. 0 121.3 Change in business inventories-totaL----------------------------------------------------------------- ________________________ ------ _____ _
Net exports of goods and services (GNP basisl----------------------------------------------------------
Exports __________________ --------------------------------------------___________________________________ 103. 4 107.3 104. 6 105.0 105. 7 104.7 103. 7 104.3 105.2 105. 8 104.4 104.5 Imports _____ ------------------------------------------------------------------------------------------ 101.8 103.2 98.8 97.1 !00.4 99.4 98.4 97.4 96.0 97.9 96.•1 97.7
Government purchases of goods and services------------------------------------------------------- 109.2 114.9 118.1 121.1 116.8 117.2 119.0 1!9.4 119.7 120.1 121.5 123,2
Federal.. ___ -- _____________________________________ ------------------------------------_________________ 109. 7 11.5. 4 118.4 121.2 117. 2 1lfi. 9 119. 7 119. 9\119. 8 119. 8
1
121. nl 123. 4 State and locaL ____ . ___________________________________________________________________________________ 10S.6 111.2 117.7
1
121.111H\.:l 117.6 117.9 11~.9 119.fi 120.4 121.4[123.0
Table VII-13.-Corporate Profits and Inventory Valuation Adjustment, Quarterly, 1956-59 [Billions of dollars]
1959 1958 I 1958
1959,--.---.-------.---I---.---,--------,--
I I n lrn IV I n I nr IV
Corporate profits and inventory valuation adjustment_ ________________ _
Profits before tax __________________ .. _________ ------ ___________________ _
Pro fils tm liability _____________ .. Profit;;; nfter tnx_ ___ -----·. ---·
inventory v81Lr1tion adjustment ____ .
N·A-Not uvculaLle.
42.0 -11.7 36.7 NA
44.7 4:1.3 37.1 NA
21.2 21. I 2:l . .0 22.2 -~. 7 -1.0
!R.2 NA JR.~ NA -.1
1
NA
7.4
7. 6
3. 7 3. g -.:>
8.6
8.·1
4.1 4.:J .I
9. 7 11. 0 10. 6
9. 8 11. 3 10. 8
4.8 fi. 0
-.1
fi. 5 .1. 7
-.2 I
11.5
II. 6
5.6 5. 9
-.1
NA
NA
NA NA NA
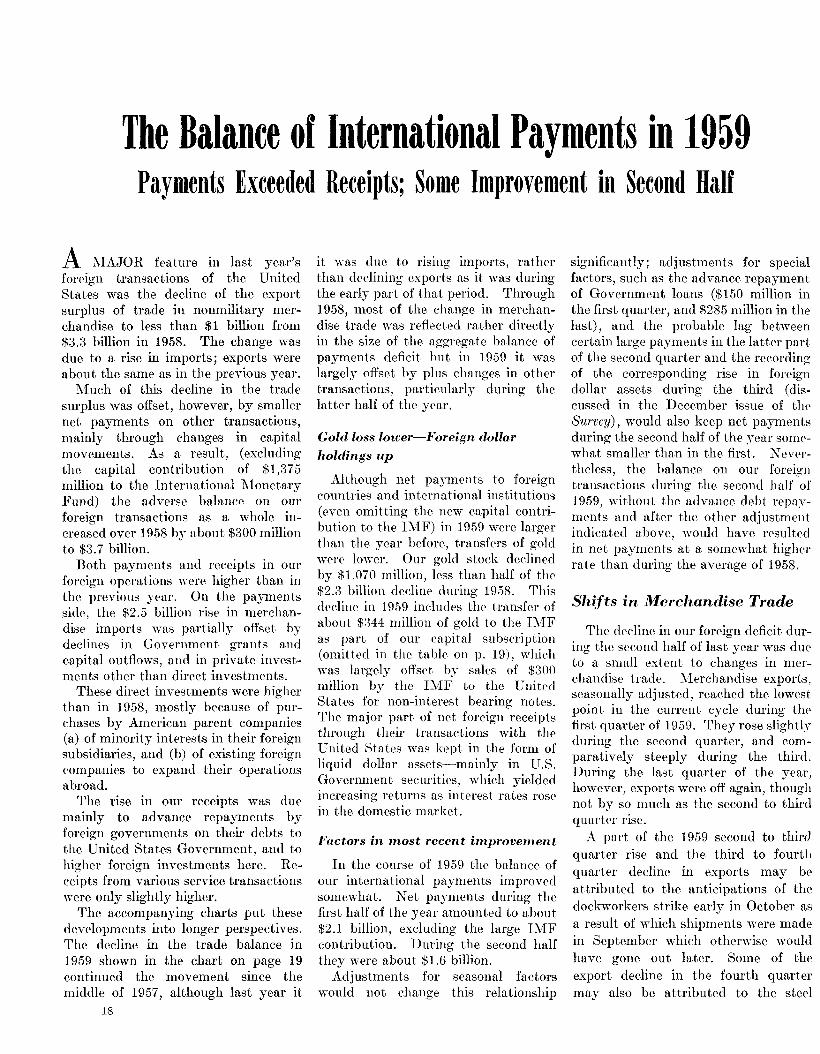
The Balance of International Payments in 1959 Payments Exceeded Receipts; Some Improvement in Second Half
A _:...rAJOR feature in last year's foreign transactions of the United States was the decline of the export surplus of trade in nonmilitary merchandise to less than $1 billion from $3.3 billion in 1958. The change was due to a rise in imports; exports were about the same as in the previous year.
Much of this decline in the trade surplus was offset, however, by smaller net payments on other transactions, mainly through changes in capital movements. As a result, (excluding the capital contribution of $1,375 million to the International Monetary Fund) the adverse balance on our foreign transactions as a whole increased over 1958 by about $300 million to $3.7 billion.
Both payments and receipts in our foreign operations were higher than in the previous year. On the payments side, the $2.5 billion rise in merchandise imports was partially offset by declim's in Government grants and capital outflows, and in private investments other than direct investments.
These direct investments were higher than in 1958, mostly because of purchases by American parent companies (a) of minority interests in their foreign subsidiaries, and (b) of existing foreign eompanies to expand their operations abroad.
The rise in our receipts was due mainly to advance repa:yments by foreign governments on their debts to the United States Government, and to higher foreign investments here. Receipts from various service transactions were only slightly higher.
The accompanying charts put these developments into longer perspectives. The decline in the trade balance in 1959 shown in the chart on page 19 continued the movement since the middle of 1957, although last year it
18
it was due to r1smg imports, rather than declining exports as it was during the early part of that period. Through 1958, most of the change in merchandise trade was refleeted rather directly in the size of the aggregate balance of payments deficit but in 1959 it was largely offset by plus changes in other transactions, particularly during the latter half of the year.
Gold loss lower-Foreign dollar
holdings up
Although net payments to foreign countries and international institutions (even omitting the new capital contribution to the HdF) in 1959 were larger than the year before, transfers of gold were lower. Our gold stock declined by $1,070 million, less than half of the $2.3 billion decline during 1958. This deeline in 1959 includes the transfer of about $044 million of gold to the lMF as part of om capital subscription ( omittt'd in the table on p. 19), which was largely offset b~· sah•s of $300 million by the IMF to the G llited States for non-interest bearing notes. The major part of net foreign receipts through their transactions with tl1e United States was kept in the form of liquid dollar assets-mainly in U.S. Government secmities, which yielded increasing returns as interest rates rose in the domestic market.
Factors in 1nost recent improvenwnt
In the course of 1959 the balance of our international payments improved so mew hat. Net payments during the first half of the year amounted to about $2.1 billion, excluding the large IMF contribution. During the second half they were about $1.6 billion.
Adjustments for seasonal factors would not change this relationship
significantly; adjustments for special factors, such as the advance repayment of Government loans ($150 million in the first quarter, and $285 million in the last), and the probable lag between certain large payments in the latter part of the second quarter and the recording of the corresponding rise in foreign dollar assets during the third (discussed in the December issue of the SuTvey), would also keep net payments during the second half of the year somewhat smaller than in the first. 1'\ evertheless, the balance on our foreign transactions during the second half of 1959, without the advance debt repayments and after the other adjustment indicated above, would have resulted in net payments at a somewhat higher rate than during the average of 1958.
Shifts in Merchandise Trade
1'he decline in our foreign deficit during the second half of last year was due to a small extent to changes in merchandise trade. :Merchandise exports, seasonally adjusted, reached the lowest point in the current cycle during the first quarter of 1959. They rose slightly during the second quarter, and comparatively steeply during the third. During the last quarter of the year, however, exports were off again, though not by so much as the second to third quarter rise.
A part of the 1959 second to thinl quarter rise and the third to fourth quarter decline in exports may be attributed to the anticipations of the dockworkers strike early in October as a result of which shipments \vere made in September which otherwise would have gone out later. Some of the export decline in the fourth quarter may also be attributed to the steel
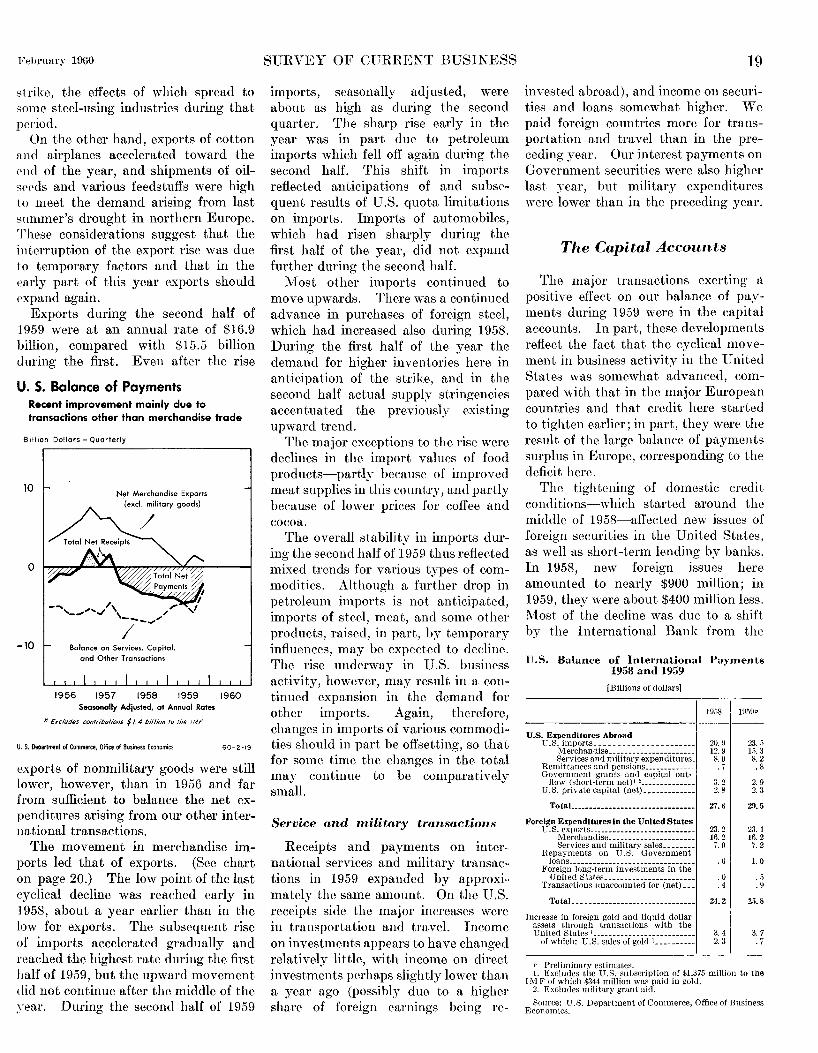
FebrnalT 1960
st rikc, the effects of which spread to some steel-using industries during that period.
On the other hand, exports of cotton and airplanes accelerated toward the c•nd of the year, and shipments of oilscPds and various feedstuffs were high to meet the demand arising from last summer's drought in northern Europe. These considerations suggest that the interruption of the export rise was due to temporary factors and that in the early part of this year exports should Pxpand again.
Exports during the second half of 1959 were at an annual rate of $16.9 billion, compared with $15.5 billion during the first. Even after the rise
U. S. Balance of Payments Recent improvement mainly due to transactions other than merchandise trade
Billion Do!lors- Quarterly
10
0
N~t Merchandise Exports (excl. military goods)
---,_ .... ~ ... .,//\ /
'---_,"" /
-10 Balance on Services, Capital, and Other Transactions
1956 1957 1958 1959 Seasonally Adjusted, ot Annual Roles
·Jt Excludes contributions $1.4 billion to the IMF
U. S. Department of Commerce, Office of Business Economics
1960
60-2-19
exports of nonmilitary goods were still lower, however, than in 1956 and far from sufficient to balance the net expenditures arising from our other international transactions.
The movement in merchandise imports led that of exports. (See chart on page 20.) The low point of the last eyclical decline was reaehed early in 1958, about a year earlier than in the low for exports. The subsequent rise of imports accelerated gradually and reached the highest rate during the first half of 1959, but the upward movement did not continue after the middle of the year. During the seeond half of 1959
SURVEY OF CURRENT BUSINESS
imports, seasonally adjusted, were about as high as during the second quarter. The sharp rise early in the year was in part due to petroleum imports which fell off again during the second half. This shift in imports reflected anticipations of and subs('quent results of U.S. quota limitations on imports. Imports of automobiles, whieh had risen sharply during the first half of the year, did not expand further during the second half.
Most other imports continued to move upwards. There was a continued advance in purchases of foreign steel, which had increased also during 1958. During the first half of the year the demand for higher inventories here in anticipation of the strike, and in the second half aet.ual supply stringencies aecentuated the previously existing upward trend.
The major exceptions to the rise were deelines in the import values of food products-partly because of improved meat supplies in this country, and partly because of lower prices for coffee and cocoa.
The overall stability in imports during the second half of 1959 thus reflected mixed trends for various types of commodities. Although a further drop in petroleum imports is not anticipated, imports of steel, meat, and some other products, raised, in part, by temporary influences, may be expected to decline. The rise underway in U.S. business activity, however, may result in a continued expansion in the demand for other imports. Again, therefore, changes in imports of various eommodities should in part be offsetting, so that for some time the changes in the total may continue to be comparatively small.
Service and military transactions
Receipts and payments on international serviees and military transactions in 1959 expanded by approximately the same amount. On the U.S. receipts side the major increases were in transportation and travel. Income on investments appears to have ehanged relatively little, with income on direct investments perhaps slightly lower than a year ago (possibly due to a higher share of foreign earnings being re-
19
invested abroad), and income on securities and loans somewhat higher. We paid foreign countries more for transportation and travel than in the preceding year. Our interest payments on Government seeurities were also higher last year, but military expenditures were lower than in the preceding year.
The Capital Accounts
Tlw major transactions exerting tt
positive effect on our balance of payments during 1959 were in the capital accounts. In part, these developments refleet the fact that the cyclical movement in business activity in the United States was somewhat advanced, compared with that in the major European eountries and that credit here started to tighten earlier; in part, they were the result of the large balance of payments surplus in Europe, corresponding to the defieit here.
The tightening of domestic credit conditions-which started around the middle of 19.58-afi'ected new issues of foreign securities in the United States, as well as short-term lending by banks. In 1958, new foreign issues here amounted to nearly $900 million; in 1959, they were about $400 million less. Most of the decline was due to a shift by the International Bank from the
U.S. Balance of International Payments 1958 and 1959
[Billions of dollars]
·----------~~~ 1959P
U.S. Expenditures Abroad U.S. imports _______________ -------
Merchandise _____________________ _ Services and n1ilitary expenditures_
Re1nittances and pensions ____________ _ Government grants and capital out
flow (short-term net)' '--------------U.S. private capital (net) ____________ _
Tota'--------------------------------
Foreign Expenditures in the United States U.S. exports ______ ---------------------
]\11 erchandise ___________________ ---Services and military sales _______ _
Hepayments on U.S. Government loans .. ___ ------- _________ -----------
Foreign long-term investments in the United States ______________________ _
Transactions unaccounted for (net) __ _
TotaL __ ._·-·-·---------------------
Increase in foreign gold and liquid dollar assets through transactions with the Vnited States 1-------------------------
of which: U.S. sales of gold'----------
v Preliminary estimates.
:!O.!J 23.5 12.9 l.). 3 8. 0 8. 2 . i .8
3. 2 2. 9 2. 8 2. 3
27.6 29.5
23.2 2:3.4 16.2 16.2
7. 0 7. 2
.ti I 1.0
.0 . ,)
. 4 .9
24.2 2.'),8
3. 4 3 -,{ 2. 3 . 7
1. Excludes the U.S. subscription of $1,375 million to the IM F of which $344 million was paid in gold.
2. Excludes military grant aid.
Source: U.S. Department of Commerce, Office of Business Economics.
20
United States to Europe as a source of new capital.
The net outflow of short-term banking funds dropped from about $340 million in 1958 to around $100 million in 1959. Medium-term bank loans were also somewhat less in 1959 than a year earlier. Another factor contributing to the reduction in the outflow of U.S. capital was the decline-particularly after the middle of 1959-in U.S. purchases of foreign stocks (other than those representing direct investments).
In 1958, our net expenditures on foreign stocks were well over $300 million; in 1959, they were probably not much more than $200 million, and these were concentrated during the first 5 months of the year. The comparative advances in foreign and U.S. stock prices substantially reduced the differences between yields here and abroad on comparable securities, and thus operated to dampen stock purchases abroad.
Foreign Trade Exports started up again in 1959 while imports stabilized
Billion Dollars-Quarterly
30
Exports (excl. military goods)
20
...... ..-"* t __ .__... / .. .,. __ tf/1'
10 Imports
0 1956
Seasonally Adjusted, at Annual Rates
U. S. Department of Commerce, Office of Business Economics
1960
60-2-18
SURVEY OF CURRENT BUSINESS
A major element in the shift in capital movements from 1958 to 1959 was the resumption of foreign long-term investments here-mainly through purchases of stocks-and the advance repayments by foreign governments of long-term debts to the U.S. Government. Togethrr, these two items increased U.S. rrcPipts in the balance of payments in 1959 by nearly $1 billion.
Foreign purchases of U.S. corporate securities had declined in 1957, partly as a result of restrictions imposed in some European countries during the financial crisis earlier in that year. In 1958, fon•ign salrs exceeded purchases by about $40 million. Starting in the latter part of 1958, foreign purchases increased again, and net foreign purchases of U.S. corporate securities in 1959 may be estimated at about $400 million. This was more than in any other postwar year.
The rise reflects in part the liberalization of Em·opean rrstrictions on capital transaetions, which was made possible by the substantial increase in European gold and dollar holdings during 1958 and 1939.
The improved reserve position abroad also made possible the advance repayments on foreign debts. The total of such payments was $4:35 million, including $150 million from Germany, $250 million from the United Kingdom, about $25 million from France, and $10 million from Mexieo.
Current position of United States
The large rise in gold and dollar holdings of the major foreign industrial countries during 1958 and 1959 enabled them to continue the dismani1ing of restrictions on their foreign transactions, particularly those with the dollar
February 196{1
area. It also made possible the acceleration of economic activity abroad at a more rapid pace than would have been likely if they had to cope with less favorable balance of payments comlitions.
At the end of 1959, business in other industrial countries-as in the United States-was moving forward, and in some countries and industries it was approaching capacity operations. This should-as may be inferred from previous experiences-tend to improve the trade balaneC' of the United States. The rise in foreign business, however, has as in our case also resultC'd in a tightening of credit in the major foreign countries. Karrowing the differC'nces in the supply situation for credit between the United States and major foreign capital markets may change the effects which capital movements had on our balance of payments in 1959.
The tightening of credit. abroad would appear to make less likely a repetition of the developments in 1956 and 1957 when the rise in foreign demand ''.-as speeded up b~, inflationary credit expansion. Tl1is wa.s one of the major factors then aecelerating the growth in our exports which contributed to the temporary balancing of our forPign receipts and payments at that timC'.
A further rise in foreign business activity in combination with certain special factors currently stimulating U.S. exports may he expected to have a beneficial effect on our balance of payments. Part of the necessary improvement in our foreign accounts, however, will still depend upon the strengthening of our position in international trade by private efforts, and on the effects of various measures already taken or under consideration by the Government for the purpose of achieving this end.
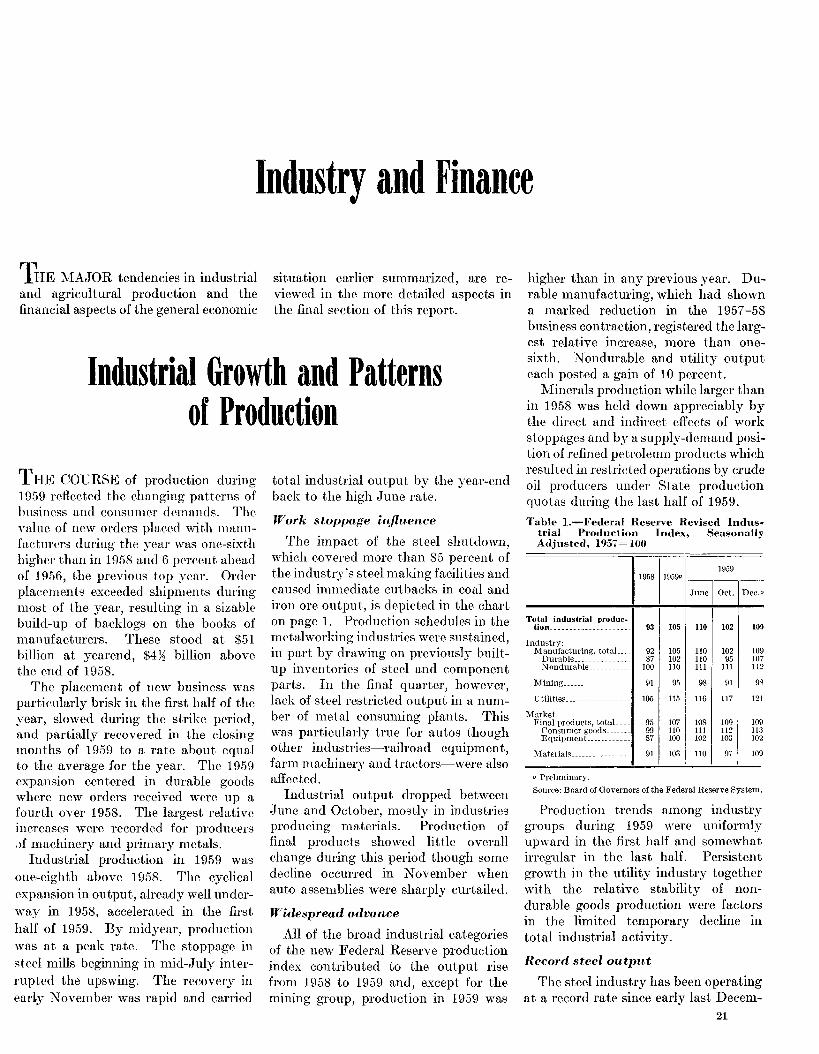
Industry and Finance
THE MAJOR tendencies in industrial and agricultural production and the financial aspects of the general economic
situation earlier summarized, are reviewed in the more detailed aspects in the final section of this report.
Industrial Growth and Patterns of Production
THE COURSE of production during 1959 reflected the changing patterns of business and consumer demands. The value of new orders placed with manufacturers during the year was one-sixth higher than in 1958 and 6 percent ahead of 1956, the previous top year. Order placements exceeded shipments during most of the year, resulting in a sizable build-up of backlogs on the books of manufacturers. These stood at $51 billion at yearend, $4~~ billion above the end of 1958.
The placement of new business was particularly brisk in the first half of the year, slowed during the strike period, and partially recovered in the closing months of 1959 to a rate about equal to the average for the year. The 1959 expansion centered in durable goods where new orders received were up a fourth over 1958. The largest relative increases were recorded foe producers ,)f machinery and primary metals.
Industrial production in 1959 was one-eighth above 1958. The cyclical expansion in output, already well underway in 1958, accelerated in the first half of 1959. By midyear, production was at a peak rate. The stoppage in steel mills beginning in mid-July interrupted the upswing. The recovery in early November was rapid and carried
total industrial output by the year-end back to the high June rate.
Work stoppage influence
The impact of the steel shutdown, which covered more than 85 percent of the industry's steel making facilities and caused immediate cutbacks in coal and iron ore output, is depicted in the chart on page 1. Production schedules in the metalworking industries were sustained, in part by drawing on previously builtup inventories of steel and component parts. In the final quarter, however, lack of steel restricted output in anumber of metal consuming plants. This was particularly true for autos though other industries-milroad equipment, farm machinery and tractors-were also affected.
Industrial output dropped between June and October, mostly in industries producing materials. Production of final products showed little overall change during this period though some decline occurred in November when auto assemblies were sharply curtailed.
Widespread advance
All of the broad industrial categories of the new Federal Reserve production index contributed to the output rise from 1958 to 1959 and, except for the mining group, production in 1959 was
higher than in any previous year. Durable manufacturing, which had shown a marked reduction in the 1957-58 business contraction, registered the largest relative increase, more than onesixth. Non durable and utility output each posted a gain of 10 percent.
Minerals production while larger than in 1958 was held down appreciably by the direct and indirect effects of work stoppages and by a supply-dC'mand position of refined petroleum products which resulted in restricted operations by crude oil producers under State production quotas during the last half of 1959.
Table I.-Federal Heserve Hevised Industrial Production Index, Seasonally Adjusted, 1957=100
Total industrial produc-tion _____________________
Industry: Manufacturing, totaL._
Durable ... -----------Nondurable ___
Mining __________________
Utilities ______ --- ________
Market: Final products, totaL ___
Consumer goods _______ Equipment_ ___________
Matnia]s ___________ . ____
P Preliminary.
1959 J958 J959P ---,--,-
June I Oct.[ Dec.P
93 105 110 102 109
92 105 110 102 109 87 102 110 9.1 107
100 110 Ill Ill 112
91 9.1 98 91 98
105 115 116 117 121
95 107 108 109 109 99 110 111 112 113 87 100 102 103 102
91 103 110 97 109
Source: Board of Governors of the Federal Reserve System.
Production trends among industry groups during 1959 were uniformly upward in the first half and somewhat irregular in the last half. Persistent growth in the utility industry together with the relative stability of nondurable goods production were factors in the limited temporary decline in total industrial activity.
Record steel output
The steel industry has been operating at a record rate since early last Deeem-
21
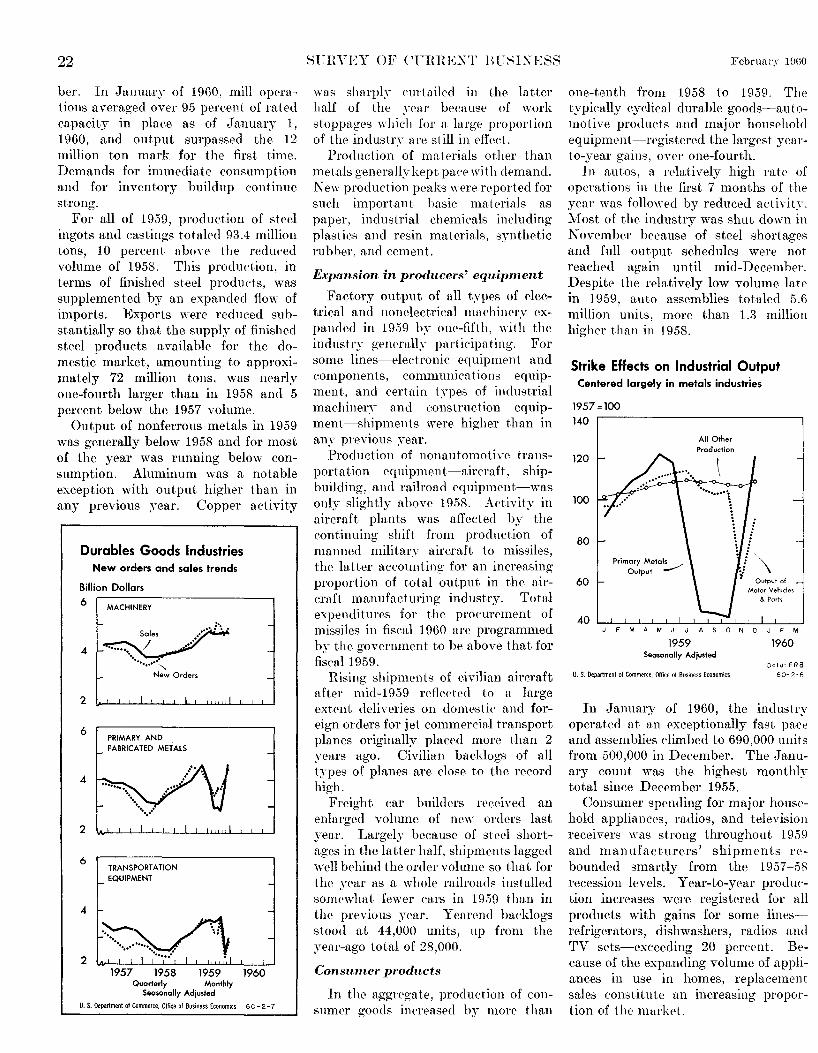
22
her. In January of 1960, mill opPrations averaged over 95 percent of rated capacity in place as of January 1, 1960, and output surpassed the 12 million ton mark for the first time. Demands for immediate consumption and for inventory buildup continue strong.
For all of 1959, production of steel ingots and castings totaled 93.4 million tons, 10 percent aboye the reduced volume of 1958. This production, in terms of finished steel products, wa.s supplemented by an expanded flow of imports. Exports were reduced substantially so that the supply of finished steel products available for the domestic market, amounting to approximately 72 million tons, was nearly one-fourth larger than in 1958 and 5 percent below the 1957 volume.
Output of nonferrous metals in 1959 was generally below 1958 and for most of the year was running below consumption. Aluminum vms a notable exception with output higher than in any previous year. Copper activity
Durables Goods Industries New orders and sales trends
Billion Dollars
6 MACHINERY
4
2
6
4
2
6
4
I L
PRIMARY AND FABRICATED METALS
TRANSPORTATION r EQUIPMENT
.I
~ 2 I •••••• I ",1
1957 1958 1959 Quarterly Monthly
Seasonally Adjusted
-
-
-
-
-
1960
U. S. Department of Commerce, Office of Business Economics 6 0 - 2- 7
:-iCHVEY OF <THHEXT IHJ~IXESS
was sharply curtailed in the latter half of the year because of work stoppages which for a large proportion of the industr~' are still in pffect.
Production of materials other than metals generally kept pace with demand. New production peaks were reported for such important basic materials as paper, industrial chemicals including plastics and resin materials, synthetic rubber, and cement.
Expansion in producers' equipment
Fa.ctory output of all types of electrical and nonelectrical machinery expanded in 1959 h~' one-fifth, with the industry generall~, participating. For some lines-electronic equipment and components, communications equipment, and certain types of industrial machiner~, and construction equipment-shipments were higher than in a.ny prevwus year.
Production of nonautomotiYe transportation equipment-aircraft, shipbuilding, and railroad equipment-was only slightly above 1958. Activity in aircraft plants was affected by the continuing shift from production of manned military aircraft to missiles, the latter accounting for an increasing proportion of total output in the aircra.ft manufacturing industry. Total expenditures for the procurement of missiles in fiscal 1960 are programmed by the government to he above tha.t for fiscal 1959.
Rising shipments of civilian aircraft after mid-1959 reflected to a large extent deliveries on domestic and foreign orders for jet commercial transport planes originally placed more than 2 years ago. Civilian backlogs of all types of planes are close to the record high.
Freight car builders rcceiYed an enlarged volume of new orders last year. Largely because of steel shortages in the latter half, shipments lagged well behind the order volume so that for the yt>ar as a whole railroads installed some,vhat fewer cars in 1959 than in the previous year. Yearend backlogs stood at 44,000 units, up from the year-ago total of 28,000.
Consumer products
In the aggregate, production of consumer goods in('reased by more than
February lDGO
one-tenth from 1958 to 1959. The typically cyclical durable goods-automotive products and major household equipment-registered the largest yearto-year gains, over one-fourth.
In autos, a relatively high rate of operations in the first 7 months of the year was followed by reduced activity. Most of the industry was shut down in November because of steel shortages and full output schedules were not reached again until mid-December. Despite the relatively low volume late in 1959, auto assemblies totaled 5.6 million units, more than 1.3 million higher than in 1958.
Strike Effects on Industrial Output Centered largely in metals industries
1957=100 140
1959
All Other Production
Seasonally Adjusted
U. S. Department of Commerce, Office of Business Economics
1960
Data: FRS 60-2-8
In January of 1960, the industry operated at an exceptionally fast pace and assemblies climbed to 690,000 units from 500,000 in December. The January count was the highest monthly total since December 1955.
Consumer spending for major household appliances, radios, and television receivers was strong throughout 1959 and ma.nufacturers' shipments rebounded smartly from the 1957-58 recession levels. Year-to-year production increases were registered for all products with gains for some linesrefrigerators, dishwashers, radios and TV sets-exceeding 20 percent. Brcause of the expanding volume of appliances in use in homes, replacement sales constitute an increasing proportion of the market.
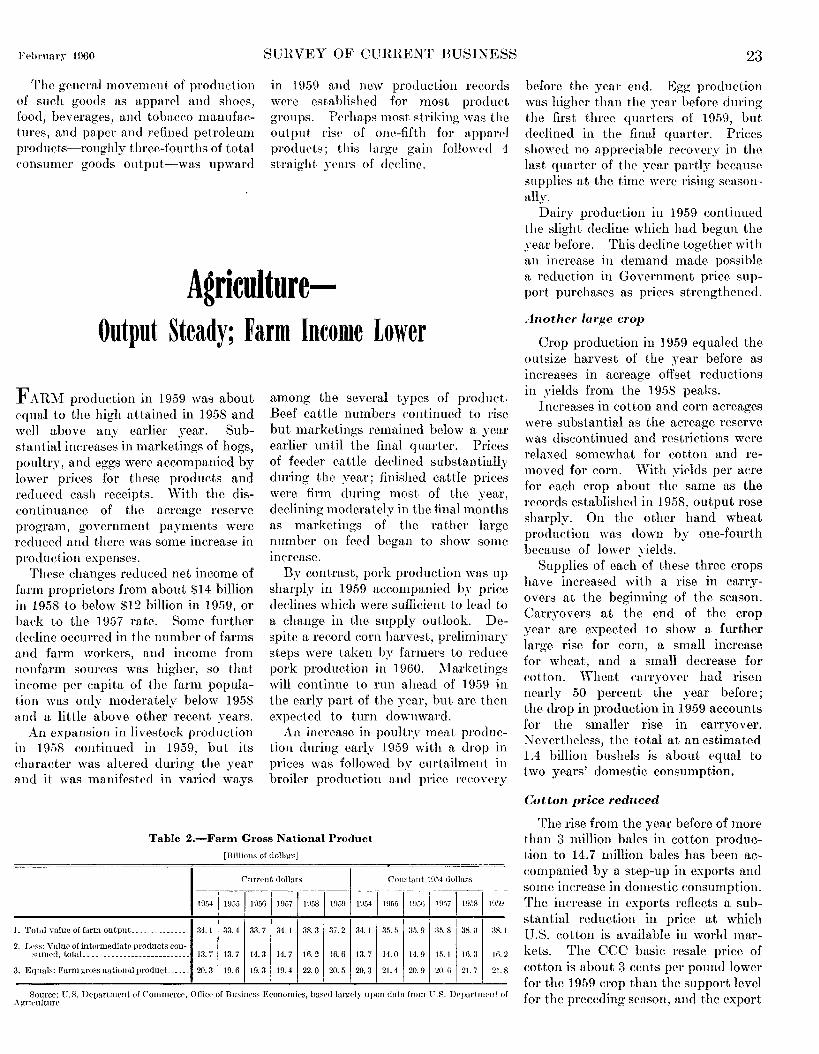
FPhrnary 1!)(;0
'l'he general movement of production of such goods as appart>l and shoes, food, beverages, and tobacco manufactures, and paper and refined petroleum produets-roughly three-fourths of total consumer goods output-was upward
SUHVEY OF CUHHENT BUSINESS
in 19.59 and new produetion records were established for most product groups. Perhaps most striking was the output rise of on~~-fifth for apparPl products; this large gain follow(•d 4 straight .Fars of decline.
Agri~ulture-Output Steady; Farm Income Lower
FARM production in 19.59 was about equal to the high attained in 19.58 and well above any earlier year. Substantial inerea.ses in marketings of hogs, poultry, and eggs were accompanied by lower prices for these products and reduced cash receipts. With the diseontinuancc of the acreage reserve program, government payments were reduced and there was some inerease in production expenses.
These changes reduced net income of farm proprietors from about $14 billion in 19.58 to below $12 billion in 19.59, or hack to the 19.57 rate. Some further (kdine occurred in the number of farms and farm workers, and income from Jll•nfarm sources was higher, so that income per capita of the farm population was only moderately below 19.58 and a little above other recent years.
An expansion in livestoek production in 19.58 continued in 19.59, but its character was altered during the year and it was manifested in varied ways
among the several types of product. Beef cattle numbers continued to rise but marketings remained below a year earlier until the final quarter. Prices of feeder cattle declined substantially during the year; finished cattle prices were firm during most of the year, declining mo(lerately in the final months as marketings of the rather large number on feed began to show some mcrease.
By contrast, pork production \\'as up sharply in 19.59 aecompanied b_,, price declines which were suffieient to lead to a change in the supply outlook. Despite a record corn harvest, preliminary steps were taken by farmers to reduce pork production in 1960. ::VIarketings will continue to run ahead of 19.59 in the early part of the year, but are then expected to turn downward.
An increase in poultry meat production during early 1959 with a drop in priees was followed by eurtailment in broiler produetion and price n'rovPry
Table 2.-Farm Gross National Product
[Billions of uollar"J
Current dollars Constant HJ.\4 dollars
1. Total value of farm output_ ... _._ 34. I 33. 4 33. 7 34. I 38. 3 3i. 2 34. I 35. 5 35. 9 :l.l. 8 I 38 0 38. I
2. Less: Value of intt•rmeuiatc products con· snmcd,totaL .......... ----·-----·-·--- 13.7 13.7 14.3 14.7 16.2 16.6 13.7 14.0 14.9 IS.! 16.3 16.2
3. Eqnals:Farmgrossuationalproduct .. --·- 20.3 19.6 19.3 19.4 22.0 20.5 20.3 21.4 20.9 20.li 21.7 21.8
Sourrr: C.S. DepartmC>nt of C'Ollllllt'l'C{\ Officf• of Bnsint)SS F.conomies, basrd hll'J!Ply upon data from r.s. l)ppnrtnwnt of .:\ gri(·ulturc
23
before the y<'ar end. Egg production was higher than the year before during the first three quarters of 19.59, but deelined in the final quarter. Prices showed no appreeiable reeovery in the last quarter of the year partly becausP ;;upplies at the time were rising seasonally.
Dairy produetion in 1959 continued the slight decline which had begun the year before. This deeline together with an increase in demand made possible a reduction in Government price support purchases as prices strengthened.
Another large crop
Crop production in 19.59 equaled the outsize harvest of the year before as inereases in aereage offset reduetions in yields from the 19.58 peaks.
Increases in cotton and eorn aereages were substantial as the acreage reserve was discontinued and restrietions were relaxed somewhat for cotton and removed for eorn. vVith yields per acre for each crop about the same as the records established in 19.58. output rose sharply. On the other hand wheat production was down by one-fourth because of lower ~'ields.
Supplies of each of these three erops have increased with a rise in carryovers at the beginning of the season. Carryovers at the end of the crop year are expected to show a further large rise for corn, a small inerease for wheat, and a small decrease for cotton. 'Vheat calT.YOYPr had risen nearly 50 pereent the year before; the drop in production in 19.59 accounts for the smaller rise in carryover. N everthclcss, the total at an estimated 1.4 billion huslwls is about equal to two years' domestic. consumption.
Cotton price reduced
The rise from the year before of more than 3 million bales in eotton production to 14.7 million bales has been aeeompanied by a step-up in exports and some increase in domestie eonsumption. The increase in exports refleets a substantial reduction in price at which U.S. eotton is availa.ble in world markets. The CCC basic resale price of cotton is about 3 cents per pound lower for the 19.59 crop than the support level for the preceding sc·ason, and the export
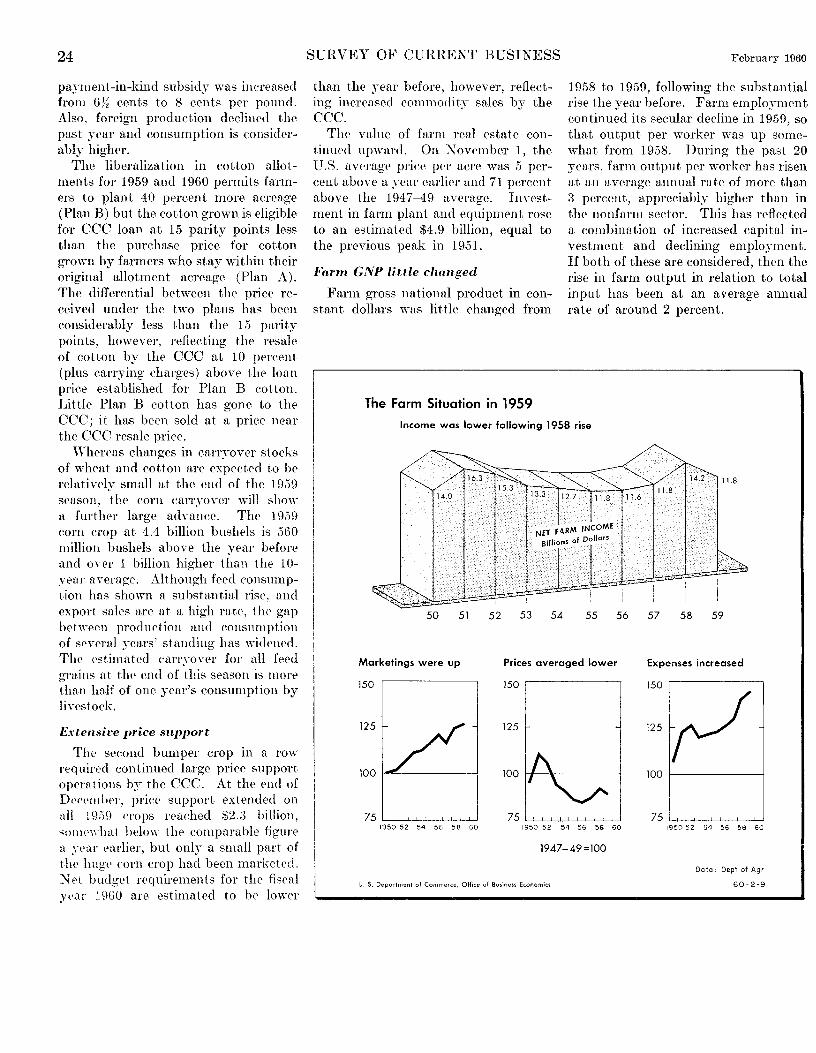
24
payment-in-kind subsidy was inereased from 6% cents to 8 cents per pound. Also, foreign production declined the past year and consumption is considerably higher.
The liberalization in cotton allotmen ts for 1959 and 1960 permits farmers to plant 40 percent more acreage (Plan B) but the cotton grown is eligible for CCC loan at 15 parity points less than the purchase price for cotton grown by farmers who stay within their original allotment acreage (Plan A). The differential between the price received under the two plans has been considerably less than the 15 parity points, however, reflecting the resale of cotton by the CCC at 10 pereent (plus carrying charges) abon' the loan price established for Plan B cotton. Little Plan B cotton has gone to the CCC; it has been sold at a price near the CCC resale price.
\Vhereas changes in carryover stocks of wheat and cotton are expected to be relatively small at the end of the 1959 season, the corn carryover will show a further large advance. The 1959 corn crop at 4.4 billion bushels is 560 million bushels above the year before and onr 1 billion higher than the 10-_yenr average. Although feed eonsumpt.ion has shown a substantial rise, ancl export sales are at a high rate, the gap b0tween production and consumption of several years' standing has widened. The estimated earryover for all feed grains at the end of this season is more than half of one year's consumption by livestock.
Extensit'e price support
The second bumper crop in a row required continued large price support operations by the CCC. At the end of D<'C('mher, price support extended on nll 1909 crops rPaehed $2.3 billion, somewhat lwlow the eomparnbll' figure a year l'arlier, but only a small part of the hug<' rorn crop had been marketed. N t't budget n'qnirements for th<' fiscal Jl'lH 1960 are estimatC'd to be lowPr
SURVEY OF CURRENT BUSINESS
than the year before, however, reflecting increased commodity sales by the CCC.
The value of fnrm real estate continued upward. On 1'\ovember 1, the U.S. average price per acre was 5 percent above a ~~enr earlier and 71 percent above the 1947-49 average. Investment in farm plant and t>quipment rose to an estimated $4.9 billion, equal to the previous peak in 1951.
Farm GNP little changed
Farm gross 1mtional product in const.ant dollars was little changed from
The Farm Situation in 1959
February 1960
1958 to 1959, following the substantial rise the year before. Farm employment continued its secular decline in 1959, so that output per worker was up somewhat from 19.'58. During the past 20 years, farm output per workPr has risen at an average annual rate of more than 3 percent, appreciably higher than in the nonfarm sector. This has reflected a combination of increased capital investment and declining employment. If both of these are considered, then the rise in farm output in relation to total input has been at an average annual rate of around 2 percent.
Income was lower following 1958 rise
~.
50 51 52
Marketings were up
150
125
100
53
NET F4.RM iNCOME Billions of Dollars
54 55 56
Prices averaged lower
150
1251
100
75 ~~--'-'--'-~~~ 1950 52 54 56 56 60
1947-49=100
U. S. Department of Commerce, Off1ce of Business Economics
11.8
57 58 59
Expenses increased
150 I
125rJ 100
1950 ''2 54 56 5tl 60
Data, Dept of Agr
60- 2~9
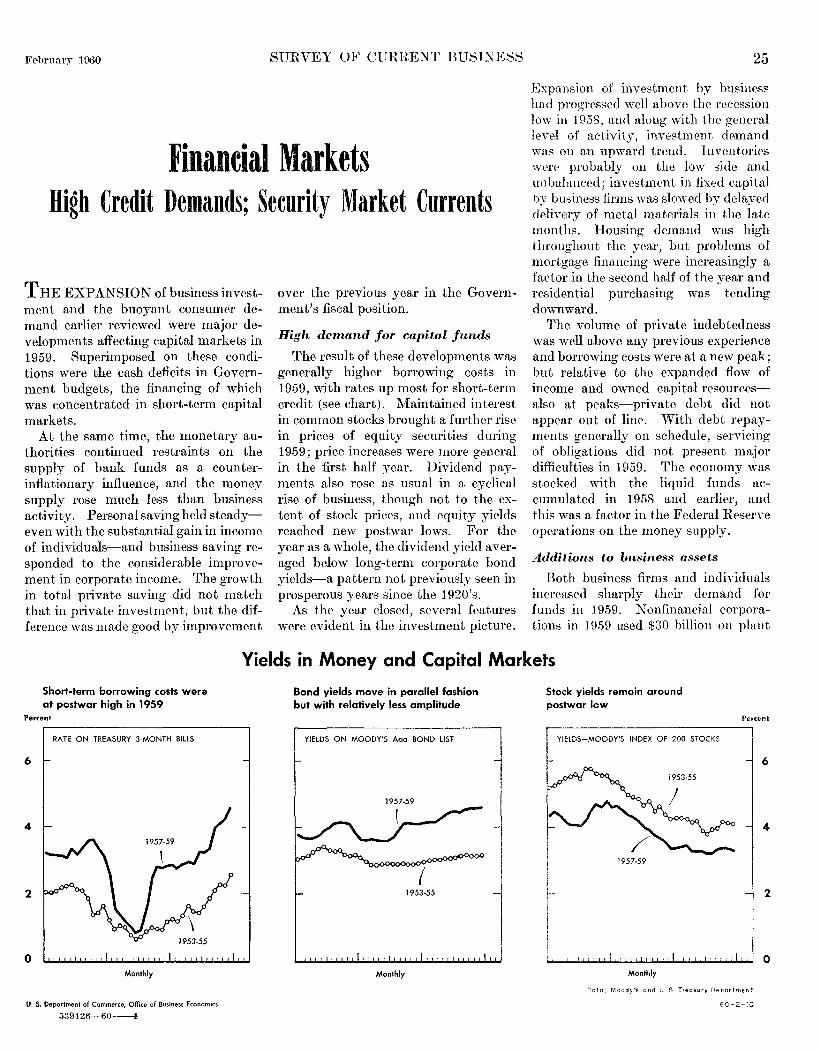
Febrnar,v 1000 SURVEY OF CURRENT BUSINESS
Financial Markets High Credit Demands; Security Market Currents
THE EXPANSION of business investment and the buoyant consumer demand earlier reviewed were major developments affecting capital markets in 1959. Superimposed on these conditions were the cash deficits in Government budgets, the financing of which was concentrated in short-term capital markets.
At the same time, the monetary authorities continued restraints on the supply of bank funds as a counterinflationary influence, and the money supply rose much less than business activity. Personal saving held steadyeven with the substantial gain in income of individuals-and business saving responded to the considerable improvement in corporate income. The growth in total private saving did not match that in private in vestment, but the difference was made good by improvement
over the previous year in the Government's fiscal position.
High demand for capital funds
The result of these developments was generally higher borrowing costs in 1959, with rates up most for short-term credit (see chart). Maintained interest in common stocks brought a further rise in prices of equity securities during 1959; price increases were more general in the first half year. Dividend payments also rose as usual in a cyclical rise of business, though not to the extent of stock prices, and equity yields reached new postwar lows. For the year as a whole, the dividend yield averaged below long-term corporate bond yields-a pattern not previously seen in prosperous years since the 1920's.
As the year closed, several features were evident in the investment picture.
25
Expansion of investment by business had progressed well above the recession low in 1958, and along with the general level of activity, investment demand was ou an upward trend. Inventories wr·re probably on the low side and unbalanced; investment in fixed capital by business firms was slowed by delayed delivery of metal materials in the late months. Housing demand was high throughout the year, but problems of mortgage financing were increasingly a factor in the second half of the year and residential purchasing was tending downward.
The volume of private indebtedness was well above any previous experience and borrowing costs were at a new peak; but relative to the expanded flow of income and owned capital resourcesalso at peaks-private debt did not appear out of line. With debt n'payments generally on schedule, smTicing of obligations did not present major difficulties in 1959. The economy was stocked with the liquid funds accumulated in 1958 and earlier, and this was a factor in the Federal ReserYe operations on the money supply.
Additions to business assets
Both business firms and indiYiduals increased sharply their demand for funds in 1959. Nonfinancial corporations in 1 !1.59 used $30 billion on plant
Yields in Money and Capital Markets
Short-term borrowing costs were at postwar high in 1959
Percent
RATE ON TREASURY 3-MONTH BILLS
6
4
2
0 Monthly
U. S. Department of Commerce, Office of Business Economics
539426-60-----4
Bond yields move in parallel fashion but with relatively less amplitude
YIELDS ON MOODY'S Aaa BOND LIST
Monthly
Stock yields remain around postwar lew
Percent
4
2
0 Monthly
Cofo: Moody's and U.S. Treasury Deporfrntr,f
60-2-10
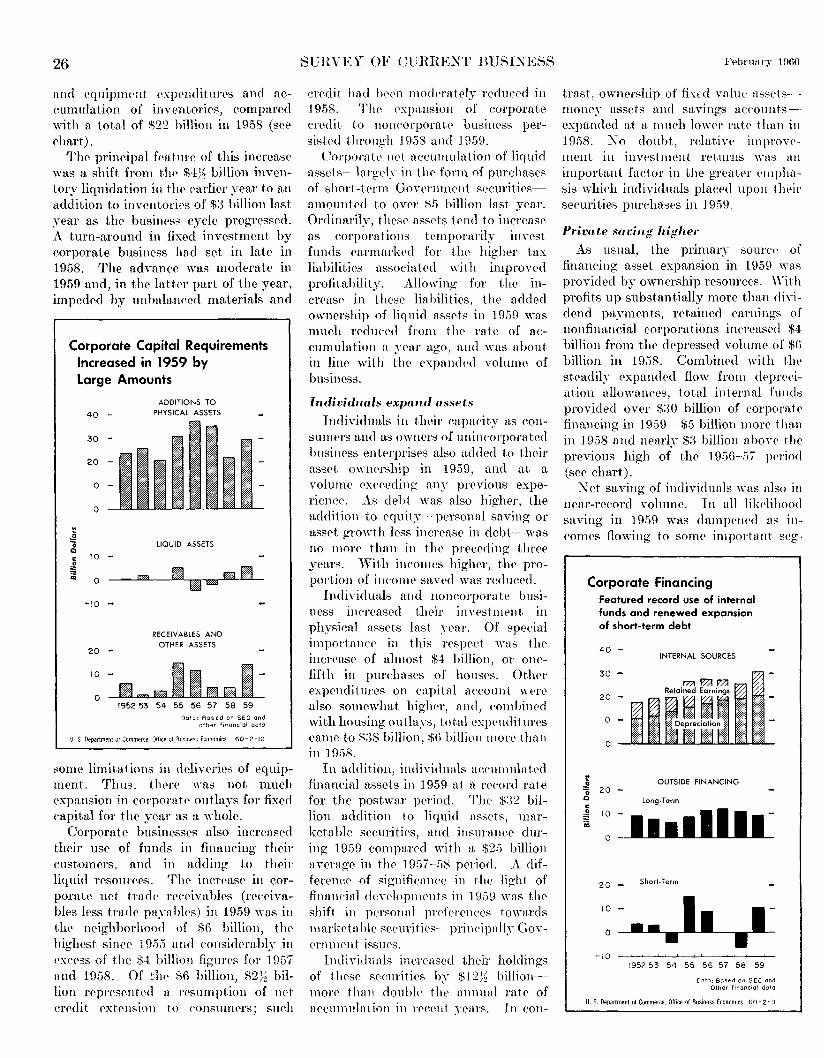
26
ancl equipnwnt exp('llditm·es and nceumnlation of inventoriC's, compared with a total of $22 billion in 1958 (see chart).
The principal feature of this increase was a shift from the M% billion inventory liquidation in tlw parlier year to an addition to inventories of $3 billion last ~·ear as the business cycle progressed. A turn-around in fix0d investment by corporate business had set in late in 1958. The advanee was moderate in 1959 and, in the lattN part of the year, impeded by tm balanced materials and
Corporate Capital Requirements Increased in 1959 by
!! ,g 0
Q
c: 0
:0:
"' ..
Large Amounts
40 -
30 -
20 -
10 -
0
10 -0
-10 -
20 -
ADDITIONS TO
PHYSICAL ASSETS
LIQUID ASSETS
RECEIVABLES AND OTHER ASSETS
1
: -~t-~11~~1-,952 53 54 55 56 57 58 59
Dolo. B~sed on SEC and other ftnanciol data
U.S. Department or <::ommerce, ·:Hf1ce of BLsines$ Economics 60-2-12
some limi1at.ions in delivPriPs of equipment. 'fhus, tlwrP was not much expansion in eorporatp outlays for fixed capital for the year as a ·whole.
Corporate businesses also incrPased their use of funds in financing their customers, and in adding to their liquid resour<"es. ThE' increase in corporatE' net trade rPC"('ivables (receivables lPss tradr payablPs) in 1959 was in the neighborhood of $6 billion, thr highest since 1 9l55 and considerably in l'xcess of the $4 billion figurrs for 1957 and 1958. Of thP $6 billion, $2% billion r0presented a resumption of net crPdit extension to consmnrrs; sueh
SUHVEY OF GlilUU:NT BUSINESS
credit had hrl'l1 moderately rPcluced in 1958. The E'Xpansion of corporate credit to noncorporate businrss persistPd through 1958 and 10.59.
CorporntP nd accumulation of liquid asset s---lnrgely in t hr form of purchases of short-term Gon'nlmrnt sc'curitiPsamountrd to over $5 billion last year. Onlinnrily, t hc'sr assds tend to increase as corporations temporarily invest funds cannarkrd for tlw higher tax liabilities associated with improvpd profi1 ability. Allowing for the increasl' in these' liabilitil'S, the added ownrrship of liquid assrts in 1959 was mueh rPduc·c'd from tlH' rate of accumulation a year ago, and was about in line with the expandNl volume of business.
Individuals expand assets
Individuals in their eapaeit~' as consumers and as owners of unincorporated business entt•rprises also added to their asset ownership in 1959, and at a volume exel'l'ding- any previous experieneP. As dPht was also highPr, the addition to cquit.Y-personal saving or asset growth less increase in debt-was no mon• than in the• preerding tln·rp years. ·with inconws higher, tlw proportion of inl'ome saved was rrducrd .
Individuals and Honeorporate business increased their invE'stment in physieal assrts last ~-ear. Of special importiuH·e in this resprct wns tltr increase of almost $4 billion, or onefifth in purchasps of houses. Ot.lwr expenditures on eapitnl aeeoUilt. were also somewhat highc•r, and, combined with housing outlays, total ex1wnclit mes eame to $:)8 billion, $G billion mon• tlwn in 1958.
In addition, indiYiclunls nl~l·nmulntl'd financial assets in 1959 at n n'eord rate for the postwar period. Tl1e $:)2 billion addition to liquid ass!'ts, marketable seeuriti('S, and insurnnee during 19.59 compared with a $25 billion a ;·ernge in thP 195 7-.58 prrio1l. A differt>ner of signifil'alll'l' in t hl• light of finanl'ial dPvdopmPnts in 1959 was the shift in personal prderenees towards mnrkrtnhle st>eurities--prineipnlly Govl'rlllllPn t issurs.
ImliYidunls increased their holdings of t lwse securities b~· $12% billionmorP than double the annual rate of aecmnulntion in rC'eent years. In eon-
trast, ownership of fixed valul' assetsmoney assets and savings accountsexpanded at a mueh lowl'r rn.tP than in 1 9.58. r\o doubt, rcln.tivP improwment in invrstment returns was an important faetor in the grPatPr rmphasis which inclivid uals plneed upon t lwir securities purehasC's in 1 95\).
Private saving higher
As usual, thE' primary soureP of financing asset expansion in 1959 was provided by ownership resources. \Yith profits up substantially more than dividend pnyn1E'nts, retained earnings of nonfinancial c-orporations increased $4 billion from the depressed volumr of $f\
billion in 1958. CombinE'Cl with tlH• stpadily expanded flow from deprPeiation allowances, total internal funds provided over $:)0 billion of eorpora.tr financing in 1959-$5 billion morr than in 1958 and nearly $:3 billion a how the preYious high of tlw 19.56-.57 JWriod (sec chart).
I\ et saving of individuals was nlso in ncar-record volume. In all li hlil1oml saving in 19.59 was dampPn('(l as incomes flowing to some important sPg-
Corporate Financing Featured record use of internal funds and renewed expansion of short-term debt
40 -
30 -
20 -
10 -
0
:e J! 0 20 -Q
~ s 10 -iii
0
20 -
10 -
0
INTERNAL SOURCES
OUTSIDE FINANCING
Long-Term
11•11111-Short-Term
•• • II I 1-
1952 53 54 55 56 57 58 59
Dolo· Based on SEC and Other fmoncio! dolo
U.S. Department of Commerce, Office of Business EconomiCS 60-2-11
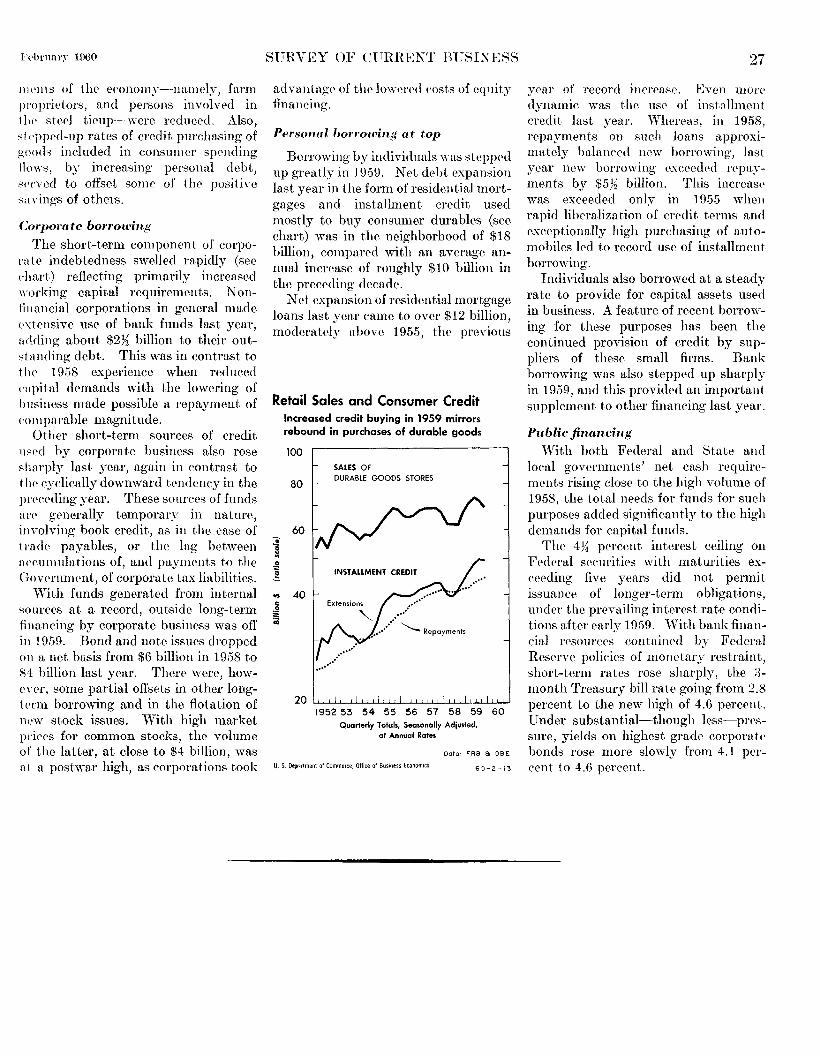
Fl'ln·nary 1000
JllP!lts of the economy--namel~-, farm proprietors, and persons involved in tlH' steel tieup-were reduced. Also, st <·pped-up rates of credit purchasing of goods included in consmn<'l' spcnding iiows, by increasing personal dc,bt, served to offset somP of thP positive savings of others.
Corporate borrowing
The short-term component of corpora tc indebtedness swelled rapidly (sec dtart) reflecting primarily increased working capital requirements. Nonfinancial corporations in general made Pxtensive use of bank funds last year, adding about $2~ billion to their outstanding debt. This was in contrast to the 1958 experience when reduced capital demands with the lowering of business made possible a repayment of comparable magnitude.
Other short-term sources of credit usPd by corporate business also rose sharply lust year, again in contrast to t hl' cyclically downward tendency in the JH'('CNling year. These sources of funds at'(' generally temporary in nature, involving book credit, as in the case of track payables, or the lag between aceumulations of, and paynwnts to the Government, of corporate tax liabilities.
·with funds generated from internal sources a.t a record, outside long-term financing by corporate business was off in !959. Bond and note issues ch·opped on a. net busis from $6 billion in 1958 to $4 billion last year. There were, however, some partial offsets in other longt<'l'm borrowing and in the flotation of new stock issues. With high market prices for common stocks, the volume of the latter, at close to $4 billion, was at a postwar high, as corporations took
SURVEY OF CURHENT BUSIXESS
ad vantage of tlw lowered costs of equity financing.
Personal borrowing flt top
Borrowing by individuals \nts stepped up greatly in 1959. Net debt expa.nsion last year in the form of residential mortgages and installment credit used mostly to buy consumer durables (see chart) was in the neighborhood of $18 billion, compared with an average annual increase of roughly $10 billion in the preceding decade.
Net expansion of residential mortgage loans last year came to over $12 billion, moderately above 1955, the previous
Retail Sales and Consumer Credit Increased credit buying in 1959 mirrors rebound in purchases of durable goods
100
80
60 ::! § ~ ! ... 40 c .2 ;: "'
SALES OF DURABLE GOODS STORES
INSTALLMENT CREDIT
Extensions
""-- Repayments
1952 53 54 55 56 57 58 59 60 Quarterly Totals, Seasonally Adjusted,
of Annual Rates
Data: FRB a 08 E
U. S. Oejt~rtment of Commerce, Office of BuSIMSS EcJnomics 60-2-13
27
year of record increase. Even mon' dynamic was the use of installment credit last year. Whereas, in 1958, repayments on such loans approximately balanced new borrowing, last yPar new borrowing cxeeedPd rPpayments by $5}~ billion. This incrcas(' was exceeded only in 1955 when rapid liberalization of credit terms and exceptionally high purchasing of automobiles led to record use of installment borrowing.
Individuals also borrowed at a steady rate to provide for capital a.ssets used in business. A feature of recent borrmYing for these purposes has been the continued provision of credit by suppliers of these small firms. Bank borrowing was also stepped up sharply in 1959, and this provided an important supplement to other financing last ypar.
Public financing
With both Fedpral and State and local governments' net cash rpquircments rising close to the high volume of 1958, the total needs for funds for such purposes acldPd significantly to the high demands for capital funds.
ThP 4}~ pPrcent interest ceiling on Federal securities with maturities exceeding five years did not permit issuance of longer-term obligations, under the prevailing interest rate conditions after early 1959. With bank financial rcsourecs eoutairwd by Federal Reserve policies of monetary restraint, short-term rates rose sharply, the :3-month Treasury bill rate going from 2.8 percent to the new high of 4.6 percent. Under substantial-though less-pressure, yields on highest grade corporal<' bonds rose more slowly from 4.1 pNcent to 4.6 percent.
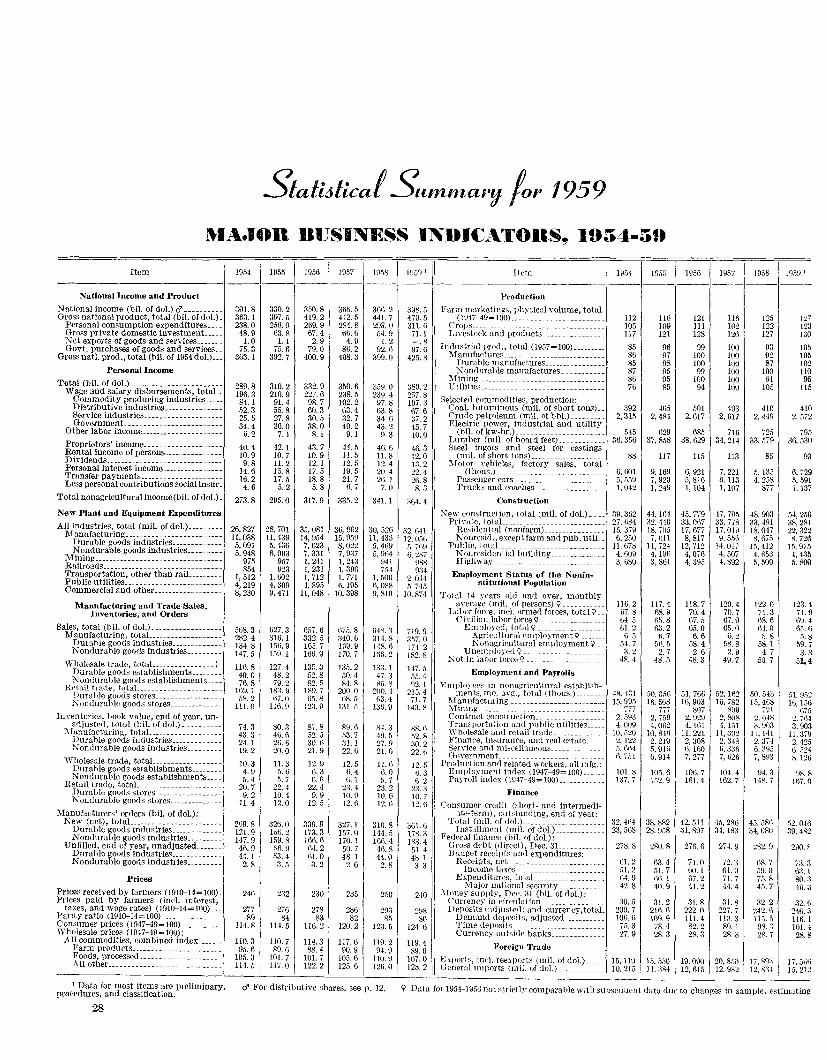
Stali3licaf Sumn'tai''J /or 1959
.iti}\.JOR BUSINESS INDIC .. L\TORS, 1954-59
I
--"''"-I-'""'"-Item 1954 1955 19.56 1957 1958 HI3H I Item 1~04 19S5 19.56 1957
--------------- ---- -------
National Income and Product Production
National income (bil. of dol.) 0'---------- 301.8 330.2 :150.8 3G6. 5 366.2 398.5 Fann marke,tings, physical volume, total Gross national product, total (bil. of dol.)_ 363.1 397.5 419.2 442.5 441. 7 479.5 (1947-49= 100) ------.----------------- ll2 !l6 121 ll6 125 1:27
Personal consumption expenditures ____ 238.0 256.9 269.9 284.8 203.0 311.6 Crops ________ 105 109 111 102 122 123 GroRs private domestic inve.,tment_ ____ 48.9 63.8 67.4 66.6 54.9 71.1 Liwstock and l;r-oducts:::::::::::::::: 117 121 128 126 127 130 Net exports of goods and services _______ 1.0 I.! 2. 9 4. 9 1.2 -.8 Indnst.rial prod., total (1957=100) _________ 85 96 99 100 93 Govt. pnrchases of goods and services._ 75.3 75. 6 79.0 86.2 92.6 97.6 105
Gross nat!. prod., total (bil.of 1954doJ.) ___ 363.1 392.7 400.9 408.3 399.0 425.8 Manufactures __________________________ 86 97 100 100 92 105
Durable manufactures ________________ 85 98 100 100 87 102 Personal Income 1-:onrlurable manufactures. __________ 87 95 99 100 100 110
Total (bil. of dol.) ________ ----------------Mining _________________________________ 86 95 100 100 91 95
289.8 310.2 332.9 350.6 359.0 380.2 t:tilities ________________________________ 76 85 94 100 105 115 Wage and salary disbursements, totaL 196.3 210.9 227.6 238.5 239.4 257.8 Commodity-producing industries _____ 84.1 91.4 98.7 102.2 9'1. 8 107.3 Selected commodities, production: Distributive industries _______________
.o2. 3 55.8 60.3 63.4 63.8 67.6 Coal, bituminous (mil. of short tons) __ 392 4fl..l) 501 493 410 410 Service industries.---------------- ___ 25.5 27.8 30.5 32.7 3-1.6 37. 2 Crude petroleum (mil. of bbl.) _________ 2, 315 2, 484 2, 617 2, 611 2,4.49 2. -572 Goyernment _________________ - _ -- ____
34.4 36.0 38.0 40.2 43.2 45. 7 Electric power, industrial and utility Other labor income _____________________
6. 2 7. I 8.1 9.1 9. 3 !0. 0 (bil. of kw-hr.)________ _ ___________ 545 629 685 716 725 79.o
Proprietors' income ______ -------------_ Lumber (mil of hoard feet) ____________ 36.356 37, 858 38,629 34,214 33, 579 36.530 40.4 42. I 43.7 44.5 46.6 46.3 Steel ingots and steel for castings Rental income of persons _______________ 10.9 10.7 10.9 11. 5 II. 8 12.0 (mil. of short tom;) __________________ 88 ll7 115 1!3 85 93 Dividends ______________________________
9. 8 11. 2 12.1 12. ·' 12.4 ]:l.2 Motor vehicles, factory sales, tot a! Personal interest income ________________ 14.6 15.8 17.5 19.5 20.4 22.4 (tbous.) ___________________________ f), 601 9,169 6, 921 7, 221 5, 135 6, 729 Transfer payments _____________ -----_-- 16.2 17.5 18.8 21.7 26.1 26.8 Passenger cars ________________________ 5, 559 7, 920 5, 816 6. 113 4. 258 5, 59! Less personal contributions social insur _ 4. 6 5. 2 5. 8 6. 7 7. 0 8 .. 3 Trncks and coaches _________________ I, 042 I, 249 I, 104 I, 107 877 1. 137
Total nonagriculturallncome(bll. of dol.)_ 273.8 295.0 317.9 335.2 341.1 364.4 Construction
New Plant and Equipment Expenditures New construction, total (mil. of dol.) ____ 39,362 44, Hi4 45, 779 47, 79.5 48,903 .54, 256 All industries, total (mil. of dol.) _________
Private, total ___________________________ 27. li84 :;~. 440 33,067 33,778 33.491 38,281 26,827 28, 701 35, 081 36, 962 30, 526 32. 641 Residential (nonfarm) ________________ !5, 379 18, 705 17,677 17,019 18,047 22,322 Manufacturing _________________________ ll, 038 11, 439 14, ~54 15,959 11,433 12.0.06 N onresid., except farm and pub. uti! __ 6, 2.\0 7, fill 8, 817 9, 55o 8, 67;1 8. 726 Durable goods industries _____________ 5,091 5. 436 7, 623 8, 022 5, 469 !i, 769 Puhlic, tctaL _______________________ 11,678 11, 724 12, 712 14,017 15, 412 15,975 Nondurable goods industries _________ 5, 948 6, 003 7, 331 7, 937 5, 91i4 6, 2:-.;7 Nonresidential building ___________ 4. 609 4,!96 4, 076 4, 507 4, 65~ 4, 435 Mmmg _________________________________
975 957 I, 241 I, 243 1141 988 Highway _______________________ 3. 680 3. 861 4, 395 4, 892 5, 500 5. 800 Railroads ___________________ - ___ --- ___ --854 923 I, 231 I, 396 7M 934 Transportation, other than raiJ _________ I, 512 I, 602 1, 712 I, 771 I, 500 2. 044 Employment Status of the Nonin-
Public utilities __________________ ------- 4, 219 4, 309 4, 895 6,195 6,088 5. 7-!5 stitutional Population Commercial and other __________________
8, 230 9, 471 11, 048 10,398 9, 810 10,874 Total 14 years ol<l and monthly over, Manufacturing and Trade Sales, aYerage (mil. of ]lersons) 9 __________ 116. 2 117. 4 118.7 120. 4 122.0 123. 4
Inventories, and Orders Lahor forre, incl. armerl forces, total)?_ 67.8 68.9 70.4 70.7 71.3 71.9 Ci\'ilinnlabor force\? ______________ 64.5 (\5. 8 67.5 67.9 o8. 6 tl9. 4
Sales, total (bil. of dol.) __________________ 568.3 fl27. 3 ()57. 6 675. 8 G48. 3 719.9 Employed, total \1 __________________ 61. ~ 63.2 65.0 6.5.0 fA. 0 65. 6
Manufacturing, totaL _________________ 282.4 316.1 332.5 340.6 314.8 3.57. 0 Agrieult.ural employment 9 _______ n. 5 ti. 7 6.6 6. 2 5. 8 5. 8 Durable goods industries _____________ 134.8 !56. 9 165.7 169.9 148.6 171.2 N onngricultural employment 9 __ 54. 7 ,)6. 5 58.4 58.8 58. 1 59.7 Nondurable goods industries _________ 147.5 159.1 166.9 170.7 Hi6.2 182.8 Unemployed\? ----------------- 3. 2 2. 7 2. 6 2. 9 4. 7 3. 8
Wholesale trade, totaL __ ------------: ~ ot in labor force\! ------------ 48.4 48.5 48.3 49.7 50. 7 51,4
1Hl. 8 127.4 135.3 !3.1. 2 133.1 147.5 Durable goods establishments ________ 40.0 48.2 52.8 50.4 47.3 55.4 Employment and Payrolls Nondurable goods establishments ____ 7G. 8 79.2 82.5 84.8 85.8 92. I Etn})lnye<'s in nonagriPnlturnl establi~h-Hetail trade, totaL _____________________
169. I 183. 9 189. 7 200.0 200.4 21:1. 4 ments, mo. avg., total (tlwus.) ________ 48,431 50, 0.\6 51,766 52, 162 50.5-13 51. !).~2 Durable goods stores _________________ 58.2 67.0 65.8 08.5 03.4 71.7 l\I anufacturing _______ ---------------- _ 15.99.1 16.563 16,903 16, 782 !5, 468 16.156 ~ondurable goods stores ______________ 111.0 116.9 123.9 131.5 136.9 143.8 :Mining _________________ "'iTi 777 807 8()9 721 (\75 ---------------Inventories, hook Yalue, end of year, un- Contract construction __________________ 2, 593 2, 759 2. 929 2, 808 2,1)-1:8 2, 764
a<ljuste<l, total (bil. of dol.) __________ 74.3 80.3 87.8 89.6 84.3 88.6 Tran~portation and public utilities _____ 4. 009 4,0(\2 4, !61 4.lii1 3. 903 3. 903 J'danufacturin~, totaL _________________ 43.3 46.6 52.5 53.7 49.5 52.8
Wholesale and retail trade _______ . ____ 10,520 10, 8-lfi 11,221 11,302 I I. 141 11.379 Durable goods industries _____________ 24. I 2fi. 6 30.6 31.1 27.9 30.2 Finanee, insurance, and real estate _____ 2,122 2. 219 2, 308 2, 348 2. 374 2.-125 :\ondurable goods industries _________ 19.2 20.0 21.9 22.6 21.6 22. t)
Service and miscE:llaneous ______________ 5, 604 5, 916 6,160 6, 336 6. :~95 G .• o24 Wholesale trade, totaL ________________
GoYernmenL _________________________ fl, 751 6, 914 7, 277 7, 626 i, 893 8.126 10.3 II. 3 12.9 12.5 11.0 12.5 Production and related workers, all mfg.: Durable goods establishments ________ 4. 9 5. 6 6.3 6.4 6.0 G. 3 Employment index (1947-49= 100) _____ 101.8 105.6 106.7 104.4 94.3 98.8 Nondurable goods establishments ____ 5.4 5. 7 6.6 6.1 .5. 7 6. 2 Payroll index (1947-49=100) ____________ 1;)7, 7 L:•2. g Hi1.4 162.7 148. 7 167.0 Retail trade, totaL ____________________ 20.7 22.4 22.4 23.4 23.2 23.3 Durable goods stores _________________ 9. 2 10.4 9. 9 10.9 10.6 10.7 Finance
Nondurable goods stores ______________ 11.4 12.0 12.5 12.6 12.6 12.6 Consumer credit (short- and intermedi-Manufacturers' orders (bil. of dol.): nte-term), outstanding, end of year:
New (net), totaL ______________________ 2f>9. 8 326.0 339.9 327.1 310.8 361.6
Total (mil. of dol.) _____________________ 32.464 38,882 42, 511 45, 286 45, 586 52, 0-16 Durable goods industries _____________ 121. g 166.2 173.3 157.0 144.5 178.3
Installment (mil. of dol.) ___________ 23,568 28,958 :n, 897 34,183 3!, 080 39,482 Nondurable goods industries _________ 147.9 !59. 8 166. (j 170.1 !Gil. 4 !R3. 4 Federal finance (bil. of dol.):
Unfilled, end of year, unadjusted _______ 46.9 56.9 64.2 50.7 46.8 51. 4 Gross debt (direct), Dec. 3L _________ 278.8 280.8 276.6 274.9 2g2. 9 290. f.
Durable goods industries _____________ 44.1 53.4 61.0 48. I 44.0 4K 1 Bndget receipts and expenditures: Nondurable goods industries _________ 2.8 3 .. 5 3.2 2.6 2. 8 3. 3
Receipts, net_ ________________________ Gl. 2 63.4 71.0 72.3 68.7 73.3 Income taxes _______________________ 51.2 51.7 60.1 61.9 59.0 ti:l.l Prices Expenditures, totaL _______________ (\4. 9 flo. 1 67.2 71.7 75.8 80. :J
~1ajor national security _________ 42.8 40.\J 41.2 44.4 45. 7 4fl. :l Prices received by farmers (1910-14=100)_ 246 232 230 2;)5 2-50 240 :\!one.y supply, Dec. 31 (bil. of dol.): Prices paid by farmers (incl. interest, Currency in rirculation _________________ 30.5 31.2 31.8 31.8 32.2 32.6 taxes, and wage rates) (1910-14=100) ___ 277 276 278 286 293 29R Deposits (adjusted) and currency,totaL 20\J. 7 2]()." 222.0 227.7 242.6 246.3 Parity ratio (19IQ--14=100) ________________ 89 84 83 82 85 80 Dentand deposits, adjusted ___________ 106.6 109.9 111.4 110.3 11-5 .. 5 116. 1 Consumer prices (1947-49= 100) ___________ 114.8 114.5 116. 2 120.2 123.5 124. ti Time deposits ________________________ 76.3 78. 4 82.2 89.1 98. :J 101. 4 Wholesale prices (1947-411=100): Currency outside banks _____________ 27.9 28.3 28.3 28.3 2R. 7 28.8 All commodities, combined index _______ 110.3 110. 7 114.3 117.6 119. 2 119. 4 Foreign Trade Farm products _______________________ 95.6 89.6 88.4 90.9 94.9 89.0 Foods, processed _____________________ 105.3 101.7 101.7 105.6 110.9 107.0 . Export~, in<'!. reexports (mil. of dol.) ____ 15, 110 l.o, 5:,0 19,090 20, 80() 17. sg:J 1 17, 5t)6 All other ____________________________ 114. 5 117.0 122.2 125.6 126.0 128. 2 i Geneml imports (mil. of dol.) ___ ------·--- 10,215 ! 11, 384 12,615 12.982 I 12. s:H , 15. 2!2
I Data for most items are preluninary. procedures, and classifi~'ltion.
d' For distributive shares, see p. 12. \! Data for 1954-1956not strictly comparable with subsequent data due to chanp;es in sample, estimating
28
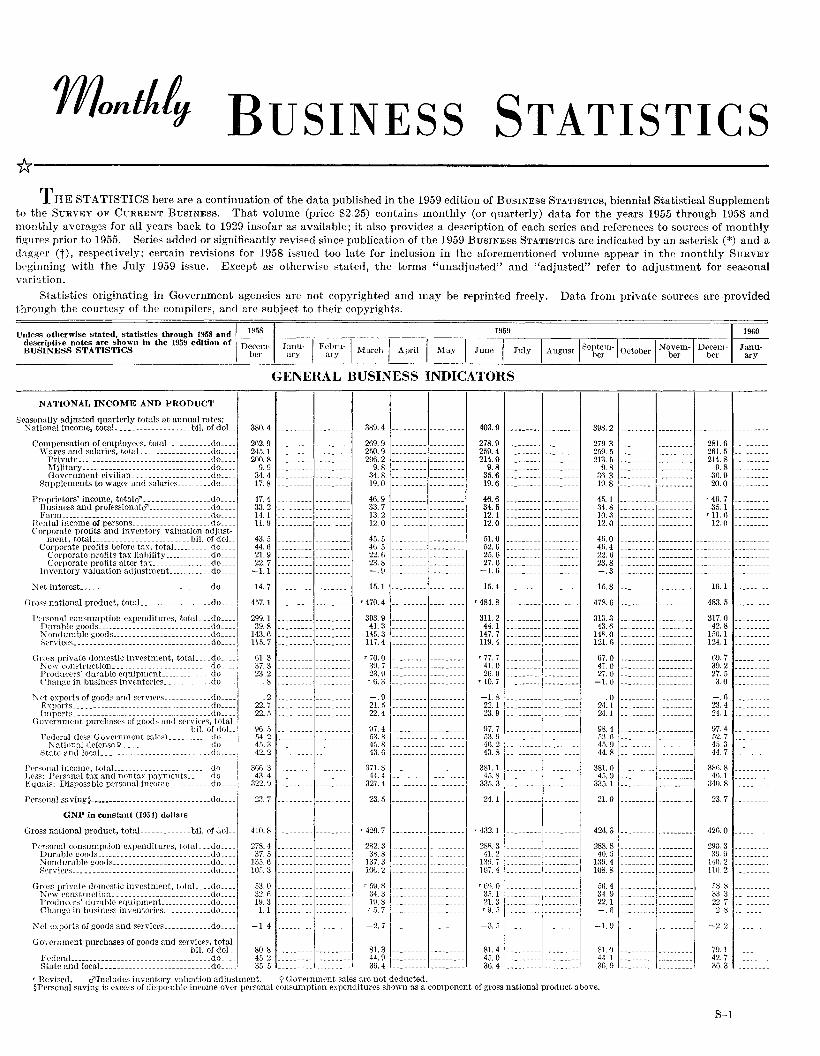
BUSINESS STATISTICS *-------------------------------------------------------------
THE STATISTICS here are a continuation of the data published in the 1959 edition of BusiNESS STATISTics, biennial Statistical Supplement to the SuRVEY OF CuRRENT BusiNEss. That volume (price $2.25) contains monthly (or quarterly) data for the years 1955 through 1!l58 and monthly averages for all years back to 1!l2!l insofar as available; it also provides a description of each series and references to sources of monthly figures prior to 1955. Series added or significantly revised since publication of the 195!) BusiNESS STATISTICS are indicated by an asterisk(*) and a daggPr (t), respectively; certain revisions for 1958 issued too late for inclusion in the aforementioned volume appear in the monthly SuRVEY b•·ginning with the July 1!l59 issue. Except as otherwise stated, the terms "unadjusted" and "adjusted" refer to adjustment for seasonal variation.
Statistics originating in Government agencies arc not copyrighted and may be reprinted freely. Data from private sources are provided through the courtesy of the compilers, and are subject to their copyrights.
1959 Unless otherwise stated, statistics through 1958 and ~-~~ descriptive notes at"e shown in the 1959 edition of I Decem~ Janu- I Febru-1 I . BUSINESS STATISTICS ber ary ary March Apnl I May I June I July I
1960
I August I septem-j 0 t b I Novem-j Dec~~: Janu· ber c 0 er bcr ber ary
NATIONAL INCOME AND PRODUCT
Se<tSOJhtlly adjusted quarterly totals at annual rates: '! ational income, totaL·----------------- bil. of doL.
Compensation of employees, totaL ________ .. do .. __ \Yages and salaries, totaL _________________ do ....
Private ________ ---- ______________________ do ___ _ Mi Jitary ___________________ . _____________ do .. __ novern1nent civilian ____________________ do ___ _
Supplrments to wag<'s and ~alarirs _________ do ___ _
Proprietors' income, totald' _________________ Qo ___ _ Business and profcssionnlc!' .. ---- _________ do. __ _ Farm______________________ _ ___________ .do .. __
!?ental income of persons ____________________ do __ __ Corporate profits and inventory valuation adjust-
ment, totaL ________________________ biL of doL Corporate profits before tax, totaL ________ do .....
Corporate profits tax liability ____________ do ___ _ Corporate profits after tax ______________ do __
Inventory valuation adjustment __________ .do ... _
l\' Pt interest _________________________________ do. __ _
Oro" national product, totaL _________________ do .. _
l'(·r~onal consumption expenditures, total ___ do_ Durable goods ______________ .. ______________ do l\' ondurable goods .. _____________________ .. do ~:.;ron ices_---------- __________ - _____________ do_
(lross private domestic investment, totaL __ do ___ _ 1\c,,. ron8trnrtion _______________________ .do ___ _ Producers' clurablc cquipmPnt____ _do __ C'hangc in business invL•ntorirs____ _.do ___ _
~Pt exports of goods and :::'ervices___ _ ____ do ___ _ F>.:ports ________________ .. ________ .. _ _ __ .. _do ___ _ Imports_______________________ _ _____ do ....
OoYcrnment purchases of p:oods and SC'rviel''>, total biL of doL
Fe<.!{·r~l (lC'ss Government salC's) ___________ do ____
1
Natwrml defense <.f.> ____________________ do __ Stah' and locaL _______________ .. ________ .. do. __ .,
P{'rsonal incon1c, totaL ________________ :--- ____ do ___ _ l.f·~s: Pcrson~1l tax and nonta'\ ]Jayments _______ cto ___ _ Equals: Disposable personal inc<nile ____________ cto __ _
P~rsonal mvings----------- _______________ ..... do ....
GNP in constant 09-H) dollars
Gross national product, totaL ____________ bil. of ;wL .,
Prrsona.l consumption cxpenditurrs, totaL __ do ___ _ Durable goods _____________________________ do ___ _ Nondurable goods _________________________ do .. __ S('rYiccs ____ -------------~---------- _____ do ___ _
Gross private domestic investment, totaL ___ cto ___ _ Kew construetion_____ _ _____ do ___ _ Pro(!Uc{'rs' durable eqttipml'nL ____________ do ___ _ Change in business inYNltori<'s___ _ __ do ___ _
Net exports of goods and services ____________ do ___ _
Go•:ernmcnt purchases of goods and Ecrvicc~, total biL of doL
FcderaL __________________________________ do ___ _ State and locaL ___________________________ do .. __
380.4
262.9 24.). 1 200.8
9. 9 34.4 17.8
47.4 33.2 14. 1 11.9
43.5 44.6 21.9 22.7
-1.1
14.7
457.1
299. 1 39.8
143.6 115.7
61.3 37. 3 23.2
.8
. 2 22.7 22.5
96 . .) 54.2 45.3 42.2
36fi. 3 43.4
322.9
23.7
410.8
278.4 37.5
135.6 Hlc•.3
!;3.0 32. () 19.3 1.1
-1.4
80.8 45.2 30.5
GENERAL BUSINESS INDICATORS
--------- ---------1 :::::::::::::::::1
389.4
209.9 250.9 206.2
9.8 34.8 19.0
46.9 33.7 13.2 12.0
45. 5 46.5 22.6 23.8 -.9
15.1
'470.4
303.9 41.3
145.3 117.4
'70. 0 39.7 23.9 r 6. 3
-.9 21.5 22.4
07.4 5:3.8 4f>. R 43. (\
371.8 44.4
327.4
23.5
'420. 7 --------- ---------
2R2. 3 --------- ---------3><. 8 1--------- ---------
137.3 '~--------- --------lOU. 2 --------- ---------~
r 59. R _ -------- ---------34.3~---------•---------' 1~.8 ---------1--------1 '".71--------- --------
-2. '1--------- ---------
~UI::::::::::::::::::
403.9
278.9 259.4 214.0
9.8 35.6 19.6
46.6 34.5 12.1 12.0
51.0 52. G 25.6 27.0
-1.6
15.4
'484. 8
311.2 44.1
147.7 119.4
r 77.7 41.0 26.0
T 10,7
-1.8 22.1 23.9
97.7 .'i3. 9 4fi. 2 43.8
381.1 45.8
335.3
24.1
'432.1
28R. 3 --------- ---------41.2 --------- ---------
:;llil -3 .. 1 --------- ---------
81.4 45.0 36.4
'Hevised. c!'Includes inventory valuation adjustment. <;>Government sales arc not deducted.
398.2
279. 3 259.5 213.5
9.8 31\.3 19.8
45. 1 :H. 8 JO.:l 12.0
46.0 46.4 22.6 23.8 -.3
15.8
478.6
313.3 43.6
HR. 0 121.6
67.0 410 27.0
-LO
.0 24.1 24.1
98.4 53.6 45. g 44.8
381.0 45. g
335. 1
21.9
42·!.3
288. s 40. G
1:!9.4 108.8
56.4 3-\. g 22. l --.6
-1.9
81.0 --------- ---------
it,~ 1:::::::: :::::::::1 §Personal saving is exce~s of <!ispo~ablc income over personal consumption expenditures shown as a component of gross national product above.
281.6 261. .5 214.8
9. 8 3(i. 9 20.0
T 4f}. 7 35. 1
'11.6 12.0
16. I
483.5
317.0 42.8
150.1 124.1
69.7 39.2 27.5 3 0
-.G 23.4 2!. I
97.4 [)2. 7 45.3 44. 7
38G. 8 4U. l
340.8
23.7
426.0
290.3 au. u
1-10.2 111). 2
cs. s :l3. 3 22 7
2. 8
-2 2
79 1 42. 7 36.3
S-1
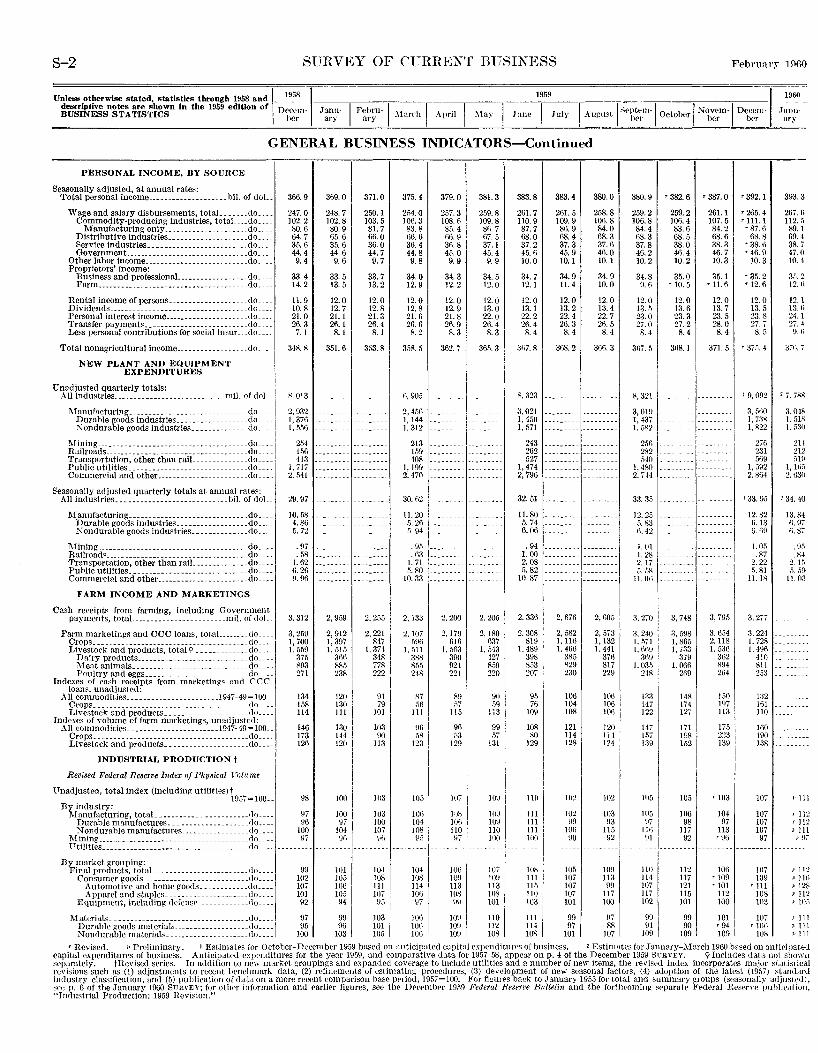
S-2 SUHVEY OF CFRRE:NT BUSINESS
Unless otherwise stated, statistics through 1958 and I 1958 __ 1
descriptive notes are shown in the 1959 edition of Decem J anu I F bru I I I I BUSINESS STATISTICS her - ary- ~ry - :\larch April :\lay June
;
1959
I July I
Feb run ry 1fHiO
1960
I ol.uamt I Septem-1 0 t he I Novem-1 Decem-I • " - her c 0 r ber ber '
GENERAL BUSINESS INDICATORS-Continued
PERSONAl, INCOME, BY SOURCE
Seasonally adju,ted, at annual rateR: Total personal income ____________________ bil. of doL.
Wage and salary disbursements, totaL ______ do. __ _ Commodity-producing industries, totaL .. do ___ _
Manufacturing only ____________________ .do ... __ Distributive industries ___________________ .do ___ _ Service industries. __ --------------------- _do. __ _ Government. ... __ ... _----------- ___ .. _ .... do. __ _
Other labor income __________________________ do ___ _ Proprietors' income:
Business and professiona]_ _________________ do ___ _ Farm ______________ ------------------ ______ .do. __ _
Rental income of persons __________________ .. do __ _ Dividends ___________________ .----- ___ ..... __ do ___ . Personal interest income _____________________ do_ Transfer payments _________ ------. _______ ... do_ Less personal contributions for social in sur __ .do_
Total nonagricultural income ___________ .
NEW PLANT AND EQUIPMENT EXPENDITURES
Unadjusted quarterly totals:
.. do_
All industries _________________________ .. mil. of dol.
Manufacturing ____________ --------- ________ do_._. Durable goods Industries _________________ .do. _. .\ondurable goods industries _____________ do __ .
!\fining __________ ----------- _____ • __________ .do. __ Railroads ___________________ ---------- _______ do __ . Transportation, other than rail ______________ do __ _ Public utilities. _____________________________ do ___ . Commercial and other _______________________ do ___ .
Seasonally adjusted quarterly totals at annual rates: All industries._.------------------_. __ .. _ bil. of doL.
1\fanufacturing _____________________________ .do .. - .. Durable goods industries _________________ _cto ___ _ .'fondurahle goods industries ______________ do ___ _
1\Iining ______________________________________ do ..•. Railroads ______________ ._._. __________ .. __ ._ .do._--Transportation, other than rai]_ _____________ do ___ _ Public utilities.----------------------- ___ ... do ___ _ Commercial and other.--------------------- .do ___ _
FARM INCOME AND MARKETINGS
Cash receipts from farming, Including Government , payments, totaL ______________________ mil. of do_l __ l
Farm marketings and CCC loans, totaL ______ do Crops _______________ ------ ________________ .. do _-Livestock and products, total\' ____________ _do ___ _
Dairy products ____________________________ do._--l\Ieat animals._------------------------ ___ do ___ _ Poultry and eggs _________________________ .do ___ _
Indexes of ca:-;h reeeipts from marketin{!:" nnd CCC loans, unadju~ted:
All commodities.--------------------_ .194i-49=10Q __ Crops ____________________ ---------- ________ .do ___ _ Livestock and products _____________________ ,Jo ___ _
Indexes of volume of farm marketings, unadjusted: All commodities. _____________________ .194i-49=100 ..
Crops ___________________ ----------- _________ do._--Livestock and products .. ---------------- __ .do ..
INDUSTRIAL PRODUCTION t
Revised Federal Reserz•e Index of Physical Yn/11 me
Unadjusted, total index (including utilities)t
3fm.9
247.0 102.2 80.6 64. i 35.6 44.4
9. 4
33.4 14.2
11.9 10.8 21.0 26.3
7.1
34H. S
~.013
2, 932 1, 3if\ 1, 5.06
254 1M 413
1, ili 2.M1
10.58 4. 86 5. i2
. 97
. 58 1.62 t>.26 H.90
3, 312
3,2.)9 1, iOO I. 559
375 893 2il
134 158 ll4
146 173 126
1957= 100-- 98 By industry:
:1\Ianufacturing, totaL--~------- ____________ do____ H7 Durable manufactures. ___________________ do____ 96 Nondurable manufactures _________________ do____ 100
lVlining _____________________________________ .do .. __ 9i Ftilities ____________________________________ .do. ___ --------- -
By market grouping: I Final products, totaL-------------- _____ .... do ___ _
Consumer goods __________________________ .do. __ _ Automotive and home roods. ___________ do ___ _ Apparel and staples.---------- __________ do ... _
Equipment, including d0fens0 ____________ do ___ _
Materials __ ---------------- ________________ .do ___ _ Durable goods materials ___________________ do .... / Nondurable materials _____ --------------- _do ___ _
99 10'1 lOi 101 92
97 95
100
369.0
248.7 102.8 80.9 65.6 35.6 44.6 9.6
33.5 13.5
12.0 12.7 21.1 26.1
8. I
351.6
2, 959
2, 912 1, 397 1, 51.5
366 885 238
120 1
130 I Ill
130 144 120
100 I 100 97
104 ~)(i
101 105 106 105 94
99 96
103
371.0
250.1 103.5 81.7 66.0 36.0 44.7 9. 7
33.7 13.2
12.0 12.8 21.3 26.4
H.1
353.8
2. 255
2. 221 847
I. 371 348 7i8 222
91 i9
IQ1
103 90
113
103
103 100 107 H6
10-1 108 111 107
1:~ I 101 105
375.4
254.0 106.3 83.8 66.6 36.4 44.8 9. 8
34.0 12.9
12.0 12.8 21.6 2fl. 6
H. 2
3.58. 5
fi. 905
2, 456 1,144 I. 312
213 !59 408
1,199 2, 470
30.62
11.20 .5. 26 li. 94
. 95
. 63 l.il .o. 80
10.33
2.1331
2.10i .o9n
I. fill 388 RM 248
8i .If\
J11
06 58
123
10.1
!Oii 104 108 Pli
1041
1
108 114
~g~ I 1061 106 106
3i9.0
257.3 108.6 85.4 66.9 36.8 45.0 9.9
34.3 12.2
12.0 12.9 21.8 26.9 8.3
362. i
2.200
2.179 ()1()
1. ,)()3 390 921 221
H!J J)7
115
96 tl3
129
lOi
]Oii 109 113 108 !IQ
10!1 II 109 109 I
381.3
259.8 109.8 sn. i Oi. 5 37.1 45.4 9.9
34.5 12.0
12.0 13.0 22.0 26.4
8. 3
365.3
2. 205
2,180 637
1,.143 427 859 220
~0 fl9
113
99 .~7
131
109
10!1 109 110 100
107 lOV 113 108 101
110 ll2 108
383.8
261.7 110.9 87.7 68.0 37.2 45. 6 10.0
34.7 12.1
12.0 13.1 22.2 :?fl. 4
8. 4
:ll\7. 8
8. 323
3, 021 1, 450 I, 5il
243 262 .527
1, 474 2, 796
32. 51
11.80 5. i4 6.06
.94 1. 00 2.08 .o. 82
10. Si
2, 336
2. 308 819
1. 489 398 s.o3 207
~5 i6
109
108 80
129
110
Ill Ill Ill 100
10~ Ill 115 110 103
111 ll4 108
383.4
261.5 109.9 86.9 68.4 37.3 45.9 10.1
34.9 11.4
12.0 13.2 22.4 26.3
8. 4
368.2
2, 676
2 582 1: 1Hi I. 466
385 829 230
106 104 108
121 114 128
102 99
106 ilO
105 !Oi !Oi 107 101
99 9i
101
380.0
258.8 106.8 84.0 68.3 3i. 6 46.0 10.1
34.9 10.0
12.0 13.4 22. i 26.5
8. 4
3136.3
---------1
2. G05
2, 573 1,132 l. 441
376 81i 229
IO(i 106 106
120 114 124
1112
103 !13
115 92
109 113 99
11i 100
tl7 88
lOi
380.9
259.2 106.8 84.4 68.3 37.8 46.2 10.2
34.8 9. 6
12.0 13.5 23.0 27.0
8. 4
31li. 5
~. 321
3,019 I, 43i I. 582
256 II
282 -540
1, 480 2. iH
33. 3.1
12.25 5. 83 Ji. 42
I. (11 I. 28 2.1i 5 .• 1R
II. Oli
3, 270
3. 240 1 I, 571
I,~~~ I ].()3.)
24R
133 147 122
147 !.57 B9
1115
1115 Y7
116 91
Ill) 114 107 117 102
99 91
109
'382.6
259.2 106.4 83.6 68.5 38.0 46.4 10.2
35.0 '10.5
12.0 13.6 23.3 27.2 8.4
'387.0
261.1 107.5 84.2 68.6 38.3 46.7 10.3
35.1 '11.6
12.0 13. i 23.5 28.0 8.4
'392.1
'265.4 '111.1 '87.6
68.8 '38.6 '46. 9
10.3
r 35.2 '12.6
12.0 13.5 23.8 27.7
8. 5
31i8.1 371. 5 • :li.o. 4
3, i48 3, 795
:l. 598 3, 654 I, 865 2, 118 I, 733 I. 536
379 362 I. 066 894
2o9 264
148 150 174 197 127 I 13
lil 1 i5 1r8 223 152 139
105
106 98
11i 92
112 lli 121 115 101
99 90
109
'103
104 97
113 '96
106 '109 '101
112 100
101 '94 109
l 9,092
3. 5tl0 l. 7:l~ I. 822
276 231 .5o9
1, 592 2.804
1 33. 9.)
12.82 0.13 G.tm
I. 0,) .87
2. 22 5. 81 11.1~
3. 277
3. 224 I. 728 I. 496
410 811 2-13
1:!2 161 110
160 190 1:Js
107
!Oi 107 107 9i
107 109
'111 108 103
107 '101)
108
393.3
267.1) 112.1i 89.1 69.4 38. 7 47.0 10.4
3f•. 2 12.1;
12.1 13.1; 24. 1 2i. 4
~ .. li
3ili. i
3,041' 1. 51S I. ;,31)
211 212 ;il9
l,ltifi 2.H311
'34. 40
13.84 H. 97 li. 87
. fl,~
.S4 2. 1i• 5. 59
11.03
, 111
1 11:.? ' 112 I II I
I' fli'
111'2 p 111\ "i' 12k ,. 112 I lOA
,. 111 ,.111 )-> 111
• Revised. • Preliminary. 1 Estimates for October-December 1959 hascd on antic1pated e,lp!tal e'[>enditmes of business. ' Estimates for Tanuary-March 1960 based on .mt1dpated capital expenditures of business. Anticipated expenditures for the year 1959, and comparath·e data for 1957-58, appear on p. 4 of the December 1959 ST"RVEY. I' Includes data not shown separately. tRevised series. In addition to new market groupin~s and expanded co\·erage to include utilities and a number of new items, the revised index incorporates major statistical revisions such as (1) adjustments to recent b0nchmark data, (2) refinements of cstimatin~ procedures, (3) development of new seasonal factors, (4) adoption of the latest (1957) standard Industry classification, and (5) publication of data on a more recent comparison has0 peliod, 195i=IOO. For figures back to January 1955 for total and summary groups (seasonally adjusted), sec p. 6 of the January 1960 SURVEY; for other information and earlier figures, see the Decem her 19,19 Federal Reserre Bulletin and the forthcoming separate Federal Resel'\'e puhlication, "Indu,trial Production: 1959 Revision."
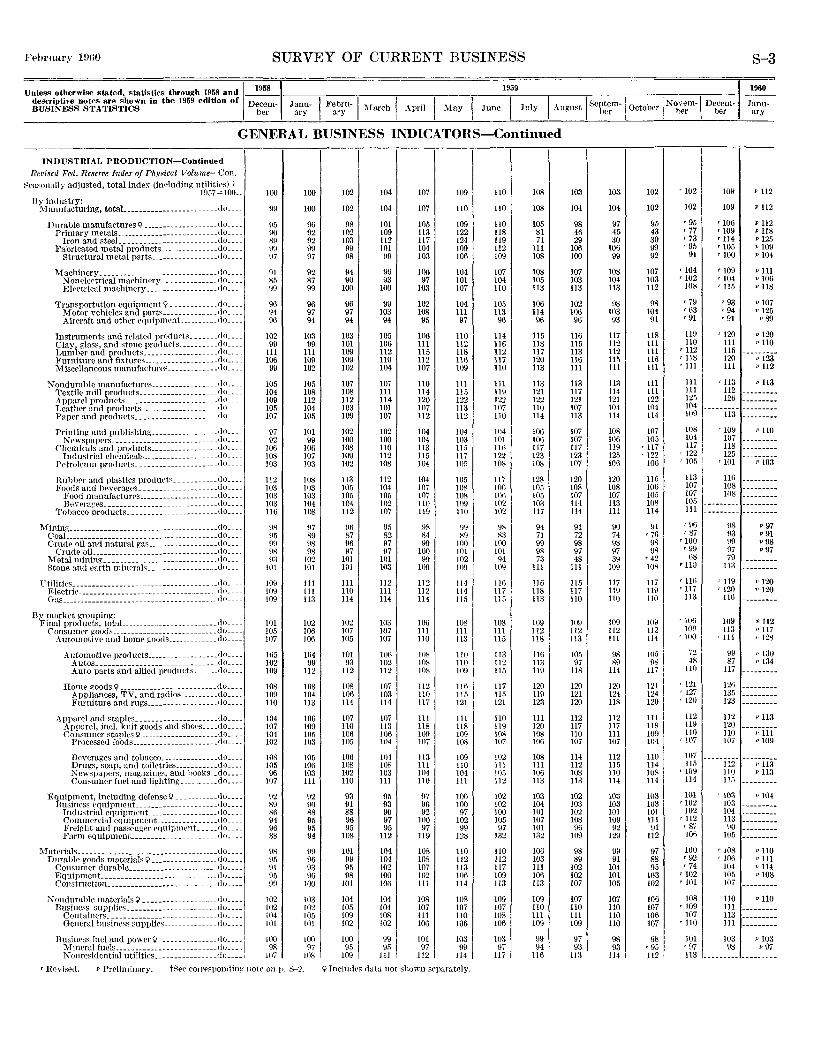
Fdn·nary l!}(i0 SURVEY OF CURRENT BUSINESS S-3
1959
1
1960
1-\ugust I Septern-1 October I No vern-~ Decem- Janu-. · ber her ber ary
- · 1 1958 Unless otherwise stated. statistics through 1958 and
descriptive notes are shown in the 1959 edition of I Decent-BUSINESS STATISTICS ber Janu- I Febru-1 :\[arch I ·\pril J Hay I June I July ary ary
1-
1-
GENERAL BUSINESS INDICATORS-Continued
NDUSTRIAL PRODUCTION-Continued sed Fed. Reser11e Inder of Physical Volume-Con. Rem
~raso nnlly adjusted, total index (inrluding utilities) t 1957=10!1__
industry: nnufacturlng, totaL------------------- ____ do ___
Durable manufactures\) ___________________ do __ Primary metals ___________________________ <lo ___
Iron and steeL ________________________ do ____ Fabricated metal products _______________ do ____
Structural metal parts _________________ ,lo ____
Machinery_---------------- _____________ tlo ____ Nonelectrical machinpry ______________ do ____ Elt'etrical machinery __________________ do ___
Transportation equipment I' ____________ do ____ Motor vehirles and parts ______________ <lo ____ Aireraft and other equlpmPnt. _________ ,jo ____
Instruments and rdated prortuf'ts _______ do _____ Clay, glass, and stone produrts __________ do ____ Lumber and products ___________________ do ___ -Furniture and fixture_s ___________________ do ____ Miscellaneous manufactures .. ___________ t)o ____
Nondurahle mauufactures _________________ do ____ Textile mill products ____________________ do ____ Apparel products ________________________ do ____ Leather and products ____________________ do ____ Paper and produrts _____________________ do ____
Printing and puhlishing _________________ do ____ Newspapers _________________________ - .do_-- ..
Chemicals and products _________________ do ____ Industrial chemicals ___________________ do ____
Petroleum products. _____________________ rto ____
Ruhl><'r and plastics produt'ls ___________ tlo ____ Foods and hevr.rages ____________________ do ____
Food numufactures ____ ~------~----- ___ do_---Bevera.~es _____________________________ do ____
Tohacco products _______________________ cto ____
I
M lning ______________________________________ do ____
By F
CoaL ______________________________________ do ____ Crudr oil and natural {.?;as __________________ do ____
Crude oiL ______________________________ <lo ____ Mctalminin!_,!: _____________________________ (lo ____ Stone and earth mhwrals __________________ do ___
tilities ____________________________________ .do_---El<•ctric _____________________________________ do. ___ Oas ________________________________________ do. ___
market grouping:
ic~~~~~~~"~dot~~~~~-----~~ ::::::::::::::: :::j2:::: Automotive and home goods _____________ tlo ____
A utomoiive products __________________ do ____ Autos __ ----------- __________________ do __ --Auto parts and allied pro<lucts _____ .. do ____
I [orne goods \l _________________________ do ____ Appliances, TV, and radios __________ do ____ Furniture and rugs __________________ do ____
Apparel and staple~---------------------<10 .... Appar~.J. ineL knit goods and shoes ____ do ____ Consmner staples~ ____________________ do ____
Processed foods. ____________________ .do __ --
Beverages and tobaeco _______________ do ____ Drugs, soap, and toilctries ___________ do ____ Newspapers, magazines, and hooks __ do ____ Consumer fuel and lighting __________ do ____
Equipment, including deferu3et;' ___________ do ____ Business equipment_ ____________________ llo ____
Jndu:strial equipm<"nt_ _________________ do ____ Comm('rcial eqnipment_ _______________ do ____ Freig-ht and passf'ngcr cqnipnwnt _____ do ____ Farm pquipmcnt_ _____________________ do ____
atL1rials. ---------------------- ____________ .do. ___ Durable goods materials I' _________________ do ____
Consumer durable _______________________ do ____ Equipment_ ____________________________ .do ____ Construction_----------------- _________ .rio. ___
Nondurable materials \l ___________________ t!o ____ l Bus mess supplies_---------- ___________ .do. ___
Containers __ ------------------------- _do ____ l General business supplirs ______________ do ____
Business fuel and power\) _______________ t\o ____ l Minera,l fuel~-----.-co·------------- ____ <\o ___ .. , N onresidentml utilities ________________ do ____ J
100 100
H\l 100
!15 96 90 !)2 -~9 92 99 99 ~7 97
!)! 92 Xi) 87 !19 99
91) 96 94 97 96 94
102 103 99 99
Ill Ill 106 109 99 102
10.5 105 104 108 109 112 105 104 107 105
97 101 92 99
106 106 108 107 103 l03
112 108 103 103 103 103 103 104 116 108
~8 \17 9.5 89 99 98 98 98 93 102
llll 101
109 111 109 111 109 113
101 102 105 106 107 106
105 lll4 102 D9 109 112
108 108 109 104 110 ll3
104 106 107 109 104 105 102 103
108 105 105 106 !J6 103
107 Ill
92 92 89 90 86 88 94 95 96 95 88 94
98 99 95 96 91 93 95 96 99 100
102 103 102 102 l04 105 101 101
100 100 98 97
107 108
, Hevisrd. v Prrliminary. t.Ree COITP~J)QlHiin1-! notr on p. 8-2.
102 104 107 109 110
102 104 107 llO llO
98 101 105 109 llO 102 109 113 122 ll8 103 112 117 124 119 99 101 104 109 112 98 !19 103 106 109
94 \J6 100 \04 107 90 93 97 101 104
100 100 103 107 110
96 99 102 104 105 97 103 108 Ill ll3 94 94 95 97 96
103 105 106 110 114 101 106 Ill ll2 116 109 112 115 118 112 109 110 112 116 117 !02 104 107 109 110
107 107 llO Ill Ill !08 Ill ll4 11.5 119 112 114 120 122 122 103 101 107 113 107 109 107 112 ll2 110
102 102 104 104 104 !00 100 104 103 101 108 110 113 115 116 109 112 115 117 122 102 108 1114 10.1 108
113 112 104 105 117 105 104 107 lOR 100 105 105 !Oi lOS !Of\ 104 102 no 109 102 112 107 119 110 102
\16 95 \JS mJ 98 87 82 84 X9 83 \16 97 99 100 100 97 97 100 101 101
101 101 99 102 94 101 103 109 111!1 109
lll 112 112 114 116 110 Ill ll2 114 117 114 114 114 11-5 115
102 103 106 108 108 107 107 Ill Ill 111 105 107 110 113 115
101 106 108 110 113 93 102 108 no ll2
112 112 108 109 115
108 107 112 ll6 117 106 103 110 115 11.5 114 114 117 121 121
107 107 111 111 110 llO 113 118 118 119 106 106 109 109 108 105 1114 107 108 10i
106 104 113 109 11)2 108 108 111 no 111 102 103 104 104 105 110 Ill 110 Ill 112
93 95 97 100 102 91 93 96 100 102 88 90 92 97 100 96 97 100 !02 105 95 95 97 99 97
108 112 119 128 1~2
101 104 108 110 110 99 104 108 112 112 95 102 !Oi 113 117 98 100 102 106 109
101 106 Ill 114 113
104 104 108 108 109 105 104 107 107 107 109 108 Ill llO 108 102 102 106 106 106
100 99 !01 103 103 95 95 9i 99 97
109 111 112 114 117
9lnclud.t>s data nor shmvn s<~parutnly.
lOR 103 103 102 - J02 1(19 > 112
108 104 104 102 102 109 • 112
105 98 97 95 -95 '106 "112 81 46 45 43 '77 '109 p 118 71 29 30 30 '73 '114 p 12.1
Ill 106 106 99 '95 '105 p 109 108 100 99 92 91 '100 p 104
108 107 108 107 '104 '109 p lll 105 103 104 103 '102 '104 p 106 113 ll3 113 112 108 '115 v 118
106 102 98 98 '79 '93 p 107 ll4 106 103 104 '63 '94 p 125 96 96 93 91 '91 - 91 p 89
115 116 117 118 119 '120 P120 118 ll5 112 111 110 111 p 110 117 113 112 111 '112 115 --------120 116 115 116 ' 118 120 p 123 ll3 Ill 111 Ill ' Ill 111 "112
113 113 113 111 Ill '113 p 113 121 117 114 Ill Ill 112 --------122 121 121 122 125 126 --------110 107 104 I 104 104 --------114 113 ll4 114 109 113 --------lOll 107 lOR 107 lOS - 109 p 110 106 107 106 105 104 107 --------117 117 119 '117 117 i 118 --------123 123 125 '122 - 122 , 125 --------108 107 106 106 '!05 '101 Pl03
128 120 120 115 113 116 --------105 !08 108 !06 107 108 --------105 107 107 106 107 !08 --------103 114 113 108 105 --·------ --------117 114 111 114 Ill --------- ~-------
94 91 90 91 '96 98 p 97 71 72 74 '7H '8i 93 p 91 99 98 98 98 '100 !19 p 98 98 97 97 98 '99 97 p 97 i3 48 39 '42 08 79 ---·----
Ill Ill 109 108 • 110 113 --------116 115 117 117 ' llti ' 119 p 120 118 117 119 119 '117 '120 1•120 113 110 110 110 113 116 --------
-lOU 109 109 109 109 !09 v 112 112 112 112 1121 109 113 p 117 118 113 Ill 114 '100 - 114 ,, 128
116 10.5 98 1~~ I i2 -99 p 130
113 97 89 48 87 ,, 134 119 liR 114 117 l 110 117 --------120 120 120
121 I . 121 ' !2ti --------119 121 124 124 · 127 I 135 --------123 120 IIR 120 '120 123
--------~
111 ll2 112 Ill I 112 ll2 p 113 120 117
117 I 118 119 120 ---------108 110 Ill 109 110 110 "Ill 106 107 107 104 - 107 107 p 109
108 ll4 112 110 107 -•w-••••• ---------111 112 115 114 "·' 112 p 113 106 108 110 lOS '!09 liO p 113 113 ll3 114 114 114 115 ---------103 102 103 103 101 '103 p 104 104 103 103 103 '102 103 ---------101 102 101 101 102 104 ·--------107 108 109 Ill '112 113 ---------101 96 92 91 f 87 90 ---------132 109 129 112 106 105 ---------106 98 99 97 100 '108 p 110 103 89 91 88 •92 '106 PIll Ill 102 104 95 '74 104 p 114 106 102 101 103 '102 10.5 "108 113 107 105 102 '101 107 ---------109 107 107 106 108 110 p 110 110 110 110 107 '109 Ill ---------111 111 110 106 107 113 ---------109 109 110 107 '110 Ill ---------99 97 98 98 I 101 103 p 103 94 93 93 r 95 ' '97 98 p 97
116 113 114 m! 113 --------- ---------
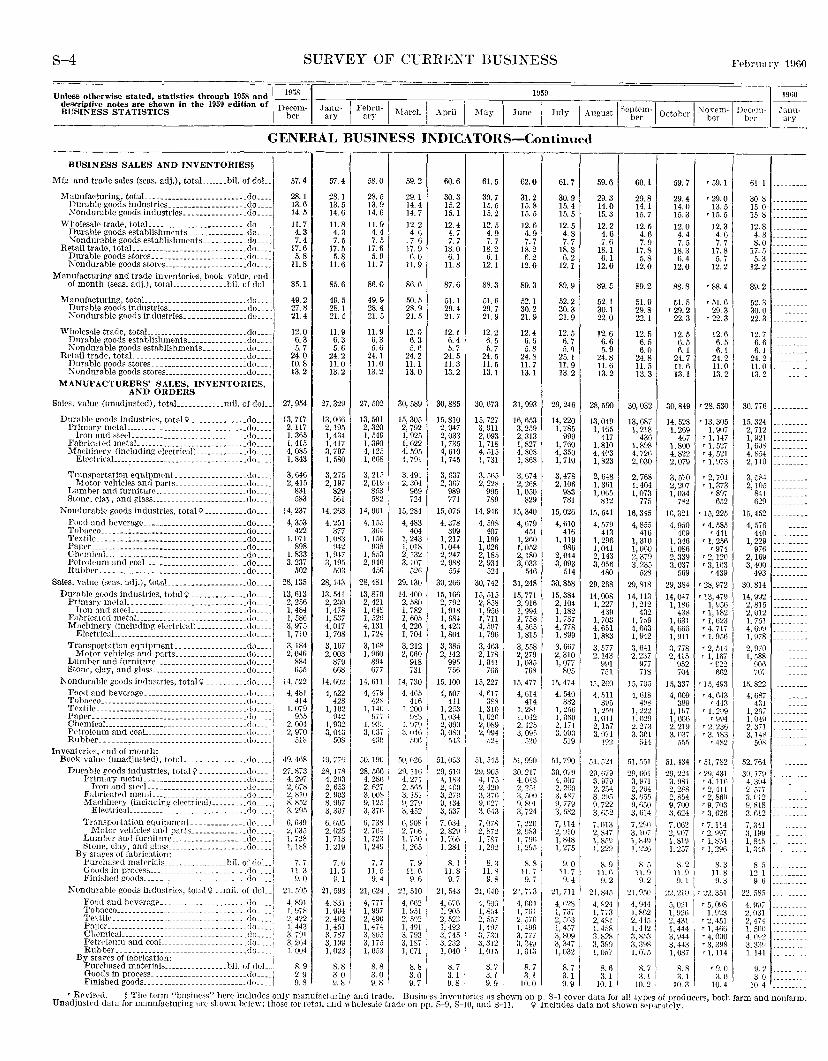
S-4 SURVEY OF CURRENT BUSINESS February 1!JUO
Unless otherwise stated, statistics through 1958 and ~·~~ l!JS!J d~scriptive notes are shown in the 1959 edition of , ' BUSINESS STATISTICS I D'b::n- J~~r I F~~~;•·I?>Iarch I .\pril I May 1 June I July
1
1960
II August IScptrm-1 0 t h '' I ?'\ovem·l n~'('('ill- -- Janu-
ber c 0 cJ bcr bc>r ary
GENERAL BUSINESS INDICATORS-Continued
BUSINESS SALES AND INVENTORIES§ 1 Mfg. and trade sales (seas. adj.), totaL. ___ .. bil. of doL
l\1 anufacturing, totaL .. _--------------- .•.•... do. __ _ Durable goods industries. ------------------.do .. __ :\ondurable goods industries. --------------.do ... .
Wholesale trade, totaL ------------------------do ....
1
Durable goods establishments .........•..... do ... . :\ondurable goods establishments ........... do ... .
Retail trade, totaL ____________________________ do ... . Durable goods stores. -----------------------do .... l
Manufactnring and trade inventories, book value, end :\ondurable goods stores .... --------- ________ do •. --~
of month (seas. adj.), totaL. ............ bil. cf doL
Manufacturing, t?taL .. 0
• _________________ •••• do ... -~ Durable goods mdustnes ____________________ do ... . :\ondurable goods industries ..•.•••......... do ... .
Wholesale trade, totaL ________________________ do ... . Durable goods establishments _______________ do ... . ;.Jondurable goods establishments .....•..... do ... .
Retail trade, totaL ____________________________ do ... . Durable goods stores. __ --------------------.do. __ _ '\ondurable goods stores _____________________ do ....
MANUFACTURERS' SAI,ES, INVENTORIES, AND ORDERS
Sales. value (unadjusted), totaL ___________ mU. of doL.
Durable goods Industries, total Q ______________ do .... l
;Ji~~:~~~m~~~;~~~~==::::::::::::::::::::::~~:::: Machinery (including elcctrical) _____________ do ... .
ElectricaL __________________________ . ___ .. do ... _
Transportation equipment._. __________ ..... do. __ _
L~~~; ,~~~i1~~;1&~~r~~~::::::::::::::::::~~::::1 _stone, rlay, and glass ... : ____________________ clo ____ l
1\ondurable goods Industnes, total'¥ -~---------do ___ _ Food and beverage __________________________ do .... To hnrco .. __ --------------- ____________ . ___ .. do. __ _ Textile. ____ ------------------- _____________ .do. __ . Paper _______________ ------ _____ •.. ___________ do. __ _ ClwmicaL __________ ----------------- ____ . ___ do. __ . Petroleum and coaL _________________________ do .... Rubber .... --------------------------- ...... do. __ _
Sales, value (seas: adj.), totaL ___________________ do .... l Durable goods mdustnes, total Q ______________ do .. ..
:~ifi[f{i~%~~'il::::: :::::::::::::::::::::::~~::::I Marllinery (including electrical) _____________ do .. --I
ElectncaL. ....... __ . ___ .... ____ -- ...•..... do .... i Transportati?n equipment. ___________ ...... do ... -I
Motor velncles and parts .................. do .... , Lumber and furniture _________________ ...... do .. -- f
Stonr, clay, and glass ________________________ do ___ _
Nondurable goods industries, total'( __ . __ .. __ .clo ... _! Food and beverage __________________________ do ____ : Tobacco ___________________ ------- ___________ 1i11 ___ _
'frxt!lc_ ------------------ ___________________ ( l<l ____ ,
~~~~~i;Qi~~====================== == ===== === =~i~= == ~; Pf'trolcum and conL _________________________ do ____ 1
Rubber ____ ---------- _______________________ do ___ _i I
Invt'lnt(lrjes, end of month: i Book value (unadjusted), totaL ............... do .... l
Durable goods industries, total9 ____________ Uo ____ i Primary nwtaL _________________________ do ____ !
Fc~b~~t~t~J ~~~:~~~ ~ =: == == = == === == =~ == == ==gg=::: i ~1achinery (hlcluding electrical) _________ do ____ ;
ElectricaL .... ________________________ do ... _;
Transportation equipment- _____________ do ____ :
L~0t;g~ :~;;ir~~~n~~~e~~~~~==============~i~====! Stone, clay, anrl g'lass ____________________ do ____ ! By staves of fabrication: 1
Pun.'hased matc·rinls ________________ bil. of doL_r
¥~~)i~~~a g~~~~~~~---~==================== =~l~= == =! Nondurabk goodB industries, total Q .. mil. of dol..i
~~h~~c~~~~- ~)~~-'~~~1~~~===::::: =====::: ==::: =~i~ =:::I Te"Xliie __________________________________ do ___ _ Paper _______ . ____ . ___________ . _________ .. do .. __ Clu,•n1icuL _______________________________ do ____ , Petn,lcnm and coaL _____________________ do ____ , Rubber __________________________ ....... do .. _.
By staves of fabrication: i Purchased matcrials ________________ bil. of doL.·
l?i~~f,~~ i'~~d;~~::: :::::::::::::::::::::g~:::::
57.4
28.1 13.6 14.5
II. 7 4. 3 7.4
17.6 5. 8
11.8
85.1
49.2 27.8 21.4
12.0 6.3 5. 7
24.0 10.8 13.2
27,954
I3, 7I7 2, 117 I. 365 1, 415 4, 085 1,843
3. 646 2, 4I5
831 583
14,237
4, 353 422
I, 07I 898
I. 833 3, 237
502
28, I35
I3, 6I3 2, 256 I, 484 I, 586 3. 975 I, 710 3,184 2. 04()
884 1155
H, 522
4, 4~1 414
I. 079 955
2. 004 2 970 '.518
49,468
27. 873 4. 297 2, GIS 2. 810 8 852 3:295
"· r,:w 2, 635 1. 728 1,188
7.7 II. 3 9.0
21. 595
4. 891 I, 978 2. 422 I, 443 3, 791 3. 21i4 1. 001
8. g 2.9 9. 8
57.4
28.I 13.5 14.6
Il.8 4.3 7. 5
17.5 5.8
11.6
85.6
49.5 28.1 21.4
II. 9 6. 3 5. 6
24.2 11.0 13.2
27,329
13,066 2,195 1, 434 1,417 3, 797 1, 580
3, 275 2,197
829 561
I4, 263
4, 25I 377
I, OS:J 942
1, 947 3, 195
503
28, 143
I3, 54! 2, 230 l, 478 1, 537 4. 017 1, 708
3,167 2, 003
879 668
14, C.02
4, 522 428
I, 102 942
~· ~~~ '508
49, ~-;-f)
28,178 4. 2\13 2, ()53 2, 903 8, 9ti7 3, :JOi
6, 695 2. G25 l, 713 1, 219
7. G 11. 5 9.1
21,598
4, 831 I, 904 2, 4ti~
!· ~5~ ,q,,)(,, 3, I99 I, 023
8.8 3. 0 9. 8
58.0
28.5 13.9 14.6 11.9 4. 4 7. 5
17.6 5. 9
II. 7
86.0
49. g 28.4 21.5
11.9 6.3 5. 6
24. I Il.O 13.2
27,502
I3, 50I 2, 320 I, 549 1,390 4, 125 1, GGS
3, 215 2, 019
8ii.'l 582
14, 001 ' 4. I 55 I
3fi4 I,I5t>
938 I, 853 2, 94G
456
28, 48I
I3, 870 2, 42I I, f\48 1, ~12() 4, I31 1, 724
3, I68 I, 9GO
894 677
14, Gll
4, 479 1
42~ 1
I,B\1: U/7 I
1, tl:1~; 3, 037
400
50, 1\)(J
28, 506 4,2SG 2, 627 :J. 008 9.12.1 3, 376
G, 738 2. 704 1, 72::; 1, 24U
7. 7 11. 5
9. 4 2I, (;24
4, 777 1, fl97 2, 49ll 1. 474 3:805 3.I75 I; 053
8.8 3. 0 9. 8
59.2
29.I 14.4 14.7
I2.2 4. 6
. 7. () I7. g 6. 0
II. g
86.6
50.5 28. g 21.5
12.0 6.3 5. 6
24.2 Il.1 I3. 0
30, 589
I5, 305 2, 792 I, 925 I, 622 4, 595 1, 791
3, 49I 2, 304
969 724
I5, 284
4, 483 404
I, 243 1, 018 2.I32 3,107
526
29, I30
I4, 400 2, 580 I, 782 I, 605 4, 226 I, 704
3, 212 2, 060
918 731
14, 730
4, 465 4I6
1. ~00 fJ-:3
1. 979 3, (146
,!)(){)
50, C26
2\l, 1\G 4. 27I 2, 565 3,I.ol 9, 279 3, 452
H, 908 2, /tit) 1. 7."1() I, 21;5
7. 9 11.6
9. fj
2I, 510
4, r.u2 I I, 951 2, 5'):2 1. 491 3. 793 3. IS7 1, 071
8.8 3. 0 9. 7
60.6
30.3 15.2 I5.1
12.4 4. 7 7. 7
18.0 6.1
11.8
87.6
51. I 29.4 21.7
I2.1 6.4 5. 7
24.5 II. 3 13.2
30,885
I5, 810 2, 947 2, 033 1, 735 4, 610 I, 745
3, 637 2, 367
989 77I
I5, 075
4, 378 399
I, 217 1, 044 2, 247 2, 988
554
30,266
I5,166 2, 792 I, 918 l,ll84 4, 423 I, 804
3, 385 2, I42
995 756
15,IOO
4, 507 411
I, 2:i3 1, ll34
~- g~~ I '543 I
51, OD3
29. 510 ( 183 z: 4GO 3, 270 9, 434 3, 537
7. o:l4 2, S2~1 1, 7GG 1, 284
8.1 11.8
9. 7 21, 543
4, G7G I, 9115 2 '2'3 I: 492 3, 745 3 232 1:040
8. 7 3.1 9. 8
61.5
30.7 15.5 15.2
12.5 4. g 7. 7
I8.2 6.I
12.1
88.3
51.6 29.7 21. g
I2. 2 6. 5 5. 7
24.5 11.5 13. I
30,673
I5, 727 3, 011 2, 093 1, 7I8 4, 515 I, 731
3, 51>.5 2, 228
995 789
I4, 946
4. 598 407
I, 199 I, 026 2, I85 2, 934
524
30,742
I5, 5I5 2, 858 I, 956 1, 711 4, 507 I, 796
3463 2:178 1, 041
7(i6
I5, 227
4, f,J( ass
I, 310 I, 021i 2, 009 2, 994
524
51, 515
29, 905 4, 175 2, 420 3, :JiG 9 {'')" I
3: G43 I
7, 078 2, ~12 1, 787 1, 292
8. 3 II. 8
9. 81 2I, 640 4 I'll('
1; 8~4 I 2, 557 I 1, 497 ;;, 730 :;, 312 I, 015
8. 7 3.1 9. 9
62.0
31.2 I5. 8 I5. 5
I2. 6 4.9 7. 7
I8. 2 6.2
I2.0
89.3
52.1 30.2 21. g
12.4 6. 6 5. 8
24.8 11.7 13.I
3I, 993
I6, 653 3, 259 2, 3I3 I, 827 4, 808 1,868
3, 674 2, 2G8 I, 050
829
I5, 340
4, 679 451
I, 200 I, 052 2, I80 3, 033
546 3I, 248
15,771 2, 916 I, 994 I, 758 4, 565 I, 815
3, 558 2, 279 I, 035
768
I5, 477
4, 6I4 414
1. 281 l, 042
2,1251 3, 09fi 0:?0
,)], 990
:10,217 4, 013 2, 2:•I a. uoo 9, 8!11 3, 724 7, 220 2, 9S:J 1, itHi 1,205
8.8 11.7
9. 7 21,773
4, 604 l, 7f;4 2. 570 1, 49!) 3, 777 3, 249 1, 0!3
8. 7 3.1
10.0
61.7
30.9 15.4 15. 5
12. 5 4.8 7. 7
18.3 6.2
12.I
89.9
52.2 30.3 21.9
12. 5 6. 7 5. q
25.1 II. g 13.2
29,246
I4, 220 1, 785
999 1, 7GO 4, 350 I, 710
3, 478 2,106
983 781
I5, 026
4, 610 4I6
I, 119 986
2, 044 3, 093
514
30,858
15,384 2, I04 1,I82 I, 787 4, 778 I, 899
3, 667 2, 310 I, 077
805
I5, <174
4, 540 382
I, 256 1, 0(-iO 2, 171 3, 093
519
M, 79o ! 30,079
4, 007 2, 200 3. 4b7 9, 779 3, 582
7, 114 2, 910 I, 848 1, 275
9.0 11.7
9. 4
21,711
4.1i'28 1; 737 2, ,1()3 1, 457 3, 809 3, 347 1, 032
8. 7 3.1 9.9
59.6
29.3 14.0 15.3 I2.2 4. 6 7. (i
18.1 6.1
I2.0
89.5
52.1 30.1 22.0
12.6 6.6 5. g
24.8 11.6 I3.2
28,590
13,049 I, W5
4I7 1,810 4, 4C3 1, ~23
2, 648 I, 31\1 1, 065
8I2
15, 541
4,579 413
1, 296 I, 04I 2, 143 3,056
4RO 29, 268
14,008 I, 227
439 I, 703 4, 651 I, sg3
3, 577 2,143
fi~Jl 751
If, 260
4, 511 3\:15
1. 2[-0 l, Oil 2, I 57 3, 071
'lfl2
2?, <>79 3. 979 2, 2ii4 3.2!).1 9. 722 3. ()52
7.013 2. S47 I. 85\i 1, 229
8. 9 11. r; (1.2
21.845
4, <24 1, 773 2, 4Rl 1.-158 3, 878 3, 399 1.057
8. 6 3.1
10. I
60.1
29.8 14.1 I5. 7 12.5 4.6 7. g
17.8 5. 8
12.0
89.2
51.9 29.8 22.1
12.5 6. 5 6.0
24.8 II. 5 13.3
30,032
13,687 1, 218
436 I, 898 4. 726 2,030
2, 768 1, 404 1,073
775
16,315
4, 855 416
1, 310 1,060 2,379 3, 235
528
29,818
14, 113 1, 212
432 1, 759 4,663 I, 942
3, 64I 2. 2:17
977 718
15, ;o;, 4, (i)8
408 l, ~22 1,029 2.273 3.301
[!44
51.5.51
29, GOI 3, 971 2, 21i4 3,035 0, 050 3, (il4
7, 290 3, ](17
i: ~~~~ l s_ 5
11.9 9. 2
~1. P50
4, 9441 I ~52 2:440 I I. 442 3, t;53 3,:_Hl8 1.075
8. 7 3.1
10.2
59.7
29.4 14.0 15.3
12.0 4. 4 7. 5
IS. 3 6. 4
12.0
88.8
51.5 '29.2
22.3
12.5 6. 5 6. I
21.7 II. 6 I3. 1
'59. I
'29.0 I3. 5
'15. 5 I2. 3 4. 6 7. 7
17.8 5. 7
I2.2
'88.4
'51. 6 29.3
'22. 3
12.6 6. 5 6. 1
24.2 II. 0 13.2
30. 849 ' 28, 530
I4, 528 I, 269
467 I,800 4, 822 2, 079
'I3, 305 1, 907
'I, 147 '1, 527 '4, 521 1 1, 973
3, 570 T 2, 701 2, 207 1 1, 373 I, 034 '897
782 6.52
I6, 32I ' I5, 225
4, 950 ' 4, 585 409 '441
I, 346 '1, 256 1,086 '974 2, 339 '2, I20 3, 037 ' 3, 103
569 '439
29, 384 ' 28, 972
14,047 1,186
438 I, 631 4, 666 I, 9ll
3, 778 2,415
B52 704
I5, 337
4, 609 399
1, Hl7 1,006 2,219 3,1137
.)55
' I3, 479 1, 956
'1, 182 r 1, 623 1 4,717 'I, 956
'2, 514 r 1, 167
r £22 662
'15, 493
'4, 643 '443
T I, 209 1 904
'2, 236 '3. I83
T 482
51.-134 '51, 782 29,224 3, 98I 2.288 2, l-\54 9, 700 8,62/:i:
7,062 2. \J07 1,819 1, 237
8. 2 ll. 9 I 9.I I
n,zw 5, 021 1, 92() 2 43! I: 444 3, 944 3, 443 I, 087
8. 8 3.1
IO. 3
'29, 431 '4, 1\61 '2, 411
; ~: ~g~ I '3, 626
'7, 114 T 2, 997 '1, 8:l4 1 1, 290
8. 3 Il. 8 fl. 3
r 22,351
'5, 0()8 1. 923
1 2,451 1 1,46G '4, 000 '3, 398 '1. ll4
'9. 0 3. ()
10.4
61. I
30.8 I5. 0 15. 8
I2. 8 4. 8 8.0
17 .. 5 5. 3
12.2
89.2
52.3 30.0 22.3
I2. 7 6.6 6 I
24.2 II. 0 I3. 2
30,776
15. 324 2, 712 I, n1 -------I,608 __ 4. 8.)4 ----2,110 ---
3, 584 2,105
841 629
15, 452
4, ,}76 440
1, 229 976
2, 169 3,400
493
30, 8I4
14,992 2, 815 2, 012 I, 751 4, 699 I, 978
2, 970 1, 588
906 707
I5. 822 4, 687
431 -----1, 2fii ---1.04\1 2, 37I 3,148
50~
52.764
30. I7~ 4. 3114 2, 577 3.1112 ~- 818 3. G12
7, 34I :l, Hl9 I, 84:> I, 345 --- .. '"
8 .I __ I2 I 9. 6 --- "' --
22, 58S
4, ~ID/ 2, 031 2, 474 I, 500 ----4, m12 __ _ 3,3:1f1
1,H1
9. 2 3.(1
104
"RPvisect. §The term "business" here includes only manufaC'turinp.: and trade. Business invrntories a<; shown on p. S-1 cover data for all types of produccr'3, both farm and nonfarm. Unadjusted data for mannfaeturing are shown brlow; those for retail and wholesale trade on pp. S-9, S-10, and 8-11. 9 Includes data not shown s<·parately.
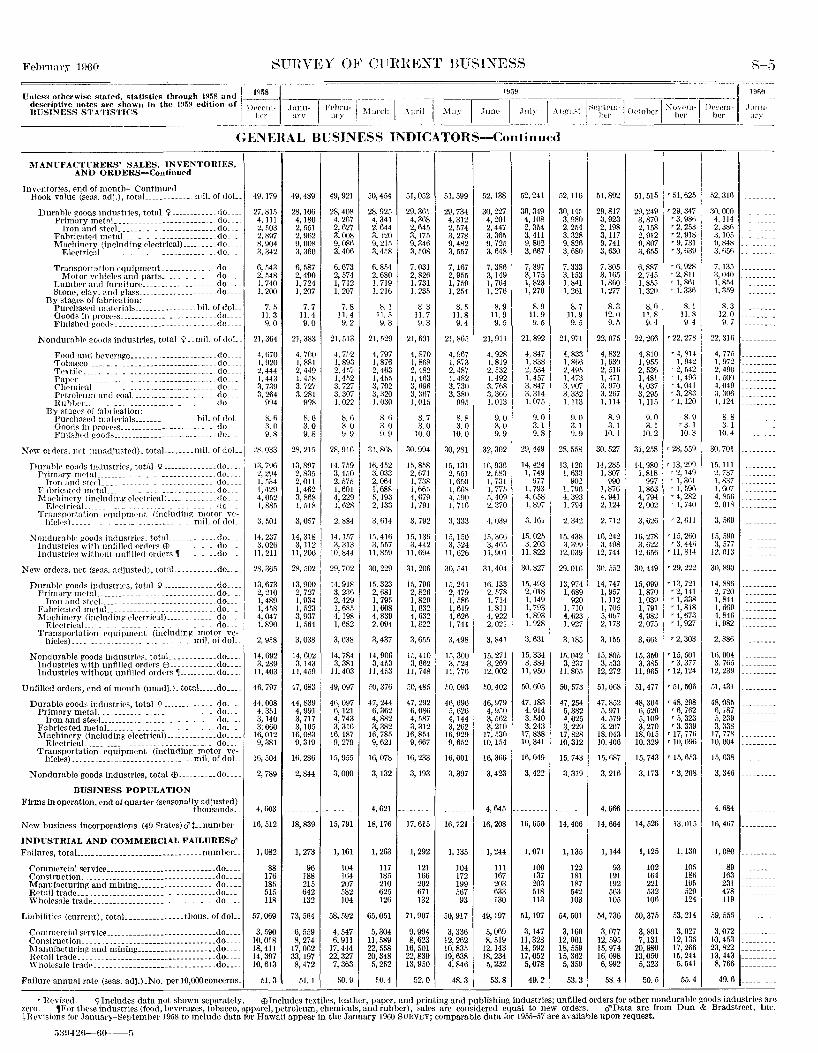
Febrnary 1!)()0 SUHVEY OF CliRRENT BUSINESS
Unle~H ~therwi~e Ht~~~~. statistics through HH'iS -and I IH58- -~-. - ··- . ----- - -descriptive notes art' shown in the 1!15H edition of: DPC'('!tl- J·mu- I fphru-1 I BUSINESS STATISTICS j 1,..r · ;,ry my , C\larch
--------- ---- ------
Gf:NEHAL BUSINESS INDICATORS-Continued
MANUFACTURERS' SALES, INVENTORIES, AND ORDERS-Continued
Jnvt'ntories, €'nd of month--Continurd Book value (seas. adj.), totaL _________ miL of doL
Dnrable ROOds indnstriPs, total \? ----------- <lo Primary metaL ________________________ do_
Iron and steeL _______________________ do_ Fabrirated mPtaL _______ ----------- do_ Maehinl'ry (including electrical) ________ do_
ElectricaL -----------------------do_
Transportation HJUlpment ______________ do ___ _ Motor VPhic1('S and pa.rts ______________ do ___ _
Lumber rmd t'nrniturc ___________________ do ___ _ Stone, clay, and vlass ____________________ do ___ _
By stages of fabrieation: Purchased mat<•rials ________________ biL of doL Goods in procr:-s ________________________ do ___ _ Finishc<l goo<!~_------------------ ----- do ___ _
Nondurable roods industries, total \? __ miL of doL
Food and beverage.------~--------- do Tobacco ____ ------------------------. do_ TPxtile __________ ------------------- do_ PnpPr __ ----------------------------- do_ ChemicaL. ____ ----------------- _ do_ PPtrolC'nm and coaL________________ do_ Ruhtwr _________ ----------------- do_
By R!agps of fnbrieMion: PurchnS<·d mllt<'rinls ________________ biL of doL GoodE' i11 })J"OC('~s _______ ---------------- _ do __ _ Fini~h('(l !.roodf.l __________________________ do_ -~
Kew orders, ll<'t (ulla<ljusted), totaL _______ miL of doL_
J)urahlr- goods 1IH1Ustri('S1 total 9----------- do_ Primary mrtnL _______________ ----------- do_
Jronandst<'t'L_____________ _____ do_ F:lhricated mdaL_ _ _ _ _ ___ _____ _ do_ M:whinery (including electrical)____ ____ do_
ElectricaL_______ _ _ do __ Transportation ('quipmf'nt (inr1uding motor V<'-
hicles) ___________________________ nliL of doL
N ondurahh, goods indus triP~. totnl ____________ .do_ Industries with un!'llkd ordrr~ EB--- ________ do_ ln<lustrirs without unfillr•d onh•rs fJ __________ {}o
New orders, net (scns. adjustP<l), totaL __________ do_
Durable goods industriPs, total '1--------------do_ Primary nl<•taL ___________________________ do_
Iron and stt•cL ___________________________ do_ Fabricated Illl•taL _______________________ do_ Machinery !including- electrical) _____ ---- ____ do_
F.lc>ctrical_____ _ _____ _ __________ do __ _ Transportation equipment (including motor ve-
hicles)______ _miL of doL
Nondurable goods industri<'s, totaL ___________ do __ _ Industries with unfilled ordPrs Ef> ____________ do ___ _ Industries without unfilled orders 1---------- do ___ _
Unfilled orders, end of month (unadj.), totnL ___ do ___ _
Durable goods industries, total '1------------- do ___ _ Primary metaL ___________ --------------- do ___ _
Iron and steeL _________ ------------- do ___ _ Fabricated metaL ____________ -----------do ___ _ Machinery (including electrical) ______ ----- do ___ _
ElectricaL __________________ -------· _ -· __ do __ _ Transportation equipment (including motor ve-
hicles) _______________________________ miL of doL
Nondurable goods industries, total GJ __________ do ___ _
BUSINESS POPULATION Firms In operation, end of quarter (seasonally adjusted)
thousands_
49, I7H
27,81.1 4, Ill 2, o03 2,897 8, 904 3, 342
6, .143 2,.148 1, 740 1, 200
7. [) 1L 3 9, 0
21,364
4, ()70 1, 920 2,444 1, 443 3, 739 3, 264
994
8. 6 :J. 0 9.8
28,033
1:1,796 2, 294 1, .134 1,429 4,0.\2 1, 88.1
3, 501
14,237 3,026
11, 211
28, 36.1
13,673 2, 210 1, 489 1,408 4, 047 1, 890
2, 9fi8
14,692 3, 289
11, 403
46, 797
44,008 4, 351 3,140 3, 060
16,012 9, 381
16,504
2, 789
49,489
28, 106 4, ISO 2, 551 2, 962 9, 008 3,360
6, 587 2, 490 !, 724 1, 207
7. 7 11.4 9.0
21,383
4, 700 1,881 2, 449 1,4,18 3, 727 3, 281
998
8. 6 3.0 9.8
28, 215
13,897 2, 835 2,011 1,462 3, 868 1, 518
3,0-'7
14,318 3,112
11,206
28, 502
13,900 2, 727 1, 934 1, .123 3, 937 1. 564
3, 038
14,602 3, 143
11,459
47, 683
4!: ~~~ 3, 717 3,105
16,083 9,319
16,286
2, 844
49,921
28,408 4, 267 2,627 3,008 9,086 3, 406
6,673 2, [)74 I, 712 I, 207
7. 8 11.4
g_ 2
21,513
4, 7c2 I, 89:l 2, 4b7 ],4."i2 3, 727 3,307 1, 022
8.6 3. 0 9. 9
28,916
14,759 3,450 2, 57.1 1,601 4, 229 1, 628
2, 884
14, 1.17 3, 31:1
10, 844
2\\702
14,918 3, 23f} 2,429 I, 68.1 4,198 I, 682
3, 038
14,784 3, 381
11, 403
49,097
4ll,097 6,121 4, 743 3, 316
16,187 9, 279
1.1, 955
3, 000
50,454
28,925 4, 341 2, 644 3.120 9. 21;; 3,4.c8
6,854 2, 680 1, 719 1, 216
8.1 11. ,I 9. 3
21, "29
4, 797 1, 876 2, 463 1, 4flf:i 3, 702 3, 320 1, 030
8,6 :J.O 9. 9
31,868
16,4.12 a, o:13 2,064 l,G88 -I, 19:1 2,133
3, 614
L'\ 416 :J,.o.\7
11,859
ao, 229
1fi,323 2, 681 1, 795 1,608 4, 839 2,094
3, 437
14,906 3,453
11,453
fO, 376
47, 241 6, 362 4, 882 3,382
16,78.1 9, 621
16,078
3,132
51,052
29,361 4,368 2, 64.1 3, I7o 9, 346 3, F08
7,031 2, 826 1, 731 1, 235
8. 3 11.7 9_3
21,691
4,870 1, 868 2, 482 1,463 3, 696 3, 367 1,015
8. 7 3. 0
10.0
30,994
Ifl,858 2, ll71 1, 738 1,665 4,679 I, 791
3, 792
l!i, 136 3, 442
11, 6\)4
31,206
1.1, 796 2, 82f> 1, 829 1, 632 4,632 1, 822
3, 6.\.1
1.1,410 3, 662
11,748
r:o, 4So
47, 292 6, 086 4, 587 3, 312
16,854 9, 667
16,233
3,193
51,599
29,734 4, 312 2, .174 3, 278 9,482 3, 557
7,167 2, 950 1, 7.19 1,2.54
8. !i 11.8 9. 4
21,860
4, 967 1, 873 2, 487 1, 482 3, 730 3, 3~0
995
8, 8 3.0
10.0
30,281
1.1, J:ll 2, 051 1,6f.O I, 668 4, ii90 1, 716
3, 333
lo, 1-10 3, 524
11, 626
30,541
1!), 24] 2, 479 1, 586 1,619 4,626 1, 744
3,498
1.1, 300 3, ,524
11,776
[(), 093
46,696 5, 626 4, 144 3, 262
16,929 9,652
16,001
3, 397
52,138
30,227 4, 201 2,447 3, 365 9, 725 3, 648
7,386 3,149 1, 764 1, 276
8.9 11.9 9. 5
21,911
4, 928 1,819 2, ;';32 ]. 492 3, 768 3, 366 I, 013
9. 0 3.0 9.9
32.302
16,930 2, ,<83 1, 731 1, 77,':) ;;,409 2, 370
4, 039
1.\3G6 3, 4G5
11,901
31,404
16,133 2, 578 1, 714 1, 811 4, 922 2, 021
3, 841
1.1, 271 3, 269
12,002
W,402
46,979 4, 950 3, 562 3, 210
17,530 10,154
16,366
3,423
4,645
52.241
30,349 4,108 2, 354 3, 411 9, 802 3, 667
7, 397 3, 175 1,823 1, 270
8.9 11.9 9.5
21,892
4, 847 1. 838 2, 534 1, 457 3, 847 3, 314 1. 075
9.0 3. 1 v. 8
29,449
14,424 I, 749
977 1.793 4, 658 1. 897
3,161
1-5,025 3, 203
11, 822
30, 827
15,493 2, 018 1, 149 1, 793 4, 893 1. 928
3, 631
15,334 3, 384
11,950
50, 605
47,183 4, 914 3, 540 3, 243
17,838 10,341
16,049
3, 422
52, 116
30, 145 3, 980 2, 2.54 3, 328 9, 826 3, 680
7,333 3, !53 1, 841 I, 261
8. 7 11.9 9. 5
21,971
4, 833 1, 8{i() 2, 4115 1. 473 3, ~107 3,332 1. 113
9.0 3. I 9. 9
28. 558
13,120 !, 633
902 1. 'i~l6 4, 3!13 1, 794
2, 342
15,438 3, 399
12,039
29,01fl
13,974 1, 689
920 1. 710 4, 623 1. 927
3,185
15,042 3, 237
11, 805
50,573
47,254 5,382 4, 025 3, 229
17,828 10,312
15,743
3, 319
51,892
29.817 3, 923 2,198 3,117 9. 741 3,630
7,305 3,165 1, 860 1, 277
8_3 12.0 9. 5
22,075
4, 832 1, 930 2. 516 1,-171 3, 970 3, 267 1.114
8.9 3. 1
10.1
30,527
14,285 1,807
990 1,876 4, 941 2,124
2. 712
If>, 242 3, 498
12,744
30.552
14,747 1, 957 1. 112 1, 705 5,067 2,173
3,155
15,805 3, 533
12,272
51,068
47,852 5, 971
Ub? i 18.043 10,406
15,687
3, 216
4, 666
New business incorporations (49 Sta!Ps)ci't--number_
INDUSTRIAL AND COMMERCIAL FAILURESci'
4, 603
16, 512 18,839 15,791
4, 621
18, 176 17,615 16,721 16, 208 16, 650 14,406 14, 664
Failures, totaL ____________ ----------------- _number._
Comnwrcial se-rvice _____ ------------------_--- _do ___ _ Construction ___ .. _ .. ___________________________ _do __ --Manufacturing and mining ____________________ do __ --Retail trade ___________________________________ do ___ _ Whol<•sale trade ______ ----------------- ________ do ___ _
LlabilitiPs (current), totaL ______________ thous. of doL_
Conimrrcial sf•ryicr _________ -------- __ -_----- __ do. __ _ Construetion_ _ ______ --------------- ________ do ___ _ Manufacturing and mlnlng ____________________ do ___ _ R<'tail trade ___ ------------------------------do ___ _ \Yholcsale trade _______________________________ do ___ _
Failure annual rate (seas. adj,)_No. per!O,OOOconcerns_
1, 082
88 176 185 515 118
57,069
3, .\90 10,0[8 18,411 14,397 10,613
51.3
1, 273
96 188 215 642 132
73,564
6, 559 8, 274
17,062 33,197 8, 472
51. I
I, 161
104 164 207 582 104
58,592
4, 547 6, 911
17,444 22,327 7, 363
50.9
1,263
117 185 210 625 126
65,051
5,304 II, 589 22,558 20,348
5, 2.12
f_0_4
I, 292
121 166 202 671 132
71,907
9, 994 8, 623
16,501 22,839 13,950
I, 135
104 172 199 567 93
50,917
3, 336 12,262 10,83.5 19,638 4,846
48.3
I, 244
Ill 167 203 633 130
49, 197
5, 069 8, 519
12,143 18,234 5, 232
53.8
1,071
100 137 203 518 113
51,197
3,147 11, 328 14, 592 17,052 5,078
49.2
1, 135
122 181 187 542 103
54,501
3,160 12, 061 18,559 15, 362 5, 359
53.3
1, 144
93 191 192 563 105
54,736
3, 077 12,595 15,974 16,098 6, 992
58. 4
51,515
29,249 3,870 2,158 2, 912 9,807 3,655
6,887 2, 74-5 1,855 1,320
8.0 11.8 9. 4
, 51, 62.1 I '29, 347 ' , 3,9sli 1 '2, 2.13
:?.m '3, 1)39
'1\, 928 '2, 811
::: ~~~ 8.1
11.8 9.4
22, 266 ' 22, 278
4, 810 '4, 814 1,%5 1,942 2, 536 ' 2, 542 1,481 'I, 49() 4, 037 '4, 041 3, 295 ' 3, 28:J I, 115 ' 1. 120
9.0 R-~ 3.1 '3.1
10.2 10.3
31,258 '28, 559
14,980 I, 818
997 1,863 4, 794 2,002
3,626
'13,299 '2, 1491 r 1. 3()1 r 1~ 5\lf\ '4, 282 '1, 740
'2,D11
16,278 ' 15, 2li0 3, 622 ' 3. 441\
12,656 ' II, 814
30, 449 ' 29, 222
15,099 1,870 1,039 I, 791 4, 982 2,075
3,661
'13, 721 '2, 141 '1, 338 '1, 818 r 4,67:1 r 1, 927
'2,303
15,350 ' 15, 501 3, 385 ' 3, 377
11,905 '12, 124
51,477 '51, 506
48,304 6,520 5,109 3, 270
18,015 10,329
15,743
3,173
'48, 298 '6, 762 '5, 323 '3. 339
r 17, 776 r 10, 09t)
r 15, 653
'3, 208
.52, 316
:Jo, ooo 4, 114 2,38() 3, 10.1 9, 848 3, fi56
7,135 a.040 1,8.14 1, 359
8. 3 12.0 9.7
22,3W
4, 775 1. 972 2, 490 1. 5(Xl 4,049 a, 30H 1,124
8. 8 a. 1
10.4
30,701
15, 111 2, 737 1, 837 l,fl.l7 4, 8.1(\ 2. 018
3, 5li9
1.1, 590 ;;, 577
12,013
30,890
14, SSG 2, 720 1, 844 1, tl69 4, 84(\ I, 982
2,886
lfi.004 3_ 7fi5
12,239
.51, 431
48,085 fi, 787 5, 239 3, 338
17,778 10,004
15,638
3,346
4. (i84
14,526 13,01.5 16, 467
1,125
102 164 221 532 106
50,375
3,891 7,131
20,980 13,050
5,323
50.5
1,130
105 186 IU5 520 124
53,214
3,027 12, 136 17,266 15,244
5, 541
55.4
1,080
89 163 231 478 119
59, 556
3,072 10,453 23,822 13,443 8, 766
49.6
' H<•vised. 'I Includes data not shown separately. EE> Includes textiles, leather, paper, and printing and publishing Industries; unfilled orders for other nondurable goods industries are zero. 1For tileS<' industries (food, !leverages, tobacco, apparel, petroleum, chemicals, and rubber), sales are considered equal to new orders. ci'Data are from Dun & Bradstreet, Inc. tHevisions for January-September 1958 to include data for Hawaii appear in the January 1960 SURVEY; comparable data for 1955-57 are available upon request.
r;:m-t26-!\0-- --fi
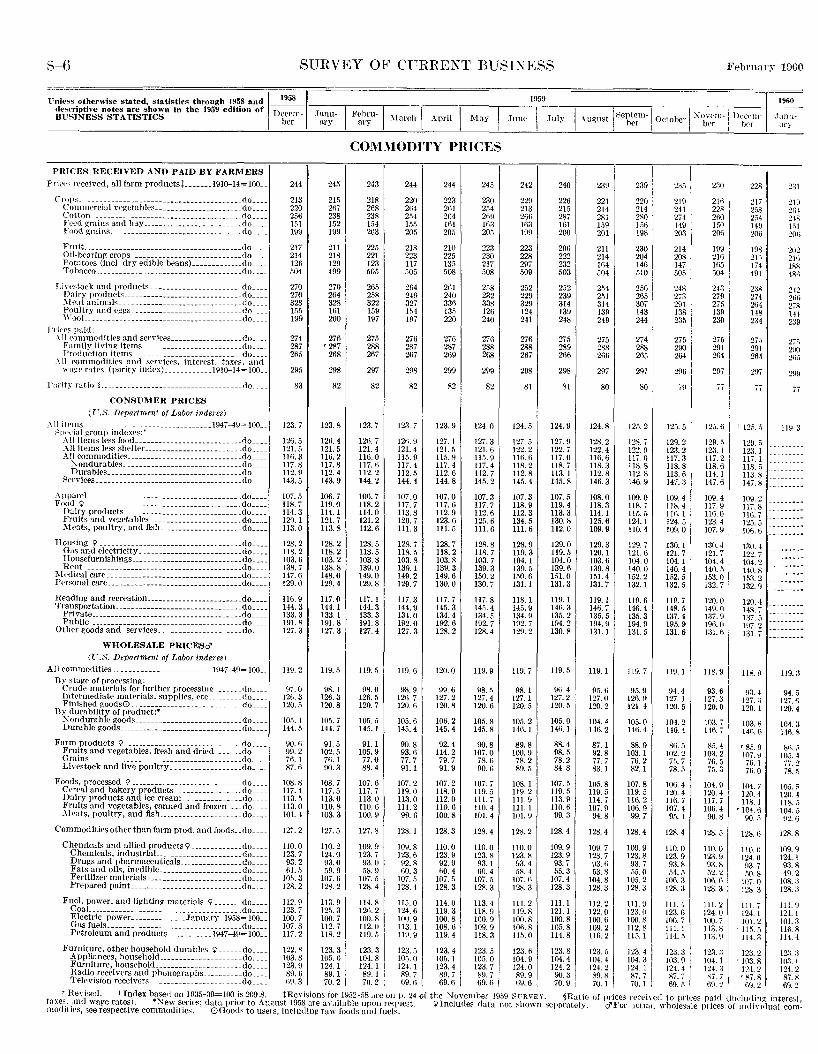
S-fi SURVEY OF CrRRI<:NT BUSIXESS
- I lin less otherwise stated, statistics through 1958 and _ 1958 _ desrriptive notes are shown in the 195!) edition of I Decrm-Bl'SJNESS STATISTICS her
PRICES RECEIVED AND PAID BY FARMERS Prieps received, all farm productst _______ 1910-14=100 __
Crops. ___________________ ---------------------do. __ _ C ornmercial vegetables ______________________ do ___ _ Colton _____________ . ________________________ do ___ _ Feed grains and hay _________________________ do ___ _ Foocl grains. __ -----------------------------.do ___ _ Fruit. . ______________________________________ do ___ _ Oil-hcnring crops ___________________________ do ___ _ Potatoc's (inrl. dry edible beans) _____________ do ___ _ Tohacco. ____________________________________ do ___ _
Liwstock and products. ______________________ do. __ _ Dairy products. ____ ------------------------ .do. __ _ ::\I rat animals _______________________________ do ___ _ Poultry and eggs ___________________________ do ___ _ WooL. ______________________________________ do ___ _
Prkr-~ paid: .\Il eommoditif'S and servicrs __________________ do ___ _
Fnrnily living itrms ________________________ do ___ _ Production items __________________________ --do ___ _
.\11 eommoditirs and srrviePs, intrn'st, taxrs. and 1nwe ratl's (parity index) ____________ l910-14=100 __
Parity ratio § ____ --------------------- ___________ rlo ___ _
CONSUMER PRICES
( CS. Department of Labor in de res)
A 1l itPms . ------------------------------1947-4\1= JO(L Spt~eial group inde:-a•s:*
All items less food ___________________________ do ___ _ All items less shelter_ ________________________ do ___ _ .-\ll commodities ____________ ---------------- .do ___ _
X ondurables .. ------- _____________________ do ___ _ Dura bles. ________ ---------------- ________ .do ___ _
Srrvices __________ -------- __ ------------ _____ do ___ _
Apparel ...... _________ ------------------------ _do. __ _ Food I! __ -------------------------------------do ___ _ Dairy products. ________ ------ _______________ do. __ _
Fruits and ve~etables _---------------------do ___ _ :\lmts, poultry, and fish. ____________________ do ___ _
Housii1~ I! ___ ---------------------------------do ___ _ Gas and electricity _________________________ .do ___ _ Housefurnish ings ____________________________ do. __ _ Rent _________ ----------- __ ----------------_do. __ _
l\ledical care. ___ ----------------------------- _do ___ _ Pl'rsonal care .. _______ -------------------------do. __ _
Rl'adin~ and recreation------------------------do ___ _ Transportation _________ ---------- ___________ -.do. __ _
Private ______________________________________ do. __ _ Public ______________________________________ do ___ _
Otlwr goods and services. ____________________ do ___ _
WHOLESALE PRICESci'
(U.S. Department of Labor indens) All commodities .. _______________________ 1947-49=100 __
By stugr of proct•ssing: Crude matrrials for furthrr fJI'Oct'ssing ______ l}o_ Intt>rmediate matf'rials, supplif's, rte ________ do __ _ Finished goods0. __________________________ do ___ _
By durability of product:* ~ ondurablP goods ______________ ---------- __ _c]o ___ _ Durable goods _______________________________ do ___ _
Farm products I! -----------------------------do ___ _ Fruits and vegetables, fresh and dried _______ do ___ _ Grains_ . ------------------------------------do ___ _ Liwstock and live poultry __________________ do ___ _
Foods, processed I! ----------------------------do ___ _ Cereal and bakery products .. _______________ do ___ _ Dairy products and ice cream .. _____________ do ___ _ Fruits and vegetables, canned and frozen ___ do ___ _ .\!eats, poultry, and fish _____________________ do ___ _
Commodities other than farm prod. and foods .. do ___ _
Chemicals and allied products I' _____________ do ___ _ Chemicals, industriaL ___________________ do ___ _ Drugs and pharmacenticals ________________ do ___ _ Fats and oils, inedible _____________________ do ___ _ Fertilizer materials ____________ -----------_ do. __ _ Prepared paint ____________________________ do ___ _
Fuel, power, and lightin!! materials I' ______ _do ___ _ CoaL ______________________________________ do ___ _ Electric power. _____________ .January 1958=100 __ Gas fuels_-------------------------- _______ do ___ _ Petroleum and products. __________ !947-49=100 __
Furniture, other household durables <;> ______ do ___ _ Appliances, household ____________________ _cto ___ _ Furniture, household ______________________ do ___ _ Radio receivers and pllonographs __________ cto ___ _ ':Pelevision receivers _______________________ do ___ _
244
213 220 256 !51 199
217 214 121) ·'04
270 270 328 1.15 199
274 287 265
29.1
83
123.7
126.5 121.5 !Hi. 3 117.8 112.9 143.5
IU7. 5 118.7 114.3 120.1 113.0
128.2 118.2 103.6 138.7 147.6 129.0
116.9 144.3 133. 3 191. s 127.3
119.2
!17. 0 121\.3 120.5
105.4 144.5
90.6 99.2 76.1 87.6
108.8 117.4 113.5 113.0 101.4
127.2
110.0 123.7 93.2 t\1. 5
105.3 128.2
112.9 123.7 100.7 107.8 117.2
!22.R 103.8 123.9 89.6 69.3
1959
J~~l~- I F;~~u-1 March I April I !\lay I June I July
245
2!.1 2fi7 238 !.52 199
211 218 129 499
270 264 328 161 200
276 '287
268
298
82
123.8
12!1. 4 121.5 116.2 117.8 112.4 143.9
106.7 119.0 114. I 121.7 113.8
128.2 118.2 103.2 138.8 148.0 129.4
117.0 144.1 133.1 191.8 127.3
119.5
US.! 126.3 120.8
105.7 144.7
91.5 102.5 76.1 90.3
108.7 117.5 113.0 110.8 103.3
127.5
110.2 124.0 93.0 59.9
107.6 128.2
113.9 125.3 100.7 112.7 118.2
123.3 105.0 124.1 89.1 70.2
COMMODITY PRICES
243
218 268 238 !54 203
225 221 123 505
265 258 322 159 197
275 288 267
297
82
123.7
121). 7 121.4 116.0 117. t\ 112.2 144.2
106.7 118.2 114.0 121.2 112.6
128.5 118.5 103.8 139.0 149.0 129.8
117. 1 144.3 133.3 191.8 127.4
119.5
98.0 126.5 120.7
105.5 145. I
91.1 105.9 77.0 88.4
107.6 117.7 113.0 110.6 100.9
127.8
109.9 123.7 93.0 58.9
107.5 128.4
114.8 126.2 100.8 112.0 ll9. 5
123.3 104.8 124. I I 89.1 70.2
244
220 2f\4 254 15.1 205
218 223 117 505
204 249 327 !54 197
276 287 2()7
298
82
123. 7
12n. n 121.4 115.9 117.4 112.5 144.4
107.0 117.7 113.8 120.7 111.3
128.7 118 .. 5 103.8 139. 1 149.2 129.7
117.3 144.9 134.0 192.0 127.3
119.6
98.9 121\. 7 120.6
105.6 145.4
90.8 93.6 77.7 91.1
107. 2 119.0 113.0 111.2 99.6
128.1
109.8 123.6 92.8 t\0. 3
107.5 128.4
115.0 124.6 100.9 113. I 119.9
123 .. 5 105.0 124. I 89.7 69.6
244
223 2!\1 204 ltH 205
210 225 13., .108
261 240 331\ 13fl 220
27() 287 269
299
82
123.9
127. 1 121.5 115.9 117.4 112.6 144.8
107.0 117.6 112.9 123.6 111.5
128.7 118.2 103.8 139.3 149.6 130.0
117. 7 145.3 134.4 192.6 128.2
120.0
\)9. 6 127.2 120.8
106.2 145.4
92.4 114.2 79.7 91.9
107.2 118.9 112.0 110.6 100.8
128.3
110.0 123.9 92.9 f\0. 4
107. r, 128.3
114.0 119.3 100.8 108. 6 119. 4
123.4 105.1 123.4 89. 7 69.6
245
230 2.54 269 Jf,3 205
223 230 217 .108
258 232 338 126 240
276 288 2fJ8
299
82
124.0
127.3 121. t; 11.1. 9 117.4 112. 7 145.2
107.3 117.7 112.6 125.6 111.6
128.8 118.7 103.7 139.3 150.2 130.7
117.8 145.4 134.5 192.7 128.4
119.9
98 .• I 127.4 120.6
105.8 145.8
90.8 107.0 78.6 90.6
107.7 119.5 111.7 110. 4 101.4
128.4
110.0 123.8 93.1 60.4
107.5 128.3
113.4 118.9 100.9 109.9 118.3
123.5 105.0 123.7 89.7 69.6
242
229 213 26{\ 163 199
223 228 297 509
252 229 329 124 241
276 288 267
298
81
124.5
127.5 122.2 116. f\ 118.2 112.8 145.4
107.3 118.9 112.3 134.5 111.6
128.9 119.3 104.1 139.5 1.50. 6 131. 1
118. 1 145.9 134.9 192.7 129.2
119.7
98.1 127.1 120.5
10.5. 2 146.1
89.8 100.9 78.2 89.5
108.1 119.2 111.9 Ill. I 101.9
!28. 2
110.0 123.8 93.4 58. 4
107.6 128.3
111.2 119.8 100.8 106.8 115.0
123.6 104.9 124.0 89.9 69.6
240
226 21.5 287 161 200
200 222 232 503
252 239 314 139 248
275 289 266
298
81
124.9
127.9 122.7 117.0 118.7 113. 1 145.8
107.5 119.4 113.3 130.8 112.0
129.0 119.5 104.0 139.6 1.>1. 0 131.3
119.1 146.3 13.1. 2 194.2 130.8
119. 5
91l. 4 127.2 120.5
105.0 14f>.l
8S. 4 98.5 78.2 84.8
107. 5 119. ,\ 113.9 110.6 99.3
128.4
109.9 123. g 93.7 55.3
107.4 128.3
111.1 121.1 100.8 105.8 114.8
123.8 104.4 124.2 90.3 70.9
Febrnnry lDGO
.\ugust I Septem-1 Octoh ·I :\ovem-1 ll••ccm·l her 1
01 1
her her
239
221 214 281 I.o9 201
211 214 164 504
2.>4 2.,1 314 139 249
275 288 2fill
297
80
124.8
128.2 122.4 116.6 118.3 112.8 146.3
108.0 118.3 114. I 125.6 109.9
129.3 120.1 103.6 J:l9. 8 151.4 131.7
119. I 146.7 135 .• 5 194.9 131.1
119. 1
H5.tl 127.0 120.2
104.4 146.2
87.1 92.8 77.7 83.1
105.8 119.5 114. 7 107.9 94.8
128.4
109.7 123.7 93.6 53.8
104.8 128.3
112. 2 122.0 100.6 109.2 111\. 2
123. ,) 104.4 124. 2 89.8 1
70.1 '
239
220 214 280 lfi6 198
230 204 146 510
25fi 265 307 143 244
274 288 265
297
80
12.1. 2
12S.. "j 122.9 117.0 118. 8 112.8 146.9
109.0 118. 7 115.5 124.1 110.4
129.7 121.6 104.0 140.0 152.2 132. I
119.6 146.4 135.3 194.9 131.5
l19. 7
95.9 126. H 121. 4
10.5.0 146.4
88.9 103.1 76.2 82. 1
107.8 119. 5 116.2 106.9 99.7
128.4
109.9 123.8 93.7 55.0
105.2 128. :l
111.9 12:l. 0 100.8 112.8 115. 1
123. 4 104.3 124. I 87.7 70.1
23.~
219 241 274 14\l 203
214 208 147 505
248 273 291 138 235
275 290 2tH
2\1(\
125.5
129.2 123.2 117.3 118.8 113.6 14i. 3
109.4 118. 4 116. 1 124. 5 109.0
130.1 121.7 104.1 140.4 1.52. 5 132.5
119. 7 148.5 137.4 195.9 131.6
119.1
!l4. 4 127. 1 120.5
104.2 146.4
86. r, 102.2
71"1. 7 78. f)
106.4 120.4 116. 7 107.4 95.1
128.4
110.0 123.9 93.8 !i4. 5
106.3 128.3
111.4 123.6 100.7 Ill. I 114. ii
12:!. 3 103.9 124.4 87. 7 69.5 I
230
216 22R 260 150 206
199 2lfl lf\5 504
243 279 27S 139 230
275 291 264
297
77
129.;) 123. I 117.2 118.6 114. I 147.6
109.4 117.9 116.0 123.4 107.9
130.4 121.7 104.4 140. ·' 15.3.0 132.7
120.0 149.0 137.9 196.0 131.6
118.9
93.6 127.3 120.0
103. 7 146. 7
85.4 103.2 76. ,) 7.1. 3
104.9 120.4 117.7 106.4 90.8
128.5
110.0 1:13.9 93.8 fi2. 2
106.6 128.3
111.2 124.0 100.7 113.8 113.9
123.3 104. 1 124.:! S7. 7 69.2
228
217 20\8 2i14 149 206
198 21:; 174 191
z;*' 274 264 148 234
27.~ 291 264
297
1 125. ,j
12H •. ~ 123. I 117. I 118 .. ) 113.8 147.8
109.2 117.8 116.7 125.5 106.6
130. 4 122.7 104.2 140.8 103.2 132.9
120.4 1~. 7 137.5 197.2 131. 7
118.9
93.4 127. a 120.1
103.~ 146.6
'8.5. 9 107.9 76. 1 76.0
Jtl4. 7 120.4 118.1
'104.1\ 90. ;)
128.6
110.0 124.0 93.7 .'\(). 8
107.0 1~8:)
111.7 124.1 101.2
' 115. 5 114.3
123.2 '103. 8
124. '2 r ~7. 8
fWJ. '2
1960
Jan nary
231
21:1 26! 2--ti\ 1.11 20<\
202 21!) 18~ 48l\
2-t2 2fll~
2/S 1H 239
27.=) 290 21).~
77
119.3
94 .. 5 127. () 120.4
104. :; 146.8
811.,=) 10.5. 4 77.2 78. f)
10.5. ,=)
120.4 118 .. 5 104. i) H2. H
128.8
109.9 124.1 93.8 49. 2
108. :; 128.3
111.\l 12·1.1 101.3 116. 8 114.4
123.:; 103. 1 124.2 87. ~ 69.2
' Hevised. 1 Index based on 19;).5-39=100 is 209.8. tRevisions for 1952-!58 <neon p. 24 of the Novemher 1959 8rR\ E\. §RatiO of prices 1 eeel\ ed to p1tees pa1d (ltJeludmg mterest, tnxe::. and wage rates). *:0:ew serie~; data prior to A-:.1gust 1958 are available upon recp1est. 9 Includes data not sho" n sepnrately. Q":For :1etual \\ holesale p1 1ees of 111ct1nctuai com· modities, :;;ee respective commodities. 0Goods to users. including raw foods and fuels.
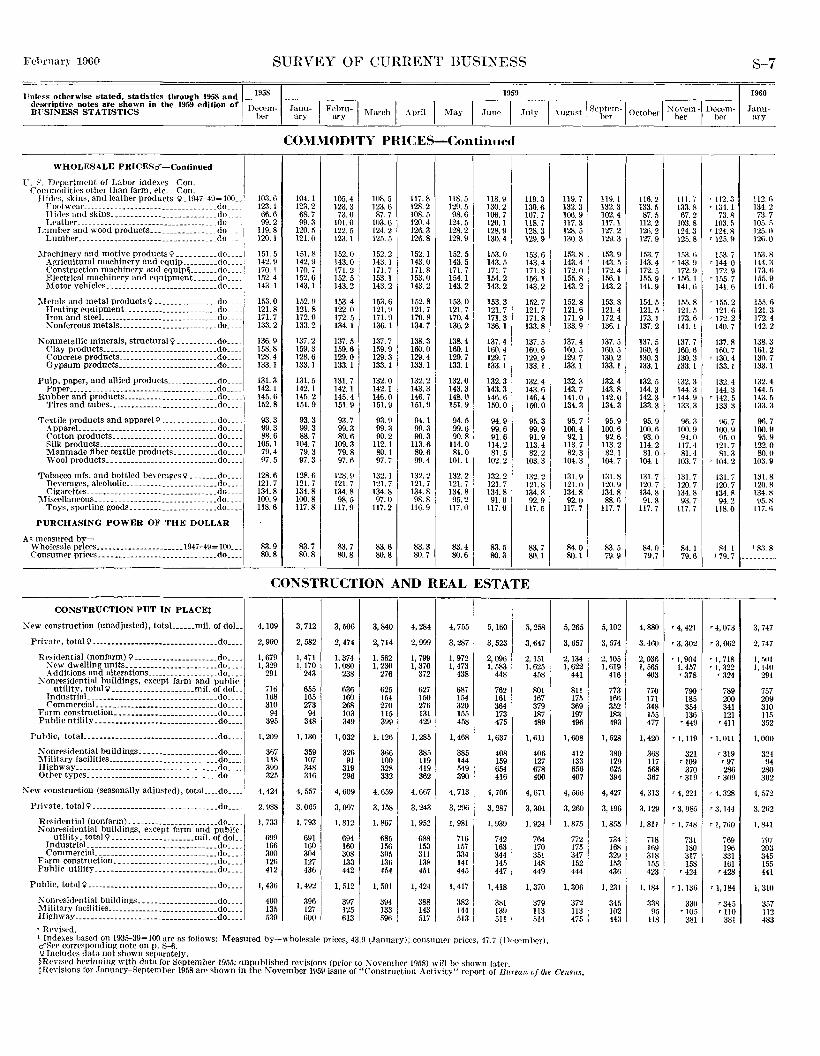
Fehrnary 1000 SURVEY OF CURRENT BUSINESS S-7
Unless otherwise stated, stati•tics through 1958 and~~ I . .1959 - --- - 1·
dl"scriptive notes are shown in the 1959 edition of I I b I I I I I I I R I I N' · I D ' J BllSINESS STATISTICS )ecem- Janu- Fe ru- March <\pril May June Tuly \n~ust .. eptcm- October " O\em- ec<nl- anu-1
1 her ary ary · ' ·
1
h~r ' her bi'r ary
1960
COMMODITY PRICES-Continued
WHOLESALE PRICESd'-Continued I r. i'. Department of Labor indexes-Con.
Commodities other than farm, etc.-Con. II ides, skins, and leather products \1.1947-49= 100 .. 103.6 104. I 105.4 108. 5 117.8 118.5 1!8. 9 119.3 119.7 119. I 116.2 Ill. 7 '112. 3 1!2. r. Footwear _________________________________ .do ____ 123. I 123.2 123.3 123.6 128.2 129.5 130.2 130.6 132.3 132.3 133. 5 133.8 '134.1 134.2 llides and skins ___________________________ do ____ 66.6 68.7 73.0 87.7 108.5 98.6 106.7 107.7 106.9 102.4 87.5 67.2 73.8 76.7 Leather ____________________________________ do ____ 99.2 99.3 101.0 103.6 120.4 124.5 120.1 1!8.7 117.3 117. 1 1!2. 2 103.8 103.5 105.;; Lumber and wood products _________________ do ____ 1!9. 8 120.5 122.5 124.2 126.3 128.2 128.9 128.3 128.5 127.2 126.2 124.3 '124. 8 125. n Lumber ___________________________________ do ____ 120.1 121.0 123. I 12.o. 5 126.8 128.9 130.4 129.9 130.3 129.3 127.9 125.8 '125. 9 126.0
;\fachinery and motive products 9 __________ do ____ 151.5 151.8 152. n 152.2 152. 1 152.5 153.0 153.6 153.8 153. 9 153.7 153.6 153.7 153.8 Agricultural machinery and equip _________ do ____ 142.9 142.9 143.0 143. 1 143.0 143.5 143.5 143.4 143.4 143.5 143.4 '143. 9 '144. 0 144. ;j Construction machinery and equip§ _______ do ____ 170. I 170. 7 171.2 171.7 171.8 171.7 171.7 171.8 172.0 172.4 172.5 172.9 172.9 173. ti Electrical machinery and equipment. _____ do __ --~ 152.4 152.6 152.5 153. 1 153.0 154.1 154.2 156.1 155. 8 156. 1 155.9 '156. 1 '155. 7 l.o5. 9 Motor vehicles._---------------------- ____ do. ___ 143.1 143. I 143.2 143.2 143.2 143.2 143.2 143.2 143.2 143.2 141.9 141.6 141.6 141.6
;\letals and metal products 11----------- _____ do ____ ! 153.0 152. \) 153.4 153.6 152.8 153.0 153.3 152.7 152.8 153.8 154.5 156.8 '155. 2 155.6 Heating equipment_ _______________________ do. __ -~ 121.8 121.8 122.0 121.9 121.7 121.7 121.7 121.7 121.6 121.4 121. 5 121.5 121.6 121.3 Iron and steeL _____________________________ do ____ 171.7 172.0 172.5 171.9 17{). 8 170.4 171.3 171.8 171.9 172. 4 173.1 173.6 '172. 2 172.4 X onferrous metals ... --------- _____________ do. ___ 133.2 133.2 134. 1 136.1 134.7 136.2 136. 1 133.8 133.9 136.1 137. 2 141. I 140.7 142.2
:Nonmetallic minerals, structural \? __________ do .... 136.9 137.2 137. 5 137.7 138.3 138.4 137.4 137.5 137.4 137.5 137. 5 137.7 137.8 138.3 Clay products _____________________________ do ____ l 158.8 159.3 159.6 159.9 160.0 160.1 160.4 160.6 160.5 160.5 160.4 160.6 160.7 161.2 Concrete products ... _____________________ .do. ___ 128.4 128.6 129.0 129.3 129.4 129.7 129.7 129.9 129.7 130.2 130.3 130.3 '130. 4 130.7 Gypsum products _________________________ do. ___ 133.1 133.1 133.1 133.1 133.1 133. 1 133.1 133.1 133.1 133.1 133.1 !33. I 133.1 133.1
Pulp, paper, and allied products _____________ do ____ 131.3 131.5 131.7 132.0 132.2 132.0 132.3 132.4 132.3 132.4 132.5 132.3 132.4 132.4 Paper _______________ ----- _________________ .do. ___ 142.1 142.1 142.1 142.1 143.3 143.3 143.3 143.6 143. 7 143.8 144.3 144.3 144.3 144. s Rubber and products ________________________ do ____ 145.6 145.2 145.4 146.0 146.7 148.0 146.6 146.4 141.0 142.0 142.3 '144. 9 '142. 5 143.5 Tires and tltbes ____________________________ do ____ 152.8 151.9 151.9 151.9 151.9 151.9 150.0 150.0 134.3 134.3 133.3 133.3 133. ~ 133.3
Textile products and apparel\? ______________ do ____ 93.3 93.3 93.7 93.9 94.1 94.5 94.9 95.3 95.7 95.9 95.9 96.a 96" 9fi. 7 ,/ AppareL _________________________________ .do. ___ 99.3 99.3 99.3 99.3 99.3 99.6 99.6 99.9 100.4 100.6 100.6 100.9 100.9 100.9 Cotton products.----------------- _________ do ____ 88.6 88.7 89.6 90.2 90.3 90.8 91.6 91.9 92. 1 92.6 93.0 94.0 95.0 95.9 Silk products _____________________________ .do ____ 105.1 104.7 109.3 112. 1 113.6 114.0 114.2 113.4 113.7 113.2 114.2 117.4 121.7 122.0 Manmade fiber textile products. __________ do ____ 79.4 79.3 79.8 80.1 80.6 81.0 81.5 82.2 82.3 82.1 81.0 81.4 81.3 80.0 Wool products. __ ------------------------ .do ____ 97.5 97.3 97.6 97.7 99.4 101.1 102.2 103.3 104.3 104.7 104. 1 103.7 '104. 2 103.9
Tobacco mfs. and bottled beverages \1. ______ do ____ 128.6 128.6 128.9 132.1 132.2 132.2 132.2 132.2 131.9 131.8 131.7 131.7 131.7 131.8 Beverages, alcoholic _______________________ do ____ 121.7 121.7 121.7 121.7 121.7 121.7 121.7 121.8 121.0 120.9 120.7 120.7 120.7 120.8 Cigarettes _________________________________ do ____ 134.8 134.8 134.8 134.8 134.8 134.8 134.8 134.8 134.8 134.8 134.8 134.8 134. R 1:J4. 8 ;\1 iscellaneous. _____________________________ .do. ___ 100.9 100.8 98.5 97.0 98.8 95.2 91.0 92.9 92.0 88.6 91.8 93.7 94.2 95.8 Toys, sporting goods._---------- __________ do ____ 118.6 117.8 117.9 117.2 116.9 117.0 117.0 117.5 117.7 117. 7 117.7 117.7 118.0 117.li
PURCHASING POWER OF THE DOLLAR
As mr-nsnred by-Wholesale prices._--------- __________ .1947-49= 100. __ 83.9 83.7 83.7 83.6 83.3 83.4 83.5 83.7 84.0 83.5 84.0 84. I S4. I I 83.8 C'onH1mer prices.~.-------------- _____________ do ____ 80.8 80.8 80.8 80.8 80.7 80.6 80.3 80.1 80.1 79.9 79.7 79.6 I 79.7 ---------
CONSTRUCTION AND REAL ESTATE
CONSTRUCTION PUT IN PLACEt
K ew construction (unadjusted), totaL •... mil. of doL 4,109 3, 712 3,506 3,840 4,284 4, 755 5,160 5,258 5, 265 5,102 4, 880 '4,421 '4,073 3, 747
Pri,·ate, total 11--------------------------------do ____ 2,900 2,582 2, 474 2, 714 2,999 3, 287 3,523 3,647 3,657 3, 574 3, 460 '3,302 , 3,062 2. 747
Residential (nonfarm)'¥ ---------------------do ____ 1, 679 1, 471 1.374 1. 562 1, 799 1, 972 2,096 2, 151 2, 134 2,105 2,036 'I, 904 , I, 718 1,f>OI :\'ew dwelling units _______________________ do ____ 1,329 1,170 1,080 1, 230 1, 370 1, 473 1, 583 1,625 1,622 }, 619 I, 565 I, 457 'I, 322 1,140 Additions and alterations __________________ do ____ 291 243 238 276 372 438 448 458 441 416 403 '378 '324 291 Xonresidential buildings, except. farm and public
utility, total 11---------------------mil. of doL 716 655 636 625 627 687 762 801 811 773 770 790 789 757 IndustriaL ___ -------------- ______________ .do ____ 168 165 160 154 150 154 161 167 175 166 171 185 200 209 CommerciaL __ ----------------- ___________ do ____ 310 273 268 270 276 320 364 379 369 352 348 354 341 310
!~arm construction. ___ ------------ _________ .do. ___ 94 94 103 115 131 155 173 187 197 183 155 136 121 liS Public utility __ -----------------------------do ____ 395 348 349 399 429 458 475 489 496 493 477 '449 '411 :ho2
Public, total----------------------------. __ ... do. ___ 1,209 1, 130 1,032 1, 126 1,285 1,468 1,637 1,Ml 1,608 1, 528 1, 420 '1, 119 'I, 011 1,000
C\J onresidential buildings ••• ------- __________ do. __ . 367 359 326 366 385 385 408 406 412 380 368 321 •319 324 :!\'1 ilitary facilities.----------------- _________ .do ___ . 118 107 91 100 119 144 159 127 133 129 117 '109 '97 94 1T i)<hway _______ --------------- _____________ .do. __ . 399 348 319 328 419 549 654 678 656 625 568 370 286 280 Other types._ -------------------------------do. __ . 325 316 296 332 362 390 416 400 407 394 367 '319 '309 302
Kew construction (seasonally adjusted), totaL .. do .... 4,424 4, 557 4,609 4,659 4,667 4, 713 4, 705 4,671 4, 566 4,427 4, 313 •4,221 '4,328 4, 572
Prh·ate, total'¥ --------------------------------do ____ 2, 988 3.065 3,097 3,158 3, 243 3,296 3,287 3,301 3, 260 3,196 3,129 '3. 085 '3. 144 3,262
Re,idential (nonfarm) __ ------------------- .. do .... j l. 733 I, 793 1, 812 1, 867 I, 952 1, 981 I, 939 I, 924 I. 875 I, 855 1, 81! , I, 748 r 1, 7ti0 1,841 Nonresidential buildings, except farm and public utility, total 11---------------------mil. of doL 699 691 694 685 688 716 742 764 772 734 718 731 769 1n1 Indnstrial _________________________________ do ____ 166 160 160 156 153 157 163 170 175 16R H\9 180 196 203 CommerciaL ______________________________ do ____ 300 304 308 305 311 334 344 351 347 329 318 317 331 345 Farm construction~ _________________________ do ____ 126 127 133 13() 138 141 145 148 152 153 155 158 161 155 Public utility _______ ---------- __ ----- ______ .do. ___ 412 436 442 454 451 445 447 449 444 436 423 '424 '428 441
Public, total 1?---------------------------------do ____ 1, 436 1, 492 I, 512 1, 501 1, 424 1, 417 1, 418 1,370 1,306 1,231 1.1841
'I, 136 T }, ]84 1,310 X on residential buildings ____________________ do. ___ 400 396 397 394 388 382 381 379 372 :J45 338 330 '345 3.57 ;\'I ilitary facilities. ___ ------------- ___________ do. ___ 13/i 127 125 133 143 144 I 139 113 113 102 95 '105 '110 112 Highway ____________________________________ do ____
539 600 613 596 517 513 511 514 475 443 418 381 381 483 r Revised. 1 If!dexes based O!' 1935--39=100 are as follows: Measured by-wholesale prices, 43.9 (.January); consunwr prices, 47.7 (December). d'f'<'C correspondmg- note on p. S-6. 9 Includes data not shown separately. §ll<'Yised hednninR with data for September 1955; unpublished re,-isions (prior to Xo,·ernbcr 1958) will be shown later. tReYisions for January-September 1958 are shown in the November 1959 issue of "Construction Activity" report of Bureau of the Censns.
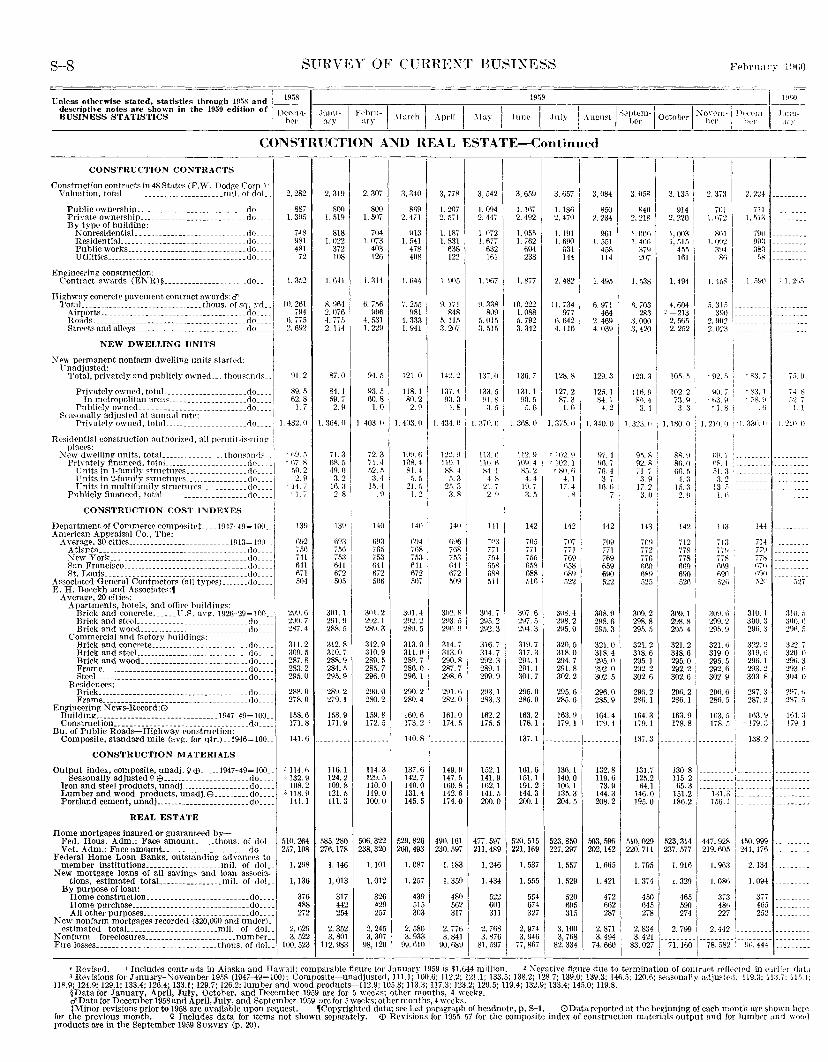
S-8 SUHVEY OF CURHEXT HUSIXESS
Unless otherwise stated~ statistics through Ht'lS and ~~~~8 I descriptive notes are shown in the 1959 edition of DC'C'l'lll· BUSINESS STATISTICS hrr
CONSTRUCTION AND REAL ESTATE-Continued
CONSTRUCTION CONTRACTS
Construction contracts in 4R States (F.W. Dodge Corp.l: Valuation, totaL ......................... rnil. of doL.
Puhlic ownrrship ............................ do ... . Private ownl'rship ........................... do ... . By type of huilding:
Nonresidential __ -------------------- ______ do ___ _ ResidentiaL ............................... do ... _ Puhlicworks .............................. do ... . Utilities .................................... do_. __
EnginePring construction: Contract awards (ENR)§............... .do.. I
Highway concrete pavement contract awards:Q'I I
T~~f~ti~~~~~~~~~~~~~~~~~~~~:~:-~~~~~~~:':: ~~ ]f': I NEW DWELLING UNITS I
New permanent nonfarm dwelling nnits started: Unadjusted:
Total, privately and puhlicly owned. thousands .. I Privately own~d, totaL ................... do .. _-I
In metropolitan areas ____________________ rlo ____ , Puhlicly owned ........................... do .... l
Seasonally adjusted at annual rate: I Privatelv owned, totaL ................... do .. ..
RrsidC'ntial eon~truction authorized, al! pf'rmit-i~sning: plac<>s: I
~rw dwelling units. totaL _____ "------ __ thom::::mr1~ __ 1
Prh·ately financed, totaL ................... do .... l Units in 1-family strnetnres _______________ do ____ , l:Tnits in 2-family strnctnrf's ________________ do ____ l Fnits in mnltifnmily stn1cturrs ____________ do ___ _
Publicly financed, totaL ..................... do .... i CONSTRUCTION COST INDEXES
I Department of Commerce cornpositet .... 1947-49~ 1110 .. ,
1
,
American Appraisal Co., The: Average, 30 cities .......................... 1!l13~ltlO ..
Atlanta ...................................... do .. _. :\'ew York ................................... do ____ l
1
San Francisco ________________________________ do ___ _
A ss~~\;.~':j18eneraT C'oiit!actor; (a 11 ty-pes)~.·_:::~~:.:: E. H. Boeckh and Associates:, 1 Average, 20 cities: I
Apartments, hotels, and office hnilcling"
~~l~~ ~~~ ;::,~f:~~~::::::~:~~~~~,:~~-19:~~-2_9_';;~~0::1 Brick and wood ........................... clo .. ..
Commercial and factory hnildings: Brick and conerete ......................... do .. .. Brick and steeL ........................... do .. .. Brick and wood ......... _ .. , ............. do .. ..
Rii~~~~~~ ~ ~~~~~~~~~~~~~~~~~~ ~ ~~ ~ ~ ~: ~~::~~;:~~~~I Frame __________________ ----- ______________ cto ___ _
Engineering News-Record:0 Buildinp; ...... _ .. -------· .............. 1947 -49~ 100 .. Construction _______ ._ ......................... do ... .
Bu. of Public Roads-Hip;hwa~· construction: Composite, standard mile (av!(. for ~tr.) .. 1946~ 100 ..
CONSTRUCTION MATERIALS
Output index, composite, unadj. <;>Ell ..... 1947-49~ 100 .. Seasonally adjusted<;> EB ...................... do .. ..
Iron and steel products, unad.i ................. do .. .. Lumber and wood products, unadj.E!l ......... do .. .. Portland cement, unadj ........................ do .. ..
REAL ESTATE
Home mortgages insured or guaranteed by-Fed. Hous. Adm.: Face amount. .... thous. of doL. Vet. Adm.: Face amount. ..................... do .. .
F~deral Home Loan Banks, outstanding advances to member institutions ...... - ............ mil. of doL.
New mortgage loans of all sayings and loan associa-tions, estimated totaL .............. mil. of doL
By purpose of loan: Home construction .......................... do ... . Home purchase .............................. do ... . All other purposes ........................... do .. ..
N rw nonfarm mortgages recorded ($20,000 and under), estimated totaL ...................... mil. of doL.
Non farm foreclosures _______________________ num h('r __ Fire losses .............................. thous. of doL. 1
2, 282
887 1. 305
748 081 481
72
1. 352
10.261 794
6. 77.') 2. 692
91.2
8fl. 5 62.8
1.7
1. 432. ()
,. ml5 r fi7. 8
.50. 2 2. ~I
r 14. 7 r J. /
13!1
092 /,1)1) 741 641 071 504
29!1. 6 290. 7 287.4
311.2 :109 .. 1 287.8 283.2 295. ()
288.0 278.0
158.6 171.8
141.6
3 114. (\ 3132.9
108.2 3 118.\1
141. I
510,264 257,108
), 298
I. 136
376 488 272
2, 629 3, 522
100,523
2, 319
801) 1. 510
818 1. 022
372 108
1, 641
R. H64 2. 076 4, 7ifl 2. 114
87.0
84.1 .19. 7 2. 9
], 364.0
71.3 68.5 4\l. 0 3. 2
16.3 2. 8
2, 307
800 ], 507
704 ), 073
403 126
1. :l14
6. 7l>6 99(\
4, 531 1, 22(1
94.5
93.5 60.8 1.0
1. 403.11
72.3 71.4 .=i2. 5 a. 4
1.5. 4 . ~)
13!1 140
tW3 ()!l3 756 765 753 753 oil 1\41 672 672 ti05 ,)()()
am. 1 301.2 291.9 2!!2.1 288.5 289.3
312. 8 :J]2. 9 310.7 310.9 288.9 289. 5 284. ,) 285.7 29.\. 9 296. 0
289. 2 2\XI. 0 279. 1 280.2
1.58. 9 159. 8 171.9 172.5
116.1 124.2 109.8 121.5 111.3
585,280 276, 178
1,146
I, 013
317 442 254
2. 352 3. 801
112.983
114.3 129.5 110.0 119.0 100.0
506,322 238,320
1,101
1. 012
326 429 257
2, 245 3, 307
98, 120
3, 340
8!i9 2. 471
\l13 1. 541
478 408
1.64-1
7. 25.? 981
4. 333 I. 941
121.0
118. 1 so. 2 2. n
I. 403.0
J(l\1. B 108. 4 81.4
.). 5 21.!)
1.2
140
!)\14 76R ltl3 fi41 fi72 507
301.4 2!12. 2 289.5
313.0 311.0 289.7 286.0 296.1
2911.2 280.4
160.6 173.2
140.8
137.6 142.7 140.0 131.4 145.5
529.826 260,493
1. 087
I, 257
439 515 303
2, 586 3. 933
99,610
3, 778
I. 207 2. 571
1. 187 1. 831
f\38 122
I. 905
Rlil 848
5. 115 3. 207
142.2
137. 4 93.3
4. 8
1. 434.11
122. \) 119. 1 88.4
5. 3 25. ~) 3. 8
3, 5421
I. 094 2. 447
1. 1172 1. 6ii
632 161
1. 9117
!l. 338 809
,\,(1]/j
3. 515
l. :170.0
HO 141
6\l6 ';"11:1 76R 771 7.5:1 7.~4 644 f\58 672 fiRS 5119 511
302.8 3114.7 21 13. f) 295. 2 290.11 292.3
314.7 316.7 313.0 314.7 290.8 292.3 287. 7 289. I 2\lS. 6 2911. 9
291.6 293. 1 282.0 283.3
161. 0 !62. 2 174. ,) 175.5
149. 9 147. 5 160.8 142. 6 174.0
490, 161 230,597
1. 183
1. 359
480 56Z 317
2. 776 3, 841
90.689
152.1 141.9 162.1 141.5 200.0
477. 597 211, 489
1, 246
1. 434
522 601 311
2, 768 3. 876
81.597
3, 659
], 167 2. 4\!2
\. 055 1. 762
604 238
1, 877
10. 222 1.088 .1. 792 3. 342
136. 7
131.1 \10. 5 ii.6
1. 368.11
112.\1 10\1.4 85.2
4. 4 19. 7 3. 5
142
705 Til 755 6.58 688 516
307.6 297 .. 5 2\14.3
319.7 317.3 294.1 291.1 301.7
295.0 285.0
163.2 178.1
137. 1
161.6 151.1 191.2 144.3 200.1
520. 515 221,169
1. 537
1.5.15
554 674 327
2, 974 3, 946
77, 807
3, 657
1. 181i 2. 470
1.1\ll I. 6\lO
f>31 144
2. 482
11.734 977
6. 642 4. 116
128.8
127.2 87. 3
J.(j
1, 371i. 0
'102. !l '102. 1 '80. (;
4.1 17.4
.8
142
707 771 769 658 f\8!1 522
3il8. 4 298.2 295.0
320.5 318. () 2~4. 7 291.8 302.2
295.6 285.6
163.\1 179.1
136.1 140.0 10H.1 135.3 204 .. 5
523, 850 227.297
1, 557
1. 5211
520 6!15 315
3.100 3, 768
82. 334
3, 084
850 2, 234
961 ]. 551
458 114
1. 495
6. 971 464
2. 469 4. 039
129.3
125. 1 84. 1
4. 2
1. 340.0
97.4 90. 7 70.4
3. 7 !fl.6
.i
142
709 ill 769 659 Will :>22
~~~:~I 295.3 ! 321. () 318.4 2~5. () 2\12. () 302.5
296.0 285. [I
164.4 179.4
132.8 119.6 73.9
144.3 208.2
503,596 202,142
1.665
1, 421
472 662 287
2, 871 3. 494
74,660
3. 058
840 2. 218
LOOn 1. 4()0
:179 207
1. 538
(}, 703 28'l
:J. 000 3, 420
120.3
111t n 8<1. 4
3. 4
I. 323. II
9.). s ?2. 8 71 7 I :l. 9 i
17. 2 I 3. (I
113
70\) 772 iih f\60 ()89 f!2fl
309.2 298.8 295.5
321. 2 318.6 29.1. 1 292.2 302.6
29G. 2 28fi.1
164.3 179. 1
131.7 125.2 ll4.1
146.0 195.0
.510, 029 220. 711
1. 795
I, 374
450 645 278
2, 834 3. 421
83. 027
Frbrnal',\' 1~Hi0
I 3. 13.1 1
914 I 2, 220 I
1, 003 ], f.].\
455 161
I. 494
4, 6041
1
'-213 2, 5f),~ I
2. 252
I 10!\ .5 I 102.2 I 73. q : 3. 3
), 180.0
88.9 8fi.O no. !l
4. a II\. 3 2. H
142
712 778 778 fl69 690 52()
309.1 298.8 295 4
321.2 318.6 295.0 292.2 302.6
2%.2 286.1
163.9 178.8
130.8 115.2 65.3
151.2 186.2
2. 373
/01 1. n12
~01 I. 092
394 8fi
2. 224
ill 1. 513
1. 4.18 1' .~9(1
i'i. 315 390 1--.
2, ~102 2. 02:l
9(1, 7 r fl3. 9 '1. 8
'83. I r ,)~. ~~
.h
1. 210." ·]. 33(1_1,
C{l.; liS. 1 ,,]. :l 3 "
13. :, l.ti
I 309.1i ' 299.2 f
295. n 1
321.1; 1
319.0 ' 295.51 292.6 302.9 '
29(i. 6 i 28fi. 5 '
i 163." 1 1/8. [j I
310.1 :lOO. :; 296.:)
322.2 319. I)
291i. 1 293.2 303.8
297.3 287. 2
Jf\3. \J r 179. ;.;
138.2
--------!--------·
---i~iX'•:::::•:: 156.1 .........
523,314 447. 92S 4.'\0. 999 237, 577 219,605 241,176
1. 916 I. 963 2. 134
'· 329 1. osn 1. 094
465 373 377 590 48!\ 465 274 227 252
1, ~H.')
;,:z.-; 1.1
L :.?ln.o
:llo .. 1 3110.1i ;!l)t\. fl
:t>-2. i 320.0 :..~)li.3 :!!l3, li 3111.0
2~7. fi 2Si. ol
!ti4. :.l 179. -l
2,799 2,442 ................ ..
7i: 1 iio t · 78: :ssz · 1ii;: 44-i · • • • •: •: .. !
r Revised. J Includes contracts in Alaska and IT::nvaii; corn parable figure for January 1959 is $1,044 million. 2 .:\ep:ativr figure due to termination of contract rrfkcted in t·:tr!i~._·r dtiLt 3 Revisions for January-1\ovember 195S (1947-49~100): Composite-unadjusted, 111.1; 100.6; 112.2; 121.1; 133.5; 138.2; 128.7; 139.0; 139.3; 146.5; 120.6; seasonally a<ljtLsted, 119.3; u:5.7: I If•.•:
11F.9; 124.9; 129.1; 133.4; 126.4; 133.1; 129.7; 126.2; lumber and wood products---112.9; 105.8; 113.~; 117.3; 123.2; 120.5; 119.4; 132.9; 133.4; 145.0; 119.8. §Data for January, April, July, Octoher, and December 1959 are for 5 weeks; other months, 4 weeks. ci'Data for December 1958 and April, July, and September 1959 are fm .5 \\·eeks; other months, 4 weeks. tMinor revisions prior to 1958 are available upon request. ,Copyrighted data; see last paragraph of headnote, p. S-1. 0Data reported at the beginning of each month are shown here
for the preYious month. <;> Includes data for items not shown separately. Ell Revisions for 1955---57 for the composite index of construction materials output and for lumber ani woo• I products are in the September 1959 SURVEY (p. 20).
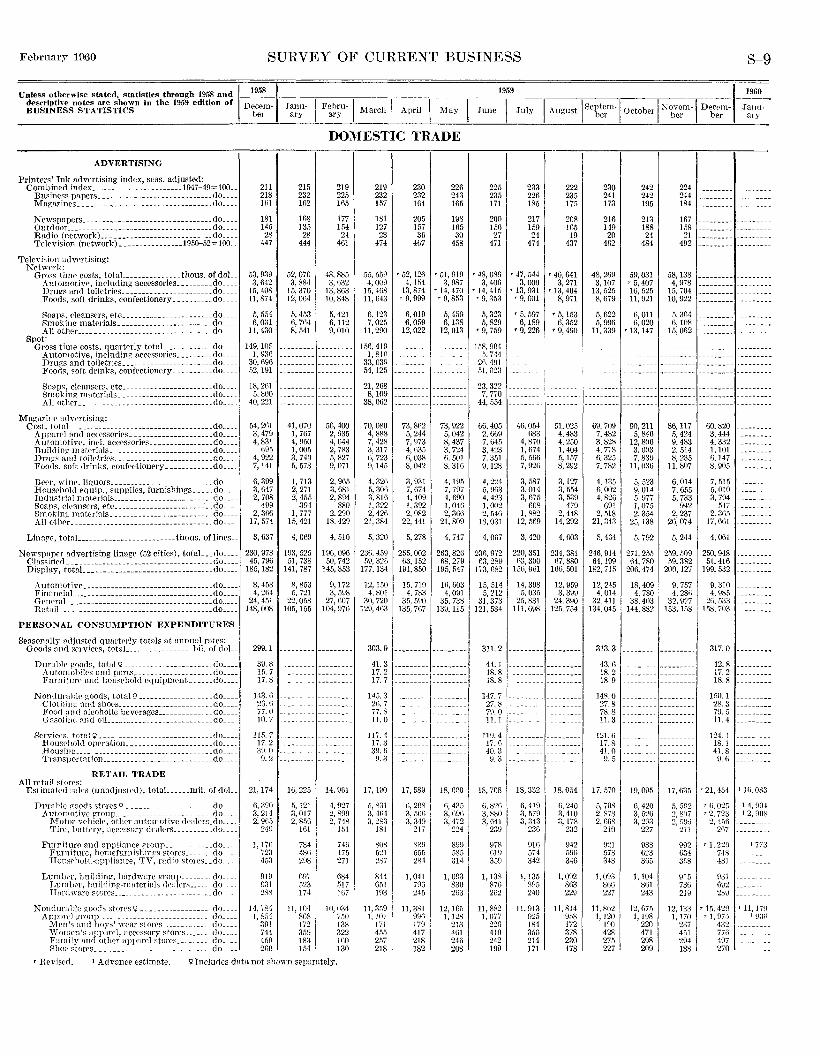
February 11)60 SURVEY OF CURRENT BUSINESS 8-9
Unless otherwise stated, statistics through 1958 and ~~~ deSf'riptive notes are shown in the 1959 edition of Decem-BUSINESS STATISTICS ber
ADVERTISING
Printers' Ink advertising index, seas. adjusted: Combined index ______________________ .1947-49= 100 ..
Business papers __ -------------------- ______ .do .. __ J\1agazincs_ ------------------------ _________ do. __ _
N cwspapers ______ ------------------ ___ --- ___ do __ -_ Outdoor __________________ ------ _____ - __ .- ___ do ___ _ Radio (network) ___________________________ do ___ _ Television (network)_------------ ___ 195Q-52= 100
Television advertising: Network:
Gross time costs, totaL _____________ thous. of doL Automotive, in{'luding accessories _________ do ___ _ Drnl"s and toiletries _______________________ do ___ _ Foods, soft drinks, confectionery __________ do ___ _
Soaps, deansrrs, etc __ ----------- ··---------do ___ . Smoking materials ________________________ do ___ _ All other __________________________________ do ___ _
Spot: Gross time costs, r]Uartrrly totaL ____________ do ___ _
Automotive, including accessories _________ do ___ _ Drugs and toiletries. ______________________ do ___ _ Foods, soft drinks, confectionery __________ do ___ _
Soaps, clf'ansers. etc _______________________ do ___ _ Smoking materials ___ ---------------------do_--· All other ____ ------------------------------do._
Magazilw aclwrtising: Cost, totaL _____________ --------------------- .do ___ _
Appnrd rmd arcrssories_ --------------------do ___ _ Automotivr, incl. accessories ________________ do ___ _ Building materials _________________________ _do ___ _ Drugs and toiletrirs ________________________ .. do ___ _ Foods. soft drinks, confectionery ___________ .do ....
Brrr, wiTH\ liquors ___________________________ do __ _ Housrholcl equip., supplies, furnishings _____ do ___ _ Indnstrl:1l nwtf'rinls ______ --------------- ____ do ___ _ Soaps, clransrrs, rtc _________________________ cto ___ _ Smoking rrwtcrials __ ------------ ____________ do ___ _ All otll<'r ____________________________________ do ___ _
Linage, totaL ________________________ thous. oflines ..
2ll 218 lf>l
181 145 28
447
53,939 3, C.42
!.5, 408 11,874
5, 554 6,031
11,430
149,105 l, 936
30, fo96 52,191
18,261 5. 800
40.221
54, 2tll 3, 479 4, 831
69.5 4, 922 7,141
n, 399 3, 047 2, 708
499 2, 3()()
17, 574
3, 637
Newspaper advertising linage (52 cities), totaL __ do ____ 230,978 Classitie<L ____________________________________ do____ 45, 79fo Display, totaL--------------------------------do ____ 185,182
Automotive _____ --------------------- ___ - ___ do. __ _ FinanciaL ___ --------------------- ______ - ___ do .. __ GrnernL _________ -------- _______________ - ___ do .. __ _ RetaiL ______________________________________ do. __ _
PERSONAl, CONSUMPTION EXPENDITURES
Seasonally adjnstrd quartPr!y totals at annual ratrs: Goods and services, totaL _______________ . bil. of doL.
Dural>lP goods, total '1----------· ----------- do ___ _ Automobilrs nnd pnrts ____________________ rlo ___ _ Furniture· and household Cr]nipment_ _____ do ___ _
Nondurable goods, total?-------------- ____ do ___ _ Cloth in!!: and shO('s ________________________ do ___ _ Ji"'oort and n]eoholic bevE>rages _______________ do ___ _ Onsolille nnd oil ___________________________ do __ _
Sf'rviccs, t(,tt11 9 _____________________________ do ___ _ H ousel10ld operation ______________________ cJo. __ _ H ousin~--- _______________________________ do ___ _ Trnnsportntion _____________________________ do ____ _
RETAIL TRADE All retail ~(ores:
8, 458 4, 264
24,451 148,008
299.1
39.8 15.7 17.8
!43. 6 2G. 6 77.0 10.7
115.7 17.2 3(). 0 H.2
January
215 232 162
168 l3S 28
444
52,071\ 3, 884
15,370 12,064
5, 453 6, 764 8, 541
'11, 070 I, 767 4, 950 1, 005 3, 740 5. 578
l, 713 2, 271 2, 451)
394 1, 777
15,421
4, 069
193,525 51,738
141,787
8, 853 5 721
22; 058 105,155
F';7.~u-l March I April I May
DOMESTIC TRADE
219 225 165
177 !54 24
461
48, 881> 3, 632
13,863 10,848
1>,·121 6,112 9,010
56,400 2, 935 4, 644 2, 783 5, 827 9, 071
2, 965 3, (i81 2, 894
880 2. 2\!0
18,429
4, 510
196,096 50,742
145, 353
9,172 3, 598
27,607 104,976
219 232 IS7
181 127 28
474
.55.550 4, 009
15, 468 11,643
6.123 7,025
11,290
156.419 I, 8](;
33,03\l 54, 125
21,268 8,109
38,062
70,080 4,888 7, 428 3, 317 fi, 723 9, 14!;
4,32!\ 5, 30n 3, 8Hi l, 322 2, 42()
21, 3S4
5, 320
236, 459 1>9, 326
177, 134
12, !50 4, 801
30, 720 129, 463
303.9
41.3 17.2 17.7
145.3 26.7 77.8 11.0
J17. 4 17.3 39.6
9. 3
230 232 164
205 !57 36
467
r 52,126 4,1M
13,874 '9, 999
6,019 6,059
12,022
73,862 5, 244 7, 973 4, 635 6, 038 8, 042
3, 931 7, 674 4, 40!! ], 392 2,082
22,441
5, 278
255,002 fi3,152
191, 850
Hi, 710 4, 7S:l
35,590 135, 767
226 243 165
198 165 30
458
5, 459 6,138
12,013
73,922 5, 042 8, 437 3, 724 6, 501 8, 316
4, 19S 1, 797 I 4, 690 1, 04(; 2, 3()6
21,809
4, 747
263,821\ fi8,279
195,547
16, 603 4, 091
35, 73S3 139.115
Estimated sales (unadjusted), totaJ. _____ mil. of doL. 21,174 16,225 14, 9G! 17, lHO 17, 589 18, GOO
Dural'le goods stores9 ---------··-------------do ___ _ AutorPotivc group __________________________ do ____ _
1Vfolor-vC'hick, otlwr rmton'otlvr dealers_ do .. __ ':rire, battery, nceessory rlcalers __________ cto ___ _
Furniture and npp1innc<' rroup ____________ do ___ _ Furniture, homf'fnrnishinp:s stores _______ do ____ _ Hmlsf•hold-npplian~e, TV, radio storrs __ do ___ _
Lun1lwr, building, hardvyr~rr ~:-roup ________ do ___ _ Luml1n·, building-n::.aterinls drDlers ______ dcL---I-I ani wnro stores _________________ ------- _do ___ _
Nondurable goods stores 9 _________________ .do. __ _ Appnn•l gronp _____________________________ do. __ _
MC'n's and boys' wear stores _____________ do ___ _ \Y0If!('!1'S fl[lJKtre1, HCCC'f'SOfy storcs _______ do ___ _ Family and other appnrf'l stores _________ do ___ _ Sho0 stores ____ ------------ _____________ do ___ _
6, 390 3, 214 2, 9(;3
24\J
l,l7H 723 453
91\1 G31 283
14, 784 1, 8.)4
391 744 45\1 260
5,121 3,017 2, 85(i
](jJ
784 -181) 298
HU7 523 174
ll, 104 8(;8 172 359 183 !54
4, 927 2,899 2, 748
151
74() 475 271
684 517 ](,7
10, ~~~ l3S 322 !GO 130
r RevisPd. 1 Advance estimate. ? Ineludrs deta not shown separately.
5, 831 3. 41<4 3, 21i3
181
808 521 287
844 651 193
11, 359 I, 101
171 45S 257 218
6, 2081 3, 5(i~i 3, 34•1
217
8:1!! 555 281
I, 041 796 245
11, 381 9\lfi 17H 417 218 182
o. 435 3, (i9fi 3, 472
224
8(19 585 314
1, 093 830 2G3
12, 1f>5 l, 128
2i3 4Gl 246 208
1959
.Tune I July
225 235 171
200 !5!i 27
471
'48, 08fi 3, 40f>
'14, 415 '9,353
5,323 5,829
'9, 759
l.o8, ~04 5, 744
2H,4m .11. 023
23,322 7, 770
44, 554
66,405 2, 669 7, 645 3 4?3 7:351 9,128
4, 224 5, Hfi3 4. 423 I, 002 2, 540
18,031
4, 067
236,972 G3, 280
173, ()82
IS, 614 5, 212
31,373 121,584
311.2
44.1 18.8 18.8
147.7 27.8 7!1. 0 11.1
ll9. 4 17. (', 40.3 9. 3
233 226 185
217 !59 24
474
'47, 544 3,000
'13. 931 '9, 601
'5, S97 6,189
•9, 226
46,054 fi83
4, 870 I, 674 5, 566 7, 926
3, 587 3,014 3, 675
60S l, 882
12,569
3, 420
220,351 63,390
156, 961
14,398 5, 035
25,831 Ill, 698
1
1960
I Aurrust ISeptem-1 October I ~ovcrn-~1 :D;c~;~~ - Janu-
~ her bcr ber at y
222 235 !7.o
208 165 19
437
'46, 641 3, 271
'13,404 8, 971
'5, 153 6,352
'9, 490
51,025 4. 483 4, 250 I, 404 5, 1S7 8, 292
3,127 3, 554 3, 539
479 2,448
14,292
4, 603
234, 381 (i7, 880
166,501
12.959 3,39\J
24,390 125,754
230 241 173
216 149 20
462
48,269 3,107
13, 52S 8,679
242 242 195
213 188
24 484
59,031 '5, 407 16, 525 11,921
5, 622 6, Oll 5 996 6, 020
11:339 ' 13, 147
69.709 7, 482 3, 828 4. 778 6. 32,o 7, 782
4. 135 6, 002 4. 826
691 2. 518
21,343
5. 434
246.914 61,199
182,715
12, 245 4, 014
32,411 131,045
313.3
43.6 18.2 18 9
14~.0 27.8 78.8
II. 31 121.6 11. s 1
41.0 9. 5
90,211 5, 846
12,806 3. 603 7, 839
11,036
5, 523 9, 014 5, 977 1,075 2,354
25,138
5, 792
271. 2S5 64,780
20o, 474
18, 409 4, 780
38, 403 144,882
224 244 184
167 !58
21 492
58,138 4, 978
15, 704 10,922
5,364 6,108
15,062
86,117 5, 424 9,483 2, 514 8, 235
11,807
6, 014 7, 6S5 5, 733
942 2,237
26,074
5, 24-l
2.19, 509 ,)9, 382
200, 127
9. 757 4, 28()
32, 9'27 153, l.o8
60,820 3, 444 4, 3:l2 I, 101 6,147 8, 905
7, 51.5 5, 010 3, 794
547 2. 3o5
17,661
4,061
250,948 51,416
199,532
9,310 4, 985
21\, 538 1.58, 703
317.0
42.8 17.2 18.8
1fi0.1 28.3 7D. 5 II. 4
124.1 18. l 41.8 9.6
18,708 18,332 18,054 17,570 19,095 17,63.o •21,45,1 IJ1i.OS3
6. 8211 3 880 a: G4I
239
~17R {)]9
35U
I, 138 87G 262
11,882 I, 077
226 410 242 199
6, 419 3, 579 3,343
23G
916 574 342
1, 135 kP5 240
ll, 913 925 !84 35G 214 171
6, 240 3,410 3, 178
232
942 59() 346
I, 092 8ti3 229
11,814 958 172 378 230 178
5, 708 2, R78 2, r.G8
210
921 573 348
1, 093 8()5 227
11, R(i2 1, 120
l?O 428 275 227
6, 420 3, 521) 3, 293
227
988 623 3G5
1,104 861 243
12,675 1,188
220 471 298 209
5. 5G2 2, 8117 2, ~~ki
211
992 634 3:,8
9"5 736 219
12 133 1:170
2:)7 4Sl 294 188
'6, 02~ '2. 723
2. 4~6 2H7
'I, 22D 7·1S 481
981 6U2 2k[l
I 4, UOJ I 2, 90S
r 15, 42\) 1 11, 17\1
' 1, 97.; I ' 93;; 4:12 ---------77(i ---------4U7 ---------270 ---------
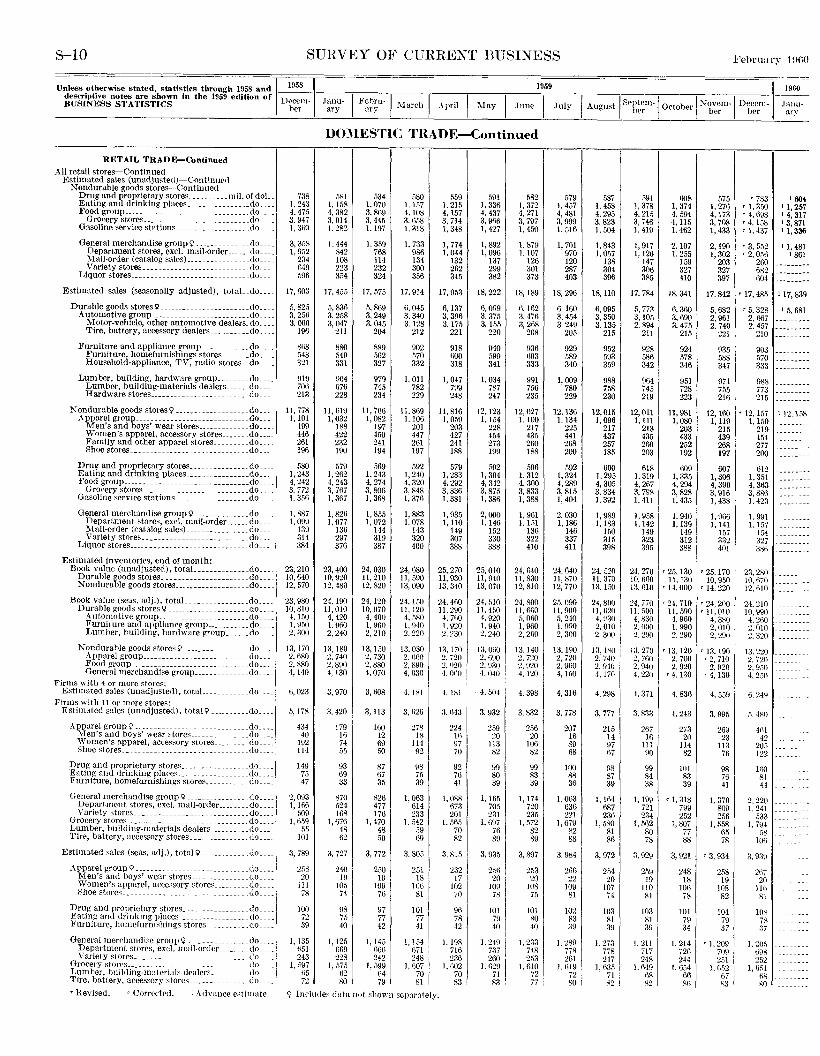
S-10 SUHVEY OF CURHENT BUSINESS
llnless otherwise stated, statistics through 1958 and ~~-~ deSf'riptive notes are shown in the 1959 edition of nrcem-. BUSINESS STATISTICS he~
RETAIL TRADE--Continued All retail stores-Continued
Estimated sales (unadjuste<l)-Continued Nondurable goods stores-Continued
Drug and proprietary stores .......... mil. of doL Eating and drinking places ................ do .. . Food group .... ____________________________ do .. .
Grocery stores ________________________ .... do. GR.soline service stations ... ________________ .do
General merchandise group?···-··-·-· ____ .do .... Department stores, excl. mail-order. ..... do ___ _ Mail-order (catalog sales) ... _____________ do ....
Li~~~~~lo~~~~~~:::::::::::::::::::::::::::~g:::·
I
738 1. 243 4, 47.1 3. 947 1. 31\g
3, 35g 1, 9.12
234 ()49 596
1959
.June I .July
DO)IESTIC TRADE-Continued
.1))1 1, 1.18 4, 382 3, 914 1. 282
1.444 842 108 223 3M
li34 1,070 3, 869 3, 44.1 1.197
], 359 768 114 232 324
580 I. !.17 4,108 3. 658 I, 318
], 733 986 134 300 356
li59 I, 215 4,157 3, 714 1, 348
1, 774 1. 044
132 262 34.)
591 I. 336 4, 437 3, 966 1, 427
1,892 1,096
137 299 382
582 1, 372 4, 271 3, 797 I. 4.)\)
1. 879 1,107
126 301 373
579 1. 457 4, 481 3, 999 1, 516
1, 701 970 120 287 403
. 11960
I August I Septem-1 Oct h I ~ovem-1 DecPm-~ ~ her 0 er ber ber ary
587 1, 458 4,295 3. 823 1, 504
1, 843 1, 057
138 304 396
.)91 I, 378 4, 21.) 3, 746 I, 419
1, 917 I, 126
147 306 385
li08 1, 374 4, 594 4, 115 1. 462
2.107 1. 255
159 327 no
575 I, 276 4,173 3, 708 1, 433
2,190 1,302
203 327 397
'783 '1, 3.)() '4, !\98 '4, 158 'I, 437
'3. 552 '2,056
260 682 604
I 6(H 11,257 I 4, 317 I 3, 87J 1 1,336
'1. 481 '861
Estimated sales (seasonally adjusted), totaLdo.... 17,603 17,455 17,575 17,914 17,953 18,222 18,189 18,296 18,110 17,784 18,341 17,842 '17. 485 117,839
Durable goods stores?·-····-· ______________ do ... . Automotive group. _______________ ._._ ... _ .do ... .
Motor-vehicle, other automotive dealers_ do ... . Tire, battery, accessory dealers ... _______ do ... .
Furniture and appliance group._. _________ do ... . Furniture, homefurnishings stores .. _ ... _do ___ . Household-appliance, TV, radio stores .. do ....
Lumber, building, hardware group ________ do ___ _ Lumber, building-materials dealers .... _ .do. __ . Hardware stores.·----------·-········---do ... .
Nondurable goods stores? --··-···---------·-·do .. . Apparel group .... ________ .. ___ . __________ .do __ _
Men's and hays' wear stores .... _________ do ... . Women's apparel, accessory stores .. _____ do ... . Family and other apparel stores _________ do .. . Shoe stores _______________ .............. do ..
Drug and proprietary stores __ . __ . ______ ._. do .. Eating and drinking p\aces. _______________ do .. . Food group ..... ____ ._._ .. _________________ do .. .
Grocery stores. _________________________ do .. . Gasoline service stations ___________________ do ..
General merchandise group?-··--·-··---· .do .. . Department stores, excl. mail-order ...... do .. . :VI ail-order (catalog sales) ________________ do __ _ Variety stores_. __ ._. __ --···. ___ . ___ .. ____ do .. _.
Liquor stores ________ . _________ . _____ . ___ . __ do ....
Estimated inventories, end of month: Book value (unadjusted), totaL _____________ do ... .
Durable goods stores ______________________ do ... . Nondurable goods stores ___________________ do ... .
Book value (seas. adj.), totaL _______________ do ___ _ Durable goods stores 11--····-------------- .do .. .
Automotive group ........ -··--··------· .do ... . Furniture and appliance group. __________ do ___ _ Lumher, building, hardware group ______ do ... .
Nondurable goods stores \1 .... _____________ do ... . Apparel group .. ____ ·-···-------·-------·do ... . Food group ... ______ ·-·-····---···------·do ... . General merchandise group ______________ do.
Firn1s with 4 or nwre stores: Estimated sales (unadjusted), totaJ.. __________ do ... _
Firms with 11 or more stores:
5, 825 3, 256 3. 060
196
Xti8 ,)48 321
919 706 213
II, 778 1,101
199 446 261 196
580 1,243 4,242 :l, 772 J, 356
I, 887 I, 099
139 314 384
23,210 10,640 12, 570
23,980 10,810 4,150 1, 950 2, 300
13, 170 2, 680 2. 880 4,140
!3,023
Estimated sales (unadjusted), total? .......... do____ 5.17K
.-\pparel group\) ____________________________ do____ 434 :\len's and boys' wear stores_________ _ ___ do_____ 40 "\Vomen's apparel, accessory stores ________ do____ 192 Shoe stores._····--······-··-··-···-- ..... do.... 114
Drug and proprietary stores ........ _ ...... do.... 149 Eating and drinking places............. . .. do____ 75 Furniture, homefurnishings stores __________ do____ 47
General merchandise group?···---· ... __ ... do .... Department stores, excl. Inail-order _______ do_ .. __ Variety stores __________________________ .. do ___ _
Grocery stores ______________________________ do ___ _ Lumher, building-materials dealers ......... do __ _ Tire, battery, accessory stores ___________ .. do __ _
Estimated sales (seas. adj.), total '1--- ...
Apparel group?··------- _______ .. ···-·--· .. do ___ _ Men's and boy~' wear :stores _____________ do ___ _ \Von1en's apparel, accessory ~tores _______ do ___ _ Shoe stores ____________________ .. ··-·· do ... .
Drug and proprietary stores _________________ ,lo ... . Eating and drinking places. ____ --·--·--·--··do ... . Furniture, homefurnishings stores _________ do ___ _
General merchandise gro~.tp '1_-:-- ......... ... do .. --\ Department stores, excl. rnatl-order ........ do ....
1 Variety stores _____________________________ do ____ ! Grocery stores_________ _ _____ ·--- ____ do ____ l Lumber, building-materials dealers __________ do ___ -1 Tire, battery, accessory stores _______________ do ____ :
2 093 1:166
509 I. 6.)9
55 101
3, 789
258 20
Ill 78
]()I)
72 3\l
I, 135 651 243
], 597 ()5 72
5,836 3.258 3, 047
211
880 549 331
904 676 228
11,!\19 1,032
188 422 232 190
.579 1, 2H2 4, 243 3, 767 I, 367
1,826 1.077
136 297 376
23,400 10,920 12,480
24.190 II, 010 4, 420 I. 960 2,240
13,180 2, 740 2,890 4,130
3, 970
3, 420
179 16 74 .15
93 ti9 33
870 .124 ltl8
I, 676 48 62
:l, 727
240 19
!05 74
\18 75 40
I, 125 669 228
I. .57,) 62 80
5, 869 3, 249 3, 045
204
889 ,)62 327
979 745 234
11,706 1,082
197 450 241 194
569 1,243 4, 274 3, 806 1, 368
I, 855 1,072
144 319 387
24,030 11,210 12,820
24,120 10,970
4, 400 1,9ti0 2, 210
13,150 2, 730 2, 880 4, 070
3,608
3, 113
160 12 69 50
87 67 35
826 477 176
I, 470 48 .)9
3, 772
250 19
109 76
97 77 42
I, 14.) 666 242
1, il99 G4 79
6,045 3, 340 3.128
212
902 570 332
I, 011 782 229
11, 869 1.106
201 447 261 197
592 1,240 4, 320 3. 848 1, 376
1, 883 I. 078
143 320 400
24,680 11, 590 13,090
24.150 11, 120 4, .180 I, 940 2, 220
13.030 2. ti60 2, 890 4, 030
4.181
3, fi26
278 18
114 92
!l8 75 39
1, 063 614 233
1, 542 .\9 69
3, 805
251 18
106 81
101 77 41
I, 154 fi71 2481
I. 607
~?I
6,137 3, 396 3.175
221
918 fiOO 318
I, 047 799 248
11,816 I, 0.59
203 427 241 188
.579 1,283 4, 292 3, 836 I. 381
1, 93.) 1,110
149 307 388
25,270 11,930 13,340
24,460 11.290 4, 7fi0 I, 920 ~.230
13. 170 2, 720 2,?20 4. Ot\11
4. !HI
3. fi43
224 16 97 70
92 76 41
l, 088 fi73 201
I. 565 70 82
3. 815 1
2321 17
102 70
96 78 42
I. 198 716 236
I, f\02 70 83 '
'Revised. c Corrected. J Advance e . ..;tim:lte. ¥ Include:-; data not shown E'epnrately.
6,0!l9 3, 375 3.155
220
940 599 341
I. 034 787 247
12,123 1,154
228 454 273 199
592 !,304 4, 342 3, 875 I, 386
2,000 1.146
152 330 388
25,010 11. 940 13,070
24, ,)10 ll. 4!i0 1. 920 I, 940 2. 240
13, OliO 2, GVO 2. 930 4. 040
I I 4, 504 I
3. 932
259 20
113 82
99 80 39
1, 165 705 231
1, 697 76 S9
3. 935
2.56 20
109 78
101 79 40
I. 249 737 260
I. fi29 71 83
6,162 3, 476 3, 268
208
936 ti03 333
991 7.56 235
12,027 I, 100
217 435 260 188
596 I, 312 4, 300 3,833 I, 388
I, 961 I, 1.11
136 322 410
6,160 3, 454 3. 249
205
929 .)89 340
1,009 780 229
12,136 1,134
225 441 268 200
592 1,324 4, 289 3, 815 1,404
2, 030 1.186
146 337 411
24 640 24, 640 11: 830 I 11, 870 12, 810 12, 770
24,800 11, 6DO
5, 060 I, 960 2, 2()0
13,140 2, 720 2, 920 4, 120
4. 398
3, 832
2.\6 20
106 82
99 83 39
1,174 720 235
1.572 82 89
3, 897
253 20
108 75
!01 80 40
I. 233 748 253
1.610 72 77 ;'
25,090 11,900 5, 240 1,990 2, 300
13.190 2, 720 2, 960 4,1.10
4,316
3, 778
207 16 89 68
100 88 36
1.063 636 221
I, 679 82 88
3. 9h4
266 22
109 81
102 83 39
I. 289 778 261
l,fil9 72 80
6, 095 3, 350 3,135
215
952 ,193 3.59
988 758 230
12,015 1,096
217 437 257 185
600 1, 295 4, 305 3, 834 1,392
1, 989 1.183
150 315 398
24, G20 11, 370 13, !flO
24,800 ll, 620 4, \'30 2,010 2. 3oo 1
13 IX() 2:740 2. 9411 4, 170
4,298
3, 777
215 14 97 67
!l8 87 39
1, H\4 !\87 236
I, .)80 81 86
3, 972
254 20
107 74
103 81 39
1, 273 778 2471
1 ti35 71! 82 !
5, 7i3 3,105 2, 894
211
928 586 342
964 745 219
12,011 1,111
213 43,) 260 203
618 1,319 4,267 3, 7G8 1, 411
1, 958 1,142
149 323 39!;
6,360 3,690 3, 475
215
924 578 346
951 728 223
11,981 I, 080
203 433 252 192
li09 1,335 4, 294 3, 828 1,435
I. 940 1, 139
149 312 :l88
5, 682 2,961 2. 740
221
935 588 347
9il 755 216
12,160 I, 119
215 439 268 197
607 1,306 4,390 3, 916 1, 438
I, 966 !, 141
157 332 401
r 5,328 2, 667 2. 457
210
903 .)/0 333
988 773 215
' 12, 157 1,150
219 454 277 200
612 1, 3.5! 4,363 3, 886 I. 423
I. 991 1,157
154 :l27 3R6
I 5, 681
I \2.J5o
24. 270 ' 25, 130 ' 25, 170 i 23, 280 10,6fi0 11.130 10,950 JO,fi70 l:l. mo ' H,ooo , 14.220 12. 610
24, ~7o 1 · 24, 110 11. ;iQO 11, 590
4, 830 4, 960 2. 000 1. 990 2. 290 2. 290
'24, 200 ' 11,010
4,380 2,010 2,290
13,270 ' 13 120 '13, 190 2. 760 2: 700 '2, 710 2, 940 2, 920 2, 920 4, 220 ' 4. 130 ' 4, 130
I. 371
267 Ill
111 90
99 R4 38
I, 199 721 234
1, .562 so 78
:l. 929
2.59 19
110 81
103 81 39
I, 211 717 248
I. 649 68 82
4, 83tl
·1. 243
273 20
114 82
101 83 39
'1, 318 799 252
1, 807 77 88
3. 921
248 18
106 78
101 79 34
1, 214 726 244
1. 1)54 66 81)
4. 559
3, 995
269 23
113 76
98 76 41
1, 370 809 256
1, 558 65 78
'3, 934
258 19
lOB 82
104 79 37
r 1, 209 709 251
1,1\.52 67 S3
24,210 10,990
4, 2tl0 2,010 2. 320
13.220 2. 720 2, 950 4, 250
6. 24!-J
;,, 4~0
41\1 ---42
20.1 ---122 ..
!riO ___ _ __ 81 44
2. 220 I. 241
533 1. 794
58 10fi
3. 939
267 20 ..
llfl 81
10~ 78 37
1. 20.o 69~ 252
I, 651 68 so
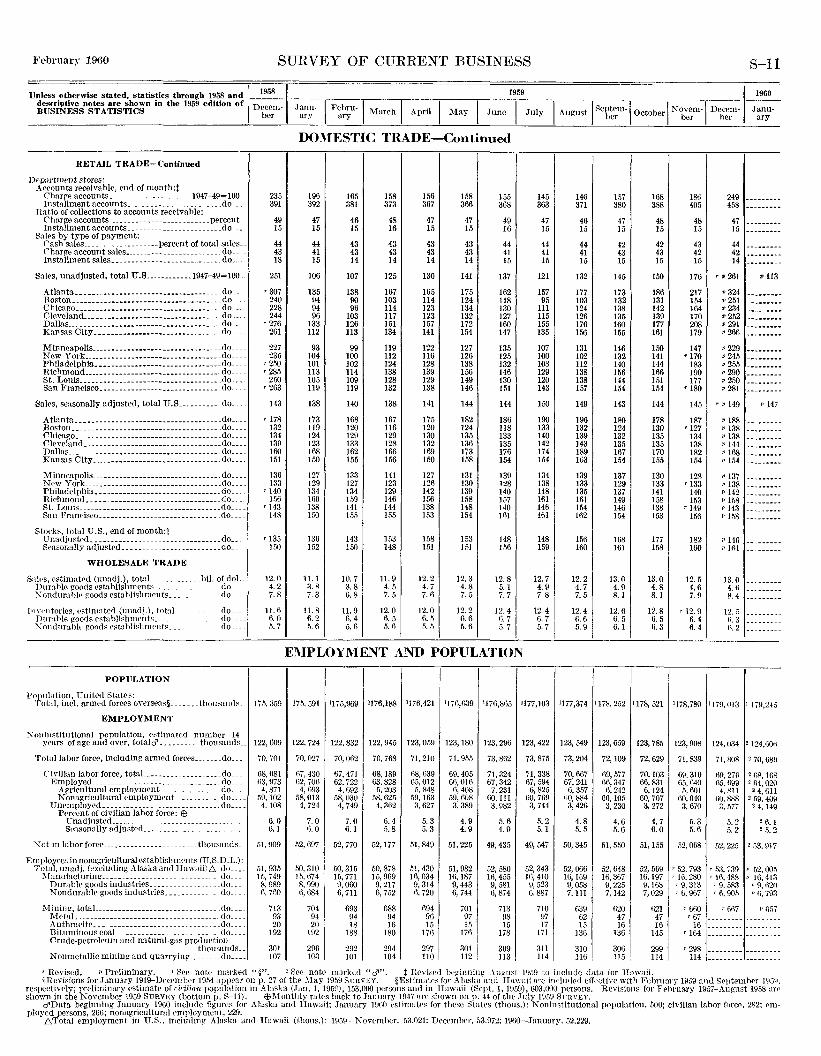
Ft>bruary 1960 SURVEY OF CURRENT BUSINESS
Unless otherwise stated, statistics through 1958 and ~~~ desrriptive notes are shown in the 1959 edition of Decem-BUSINESS STATISTICS ber
RETAIL TRADE-Continued
Dep:>rtment stores: Accounts receivable, end of month:t
Charge accounts .. __ ~- ______ --. _____ ... 1947-49=100. Installment accounts •.. -----~ ______________ do ___ _
Hatio of collections to accounts receivable: Charge accounts. _________________________ JlercenL_ Installment accounts. ____________ ----~~ _____ .do~- __
Sales by tyJle of payment: Cash sales~------------------Percent of total sales .. Charge account sales •..... __________________ _do ___ _ Installment sales.---------------------- ...... do. __
Sales, unadjusted, total u.s ____________ J947-49=100 ..
Atlanta. __ •...•••.•••. --··-------- •.•. _____ ~do._~ Boston _____ ------------------------------ __ .do __ _ Chicago ____ ------------------------------_--do_--_ Cleveland ____ ----------------------------- .. do.-.-Dallas~ ______ ------------------ ___ --------- __ do. __ _ Kansas City --------------------------------do._-_
Minneapolis ________ ------------------------ .do. __ New York ..... ----------------------------- .do. __ _
Kr~~~~J'~-~---:===== ======== =================~g=:: _ St. Louis. ____ ------------ __ .--------------_ .do. __ _ San Francisco _______________________________ do
Sales, St•asonally adjusted, total u.s __________ .. do.
A tlant'l •••• ____ ----- ___ -----. ___ --- .• ---- __ .do .. _-Boston --------------------------------------do. __ _ Chicago ____ -------------------- _____ ----- ___ do. __ _ Cleveland .. _---------------------------- ____ do.- __ Dallas ~ _____ ----------------------- ________ .do. __ Kansas City ____ --------------- _____________ .do. __ ~
Minneapolis.--------------------- __________ ~ do. __ _ New York.--------------------------------- .do. Philadelphia._----------------------- _______ do_. Richmond •• ____ --------------------------- do_ St. Louis ______ -------------------------- ___ .do __ Snn Franeisco_ ----------------- ______________ do
Stoeks, total U.S., end of month:t Unadjusted. ___________________ ~ ____________ do .. _ Seasonally adjusted .•. ______________________ do.
WHOLESALE TRADE
Salt•s, estimated (nnadj.), total ___ ~ _______ hil. of doL. Durable !(oocts Pstahlishmrnts. __ ~~ _ _ _ __ _ _ _ _ do __ _ :-::ondumhiP goods cstablishnwnts_____ do~
lllY<'lltorics, 1..•stimatcd (nnadj.), total Dura hlP goods l'StablishnwntR_ X ondnrablP goods Pstn hli~hnlt'nt~- __
<lo .. do do
235 391
49 15
44 43 13
251
'307 240 228 244
'276 261
227 23.5
'250 '285
250 '263
143
'178 132 134 139 160 151
136 133
'140 1-56
' 143 148
'135 150
12.0 4. 2 7. 8
JL(i 6.0 5. 7
1959
Janu- I Fehru-1 I . I I ary ary March Apnl May June I July
DO:\IESTIC TRADE-Continued
196 392
47 15
44 41 15
106
135 94 94 96
133 112
93 104 101 113 105 119
138
173 119 124 123 168 150
127 129 134 160 138 150
136 152
11.1 3. 8 7.3
11.8 6. 2 ii. 6
165 381
46 15
43 43 14
107
138 90 96
103 126 113
99 100 102 114 109 119
140
168 120 129 133 162 155
133 127 134 159 141 15.'
143 150
10.7 3.8 6.8
11.9 6.4 5. 6
158 373
48 16
43 43 14
125
167 103 114 117 !51 134
119 112 124 138 128 132
138
167 116 129 128 166 156
141 123 129 146 144 155
153 148
11.9 4. 5 7. 5
12.0 6 .• 5 5. 6
!56 367
47 15
43 43 14
130
165 114 123 123 157 141
122 116 128 139 129 138
141
175 120 130 132 169 150
127 126 142 156 138 153
!58 151
12.2 4. 7 7. 6
12.0 6. 5 5. 5
158 366
47 15
43 43 14
141
175 124 134 132 172 154
127 126 138 !56 149 146
144
182 124 135 136 173 158
131 130 139 158 148 154
153 !51
12.3 4. 8 7. 5
12.2 6.6 5.6
155 368
49 16
44 41 15
137
162 118 130 127 160 147
135 125 132 146 130 151
144
186 118 133 135 176 154
139 128 140 157 140 161
148 !56
12.8 5. I 7. 7
12.4 6. 7 5. 7
145 363
47 15
44 41 15
121
157 95
111 115 155 135
107 100 108 129 120 143
150
190 133 140 142 174 154
134 138 148 161 146 161
148 159
12.7 4.9 7.8
12.4 6. 7 5.7
EMPLOYMENT AND POPULATION
POPUI,ATION
Population, United States: Total, inrl. armed forces ovrrsNts§ ____ ._thousands 175. 359
I '175,969 '176,188 '17(i,421 1[76,639 '176,86,5 '177,103 175, 591
EMPLOYMENT
~ouinstitntional population, estimatPd number 14
S-11 ~ ~ ~ ~ ~ ~ ~~ ~ '11960
I August I Re!ltem-1 October I Novem-~~-~Dece~: ~j~;;-;-- her ber her ury
146 371
46 15
44 41 15
132
177 103 124 126 176 156
131 102 112 138 138 157
149
196 132 139 143 189 163
139 133 135 161 154 162
156 160
12.2 4. 7 7. 5
12.4 6.6 5. 9
157 380
47 15
42 43 15
145
173 132 138 135 160 155
146 132 140 156 144 154
143
180 124 132 135 167 154
137 129 137 149 146 154
168 161
13.0 4.9 8.1
12.61 6. 5 6. I
168 388
48 1.>
42 43 15
150
186 131 142 139 177 161
150 141 144 166 I.Jl 154
144
178 130 135 135 170 155
130 133 141 158 138 153
177 158
13.0 4.8 8.1
12.8 6. 5 6. 3
'177,374 1178,252 '178, 521
186 405
48 15
43 42 15
249 458
47 15
44 42 14
176 ·•261
217 154 164 170 208 179
147 '170
183 190 177
'180
p 324 • 251 p 234 p 252 p 291 p 266
p 229 • 245 • 255 p 290 p 250 p 281
145 'p 149
187 '127
134 138 182 154
128 '133
140 153
'149 156
182 160
12. 5 4.6 7. 9
'12.9 6. 4 6.4
•188 •138 p 138 •144 p 168 p 154
•137 •138 •142 •158 p 143 p 1->8
p 146 11)(}t
13.0 4.6 8.4
12. ii 6. 3 6. 2
I 1178,780 IIJ79,013
• 113
p 147
1 I79,24.o
years of age and over, totalci'. ______ . _ thousands__ 122, 609 122, 724 122,832 122. 945 123,059 123, 180 123,296 123,422 123, 549 123,659 123, 785 123,908 121,034 2 124,GOI\
Totallahor force, including armrd forces.-~ ___ ~ do. __
Ci\·ilian labor force, totaL ... __ ----------- __ do.~_ Employed. ______ --~- _______ ---------------" do. __ _
Agricultural emJlloyment_ ______________ do ... Nonagricultural employment _______ . _____ do ___ _
Unemployed _____________ ----~---------~do .. PPrcent of civilian labor force: $
Unadjusted _________________________________ _ S1•nsonally adjustrct_________ _ ____________ _
!\ot in labor force ----------------~ __ _ . thousands_
EmJlloyees in nonagricultural e~tablishm<'nts <U.S. D .L.): Total, unadj. (excluding Alaska and HawaiilL:, do ___ _
i\lanufacturing ___________________ ----- _ do. Durable !(oods industries ___________ -~-. _ ~ ~~do_ Nondurable goods industries _____________ .do.~
Mining, totaL.---------------------------- cto. MrtaL ·----------------------------------·do. __ _ Anthracite. ___ ------------ _______________ .do. __ _ Bituminous coaL ____ ------------------ ___ do. __ _ Crude-petroleum and natural-gas production
thousands __ Nonmetallic mining and quarrying~----~- .do ....
70, 701
68,081 63,973
4, 871 59, 102 4.108
6.0 (\.!
51,935 15,749 8, 989 6. 760
713 93 20
192
301 107
70,027
67,430 62, 706 4, 693
58,013 4, 724
7.0 6.0
52,697
50,310 15,674 8, 990 fl, 684
704 94 20
192
29(i 103
70,062
67, 471 62,722 4,692
58,030 4, 749
7.0 6. I
52.770
50,315 15,771 9,060 6, 711
fl93 94 18
188
21)2 101
70,768
u8,I89 63,828
5, 203 58,625 4,362
6.4 5.8
52,177
50,878 15, 969
9, 217 6, 752
688 94 16
180
294 104
71,210
68,639 65,012 5,848
59,163 3.627
5. 3 5. 3
51,849
.o!, 430 16,034 9, 314 6, 720
6\)4 96 1.5
176
297 110
71,955
69,405 G6, 016 6, 408
59,608 3, 389
4. 9 4.9
51,982 16,187 9, 443 6, 744
701 97 15
176 I
am 1 112,
73,862
71,324 67,342
7,231 60,111 3, 982
5. 6 4.9
49,435
52, 580 16,455 9, 581 6, 874
713 98 15
178
309 113
73, 87.5
71,338 67,594 6,825
fiO, 769 3, 744
5.2 5. 1
49,547
52,343 16,410
9, 523 6.887
710 97 17
171
:m 114
73,204
70,667 67,241
6, 3.57 fiO, 884 3, 426
4.8 5. 5
50,345
52, 06() 16, 169 9, 058 7, Ill
639 62 15
J3o
310 116
72, 109
69, .577 66,347 !i,242
60,105 3, 230
4.6 5.6
51,550
52,648 16,367 9, 225 7,142
fi20 47 16
136
306 ll5,
72,629
70.103 66,831 6,124
60,707 3,272
4. 7 6.0
51,155
52,569 16,197 9,168 7,029
fi21 47 10
145
ml , Revised. P Preliminary. 1 See not<" marked "§". 2 Se(' note marked "cf". t Revised heg-inniug ~\ugu~t H~S9 to include data for Hawaii.
71,839
69,310 65,640
.'), 601 60,040 3, 670
5.3 5.6
52,068
'52, 793 '16, 280 '9, 313 '6, 967
'660 '67
16 '164
•298 114
71,808
t\9, 276 fi5, 699
4, Rl! li0,888
3, 577
5.2 5. 2
52,225
z 70,()8fl
2 fi8, Hi8 2 64,020
2 4, 611 2 .59, 409
2 4,149
2 6.1 '.). 2
T 53, 739 p 52. OOi'i '16, 488 p 16, 4l:J ' 9, 583 p 9, f\20 r 6. 905 P f>, 793
r 6fi7 P fi!}j
tRevisions for January 1919-Decemher 1954 appear on p. 27 of thP :Vfay 19.59 SnRVEY. §Estim<ltes fo>· Alaska and Hawaii il"e inclndrd eff<•clive with February 1959 and SeptembPr l95ll, respectively; Jlfl'liminary estimate of ririlinn population in Alasl<a (.fan. l, 195r.), 153,000 persons and in !Iawaii (Sept. 1, 1959), 603,000 persons. Revisions for February 1957-Angnst 1958 ar<' shown in the November 1959 SURVEY (bottom p. S-11). $Monthly rates back to Januory Hl47 nn• shown on p. 44 of thr• July 1959 SnRVEY.
ci'Data beginning January 1960 include figures for Alaska an<l Hawaii; January 1960 PstimatPS for these States (tbons.): Nonimtitutiona.l popul<>tion. 500; civilian labor forcr. 2R2; l'mployrd persons, 266; nonngricultural Pmployment, 229.
L:,Total emJlloyment in U.S., including Alaska anct Hawaii (thons.): 1959-l\ovember, .5:1,021: Drcrmhrr, .>:!,972; 1960-January, 52.229.
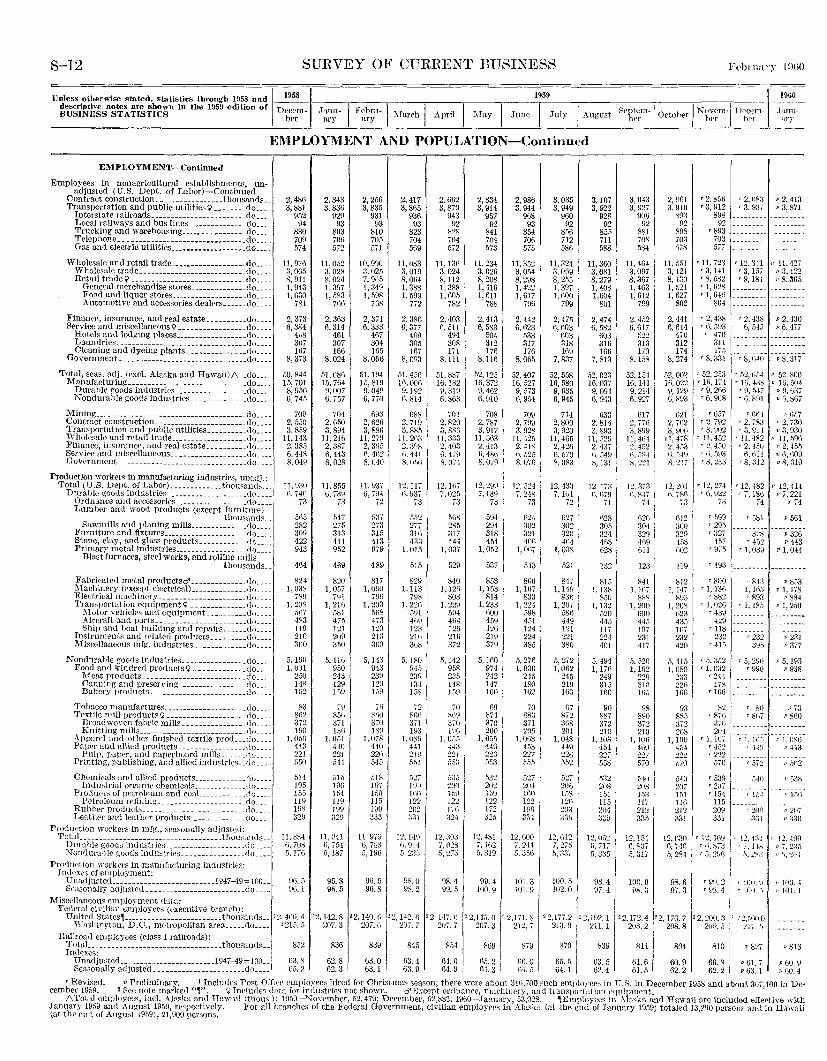
S-12 SURVEY OF CURRENT BUSINESS
Unless otherwise stated, statistics through 1958 and ~~~ descriptive notes are shown in the 1959 edition of BUSINESS STATISTICS Decem- Janu- I Febru-ll\Tarch I April ll'vlay I June ber ary ary
1959
I July
EMPLOYMENT AND POPULATION-Continued
EMPLOYMENT-Continued
Employees in nonagricultural establishments, unadjusted (U.S. Dept. of Labor)-Continued
Contract construction. ________________ thousands .. Transportation and public utilitiesl) ________ do ....
Interstate railroads ... _____ -------------- .. do. __ _ I~ocalrailways and bus lines _______________ do ___ _ Trucking and warehousing ________________ do ___ _ Telephone ____ ---------------------------.do ___ _ Gas and electric utilities ___________________ do ___ _
Wholesale and retail trade •.•.••••••..••••... do ___ _ Wholesale trade_---------- __ •• ------ _____ .do. __ _ Retail trade\1-----------------------------do ___ _
General merchandise stores ______________ do ___ _ Food and liquor stores ___________________ do ___ _ Automotive and accessories dealcrs ...... do ___ _
Finance, insurance, and real estate __________ do ___ _ Service and miscellaneous\) •.. ______________ do ... .
Hotels and lodging places __________________ do ... . Laundries _________________________________ do ... .
G Cleaning and dyeing plants _______________ f] 0 ___ _ overnment ________ ----- ___ • ______________ .do. __ _
Total, seas. adj. lexcl. Alaska and Hawaii)L', .. do .... Manufacturing _____________ ------ __________ .do .. __
Durable goods industries __________________ do ___ _ Nondurable goods industries ______________ c\o ___ _
Miuitw .. ------------------------------------do ... . Contract construction. ______________________ do ... . Transportation and puhlic utilities __________ do ___ _ Wholesale and retail trade ________ ·---------.do ___ _ Finance, insurance, and real estate __________ do ___ _ Service and miscellaneous ___________________ do ___ _ Government ________________________________ do ___ _
2, 486 3, 881
952 94
830 709 574
11,976 3,065 8, 911 I, 943 1,630
781
2, 373 6,3S4
4G8 307 167
8,373
50,844 15,701 8, 956 6, 745
709 2, 550 3,859
11,143 2, 3S.o 6, 448 8, (14[)
Production worker< in manufacturing industries, uuadj.: Total (U.S. Dept. of Labor) _____________ thou~ancb ___ 1 11. Hao
Durable goods industries ____________________ do____ n, 740 Ordnance and accessories _________________ .do____ 73 Lumber and wood products (except furniture)
thou~ands__ 51i5 Sawmills and planing mills ______________ do____ 282
Furniture and fixtures _____________________ do____ 30H Stone, clay, aud glass products ____________ do____ 422 Primary metal industries __________________ do____ 943
Blast furnaces, steel works, and rollit1g llli!ls thousands.. 464
Fabricated metal productsci' .••........... do____ 824 Machinery (except electrical) ______________ do____ 1, OWl Electrical machinery ______________________ flo____ 7.SU Transportation equipment\) _____________ _clo____ 1. 208
Motor vehicles and equipment_ _________ do____ 5ii7 Aircraft and parts _______________________ do____ 483 Ship and hoat building and rcpairs ...... do____ llU
Instruments and related products _________ do____ 210 MisC<'llaneous mfg. industries_ -----------.do____ 3GO
Nondurable goods industries ________________ do____ 5, 1\liJ Food and kindred products\) __ ----------.do____ I, 001
Meat products. ------------------------.do____ 250 Canning and preserving __________________ flo____ 14!': Bakery products_--------------- ________ do____ 1<\2
'l'obacco manufactures _____________________ do ___ _ Textile mill products\) ____________________ do ___ _
Broad woven fabric mills ________________ do ___ _ Knitting nlills ___________________________ (lo ___ _
Apparel and other finished textile prod ... clo ___ _ Paver and allied products _________________ do ___ _
Pulp, paper, and paperboard mills ______ do ___ _ Printing, publishing, and allicdindustries __ do ___ _
Chemicals and allied products ____________ _r]o ___ _ Industrial org-anic chemicals _____________ do ___ _
Products of petroleum and coaL ___________ do ___ _
R~l;~~~l~~~~~~~~~-~~~::::::::::::::::::::~g:::: Leather and leather products ______________ ()o ___ _
Pr;~~f2~~~~~ -~--o_r_~~!~S- ~~ _ ~~~~·~ _s_e_a~~~~:=l-~ ~-~j-'~f~~g~~m ds __ ! Dm·uhle goods industries ____________________ do ___ _ Nondurable goods industries ________________ do ___ _
Production \\·orkers in manufacturing industries: Indexes of employment:
Unadjusted _________ ---------------- .1947-49= 100. _ Seasonally adjusted __ -----------------------do ___ _
l\1iscella.ne.ons employment datu:
~3 862 372 1\JO
1,05(i 443 221 5.\0
514 1!!5 155 IHJ HJS 329
11, 8S4 6, 70~ 5, 17(i
91l. 5 9tl.l
Fedrro.l civilim1 employees (executiYe branch): United States, _________________________ thousands __ '2. 41\0.4
\Yashington, D.O., metropolitan area _____ do____ '215. 5
Railroad employees (class I railroads): TotaL _______ ---------------------- __ .thousands._ 852 Indexes:
U nadjnsted __ ----------------------1947-49= 100. _ 63. 8 Seasonally adjusted_ ----------------------do____ 65.2
2,343 3,836
929 93
803 706 5-o ,_
II, 052 :1,028 8,024 I, 397 I, 583
766
2, 363 6,314
461 307 166
8,024
51,08G 15,704 U,007 6, 757
704 2, 050 3, 894
II, 2Hi 2, 387 6, 443 8,028
11,8.05 li. 73\)
73
547 275 313 411 952
469
820 1, 0[17
791 I, 216
581 475 121 209 350
5, !IIi 950 243 12\l !.09
79 850 371 lSfi
I, 051 4411 221 544
515 I!J(i !54 11U 199 329
11. \14) c, 154 5,187
95.8 96.5
'2, 142.8 207.3
8361 62.8 62.3
2,256 3,835
931 93
810 7o.o 571
10,990 3, 025 7, 9~i5 1, 349 I, .0\18
768
2,371 6, 333
467 304 IG5
8,066
51, 194 15, 81\l 9,049 6, 770
693 2,62fi 3, 880
11, 27\J 2, 3D5 f), 41i2 8, (140
11, 93'; G, 7H4
72
537 273 315 413 979
489
817 l,OHO
79(i I, 203
5(i8 473 120 213 3fi0
5,143 943 23\J 129 109
'j(i
r:til) 370 189
I, 078 440 220 545
518 107 !50 115 199 333
11. 9·;:1 G, 7b8 5,190
95. ti
96.81
2,417 3, 81)5
936 93
823 704 569
11,083 3,01U 8, 064 I. 388 I, 599
772
2, 386 6, 3i7
4n9 305 lfi7
8.093
51, 45() 16, OOG 9,192 6. ~14
688 2, 719 3, 885
11.263 2, 398 ii, 44! 8, ()!iii
12.117 6,937
73
552 277 3In 433
1, 015
515
82U 1.113
79.~ 1, 22ti
59! 4G9 123 216 308
5, ISO 945 23U 134 158
72 s~~~i 371 Hl3
1.08.5 441 21\J 5.51
527 HIU lflll 122 202 331
12.14,)
~· 9.1! v,2.h
98.0 98.2
20 140 C loo 14° (' -· 207:1: -· 20~: 7
839 845
63.0 63.4 63. 1 63. 9
2,662 3,879
943 92
82S 704 572
II, 1:16 3,024 8, 112 1, 388 !, 605
782
2,403 6, 511
4\14 308 171
8, Ill
51,887 16,182
9, 319 6.863
701 2.829 3 sse u: 333 2. 403 0. 47H 8.074
12, li\7 7,025
73
5!\K 285 317 444
I, 037
529
840 I, 12G
803 1,229
594 4G4 120 21G 372
5,142 953 235 148 1.'"~9
10 .S~iU 370 1\l(l
1, 055 -!43 221 [).);{
[J:),) 201) 15\) 122 17() :;24
12, ;i(l3 7 n·)s .s; 27s
\)8. 4 \)9. 5
854
G4. 0 64. u
2, 834 3, 9!4
957 92
841 704 573
II, 234 3, 026 8, 208 1,4!6 I, 611
788
2, 413 6, 583
504 312 176
8,116
52,125 16,372
9, 462 6, 9!0
708 2, 787 3, 9!7
11, 363 2, 413 {), 4Sii 8, 079
12, 29!1 7,139
73
594 294 318 454
I, 052
537
853 I, 153
8!4 I, 233
600 459 126 219 379
5, !GO 974 242 147 !GO
69 874 370 200
1, 05.rJ 44(\ 223 f>[,3
{!32 202 159 122 172 325
12,481 7.11i2 5, :519
99.4 100.9
8G9
2, 986 3, 944
968 93
854 7011 575
11,352 3, 0.14 8, 2U8 1.422 I, 617
706
2, 442 6,623
.533 317 176
8,065
.52, 407 16, 527 9, 573 6, 954
709 2, 799 3, 928
11, 42.5 2, 41S fi. ,1)25 8. Oifl
12, 5:!-! 7, 248
73
624 302 321 4fi(i
1,0\17
M3
866 I, IG7
833 I, 224
598 451 124 224 385
5, 276 1, 030
245 180 162
70 ss:1 371 205
1,068 453 227 f:,)5 I
527 201 lflO 1')•)
}()()
234
12,600 7, 214 5, 35G
101.3 101.9
879
Gfl. 0 64. 5 I
3,035 3, 949
960 92
85fi 712 586
11,324 3, OG9 8, 255 I, 397 1, r,oo
799
2, 475 6,603
603 318 Hi9
7, 837
52,558 16, 580 9, 635 fi, 945
714 2,800 3, 920
11, 46.o 2,426 G, 570 s, os:;
12, 43:) 7, Ill!
72
627 302 320 404
I, 038
52!
847 1, 149
s:lli I, 207
586 449 121 221 380
5, 272 I, 062
245 210 Hi3
67 872 3G8 201
1, o,;g 449 22ti 552
527 206 !58 120 211;1 335
12,1012 7, 275 5, 337
100.5 102.0
2 2,177.2 2. 213.0
870
65.5 64. 1
3,107 3, 922
928 92
855 711 588
II, 360 3, 081 8, 279 I, 408 1.604
801
2, 474 6, 582
603 31f> IGfi
7, 813
52, 023 16.037
9, 09,1 G, 943
ll33 2, 814 3, 893
11, .~20 2, 4;17 0, Ei49 8,131
12 173 G, 1)79
71
028 30.\ 324 4fi8 1)28
132
815 1,138
SfiO 1,132
.\20 445 117 224 401
5. 494 1, 170
249 315 l()fi
90 887 372 210
I, 103 454 227 558
532 208 !51 115 204 :l:.:Q
12,052 {), 717 5, 3~i5
98.4 97.4
3. 043 a, n27
9()1) 92
881 708 584
II, 4fi4 3,097 8,367 1, 463 1, 612
799
2, 452 6, 617
522 313 170
8. 158
52, 154 IG,l41 9, 214 6, 927
617 2, 771) 3, 8!)9
11. 41)4 2. 4[)2 (), 5?1·1 8, 2:!1
2, t!G1 3. 910
893 92
898 703 57H
II. 5.51 :J, 121 8, 430 1, 521 I 627 '802
2, 441 6, 614
476 312 174
8, 274
.\2, 002 16,022 9,129 6, RU3
621 2, 7fi2 3, 900
J], 478 2, 4:'3 G, :,49 S, 2!7
12.373 1 12,201 G, 847 H, j!)f\
74 73
1)20 012 304 300 329 329 409 47~8 Gil (;02
841 1,167
88S I, 200
GOO 44.) 107 231 417
!l, 52G !, 162
229 31G Hi5
98 890 372 210
1, !Of> 4fi0 227 570
:'\10 20S 153 117 212 335
1'' 15-1: G: k37 5, 317
\00.0 98.3
812 1, Hi
i'93 I, 208
023 4:)5 107 232 420
5, 4\.o I, 080
233 22H 166
93 S85 372 208
I, 100 454 222 .570
Mil 207 151 116 212 331
12,~:l?, G, <4>J 5, 281
9R. 6 97.3
1 I 22,172.4 22, lifi. 7 I 20S. 2 208. 8
839
63.5 62.4
814
61.6 61.5
804
60.9 62.2
T 2, 85f) r 3, fll2
898 92
r SfJ3 703 577
1960
January
p 2, 413 p 3. 871
'II, 723 '3, 141 '8, 582 ') 628 r 1: ().!fi
' 12, 'l~ 1 p !1, 427 I ' 3, 157 v 3, 122
804
r 2, 438 r 6, 593
' 9, 184 p 8. 305
'2 438 p 2,430 6: .5.!5 p 6. 477
r 470 ·-------- ---------311 1 lii)
'8,331
T 52,253 '16, 174
T 9,266 r 6, 908
'8.640 p 8.317
T 52, 654 I' 52, S()Q ' 16.438 P IG, 50-1
r 9, 5·17 P 9, 637 '6, ~91 p 6, 867
r 637 r Gti4 P 657 r 2, 792 r 2, 7~3 P 2, 730 '3, fKJ2 '3, 014 P 3, 930
r 11 452 r 11, 482 P 11, 590 r 2:-:150 r 2, 451J P 2, 45.5 r n, .51J3 6, tHl P 6, 609 's. 2:;3 I '8, :nz v 8, 319
'12, 27411 '12. 482 p 12,414
'6, U22 '7, 18il v 7, 221 73 74 p 74
: ~~ I~ ___ :_~:~- : ::~ 457 T 45:2 p 443
r 9/5 r 1, 039 P 1, 044
'800 'I, 13fi
'882 '1,026
'409 429
'118 232
r 415
r 539 r 207 ' 1.5-l
115 20V 331
r 12, 1()\J r fi,87:3 r 5, 2H!)
'11'1.21 '9S. 4 ~
'843 !, 163 '893
r 1, ]f(;)
p 853 p 1, 178
'' S84 PI, 250
r 232 P 231 3\J.') p 377
540 !' 53S
r 1.1-1- P 15!\
r :2Wl P 207 3:H P 330
r 1''"~ 4'V P 12, 4~l9 T 7; 11~ p 7, 2:35 r ,j, ;?::-,;j f! 5. 2(i.f_
'IOIJ. \, I ,. F!O. 4 r 100. 0 '' 10 l. 1
'2, 200. 31 : z,cf'<i.O
'~·:'I :.::~ 62.2 > 63. I
p i\0. g v no. 4
'Revised. P Preliminary. 'Includes Post Office employees hired for Christmas season; there were about 3Hi,700,uch employees in U.S. in December 1958 and about 307100 in De-cember 1959. 2 See note marked "r'. ~Includes data for industries not shown. d"Except ordnance, machinery, and transportr~tion equipment. '
!'.Total employc.es, incl. A!C~ska and Hawaii (thous ): 1959-NoYember, 52.479; December, .\2,882; 1960-.Tanuary, 53,028. ,Employees in Alaska and Hawaii are included effective with January 1959 and August 1959, respectively. For all branches of the Federal Government, civilian employees in Alaska (at the end of January 1959) totaled 13,200 persons and in Hawaii (at the end of August 1959), 21,900 persons.
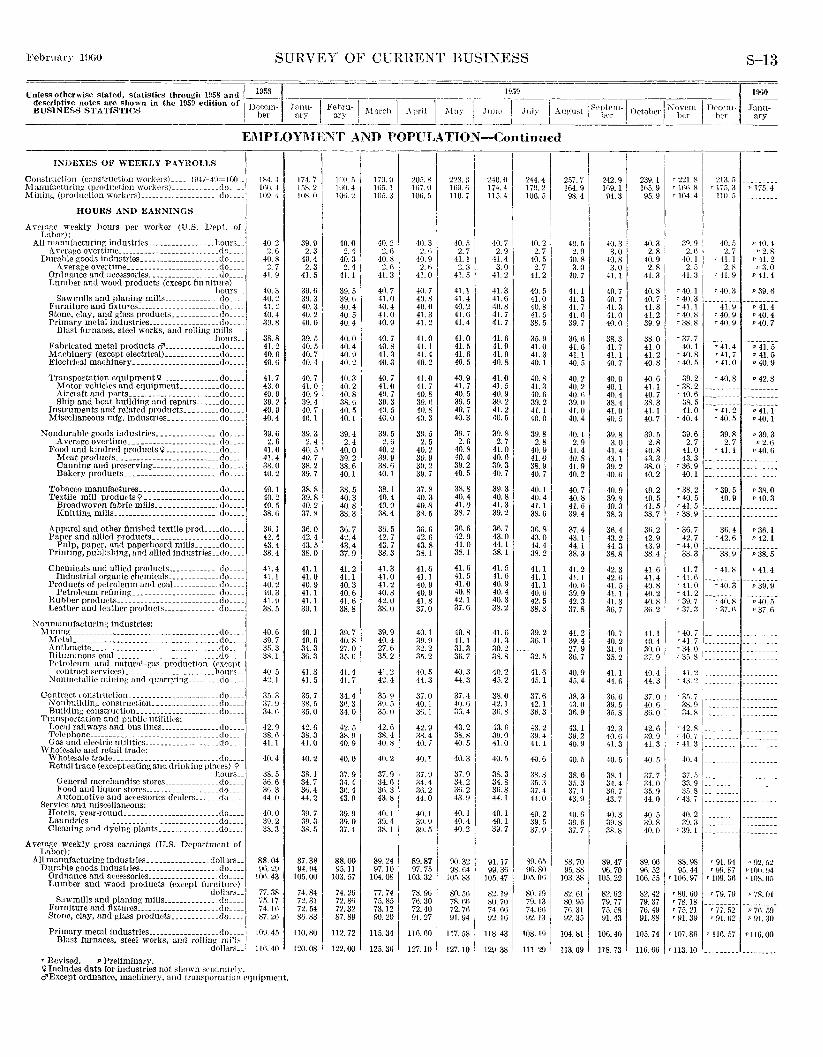
SURVEY OF CURRENT BUSINESS S-13
Unless otherwise stated, statistiC'S through 1958 and / 1958 -1 _ __ descriptive notes are shown in the 1959 edition of ,. BUSINESS STATISTICS I Decem- Junu- I Eebru-1 l\T"rch I •\pril I :lhv I
' ... ' 1
her ary ury '~-1
~ ... ' ~
1~'5~)
J""'' 1 .~ ~~~,- I All 'USt I Sentcm-J 0 t her I Xovem-j nect'Ill-1 g ' bcr r 0 her brr
I
1960
January
EMPLOYMENT AND l'OPULATION-Continued
INDEXES OF WEEKLY PAYROUB
Construction (constrnetion worker~) _____ l H47-49=10Q __ :1\lanufn.f'tnring (production wurkers) _____________ do ___ _ I\iining (production 'vorkcrs) ____________________ flo ___ _
HOURS AND EARNINGS
A vcra:ce weekly hours per worker (U.S. Drpt. of Labor):
All mmmfacturinr, industries _________________ hours __ Average overtimc __________________________ do ___ _
Durable goods industrics ____________________ do ___ _ Average overtime ______________________ do ___ _
Ordnance and accessories _________________ . do ___ _ Lumber and wood products (except furnitnre)
hours __ Sawmills and planing mills _____________ do ___ _
Furniture and fixtnres _____________________ \lo ___ _ Stone, clay, and glass prodncts ____________ <Jo ___ _ Primary metal industries __________________ do ___ _
Dhst furnaces, steel works, and rolling mills hours __
Fabricated metal products 0'--------------do ___ _ Machinery (except electrical) ______________ rlo ___ _ Electrical machinery_ ---------------------do ....
Transportation equipment\! _______________ do ___ _ Motor vehicles and equipmeut_ _________ do ___ _ Aircraft and parts _______________________ rlo ___ _ Ship and boat building and rcpairs ______ do ___ _
Instruments and related products _________ rJo ___ _ Miscellaneous mfg. industries _____________ do ___ _
Nondurable goods industries ________________ do ___ _ Average overtime _______________________ do ___ _
Food and kindred products\! ______________ do ___ _ Meat products __ ------------------------do ___ _ Canning and preserving _________________ do ___ _ Bakery products_----------------------- do ___ _
Tobacco manufactures. __ ----------------- do ___ _ Textile mill products\! ___________________ do ___ _
Broadwoven fabric mills ________________ do ___ _ Knitting mills. --------------------------do. __ _
Apparel and other finished textile prod .... do ... . Paper and allied products _________________ do .... .
Pulp, paper, and paperboard mills ______ do ... . Printing, publishing, and allied indnstrics .. <lo ___ _
Chemicals and allied prodncts _____________ do ___ _ Industrial organic chemicals _____________ do ___ _
Products of petroleum and coaL __________ do ___ _
R~,b~~~l~~~~;,~~i~~~ ~=: ::::::::::::::::: :~g:::: Leather and leather products ______________ do ___ _
!\onmanufaeturing industries: ~lining _________ -------- _____________________ do ___ _
MetaL ______ ------------- ________________ .do ___ _ Anthracite ______ --------- _________________ do. __ _ nitnminous coaL _________ ---------------- _do ___ _ Petroleum and natural-gas production (rxccpt
contract serviers) _______________________ hours __ Nonmctallie mining and quarrying ________ do ___ _
Contract construction _______________________ do ___ _ Non building- l'Onstruction_ ------- _________ do ___ _ Building eonstruetion _____________________ do ___ _
Transportation and public utilities: Local railways and bus lines _______________ r\o .. __ Telephone. _______________________________ .do. __ _ Gas and electric ntilities ___________________ do __ _
Wholesale and retail trade: Wholesale trade-------------- _____________ do .... He tail trade (except eating and drinking places) <;;?
hours __ General merchandise stores ______________ do ___ _ Food and liquor storcs ___________________ <lo ___ _ Automotive and accessories dcalers ______ do ___ _
Servico and miscellaneous; Hotels, year-round ___ -------------------- _do ___ _ Laundries _________________________________ do ___ _ Cleaning and dyeing plants _______________ do ___ _
Average weekly gross earnings (U.S. Dcpnrtrnent of Labor):
All manufacturing industries _______________ dollars __ Durahle goods indnstries ____________________ do ___ _
Ordnance and accessories __________________ do ___ _ Lumber and wood products (except furniture)
dollars .. Sawmills and pl::ming mills ______________ do ___ _
Furniture and fixtures _____________________ do ___ _ Stone, clay, and glass products ____________ do .....
1S4. I I 100. I 1011.1
40.2 2. 6
40.8 2. 7
41.9
40.3 40.2 41.2 40.4 39.8
38.8 41.2 40.6 40.6
41.7 43.0 40.9 39.7 40.9 40.4
39. (j
2. 6 41.0 41.4 38.0 40.2
40.1 40.2 40.5 38.6
36.1 42.4 43.4 38.4
41.4 41.1 40.2 40.3 41.9 38.5
40.6 39.7 35.3 3X. I
40.5 42.1
3.o. 3 37. ~J 34. G
42.9 38. (i 41. I
40.4
38.5 3ti. 6 3<]. 3 44.0
40.0 :l9. 2 38.3
88.04 96.29
106.43
77.38 75.17 74. ]{j 87. 2fl
Primary metal iltdnstries __________________ do____ I09. 45 Blast furnaces, steel works, and rolling mi1ls
dollars.. 1 W. 40
' Revised. • Preliminary. \!Includes data for industries not shown separately. d'Except ordnance, machinery, and transportation equipment.
17-1. 7 LoX. 2 lOX. 0
39.9 2. 3
40.4 2. 3
41.5
39.() 39.3 40.3 40.2 40.0
39.5 40.5 40.7 40.4
40. 7 41.0 40.9 39.4 40.7 40.1
39.3 2. 4
40.5 40.7 38.2 39.7
38.8 39.8 40.2 37.8
36.0 42.4 43.5 38.0
41.1 41.0 40.9 41.1 41.1 39.1
40.1 40.6 34.3 3G. 3
41.3 41.5
35.7 38.5 35.0
42.6 38.3 41.0
40.2
38.1 34.7 36.4 44.2
39.7 39.3 38.5
87.38 94.94
105. 00
74.84 72.31 72.54 86.83
110.80
I20. 08
1!"P. ,) Wl. 4 lOti. 2
40.0 2. 4
40.3 2. 4
41.1
39.5 39.6 40.4 40.5 40.4
40.0 40.4 40.9 40.2
40.3 40.2 40.8 38.6 40.5 40.1
39.4 2.4
40.0 39.2 38.6 40.1
38 .• 5 40.3 40.8 38.3
3o. 7 42.4 43.4 37.9
41.2 41.1 40.3 40.6 41.6 38.8
39.7 40.8 27.0 35. (i
41.4 41.7
34.4 3!i. 3 34.0
42.5 38.9 40.9
40.0
37.9 34.4 3G. 4 43.9
39.9 39.0 37.4
88.00 95. II
103.57
74.26 72. sr, 72.32 87.89
112.72
122.00
17\l. n lli.1. 1 105.3
40. 2 .t)
40.8 2. fi
41.3
40.7 41.0 40.4 41.0 40.9
40.7 40.8 41.3 40.3
40.7 41.0 40.7 39.3 40. 5 40.0
311.5 .ti
40.2 39.9 38. G 40.1
38.1 40.4 40.9 38.4
36.5 42.7 43.7 38.3
41.3 41.0 41.2 40.8 42.0 38.0
39.9 40.4 27. (i 35.2
41.2 42.4
35.9 39.5 35.0
42.6 3K4 40.8
40.2
37.9 34. G 31i. 3 43.8
40. l 39.4 38.1
89.24 97.10
I04.08
77.74 7.5. 85 73.12 90.20
115.34
125. 3G
~O!l. 8 Hi7.0 lOG. 5
40.3 :?.n
40.9 2. ti
41.0
40.7 40.8 40.0 41.3 41.2
41.0 41.1 41.4 40.2
41.0 41.7 40.8 39. (i 40.8 40. 3
39.5 2. 5
40.2 39.9 39.2 39.7
37.8 40.3 40.8 38.5
3fi. 6 42.6 43.8 38. I
41.6 41.1 40.9 40.9 41.8 37.0
40.1 39.9 32.2 :15.2
40.5 44.3
37.0 40.1 3!i. l
42.9 38.4 40.7
40.1
37. g 34.4 3(1. 2 44.0
40.1 39.9 39.5
89.87 97.75
103.32
78. 9G 71l. 30 72.40 91.27
116.60
127.10
2~3. ~ I lb9. b 110.7
~~o. Ii 2. 7
41.1 2.8
41. 5
41.1 41.4 40.2 41.6 41.4
41.0 41.5 41.6 40.5
40.9 41.7 40.5 39.5 40.7 40.3
39.7 2. 6
40.8 40.4 39.2 40.5
38.8 40.4 41.0 38.7
3fl. 6 42.9 44.0 38. I
41.6 41. ,5 41.0 40.8 42.1 37.6
40.8 41.1 31.3 3(). 7
40.3 44.3
37.4 40.6 3(\. 4
43.2 3S. 8 40.5
40.3
37.9 34.2 3\i. 2 43.9
40.1 40.4 40.2
90.32 98.fH
105.83
80.56 78.66 72.76 91.94
117. 58
127. 10
210.0 I li4. 41 115.4
40.7 2. 9
41.4 3. 0
41.2
41.3 41.6 40.8 41.7 41.7
41.6 41.9 41.9 40.8
41.0 41.5 40.9 39.2 41.2 40.5
39.8 2. 7
41.0 40.6 39.3 40.7
39.3 40.8 41.3 39.2
36.7 43.0 44.1 38.1
41.5 41.6 40.9 40.4 40.3 38.2
41.6 41.3 30.2 38.8
40.2 45.2
38.0 42.1 3(i.8
43. fi 3\1.0 41.0
40.5
38.3 34.8 36.8 44.1
40.1 40.1 39.7
91.17 99.31\
105.47
82.19 80.70 74.66 92.16
118.43
12R38
I
244.41 170.2 '
106.51
40.2 2. 7
40.5 2. 7
41.2
40.5 41.0 40.8 41.5 38.5
35.9 41.0 41.3 40.1
40.8 41.3 40.6 39.2 41. 1 40.0
39.8 2. 8
40.9 41.0 38.9 40.7
40. 1 40.4 41.1 38.6
36.8 43.0 44.4 38.2
41.1 41. 1 41. 1 40.6 42.5 38.3
39.2 36.1
32.5
41.6 45.1
37.6 42. I
i
3(i. 31 43. 2 39.4 ' 41. 1 I 40.6
38.8 35.3 37.4 44.0
40.2 a9. 5 37.9
89.65 116.80
105. 06
80.19 79. I3 74.66 92.13
108. 19
111.29
2.17. 7 164. () 98. 4
40.5 2. 9
'10. 8 3. 0
40.7
41.1 41.3 41.7 41. (j 39.7
36. (l 41.6 41. 1 40.5
40.2 40.2 40. (i 39.0 41.0 40.4
40. 1 2. 9
41.4 40.8 41.9 40.2
40.7 40.8 41.6 39.4
37.4 43.1 44.1 38.3
41.2 41. I 40. (j
39.9 42.3 37.8
41.2 ' 39.4 27.9 36. 7
40.9 45.4
38.3 43.0 36.9
43. 1 39.2 40.9
40.5
38.6 3.1. 3 37.1 43.9
40.6 39.6 37.7
88.70 9:;. 88
IO:J. 38
82.61 80.95 76. 3I 92.35
104.81
113. 09
242.9 lfi9. I 94.3
40.3 3.0
40.8 3.0
41.1
40.7 40.7 41.3 41.0 40.0
38.3 41.7 41. 1 40.7
40.0 40.1 40.4 38.4 41.0 40.5
39.8 3.0
41.4 4.3.1 39.2 40.G
40.9 39.8 40.3 38.3
36.4 43.2 44.3 38.8
42.3 42.6 41.5 41.1 41.3 36.7
40.7 40.2 31.9 35.2
41.1 44.6
36.6 39.5 35.8
42.3 40.fl 41.3
40.5
38.1 34.4 3fi. 7 43.7
40.3 39.8 38.8
89.47 96.70
105.22
82.62 79.77 75. 58 91.43
106.40
118.73
239.1 1fi.). 9 95.9
40.3 2. 8
40.9 2.8
41.3
40.8 40.7 41.8 41.2 39.9
38.0 41.0 41.2 40.8
40.6 41.1 40.7 38.3 41. I 40.7
39.5 2. 8
40.8 4.3.3 38.0 40.2
40.2 40. 5 41.5 38.7
36.2 42.9 '13. 9 38.4
41.6 41.4 40.8 40.2 40.8 3H. 2
41. 1 40. 4 30.0 37.9
40.4 44.3
37.0 40.6 36.0
42.6 ;w. 9 41.3
40.5
37.7 34.0 35. \) 44.0
40.5 39.8 40.0
89.06 96.52
106. 55
82.42 79.37 76.49 91.88
'221. 8 T Hi0.8 '104. 4
39.9 2.(i
40. 1 2. [)
-11.3
'10.1 '40.3 '41. 1 '40.8 '38.8
T 37.7 ·10. l
'40. 8 r 40.5
39.2 ':l8.2 '40.6
38.5 -11.0
'40. 4
39.6 2. 7
41.0 43.3
'36. 9 40.1
'38. 2 '40. 5 '41. 5 '38. 9
'36. 7 42.7
'H.O 38.3
41.7 '41.6 '41.0 '41. 2 r 3H. 7 r 37.3
213. ;) r 17.1. a
110.5
40.5 '2. 7
'41. 1 2. R
'41. 9
41.9 '40. 9 '40. g
'41.4 '41. 7 '41.0
'41.2 '40. 5
39.8 2. 7
'41. 1
p 175.4
p 40.4 p 2. 8
p 41.2 p 3. 0
p 41.4
p 39. ()
p 41.4 p 40.4 p 40.7
p 41.5 p 41.5 p 40.9
p 42.8
p 41. 1 p 40. 1
p 39.3 p 2.6
p 40. (i
'39. 5 p 38.0 40.9 p 40.3
36.4 •36.1 '42. 6 p 42. 1
38. (1 p 38.5
'41. 8 p 41.4
'40. 3 p 39.9
'40. 8 p 40.5 r37.H P37.fi
, 40., I ____________ _ '41. 71 ______ -- -----' 34.0 ------ -- ---' 3o. s ,------ _____ _
' 41.2 1--------
r 4~~- 2 ___ . _. _
r 35.7 j _____________ _
38.? --------- - ---34.8 ----- -- -----
'42. 8 ---- --- -----r 40.7 ------- ____ _ '41. 3 !------ -----
1 -10. 41 _____ ---- ---
~~j [:::: __ ::::: r 4:3.7 j_____ _ __ _
21 40
1
, ______ _ ___ _
3!1. 3 --- ---- ---' 39.1 --------- ---
88.98 95.44
'106. 97
'80. 60 '78.18 '75. 2I '91.39
'91. 94 '99. 87
'109. :l6
r 79. iH
r 77.52 r 91. tl2
n nz. 52 p 100. 94 "108. 05
p 7S. 01
p 76.59 p 91.30
105. 74 ' 107. 8() ' 116. 57 p 116.00
uo. 56 ' 113. 10
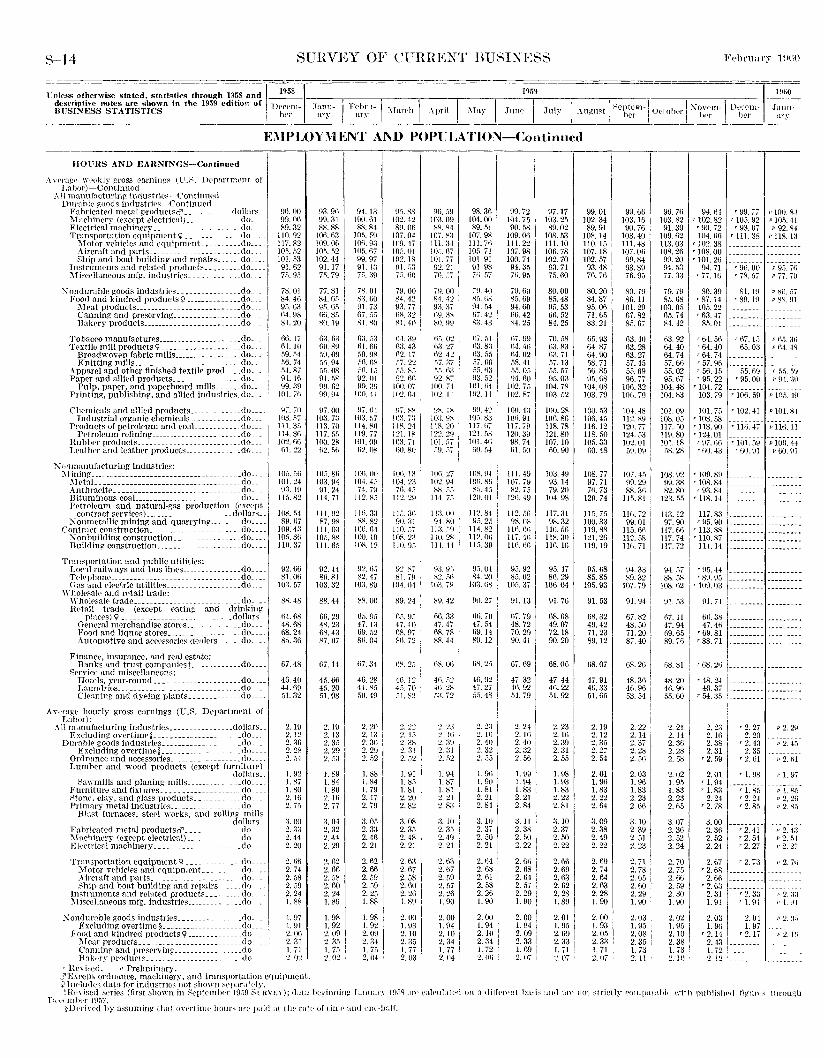
S-14 SUHVEY OF CFRHR~T HU~IXESS Feb rna ry 1\ lHO
t'n.lcss ~therwise stated, statistics through 1958 and ~~~ l!IS!I II%O . des<"riptiv~ notes are shown in the 1959 edition of . l>f'C"t'Ill- Jann- ,, F(~l)rtt-1 '. [·•J·"ll I I 1 I 1-::.E' t' ) I:\: J D . -~ BUSINESS STATISTICS !'· h• ... ,· ·' , , .\pril .\fay .J11n<' I July Angn~t ' Pun- Octoher · ovem- J•r·rm- ami· n.ry ury < hc·r l hf'r her ary
------------~-----~--~----~--~----~---~----~--~----~---
K\IPLOYMENT AND POPULATION-Continued
HOURS AND EARNIN£;S-Continued I :\ ....-cragi• WPt•kly gross earnin!Jf' (U.~. Depnrtuwnt of
J,ahor)-Continued 1 ..\ 11 manufacturing industrip::;-Contitnwtl
Durahlt' goods industriP~-Continued I Fahrieated metal product so'.. dolh1rs. l\Tuchincry (excrpt t"'lectrical)_______ do __ Electrical machinery.... .. . .. do Transportation equipnwnt? _______ __do
:\fotor vehicles and c>quipmpnt..... ..do Aircraft and parts.. . .. . .. do. Ship and boat build in~ and n'pa!rs .... do.
Instruments and rel:lted products.... .. .do .. :\fiscc•llaneous mfg. industries.... .. . ..do
:\'ondurable goods Industries ............... do Food and kindred products\! .............. do.
Meat products ............................ do. Canning and preserving ................. do Bakery products ......................... do
Tobacco manufactures ...................... do .. . Textile mill products 9 .................... do .. .
Broadwoven fabric mllls ................. do .. Knitting mills ............................. do ...
Apparel and other finished textile prod .... do .. Paper and allied products ..................... do .. .
Pulp, paper, and paperboard mllls ...... do .. Printing, publishing:, and allied lndustries.do.
Chemicals and allied products..... .do .. . Industrial organic chemicals.. ........... do .. .
Products of petroleum and coaL .......... do ... Petroleum refining ....................... do ... .
Hubbrr products .......................... do ... Lcatt1rr and leather products.... .do ...
~ (,nmanufacturing industries: :\I ining _______ --------------------- ________ ._do __ _
'\IctaL .................................... do ..
ri~;i';,~~fJ:i; ·coal.~~:::::::::::· ··::·--····--~Z::: -I Petroleum and natural-gas production (rxrPpt
contract service~).. ........ .. .. ..... dollars .. :\ onmetallic mining and quarrying ....... do .. ..
Contract construction.. .. .. ... . ... do .. .. :\on building construction... ....... .. .do .. .. Building construction...... .. .do .. .
Tramportation and public utilities: Local railways and bus lines ................. do .. .. Telephone ................................ .do .. .. Gas and electric utilltl~s... .. .......... do .. ..
"'lwle~alr and retail trade: Wholesale trade .......................... do .. .. Retail trade (except eating and drinking
places)\! ........................... dollars. Grnera.l merchandise stores___ __do __ _ }'ood and liquor stores. ..... .. . .. do .. .. Automotive and aecessorles d~alcrs ..... do ... .
Finane(', insurance, and real estate; Banks and trust companiest ............. do .. ..
SrrvicP and miscellaneous: Hotels, year-round ........................ do ... . LaunflriPs_, , ___________ -------------··-.do .. __ Cleaning and dyeing plants ............. do ..... .
Awr:.ge hourly gross earnings (U.S. Department of Labor):
All manufacturing Industries ............... dollars .. Exrluding ovcrtimC'§_________________ _do
Durahle goods industril'S............... .do ... Excluding overtime§_____________ _ _do_
Ordnnncc and accessories __________________ do._. Lum her and wood products (except furniture l
dollars .. Sawmills and planing mills..... .do ....
Furniture and fixturl's............ do ... ~ton(•, clay, and g-lass products _________ .do __ _ Primary mt?tal industries_____ _ ___ do_
Blast furnaces, strcl works, and rolling mills
F,tbrieatrd metal productso' ... .. :\farhin,•ry (excl'pt electrical) ... .. Electrical machinery .....
dollars .. ..... do. ..... do ..
.do.
Transportation equipment\! .. .. . ...... do. :\!otor Vl'hiclcs and cquipllll'HL ......... do. .~ircraft and parts ........................ do. Ship and hoat building and repairs ..... do
In~trumrnts and related products ________ "do \fiscellaneous mfg. industries ............... do
:\on<lurahle p;oods industri~s ............... do. Exrluding overtime§ ................... do ...
Food and kindred products? .............. do. l\fc,ttproducts ....................... do. Canning and prrsl'rving ............... do .. RakPry products_________ _ do_
r R('\·ised. P Preliminary .
913.00 !J9.01i 89.32
110.92 117.82 IO'i. f<2 101. ,,;; 91.62 75. !).i
78. OJ 84.46 98. (j:J 64.98 81.20
66. 17 61.10 59. ·'1 .\6. 74 .S4. R7 91. 1(\ \19.:19
101. iii
~i. 70 103 .. '7 11I.:J;, 111. So 102. flO 61.22
1():,. :t; 101.24 (l:J.19
118.82
108. 54 89. (\7
109. 4:J 10.1. 3() l 10. 87
92. {)6 81.06
IO:J. 57
88.48
fi-t. f>8 48.68 68.24 88.36
67.48
46.40 44.69 51.32
2. 19 2.12 2. 36 2. 28 2 . .14
l. 92 l. 87 1. 80 2. 16 2. 7fi
a. oo 2. 3::! 2. 44 2. 20
2. t\6 2. 74 2. 58 2. 59 2. 24 l. 88
I. 97 1. 91 2. O(j 2. 31 I. 71 2. 0:.?
. ~E\cept ordnance, machinery, and transportation equipment. Q Includes data for indnstrit•s not shown sppnr<.ltPly.
93. 9fi \19.31 88.88
IO(i. 63 109. or, lO.S. f{! 102. 44 nl.17 7fl. 79
77.81 g!, 6fi fl.ti.6fi fifi. Rii ~0. 19
tia. na t\0. 89 .~n. 09 [).l. 94 M'). OR 91. !i~ 99. fo2 99.94
97.00 lll3.7:l 113.70 117. [i[)
100. 2R f\2. fl6
lO!i. sn 103. 94 91.24
114. 71
111.!12 87.98
lli.O:J 105. &~ 111. 6:i
92.44 80.81
103.32
88.44
Gti. 29 48.26 68. 4::! 87. 07
67. 14
45.66 4.5. 20 !\1.98
2.19 2.13 2. 3Ii 2. 29 2. f'i3
l. 89 I. 84 1. 80 2. 1fl 2. 77
3. 04 2. 32 2. 44 2. 20
2.(i2 2. 66 2. 58 2.60 2. 24 1.89
1. 98 l. 92 2. 09 2. 3.l l. 75 :!. 0::!
94. 13 100. fll
RR. 81 IllS .. \9 !Of\. 9:l 10.~. 67 9R 97 91. 13 7:'. 39
7R. 01 ~3. (\0 91. 73 07. !i.i ~I. ~0
G:J. f:3 61. fi{i !\9. 9R tH. fl~ ['(\,].)
92.01 99. :1!1
100.44
01. tH 10:3. fii 111. ~n 119.77 101.09 f\2.0~
l(lli.l\(1 10·1. 4:, 74. 79 I
112.1i'•
! lfi. ~;~ ss. 82
!Of>. 64 HHI. HI lOX. I?
H:!. g,-, 82. 47
100.89
88.00
6.5. U;) 47. I:J 69. ,\2 8fi. 04
67.34
46.28 44. R:i fiO. 49
'2. 20 2. 1:1 ?. 31\ 2. 29 2. 02
1.88 1. 84 l. 79 2.17 2. 79
3. 05 2. 33 2.46 2. 21
2. 62 2. 66 2. 59 2. 59 2. 25 1. 88
l. 98 l. 92 2.09 2. 34 I. 75 2. 04
9.'1. 8~ 102.42 8\1.06
107. 04 109. 47 ](1:>.01 102. 18 91. f;3 7:J. no 7\1.00 84.42 93.77 ns. :lz Sl. 41'
lit. ::!91 G:J. 43 ()2, 17 .~7. 22 .'i.">. S:)
\J:!.fifi 100.07 IO:!.f\.1
\Ji. XH 10:1. 7:; 118. 24 121. 18 lO:J. 74
GO. 80
IUfi. l:l 104. 2:l 76. 4:i
112.29
11~. :lti 90. :ll
110. tl7 ws.n 110. u.-)
9:! ~7 81. 79
10·1.0·1
89.24
OFi. 9:i -17.40 OS. 97 81\. 72
tiS. 2.1
4G. 12 4;). 70 .11. 82
2. :!~ 2. t.~)
2. :Js 2. 31 2. 52
I. 91 I. Sfi 1.81 2. 20 2. 82
:J. 08 2.3!1 2. 48 2. 21
2. o:l 2. 67 2. 58 2. 60 2. 2!\ 1. 89
2. 00 l. 93 2.10 2. 35 l. 77 2. 03
9H, ;itl 103.09 88.84
107. s:; 111. 34 Jll:"). H7 101. 77 92. 21 7G .. -~7
7~. 00 B4. 42 9:l. :J7 n9. as XO. 99
w,.o2 o:t 27 62.42 .:'i7. :~7 :i;"'J.Iia ~2. R7
1110. 74 10:!.11
H.'"\. t.-... IO:l. 9~ 11~. 20 122. 2\J 101. fi7
;,g_ ':!/
ltlli. 27 102. 94 88. ""
11-L 7:1
ll:l.llll 94.80
u:;. ~9 11U. 2~ 111.41
ua. H.~, H2. fili
Jtl:), 7~l
S9. 42
66.33 47.47 68.78 88.H
tiS. Oil
4il. r.:z !H. :?X f'l::1. 7'2
I. 94 1. 87 1.81 2. 21 2. So
3.10 2. 33 2. 49 2. 21
2. 63 2. 67 2. [19 I 2. f)7 2. 26 1.90
2. 00 1. 94 '
U~l 1. 77 i 2.114 .
~~~: ~g I 89. 51
107.98 111.711 105. 71 101.91 Ill. 98 71i. 07
7~1. 40 .S.~. fiX 94 .. '\4 Iii. 42 s:;. 43
Iii. 51 fi:J. 83 li3. 55 t17. {i() 05. f)3 93. 52
101.ii4 1112. II
!Jn . .t'.? 10;'>. 83 117. f)j
121. ,\H llll. 41; lill. ,Oj
108. U4 lO!i. XH
.S!l. 4:) 1211.01
112.84 9.o. 2ii
114.82 ll2.0ti Jl!), 39
9!i. 04 84.20
1()3. (i8
90. 27 ~
ti~i. 70 47. 54 li9. 14 89.12
40.92 47. '27 .i.i. 4S
2. 2:l :2.l(i 2. 41) 2. 32 2. 55
1. 91i 1. 90 1.81 2. 21 2. 84
3.10 2. 37 2. 50 2. 21
2.1i4 2. 68 2.1il 2. 58 2. 21l I. 90
2. 00 1. 94 2.10 2.34 I. 72 :2.0ti
99.72 104.75 90.58
109. OG 111. 22 107.98 100. 74 94. 3.o 7fi. 95
79. 6() 85.69 94.60 1\6.42 84.25
ti/.\;)9 114. 41) li4. 02 58.41 fi.l. 05 94.1\()
102. j[)
102. ~i
1011. 4:l JO!i. 91 117. 79 120. ::!9 98.74 Iii. 50
Ill. 49 107. 79 82. 75
l21i. 49
112. 51) 98. OS
1Hi.(ili lli. 4ti 110. t)()
95. 92 85.02
!05. 37
91.13
07. 79 48.72 70.29 90.41
()7. 69
47.32 4ti. H2 54. 70
2. 24 2.W 2. 40 2. 32 2. 51i
1. 99 1. 94 1. 83 2. 21 2. 84
3. II 2. ::!8 2. 50 z. 22
2. 6G 2. 68 2. t\4 2. 57 2. 29 I. 90
2. 00 I. 94 2.09 2. 33 I. (i9 2. 07
97.17 103.25 89.02
108. 53 111.10 106. 78 102.70 93.71 75.60
80.00 8.1. 48 \15. 53 6fi. 52 84. 2.1
70.58 ll3.8:J 1\3.71 57. 13 55.57 95.03
104. 78 HI:J. 52
lOll. 28 106.8fi 118.78 121.80 107. 10 60.90
IO:J. 49 93. 14 7\1.211
104. 98
117.31 \18.32
I IIi. 51\ 118.30 llfi. Hi
95.47 sn. 29
106.04
91. 7ll
68.68 49.07 72.18 90.20
68.06
47.44 46.22 51.92
2. 23 2.10 2.39 2. 31 2. 55
1.98 I. 93 1.83 2. 22 2. 81
3.10 2. 37 2. 50 2. 22
2.66 2.fi9 2. 63 2. 62 2. 28 1.89
2.01 1. 95 2. 09 2. 33 I. 71 2. 07
99.01 102.34 89.91
108.14 ll0.15 107.18 102. ,)7 93.48 711.70
80.20 84.87 95. Oli 71.65 83.21
65.93 64.87 04.90 08.71 56.85 9o.li8
104.08 103. 79
100 .. \3 106.45 llfl. 12 118. 50 10.\. 33
GO. 48
108.77 97.71 70.73
120.74
11:i. 7.1 lOll. 33 119.88 121.26 119.19
95.68 85.85
105.93
91. .53
68.32 49.42 71.23 89.12
ll8. 07
47.91 4G. 33 51.65
2.19 2.12 2. 35 2. 27 2. 54
2.01 1. 96 I. 83 2. 22 2.li4
:;.09 2. 38 2. 49 2. 22
2. 69 2. 74 2. 64 2. fi3 2.28 I. 90
2. 00 I. 93 2. 05 2. 33 1.71 2.117
99.66 103.16 90.76
108. 40 Ill. 48 107.06 99.84 93.89 76.95
80. 79 86. 11
101.29 67.82 85.67
63.40 63.28 63.27 57.45 55.69 96.77
106.32 10fi. 70
104. 48 112. x9 120. 77 124. 1\3 102.01
5P. 09
107. -t;i 99.29 88. 31i
115.81
lHi. 72 99.01
115. on 112.58 111). 71
!14. 33 89.32
107.79 I
91.94
67.82 48.50 71.20 87.40
68.21\
48. 31i 4G. 96 53.54
2. 22 2. 14 2. 37 2. 28 2. 5()
2.ll3 I. 96 1.83 2. 23 2. 60
3.10 2. 39 2. 51 2. 23
I
2. 71 2. 78 2.65 2. 60 2. 29 ' I. 90 .
2. 03 . I. 95 : 2.08 ; 2.35 : 1.73 2. ll
9fi. 70 103.82 91.39
109.62 113. O:J lOS. 2fJ 99.20 94 .• 13 i7. 3~
79. 79 85. fj8
103. 0.1 0.5. 74 ~4. 42
o3. 92 !)4. 40 64.74 57.66 55.02 95.67
104.48 104. ~3
101.09 108.05 117. ,\0 119.80 101.18 .)~. 28
108. 92 99.38 82.80
123. 55
113. 12 97.90
117. f)fi 117. 74 117. 72
94 .. ')7 88. 5H
108. r,2
91. ;i:J
tl7. II 47.94 69.65 89. 'j'{j
G8. 81
48.20 46. 91i 55.60
2. 21 2.14 2.3H 2. 28 2. 58
2. 02 I. 9.5 I. 83 2. z:J 2. 05
3. 07 2.36 2. 52 2. 24
2. 70 2. 75 2. 66 2. 59 2. 30 I. 90
2. 02 I. 9.51 2.10 2.~8 i I. 13 : ~. 10
9·!. fi4 ' 99. 77 ,, 100. 8·1
'.1Z6: ~§ i '}~~: ~~ '}~~ ~! 104. Gr. '111. :Js '118. 13
'102. 38 ................. . 'lllS.OO ................. . '!01. 21l
94. 71 '96. 00 p 95. 71) r 77. lfi
80.39 ! '87. 74 105.22 '63. 47
85.01
r 64. 56 '64. 40 '64. 74 r 57. n6 '56.15 '9fi. 22
'104. 72 103.79
r 78. !)"; P Ti. i\1
81.19 I- ~ll. [jj '89.19 p 88. !Jl
r 67. l.i P fl5. ;{li 65. O:J '64. 48
.15. fi!J P bfl. 5H '95. oo '94. :ln
r 106. 59 " In5. 4H
101. 7f< '102. 41 p 101. 8·1 'lOS. 58 ' 118. 90 ' 116. 47 p 11fl. 11 '124.01 ' 97. li61 ' 101. 59 p 100. 44 , no. 4:J , t.io. 01 ,, 60. 91
j~: ~1 H~~:~:~ -~~~~~~:~ 117.83
r ~)5. 90 ' 113. 88 r 110. ~7
1H.1·1
'95. 44 '89. 95
'109.03
HI. 71
t)fi.38 47.4ti
• 69.81 r 88. il
I I I
1::::::::: ::==:::=:
;
!:~~~~~~~~ ~~~~~~~~~ i
r 68. 2t) i------~-- ----·---~ '48. 24 f .................. .
46.37 1 ................. .
r 54.a5 i _________ ---------
2. 23 2.lfi 2.38 2.31
r 2. 59
2.01 'I. 94 '1. 83
2. 24 '2. 78
3.00 2.36 2. ,)2 2. 24
2.67 '2.68
2.66 '2. 6:l
2. 31 1. 91
2.03 1.9fi
'2.14 2.43 1.72 2. 1~
r 2. 27 2.20
'2.43 2. 35
'2. 61
r 1. 85 '2. 24 r 2. 85
'2. 41 '2. 54 r 2. 27
r 2. ia
'2. 33 r 1. 9-l:
2. 04 I. 97
'2.17
p 2. 2~J
p 2. 4.5
, 2.n1
I• 1. 97
PJ.N 11 2. 2H p 2. ~.)
p 2. 43 P2.M p 2. 2i
p 2. it}
1'',!,:);{
p 1. \Jl
/) :2. ().)
J! 2.19
~HI'Yiscd srri<'S (first shown in Septemh('r 19tl9 SrRYEY); dilta bc~_.dnning Lwuary Hl.iR Jn' caleulatt•d on ;t di!Tt·r~·nl ba.-:is ~1.nd arP not strktly r>fmip:lLthh• with puhlislwd fil!nr••-: through Dct·!·Inht•r 1957.
§IJNiY('(l. by assuming thnt ovt•rtimt· hour::' arl' paid at the ratl· of tiiiH' ;tnd um•-lwlf.
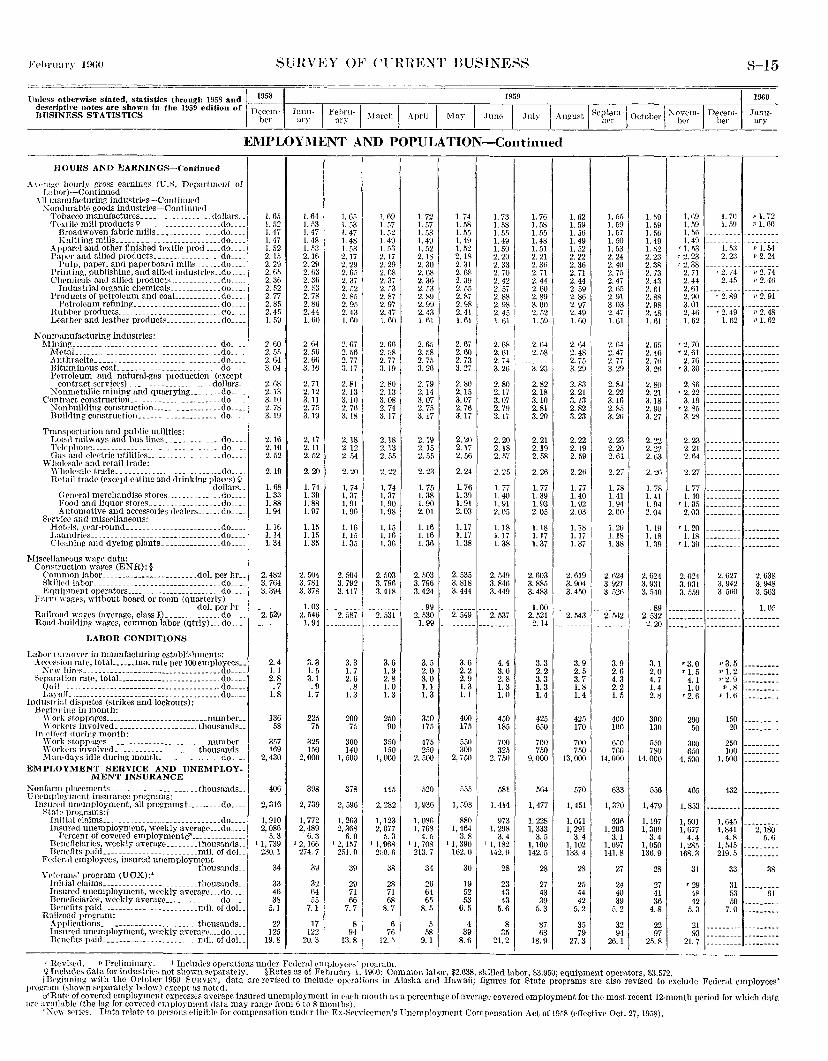
SUHVEY OF <Tinm~T BUSINESS S-15
~!uless otherwise stated, statistics through 1958 and 1 __ _19~~ --~,----,----,---,------,---,----19,5_9 ___ ,----,----,---,-----,,-----1 descripti"e notes are shown in the 1959 edition of nccem~ .Tanu- I Fehru-1 'l•trclt I I I I ,. •\tJrrust I Septem-j Oc•tol>ei·\ ~·ovem-J Decem-BUSINESS STATISTICS . b~1• " , • April May June July - ~ l>"I' . b"J' bel' ..._ ary nrr
1 ,- '--
1960
January
EMPLOYMENT AND POPULATION-Continued
HOURS AND EARNINGS-Continued
..:\ \-~·r;!g(• 1lour1y ~ross earnings (U .. -..:. DE'pnrtmpnt of T.abor)-Continucd
.\ll manufacturing indu:;:trif's-Continuf'd S ondurable goods industries-Continued
Tobacco manufactures__________ dollars_ Tt•xtile mill products\'. .. .. do ___ __
Broadwoven fabric mills ___________ .... do. ___ Knitting mills. _________________________ do. __ _
Apparel and other finished textile prod ____ do. ___ l'arwr and allied products ____________ do __ __
J'ulp, paper, and paperboard mllls _____ do .... Printing, publish in~. and allied industries .. do __ __ Chemicals and allied products _____________ do.
Industrial organic chemicals ___________ .. do. __ Products of petroleum and coaL ____________ do ...
Petroleum refinin~r. _____________________ do Hub her products __________________________ do __ _ Leather and leather products ______________ do ___ _
N onrnanufacturing industries:
M~;-;;E~~~ii~~=====:::::::::=: ::::::::::: ::Jg: :::I ~:.~~~l~~:sa'ii'J'n.aiiii-a!:ias- i>J.<><Iliciiofi --<e~~el>t.l
contract services) _________________ ._ ... dollars .. :t\'onmetallic rninin~ and quarryln~--- _ ... do ___ _
Contract construction ________ ----------------- do ___ _ :Jonhni1ding com:;trnetion _______ ----------dO----~ Building constrnction _____________________ do _
'l'ransportation and public utllltles: Local railways and bus lines ______________ do .... 1't·l<·phone __________________________________ do .. --Gas and electric utilities ____________________ do ___ _
WhoiPsale and retail trade: '\'JIOIPsaletrade ___________________________ do __ __ Hl't:lil trade (except catilw and drink!ng places) I'
dollar,< __ Grw\rnl merchandise ::-tores ____________ .do ___ _ Food and liquor stores_ ___ .. ____________ do __ _ Automotive and accessories dealers ______ do __ __
Sen-icc and miser llaneous: Hotels, yPar-round _________________________ do __ __ 1.aundrit>s _________________________________ do ___ _ Cleaning :md dy!'lng plants. _______________ do ....
Miscellmwous wage data: Comtmction wages (ENR): §
1.6.1 1. 52 ]. 47 ]. 47 ]. 52 2. 1.1 2. 2U 2. 65 2. 36 2. 52 2. 77 2. 85 2. 4!i ]. .19
2. 60 2. 5.~ 2. 64 3. 04
2. 68 2.13 3.10 2. 78 3.19
2.16 2.10 2. 52
2.19
1. 68 !. 33 1.88 1. 94
1.16 1.14 1. 34
Common labor_ ____________________ ... dol. per hr.. 2. 482 Rkilkdlnbor ________________________________ do____ 3. 764 Equipml'nt operators _________________________ do ___ 3. 394
Farm wa~es, without board or room (quarterly) dol. per hr .. ------
Railroad wages (average, class I) ______________ c\o____ 2. 529 Hoad-buildin~ wa!(es, common labor (qtrly) __ .do ___ _
LABOR CONDITIONS
Labor turnovt~r in manufacturiug estnblislunents: .-\ecPseion rate, totaL ..... mo. rate per 100 employees __
.?\t'\\' hires. ___ .. _------------------- __________ do ___ _ 8L'JnLrat1on rate, totaL---------------------- ___ do ___ _
Quit ____________ ------------------------ .. do __ __ Layolf ______ .. __ ----------------------- ______ do ....
Industrial disputes (strikes and lockouts): Bt·~inning in month:
Work stoppages _________ -------- _______ .. num her __ Workers involved.-------------------- thousands __
In df(•c·t during month: "' ork ~toppages _______ ----------- _______ number __ W ork<'rs involved. ____________________ thousands._ Man-days idle during rnonth ________________ do __ __
EMPLOYMENT SERVICE AND UNEMPLOYMENT INSURANCE
Konfarrn placements __________ ---------- __ thousands .. lJnC'mployment insurance progran1s:
Insmwl unemployment, all programst _________ do __ __ ~tatP programs:t
I nit i:tl claims ____________ ---·· __ ._. ______ .. .do __ __ Insureclunempioyment, weekly averagc ... do ___ __
PPrcent of covered employmentc?' ____________ __ Bt•neficiarip,s, weekly average ________ thousa.nrls. _ Benefits paid _________________________ mil. of' doL
Federal employees, insured unemployment thousands._
\'l'l<'nms' program (UCX):* Initial claims ________________________ t!wus~nds .. Insured unemployment, weekly avemge ___ do __ __ Beneficiaries, weekly averag(' ______________ do ___ _ Benefits paid ________________________ mil. of cloL.
Hailroad program: Applications ___ ------------- ________ thousands._ Insured unemployment, weekly averagP_. __ do ___ _ Benefits paid ______________________ mil. of doL.
2.4 1.1 2.8 .7
1.8
136 58
357 169
2,430
406
2, 316
1,910 2,086
5. 3 I I, 739
z:l0.1
34
33 46 38
5.1
22 125
19.8
!. 64 l. !)3 1.47 1. 48 1. !i3 2.16 2. 29 2. 63 2. 36 2. c3 2. 78 2. 86 2.44 1.60
2. 64 2. 56 2. 66 3.16
2. 71 2. 12 3.11 2. 7:-l 3.19
2.17 2.11 2. 52
2. 20
!. 74 1. 39 1. 88 1. 97
1. 15 1. 1.1 ]. 3,1
2. 504 3. 781 3. 378
]. 03 2. 546
1. 94
3.3 1.5 3.1 . 9
1.7
22.1 75
325 150
2,000
398
2, 739
I, 772 2.489
6. 3 l 2,16(i
274.7
39
32 64 55
7.1
17 122
20.3
1.6c 1. 53 1. 47 I. 48 I. 6:l 2.17 2. 29 2. Gri 2. :l7 2. 52 2.8!i 2.9f> 2.4:! J. r.o
2. fl7 2 .. 16 2. 77 3. 17
2. 81 2.13 3.10 2. 76 3.18
2.18 2.12 2. !)4
2. 20
I. 74 1. 37 I. 91 1.96
1.16 l.l!i I. 35
2. 504 3. 792 3. 417
2. 587
3. 3 1. 7 2. 6 .8
1.3
200 75
300 140
I, 500
378
2, 596
I, 263 2,368
6.0 I 2, 157
2.11. 0
39
29 71 66
7. 7
8 94
!3.8
I. 69 I. 57 I. 52 I. 49 1. ,c3 2. 17 2. 29 2. 68 2. 37 2 . .'3 2. 87 2. 97 2.47 1. 60
2. 6(;
2. 58 2. 77 H. 19
2. 80 2.13 3. 08 2. 74 3. 17
2.18 2.13 2. 5.1
2. 22
I. 74 I. 37 1.90 1. 98
1.15 1.16 I. 36
2. 503 3. 796 3. 418
2. 531
3.6 1.9 2.8 1.0 1.3
250 90
350 150
1,000
445
2,282
1,123 2, 077
5. 3 I J,9f>8
2ro. o
38
28 71 68
8. 7
6 76
12.5 I
r Hevis(·d. P Preliminary. l Iucludt•s opt•rutions UlHll·r Fe<lerul muployet·s· program.
I. 72 I. 57 I. ii3 1.49 1. f>2 2.18 2. 30 2. 68 2.36 2. f3 2. 89 2. 99 2.43 ], 61
2.6:i 2. 58 2. 7.1 3. 26
2. 79 2.14 3. 07 2. 7!i 3.17
2.19 2.15 2. 55
2. 23
1. 75 1.38 1.90 2. 01
1.16 !.If> 1.36
2. 503 3. 796 3.424
. 99 2. 530 I. 99
3. 5 2.0 3.0 1.1 1.3
350 175
475 250
2, 500
.120
1, 936
1,086 I, 768
4 .• I l 1, 708
213.7
34
26 64 65
8. 5
5 58
9.1
I. 74 I. 58 I. 55 I. 4\l I. 52 2.18 2. 31 2. 68 2. 39 2. 55 2. 87 2.98 2. 41 I. 61
2. 67 2. 60 2. 73 3. 27
2.80 2.15 3.07 2. 76 3.17
2.20 2.17 2. 56
2. 24
1. 76 1. 39 I. 91 2.03
1.17 1.17 1.38
1. 73 I. 58 1.51i 1. 49 I. 50 2. 20 2. sa 2. 70 2. 42 2. 57 2. 88 2.98 2. 45 1.61
2. 6~ 2.61 2. 74 3. 26
2. 80 2.17 3.07 2. 7\1 3.17
2.20 2.18 2. 57
2. 25
1. 77 1.40 1.91 2.05
1.18 1.17 1.38
2. 535 2. 549 3. 818 3. 846 3. 444 3. 449
2. 549 2. 537
3.6 2.2 2.9 1.3 1.1
400 175
550 300
2. 750
1, 593
880 1,464
3. 8 I I, 390
162.0
30
19 52 53
6. 5
4 39
8.6
4.4 3.0 2.8 1.3 1.0
450 185
700 325
2. 750
581
I, 414
973 I. 298
3. 4 l 1.182
142.\1
28
23 43 43
5.6
8 35
21.2
1. 76 I. 58 I. 55 1. 48 1. 51 2. 21 2.36 2.71 2. 44 2.60 2. 89 3. 00 2. 52 1. 59
2.\i4 2. 58
a. 23
2.82 2.18 3.10 2.81 3. 20
2. 21 2.19 2. 58
2.26
1.77 1.39 1. 93 2.05
1.18 1.17 1.37
2. 603 3. 885 3. 483
1.00 2. 521 2.14
3.3 2.2 3.3 1.3 1.4
425 650
700 750
\1,000
564
I, 477
I. 228 1, 333
3. 5 1,100 142.5
28
27 43 39
5. 3
87 (i3
18.9
1. 62 I. 59 I. 56 I. 49 1.52 2. 22 2.36 2. 71 2. 44 2. 59 2. 86 2. 97 2. 49 1. 60
2.64 2. 48 2. 75 3. 29
2. 83 2.21 3.13 2. 82 3.23
2. 22 2.19 2. 59
2.2ti
I. 77 1.40 I. 92 2. 03
1.18 1.!7 1.37
I. 55 I. 59 I. 57 1. 50 !. 53 2. 24 2. 40 2. 7.1 2.47 2.65 2. 91 3.03 2. 47 1. 61
2.(\4 2. 47 2. 77 3. 29
2.84 2. 22 3.1G 2.85 3.2(i
2. 23 2. 20 2. 61
2. 21 !
I. 78 I. 41 I. 94 2.00
I. 20 1.18 1.38
2. 619 2. 624 3. 904 3. 921 3. 450 3. 52ti
3.9 2.5 3. 7 1.8 1.4
425 170
700 7.50
13,000
570
I, 451
I, 011 I, 291
3.4 1,102 133.4
28
25 44 42
5. 2
351 79 27.3
2. 542
-----,
3. 9 2.6 4.3 2.2 1.5
400 100
650 7HO
14,000
633
1,370
936 1, 203
3.1 I, 097 141.8
27
24 40 39
5. 2
32 94
26.1
I. 59 I. 59 I. ,\6 I. 49 1..52 2. 23 2. 38 2. 73 2. 43 2. 61 2. 8R 2. 98 2. 48 1.61
2. 65 2. 46 2. 7{) 3. 2ti
2. 80 2. 21 3.18 2. 90 3. 27
2.22 2. 22 2. 63
2. 26
I. 78 1.41 I. 94 2.04
1.19 I. 18 I. 39
2.624 3. 931 3 .. 140
.89 2. 532
'2. 20
3.1 2.0 4. 7 1.4 2.8
300 130
550 780
14,000
556
1,479
1,197 1, 309
3.4 I, 050 136.9
28
27 41 36
4.8
22 97
2.1.8
1.69 I. 59 1. 56 I. 49
r 1.!;3 '2. 23 '2.38
2. 71 2.44 2.61 2. 90 3.01 2.46 I. 62
'2. 70 '2. 61
2. 76 '3. 30
2. 86 '2. 22
3.19 '2.85
3. 28
2.23 2. 21 2.64
2. 27
1. 77 I. 40
'I. 95 2.03
'1. 20 1.18
'I. 39
2. 624 3. 931 3. 559
•3.0 •1.5
4. I 1.0
'2. 6
200 50
300 G50
4, .500
465
1, 853
I, .501 1, 677
4. 4 I, 285 168.3
31
'29 48 42
5. 3
21 93
21.7
I. 70 pI. 72 l..IU PJ.60
1.53 Pl,54 2. 23 p 2. 24
'2. 74 2.45
'2. 89
'2.49 1. 62
2. 627 :J. 942 3. 5ti0
p 3. 5 pI. 2 1l 2. 9 •.8
Pl.{)
150 20
250 100
1,500
p 2. 74 p 2. 4ti
,, 2. 91
p 2. 48 p 1.62
2.638 3.948 3. 5!\3
1.05
432 ---------
I, 645 1,841 2, 180
4.8 5.fi I, 545 219.5
33 38
31 5:l fil 50
7.0
I' Includes data for industries not shown separatc•ly. §Rates as of February I, 19GO: Common labor, $2.638; skilled labor, $3.950; equipment operators, $3.572. !Beginning with the October 1959 SrRVEY, data are revised to incltH!c operations in Alaska and Hawaii; figures for State programs are also revised to exclude Federal employees'
pro~rmn (shown separately below) except as uoled. c?'Rate of covered employment expresses average insured unPmploymcnt in rach month a< a percentage of average covered employment for the most recent 12-month period for which data
arc av:~ilable (the lag for cowred <'Inploym<'nt data may rang<' from 6 to 8 months). '}.;'''""'rice. Data relate to persons Pligibk for compensationundr:r the Ex-~erYitt•mcn's Fnemploymcnt Conqlcmation Act of J9!i8 (effective Oct. 27, 1908).
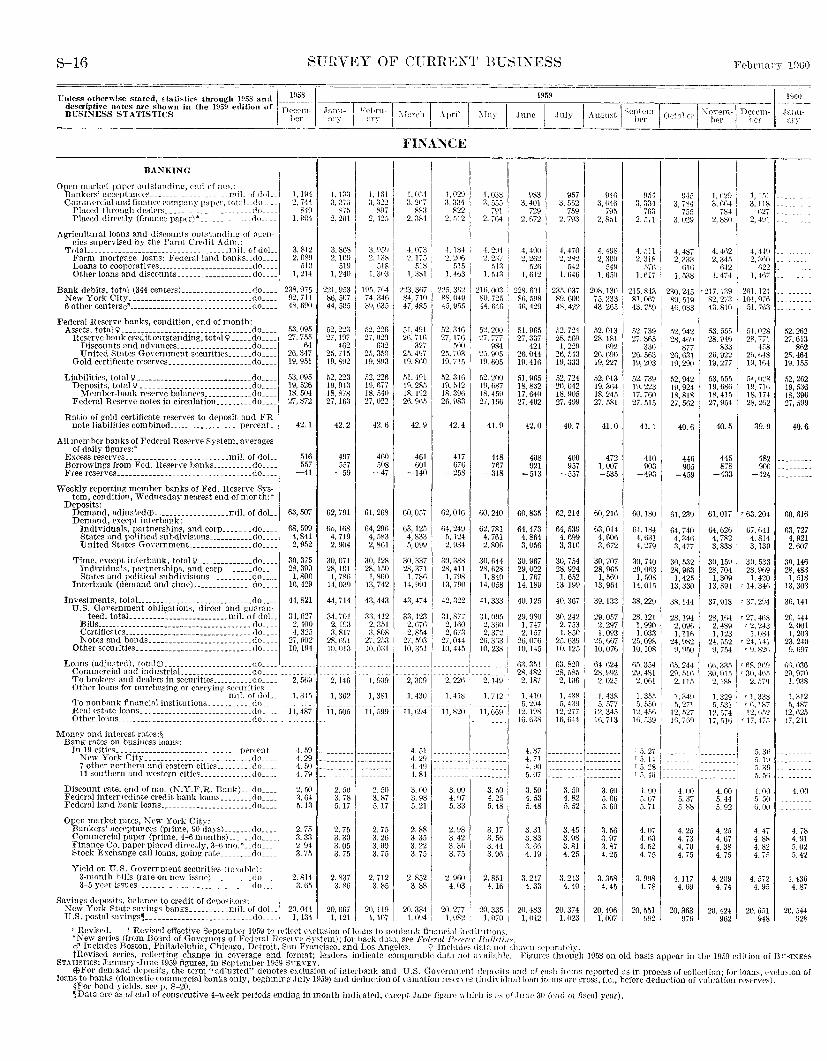
S-16 SUHVEY OF CURREXT BUSIXESS
Unless ot~1erwisc stated, s~ati~~~;s through 1958 and--~----~~~~-~----· de~::eriptive notes are F>hown in the 1!159 edition of De'"'"lil- J \l')ll
BUSINESS STATISTICS I ~~~r · ~:Y-
BANKING I Open markrt paTl<'l' \mtstanding, f•nd of mo.: . j
Bankers' accpptan('cs ____________________ rrd1. .)f d(JL_I Connnf'rcial nnd financC' company rlapl'l', totaL_do ----1
Placed through dealers ______________________ clo ___ _ Placed directly (finance paper)' _____________ do ____ I
Agricultural loans and discounts outstandhlg of fl~cn- 1 cics supervised by the Farm Cr<'dit Adm,: 1
TotaL ___________________________________ nnL of doL_ I Farm mortgage loans: Federal land banks __ do ___ _ Loans to coopcratives ________________________ do ___ _ Other loans and disconnts ___________________ do ___ _
Bank debits, total (344 centers) __________________ do ___ _i New York City -------------------------------do ___ _ 6 other centers a'------------------------------ _do ___ _
Federal Reserve banks, condition, end of month: Assets, total<;> _________________________________ do ___ _ Rosen-e bank credit outstanding, total\'---- .do ____ l
D1scmmts and advances ___________________ do ___ _ United States Government securities ______ do ___ _
Gold certificate reserves _____________________ do ___ _
Liabilities, total<;> -----------------------------do ___ _ Deposits, total? ____________________________ do ___ _ MPmher-hrmk reserve balanccs ____________ do ___ _
Federal Rrserve notes in circulation _________ do ___ _
Ratio of gold certificate resen·es to deposit and FR note liabilities combined __________________ percent__
All mem her banks of Federal Reserve System, anragcs of daily figun•s:*
Excess reserves __________________________ mil. of doL_ Borrowings from Fed. Resen·e banks __________ do ___ _ Free reserves __________________________________ do ___ _
Weekly reporting memher banks of Fed. Reserw System, condition, Wednesday nearest end ofmonth:t
Deposits: Demand, adjusted(J) ___________________ mil. of doL Demand, except interhank: I
IndiVIduals, partnerships, and corp _______ do ___ _ States and political snbdivisions ___________ do ___ _ United States Gov·crnmpnt_ _______________ do ___ _
Time, except inter hank, total\' ______________ do ___ _ Individuals, partner~ hips, and corp _______ rlo ___ _ States and politiral snbdivisions ___________ do ___ _
Interbank (demand and time) _______________ do ___ _
Investments, totaL ___________________________ do ___ _ U.S. Gowrnment obligations, direct and guaran-
teed, totaL ________________________ mil. of doL_ Bills ______ ----- ___ ----- ____ ------- _________ do ___ _ Certificates _______ -------------- ___________ do ___ _ Notes and honds __________________________ do ___ _
Other securities _____________________________ do ___ _
Loans (adju.st<•d), l?tni(J) __ . ____________________ do ____
1
_
Commercwl and tndustnaL _________________ do ____ _ To brokers and dralers in securitirs __________ do ___ _ Other lmms for pnrchnsing or currying: seeuritit'S
. . . . mil. ofcloL_j To nonbank financial InstitutiOns ___________ do ____ 1_ Real estate loans ____________________________ do ___ -I
1,1\14 2, 7~1
~40 1,DWt
3. 812 2, 08\1
510 1, 214
238, 975 92, ill 48, 6£,(1
53. nn5 27. 755
64 26,347 19,951
.53, 095 19,526 18,504 27, 872
42.1
516 557
-41
63,507
08, 59!) 4, 841 2, 952
30, 375 28,390
1,800 lH, 429
44,821
34,627 2, 400 4, 325
27, f/02 10,194
z,stm
1, 315
11, 487
1, 1~:{ ~). (\7\i
~75 2. ~01
3. 8GS 2, li)fl
519 1, 240
221, 9fi3 86. 5!17 44, 5(1!5
52,223 27, 197
462 25.715 19.8\12
52,223 19,9-13 18.878 27, 16:!
42.2
497 557
-59
62,791
()5, H-i8 4, 719 2, 904
30,071 28, 101
1. 78G 14. o;Jg
44, 714
34. 701 I 2,1\13 3, 817
2S. H91 I 10, 1)]3 i
I
2: 14b i I. 3621
11, 505
Fl'hrunry
1.161 ') ':P'> . '~97 2,125
3. HD\! 2. 1:l8
018 1. 3fl3
lfl;), 7()4 74,346 il9, 635
52.226 27.020
632 25, 350 HI. 8!13
52. 226 10, fli7 18.5411 27, 022
42.6
460 508
-47
61,268
fl4, 296 4, 583 2,861
30,128 28,150
1,800 13, 742
43, 443
3:l. 412 2, ;J51 3, ROR
27, 2.S:~ 10,031
1, f!39
I, 381
11, 599
CIL:rc!J I .\J,ril I FINANCE
1,(61 3. 2Hi'
~~;{
2. 384
4. ll73 2. 17.5
518 1. 3'"
2~3. 3fi7 84, 710 47,485
51 491 26.716
327 25,4\17 19.860
.)1. 4fll ]fl. 285 18_ 1!12 26. 965
42.9
461 601
-140
60,057
63, 125 4,833 5, Oll!l
30,337 28,371
1, 781l 14, 991
43,474
33,123 2, 676 2, 854
27. 593 10.351
2,309
1 0''',) 3: iJ34 2, 512
~. 184 2. 2tl(i
,S15 l. 463
.)2. :l46 27,176
5110 25.703 19,715
52. 3411 1H. 542 18_ 3!!6 25,\183
42.4
417 676
-258
62,016
fi4, 24B 5, 124 2, 934
30, 3F8 28, 411
1, 7H8 13. 700
42, 322
31,877 2, HlO 2,1373
27,044 10, 445
2:;2;i 1
1,430 i l.~W I 11, fifl-1 :- 11' 820
I, 038 3,5[15
71J1 2. 704
·t. 2V4 2. 237
,,];j L 543
zw.oo:J so. 725 H.G4fl
52,200 27, 777
!184 2.5. ~)(\5 1!1, 605
.12. 200 1~. 687 18. 459 27, 1.16
4L II I
448 767
-318
GO, 240
62,781 4, 71\1 2,806
30, 644 28. ()28
1, 810 14,058
41,333
3~:~i:~ I 2, 372
2\i, 3Ci3 10, 238
2, 149
1, 7-12
11, G69
Mm~:h:~:o:tsr·;;~; ~~~~:;~ __ ----------- _________ do ___ -~-Bank rates on businrss loans:
rn J~,~i\~~~:v cii~;~ ~~ =~~=~ ========= ==== == = =~~·x~~ ~::II -1.50 4. 29 4. 51! 4_ 79
- ----------------- -- 1-
!. ~0 1:=======: ========= 7 other northPrn and eastr,r\1 citics _________ do ____ 1 11 southern and 'vrstrrn Cltles _____________ do ____ l
Discount rate, end of mo. (N.Y.F.R. Bank) __ _clo ___ _ Federal intermediate credit bank loans ________ do ___ _ Federal land bank loans _______________________ do ___ _
Open market rates, New York City: Bankers' acceptances (prime, 90 days). ______ do ___ _ Commercial paper (prime, •1~6 months) ______ clo ____
1 Finance Co. paper plaeed directly, 3~6 mo. • __ c]o ____
1
Stock Exchange call loans, going rate ________ cto ___ _
Yield on U.S. Government securities (Ln:lhle): 3-month hills (rate on nevY issnr) __________ clo ___ _
SaYin:~::~::i~:s:~::;,~~~~-:~ -;r~~;t-~;~,:~~~;:~::,_do_---~ New York State savings banks __________ nlil. of doL_ U.S. postal saYings, ___________________________ do ____ '
2. 50 :J. 64 5.13
2. 75 3. 33 2_ 94 3. 75
2. 814 3_ li5
20.044 1, 134
2. 50 3.78 5.17
2. 75 3. 30 3. 05 3. 75
2. 837 3. 86
20.1167 I, 121
2_ 50 3.B7 5.17
2.75 3. 26 3.00 3. 75
2. 712 3.85
211, 119 I, 107
-1_ 4!1 --------- ---------4_ 84 --------- ---------1
3.110 3. 98 5.21
2.88 3.35 3. 22 3. 75
2. 852 3. 88
20.33-1 1. 0\14
3.00 4. 07 5. 33
2. ~8 3. 42 3. 3() 3. 75
2. (!60 4_ 03
20. 277 1,1182 i
3_ 50 4. 25 5. 48
3_ 17 3_ 56 3_ 44 3. 96
2. 851
4.161
20.335 I J.ll71) 1
1959
June / July
983 3, 401
729 2, 672
4. 400 2. 262
.120 !, 612
228, f\01 86.5\18 46,429
51.965 27,337
421 26.044 19.416
51,965 18,832 17,640 27,402
42. ()
408 921
-513
60, 835
64, 473 4. 864 3, 056
30,967 29,022 !, 767
14,189
40, 125
29,980 1. 747 2,157
2G. 076 Ill. 145
63, 351 28, 4~2
2, 187
1, 410 5, 294
12.198 16.638
4. 87 4. 71 4. 90 5.117
3. 50 4. 53 5.48
3. 31 3. 83 3. fiG 4. HI
3_ 247 4. 33
20. 483 I, 1142
9.)7 3, 552
759 I 2, 79:3
4, 470 2, 282
542 1, 646
23.1, fi37 89,600 41<, 422
,)2, 724 28. 569
1, 229 26. 543 19, 333
52. 724 20, 042 18.905 27. 499
40.7
400 957
-557
62,214
64, 539 4, 699 3, 310
30,754 28.924
1. 652 13,199
40_ 367 I 30.242 2, 753 l. 850
25.639 Ill, 125
63. 820 28, 585
2,1116
1, 4:)8 :
~· ~~~ I L. -" I 16, ()44
B41) 3,1l41i
7H5 2,B!il
4. 4\!8 2, aoo
M\1 l. 650
208, 130 7.)_ 233 4:l. 265
52,013 28.181
692 26,6\10 19. 227
.12,1113 19,364 18_ 245 27, 581
41.0
472 1, 007 -535
60,216
f>3, 014 4, 606 3. 672
30, 707 28,965 !, 56(!
13,964
39,133
29, 057 2, 297 I, 093
25,667 10,076
64, 624 28,9\12 2. 025
1, 4:38 ;), ;:'i77
12, 34.1 16,713
________ _)_ _______ _
---------1------------------~---------
3. 50 3. 50 4. 82 5. 06 5. 52 ,)_ 60
3_ 45 3.\18 3_ 81 4. 25
3. 243 4. 40
20,374 I. 023
3. 56 3. 97 3. 87 4. 25
3_ 358 4. 45
20,406 I, 007 I
r Revised. 1 Revised effective Septemller 1959 to rdlect l'\C'lusion of loaJIS to nonbank financh\ i11stltut ion:-;. *New srries (fronl Board of Governors of Ff'deral Rr~('ITl' .Sy~t('1n); for hack data, sre Federal Rrserre I?ulletiu.'l.
954 3, 334
763 2 .. l/1
4. :ill 2_ ~18
;)';"()
1, 017
215,843 81,067 43, 2.59
.12. 739 27.805
3311 26. 5fo3 19,2113
52, 73(! 19.223 17. 760 27. 51.)
41. I
410 \103
-493
l;Q, ISO
64. 184 4.1l:3] 4. 279
30,740 29.0113
1, 508 14,015 '
38,229
28,121 1, 990 1, 033
25,098 10,108
tl5,3!i4 29, 4~1
2, 061
1, 35f) .s .. ~50
12, 4.~li 10 .. s3n
! .~. '27 1,1.14-1 5. 28 l 0. 4'1
L 00 5. 07 5. 71
4. 07 4. 63 4. 52 4. 75
3. fi9R 4. 78
20,551 H\12
Felnna ry 1 ~ltiO
9-15 3, 7~4
755 3, 029
4, 487 2, 333
fi16 ], .138
k~~~ 781
2, 880
4, 4fl2 2, 34.5
0-12 !, 474
2:10, 2451'217. 139 S9, .119 82. 2i'3 4{\, 083 43. 810
52,942 2H, 4ti9
877 2G, 63! 19,290
52,942 19,924 18, 81~ 27, 562
40.6
446 905
-459
.13. 5.55 28.946
833 26,922 19, ~77
53, 555 19, 68fi 18.415 27,954
40.5
44.) 878
-433
1,1:i1 3, llS
n:t; 2, 491
4,-119 2,:)110
il22 1, .J•li'
2<ll. 121 10-l. '171\
.SL 7113
:'54, P28 2~. 771
4.\8 2h, 1;48 W,1C4
.14, o~q lP, /Hi 18,17! 28. 2fi2
39.9
482 906
-424
6!,2~9
64,740 4,34() 3, 477
61, 017 ' 63. 204
30, .}~2 2H, 963
I, 42.1 13,330
38, 144
2S, 194 2,1J9(i l,llfi
24. ~82 9, 950
G5, 244 2!l, 516
2.115
;. ~~g ,), 211
12,.127 1G, 7G9
64,626 4, 7S2 3,838
30, !59 28,704
I, 309 13.894
37,918
28, lti4 2,489 !, 123
24, 552 9, 7.54
66,335 30,015
2,188
1.329 s,r,;n
12,574 17, fill)
r:~:~~~~l 4. (Ill 4. 00 .)_ 37 5. 44 .)_ ss 5. 92
4. 25 4.73 4. 70 4. 75
4.117 4. 69
20,363 U/6
4_ 25 4_ 67 4. 38 4. 75
4_ 209 4. 74
20,424 962
G7,1H1 4, 81-1 3,139
30,.133 28,969
1, 420 '14. 34<l
r 37, 294
r 27, 41\8 '2. 2-13
I. 081 <24, 111
r 9, 821\
r !~8. ()(\9 r 30,4t1.1
2. !i/9
'!, 338 T R, 187 12, !if(~
r 1/, 47.~
5. 31i fi. 19 .1. 39 ,l) .• ')li
4.110 .). 50 u. 00
4. 47 4. 8~ 4. 82 4. it)
4. [J/2 4. fJ5
20,11.\1 948
.12, 262 27,613
8fi2 25,464 19. 155
.52, 262 19,.\36 18,396 27, 599
40.6
60, 616
fi3, 727 4, 921 2. nOi
30,146 28,483
I, filS 13,303
3fi,l41
2fi, 444 2,0\Jl 1, 20:l
23. 240 9.1;97
till. 036 29, 970
1. n:Js
J.:H2 5, 487
12, (i2;) 17, 2-tl
4. 00
4. 78 4. 91 .)_ 02 .I_ 42
t 136 4. 87
20 .. \44 928
d' Includes Boston, Philadelphia, Chicago, Detroit, San Yrancisco, and Los Angeles. <;> Inrlnd<'s data not sllmm separately. tRevised series, reflecting change in coverage and format; leaders indicate comparable data not nniiiahl(_'. Fip-m·es through 1958 on old ba;;is appear in the 1959 edition of Bf-SJ~ESfl.
STATISTICs; January~June 1959 figures, in September 1959 Sl'RVEY. EBFor demand dPposits, the term ''adjusted" denotes exclusion of interbank and U.S. Gov('nlllH'nt (!l-po~its nnd of ensh itPms reported as in process of colh~ction; for loans, exclusion of
loans to hanks (domestic commercial bunks only, beginninf! July U)5~)) and deduction of ,-aluationresl'ITe,:; (indi\"icltwlloan itC>m:-: an· .cross, i.e., before dedurtion of nlluation n'serve~). ~For hond yields, sec p. 8~20. ,Data nrc as of end of consecutive 4~week periods ending in month indicHtcd, except June fi~nn' "IIi eli is"-' or .JmH· 30 (end of fiscal year).
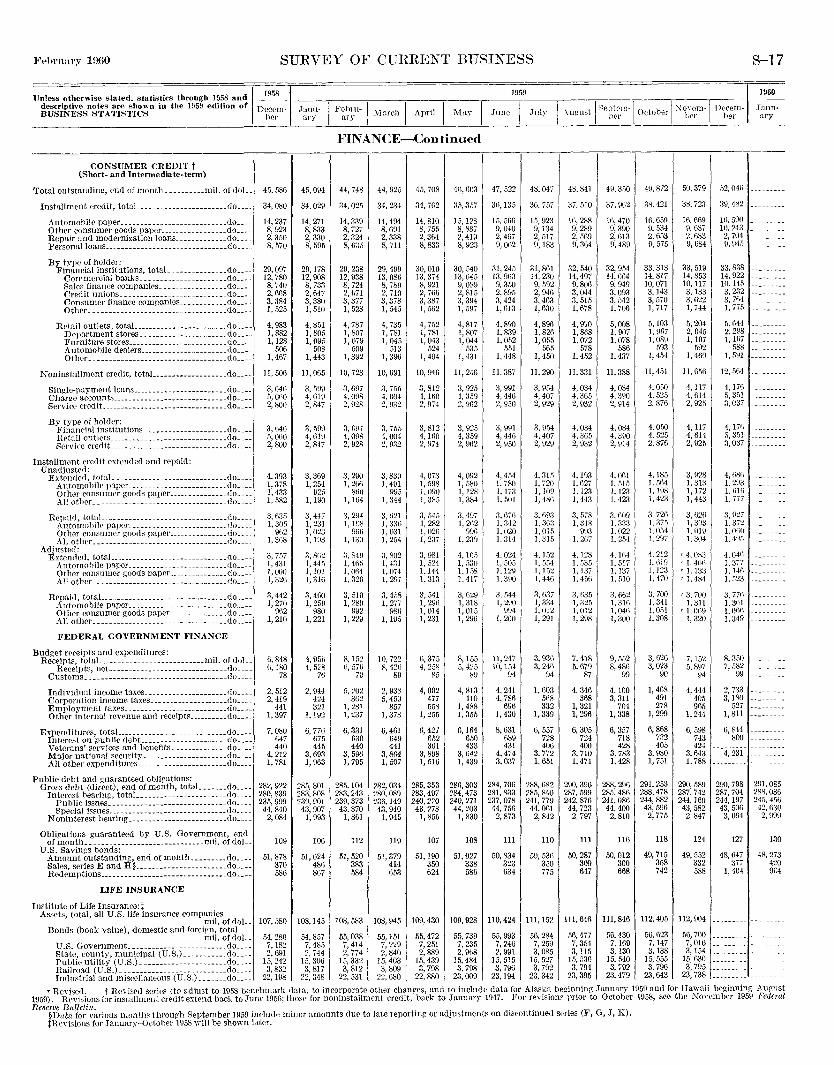
SURVEY OF CURRENT BUSINESS
Un!ess otherwise stated. statistics through 1958 and ~~~~~-~ descriptive notes are shown in the 1959 edition of Dec ~m~ BUSINESS STATISTICS h~;.
CONSUMER CREDIT f (Short- and Intermediate-term)
Total outstandin~, end of month ......... mil. of doL.
Installment credit, totaL ...................... do .. ..
Automobile paper.----------------- ......... do ... . Other consumer goods paper ................. do .. .. Repair and modernization loans ............. do ... . Personal loans ______________ -________________ do ___ _
By type of holder: Financial institutions, totaL .............. do .. ..
Commercial banks ...................... do ... .. Salrs finance companies _________________ do ___ _ Credit unions ... --------------- ......... do .... Consumer finance companies ____________ do ___ _ Other ................................... do .. ..
Retail outlets, totaL ....................... do .. .. Department stores ...................... do .. .. Furniture stores ......................... do ... . Automobile dealers ...................... do .. .. Other ................................... do .. ..
Koninstallment credit, totaL .................. do .. ..
Single-payment loans ........................ do ... . Charge arcounts ............................. do ... . SerYice credit. ............... ----------------do ... .
By type of holder: Finanein.l institutions _____________________ do ___ _ Retail outlets .............................. do ... . Service credit. ............................. do ... .
Installmpnt ercdit extended and repaid: Unadjusted:
Extrnded, totaL ............................ do ... . Automobile paper ......................... do ... . Other ronsunH~r goods pnper _______________ do ___ _ All other .. -------------------------- ...... do ... .
Repoid, totaL ............................... do ... . Automobile paper ......................... do .. .. Other consumer goods paper. .............. do .. .. All other .................................. do .. ..
Adjusted: Extcmled, totaL ............................. do ... .
A utomohile paper ......................... do .. .. Other consumer goods paper ............... do .. .. All other .................................. do .. ..
Repaid, totaL .............................. do ... . Automobile paper ......................... do .. .. Other consumer goods paper ............... do .. .. All other .................................. do .. ..
FEDERAL GOVERNMENT FINANCE
Budget n•ceipts and expenditures: Receipts, totaL ......................... mil. of doL.
Receipts, net .............................. do ... . Customs .................................... do ... .
Individual income taxes ..................... do .. .. Corporation income taxes ____________________ do ___ _ Employment taxes .......................... do .. .. Other internal revenue and receipts .......... do .. ..
Expenditures, totaL .......................... do ... . Interest on public debt. ..................... do .. .. Vetrrans' services and benefits_----------- __ do ___ _ Major national security _____________________ do ___ _ All other expenditures ....................... do .. ..
Public debt and guaranteed obligations: Gross debt (direct), end of month, totaL ...... do .. ..
Interest hearing, totaL ...................... do .. .. Public issues .............................. do ... . Special issues .............................. do ... .
Noninterest bearing _________________________ cto ___ _
Obligations guaranteed by U.S. Government, end of month .............................. mil. of dol ..
U.S. Savings bonds: Amount outstanding, end of month ......... do .. .. Sales, series E and H§ ....................... do .. .. Redemptions_ ................... _ .....•• _._. do •. _.
LIFE INSURANCE
Institute of Life Insuranco:t
45, 586
34,080
14, 237 8, 923 2,350 8, 570
29,097 12,780 8, 740 2, 668 3,384 1, 525
4, 983 1, 882 1, 128
,506 I, 467
11,506
3, 646 5, OoO 2, 80()
3,646 5, 060 2, 800
4, 393 1, 378 1,433 1, 582
3, o3.o 1, 305
9(i2 1,3G8
3, 757 1, 4:U 1,000 1, 326
3, 442 1, 270
962 1, 210
6, 848 fi, 180
78
2, 512 2, 419
441 1, 397
7, 080 647 440
4, 212 1, 781
28~. 922 280,839 235,999
44,840 2, 084
109
51,878 370 586
Jann· ary
45,094
34,029
14,271 8, 833 2, 330 8, 595
2\l, 178 12,908 8, 73:1 2, 647 3,380 1, 510
4, 851 1,805 1, 095
508 1, 443
ll, 065
3, 599 4, 619 2, 847
3, 599 4,f>l9 2,847
3,369 1, 254
02!1 1,190
3, 447 1, 231 1,023 1,1\1:1
3, 8fi2 1, 445 1,101 1, 3lli
3, 460 1, 259
980 1, 221
4, 95(\ 4, ,>CS
7(i
2, 944 424 321
1,192
ti, 776 f>7.0 445
3,693 1, 963
285,801 283,808 239,901 43,907
1, 993
106
51,624 48(\ 867
FINANCE-Continued
44, 748
34,025
14,339 8, 727 2, 324 s,6o5
29,238 12,938 8, 724 2,071 3,377 1, 528
4, 787 1, 807 1, 079
509 1, 392
10,723
3, f,97 4,098 2, H28
3m· 4:0118 2, 928
3, 290 1, 2{)6
8ii0 1, H\4
3, 294 1, 198
9(-it\ 1,130
3 849 1: 41lfi l,Oii4 1, 320
3, !'i10 1, 28\1
992 1, 229
s. 1.o2 li, 57ti
70
5, 202 362
1, 281 1, 237
6,331 630 440
3, 59ii 1, 795
285,104 n3, 243 239,373 43,870
1, 861
112
51,520 383 584
44, 925
34, 234
14,494 8, (;g[ 2,338 8, 711
29,499 13,086 8, 780 2, 710 3,378 1, 545
4, 735 1, 781 1, 04.o
513 1, 300
10,691
3, 755 4, 00<1 2, !132
3, 755 1,004 2, 932
3,830 1,491
(195 1, 344
3, !\21 1,:J:lli J.Ool 1, 254
3, 802 1, 431 1,074 1, 297
3,458 1, 277
981\ 1, 195
10,722 8, 42ti
89
2, 938 5, 459
857 1, 378
6, 461 649 441
3,8fi4 1, 507
282,034 280,089 236,149 43,940
1,\145
119
51,379 414 653
45, 708
34, 7fi2
14,810 8, 755 2,364 8,833
30,010 13,374 8, 921 2, 766 3,387 1, 562
4, 752 1, 781 1, 043
524 1,404
10,946
3, 812 4, 1ti0 2, 974
3,812 4, lfiO 2,\174
4, 073 1, 598 I, 090 1, 385
3, .145 1, 282 1,02(i 1, 237
3, 981 1, 524 1,144 1,313
3, 541 1, 29(\ 1, 014 1, 231
6,375 4, 258
85
4, 002 477 558
1, 255
(\, 427 652 3()1
3, 898 1, .516
285, 353 283,497 240,220 43,278
1, 856
107
51,190 350 624
4ti,H03
~i5, 357
15,128 8, 887 2,419 8, 923
30, 540 1a, 645 9, 089 2, 815 3, 394 1, 597
4,817 1,807 1,044
.535 1, 431
11, 246
3, 925 4, 359 2, 962
3, 925 4,359 2, 9tl2
4, 092 1. 580 I, 128 1,384
3, 4~17 1, 21\2
996 1, 23\1
4, 105 1, 5ao 1,Wl 1, 417
3, 629 1,318 1, 015 1, 296
8,155 5, 4~5
8!1
4, 813 410
1, 488 1, 355
6,164 650 433
3, 642 I, 439
28f>, 303 284,473 240, 271 44 203
1:830
108
51,027 338 586
!959
June I July
47, 522
36,135
1.0, 56G 9,010 2, 4(\7 9,01i2
31, 245 13,963 9,3.>0 2, 895 3,424 1, 613
4,890 1, 839 1, 052
551 1, 448
11. 387
3, 991 4, 446 2, 950
3, 991 4, 446 2,\150
4, 454 I, 780 1, 17:l 1, 501
3, Gifi 1. 342 1, 020 1, 314
4. 024 1, 505 1,129 1,390
3, 544 1, 290
994 1, 260
11,247 10,154
94
4, 241 4, 786
69tl 1,4oO
8, 631 689 431
4, 474 3,037
284,706 281,833 237,078
44, 75tl 2, 873
111
50,834 323 634
48. 047
36, 757
15,923 9,134 2, 517 11,183
31,861 14,230 9, 5\l2 2, 946 3, 463 I,630
4,800 1, 826 1, 055
565 I,450
11, 290
3, 954 4, 407 2,\129
3,\154 4, 407 2, 929
4, 315 1, 720 1,109 1, 4~(i
3,1\93 l,:ll\3 1, 015 1, 315
4, 1.52 1, 554 1,1&2 1, 44U
3, fi37 1, 334 1, 012 1, 291
3, 93G 3,2Mi
94
I, 603 5(\8 332
1,339
6, 557 728 406
3, 772 1, 651
288,682 285,840 241,779 44,0ol
2,842
110
50, 53f> 350 775
\ rgnst I ~rptrm-1 0 t be 10: oYem-1 Deeem-1 - t .. bc'r c 0 r L<•r her
48,841
37, 510
16,288 9, 289 2, 569 9,364
32, 540 14, 497 9, son 3,044 3, 511\ 1, 678
4, 970 1, 868 1,072
578 1, 452
11, 331
4, 034 4, 365 2, 932
4,034 4,365 2, 932
4,193 1,(127 I, 123 1,443
:J, 578 l,:HS
9!13 1, 2G7
4,128 1, 535 1,137 I, 456
3, 635 1, 32.) 1, 012 1, 298
7, 418 5, 67\1
87
4, 346 368
1, 321 1, 296
6, 305 724 400
3, 710 1, 471
290,396 287,599 242,876
44,723 2, 797
111
50,287 309 647
49, 3.50
37, 9<)2
16,470 9,390 2,613 9,489
32,954 14,o64 9, 949 3,093 3, 542 1, 706
5,008 1, 907 1, 078
586 1, 437
ll, 388
4, 084 4,390 2, 914
4, 084 4, 390 2, 914
4, 061 I, 515 1,123 1, 423
3.(\(1(1 I, 33:' 1, (122 1, ~54
4, Hi4 1, 517 I, 1:17 1, 510
3, (\62 1,31() 1, 046 1,300
9, 552 8,48(\
99
4, 100 3, 311
704 1,:138
6, 357 718 428
3, 783 1, 428
288,296 285,486 241,086 44,400
2,810
116
50,012 300 668
49,872
38,421
16,659 9, 534 2, 653 9, 575
33,318 14,817 10,071 3,143 3, 570 I, 717
5,103 1, 967 1, 08\1
593 1,4M
11,451
4, 050 4, 525 2, 876
4,050 4, 525 2, 876
4,185 1, 564 1, 19S 1, 423
r:m l.OM 1, 297
4. 212 1. 619 1.123 1, 470
3, 700 1,341 1, Ofi1 1, 308
3, fl2(j 3,023
9()
I, 46S 491 278
1, 299
6,868 722 405
3, 980 1, 751
291,253 288,478 244,882
43,596 2, 775
118
49,715 358 742
50,379
:J8, 723
16,669 9, 687 2,(183 9, 684
33,519 14,853 10, 117 3,183 3,622 1, 744
5,204 2, 045 1,107
592 1, 460
11, 656
..j, 117 4, t\14 2, 925
4,117 4, 611 2, 925
3, 928 1, 31~ 1,172 1, 443
3, G26 1, 303 1, 01\1 1,304
'4.083 r]..:l()fi
'1,1:;:1 '1. 181
'3, 700 1.311
r l,Ofi9 1. 320
7,152 5, 897
94
4, 444 405 965
1, 244
6, 598 743 424
3,043 I, 788
290, 58!1 287,742 244, 160 4:l, 582
2,847
124
49, !i52 332 588
52,0411
:19,482
11\,590 10. 2~~ 2, 704 9, 945
33,838 14, 922 10, 145 3, 232 3, 7fl4 1, 775
5,644 2,298 1, 1fi7
!iSS 1, 591
12, 5G4
4, 17() 5, 3iil 3,1!37
4,1711 5, :J.51 3,037
4, ti8t) 1. 293 l,fi]f) l. Ti7
a, P27 1. 372 1, OliO 1. -HI;i
'1,04'\ 1. 377 ],HI\ 1, ft23
3. 771i 1. 31il 1,0fifi 1,349
8, 31\0 7, 582
99
2, 733 3,180
527 1, 811
6,844 800
4, 231
290,798 287,704 244, 197 43, 506
3, 094
127
48,647 :177
1, 404
S-17
1960
January
291,085 28K086 245. 4SfJ 42, !\30 2,999
130
48,273 420 9C4
Assets, total, all U.S. life insurance companies mil. of dol.. 107,580 108, 145 108,583 108,945 109,430 109,928 110,424 111, 152 111,646 111,846 112,405 112,904 ........... .
Bonds (book value), domestic and foreign, total mil. of doL 54, 286 54,857 55, 038 55, 151 55, 472 55, no 55, 993 56, 284 56, 477 56, 430 56,623 56,700
U.S. Governmcnt. ........................ do.... 7,182 7,48,5 7,414 7,229 7,251 7,235 7,246 7,259 7,354 7,169 7,147 7,016 .......... . State, county, municipal (U.S.) ........... do.... 2, 691 2, 744 2, 774 2, 840 2, 889 2, 9!>8 2, 991 3, 085 3, 115 3, 130 3, 138 3, 154 Public utility (U.S.) ...................... do.... 15,242 15,300 15,332 15.403 15,439 15,484 15,515 15.527 15,536 15,540 15,555 15,630 Railroad (U.S.) ........................... do.... 3,832 3,817 3,812 3,809 3,798 3,798 3,796 3,792 3,794 3,792 3,796 3,795 Industrial and miscellaneous (U.S.) ....... do.... 22, 198 22, 348 22, 531 22, 680 22,880 23, 009 23, 194 23, 342 23,395 2:>, 479 23,643 23, 738
'RcYiscd. t ReYisrd series (to adjust to 1958 benchmark data, to incorporate other changes, and to include data for Alaska beginning January 1959 and for Hawaii beginning August 1959). ReYisions for installment credit extend back to June. 1956; those for noninstallment credit, back to January 1947. For revisions prior to October 1958, see the l\oycmbcr 1959 Federal Reserve Bulletin.
§Data for various montiJR through September 1959 include minor amounts due to late reporting or adjustments on discontinued series (F, G, J, K). tHevisions for January-October 1958 will be shown later.
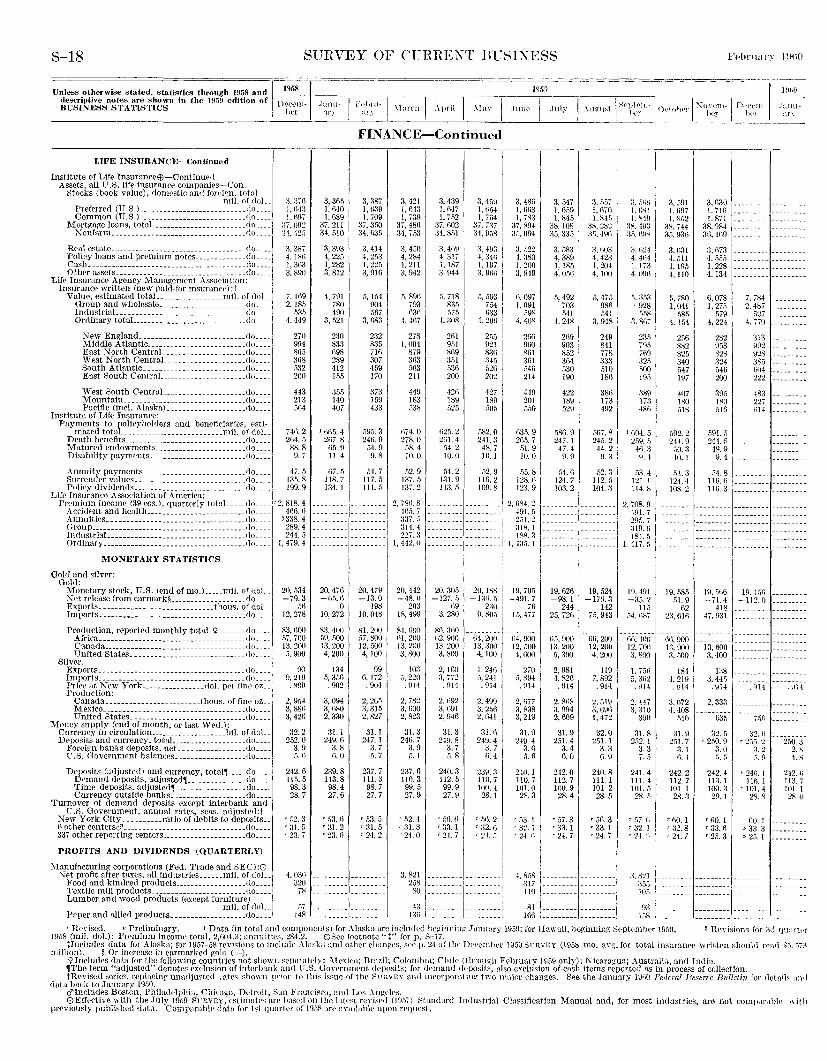
S-18 SURVEY OF CTRHEXT BU~TXESS
1!15!1 Unless otherwise stated, statistics through 1958 and ! descriptive notes are shown in the 195!• edition of i BUSINESS STATISTICS I
I
1958 I -Decem- Jann-
iJ('r nry i'i'hru
nry \~~c~~r~:-~~~,~-~~~=-f;:;~~~-:-:~~T~~;,,,..r \xo,;~~m-\ n,i;;~;"'
LIFE INSURANCE-Continued
Institute of Life InsuranceEB-Continurd Assets, all U.S. life insurance companies-Con.
Stocks (book value), domestic and for<'ign. total mil. of doL.
Preferred (U.S.)------------------ ________ .do. __ _ Common (U.S.). __________________________ do ___ _
Mortgage loans, totaL. _____________________ rlo .... X on farm_---------- ___ ----------------- ___ ito ___ _
Real estate. ________ ------------ _____________ rlo. __ _ Policy loans and premium notcs. ____________ do ___ _ Cash._------- ___ . __ .... _____________________ do. __ _ Other assets ________________________________ .do ... _
Lif(' Insurance Agency ManagemPnt Association: Insurance written (new paid-for insurane<'):t 1
Value, estimated totaL. _______________ mil. of doL.[ Group and wholesale. _____________________ do ....
1
~~~y~;:/;\:oial.~~~ :::::::::::::::::::::::: :az:::: i New England. __________________________ do .... i Middle Atlantic ________________________ .do. __ .I East .'Jorth Central. ____________________ do ... .l West North CentraL ___________________ do ___ _ South Atlantic. ______ ------------------ .do. __ _ East South CentraL_ ____________________ do ___ _
West South Centrnl. ____________________ do ___ _ Mountain. ______________________________ do .... Pacific (incl. Alaska) ____________________ do ___ _
In~titute of Life Insuranct': Payments to policyholders ami bencfirinries, esti-~
mated totaL ________________________ mil. of doL. Death benefits _____________________________ .. <lo .. __ Matured endowments ______________________ .do. __ _ Disability payments. ________ ------- _______ .do. __ _
3. 37fl I, ll4:J 1. f)~7
:J7.092 'l1. 42o
:J. 3X7 4, l~f\ 1, 3fi3 3, 890
7, 169 2.185
.13.0 4, 449
270 994 Sli5 :Jfi8 fi32 200
443 213 5fl4
746.2 21i4. 5
RS. 8 9. 7
Annuity payments __________________________ flo____ 47 .. > Surrender values ____________________________ do.... 13.1. S Policy dividends ____________________________ do.... 199.9
Lif(• Insurance Association of America: Premium income (39 cos.), quarterly total. .... do ____ '2. 818.4
Accident and health _________________________ do.... 406. fl Annuities .. ---------------------------------do____ '338. 4 Group _______________________ -------- _______ .do.___ 289. 4 IndustriaL _________________________________ .do.___ 244. 5 Ordinary ____________________________________ do ____ I, 479.4
MONETARY STATISTICS
Gold and silver: Gold:
JV[onetary stock, U.S. (en? ofmo.) _____ mil. of doLl '<et release from earmark§ ___________________ r\o ____ l Exports._-------------- _____________ thous. of doL. Imports. __ ------- .. ________________________ .do. __ _
Prx~~;!~~~: ~~~~~~~~ -~~~~~~:'-~~~~~-~ ~ ~::::: ;)g:::: I B~W~~astaies.-~:: :::::::::::::::: ~::: :::::;);;::::I
Silv~r: Exports .. ---------- ___ ---------- ___________ .do. __ _ Imports_._. _________________________________ do. __ _ Pric~ at New York ________________ dol. pPr finr oz __ Production:
Canada ________________________ thous. of fine oz __ Mexico ____________________________________ do ___ _ United States._-------------------------- .do. __ _
Money supply (end of month, or last Wed.): Currency in circulation ... ________________ bil. of doL. Deposits and currency, totaL _________________ do ___ _ Forei~n banks deposits, net _________________ do .... r.s. Governmrnt halances __________________ do ___ _
Deposits (adjusted) and cnrrency, total, _____ do .... Demand deposits, adjusted, _______________ do ___ _ Time deposits, adjusted, __________________ do ... . Currency outside banks. __________________ do ... .
Turnover of demand deposits except interbank and U.S. Government, annual rntes, Reas. adjusted:t
.'Jew York City .......... ratio of debits to deposits .. 6 other eentersci' -------------------------------do ___ _ 337 other reporting centers _____________________ do ....
PROFITS AND DIVIDENDS (QUARTERLY)
:VIanufacturing corporations (Fed. Trade and SEC):O .\'et profit after taxes, all industries. _____ mil. of doL.
Food and kindred products __________________ do ___ _ Textile mill products ... _____________________ do ___ _ Lumber and wood products (except furniture)
mil. of doL. Paper and allied products ___________________ do ....
20. ;i34 -79.3
.lfi 12,278
83, fiOO .17, 700 13. 2(10 ;i, 900
90 !l, 219
• S911
2, 9.>~ 3,881i 3, 421i
32.2 252.0
3. 9 5. (j
242.6 115.5 98.3 28.7
r fi2. a r :31.5 r 23. i
4. 031) 320
7R
ii7 148
FINANCE-Continued
3 I I
:J7 34
lfi 2
. 3ii.O • f\40 ,689 . 211 '510
. 393 • 22.1 '282 . 812
. 791 780 490
'.521
z:JO H33 f\98 289 412 1M
355 140 407
115. 4 1\7.8 li5. 9 II. 4
D7. 5 18.7 34. I
-----
I
3, 387 I I, li39
I 1. 709
37, a.IO 34, fi35
3. 414 4, 253 1, 22.> 3, 916
.1, 1.14
I 904
I .~fi7 3, f\83
232 83.1 716 :107 459 170
373 159 433
.19.). 3 246.9
54.9 9.8
.54. 7 117 .. > 111.5
-- ------------- ----------- ---------------- ------------
20, 47fi -ii5.11
0 10.272
83.400 ;,9, .>oo 13,200 4, 200
134 5, :)5()
. 902
3, 094 a, nso 2, 330
:n. 1 249. (i
3.8 fi.O
239.8 113.8 98.4 27.6
'53.() '31. 2 '23.11
------------------1
I 20, 479 -13.0
198 10,048
XI. 200 ;)7, 800 12,500 4, 100
99 G, 172
. 904
2, 21\5 3, 315 2, 827
31.1 247.1
3. 7 .5. 7
237.7 111.3 98.7 27.7
'.13. 5 '31. 5 r 24.2
3, 421 3, 439 I. ii43 1, f\47 I, 739
I
1, 7.~2 37. 48fi :17, 1102 34, 7.13 :H. 8.>1
3. 4.10 3. 410\l 4, 284 4, 317 I, 211 1, 187 3. 942 3. 944
.1. R9fl :1,718 /93
I 83.1
03() .'lib 4, 41\7 4. 308
278 261 1. 004 9.11
879 81i9 3fl3 :m 5fl3 :13() 211 200
449 4211 183 189 .138 I 525
fl74. 0 fi25. 2 278.0 21il.4
.}8. 4 04.2 10.0 10.0
52.9 54. 2 137 .. 5 131.9 137. 2 113. ,')
2, i81l. 8 -- ------4fi.l). i -- ------337 .. ~ -- ------314.4 -- ------221. a ---------
I, 442.0 __
20.442 20. 305 -48.0 -127 . .0
203 n9 18,499 3, 280
84. liiJO sr.. :{no 1\1,200 li2. 900 l:l. 200 13.200 3, 800 3, sou
103 2, lf>O 5, 220 3 - .... ) ,JI._
. 914 . !lt4
2, 782 2,1\92 3, liOO 3, li91 2, 823 2, 94\l
31.3 31.3 2413.7 249. 8
3.9 3. 7 5.1 5.8
237.6 240.3 110.3 112. 5 99.5 99.9 27.9 27.9
'.12. 4 r Mi.H '31. 8 '33. I r 24.0 r 2..f. 7
i I I I I I
I
3, 459 1, li.}4 1, 7!)4
37. 737 :l4. 9.18
:l. 493 4, 341i 1. 197 3, 9tH!
.1, 59:l 754 fi:l3
-1. 20fl
2?i.5 1!21 s:Jn 34.1 [}2{)
202
427
1891 .>us
fi82. 0 I
241.3 48.7 10.1
fl2. 9 I 19.2 109.8
-----------------· -- ------- -------- ~-----
2U, ISS -1311 .• 1
230 9.80,)
li4, 200 13,300 4,100
I, 241i •\ 241
. 914
2. 499 3, 2.5fi 2, fi41
31.\l 249.4
3. 7 n. 4
239.3 110.7 100.4
28.1
rill\. 2 '32. r. r 2..J-.!)
:l. 821 _________ !,. ________ _[
2~g ::::::::: :: ::::::1 43 l---------1--·------1 13ti I _________ ---------
3, 481) 3, 547 3, .11;7 1, 1)1)3 I, fi-09 1, ll70 1, 783 1, R45 1, Rt.O
37, 894 I :l8. 108 :1s. 282 :l!i. 094 :J5, 33.1 :1Pi, 491\
:J, .122 3, 58:J 3. fi03 I. 380 4, 389 4. 423 1, 200 I. 185 1, 204 3, 949 4, 05ii 4,100
I r.. 097 .1, 492 I. 091 703
fi, 475 98fl
;;gs 541 .~41 4, 40S 4, 248 :l. 948
200 21i9 249 91\0 903 S41 Rtll 852 778 3fll 3fi4 :J33 .14fi fi30 510 214 190 lSD
419 422 38D 201 189 173 550 529 492
fl3ii. 9 .1811. 9 .'ifi7. 8 2D5. 7 247.1 245.2
!)I. 9 47.4 ·14. 2 10.0 9. 9 9. 3
.1.1. 8 54. (j .>2. 3 128. r, 124.7 112.5 lz:l. 9 103.2 104. :J
2, f\84. 2 -- ------491. .I ---------2.11. 2 ---------:liS. I -- ------ISS. 3 ---------
fi4, 900 12 .• 100 4, 1>00
270 2, 981 119 5, H94 4, S26 7, 892 .914 . 914 . 914
2, H77 2, 8fi8 2, 519 3, 838 a, 994 3,69fi 3, 219 2, 609 1, 472
31.9 31.9 32.0 249. 4 2.51. 4 251. 1
3.G 3. 4 3. 3 5. 6 n.o 6. 9
210.1 242.0 240.8 110.7 112. 7 111.1 1111.0 IOU. 9 101.2 28.3 28.4 28 .• >
r ;)3.1 '57. 3 r 50.3 '32. I '3:l.l '33.1 r 2-1. n r 24. 7 r 24.7
, m 111:::::::::: 81 --------- ---------
1fiG ~--------- ---------
:). .~fi!i 1. t-i~H 1. S41J
ax. 4u:J ;).'l. H~IX
:J. fi24 4. 4fl4 1. 173 4. 09fi
',, :J;i3 '928
;~.1~
3. 81li
23ii i9fi 7H9 :32.5 iiOO 19fi
:1sn 17:l 48fl
lli0-1. ;j
2.19. ,o 4tU II. 4
'•3. 4 121.1 114. 8
2. 708.9 HH. 7 295.7 :ll9. (;
1-
i
I
t.l~U I i
1. i.'lll 5. 3()2
'\114
2, 447 3, 310
390
31.8 21i2. I
3. 3 7 .• 1
241.4 111.4 101.5 28. .~
r .'li. I)
'32. I ,. :2-L !)
:l. 821 :35fl 10.0
!13 158
3. 591 1, 097 I, R.12
ax. 744 3.1. 93•l
3. li31 4 .. oll I. 19.1 4.110
r;, iRO i.fl41
.>Rii 4.154
256 S82 825 340 f>47 197
407 ISO -"8
;i92. 2 244.9 :.o.:J
!fl. I I -i4. 3
124.4 lf\8. 2
In .. 185 ->1. g
f\2 2:l,61fi
11r.. ooo 1:l, 900 3, 500
!S4 4. 219 .\H4
3,072 4, 408
.i!O
31.9 2-11.7
3.1 (), 4
242.2 112. 7 101.1 28.3
'1;0.1 '32. 8 '24. 7
I I
I I
3,630 1-----I. 71fi ______ .. l.Ril
38,984 3\l, !fi9
:l, fl73 4 .. 1.1.1 I, 228 4.134
6,078 1, 27:1
.079 4, 224
282 9o3 828 324 546 200
395 180 .116
591. ,) 2-14. 5 49.9 9.4
i\4.8 111Ui 116. 3
w. ;,116 -71.4
418 47,1131
13,600 3,400
1:;s 3. 445
. 914
2,333
635
n.> '250. 9
3.0 ;,,;J
242.4 ll3. I 100.3 29.1
, no. 1 '33. 6 '25. 3
I_ _______
·-·
7. 784 2. 487
.~27 4. 770
313 992 928 38.5 604 222
483 227 !)14
19. 45fi -112.0
~--------
---------------------------
------------------
.914
---------------
;.)f'l
32. r. r 2,');). 2
3. 2 ;,, fl
2-lij, 1 116. I 101.4 28.8
00. 1 p 33.3 p 2.). 1
191i0
.l:J!HI:l r~-
---------
------------------------------------
------------------
. Bl-t
------------------
2.\0. 3 2. s 4.H
242. li 113. 7 101. 1 28.0
r Revised. 1' Preliminary. I Data (in total and components) for Alaska arc included heg"iuninl.!: January 19.%1; for Hawaii, hcp:inninp: 8<1ptemht•r 1959. 2 ReYisions for 3U qu~trh·r 1958 (mil. dol.): Premium income total, 2,604.3; annuities, 284.2. $See footnote"~" for p. S-17.
tincludes data for Alaska; for 1957-58 rpvisions to includr Alaska and other rhanges, ~('P p. 24 of tlw Dvec•mh(_•r liJ5\lSVRYEY (1958 mo. aYg:. for total insurance \vritten should r('a.d $."'! •• ~/3 million). §Or increase in earmarked p:old (-).
?Inclndes data for the following countries not shown scpmat<•ly: 2\lexico; Brazil; Colomhht; Chile (through F<>bruary 1959 only); l\;icaragua; Australia; and India. ~The term "adjusted" denotes exclusion of interbank an<! U.S. Government deposits; for d!'mand deposits, also exclusion of cash items reported as in process of collection. tReYised series, replacing unadjusted ; a1.<'s shown prior to this issue of 1he SVRVEY anti inrorporating two mnjor changes. See the January lDt)O Federal Heserve Rulletin for 1letail..- an(l
data back to Jauuary 1!J.SO. ci'Includes Boston, Ph!ladelphia, Chica~o. Detroit, San Francisco, and Los AngelL'S. OEffective with the July 1959 Sl'RVEY, C'Stimates nrc hasc•<l on the lat••st revised (l!l57J Standard Industrial Classification Manual and, for most industries, are not comparable with
})J'('Vionsly pnhlishcd dnta. Comparahll' data for 1:-:t f}twrtrr of 195R an• avnilable upon l'N}lwst.
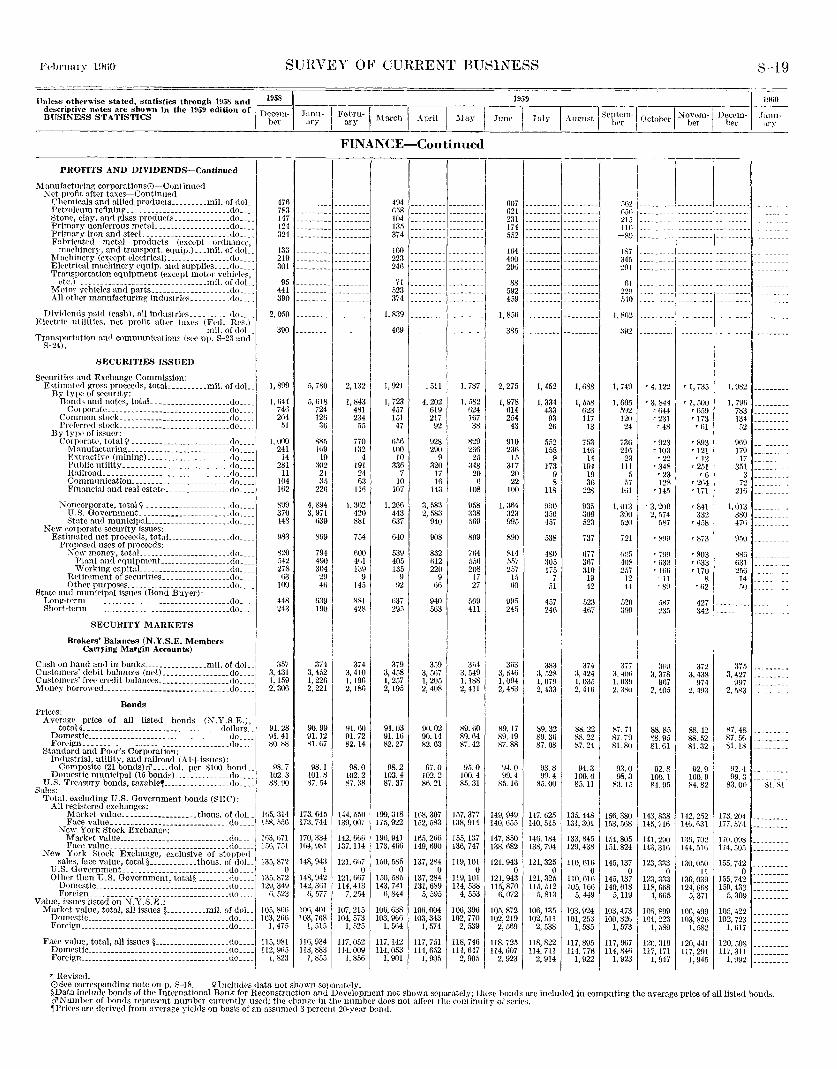
SURVEY OF CURRENT BUSlXESS S-19
1!l59 Unless otherwise stated, statistics through 1958 and ~~~~ ~~~r;&t~SSnS~~~~S.gCSn in the 1959 edition of Decem-
ber Janu· ary F~;:~u-1 ;\{arch I April I :\Jay I June I July
-,1960
I Augu~t t
1septem·l Ortohrr I Novrm-1 Decem- --.ianu-
. her I ber ber ctr:'-,.
PROFITS AND DIVIDENDS-Continued
Manufacturing corporationsO-Conti nued :\ct profit after taxes-Continued
Chemicals and allied products _________ mil. of doL_ PetrolPum refining __ --------- ______________ .do __ __ Stone, clay, and glass products .. ____________ do __ __ Primary nonf('rrous metaL __________________ do ___ _ Primary iron and steeL ____________________ do ___ _ Fabricated metal products (except ordnance,
machinery, and transport. equip.) ___ mil. of dol__ Machinery (except electrical) _______________ .do __ __ Ell'ctriml machinery equip. and supplics .... do __ __ Transportation equipment (except motor vehicles,
etc.) _________________________________ mil. of doL Motor vchieles and parts ____________________ do ___ _ All other manufacturing industries __________ do ___ _
Divi<len<ls paid (cash), all industries __________ do ___ _ Eleetrk utilities, net profit aftPr laA<·s (Fe<l. Res.) I
mil. of doL_ Transportation a.n(l communication~ (f't>t' pp. S-23 ancl
S-24).
SECURITIES ISSUED
Seeurities and Exchange Commission: Estimat.Pd gross proceeds, totaL _________ mi\. of doL_
By typ<• of seenrity: Bowls and notes, totaL ___________________ do ___ _
Corporate ______________________________ .do ___ _ Oommon stock ____________________________ do ___ _ PrPf<'rred stock ___________________________ .do __ .
By tyJW of issuer: I CorporatP, tot.al\;1 _________________________ (lo ___ _
Manufacturmg __________________________ do ____ l E'tractive (mining) ______ ----------- ____ do __ __
k~:m~"~~~i~~t:-_ ~~~::: :::::::::::::::::::: :~l~:::: Communication _________________________ do ____ l Financial and real estate. ____________ ... do ___ _
Noncorporate, total 'I __ --------- _________ .do __ --~ U.S. Government.--------------- ______ .do ___ _ State and municipaL ____________________ do ___ _
New corporate security isstws: Estimated net proceeds, totaL ______________ do .... l
Propos<•d uses of proceeds: I :\ew money, totaL ______________________ do ___ _
Pbnt mHl N)uipnwnt __________________ do ___ _ Working capitaL_------- _____________ do ___ _
Rl'tin•mcnt of securitiE's _________________ do ___ _ Other purposes __________________________ do ___ _
State and municipal issues (Bond Buyer): Lo11g-trrrn _____________________________________ do ___ _ Short-term __________ --------------- ___________ do. __ _
SECURITY MARKETS
Brokers' Balances (N.Y.S.E. Members I Carrying Margin Ac<"onnts)
Cash on hand and in banks ________________ mil. of doL_ Customers' debit balances (net) _________________ do __ __ Custorrwr~· free errdit balanres __ • _______________ <lo ____ l ~foncy borrOI\'Cd _____________________________ -- .do.--- i
Bonds 'I Pric('s: Av<'ruge .Price of all listed bonds ()J,Y.S.E.).
D~~~~~k~:::::::::: ::::::::::::::: :~:::: :~o,Vg~~:: i ForPign ____ ----------------- ________________ flo ___ -~
Standard and Poor's Corporation: Industrial, utility, and railroad (A !+issues):
Composite (21 bonds)<i' ____ dol. per $100 bon<L_I Domestic municipal (15 bonds) ______________ do ___ _
U.S. Treasury bonds, taxahle, _________________ do ____
1 Salrs:
Total. excluding U.S. Government bonds (SEC): , All re!(istercd exchanges: I
Market valuc ___________________ thous. of doL_ Faee value ______________________________ do ___ -\
)Jew York Stock Exchange: I Market value ____________________________ do ___ _
K ew ~~~k v~l~~k- EXCll:iUge~- eXCil1SiVe- -of -st,o(i~P(~,I-sales, face value, total§ ____________ t.hous. of doL_
1
U.S. Government.---------------------- ___ .do ___ _ Other tllan U.S, Government., total§ ________ do __ __
~g;~i~~:~-:~::::::::::::::::~::::::::::::: a~:::: 1
Value, issues listed on N.Y.S.E.: ~-
MIJ~%~;;~~~~:-~~~~~-~~~-:~s-~~~-§::::::::::~~~--o;1g:'~:: Foreign ____________ ----- ________________ -_-_ .do_-- ··1
Face value, total, all issues § ___________________ do ____ l Domestic ___________________________________ .do ___ _ Foreign ______________________________________ do ___ _
l r Revised.
476 783 147 124 :l24
133 219 301
9.5 441 :l9o
2, 050
390
l, 899
l. ()44 7411 204
51
I. ()1)1)
241 14
281 11
104 Hi2
~99 370 148
983
820 M2 278 o3
100
448 243
357 3, 431 I, 159 2, 300
91.28 91.41 ~0. 88
H8. 7 102.3 ~.90
lti5, 314 lf>S, fi:lG
Ili3, 1)71 156, 751
135, 87'1 0
135.872 129,349
li .• l)~3
105, 801) 103, 2!i6
1, 475
115,981 112, 9t)i)
!, R2:l
5, IllS 724 l21l
31)
SS.1 ](19
19 302
21 :l.5
221)
4, 894 3, 971
fl39
8ti9
794 490 304 29 41i
374 3, 452 l, 226 2, 221
90.99 91.12 81.67
98.1 101.8 87.M
173, H45 173,744
170, :!34 lll4, 9Rl
148 943 I ' I
148,942 142, 3()1
(i, 577
lOt\, 401 103, 7ti8
1, 515
IW, 934 113,883
1, 855
FINANCE-Continued
2,1321
I, 843 481 234
.),)
770 1:J2
4 191 24 fi3
llli
1. 3G2 420 881
I
764 1
HOO 41il 139
9 14.5
881 428
374 :J, 410 I, 196 2, 18G
Vl.liO 91.72 82.14
98.0 102.2 ~7. 38
l I
144. 5.10 1 139,007
142, ()()(i 137, 114
121, tili7 0
121,607 114,413
7, 2.54
107,215 104, 573
I, 525
494 G58 104 135 374
100 223 246
71 523 374
l, 839
4fi9
l, 9'21
l, 723 457 !51 47
656 100
lO 336
7 10
107
l, 266 443 fi37
040
539 405 135
9 92
li37 295
379 3, 458 1, 257 2,195
91.03 91.!6 82.27
98.2 103.4 87.37
199,318 175,922
19tl, 941 173, 4GG
150, 585 0
150,585 143, 741
6, 844
106,638 103, 96G
1, G64
117,052 117, 142 114. 009 ' 114, 053
I, 856 I 1, 901
---------1---------
~ ~~ ~~~ ~~ r ~ ~ ~~ ~ ~ ~ 1---------1
.511 I l, 787
4, 202 l' .182 619 H24 217 167
92 38
928 829 290 21i6
9 25 320 :J48
17 20 16 i)
143 108
3, .183 958 2, 583 :l38
940 569
908 809
832 71i4 ()12 55tl 220 208
9 17 Of) 27
940 i>69 563 411
359 3, 51i7 1, 205 2, 408
90.02 90.14 82.63
97.0 102.2 Sfi. 21
!68, 307 152, 583
lf>5, 2liG 149,690
137,284 0
137,284 131,689
5, 595
106,004 103,343
I, 574
117,751 114,652
1, 905
3li4 :l, 549 I, 188 2, 411
89.60 89.64 87.42
95.0 100.4 85.31
157, 377 !38, 9!4
155, 137 136,747
119, 101 0
119, 101 114, 538
4, 553
106,396 102,770
2, 539
118,746 114,647
2, 905
li07 021 231 174 .152
164 400 296
88 592 4.59
l, 8.16
:!85
2, 275
1, 978 614 254
43
910 236
15 317
20 22
100
1.3li4 323 995
890
814 5.57 257 I !I liO
99:) 24:)
31i3 3, 546 1, 094 2, 483
89.17 89.19 87. R8
94.0 99.4
85.16
149, 949 140,655
147, 850 138, 682
121. 94~ 1
121,943 115,870
6, 072
105,872 102,219
2, 569
1, 452 1, 688
1, 334 1, 558 433 623
93 117 26 13
552 753 155 146
9 14 173 194
9 19 8 36
118 228
~00 93i\ 350 309 457 523
538 737
4SO li77 :J05 307 175 310
7 19 51 42
·t.57 52:) 246 41\7
383 3, .128 1, 079 2, 433
89.32 89. 31) 87.08
93.8 99.4
85.00
I
374 3, 424 1, 035 2, 416
ss. 22
88.221 ~7. 24
94.3 ' 100.6 85.11
147, 62.5 1 135, 44s 140, 515 131, 301
146. 184 133, 845 1 138, 794 129, 438
121,325 0
121,325 115, 512
5, 813
106, 135 102, 511
2, 538
110 616 ' 0
1!0, GIG 105, 16ti
5, 449
103,924 101,25:3
I, 585
118, 725 118, 822 114, 007 114, 711
2. 923 1 2, 914
117, 895 114. 776
1, 922
.)62 ()56 215 !Iii
-sn 187 34.1 291
61 22\l .140
I,Xfi2
I, 749
], 605 592 120 24
736 211\
23 111
5 fl7
llil
\,\)\3 300 520
721
-lOR 257
12 H
;")21) :J99
:J/7 :l,~Oti I.O:l\1 2, :)~()
lS7. 71 87. 79 81.80
93.0 98.3
s:J. v;
!5(\, 380 153,568
1.14. 805 151.824
145, 137 0
145, 137 140,018
5,119
103,473 100, 826
1, 573
117, 9ti7 ll.4,R41i
I. 923
-----:--~·----·---
1
------ -- :::::::::1::::::::·
'4, 122
'3, 844 r fi44 '231 '48
'923 '103 '22
'348 '23 128
f 145
'3. 21)0 2, 574
[)87
r ~~~/ r 633 r Hit\
11 '8~
T 1, 735
r 1, 500 r 059 '173
r 61
'893 '121 '12
'251 '6
T 264 '171
'841 332
'458
'873
'803 r fi33 r 170
8 r(j2
f'1Hi 427 ~:;;; 342
:lt'O 3.378
91i7 2,105
88.85 '8. 95 81.61
92.8 100.1 84. 9.1
143, 838 145, 7W
141, 2\JO 143,316
123,33:3 0
123,:333 ll8, fili8
4, 665
]()(j,899 104.223
1, 589
120,319 117, 171
I, 947
372 3,438
974 '2, 493
88.42 88.52 81.32
92.9 100.9 R4. 82
1~2. 2.52 141i.l\31
13:1,702 144.516
130,050 11
130,039 124,668
5,371
JOG, 499 103,826
1, 582
120,441 117,291
1, 945
1, 982
1, 796 783 134 52
91i9 179
17 351
3 72
216
1.013 380 471i
950
8811 fi31 256
14 50
375 3,427
997 2, .183
87.48 87. 5fi 81.18
92. ~ 99.3
83.00
173, 204 177,57-l
170.098 174,505
155, 742 0
155, 742 150, 433
5, 309
105, 422 102,723
l.t\17
120,508 117, 311
1, 992
OSee corresponding note on p. S-18. ~Includ<"s data not shown sepnrat<'ly. §Data include honds of the Int<>rnational Bank for Reconstruction and Development not shown separately; t.JJL>sc bonds are included in computing the average price of all listed honds. <i'Numher of bonds represent number currently used; the chan)';c in the number dO<•s not affect the continuity of series. ,Prices a.rf:l derived from averagE: yields on basis of an assumed 3 percent 20·yrnr bond.
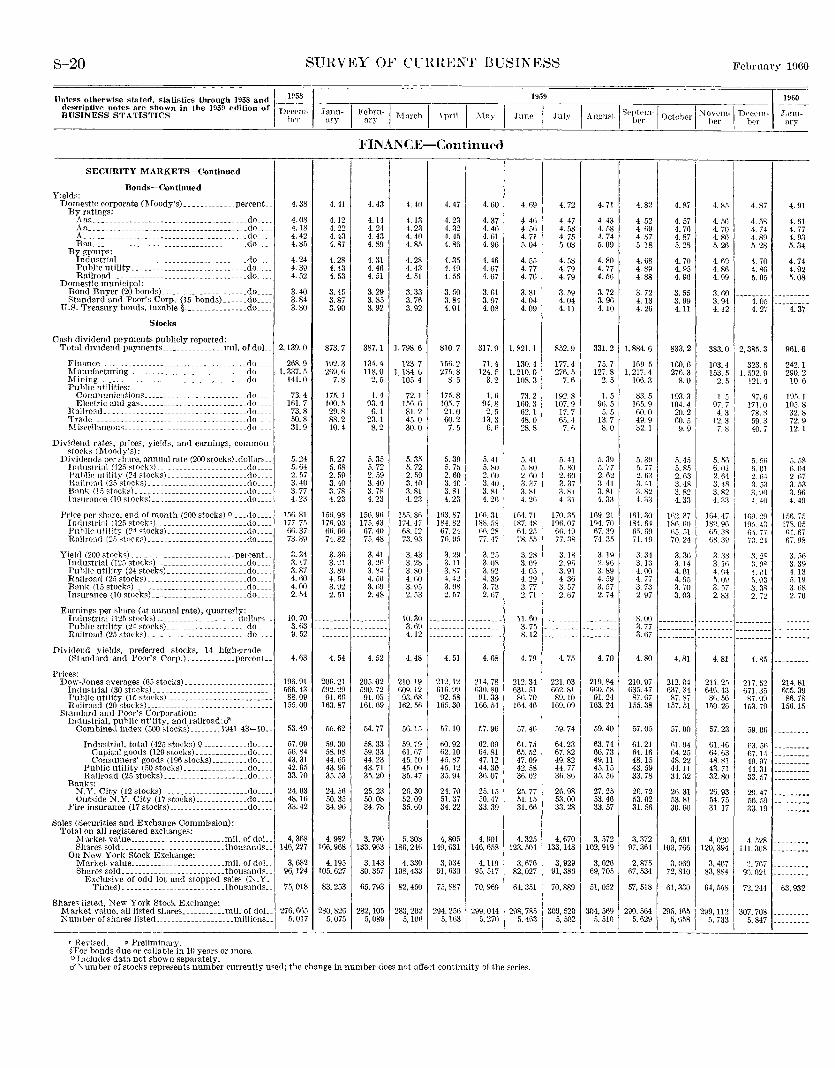
S-20 SUHVEY OF CUHRE~T BUSINESS
Unless otherwise stated, statistics through 1958 and 1_2-q~~ I d('S('riptivc notes are shown in the 1959 edition of DPCf'Ill~ BUSINESS STATISTICS brr
SECURITY MARKETS-Continued
Bonds-Con tinned Yields:
Domestic corporate (Moody's) ___________ .percent. By ratings:
A aa. ____ ----------------------- ___________ do ___ _ 1\a _________ ---------------------------- ___ do_ A _________________________________________ do. __ _
Baa. ____ ---------------------------- _____ .do By groups:
IndustriaL ________________________________ do Public utility ____________________________ .do Railroad. ________________________________ .do.
Domestic municipal: Bond Buyer (20 bonds) ______________________ do .... Standard and Poor's Corp. (15 bonds) ...... do __ __
U.S. Treasury bonds, taxable § ________________ do ....
Stocks
Cash dividend payments publicly reported:
4.38
4.08 4. 18 4. 42 4. 85
4. 24 4. 39 4. 52
3. 40 3. 84 3. 80
Total dividend payments.. ______________ mil. of doL 2,139. 0
Finance __ " ___________ ---------------- _______ do ___ _ Manufacturing _____________________________ .do. __ _ Mining _______________________ --------- ___ ... do. __ _ Public utilities:
Communications _____________ -------- _____ do __ _ Electric and gas .. -------------------- _____ do. ___
Railroad .. _____ .. _________________________ .. do __ __ 'l'rade _______________________________________ do ___ _ 1\1 iscellaneous. _______________ .. ___________ .do ___ _
Dividend rate;:;, prires, yields, and earnings, cornmon stoeks (Moody's):
Dividends per share, annual rate (200 stocks) .dollars._ Industrial (12.> stocks) ____________________ do ___ _ Puh1ie utility (24 stocks) __________________ .. do .. __ Railnla•l (25 stocks) _______________________ .. do ... Bank (li\stocbL. _________________________ do ____
1
Imnranee (10 stocks). _____________________ .. do .. __
Price per sh:u·c, end of month (200 stocks)\? ... do __ __ Indnstrinl (12/i stocks) _______________________ do ___ _ Public utility (21 stocks) ____________________ do __ __ Railroad (2.1 stm,ks) _________________________ cto ___ _
Yield (200 stocks) ___ .. _________ ------------ .percent.. Industrial (12.> stocks) ______ --------------- .. do. __ _ Public utility (24 stocks) ____________________ do .. .. Railroad (2!'i stocks) _________________________ do .. .. Bank (15 stocks) ________ ---------------- ___ .. do ___ _ Insurance (10 stocks) ________________________ do .. __
Earnings per share (at annual rate), quarterly: In<lustrial (125 stocks) ____ .. _ .. ____________ dollars __ Public utility (24 stocks) ____________________ do __ Railroad (2.1 stocks) _________________________ do ___ _
Divi<lend yields, preferred stocks, 14 high-g-rade (f'tandard and Poor's Corp.) ____________ percenL.
Priees: Dow-Jones averages (65 stocks) ____________________ __
Industrial (30 stocks) _____________________________ _ Public utility (15 stocks) ______ .. ___ ------------- __ _ Railroad (20 stocks) ___ .. ________________________ __
Standard and Poor's Corporation: Industrial, public utility, and railroad:d'
Combined index (500 stocks) ________ l941-43=!0 ..
Industrial, total (425 stocks)\? ___________ do __ __ Capital goods (129 stocks). ____________ do ___ _ Consumers' goods (196 stocks) _________ do ....
Public utility (.00 stocks) ______________ .. do __ __ Railroad (25 stocks) _____________________ cto ___ _
Banks: N.Y. City (12 stocks) _____________________ do .. .. Outside N.Y. City (17stocks) _____________ do .. ..
Fire insurance (17 stocks) ____________________ do .. ..
Sales (Securities and Exchange Commission):
26S. 9 1, 337. 5
141.0
73.4 161. 7
73.8 50.8 31.9
5.2•1 .5.6'1 2. 57 3. 40 3. 77 4. 23
151l.81 177. 7!i
()(), 37 73.89
3. 34 3.\7 3. 87 4.60 4. 00 2. 54
10.70 3. 63 9. 52
4. 63
196.91 5fifi. 43 88.09
155.00
53.49
57.09 56.84 43.31 42. 0.5 33.70
24.03 48.16 33.42
January
4. 41
4.12 4. 22 4. 43 4.87
4. 28 4.43 4. 53
3. 45 3. 87 3. 90
873.7
192.3 269.6
7. 8
175. I 100.5 29.8 S8. 2 10.4
5.27 5. 68 2 .• 19 3. 40 3. 78 4. 23
1.1fl. 9R 17f>. g~ 06.60 74.82
3.36 3. 2\ 3. 8fJ 4. !)4 3. 92 2. 51
4. 54
206.2\ :!92.29 91.66
163.87
55.62
59.30 58.98 44.65 43.96 35. 53
24.56 .10. 35 34.96
195!1
F~:~~:n-ll\1 arc;~l-~\~,: I :.lay -T June -~ July
FINANCE-Continued
4. 43
4.14 4. 24 4. 43 4. 89
4. 31 4. 46 4. 51
3.29 3. 85 3. 92
4. 40
4.13 4. 23 4. 40 4. 85
4. 28 4. 43 4. SJ
3.33 3. 76 3. 92
387. 1 1, 798. 6
134. 4 118.0
2. 5
1.4 93.4 6.1
23.1 8.2
5. 35 5. 72 2. 59 3. 40 3. 78 4. 23
156.90 175.43 07.40 75.48
3. 41 3. 21l 3. 84 4. 50 3. 69 2. 48
4. 52
20.5. 02 590.72 91.03
161. G9
54.77
58.33 59.33 44.23 43.71 35.20
25.23 .10. 08 34.78
123. 7 1. 184.6
105.4
72. 1 156.6 81.2 4.5. 0 30.0
5. 35 5. 72 2. 59 3. 40 3. 81 4. 23
155.81\ 174.47 fi8. 12 73.93
3. 43 3. 28 3. 80 4. fiO 3. 95 2. 53
10.30 3. f\9 4.12
4. 48
210.19 009.12 93.68
162. 5fi
56. 1.1
59.79 61. G7 45. 10 45.0f\ 35.47
26.30 52.09 35. GO
4. 47
4. 23 4. 32 4. 4.5 4. 86
4.35 4. 49 4. 56
3 . .10 3. 84 4.01
810.7
150.2 275. 8
8. 5
175.8 105.7 21.0 60.2
7. 5
5. 39 5. 7.1 2. 60 3. 40 3. 81 4.23
lll3. 87 184.82 67.24 7(1. n.~
3. 29 3. 11 3.87 4. 42 3. 98 2. 57
4. 51
212.12 ll16. 99 92 .. 18
165.30
57.10
nO. 92 62.10 45. 87 45. 12 35.94
24.70 51.37 34.22
4. 60
4. 37 4. 4f> 4. 61 4. 96
4.46 4.67 4. 67
3. 61 3. 97 4. 08
4. 69
4. 46 4.5fl 4. 71 5. 04
4. 55 4. 77 4. 76
3. 81 4. 04 4. 09
317.9 1, 821.1
71. 4 130.4 124. 5 1, 210. 0
3. 2 108.3
I. 6 73.2 94.8 160.3
2. 5 62.1 13. 3 48.0
6. 6 28. 8
5. 41 5. 80 2. GO
3. 40 I 3.81 4.26
1f.fi.31 188. 58
GO. 2R 77 . .t7
3. 2?5 3.0S 3. 92 4. 39 3. 73 2.G7
4. 68
214.78 f.30.80 91.33
166.54
57.96
62.09 64.81 47.12 44.30 36.07
25.15 50.47 33.39
5. 41 5. 80 2. r.o 3. 37 3. s1 I 4. 2()
lf>4. 71 1R7. 4R 04.25 'i'.S. 5i'i
3. 28 3. 09 4. 0.1 4. 29 3. 77 2. 71
11.60 3. 75 8. !2
4. 79
212.34 631.51 86.70
104.40
57.46
61.75 65.52 47.09 42.58 3fl. 02
25.77 51.15 31.66
4. 72
4. 47 4. 58 4. 7.5 5. 08
4. 58 4. 79 4. 79
3. 59 4.04 4.11
852.9
177.4 27fl. 5
7. 6
192.8 107.9 17.7 65.4
7. 6
5. 41 5. 80 2. fiO 3. 37 3. 81 4. 31
170. 3:> 19fi.07 66. 49 77. 3.S
3. lH 2.96 3. 91 4. 36 3. 57 2. 67
4. 75
221.03 ti62.81 89.10
1G9. 09
59.74
64.23 67.82 49.82 44.77 36.86
26.98 53.00 33.28
February lnGO
- I 1960 -
I August ISeptem-1 October I Novern-1 Drc~m- -J;nu-ber her h('l' ary
4. 71
4 43 4 58 4. 74 5. 09
4.80 4. 77 4. 56
3. 72 3. 96 4.10
4. 82
4. 52 4. r,g 4. 87 5. 18
4. 68 4. 89 4. 88
3. 72 4.13 4. 2(1
331.2 1,884.6
75.7 127.8
2. 5
1.5 96.5
5. 5 13.7 8. 0
5. 39 5. 77 2. 62 a. 41 :J. 81 4. 3:1
169.21 194.70
fl7. 39 74.35
3.19 2 96 3. 89 4. 59 3. 57 2. 74
4. 70
219.84 660.58 91.24
163.24
59.40
63.74 66.73 49.11 45.15 35.56
27.25 53.413 33.57
169. 5 1, 217. 4
\06.3
8~. 5 165. g
f\0. 0 49. g 32. 1
5. 39 !S. 77 2. 6:1 3. 41 3. 82 4. 33
161.30 184. f\4
(i.~. 09 71. 49
3. 34 3.13 4.00 4. 77 3. 73 2. 97
8.00 3. 77 3. 67
4.80
210.97 635.47 87.67
155.38
57.05
61.21 64.16 48.15 43.59 33.78
2fl. 72 53.02 31.56
4.87
4. 57 4. 76 4. 87 5. 28
4. 70 4. 95 4. 96
3. 55 3. 99 4.11
833.2
160.6 27f.. 3
8. 0
193.3 104.4 20.2 60.5
9. 9
5. 45 5. 85 2. G3 3. 48 3. 82 4.33
lfl2.37 !86. r.o
f>5 .• 11 70.24
3.36 3.14 4. 01 4. 95 3. 70 3.03
4. 81
212.04 637.34
87.87 157.51
57.00
61.04 64.25 48.22 44. 11 34.32
26.31 53.81 30.60
4. 85
4. 56 4. 70 4. 8fi 5. 26
4. r,g 1.86 4. 99
3. 60 3. 94 4.12
4. 87 4. 91
4. 5~ 4. 61 4.74 4.77 4. R9 4. 93 5. 28 5. 34
4. 70 4. 74 4. Sf\ 4. 92 5. 05 5. 08
4. 05 4. 27 4. 37
383. 0 2, 3S5. 3 961.6
242. 1 290.2
103.4 153. ,)
2. 5
1.5 97. 7
4. 3 12.3
7. 8
5. 5r. 6. 01 2. 04 3. 48 3. 82 1. 33
lH 47 189. gr,
0.1. 3H 08. 3H
3.:33 3. 1fi 4. 04 5. 09 3 . .57 2. 83
4. 81
211. 25 646.43
Sf\. 56 1.50. 26
57.23
61.46 64.63 48.81 43.71 32.80
26.93 54.75 31.17
323.6 I. .502. 9
121.4
87.6 171.0 78.8 59.3 40.7
5. f)f)
6. 01 2. f\4 3. 53 3. 90 4. 40
HN.2fl 19''· 43
!):). 77 70. 2!
3. 2.'. ?>. n~ 4. OJ 5. 03 3. 38 2 -·)
4.8.5
217. 52 671.35
87.09 153.79
59.06
('3. 56 67. J.l 49.97 44.31 33. 57
29.47 56.59 33.19
10.6
195. 1 105. 8 32.8 72.9 12. 1
5. 58 fi. 04 2 67 3 .. 53 3. 96 4. 40
1fifi. 73 178. 05 IH.07 ()7. 98
3 . .or. 3. 39 4.13 ;;, 19 3 fi8 2. 70
214.81 6.15. 39
Sf\. 78 156. 15
Total on all registered exchanges: 1-·larketvalue .. ______________________ mil.ofdoL 4,368 4,982 3,790 5.30S 4.805 4,901 4,325 4,670 3,572 3,372 3,591 4,020 ·1.528 Shares sold __________________________ thousands .. 146,227 166,968 133, 9G3 186,246 149, G31 146,658 123,504 133,148 102.919 97,364 103,766 120,394 141.308
On New York Stock Exchange: Markctvalue .. ______________________ mil.ofdoL 3,682 4,195 3,\43 4.330 3,9:l4 4,119 3,676 3,929 3,026 2,875 3.069 3,407 :0.767 SharessoJd __________________________ thousancts .. 96,124 105,627 80,357 108,433 91,630 95,517 82,027 91,386 69,705 67,534 72.810 83,88·1 9:1,021
Exclusive of odd lot and stopped sales (::\'.Y. Times) __________________________ thousands__ 75,018 83,253 65,793 82,450 7.1, 887 70,969 64,351 70,889 51,052 57,518 61,330 64,558 72,2-11 63,932
Shares listed, New York Stock Exchange: Market value, all listed shares ___________ mil. of doL 276,665 2SO, 826 282,105 2S3, 202 294,256 299, OH ::--Jumberofshareslisted ____________________ millions.. 5,017 5,075 .5,089 5,106 5,163 5,270
r Red.sed. P Preliminary. ~For bonds due or callable in 10 years or more. 9 Inelmles data not shown separately.
298, 785 309, 520 304, 5n9 5. 463 I 5, so2 s. 5Io
d'Xumber of stocks represents number currently used; the change in number does not affect continuity of the series.
290,564 5, 629
29.1. lfi5 299, 112 307. 708 5, 658 5, 733 5, 847
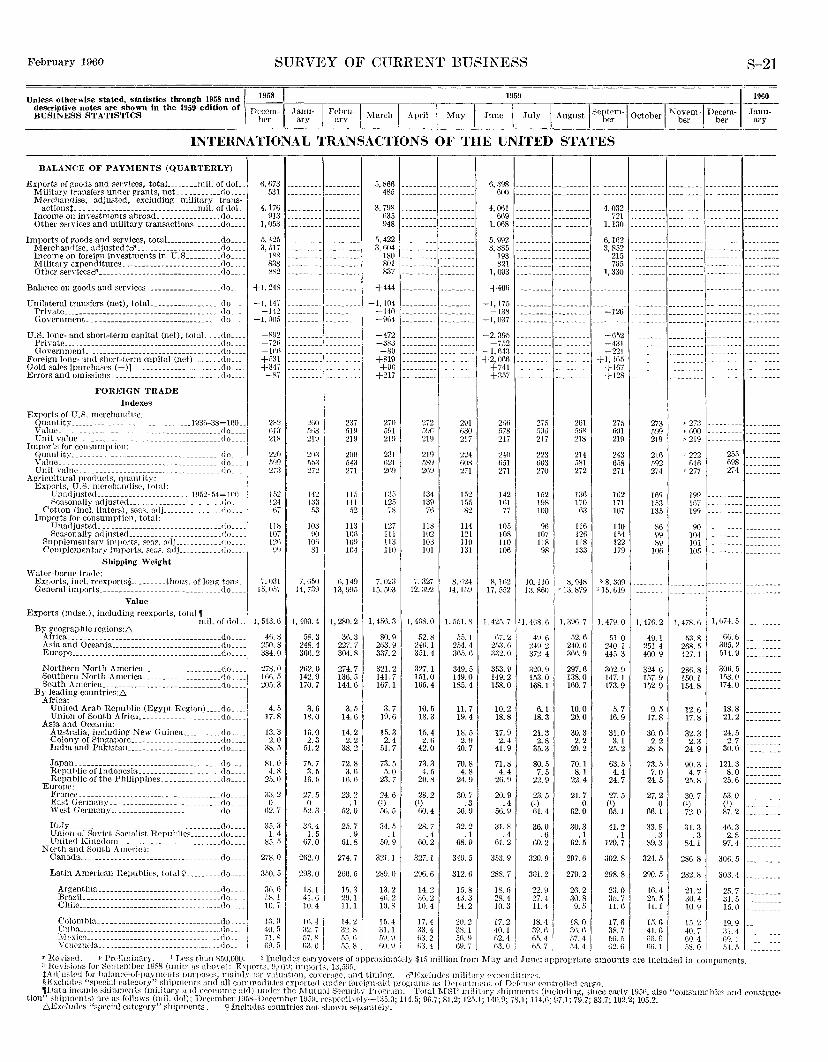
February 1960 SURVEY OF CURRENT BUSINESS S-21
1960 ~~~~--~~~~~~---~---~---~--~---~---17%_9 ___ ~--~---~---~--~~--~1-descriptive notes are shown in the 1959 edition of I !)(•ccnr~ I Jor111 I Ffihru I I I I I I •ugu··t I Se]ltem-j October I ~ove.m ., Deccrn- .Tanu-BUSINESS STATISTICS · " - ' - :\larch April
1 May June July ~~ ' · her ary nry
1 ' ber ber , ber ary
INTERNATIONAL TRANSACTIONS OF THE UNITED STATES
BALANCE OF PAYMENTS (QUARTERLY)
Exports of goods and services, tota]__ ______ rniL of doL Military transfers under grants, net ___________ cto ___ _ Mrrchandise, adjusted, excluding military trans-
actions~- ______________________________ miL of dol Income on investments abroad ________________ rlo ___ _ Other services and military transactions _______ do ___ _
Imports of goods and services, totaL _____________ do ___ _ Merchandise, adjustcd~d' _____________________ do ___ _ Income on foreign inYestments in u.s _________ dQ ___ _ Military expenditures __________ ----- __________ do ___ _ Other servicesd' ---------------------------- ___ do ___ _
Balance on goods and scrvices ___________________ do __ _
Unilateral transfers (net), totaL _________________ do Private ____ -------------- _____ -------- _____ --· __ do_ Government_ _________________________________ do
U.S. long- and short-term capital (net), totaL ___ do ___ _ PriYate ________________________________________ do ___ _ Government_ __________________________________ do ___ _
Foreign long- and short-term capital (net) _______ do __ _ Gold sales [purcha.<es (-)] _______________________ flo __ __ Errors and omissions ____________________________ do ___ _
FOREIGN TRADE lndexe~
Exports of U.S. merchandise: Quantity__________________ _ _______ 1!136-38= 100 __ Value ___ -----------_____ _ __________________ do ___ _ Unit value ____________________________________ do __ _
Imports for consurnption: Quantity ______________ .. _________ ---- __________ 0 o_--Value. ________________________________________ do __ _ Unit \·a]ue ____________________________________ do __
A~Ticultnral proctucts, quantity: Exports, U.S. mcrchandis<.\ t.otn.l:
Unadjusted _______________________ . 1!152·54= 100. Seasonally actjusted___ _ _______________ (!o_
Cotton (incl. linters), seas. adj _______________ <lo __ __ Imports for consumption, total:
Unadjusted _______________________________ <lo ___ _ Seasonally adjusted _______________________ .do_
Supplementflr:v imports, sf•a:-:. udj ____________ do __ _ Complcmentury imports, seas. adj __________ .do ___ _
Shipping Weight
Water-horne trade: Exports, incl. recxports§ _________ thous. of long tons __ General imports _______________________________ do ___ _
Value Exports (mdse.), including reexports, total,
mil. of dol By geographic regions:6
Africa _______________________________________ do_ Asia and Oceania ____________________________ <lo ___ _ Europe ____ -------------------------------- __ do ___ _
Northern North Alnerica ____________________ do ___ _ Southern North America ____________________ do ___ _ South America ______________________________ (jo __ __
By leading countries:f', Africa:
United Arah Republic (Egypt Hogion) ____ do ___ _ Union of South Africa ______________________ clo ___ _
Asia and Oceania: Au~tralia, including New Guinea __________ do ___ _ Colony of Sing-apore _______________________ do ___ _ India and Pakistan ________________________ (]o ___ _
Japan __ ---------------------------------- _do ___ _ Republic of Indonesh _____________________ do ___ _ Hepuhlic of the Philippines. ______________ do ___ _
Europe: France ____________________________________ do ___ _ East Germany ____________________________ do_ ·--\Vest Gcrnmny -------------- ______________ <1o ___ _
Italy _______________________________________ do ___ _ Union of SoYiet Socialist RrpuHic~ ________ do ___ _ United Kingdom __________________________ do ___ _
North and South America: Canada ________________________ -·--- _______ do ___ _
Latin American Republies, total'( ________ do ___ _
Argentina _______________________________ do __ ._ Rrazil_ ----------------- _________ --- _____ do ___ _ Chile _______________________________ ._ do __ __
6, fl73 531
4,176 013
1,053
fi. 42.) 3, 517
1~R
838 8'2
+1.248
-I, 147 -142
-1,005
-892 -72fi -ltiH +53\ +347 -k7
2"~:2
fil3 218
118 107 12fi !N
7,0:H 15, Of)7
I, 513.6
4G. 8 25(1. 8 384.0
278.0 lfi6. 5 20.), 3
4. 5 17.8
13.3 2. 0
38.5
81.0 4. 8
2.?. ()
33.2 0
(i2. 7
35,3 1.4
85.5
278.0
350.5
30, () 5X. 1 10. 7
J:l.!l 40.5 71.8 C9. ;j
7, (i50 14, 739
1, 400.4
58.3 248.4 3fifi. 2
262.0 142.9 170.7
3. 6 18.0
16.0 2.3
51.2
75.7 3, 5
16.5
27.5 ()
52.3
3fi. 4 1.5
G7.0
2fi2.0
293.0
18.1 41. () HI. 4
\(\, 4 32.7 57. ,R fi3. t) 1
Z:l7 .119 219
200 543 271
115 111 -52
113 lOti 10'1 104
6,149 13, H!J5
I, 280.2
31\.3 227.7 304.8
274.7 136.5 144.6
3. 5 14.6
14.2 2. 2
38.2
72.8 3, 6
16. 6
23.2 .1
52.0
25.7 .9
GL8
274.7
260.5
15.3 29.1 11.1
14.2 :12, 8 ,)5. ii 55.8
5, 866 485
:J. 798 fi35 948
5,422 3, 604
180 801 837
+444
-1,104 -140 -9114
-472 -3~:J -89
+819 +Hfi
+217
2711 5!!1 2l!J
127 111 113 110
7. o2:J 15. 5tl3
1, 45ll. a 80.9
2H3. 9 337.2
321.2 141.7 167.1
3. 7 19.6
15.3 2. 4
51.7
73.5 5,0
23.7
24. tl (') 50.5
34.5 .1
50.9
321. I
2S9.0
13.2 4(\.2 10."
15.41 31.1 .10. n f.O. !I
272 .)f)(i
2HI
219 5S!J 209
134 139
7(i
118 102 103 1111
/, 327 12, 392
1, 468.0
52.8 24ti.l 351.4
327.1 151.0 1G5. 4
10.5 18.3
15.4 2. 6
42.0
73.3 4. 5
20,8
28.2 (') ()0,4
28.7 .4
G0.2
327.1
296.6
14,2 3(). 2 10.4
17.4 :l:l. 4 n:J. 2 c:t 4
291 li30 217
224 nos 211
t;)2 105 82
114 121 110 131
8. I'24 14, 159
1, .151. s
55.1 254.4 365,6
349.5 149.0 185.4
11.7 19.4
18.5 2.9
40.7
70.8 4. 8
24.9
30.7 .3
.10. 9
32.2 '1
68.9
349. 5
312.6
1.5. 8 4:J.3 14,2
20.2 3R, I .1ft n GU. 7
fi,:·W8 600
4, O'll 6!19
I.Of\8
.1, 992 3, 885
193 821
1,093
+406
-1,175 -138
-1,037
-2,395 -752
-1,04:1 +2,01>6
+741 +357
240 ti51 271
142 ltH 77
105 108 110 106
275 P)Of) 217
223 60:! 270
152 198 100
96 107 118 98
8, 11>2 10, 110 17,552 13,8till
1. 42,), 7 'I, cj(\8, \l
fi7. 2 4q. () 25:3. (\ :tt!J. 2 332.0 372.4
353.9 149.2 158.0
10.2 18.8
17.9 2.4
41.9
71.8 4. 4
26.9
20.9 .4
51>. 9
31.8 .4
GL2
353.9
288.7
18,6 28.4 10.3
17.2 40. 1 r.2. 4 n3. o
320.9 153.0 168.1
6. 1 18.3
21.3 2. 8
35.3
80 .. ? 7. 5
22.9
23.5 (1) 61.4
36.0 .6
60.2
320.9
301.2
22.9 27.4 11.4
18.4 3H. 6 r.s. 4 G5. 7
20\ ,\f>~ 218
214 .181 272
l3(i 170
()3
116 1211 118 133
4,032 721
1,130
t\ 102 3, 852
215 765
1,330
-126
-652 -1:31 -221
-H, 1'•5 +H17 +1~8
27,\ flO! 219
243 658 271
1G2 171 107
140 1.14 122 179
~. n4s ' 8, 309 ' l:l, 879 3 15, f.19
1,396. 7
,;2, 6 240. fi 3tifi. 9
297.6 138.0 lfiO. 7
10.0 20.0
30.3 2. 2
29.2
70. 1 8.1
22.4
21.7 0
52.0
30.3 . 1
62.5
297.6
279.2
20.2 30.8
g_ 5
18.0 ;)().()
~7. 41 n4. 4
1. 479.0
fil.O 240. 1 445.3
302.9 147. 1 173,9
5. 7 16.9
31.0 3.1
25.2
63.5 4.4
24.7
27.5 (') 65.1
41.2 '1
120,7
302.8
298.8
23.0 35.7 11.6
17,6 38.7 [;{)_i)
C.2. G
2i3 599 219
21() fi92 274
1f>9 15:1 135
86 99 8\1
106
1, 476.2
49. 1 251.4 400.9
324.6 1S7. 9 152.9
9. 5 17.8
30.0 2. 2
28.8
73.5 7. 0
24.5
27.2 0
66.1
33.8 .3
89.3
324.5
290.5
16.4 25.5 IL 1
15. G 4LG ()i)_f;
f\G.l
---------~----------- ---------------------- --
l' 2ja I' 600 /) 219
19!) 11)7 199
no 104 101 105
::::::::1
1. 478. ()
53.8 2G8. 5 427. 1
286.8 150.1 154.8
12.6 17.8
32.3 2. 3
24.9
90.3 4. 7
25.8
30.7 (I) 72.0
31.3 .3
84.1
286.8
282.8
21.2 30.4 !0. g
15.2 40. 7 flO 4 fi~. 0
25!) 6H8 274
(i6.6 305.2 514.9
306.5 153.0 174.0
18,8 21.2
24.5 2. 7
30.0
121.3 8. 0
25.6
53.0 (I) 87.2
46.3 2. 8
97.4
30(), 5
303.1
25.7 31.5 15.0
HJ.9 :11. 4 1>9. 1 .5-t. 5
"~cvisPd. v Prl'limin~ry. 1 Less than $50,000. 2 Includes carryovers of approximnt;:ly $15 ndllion from J\Iay and .June; n.pprol.)riatc amounts nre included in components. 3 ReYbions for Scpten:her H\58 (units tt" al:on~): Export.:;, H,tll\J; impvrts, 13,fl!lh. tA.djn:-:te•l for halance-of-pa;vmePts purpo~es, maintY for \·~llU~Jt.ion, eon'ra).!.l', an<i timing. Q'1Exdudes militnry expenditures. §Excludes "special cut(•p_:ory" shipments and an cummodU ies exported undrr fnrPign-aid programs as lkpn.rtmcnt of Defense c0ntrolle<l carg0. ,Data include shipm0nts (military and C'(•onomic air1) under the ~\1ut tul .Se·curity Program. reotal J\f8P militnry shipmrnts (intluding, :::;il1cc early 19Gf\ also "consumabks and con~truc ..
tion'' shipments) are as follovvs (miL dol): DccPmbcr 1H5~--Dec-mn1wr l\J5~), rCSIW(>ti·v·dy--1:-t1.0; 114.5; fJl:'l.7; 81.2; 125.1; 140.9; 78.1; 114.G; 97.1; 79.7; 83.7; 102.2; 105.2 . .D.Exdudc.s "special category" shipments. ? lnclwles countries not slHnrn sPparat.cly.
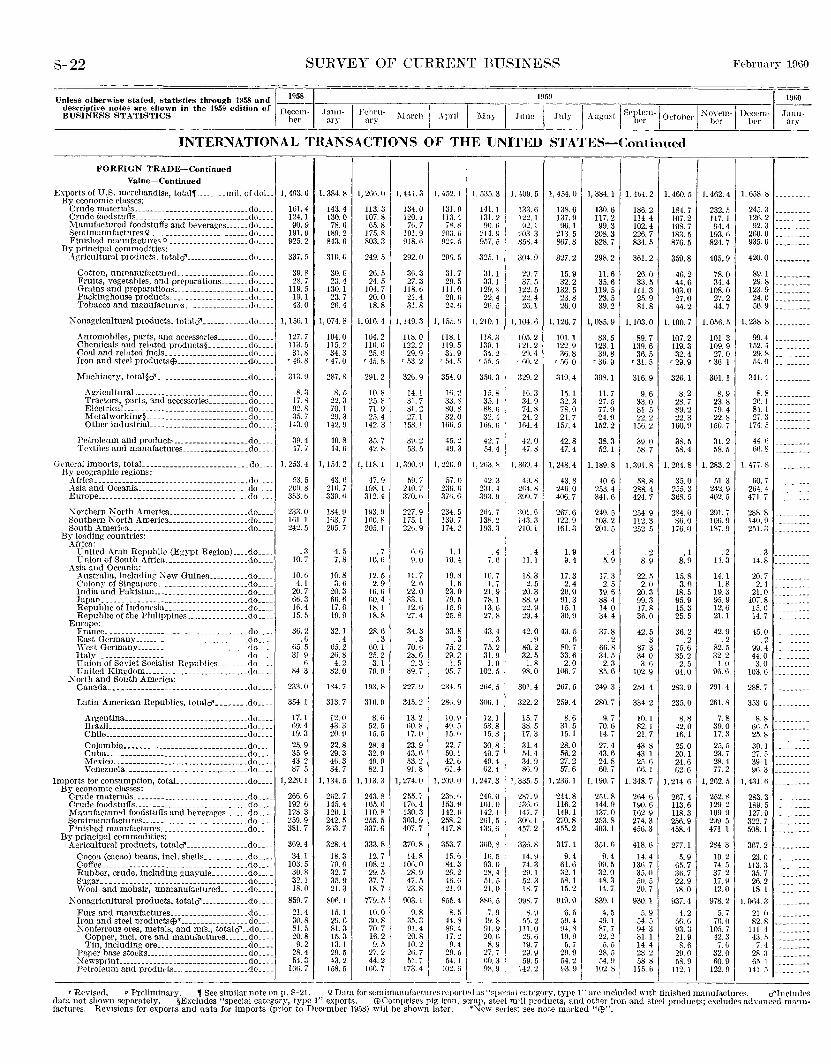
S-22 SUHVEY OF CURRENT BUSIXESS Febrnar;v 11!60
Unless otherwise stated. statistks through 1fl58 and ~~-~ descriptive notes are shown in the 1959 edition of Decem- Jai 1_ I F •l ru I I BUSINESS STATISTICS her ar'~' ~,:Y · j :llarcl!
1!159
1
1960
Augu~t I Septem-1 October I N ovem-1 Decem-~ · ber her her ary .\pril I May I June I July
INTERNATIONAL TRANSACTIONS OF THE UNITED STATES-Continued
FOREIGN TRADE-Continued
Value-Continued
Exports of U.S. merchandise, total, ........ mil. of doL. By economic classes:
Crude materials _____________ .------ ......... do. __ _ Crude foodstuffs. ____________________________ do ... . :lfanufactured foodstuffs and beverages ...... do ... . Semimanufactures <;! ____ --------------------.do ... . Finished mauufactures\1 .................... do ... .
By principal commodities: .~gricultural products, totald' ...... _______ ... do ... .
Cotton, unmanufactured __________________ do ___ _ Fruits, vegetables, and prepa.rations _______ do ___ _ Grains and preparations ___________________ do ___ _ Packinghouse products. __________________ do ___ _ Tobacco and manufactures ________________ do ....
1, 493. ti
161.4 124.1 90.9
191.9 925.2
337.5
39.8 28.7
119. 5 19.1 43.0
I, 384.8
143.4 !30. 0 78.6
189.2 843. {)
310.0
30.0 23.4
130.1 23.7 2(i.4
1, 2t.iH. 0
113. 3 107.8 (i5. 8
175.8 803.3
249.5
26.5 24. 5
104.7 20.0 18.8
1, 441.3
134.0 120. I
71i. 7 191.9 918.1i
292.0
36.3 27.3
118. 6 21.4 31.8
I, 452. I
131.9 113. 4
7X. t' :.203. ~i (/24. 5
29fl. 5
31.7 29.5
111.0 20. (i 24. (i
I, 535.3
141.1 131.2
90.1\ 214. g 9.17. 5
325.1
31.1 33.1
129.8 22.4 2(). 5
1. 409.5
133.6 122.1 92.1
203.3 85K4
304.9
29.7 37 .. 1
122.5 22.4 26.1
1. 454. 0
138.6 137.9 96.1
213.5 867.8
327.2
15.9 32.2
132.5 23.8 26.0
1, 384.1
130.6 117.2 99.3
208.3 828.7
298.2
11.6 35.6
119.5 23.5 39.2
1, 464. 2
186.2 114. 4 102.4 226.7 834.5
361.2
26.0 33.5
111.3 2.1. 9 81.8
1, 460.5
184.7 107.2 108.7 183.5 876.5
359.8
46.2 44.6
103.0 27.0 44.2
1, 462.4
232.5 117. 1 94.4
193.6 824.7
405.9
78.0 34.4
108.0 27.2 44.7
1, 658.8
245 3 126.2 92.3
260.0 935.0
420.0
89.1 29.8
123. 9 24.0 50.9
.:\onagriculturalproducts,totalci' ............ do .... 1,156.1 1,074.8 1,010.4 1,149.3 1,155.ti 1,210.1 1,104.il 1,126.7 1,085.9 1,103.0 1,100.7 1,056.5 1,238.8
Automobiles, parts, and aceessories ________ do ___ _ Chemicals and related products§ __________ do ... . Coal and related fuels _____________________ do ... . Iron and steel productsEIJ __________________ do ... .
Machinery, total§d' _----------------------do ... .
AgriculturaL. ____ .... _ .. _________ .. __ ._ .do ... . Tractors, parts, and acccssorics .......... do ... . ElectricaL.. _____________________________ do ... . Metalworkin~:§ .. _. _______ .. ______ ----- .. do ... . Other industriaL .. _._ .•. ___ .• ________ .. do ... .
Petroleum and products ___________________ do ... . Textiles and mannfactures .....•••.•••••... do ... .
Gt·ncral imports, totaL __________________________ do ... . By geographic regions:
Africa. ____ . ____ ._ ....... ____ ..• __________ ._ .do ... . .-\sia and Oceania ____________________________ do ... . Europe .... __ ... ___ . ___ . __ . ____ ._. ________ ... do ... .
.:\orthern North America .................... do ... . Southern North America ____________________ do ... . South America .. ----------------------------do ... .
By leading countries: .Urica:
United Arab Republic (Egypt Region) .... do ... . Union of South Africa _____________________ do ... .
Asia and Oceania: Australia, including: Xew Guiuea .......... do ... . Colony of Singaporc ....................... do ... . India and Pakistan ... _____________________ do ... . Japan ... ----------------------------------do ... . Republic of Indonesia _____________________ do ... . Republic of tile Philippincs ................ do ... .
Europe: Fmnce ................ _____________________ do ... . East Oermany ............................. do ... . West Germany ____________________________ do ... . Italy. _____ ........ _______ ... _________ ..... do ... . Union of Soviet Socialist Republics ....... do ... . United Kingdom __________________________ do ___ _
X orth and South America: Canada. __ •. ____ .. ____ . ____ ._ .. _._ ..... __ .do ... ..
Latin American Republics, totalci'.------ .do ... .
Argentina _____________________________ .. do ... _
BraziL-----------------------------. __ .. do ... . Chile. ___ ._. ____ ._. ____________ • _________ do._ ..
Colombia •••••... ----------- ______ ...... do ... . Cuba ....... ______ . ______ • _______________ do._ .. Mexico __________________________________ do .... Venezuela.------. __________ ._. _______ ... do .. _.
Imports for consumption, totaL. ----------------do ..•. By economic classes:
Crude materials .......•..................... do ... . Crude foodstuffs _____________________________ do ... . Manufactured foodstuffs and beverages ...... do ... . Semimanufactures. __________________________ do ... . Finished manufactures .. _______ ------------ .do ... .
By principal commodities: Agricultural products, totalQ' ________________ do ... .
Cocoa (cacao) beans, incl. shells ........... do ... . Coffee _____________________________________ do ... .
Rubber, crude, including guayule ___ ...... do ... . Sugar ___ ---------------------. ____________ do ... . Wool and mohair, unmanufactured ....... do ... .
Nonagricultural products, totald' ____________ do .. __ _
Furs and manufactures .................... do ... . Iron and steel products Ell* _________________ do ... . Xonferrous ores, metals, and mfs .• totalci' .. do ... .
Copper, incl. ore and manufactures ______ do ___ _ Tin, including ore _______________________ do ___ _
Paper base stocks __________________________ do ... . X ewsprint. ______________________ --------_.do ... . Petroleum and products ___________________ do ... .
127.7 113.5 31.8
'46. 8
313.9
8. 3 17.8 9~. 8 35.7
143.0
39.4 47. 7
J, 253.4
fi3. 5 209. ~ 353. (i
233.0 Hil. 1 242. 5
. 3 10.7
10.6 4.1
20.7 66.3 16.4 15.5
36.2 . 6
f\5. 5 31.9
.t) H4. 3
233.0
354.1
17.1 69.4 19.3
25.9 35.9 43.2 87.5
1, 229.1
266.6 192.6 128.3 :!59. 9 381.7
369.4
34.1 103.5 30.8 32.1 18.0
859.7
21.4 30.8 81.5 20.8
9. 2 28.4 54.3
lti(i. 7
104.0 115.2 34.3
'47. 0
287.8
8. 5 22.3 70.1 29.3
142.9
40.8 44. (i
I, 154.2
43. li 2W. 7 339. fi
184.9 !fi3. 7 205.7
4. 5 7.8
10.8 3.6
20.3 66. (i 17.6 19.9
32. I .4
65.2 26.8
4. 2 82.0
1~4. 7
313.7
12.0 43.3 20.9 22.8 29.3 46.3 84.7
1,134. 5
262.7 145.4 120. 1 242.5 363.7
328.4
18.3 79. fi 32.7 35.9 21.3
806.1
15.1 29.6 81.3 15.3 13.1 29.5 43.2
158.5
104.2 lUi. (i 25.6
' 45.8
291.2
10.8 25.8 71.9 25.4
142.3
35.7 42.8
I, 118. I
47.9 198. I 312.4
193. g HiO. 8 205. I
. 7 10.6
12.5 2.9
Hi.ti 00.4 18. I 18.8
28. (i .3
ti0.1 25.2 3. I
79. 9
193.8
3Hi. 9
8.(; 52.5 15.5 28.4 32.9 49.9 82.1
1, i13. 3
243.8 165.1i 110.8 255. 5 337. G
333.8
12.7 108.2 29.5 37.7 18.7
779.5
10.0 30.8 70.7 16.2
9. 5 27. 2 44.2
160.7
118.0 122.2 29.9
'53. 2
32G. 9
14.1 31.7 81.2 27.1
158.1
39.2 53.5
I, 300.9
5H. 7 240.7 370.6
227.9 175.1 22fi. 9
G. 6 9.0
II. 7 2. 6
22.0 83. I 12.6 27.4
34.3 . 3
70. (i 28. (j 2. 3
89.7
227. !J
345.2
13. 2 tlO. 8 17.0 23.9 43.6 53.2 91.8
1, 274.0
255.7 17(), 4 130.3 303.9 407.7
370.8
14.8 106.0 28.9 47. 5 23.8
----------------------------~--~----~--~-
903.1
9. 8 35.3 91.4 20.8 10.2 2fi. 7 51. 7 '
173.41
118. 1 119. 5 31.9
'54. 5
354.0
Hi. 2 33.8 80.8 32.0
llili. 5
45.2 49.3
I, 220. 9
57.0 23U. 0 37/l. fi
234.5 139.7 174. 2
1.1 10.4
19.8 1.6
23.0 79.5 15.9 25.8
33.8 . 3
75. 2 29. 2 1.5
95.7
234.5
28li. 9
10. \) 49. 5 15. fi 22.7 50.1 42.1i 61.4
1, 209.0
:23(),()
153.9 142.1i 258.2 417.8
353.7
15.6 84.3 26.2 4tl. () 21.9
855.4
8.5 44.8 Sli. 4 17.2
9. 4 29.5 54.1 I
102. (i !
i
118.3 130.1 34.2
T 5.7, {j
351i. 3
15. b 35.1 SK li 32. 4
1G9. ti
42. 7 54. 4
1, 21\:J. s
42. 3 231. 4 3\13. !I
2tH. 7 13X. 2 193.3
. 4 7. t)
10.7 1.7
21.9 78.1 13.6 27.8
43. 4 .3
75. 2 31.9 1.0
102.5
2ii4. 5
301i.l
12.1 53.8 15.8
30.8 4\1.7 40.4 ti2. 4
1. 247.3
241i. 0 Hii.O 142. I 2til. 5 43~i. ti
31i0. 8
Hi.5 93. () 2X. 4 51.5 21.0
R~li. 5
7. 9 49.8 91.9 20.t• 8. 9
'27. i ti0.3 \18.9
105.2 121.2 29.4
'GO. 2
329.2
JG. 3 34.9 74.8 24.2
IG4.4
42.0 47.8
I. 31i9. 4
49.8 21;4, B 399.7
301.6 143.3 210. I
.4 11.1
18.3 2. 5
20.3 88.9 22.9 29.4
42.0 .9
80.2 32.5
1.8 98.0
301.4
322.2
15. 7 38.5 17.3
31.4 54.4 34.9 86.9
1, 335.5
287.9 13tl. (j
147. 7 30\i.l 457.2
33ll. 8
14.9 74.3 29.1 52.3 18.7
998.7
8. 9 55.2
111.0 25.6 19.7 29.9 59.5
142.2
101. 1 122.9 36.8
'56. 0
319.4
15. 1 32.3 78.0 21.7
157.4
42.8 47.4
1. 248.4
43.8 246.0 406.7
267.6 122.9 161.3
1.9 9. 4
17.3 2.4
20.0 91.3 15. 1 30.9
43.5 .6
80.7 33.6 2.0
1116.7
267.5
259.4
8. 6 31.5 15.1
28.0 56.2 27.2 57.6
1. 236.1
244.8 116.2 149.1 270.8 455.2
317.1
9. 4 61.6 32. 1 58.1 15.2
919.0
6. 5 59.4 94.8 19.9 5. 7
211.9 54.2 ~3.11
83.5 123. 1 39.8
'36. 9
308.1
11.7 27.5 77.9 24.9
152.2
38.3 52. 1
1.189. 8
JO 6 2.'i3. 4 341.6
249.5 103 2 201.5
.4 5. 9
17.3 2. 5
19.6 88.1 14.0 34.4
37.8 .2
66.8 34. f)
2. 3 85.6
249.3
280.7
9. 7 70.6 14. 7 27. 4 43.6 24.8 60.7
1,190. 7
zr;Ls 144.9 137.0 253.8 403. 1
351.6
9.4 99.5 32.0 48.3 14.7
839. 1
4. 5 49. 1 87.7 22.2
5. 5 28.5 54.~
102. s
89.7 139.6 36.5
'31. 5
316.9
9. 6 33.0 81. ,5 22.2
156.2
39.0 58.7
I, 391.8
58.8 288.4 424. 7
254.9 112.3 252 .. )
. 2 8 9
22.5 2. 0
20.3 99.3 17.8 36.0
42.5 .3
87.3 34.0
3. 6 102.9
254.4
334.2
10. 1 82.1 21.7
43.8 43.1 25.6 06.1
1. 348.7
264.6 190.6 1G2. 9 274.3 456.3
418.6
14.4 136.7 35.0 .00.5 20.7
930.1
b. 9 54.5 94 3 31.1 14.4 28.2 58.8
115. 6
107.2 119.3 32.4
'29.9
326.1
8.2 28.7 89.2 22.3
160.9
38.5 58.4
1, 204.8
35.0 255.3 368.5
284.0 8(i.0
176.0
.1 8.9
15.8 3.0
18.5 95.9 15.3 25.5
36.2 .2
75.6 35.2
2. 5 94.0
283.9
235.0
8.8 42.0 16.1
25.0 20.1 24.6 62.6
1,214. 6
267.4 113.6 118.3 256.9 458.4
277.1
5. 9 65.7 36.7 22.9 18.0
937.4
4. 2 fiG.G 93.3 21.9
8. 6 29.0 58.9
112. I
101.3 109.9 27.0
'36. I
301.1
8.9 23.8 79.4 22.8
150. 7
31.2 58.5
1. 283. 2
51.3 242.9 402.5
291. 7 10\i. 9 187.9
.2 14.3
14. I 1.8
19.3 95.9 12.6 21. 1
42.9 . 2
82.5 32.2
1.0 96.fi
291. 4
261.8
7. 8 39.0 17.3
25.5 23.7 28.4 77.2
1, 262.5
252.8 129.2 109.9 299.5 471. 1
284.3
10.2 74.5 37.2 17.9 12.0
978.2
5. 7 in. o
10.1. 7 42.3
7. G 32.0 60.9
122.9
99.4 152.4 29.8 54.0
341.4
8 8 2fi. 1 84. l 27. 3
174 5
44. r, Gti. 8
1. 477 8
60.7 264.4 471. 7
288.8 140.9 251.3
.3 14.8
20.7 2. 4
21.0 107.8 15.0 14. 7
45.0 . 2
99.4 44.0 3.0
103. 6
288.7
353.0
8. 8 66.5 25.8 30.1 2i. 5 39. I 96.3
I, 431. li
283.3 189.5 127.9 322.7 508.1
367.2 Z:l. 0
113.3 35.7 26.2 18. 1
1. 064.3 21. (I
82 8 111.4 43 .. 1
7. 4 28 :l 65 1
141.
' Revised. P Preliminary. , See similar note on p. S-21. \l Data for semimanufactures reportL•d as "sp.-cial category. type I" are included with finished manufactures. ci'Includes data not shown separately. §Excludes "special category, type 1" exports. Ell Comprises pig iron, scrap. steel mill products. and other iron and steel products; excludes advanced manu· fartun}s. Revisions for exports and data for imports (prior to December 1958) will be shown later. *New series; see nott\ marked "e".
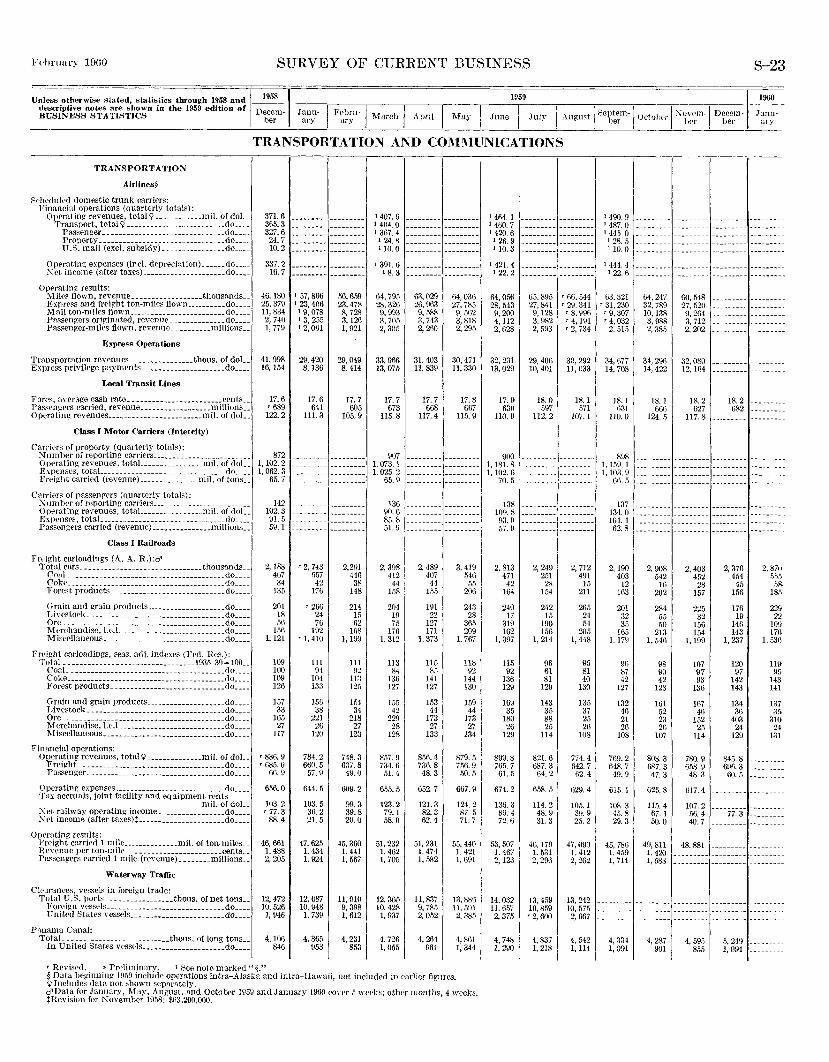
SURVEY OF CURRENT BUSINESS S-23
Unless otherwise stated, statistics through 1958 and 11958 ___ ~----,-----,----,-----~---,----1915_9 ___ ,------,----,---,----,---·1 1960
descriptive notes are shown in the 1959 edition of Decerrr- J"ntl- I Febl'll-1 I . I I I I I " t I I ,. I D . - J-- ---BUSINESS STATISTICS u l\I h \ I M June Juh.- Auuust " 0 P_ em- 0 t >b ·· _,ovem- ecem- ann-her ary ary • arc " pn ay n her c ' u her bcr nry
TRANSPORTATION AND COlW\lUNICATIONS
TRANSPORTATION
Airlines~
Scheduled domestic trunk carri<•rs: Financial operations (quarterly totals):
Operatinv revenues, total<; ____________ mil. of doL. Transport, total<;! _________________________ do ___ _
Pflssenger _______________________________ do ___ _ Property ________________________________ do ___ _ tT.S. mail (excl. subsidy) ________________ do ___ _
Operating expenses (incl. depreciation) ______ do ___ _ i\et income (after taxes) _____________________ do ___ _
Operating results: 1\Iilrs flO\vn, revenue __________________ thousands __ Express and frei!(ht ton-miles llo\\·n __________ do ___ _ Mail ton-miles flown ________________________ do ___ _ Pnssengrrs originated, rcvenur ______________ do ___ _ Passenger-miles flown, revenur _________ millions __
Express Operations
Transportation revenues ________________ thous. of doL_ Express privilege payments _____________________ do ___ _
Local Transit I~ines
Fan's, flxerage cash rate ________________________ cents __ Passf'ngf'rs carried, revenue __________________ millions __ Operating revenues ________________________ mil. of doL_
Class I Motor Carriers (Intercity)
Carriers of property (quarterly totals): ~umber of reporting carriers ________________________ _ Operating revenues, totaJ. _______________ mil. of doL. Expenses, totaL ______________________________ do ___ _ Freight carried (revenne) _______________ mil. of tons __
CarriPrs of passengers (quarterly totals): ::\umber of reporting carriers ________________________ _ Operating revenues, totaJ. _______________ mil. of doL. Expenses, total _______________________________ .do ___ _ Passengers carried (revenue) _______________ millions __
Class I Railroads
Fn•ight earloadings (A. A. R.):ci' Total cars __ ---------- ____ ----- __________ thousands __
Coal. _ ------ _________ --------- _____________ .do ___ _ Coke _____________ ------ _____________________ do ___ _ Forest products ____________________________ do ___ _
Grain and grain prodncts ____________________ do ___ _ Livestock __________ ---------- ______ -------- .do ___ _ Ore ___ --------------------------------------do ___ _ Merchandise, l.c.l. __________________________ do ___ _ Miscellaneous ______________________________ .do ___ _
Freight carloadings, seas. adj. indexes (Fed. Res.): Total __ --------- ______________________ 1935-39= 100 __
Coal._ --------------------------------------do ___ _ C'oke ________________________________________ do ___ _ Forest products __ ---------------------------do ___ _
Grain and grain products ____________________ do ___ _ Livestock __ ----------------------------- ____ do ___ _ Ore __ ---------------------------------------do ___ _ Merchandise, I.e.! ___________________________ do ___ _ M iscellaneons _______________________________ do ___ _
Financial operations: Operating revenues, total'¥ ______________ mil. of doL_
Freight __ -----------------------------------do ___ _ Passenger __ ---------------------------------do ___ _
Operating expenses ____ ----------- ______________ do ___ _ Tax accruals, joint facility and equipment rents
mil. of doL :\ et railway oprrating income _________________ do ___ _ ::\ct income (after taxes)t ______________________ do ___ _
OpPrating results: Freight carried I mile ______________ mil. of ton-miles __ Hevenue per ton-mile ________________________ cents __ Passengers carried 1 mile (revenue) ________ millions __
'\Vaterway Traffic
Clearances, vessels in foreign trade: Total U.S. ports ________________ thous. of net tons __
Foreign vessels ____________________ ----- _____ do ___ _ United States vessels ________________________ do ___ _
Pmrama Canal: Total __________________________ thous. of long tons __
In United States vessels _____________________ do ___ _
371.6 365.3 327.6
24.7 10.2
337.2 16.7
46, 180 25. 37V 11,834 2, 740 1, 779
41,998 16, 154
17.6 '689
122.2
872 1, 102.2 1,062. 3
65.7
142 102.3 91.5 SY.I
2,188 467 34
135
201 18 56
156 1, 121
109 100 109 126
157 33
165 27
117
'836. 9 '685. 0
66.9
656.0
103.2 T 77.3
88.4
46,661 1. 488 2,205
12,472 10,526
1, 946
4,106 846
I 57,866 I 23,406
I 9,078 I 3, 255 12,061
29,420 8,136
17.6 641
111.3
'2 743 , !\.57
42 176
'266 24 76
192 'I. 410
111 94
104 133
150 38
221 26
120
784.2 660.5
57.9
644.5
103.5 36.2 21.5
47,625 1.434 1, 924
12,687 10, 948
1, 739
4,365 953
56,659 23,478 8, 728 3,126 1, 921
29,049 8. 414
17.7 605
105.9
2,291 446
3R 148
214 15 62
168 1, 199
111 92
ll:J 125
154 34
218 27
123
748.3 637.8
49.0
609.2
99.3 39.8 20.0
45,360 1.441 1, 567
11, 010 9,398 1.612
4, 231 1 853
1407.6 1404.0 I 367.4
1 24.R 110.0
I 391.6 18.3
64,795 28,326 9, 993 3. 705 2,305
33,966 13,075
17.7 673
115.8
907 1, 073. 1 1, 025.2
65.9
136 90.6 85.8 51.9
2, 3981 412 44
158
20cj 19 75
li6 1. 312
113 84
136 127
155 42
229 28
128
857.9 734.6
51.4
655.5
123.2 79.1 58.0
51.232 1. 462 1, 705
12,365 10,428
1, 937
4. 726 1, o55 I
63,029 26.963 9, 588 3, 743 2, 260
31.403 11, 839
17.7 668
117.4
2, 489 407
44 155
191 22
127 171
1. 373
115 8,5
141 127
153 44
173 27
133
856.4 736.8 48.3
652.7
121.3 82.3 62.4
51.231 I. 474 1, 582
11,837 9, 78,5 2, 052
4, 261 964
64.036 27,785
9, 562 3, 818 2, 295
30,471 11,330
17.8 667
11.5. 9
3,419 546 55
206
243 28
365 209
1, 767
118 92
144 130
159 44
173 27
134
879.5 756.9 50.5
667.9
124.2 87.5 71.7
55,440 I. 421 1, 691
13.886 11, 501 2,385
4, 861 1,344
r Revised. P Pn·lirninary. I See note marked"§." §Data beginning 1959 include operations intra-Alaska and jntra-Utnvaii, not included in 0arlicr fignrcs. 9 Includes data not shown separately. ci'Data for January, May, August, and October 1959 anti January 1960 co,·er 5 weeks; other months, 4 wPeks. tRevision for November 1958: $o3,200,000.
I 41\4.1 1 460. 7 1420.6
I 26.9 I 10.3
1421.4 1 22.2
64,056 28,543 9, 200 4,112 2, G28
32, 231 13,029
17. 9 630
110.9
900 1, 181.8 1,102. 6
70. ,)
138 109. g 93. \) 57. tJ
2, 813 471 42
164
240 17
319 162
1, 397
115 92
136 129
169 35
180 26
129
899.8 765.7 61. ,5
674. 2
136.3 89.4 72.6
53,507 I. 467 2,123
14,032 11, 6fi7 2, 375
4, 74R 1, 290
65,895 27,841 9,128 3, 982 2, 593
29, 406 10,401
18.0 597
112. 2
2, 249 251
28 154
242 15
190 156
1, 214
96 61 81
129
143 35 88 25
114
821.6 687.3 64.2
658.5
114.2 48.9 31.3
46. 179 1. 531 2,296
13,459 10, 859 r 2,600
4, 8371 1, 218
'66, 544 '29, 341 '8, 996 '4, 191 '2, 734
30,292 11,033
18. 1 571
107.1
2, 712 491
15 211
265 24 54
205 1,448
95 81 40
130
135 37 25 26
108
774.4 642.7
62.4
629.4
105. I 3\J. 9 25.2
47,090 I. 412 2, 262
13,242 10, 575
2, 667
4, 542 1,114
I
1490.9 1487.0 1445.0
I 28.5 110.0
I 444.4 122. f\
63,321 '31, 230 '9,307 '4, 032
2,515
34,677 14,708
18.1 631
110.0
898 1.159. 1 1, 103. 9
66.5
137 134.0 104.4 62.8
2,190 403
12 163
20l 32 35
165 1, 17\l
\16 87 42
127
132 46 21 26
108
769.2 648.7 49.9
615.1
108.3 45.8 29.3
45, 786 I. 459 1, 714
4, 334 1, 091
64,247 32,789 10,138 3, 988 2, 385
34, 29fl 14,422
18.1 666
124 .. 5
2,908 542 16
202
284 55 ,50
213 1, 546
98 90 42
123
161 52 23 26
107
808.3 687.3 47.3
625.8
115. 4 {)7.1 50.0
49,811 1. 420 1, 588
4,287 901
60,548 27,520
9, 2()4 3, 712 2, 202
32,080 12, IrA
18.2 627
117.8
2, 403 452
28 157
225 32
156 154
1,199
107 97 93
136
167 46
152 25
114
780.9 658.9 48.3
617.4
107.2 56.4 40.7
48.881
4, 595 855
18.2 682
2,376 4,54 45
156
176 19
146 143
1, 237
120 97
142 143
134 36
403 24
129
84.5. 8 696.3
60.5
2,870 55.5
5S. 18.5
229 22
109 17(;
I. 53fJ
11\) 9!\
143 141
137 35
310 24
131
77.3 ---------
5, 249 1, 094
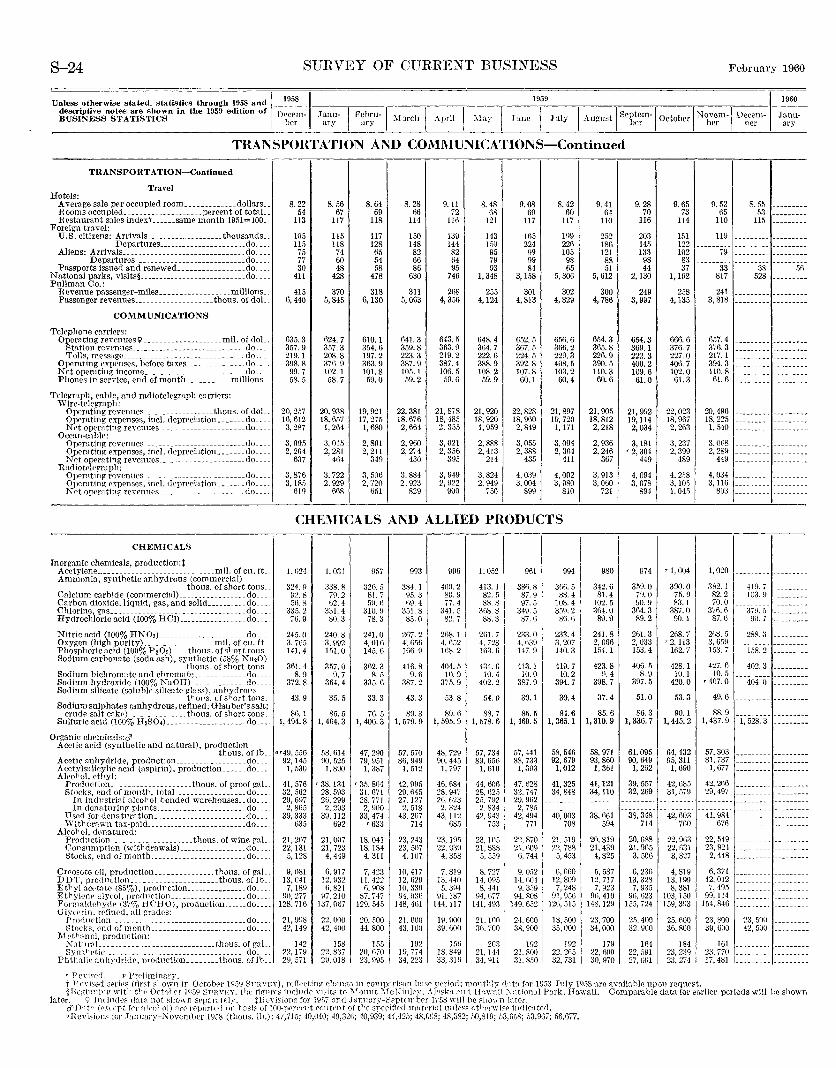
S-24 SUHVEY OF CURHENT BUSIKESS February 1960
Unless otherwise stated. statistics through 1958 and ~-~~~~ 1959
descriptive notes are shown in the 1959 edition of (I • •
BUSINESS STATISTICS Di~;:u- J~~;- I F~~~~-~ :\larch I April ! :\lay I June I July 1
- 1960
I Aurrust I Septem-1 October I Novem-1 Decem- --fu~ b her ber
1
her ary
TRANSPORTATION AND COl\ll\IUNICATIONS-Continued
TRANSPORTATION-Continued
Travel Hotels:
Average sale per occupied room _____________ dollars __ Rooms occnpied ____________________ percent of totaL_ Restaurant sales indext ______ same month 1951=100.
Foreign travel: U.S. citizens: Arrivals ___________________ thousands __
Departures ______________________ do ___ _ Aliens: Arrivals _______________________________ do ___ _
Departures ___________________________ do ___ . Passports issued and renewed _________________ do ___ _
National parks, visits§ ___________________________ do ___ _ Pullman Co.:
Revenue passenger-miles __________________ millions_. Passenger revennes ____________________ thous. of doL.
COMMUNICATIONS
Telephone carriers: Opera tin!!: revenues<;> ____________________ mil. of doL_
Station revenues __________________ ------- ____ do. __ Tolls, message _____________ --------- _________ do. __ _
Operating expenses, before taxes _______________ do ___ _ Net operating income __________________________ do ___ _ Phones in service, end of month ___________ millions __
Tele~raph, cable, and radiotelegraph carriers: Wire-telegraph:
Operating revcnues __________________ thous. of doL_ Operating expenses, incl. depreeiation _______ do ___ _ Net operating revcnues ______________________ do ___ _
Ocean-cablP: Operatin!( revenues _________________________ do ___ _ Operating expenses, incl. depreciation _______ do ___ _ Nrt. opC'rating revenurs ______________________ do ___ _
Radiotrlrgrnph: Opf'rnting revp.nnes ------·-- __________________ do ___ _ Opf'rnting rxpenses, incl. deprC'ciation _______ rlo ___ _ Nrt opPrntin~ revenues_ _ ______________ do __ _
CHEMICALS
Inorganic chemicals, production:t Acetylene ______________________________ mil. of en. ft. Ammonia, synthetic anhydrous (commercial)
thous. of short tons. Calcium carbide (commcrcial) _________________ do __ _ Carbon dioxide, liquid, gas, and solid __________ do ___ _ Chlorine, gas _________________________________ do ___ _ Hydrochloric acid (100% HCI) ________________ _cto __ _
Nitric acid (100% HNOa) ______________________ do __ _ Oxygen (high purity) _________________ mil. of cu. ft. Phosphoric acid (IOO% P,O,) ___ thous. ofsl•ort tons Sodium carbonate (soda ash), synthetic (58% I\'a,O)
tho us. of short tons_ Sodium bichromate and cl'romate ____________ do __ _ Sodium hydroxide (100% NaOH) ___________ do __ _ Sodium silicate (soluble silicate glass), ancydroPS
tl''OPS. of sl'ort tons_ Sodium sulphates <anhydrous, refined; G Iauber's salt;
crude salt cakP) __________ thous. of short tons. Sulfuric acid (100% n,so,) ____________________ do ___ .
Organic chemicals:cl' Acetic acid (synthetic and natural), production
thous. of lb_ Acetic anhydride, production _________ . _______ do ___ _ Acetylselicylic acid (aspirin), production ______ do __ _ Akorol, ctl'yl:
Production ____________________ thous. of proof gaL. Stocks, end of month, total _________________ do __ _
In industrial alcol'ol bonded warehouses .. do ___ _ In denaturing pinnts ________________________ do ....
UsPd for dcnaturntion _______________________ do ___ _ Witl•drawn tnx-pnid ____ --------------------.do. __ .
Alrol'ol, dc>naturcd: Production __________________ thous. of wine gaL. Consumption (witl'drawals) ________________ .do. __ . Stocks, end of month ________________________ do ___ _
Crrosotc oil, production _______________ thous. of gal DDT, production _____________________ thous. of lh_ Etl•yl acetate (85%), prodnction _______________ do __ _ Etl•ylene glycol, prodnction ___________________ do __ _ Formalderyde (37o/o HC'HO), production ______ do ___ _ G lyr(•rin, rrfincd, all grades:
Prodortion _ _ _ ________________________ do .. . Stocks, rnd of month ________________________ do ... .
M<•tb:mol, production: 1\'"ntnraL ____________ ---------------- thous. of gaL_ Syntl•rtic _________ ---------------------- do ___ _
Phthalic anhydride, production ________ thous. of lb __
r Fevi~cd. P Prrliminary.
8. 22 54
113
105 115
75 77 30
411
415 6,440
635.3 357.9 219.1 398.8
99.7 58.5
20,2.17 16,612 3, 287
3, 095 2, 204
637
3,876 3,185
619
8. 56 67
117
115 118
74 60 48
428
370 5, 845
624.7 357.3 208.8 376.9 102.1 58.7
20,938 18,657
I, 264
3. 015 2, 281
464
3, 722 2. 929
668
8. 64 69
118
117 128 65 54 58
478
318 6,130
610.1 354.6 197.2 363.9 101.8 59.0
19,921 17,275 1,680
2, 801 2, 211
349
3, 506 2, 720
651
8. 28 66
114
!50 148 82 66 86
630
311 5, 063
641.3 359.8 223.3 387.9 105. I 59.2
22,381 18,676
2, 664
2, 960 2, 274
430
3. 884
2, ~~~
9.11 72
116
139 144 82 64 95
746
268 4, 356
643 .. 5 363.9 219.2 387.4 106.5 59.6
21,878 18,485 2, 35.1
3,021 2,356
395
3, 949 2, 922
900
8. 48 fi8
121
143 !59 95 79 93
1, 348
255 4,124
648.4 364.7 222.6 388.9 108.2 59.9
21,920 18,920
I, 959
2,888 2,413
214
3, 824 2, 949
750
9.08 69
117
165 224
99 99 84
3, 158
301 4,813
652.5 367.5 224.5 392.8 107.8
60.1
22,828 18,960 2, 849
3,055 2, 388
435
4, 039 3,004
899
8.42 60
117
199 226 105 98 65
5, 306
302 4,829
656.6 366.2 229.3 408.5 103.2 60.4
21,897 19,720
1,171
3,094 2, 364
411
4, 002 3,080
810
CHE:\IICALS AND ALLIED PRODUCTS
1,024
324.9 92.8 5o. s
335.2 76.9
245.0 3. 765 141.4
361.4 8.9
372.8
43.9
86.1 I, 494.8
•'49, 556 92, 145
1, 530
41, 576 32, 562 29, 697
2, 865 39,333
635
21,207 22,131
5, 128
9, 081 13,041 7,189
no. 277 128,716
21,908 42,149
142 22, Ii9 29,571
1. 031
:J38. 8 i9. 2 u2. 4
3:ll. 4 80.3
240.8 3, 992 151.0
357.0 9. 7
364.4
35.5
85.5 1, 464.3
58,614 90. 525 1,890
'38,134 28, fi\)3 26,299
2, 293 39,112
692
21,007 21,723
4, 449
6, 917 12,\132
6, 821 97.210
137,067
22. 000 42, 400
158 22. s:H 29,018
957
32ft 5 81.7 .~\). fl
310. \J 78.3
241.0 4,016 145. 6
362.3 8. 5
335.6
33.3
76.5 1, 406. 3
47,290 79, 951
I, 387
'35, 804 31. (i71 28.771 2,\100
33, 474 r 633
18,041 18, 184
4, 311
7, 423 11, 422 fi. 908
87.747 129,545
20,500 4·1, 800
155 20, 670 23,995
993
384. I 95.3 (\9. 4
351.8 8.5. 0
267.2 4. 656 !66. 9
416.8 9.6
387.2
43.3
89.3 1, 579. 9
57, 570 86, 949
1, 512
42.\195 29. o45 27.127
2, .518 43, 267
714
23, 243 23. 507 4,107
10, 417 12,629 10. a;Jo 94. o:J6
148, 461
21.000 43, 100
192 19.774 34, 223
996
400.2 80. g 77. 4
341.5 82.7
268.1 4, 652 168.2
404.5 10.9
375.9
53.8
89.6 1, 595.9
48,729 90,445
I, 797
46. 684 28. U47 2G. f>23 2, 324
43, 112 68.5
23,195 22, \)39 4, 358
7, 819 13. 440
5, 304 91.187
144.117
19.900 39, GOO
150 18.849 33,316
1,052
413.1 82.5 88.8
3G8. 8 88.3
961
386.8 87.9 97.5
349. 5 87.6
261. 7 233.0 4. 728 4. (i39 163.6 147.9
434. 6 413.1 10.4 10.0
402.2 387.9
54. 0 39.1
88. 7 85. ·' 1, 578. 6 1, 469. 5
57, 734 89,656
I, 610
44.606 28,625 25, 7H2
2. 834 42, 943
753
23, 105 21,888
5, 559
8, 727 14.095 8. 441
94. 677 141,493
21, wo ao, 700
203 21, 144 34, 911
57,441 88,733
1,393
47.628 32.747 29, 9fi2
2, 785 42, 494
771
22, R70 21. r,og 6, 74-1
9. 0:>2 14. GOJ 9, 3:19
94. ~08 149, 652
24,600 38, \lOO
192 21, SOil 31,850
994
3f>6. 5 88.4
108.4 359.2
86. (]
233.4 3. 207 140.3
419.7 10.2
394.7
30.4
84.6 I, 365.1
58,546 92,679
1,012
41,325 34, 848
40,003 708
21.519 22,788
5, 453
ll,fifiO 12,809
7, 248 91, U56
126, 515
18,500 35,000
192 22. 2G5 32, 731
9. 41 fi4
110
252 186 121 88 .51
5, 612
300 4, 786
654.3 365.8 226.9 390.5 110.3 60.6
21,905 18,812 2,218
2, 936 2,246
367
3, 913 3, 060
721
980
342.6 81.4
102.5 36-1.0 89.9
241.8 2, OG6 154. I
423.8 D.4
398.7
37.4
85.6 1,310. 9
58,971 93,860 1,361
41, 121 34,110
38,661 594
20,819 21,439
4,825
5, 587 12. 717
7, 923 9(], 410
148,129
2:l, 700 34,000
179 22, ()\lf.l
30, 970
9. 28 70
116
203 14.5 133 98 44
2,130
249 3, 997
654.3 369.1 222.3 400.2 109.6 61.0
21,992 19,114 2,034
3,181 '2,304
449
4, 094 3, 078
894
974
359.0 79.0 90.9
3r.4. 3 89.2
2bl. 3 2, 033 153.4
406.5 8.9
397.5
51.0
86.3 1, 336.7
61,095 90, 649
1, 262
39, 557 32,269
38,348 714
20,688 21,965
3, 506
6, 236 13,328 7, 93.5
96, G23 155, 724
2.1. 400 32,900
lfl4 22,.591 27, OUI
9. 65 i3
114
!51 122 102 s:J 37
1,192
258 4,135
666.6 376.7 227.0 406.7 102.0 61.3
22,023 18,967 2, 263
3, 237 2,399
489
4, 2'>8 3, 10.5 I, 04.1
'1,004
390.0 75.0 83.1
387.0 90.1
268.7 '2,113
162.7
428.1 10.1
420.0
53.3
90.1 1,445. 2
64,432 95, 311
1,690
42,685 31,579
42,603 760
22, 9(i3 22,1l31 3,827
4,819 13,199 8, 381
103,150 159,393
25, l\00 36,800
184 23, 239 23, 274
t l'p,·ised E:PriPS (firsts' own in Oetoh0r 1959 SnRVEV), rl'fft'etinp: chnn'l'f\ in compnri~on h:lSC' TWriatl; monthly d:1t:1 for 19.1)3-Jnly Hl."i8 are avnilahlt: upon requrst.
9. 52 65
110
119
8. 5.1 53
115
79 --------- ---------
33 817
241 3,818
657.4 376.3 217. 1 394 3 110.8 61.6
20,496 18, 225
I, 540
3.068 2, 289
449
4, 034 3, 116
803
1,020
382.1 82.2 70.0
37f\. (\ 87.6
2li8. 5 3, 659 1.53. 7
427. 6 10. 5
'407.0
49.6
88.9 1, 437. 9
57,303 81,737
I, 677
42,266 29,497
41,984 676
22,549 23, 924
2, 448
il, 371 12,012 7, 495
99, 114 154, 846
23,800 39, GOO
38 .5fJ 528 ---------
41U. 7 103.9
37Y. 5 90. 7
288.3
158. 2
402.3 ---------
404. () ---------
I, 528.3 ---------
23,mo 42, 5:JO
161 2:1,770 17,481 c:: :::: :::::::::
§ HL'J!inning \vitl' tl r' Octol>f'r 1\159 ST'J;VEY, U1c fig-Prr·s indndc vi::-:its to \'f o1mt :\ r e !(inky, ;'\ l:'~kcl nnd Iln\\·aii X:1tional P:uk, Hawaii. Comparable Uata. for earlier periods will lle shown later. 9 Jndndes data not shown seporntf'ly. tRcvision~ for 19,17 rmd J<:Jmwry-E'f'ptC'n'brr E)58 \Yill he sllO'IYn l<-ltcr.
cJ·D"t:' (PX< 1 rt f(T :!kCJ: nl) rrr rrportt•d on hn::'is of 100-P•'rl't'Pt ror.t!'Pt of th' sprcifiNf mntt'rinl m1lc~s otht'fWi."f' indir:ltrd. (iHcvisionf.: for January-:\overnber 1958 (thons. lh.): 47,715; 40,040; 40,3:20; JO,!J39; 44,·1:?5; 48,0SS; 48,:382; 50,8HJ; 53,GDS; 53,9Gi; 56,G77.
SURVEY OF CURRENT BUSINESS s--25
~nleos otherwise stated, statistics through 1958 and ~~~ de~c("iptive notes are shown in the 1959 edition of Decmn Janu BUSINESS STATISTICS I ber - ary- I F;~~u-1 March I April I May
1959
June I July 1
1960
I AU"Ust I Septern-1 October I Novem-1 Decem- Janu-g ber ber
1
brr ary
CHEMICALS AND ALl.IED PRODUCTS-Continued
FERTILIZERS
:on,;umption (10 States)§ ________ thous. of short tons_. E'ports. total <;! ___________________________ short tons ..
\"itroeenous materhls _________________________ do Phosphat<\ materials ___ , ______________________ . do Potash materials ___ -------------------- ____ ._ .do
lmports, total <;! -----------------------------·.'\itrogenous materials, total<;!--------------·
Kitratc of soda ___ -----------------------
t~f~~hh;;;;t~r~~j~~~l~~~~:::::::::::::::::::: _.
do do do __ _ do __ _ do ___ _
'334 341,862 64,923
214,930 41,441
191,448 128, 743 49,875 12,942 31,803
411 338, 184 53, .158
249,66\ 25, 648
13(), 003 82,371 23,4.16
4, 003 28, 390
581 447,7\6 122,223 276, 337 30,316
222,337 126, 272 28,019 14,243 45,387
1,491 476,844 83,044
319,450 62,689
27\,328 153, 100 48,461 10,987 48,412
1, 799 464,114 43,28\
354,754 58,321
304,488 163, li2.5 41\,283
8, 642 51,184
1. 488 471,229 39,425
375, .)58 40, 118
210,864 129,819 53,239 9,864
15,349
789 4n,oo2 40,778
393,906 26,446
233,441 143,529 38,837 33, 270 20,582
316 530,043 62,390
438,590 25,334
371,174 287,017 45,418 25,985 34,857
Potashdeliveries _____________________________ .do .. 249,613 113,247 166,899 276,Htl 360,096 193,210 85,226 114,563 3uperphosphate and other phosphatic fertilizers (100%
A.P.A.): Production _________ ----------- __________ short tons__ 21S, 867 225,616 236,354 265,920 2.17, 522 241,899 188, 788 169,247
284,881 Stocks, end of month ______________________ ... do ____ 378,734 385,448 383,647 299,965 179,589 \60,279 240,179
MISCELLANEOUS PRODUCTS
Explosives (industrial), shipments: Black blastin!( powder _______________ . __ thous. of lb __ Hi!(h explosives ______________________________ .do ....
Paints, varnish, and lacquer, factory shipments: Total shipments_______________________ mil. of doL
'l'radc products ___________________________ .. do ___ _ Industrialtinishes ________________________ .. do __
8ulfur (native): Production ______________________ thous. of lone tons __ Stocks (producers'), end of month ___________ do_
SYNTHETIC PLASTICS AND RESIN MATERIALS
Production: Cellulose acetate and mixed ester plastics:
Sheets, rods, and tubes _______________ thous. of lb ... l\folding- and extrusion rnatC'rials ____________ do __ _
Kitrocellulosc sheets, rods, and tubes .. __ . ..do
Phenolic and other tar acid reslns _____________ do __ _ Polystyrene_ .. __ ·----· ________ ------------- ___ .do.---Urea and melamine resins ____________________ .do ___ _ Vinyl resins ___________ ----------------------- .do. __ _ Alkyd resins ________ ------------------------- .do.---
Rosin modifications __________________________ .do.--. Polyester resins ___________ ------------------- .do .. __ Polyethylene resins ____________________________ do.- __ Miscellaneous. _____________________ -----_- __ - .do_---
ELECTRIC POWER
Production (utility and industrial), totaU mil. of kw.-hr __
Electric utilities, totaL ______________ ._ .. _____ .do. __ _ By fuels ________ -------------------. ________ .do ___ _ By waterpower. ____________________________ . do ___ _
Privately and municipally owned utilit.ies ... do ___ _ Other producers (publicly owned) ___________ do ___ _
Industrial establishments, totaL ______________ do ___ _ By fuels ____________________________________ .do ___ _ By waterpower ______________ .. _______ - ___ --- .do ___ _
208 70,643
108.7 57.3 51.4
378 4, 442
4, 238 8,432
161
44,295 6\,003 26, o03 81,563 26,901
352 61,2\5
12.5. 5 71.2 54.3
346 4, 427
4, 580 8, 810
294
44,008 62,241 29,162 83,6.59 30,683
10, 145 10, 469 10,842 11,041 83, 692 87' 329 19, 137 I 23, 057
205 67,404
120.7 67.7 53.0
318 4,376
3,852 7, 954
290
41,819 60,905 27,693 82,937 29,649
10,194 10,712 78,419
121,592
127 73,523
150.7 87.7 63.0
374 4,325
3, 713 9, 049
288
47,956 73,706 30,064 92,310 34,023
3\6 86,657
170.7 103.0 67.7
391 4, 248
4,634 9,432
317
44,943 67,625 31,565 92,122 36,373
208 80,427
173.0 104.1 68.9
389 4,156
3,882 8, 121
315
46,567 73,915 30,370 98,884 35,729
124 80,696
175.9 106.5 69.4
347 4,079
4,028 8, 292
304
45,320 72,312 33,967 98,405 34,395
84 72,245
166.7 102.9 53.8
318 3,988
4,437 8,012
250
39,952 65,723 23,470 94,272 30, 587
10, 601 12, 413 12, 518 12, 601 10, 706 14, 783 15, 691 14, 068 13, 680 11, 686 95, 133 98,312 104.549 98,907 100,477
I 26, 164 I 25,903 1 24, 192 I 26, 468 I 22,434
ELECTRIC POWER AND GAS
66,396 59,236 48,485 10,751
48, lOS 11, 131
7, 100 6, 916
244
67,227 59,943 48,652 11,292
48,688 11,256
7,284 6, 999
285
60,968 54,158 43,487 10,671
43,938 10,220
6,8\0 6,554
256
65,889 58,352 46,327 12,025
47,369 10,983
7, 537 7, 247
290
63,394 55,807 43,637 12,170
45,376 10,431
7, 587 7,264
323
65,381 57, 66! 45,924 11,737
46,872 10,790
7, 720 7,411
309
67,390 59,840 48,586 11, 254
49,001 10,839
7, 550 7, 284
267
68,539 61,695 50,212 11,482
50,037 11,658
6,844 6,608
236
198 462,443 34, 86\
368,917 40,171
323,819 200,980 32,651 6,122
93,022
223,688
178, 1.53 293,775
141 75,282
158.4 98.4 60.0
369 3,876
4,086 8, 690
238
46,522 69,210 28,368 98,766 32.200
339 456,690 33,852
362,969 51, 178
326,968 199,315 67, 118 12,989 76, 514
322 437, 592 24,170
326,939 74, f>83
135, 795 92,385 25,933 7,460
1.5, 538
336 342,512 62,129
239,8\7 27,740
149,848 89,390 24,507 8,444 6,692
\10, 579 187, 975 109, 971
198, 086 '220, 205 220, 762 281, 613 '292, 636 329, 903
223 72,049
156.6 96.4 60.2
399 3,815
4,187 8,877
247
49,988 75,829 31,051 98,fl24 33,167
174 74,223
143.0 83.2 59.8
483 3, 899
4, 706 9,519
243
'51, 754 78,938
'34, 146 'lOS, 6.53 '33, 197
241 70,143
121.4 70.8 50.6
408 3,834
4,096 8,857
106
48,322 73,625 29.366
100,470 25,541
11,428 12,419 '12, 878 12,362 11,394 11,053 ' 12,804 11, 777
103,097 104,616 109,338 110,802 125,748 I 27, 750 ' 125, 735 I 24, 917
69,562 63,084 52, 127 10,957
51, 263 11,821
6,478 6,261
217
64,846 58,585 48,321 10.264
47,979 10,605
6,261 6,017
245
65,499 59,032 47,529 11,.503
48,359 10,673
6,467 6,170
297
65,275 58,433 46,764 11, 668
47,889 10,544
6,842 6, 550
292
343 567, 564 o8,ll80
377,877 97,357
261, 71\ 145, 03:l 28.843 19.296 68, 169
238, 117 363,718
182 72.838
119.6 64.5 55. 1
412 3.810
70,539 63, 1\1 .50,427 12,688
51,850 11,261
7,428 7,100
328
Sales to ultimate customers, total (E E I)----- __ - .do____ 50, 337 52, 461 51, 140 51, 427 50, 434 50, 410 52, 120 52, 661 53, 658 54, 079 52, 061 ' 51, 688 • 54, 500 Commercial and Industrial: Smallli~htandpowcr _______________________ do ____ 8,564 8,810 8,647 8,549 8,429 8,673 9,433 10,114 10,611 10.687 9,810 '9,244 •9,400 LargelightandpoweL----------·------------do ____ 24,447 24,301 23,826 2.5,052 25,049 25,743 26,550 25,531 25,297 25,354 25,191 '25,047 •26,100
Railways and railroads ________________________ do ___ _ Residential or domestic ________________________ do ___ _ Rural (distinct rural rates) ____________________ do ___ _ Street and highway !ighting ___________________ do ___ _ Other public authorities ____________________ .. do ___ _ InterdepartmentaL __________________ - ___ - do ___ _
Revenue from sales to ultimate customers (Edison Electric Institute) ____________ . _______ ... mil. of doL
GAS
1\Ianufactured and mixed gas (quarterly): t Customers, end of quarter, total \! ______ thousands __
ResidentiaL ________________________ . ___ . ____ do. __ _ Industrial and commerciaL _______ ---------· .do .. __
Sah>s to consumers, total\! __________ mil. of therms __ ResidentiaL_________________________ _ __ .. do ___ _ Industrial and commerciaL ________________ .do .. __
Revenue from sales to consumers, total 9 mil. of doL
ResidentiaL _______________________________ .do ___ _ Industrial and commerciaL _________________ do ___ _
372 14,420
791 .')60
1, 127 56
849.0
2,899 2, 709
188
609 444 159
82.9 64.5 17.9
355 16,363
868 563
1, 149 51
885.7
339 15,741
800 509
I, 171 47
872.3
333 14,848
921 497
1,167 60
859.0
2, 878 2,685
191
960 748 205
121.7 97.6 23.4
307 !3, 907
I, 083 454
1, 150 56
842.7
289 12,975 1, 088
424 1, 161
56
842.0
282 13,008
1, 191 404
1, 193 59
857.2
2,866 2,674
189
511 344 \54
70.9 53.5 16.7
277 13, 681
I, 408 415
1,170 65
886.2
363 14, 190 1,499
446 1,193
60
906.9
' Revised. • Preliminary. I Beginning 1959 includes protective coatings; earlier data (which exclude such coatings) are not comparable.
364 14, 581 1, 343
478 1, 211
60
921.5
2, 770 2,584
184
287 163 114
42.8 30.6 11.9
380 13, 916
978 524
1, 210 51
891.1
401 '14, 314
875 561
1,204 43
881.6
p 15,925 ---------
§States represented are: North Carolina, South Carolina, Georgia, Florida, Alabama, Tennessee, Arkansas, Louisian!\, Texas, Oklahoma. According to quarterly reports from Vlrgolnia, c·onsumption in that State is as follows: (thous. short tons): 1958-0ctober-Decemi.Jcr, 84; 1959-January-March, 316; April-June, 303; July-September, 69; October-DecemiJer, 73.
<;!Includes data not shown separately, tElectric-power production revisions for 1958 appear on p. 20 of the January 1960 SURVEY. Manufactured and mixed gas revisions for 1st and 2d qturt{'rs or 1958 arc available upon rf'qnest.
S-26 SURVEY OF CURRENT BUSINESS Pebrnar;y l!tt)
Unless otherwise stated, statistics through 1958 and ~~~-~~----~------~-----~- 1959 1 1960
descriptive notes are shown in the 1959 edition of Decem- Janu- I Feilrn-1 :\! 1 I . .1 I ~! I June I July I August I Septe~l-1 Oetoher \ :'-iovem-1 Decem~ -J~~~~-BUSINESS STATISTICS ber ury ary - arc 1 .\pn " ay ber
1 ber her ar;
~--~----~----~----~----~----~----~----~----~----~----~----~----
ELECTRIC POWER AND GAS-Continued
GAs-Continued
:-;-atural gas (quarterly):\? Custon1ers, end of quarter, totaL ________ thousauds __
H<•BidentiaL ________________________________ do ___ _ Industrial and commerciaL _________________ do ___ _
Salt>s to consumers, totaL ____________ mil. of therms __ Hcsidential. ________________________________ .do ... _ Industrial and rommercial_ __________________ do ___ _
Rf''-'emtc from sa.1C's to constnners, total __ mil. of doL_ Resi(lt'ntial ___________________________________ do ___ _ Industrial and commerciaL .. _______________ do ___ _
2S, 722 26, 394 2, 293
20, 385 6, 611
12,630
1, 110.8 Gl2. f) 40:1. t) ---. ---- ----1
28,950 26,625
2, 289
27, 604 12,966 1-----------13,543 --------- --
'· 087. 1 1,093.1
559. 4 ---- ----~---------
28, Sl5 26, 557
2, 223
19,984 5,!i26
13,254
1,053. 8 M9.4 472. 4
FOOD AND KINDRED PRODUCTS; TOBACCO
ALCOHOLIC BEVERAGES
Beer: ProductioJL .. ________________________ thous. of bbL _ Taxable withdrawals .... _____________________ .do __ __ Stocks, end of month .. ____________________ .... do .. __
Distilled spirits (total):
t), 834 \),()51
a 9, 005
Production ______________________ thous. of tax gaL_ or:L4, 188 Consumption, apparent, for heverage purpos('s
thous. of wine gnL. 25, 806 Taxable withdrawals ____________ thous. of tax gaL_ 10, 175 Stocks, end of month ________________________ do ____ ·•H54, 94fi linports ________________________ thous. of proof gaL_ 3, 280
Whisky: Production ______________________ thous. of tax gaL. Taxable withdrawals _______________________ .do. ___ Stocks, end of mOJltb ________________________ do __ __ Imports ..... __________ --------- thotJS. of proof gaL.
Hectified spirits and wines, production, tolald'
Hi. 343 5, 3-17
753, 073 2, 898
tl10tts. of proof gaL. "5, 778 Whisky __ --------------- _____________________ do____ ·I •. 53fJ
'Vines and distilling materials: Effervescent wines:
Production _____________________ tho us. of wine gaL_ Taxable withdrawals _______________ -------- .do __ __ Stocks, end of month _______________________ .do .... Imports. ___________________________________ .do. __ _
Still wines:
a268 389
a 1, 636 123
Production __________________________________ do ____ a '6, 151 Taxable withdrawals ________________________ do ____ "' 13,488 Stocks, end of Dilonth ________________________ do .... "'200,299 Imports. ____________________________________ do____ 94£\
Distilling mnterials produced at wineries ...... do .... a 13,354
DAIRY PRODUCTS
Butter, creamery: Production (factory)t ___________________ thous. of lb .. Stocks. cold storage, end of month _____________ do. ___ Price, wholesale, 92-score (1\ew Yorkl. .. dol. per lb ..
Cheese: Production (factory), totaJt ____________ thous. of lh __
American, whole milk t. _____________________ do __ __
Stocks, cold storap:e, end of month, totaL ______ <lo~---1 Arnrriran, whole milk~----------------------do ____ •
Imports _____ ---------- ________________________ do __ _ Pric<', wholesn.lr, Ameriean, singlC' daisies (Chie:wo)
dol. per lb._ Condensed and evaporated milk:
Production, case goods:t
107,237 69, ,95
,(\]3
99, 8ti7 li1, 971
~-\13, 189 749,042
n. ii48
. 384
Condensed (sweetened) _____________ tlwus. of lb__ -!,186 Evaporated (unsweetened) ________________ .. do .. __ 1:l8. fl05
Stocks, rnanufacturers', case goods, end of month: Condensed (swcetened) ______________ tlwus. of lb__ '4,840 Evaporated (unswectened) __________________ clo ____ 'lliO, 997
Exports: Condensed (sweetened). _____________________ do .... ! 2, 985 Evaporated (unsweetened) __ .. ____ -- __ -- .... do ....
1
19, 853 Pric<', manufacturrrs' aYen1{!:f' S(_)lliJJg:
Evaporated (unsweetened) .. ______ .. dol. per case.. li. 1.5 Fluid milk:
Production on farms ______________________ mil. of lh __ Utilization in manufactured dairy productst, _ _c]o __ __ Price, wholesale, U.S. average. _____ dol. per 100 lh ..
Dry milk:
9, :m 3, 527
4. 44
Production:t . I Dry whole nulk ______________________ tllous. of lb.. fi,815 Nonfat dry milk (human fond) ____________ .. do .. __ 126, 2fl3
R.tocks, manufacturers', end of month: Dry whole milk _____________________________ do.... 'tl. ~04 Nonfat dry milk (human foo<l) ______________ tlo .... '87; 513
Exports: Dry whole milk _____________________________ <lo.... I, 875 ~onfat dry milk (human food) ______________ do ..... 32,366
Prier, m:::mufactun)rs' avE>rage selling, nonfat dry I milk (lmman food) ____________________ dol. per lb _ _l .136
6, 353 5, 5t .. 1 9, 437
'21, 969
115,134 11, 043
81il, 884 l, 801
14,441 5. 901
759, 106 1, 568
'5, 145 3,939
224 197
1,645 37
2,384 'II, 351
'190, 055 522
'3, 119
116,300 63, 70H
. 588
100, 49.0 tl5, 6~0
2C9. 4<>9 23.5. 998
5,3~0
. 381
4, 220 143,500
3, 936 135,833
2, 691 5, 057
6.16
9, 754 3, 741
4. 34
8,300 138,250
6, 390 87,475
3, 961 12,524
.136
5, 894 5, 346 9, 631
20,431
t 15,328 11,545
866,203 I, 851
13 !!94 n: 311 7113, 704
I, 680
'6,146 5, 013
321 149
1, 797 43
2, 392 II, lf.9
'177 436 '522
I, 579
7, 702 6, 717
10, Hi!
22,076
I 18,674 12, 97~
'872, 729 2, 330
14, 4f8 (), f3.1
'7<JR, 3.53 2,054
r n,308 5, 040
381 189
1, 974 50
'3,015 13,334
'169, 432 703
2, 537
108, 190 121,395 64,033 (\3, :94
. 589 . 588
96, 570 116, 720 64, 155 78, 055
7(;(), 100 227, 830
4, 853
. 382
4,880 HO, 900
3, 791 92,420
3,127 2,083
6.17
9, 344 3. 527
4. 22
7, 400 132,450
6, ~03 SG, 4f\0
I, 577 6, 931
.131)
'257, ~71 220,0>'3
5, li49
. 382
5, 230 182,600
5, Ob7 83,814
2, 708 5,131
6.17
10,667 4,092
4. 06
8,150 157, 400
tl, o:·5 78, b07
I, 812 13.743
. 130
8, 679 7, 510
10,842
8, 672 9, 586 7, 969 8, 873
11,069 '11,316
9, 648 9,307
11,116
8, 689 8,602
10,698
23, 407 ' 21, 970 19,264
l 18,634 12, R17
'888, 779 2, 517
11, 235 15,624
1 17, 153 13,354
'878, 848 2, 548
15, 509 li, 311
r 7/4, ~'34 2, 280
'6, 382 5, 069
295 177
2, 069 56
2, 895 11,870
']57, 261 668
2, 531
126,845 82,278
. 588
128,225 90,750
783, 189 ~48, 74~
4, 879
.380
5, 310 208,200
4, 859 101\,198
3, K54 4, 3!)2
6.17
II, 171 4,372
3. 89
7, 750 178,200
G, 235 88, G3G
1, 779 19,885
.130
l 18, 175 13, ~72
884,492 2, 669
14,532 G, .199
779, :?45 2, 359
r (),805 5, 316
301 216
2,138 IJS
I, 766 10, 9Zl
149, 5G3 889
4, 474
143.390 104,138
. 5':37
153, 335 114,410
310,107 272, 211\
4, 2H8
. 380
.5, 725 272,400
5, 741 193,121
3. 486 4, 524
6.15
12,5115 5,108 3. 75
8, soo 211,200
G, 81\4 125, ~48
I, 535 53, 505
. 135
12 131 5: 9G7 782, 853
2, 236
'6, 445 4, 972
349 2G8
2,188 62
I, 601 11, 284
'138, 073 696
'2, 885
13.5, 605 138,224
. 588
150, 07o 112,310
347,725 307, 301
5,148
. 380
6,100 269,600
6, 444 288,979
2, 653 5, 983
6.16
l 17,259 12,909
884, 237 2, 377
6, 747 5, 720
781,225 2,112
5, 979 4, 703
305 H37
2,308 46
1,410 9, 671
12t,C29 552
2.185
112, 485 148,060
. 593
129,355 94,035
371,620 330,626
3, 906
. 380
6,160 235,200
5. 715 333,008
5, 002 17,063
6.15
12,152 '11,224 4, 913 4, 148 3. 70 3. 90
l 17,186 15,085
881,152 2, 750
7, 193 7, G76
777,675 2, 449
6, 755 5, 173
285 204
2,326 52
6, 243 10,406
117, 477 690
21,677
90,890 131,988
.609
113, 440 81,350
375,833 334,261
3,614
. 382
5, 430 216, 200
5, 6G6 375. 249
3.-0631 10,669
6.18
10,335 3, 504
4. 09
8, 900 7, 100 tl, 61)0 200,000 150, 400 117,500
7, 055 7, 490 7, 282 144, G15 132,496 114.533
2, 203 21,970
.135
2, 560 1, 393 35, I 051 29, 524
.136 .135
28,979 213,740
2, 204
15,618 2,332
12,434
73.5. 7 299.2 411. .5
8, 115 8,063
JO, 261
29, 214
'17, 408 !5, 2~~
819, (.)~ 3, 613
9, 854 i, 715
776,868 3,173
8, 377 6.646
229 275
2, 296 96
57,452 12,287
167,740 981
122,953
82, .155 93,012
. 637
103, liO 09.950
369,862 327, 126
6, 724
. 385
4, 925 184,800
6. 913 383,959
2.015 9, 259
6.18
9, ·113 3.168 4.36
i, 400 96, 200
4, (!16 98, 605
2, 798 30,972
. 136
7, 230 6, 977
10,086
5, 950 5, 970 9, 714
6. 609 6. 715 9. 091
39, 679 25, 994
19,440 '879, 538
3, 959
12,149 10,045
'775, 401 3,568
9, 909 8, 083
251 357
2,154 102
74,543 13,269
229,309 782
114,090
92, 105 67,286
. 633
97,930 61,585
349,461 308,105
4,167
. 388
4, 470 152,200
5, 412 325, 940
3,370 11,491
6. 25
9, 4f3 3, 246
4. 54
8, 800 99,300
5, 723 87,917
1, 276 27,786
.136
lfi,053 883,354
4, 010 ---3:535' 12,599 8,6f\l
775, 767 3,590 3,118 ---------
8, 224 6. 543
248 4:32
1, 949 108 140 ---------
12,702 13,731
226,273 912
2.5, 110 I, 128 ---------
91, 240 108, 105 46,690 '31, 0.\0
. 647 . 630
88, 720 100, 495 53, 465 59, R25
320,211\ '304. OR4 281,033 '2<-5, t\71
6, 576 8, 75:3
. 401 . 415
4. 370 124, 700
4. 270 279.028
3,17() 2, 834
6. 34
8, 826 3,070
4. 60
8,000 104,600
5, 343 85,504
2, 997 19,402
. 137
4, 480 136.200
5. 1118 225, 092
2. s.o:l 4, 444
6. 38
9, 374 3. 5()8 '4. 48
P, 700 136,800
6, 486 96. 567
2. o:;.; 5, 550
. 137
33, tl02 i\88
282, li2~ 24-5, 37tl
. 41.5
9, 8fi2
J' 4. 36
'He,·ised. v Preliminary. 1 Data for Alaska, included beginning January 1959, are as follows (thous. of wine gallons): January-Septcmber-30; 26; 32; 49; 45; 51; 40; 40; 50. 9 Totals im·lude data not shown separately. Revisions for 1st and 2d quarters of 1958 (back to 1952 for total sales and total revenue) are ayaiJable upon request. ci'Data beginning July 1959 <•xcludc production of wines and vermouth; for July 1958-Junc 1959, such prodnction tot·•lwl 43,600 "al. tHevisions for the indicated items and for the periods specified are available upon request as follows: Butter and chee'e (total and Arnerican)-January 1957-July 1958; condensed and ev<~p
oruted milk-January-July 1958; dry wl>olc milk-Jamnry 1952-December 1955 and January-July 19.5S; nonfat dry milk-January 1954-July 1958; fluid milk used in manufactured dairy products--Janunry Hi5f-l-Au~rust 1959.
• Hevi"ions for l9.c8 (units as iudieatt'd): Heer-stoeks, September, 10,06G; total di~tilled spirits-production, July, 7,591i; August, 9,768; October. 39,889; stocks, July, 852,617; August, 84.'i,\l97; ~ovcmber, 844,412; trial rectified spirits, etc. (July-November), 5,928; 5,953; 6,871; 10,899; 8,8.51: e[fercescent wines-production, October, 203; November, 176: taxable withdrawals, September, 211: :'-iovcmber, 354; stocks, October, 1,987: Nowmber, 1,788; still wine8-production (Si'ptember-Novcmber), 47,2.08; 78,660: 15,184; taxable withdrawals, :'-iovembPr, 12.679; stocks (August-Odober '· 109,4H~: 11t,,t:-n: 209~41ii: 212,fi12: di8ti11ina maferiah~. production (S{~ptt>mbrr-~ovrmhC'r), 11.5,8.51: 1!)9,01R; 3.1,tl9I.
SURVEY OF CURRENT BUSINESS S-27
~nless otherwise stated, statistics through 1958 and ~~~- 1959 descriptive notes are shown in the 1959 edition of BUSINESS STATISTICS Decem- Janu- I Febru-1 J\Iarch I •\pril l May I June I July .._ her ary ary , ~ 1
1960
I \ngust I Septem-1 October I Novem-1 Decem- r;;;;;-· ' " ber her her ary
FOOD AND KINDRED PRODUCTS; TOBACCO-Continued
FRUITS AND VEGETABLES
Apples: Production (cropestimate) ............. thous. of bu .. IJ2G.610 ------------------2118,227 Shipments, carlot. ________________ .No. of carloads.. 2,494 2.136 1, 997 2. 225 2,249
7, 876 I. 545 3,893
893 1, 577
583 306
187 330 1, 516 '1, 526 '2, 283 1, 631 Stocks, cold storage, end of mcnth ..•.. thous. of bu. 37,547 27,955 20,912 14,244 ~ ~~ ~m ~5·~• ~~
Citrus fruits, carlot shipments .......• No. of carloads.. 9, 065 7, 809 7,016 8,285 8, 846 8, 592 7,037 6,037 .o, 203 4, 241 3, 539 • 4, 603 • 9, 420 7, 370 Frozen fruits, juices, and vegetables:
Stocks, cold storage, end of month: Fruits ___________________ -------------thous. of lb.. 493,172 Fruit juices and purees ______________________ do .... 222,711 Yegetables. __ ... _______ ---------------------do.... 846.853
458, 198 404, 3.54 361, 374 305, 726 286. 046 362, 245 498,221 533, 934 52!, 708 297,741 396,238 418,899 487.091 595,481 G33, 096 573,275 517,051 44tl, 617
761, 248 687, 121 647. 899 637. 920 593. 334 ~~3: ~2~ __ 7~~: 59~_ 8~
71:. 7
14
2-~
4'_ I 92
9
5 .• -o
4
a
9
o
9
_
512,461 498,016 •464, 698 432,424 401, 760 356, 983 • 3f>O, 09! 487, 849 930, 662 906, 970 '842, 288 762, 21\0
Potatoes, white: Production (crop estimate) ............ thous. of cwL. 1265. 729 --------- --------- 2242,998 Shipments, car!ot_ __________________ No. of carloads.. 12,271 "i5;333 14,383 17,297 ""i7;i55 16,437 16,426 8,938 10,223 • ll, 279 ' 12, 769 14,589 Price, wholesale, U.S. No.1 (New York)
dol. per 100 lb.. 2. 888 2. 925 3.130 2. 783 4.219 5. 000 .). 450 4.090 3. 635 3. !50 3. 400 ' 4. 063 p 3. 803
GRAIN AND GRAIN PRODUCTS
Exports (barley, corn, oats, rye, wheat) .. thous. of btL t\9, 439 73, 190 58,932 64, 140 62,830 72, 163 70,769 82,792 65,228 63,717 59,339 63,992 71, f.64
Barley: Production (crop estirnate) .................... do. ___ "475.196 Receipts, 4 principalmarkets .................. do.... 13,606 Storks, don,estic, end of month:
CommerciaL ________ -----------------------do.... 46,918 On farms .... ____ .... _. __ .------------- ...... do.__ '228, 909
Exports, including malt§ ______________________ do.... 12,912 Prices, wholesale (Minneapolis):
No.2, malting ________________________ do!. per bu.. 1.190 ::\o. 3, straighL-----------------------------do____ 1.163
Corn:
--------- --------· --------- --------- ------·-- --------------------------- ---------------------------2420,1£1 14,238 12,378 12, 673 12, 585 11,430 13, 731 21, 156 32,227 18. 110
47, 149 47, 639 43, 524 39,222 --------· '153,825
11, 492 5, 994 7, 715 6, 918
1.169 1.139
1. 214 1.175
1.180 1.139
1.228 1.183
35,645 35, 140 34,988 39,474 40, 896 •365,315 --------- --------- '266,882
4,474 12,077 14,368 14,782 11,821
1. 235 1.197
1. 207 1.155
1.165 1.160
1.167 1.120
1. 174 1.094
14,977 14, 710 11,379
38,014 35, 738 • 37, 505 198,429
12, 573 8, 337 7' 879
1,172 1.108
1.174 1.112
1.159 1. 08.)
Production (crop estimate) _______________ mil. of bu .. '13,801 --------· --------- --------- --------- ---------. ------- --------- --------- -------·- ·-------- 24,361 Grindings, wet process _________________ thous. of bu_ Receipts, interior primary markets ............. do .. .
11, 539 4 11, 742 4 11, 759 4]2, 547 412, 751 '12, 724 '13, 545 412,685 413, 863 413, 575 4 14, 107 4 11, 901 •. q 1,812 29, noo zs, 388 33, 160 36,102 42, 520 28,388 34,102 24,226 21,592 JS, 452 26,839 55,612 • 31,974
Stocks, domestic, end of month: CommericaL .. ----------------------------- .do____ 100,026 On farms _______________________________ mil. of btL. •2, 697.0
Exports, including meal and flour ...... thous. of bu.. 19,277 l'riees. wholesale:
::\o. 3, yellow (Chicago) ............... dol. per bu. 1.167 "'eigbted average, 5 markets, all grades ...... do ... 1 1. 096
Uats: II I 1, 416 Pro<luct.ion (crop estimate) ............... mil. of bu. Receipts, interior primary markets. ___ tho us. of bu. I 7, 381
" 1 c~~~i1~~r~:~~~~·-~~1~~!-~~~:~~---------------do ... l 25,672 On farms -----------------------------------do ... •948, 149
Exports, inrluding oatmeaL .................. do ...
1
, 3, 122 Price, wnolesale, No.3, white (Chicago) .. dol. per bu.. . 698
Rke: Production (crop estimate) ____ ..... thous. of bags<;>. California:
Receipts, domestic, rough ____________ thous. of lb .. Shipments from mills, milled rice ____________ do .... Stocks, rough and cleaned (eleanetl basis), end
of month. __________________________ thous. of!b .. :-'outhern States (Ark., La., Tenn., Tex.):
Receiptf:, rough, at mill::-: ___________________ do .... ~hipments fron1 n1il1s, rnilled rice ___________ do ___ . Stocks, domestic, rough and cleaned (cleaned
basis), end of month .................. mil. of lb .. ExportR. __________________ .... _. _____ . _ t110us. of lb .. Priee, wholesale, head, dean (N.O.) ... dol. per n,_
Hy~: Produ<:tion (erop estimate) ___________ .thous. of btL-Receipts, interior primary nwrkets ____________ do ___ _ Stocks, comnlercial, domestic, end of rnontb. _.do ___ _ Price, wholesale, No.2 (J\linneapolis) .. dol. per bu ..
Wheat: J'roduction (crop e.'Stimflte), totaL ________ mil. of hu __
Spring wheat. ________ .----------------- _____ do ___ . "'inter whcnt. ___________________________ ... do .. __
neeeipts, interior primary markets _____ thous. of bu. Disappearanee (quarterly total) ............... do ... . ;':toeks, end of month:
Canada (Canadian wheat) __________________ do ....
I 44, 381
92,062 54,010
74, 871
19U,8fl4 113,685
1,182.3 55,606
. 093
I 32,18G 420
4,973 1. 230
11,401.7 1282.4
1], 179.3 2\l, 394
322,912
379, 21l9
l'nited f'tates, domestle, totalci' .... ___ mil. of bu.. 1. 820. 5 Commercial (at terminal cities), __ . tho us. of bu.. 422,047 Interior mills. (incL merchant), elevators., and
warehouses .. ------------ ____ . ___ tho us. of bu.. 854, 30.J On farms ...... ____________ ......... __ . ___ .do .... • 456, 877
E worts, total, including flom .... ------------.do .. '"I Wheat only _____ . ___ ._ ...................... do ... .
Prices, wholesale: I ::o-;·o. 1, dark northern spring (Minneapolis)
dol. per bu.-~ ~o. 2, hard winter (Kansas City) ________ ... tlo ___ _ ~p. 2, reel Winter (St. Loms). ___________ .... do ____ I '\ el~bted avg., 6 markets, ail grades ________ .do ....
34,038 28, 744
2. 235 1.984 I. 948 2.208
97,973 105,231 109, 792 120, 285 121, 421 116, 813 ------------------- •1,817.9 ------------------ '1,117.5
16,444 16,721 13,597 16,679 21,452 19,737
1.171 1.098
1.179 1.101
1. 207 1.180
23,013 22, 183 20, 154 ------------------ •584,877
4, 040 3, 328 2, 218 . 699 . 676 . 676
1. 283 1.218
19,659
2,200 . 700
1. 290 1.225
1. 289 1. 246
17,298 14,365 "298,427
2, 345 4, 412 . 694 . 700
104,622
22,339
1.265 1.222
101,876
15,094
1.272 1.203
102,718 '3331.3
15,835
1.163 1. 116
21, 754 29,246 31, OM --------- --------- •898,338
9, 330 4, 845 2, 495 . 701 . 704 . G86
107,094
12,902
1.097 1. 071
26,084
4,202 . 740
124, 633 •136, 123 3, 094.4
23,410 26,005
1.100 1. 044
19,028
5,546 . 792
1.091i 1. 025
r 17,824 699,390
1, 241 . 796
133, 123 \10, 282 115, 677 110,076 96,452 93,618 127, 557 48, 000 29, 510 185, 610 78, 034
2 53,122
84,303 56,289 ~~ ~~ ~m ~m ~~ ~~ 74, 501 42,687 37, 521 75,389 46,481
93, 683 5F., 408 53, 447 51, 417 57, 281 53,396 55, 578 45,664 26. 875 • 72,678 77, 295 75,423
110,022 135, 098 68, 40.5 1!8, 036 29, 009 36, 041 61,418 3'!, 322 250,976 1,168,f>07 1,144,978 288.156 140.284 150,912 219, 8o7 237,604 204, 498 131,856 141,994 119,870 170,()07 156.838 209,588
1, 137. 1 69,613
. 094
1,042 4, 271 1. 274
I, 038.0 55, 341
. 093
830 3, 680 1. 289
867.0 131, 3fi8
. 091
I, 001 3,374 1. 311
723.8 Ill. 533
. 089
5-57 3,122 I. 303
31' 988 30, 387 37, 079 20, 453 --------- '282, 147
380, 133 375. 434 374, 184 376. 435
'1 5-11 2 429, 989 433, 776 4t9, 579 432, 427
-------- -------- 761,126 --------- --------- •28:.l,•l20
40, 9ll 35, 427
2.205 1. 998 2.037 2.187 '
31,727 28,410
2. 227 2.028 2.041 2.162
40.391 36,851
2. 211 2. 067 2.018 2.195
30,968 31,521
2.215 2.o9o 1
U8i i
617. 1 137.551
. 089
1,042 2,093 1. 250
488.9 175,264
.093
592.2 142, 2(\8
.091
594 2, 524 2, 820 4, U79 l. 260 l. 242
365.8 204,780
. 089
891. I 90.401
. (181
4, OJ 7 1. 441 7, 613 8, 702 1. 201 1. 256
31,988 51,078 - .. ------1' 204, 180
86,660 40, 170 --------- --------- •274.047
51,258
3.)9. !'>.)8 I 3G8, 623
-4iii; 7()61!; ;~~~1'7~ 406, 382 398, 930 :)81, 03\
53(1, 068 --------- r2, 133. t) 556,360 521;,117
·-------- 3(191, 241 ----~---- r3Il4,937
-------- --------- 1,074,638
43,607 36,826
2.282 2.030 1. 885 2.212.
--------- --------· •455,2.)7
34, 4081 36, 322 26. 762 33, 439
2. 310 I 2. 295 I. 916 I. 936 I. 773 I. 801 2 122 2 087 '
29, 917 33, 0991 25, 634 27, 627
2.241 1.9931 1. 867 2. 248
2. 243 2.013 ]. 881 2. 246 !
1, 401.0 202.703
. 081
>'21 8, 836 1. 264
1,363. 7 ll3, 241
. 081
I, 177 7, 535 1.253
165,228
1,274.3 96,800 •.082
2 21,495 588
r 7, 792 1. 214
--------- 2 1.128. 2 .. --------- 2 204.7
2 923.4 25, 251 25, 076 18, 773
259. 149
369, 722 3Co9, 701 382, 691
540,605
29,400 25. 527
2. 293 2. 048 1. 8c.8 2. 281
I, 87G. 4 522, 2431•485, 656
--------- 988,028 --------- 331,742
' 26, 261 35, 197 21, 818 26, 940
2.299 2.058 2.048 2. 280
2. 246 2.081 I. 998 2. 241
15,785
37,253
!. 170 1.114
21,916
129,388
1.144 1.043
.5,892
16,029
. 780
111.624 51, G71
287 6,424 1.213
2a,l01
502, 137
2. 245 2,072 (')
2. 237
•Revised. P Preliminnry. I Revised estimate of 1958 crop. 2 :Cecember 1 estimate of 19,)9 crop . . 'Old crop onlr; new grain not reported U?til be~inning of new crop year (July fer barley, oats, and wheat; October for eot:n). .'Data beginning Janua1·y 19.19 <ll'e on Rt.and,ird 17-percent
""'"ture basts; pnor thereto, on basts of varymg mmoture content (from 12 to 2.) percent). January 19.19 figure comparable mth earher data is ll.SS.o,OOO husltels. 'No quotation. $F:xrlu<les a small amount of pearl barley. '<Bags of 100 lb. ci'Tlte total includes wheat owned by Commodity Credit Corporation and stored off farms in its own steel and wooden bins; such data are not i11elwlet! in the breakdown of stocks. ~D<tta fnr :\I areh, June, September, and December are not strictly comparable with those for other months, largely because of somewhat smaller cO\'enJge of the quarterly reports,
S-28 SURVEY OF CURRENT BUSH\ESS February l!ll}fl
1959
1
1960
I August I Septem-1 October 'I Nowm-1 Decem- Jamt-, ber ber ber arv
l .
Unless otherwise stated, statistics through 1958 and ~~~ descriptiv~ notes are shown in the 1959 edition of I Decem- Janu- I Febru-1 I . I I BUSINESS STATISTICS I her l11'Y ary :\larch .\pnl May June
' l I July
FOOD AND KINDRED PRODUCTS; TOBACCO-Continued
GRAIN AND GRAIN PRODUCTS- Continued
Wheat flour: Production:
Flour_ ___________________ thous. of saek ·s (lOll lb.\ __ Operations, percent of capacity _____ __ -------------OffaL __ ---------------------- thous. of .short tons __
Grindings of wheat.---------------- ___ tl wu~. of hu __ Stocks held by mills, end of quarter
thous. of sack s (100 lb.) __ Exports_------------------------ ______ __ ______ do ____ Prices, wholesale:
k (lOll lb.) __ Spring, short patents (Minneapolis)
dol. per sac Winter, hard, short patents (Kansas C ity) __ do ____
LIVESTOCK Cattle and calves:
Slaughter (federally inspected): Calves __________________________ thous. Cattle ________________________________ _
or aninutls __ ______ do ____
Receipts, principal markets ____________ _ Shipments, feeder, to 9 com-belt States __ Prices, wholesale:
______ do ____ ______ do ____
Beef steers (Chicago) ______________ dol Steers, stocker and feeder (Kansas Cit) Calves, vealers (Chicago) _____________ _
. per 100 lb __ -) _____ do ____
Hogs: ______ do ____
Slaughter (federally inspectcd) ____ thous. of animals __ Receipts, principal markets ____________ __ ______ do ____ Prices:
) Wholesale, average, all grades (Chicago dol . per 100 lb._
Hog-com price ratio bu. of corn equal in value to 100 lb.
Sheep and lambs: ofliye hog __
Slaughter (federally inspected) .... thous. Receipts, principal markets ____________ _ Shipments, feeder, to 9 com-belt States __ Prices, wholesale:
of animals __ ______ do ____ ______ do ____
Lambs, average (Chicago) _________ dol Lambs, feeder, good and choice (Omah
. per 100 lb __ a) .... do ____
MEATS Total meats:
Production (carcass weight, leaf lard out slaughter __________ ------ ____________ _
) , inspected .. mil. oflb __
Stocks (excluding lard), cold storage, en d of month
Exports (including lard) ________________ _ Imports (excluding lard) ___ -------------
Beef and veal: Production, inspected slaughter ________ _
mil. of lb .. ______ do ____ ______ do ____ l ______ do ____
Stocks, cold storage, end of month ____ __ thous. of lb __ Exports _______________________________ _ Imports _________________________ --- ____ _ Price, wholesale, beef, fresh, steer carcftf:
(600-700 lbs.) (New York) __________ __ Lamb and mutton:
_______ do ____ ______ do ____ sses, choice
.dol. per lb __
Production, inspected slaughter ______ __ Stocks, cold storage, end of month ______ _
Pork (including lard), production, inspect
thous. of lb __ ______ do ____
ed slaughter
Pork (excluding lard): mil. of lb __
Production, inspected slaughter. ______ _ thous. oflb __ Stocks, cold storage, end of month ____ __ Exports. _____________ - __ ---------------Imports _______________________________ _ PriCC'S, wholesale:
_______ do ____ _______ do ____ _______ do ____
Hams, smoked, composite __________ __ Fresh loins, 8-12lb. average (New Yor
Lard:
.dol. per lb __ k) ____ do ____
Production, inspected slaughter ______ __ Stocks, dry and cold storage, end of mon Exports. __ ------------- _______________ _ Price, "'holesale, refined (Chicago) ____ _
thous. of lb .. th .... do ____
_______ do ____ .dol. per lb __
POULTRY AND EGGS Poultry:
Slaughter (commercial production) ____ _ Stocks, cold storage (frozen), end of mon
.. mil. oflb __ th
Turkeys _____________________________ _ Price, in Georgia producing area, live br
thous. of lb __ _______ do ____ oilers
Eggs: dol. per lb __
Production on farms _________________ mi Stocks, cold storage, end of month:
SheiL __ --------------------------- tho Frozen ______________________________ _ Price, wholesale, extras, large (delivered
I. of cases 11 __
us. of cases __ thous. of lb __ ; Chicago) dol. per doz ..
MISCELLANEOUS FOOD PROD UCTS
Cocoa (cacao) beans: .. long tons __ .dol. per lb ..
Imports (incl. shells) __________________ __ Price, wholesale, Accra (New York) ___ __
21,072 87.0 390
47. 950
4, 349 2.302
5. 580 5.125
474 I, 437 1, 793
352
27.01 25.81 32.50
5, 814 3, 015
17.42
17.2
1, 061 937 121
19.75 20.88
2,048
462 49 85
919.7 189, 655
2.619 43, 764
. 462
51,927 9,189
I, 076.2
800,301 206, 414
4, 831 18,918
. 571
. 478
201,269 '92, 763
26.129 .128
521
346,603 162. 055
. 141
14.6
53 57,082
.365
41,190 . 410
I I
21,584 18,861 20.595 19,454 20.272 93.3 85.6 84.8 80.0 87.4 400 351 382 360 37.>
48,959 42. 884 46, 720 44, 113 45.953
--------- --------- 4, 519 --------- ---------2, 384 1, 442 1. 539 2, 368 2. 948
15.430 1 5. 450 I 5. 450 I 5. 420 I 5.630 14.850 15.025 1 4. 975 15.005 I 5.185
424 377 423 406 358 I, 441 I, 219 1, 334 1, 433 1, 412 I, 751 I, 416 1, 753 I, 759 I, 633
386 291 344 477 349
27.81 27.44 28.22 29.32 28.82 26.10 25.97 27.78 28.63 28.69
2 36.50 2 36.00 '33.00 '35. 00 '35. 00
5, 885 5, 686 5, 733 5,652 4. 970 2, 993 2, 751 2, 900 2, 899 2 .. 551
16.25 15.32 15.72 15.77 15.59
16.1 14.8 14.5 13.8 13.5
I, 322 1, 080 I, 143 1, 101 I, 017 1, 128 875 I, 009 1, 005 962
163 !53 120 156 192
18.62 18.62 21.25 21.50 24.75 19.75 19.71 19.55 19.88 20.28
2. 084 I. 862 1, 950 2. 013 I, 890
499 582 602 660 647 68 78 66 63 73 80 66 64 94 84
929.7 783. 1 85.5. 4 912.3 898.2 189, 467 186,850 184, 641 184. 291 184, 571
I, 919 1, 470 I, 850 2. 039 2, 283 42, 574 38, 945 28,767 52, 579 43,688
. 481 . 482 . 485 . 494 . 491
66,846 55, 104 57,520 54.888 48, 144 10, 118 11, 053 10, 991 13, 478 15, 730
I, 087.0 I, 023. 5 1, 036.6 I. 046.2 944.0
812.884 771,769 775, 119 781, 917 698,326 240, 489 319, 951 337, 120 380,997 365,360
4, 976 7, 500 4, 824 4, 431 5, 709 18,404 12,900 16,538 18,829 15,689
. 539 . 500 . 506 . 496 .496
. 480 .430 . 422 . 453 . 463
200,784 183,679 191,489 193,530 179, 111 109, 100 117,900 132,200 146,900 158,200 42, 149 56,521 41,910 41,248 45,163
.124 .121 .120 .123 .120
402 346 393 432 497
331,835 293,562 250,298 215,310 199,037 160,476 140,510 112,252 86,699 67,688
.175 .165 .170 .155 . 152
14.9 14.1 16.5 16.1. 15.9
57 52 107 532 I, 004 47,085 45,701 55,015 85, 119 119,273
.356 .343 .315 . 263 . 245
22,271 15,357 19,202 20,215 20,885 .368 . 358 . 378 . 368 . 378
i I I I I I I I
l
'
20,187 19.944 20.514 21,371 82.7 78. 1 88.1 91. .5 376 374 390 409
46.056 45. 445 46,869 48,945
4, 389 ------- --------- 4, 757 3, 324 I, 253 1, 862 2, 379
I 5.690 15.730 1 5. 550 15.500 14.975 1 5.065 1 5.070 1 5.100
366 382 359 415 1, 473 1, 557 1, 450 1. 539 1, 793 1,699 1, 855 2,197
295 329 444 862
28. 15 27.61 27.36 27.48 27.24 26.47 25.96 25.38
'30. 50 2 28.50 '30.00 2 29.50
4, 902 5,184 . 4, 977 5, 767 2. 685 2,623 2. 539 2. 881
14.94 13.02 13.56 13.20
12.9 11.8 12.4 . 12.3
1. 056 1,107 1,010 I 1,177 936 912 1, 061 I. 474 168 220 431 560
25.25 22.50 22.00 20.62 20.62 19.46 19.50 19.08
1, 916 1, 991 I, 840 2,038
582 513 432 408 72 87 75 94
101 87 88 108
926.9 975.7 902.7 962.3 177, 562 172,748 170,816 178. 60ll
1, 759 2, 124 2,190 2, 729 56. 785 58,401 70.218 88,618
. 480 .469 . 461 . 473
48,010 50,008 45,719 54,344 16, 614 17.374 14,605 13. 736
941.3 965.4 892.0 1,021.6
701,039 713,515 670,330 773,253 313, 141 248,352 183,745 163, 447
4, 801 5, 788 6, 82,5 6, 546 15, 705 15,678 11, 885 12, 101
.490 . 464 . 450 .454
.496 . 457 . 446 . 480
175,734 183,991 161,921 181,780 147,800 135,600 100,300 93,000 46,840 58, 365 39,535 57,279
.120 .113 . 108 .118
482 475 545 600
196,847 196,438 226,474 277,086 64,816 66,885 87,115 133. 501
.150 .150 .14.5 .148
14.3 13.7 13.1 12.6
I, 054 888 739 554 149, 175 152, 105 149,086 134.786
. 275 . 291 .312 . 407
18,668 12,593 12,710 18,614 . 381 . 358 .370 . 383 I
22.412 21.670 91.6 97. 5 426 40\l
51,150 49,505
--------- ------ --I, 684 1, 932
15.540 15.560 15.165 15.165
471 438 I, 586 I, 462 2,401 2, 243 1, 143 1,016
27.06 26.31 24.41 23.34
2 29.00 2 29.50
6,646 6, 337 3,216 3, 299
12.60 12.19
12.7 12.4
I, 200 1,070 I, 527 1,089
532 250
19.75 18.50 18.80 18.13
2, 238 2,128
421 477 102 109 66 54
991.5 913.4 170,689 186, 134
3,379 3,117 48,452 37,805
. 461 .454
55,886 50,800 12,300 12,624
I, 190.2 l,!G3. 4
902,803 876,741 184,825 223,830
6, 896 7, 979 11,858 11,875
.439 . 450
.460 . 411
210,031 '208, 587 80,400 92,100 67,845 70,722
.114 .115
699 604
384,611 352,826 220,370 183,329
.142 .140
13.3 13.2
469 297 !19, 355 96,175
.342 .307
8,048 14,388 . 358 .330
I I I
21, fi30 s~. 4 413
49. 527
4, 847 3, 721
p15.460 p 1 5. 150
456 I, 552 I, 815
544
25.26 22.51
'30. 00
6, 968 5,462
11.19
11. 7
1, 182 1,002
141
17. 75 17.10
2, 322
r 544 68 81
986.0 '212, 069
2,560 59,387
. 449
57, 552 r 14, /94
1. 278.9
954, 721 '264, 280
4, Gt\8 13.484
P, 4.\0 . 375
238,203 123, 700 36,585
P, 108
456
•316, 686 '149, 176
.175
14.3
'188 '78, 678
. 289
32.8'>-1 .309
--
----
----
----
--
--
413 1, 564
26.10 23.31
6, 517
12.08
12.4
1, 231i
19.50 17. ill
596
205. 14~
13. 98~
301,860 143, 20:?
.16:?
14.,<
304 7.5. 473
'Revised. • Preliminary. 'Beginning January 1959, quotations are for 100 pounds of flour in bulk rather than in sacks as formerly. January 1959 prices comparable with earlier data: $5.710 per 100-pound sack for spring wheat fiour (Minneapolis) and $5.100 for winter (Kansas Gity). 'Beginning January 1959. data reflect prices at ~ational Stockyards. Ill.; not com. parable with data through December 1958 (.Tanuar,· 1959 price at Chicago, $33.00). ? Cases of 30 dozen,
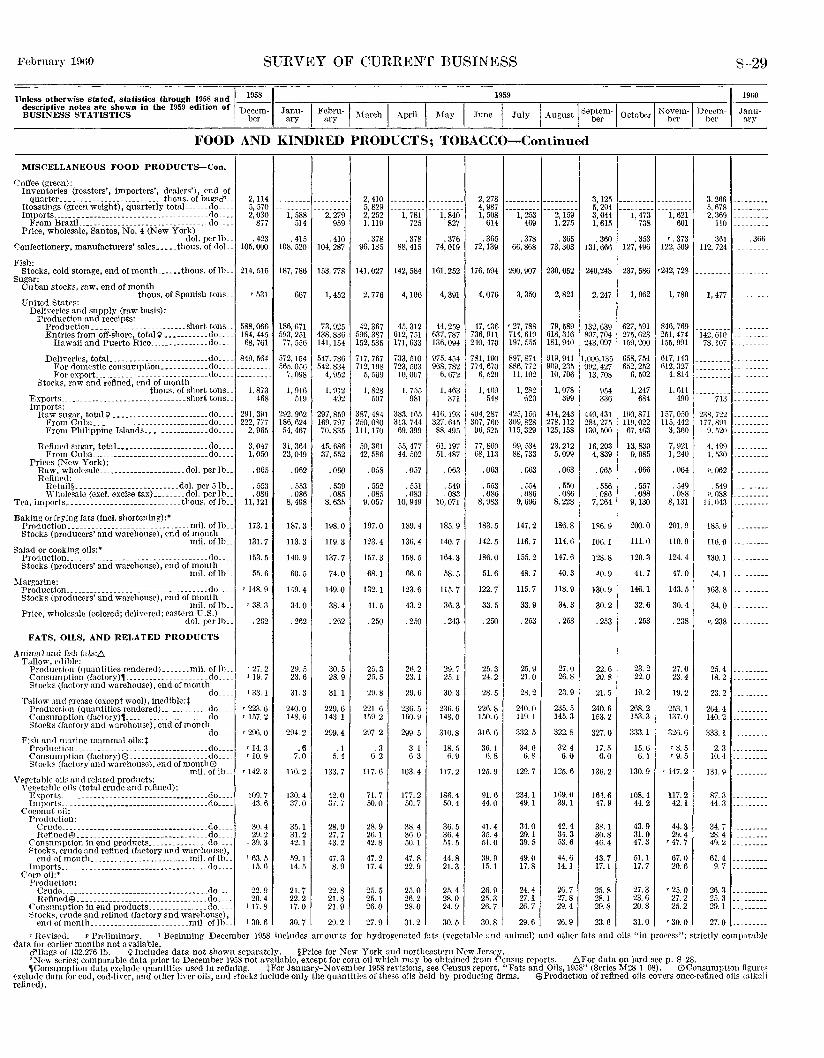
February 1960 SURVEY OF CURRENT BUSINESS S-29
Unless otherwise stated, statistics through 1958 and ~~~ 1959 descriptive notes are shown in the 1959 edition of Decein· Janu- I Febru~ I I . I I I BUSINESS STATISTICS 1 ber ary ary ::'>!arch Apnl May June July
I I 1
1960
I "'ugust I Septem-1 October I Novem-1 Decem- . Janu-- ber ber bcr ary
FOOD AND KINDRED PRODUCTS; TOBACCO-Continued
MISCELLANEOUS FOOD PRODUCTS-Con.
Coffee (green): Inventorit>s (roasters', importers', dealers'), end of
quarter ____ ------- ______________ .tho us. of bagscl' __ Roastings (green weight), quarterly totaL ..... do .... Imports. ______ --------------------- __________ .do. __ .
From Brazil --------------------------------do .... Price, wholesale, Santos, No.4 (New York)
dol. per lb .. ~onfectionery, manufacturers' sales _____ thous. of doL.
Fish: Stocks, cold storage, end of month ______ thous. of lb ..
Sugar: Cuban stocks, raw, end of month
thous. of Spanish tons .. United States:
Deliveries and supply (raw basis): Production and receipts:
Production. ______________________ .short tons_. Entries from off-shore, tota19 ___ --------do .. __
llawaii and Puerto Rico _______________ do ___ _
2,114 5, 570 2,030
877
. 423 105,000
214. 516
'531
588,06\\ 184, 44.5 68. 761
Deliveries, totaL _______________________ .do .. __ 849.564 For <lomestic consumption ____________ do .. __ --------· For export. __________________ .--- .. -.. do .. __ .. ------ _
Stoeks, raw and refined, end of month tho us. of short tons__ 1. 873
Exports ____________ ------------ _______ .short tons__ 468 Imports:
Raw sugar, totalq _------ _________________ do .. __ From Cuha _________ . ____ ----- __________ do_. __ From Philippine Islands ________________ do ___ _
Refined sugar, totaL ______________________ do ___ _ From Cuha ______________________________ do. __ _
Prices (New York): Raw, wholesale ______________________ dol. per lb __ Refined:
Retail§ __________________________ dol. per 5lb __ Wholesale (excl. excise tax) ________ dol. per lb __
Tea, imports __ --------------------------- thous. of lb ..
Baking or frying fats (Incl. shortening) :• Production _______________________________ mil. of lb .. Stocks (producers' and warehouse), end of month
mil. oflb __ Salad or cooking oils:•
Production ______________ - __ -------------- ..... do.--_ Stocks (producers' and warehouse), end of month
mil. of lb .. ~Iargarine:
Production __ ---------- _____________________ . __ do .. __ Stocke (produe~rs' and warehouse), end of month
mil. oflb .. Prict', wholesale (colored; delivered; eastern U.S.)
dol. per IlL
FATS, OILS, AND RELATED PRODUCTS
Anima I and fish fats:C; Tallow, edible:
291,391 222. 777
2, 96.5
3,047 1.050
.065
. 553
.086 11,121
173. 1
131.7
153. 5
55.6
'148. 9
'38. 3
. 262
Production (quantities rendered) _______ mil. of lb.. • 27. 2 Consumption (factory), ____________________ .do .... , 1 19.7 Stocks (factory and warehouse), end of month
do.... I 33.1 Tallow and vrease (except wool), inediblc:t
Production (quantities rendered) _____ .. ___ .. do. __ . ' 223. 6 Consumption (factory), _____________________ do ____ '157. 2 Stocks (factory and warehouse), end of month
do.... '296. o Fish and marine mammal oils:+
Production ---------------------------------do____ '14.3 Consnmption (factory)(') __________________ do... '10. 9 Stoeks (factory and warehouse), end of month0
mil. of lh. _ ' 142. 3 Vegetal>~<' oils and related products:
Ycgptahle oils (total crude and refined): Exports.. _________________________ ._----- ____ do. __ .
Imports ... -----------------·-------------- __ .do ___ _ Coconut oil:
Production: Crude .. _ ----------------------------------do. __ _ Refined (J) _________________________________ do. __ _
Consumption in end prodncts _______________ do ___ _ Stocks, crude and refine<;\ (factory and warP house),
109.7 43.6
30.4 29.2
I 39.3
end of month _________________________ mil. of! b.. I 63.5 Imports ___ --------------------------------- .do.... 1.1. 6
C'orn oil:* Production:
Crude. __ ------------------------------ ____ do ___ _ H efined(J) ____________________________ ._._.do ___ . Consumption in end products _______________ do ___ _
22.9 20.4
I 17.8
1, 588 2. 279
2, 410 5,829 2, 252 1, 119
I, 781 1, 840
2, 278 4, 987 1, 508 I, 253 2, 159
3,125 5, 204 3,044 1, 615
I,473 1,621 514 959 725 827 614 469 1. 275 738 601
. 415 . 410 . 378 . 378 . 376 . 365 72,139
. 378 . 365 . 360 .353 '.373 108. 520 104, 287 96,18.5 88. 4I5 74,019 66, 868 73, 303 !3I, 666 I27, 496 I22, 509
187, 786 153, 778 141,027 142, 584 161,252 176, 594 200,907 230,052 240,248 237, 586 '242, 728
667
186,671 593, 251 77,556
572, 154 565.056
7, 098
I. 916 519
292.962 186,624 54, 467
31,364 23,049
.062
. 553
.086 8, 498
187.3
113.3
140.9
60.5
149.4
34.0
. 262
29.11 23.6
31.3
240.0 148, 6
294,2
.6 7.0
110.2
130.4 37,0
35.1 31.2 42.1
.)9.1 14. 5
21.7 22.2 17.0
I, 452 2, 776 4,106
73, 925 42, 367 45, 312 438,836 596, 387 6I2, 75I I41,I54 152,535 171,633
547,786 542.834
4, 952
1, YI2 492
717, 767 712,198
5, 569
I. 828 507
733, 510 723, 503 10,007
1. 755 981
4, 391 4,076 3, 350 2,821 I, 962
44,259 47,436 '27, 788 79,589 132,639 627,591 637. 787 736, 911 i14, 619 618, 316 807, 704 275, 623 136,094 240, 470 197, 555 181,940 243,097 159,200
975. 454 781, 190 968, 782 774, 670
6, 672 6, 520
I, 463 371
1. 469 548
897,874 886,772 ll. 102
1 282 '620
919,941 1,006,135 658,754 909, 2.35 992, 427 652, 252
10, 706 13, 708 6, 502
I, 078 399
954 336
1, 247 684
297,859 387, 484 383, 16.5 416. 193 404,287 425, 156 414,243 169,797 250,080 313,744 327, 645 307,760 309.828 278, 112 70,835 111, 170 69,399 88, 495 96, 525 115,329 125, 158
440, 431 284,275 130,500
100,871 119,022 67,463
45, 686 37, 552
.060
. 539
. 085 8. 635
198.0
119.3
137.7
74.0
149.0
38.4
. 262
30.5 28.9
31.1
229.6 14:l.1
299.4
.1 5. 4
133.7
42,0 37.7
28.9 27.7 43.2
47.3 8. 9
22.8 21.8 21.9
50,361 42,586
. 058
. 552
. 085 9.057
197.0
123.4
157.3
68.1
132.1
41.5
. 250
25.3 2.1. 5
29.8
221.6 1.19. 2
297.2
.3 6.2
117.6
71.7 50.0
28.9 26.1 42.8
47.2 17.4
25.5 25.1 26.0
55, 477 44. 502
.057
. 551
.083 10. 949
189.4
I36. 4
I58. 5
66.6
123.6
43.2
.250
26,2 23.1
29,6
236 .. 5 lllO. 9
299.5
3, I 6.3
103.4
177.2 50.7
38.4 36.0 50.1
47.8 22.9
25.0 26.2 28.0
61,197 .51, 487
. 063
. 549
. 083 10.071
185.9
140.7
164.3
58.5
115. 7
36.3
. 243
2H. 7 25. I
30.3
23fi. 6 148.0
310.8
18.5 6. 9
117.2
186.4 50.4
36.5 36.4 51.5
44.8 21.3
25.4 28.0 24.9
77, 860 68,113
. 063
. 553
.086 8,983
183.5
142.5
186.0
51.6
122.7
33.5
. 250
25.3 24.2
28.5
226.8 !50. 6
316.6
36.1 6.8
125.9
91.6 44.0
41.4 35.4 51.0
39.9 1.5.1
26.9 25.3 26.7
99, 534 88,733
. 063
. 554
.086 9, 696
147.2
116.7
155.2
48.7
115.7
33.9
. 253
25.9 21.0
28.2
240.0 119.1
332.5
34.0 6.8
129.7
234.1 49. I
34.0 29.1 39.5
49.0 17.8
24.4 27.1 26.7
23,212 5,099
.063
. 550
. 086 8,228
186.8
114.6
147.6
40.3
118.9
34.3
. 253
27.0 26.8
23.9
235.5 145.3
322.8
32.4 6.0
125. 6
169. () 39.1
42.4 34.3 53.6
44.6 14.1
26. 7 27.8 29.4
16,203 4, 839
. 065
. 556
. 086 7, 264
1~6. 9
lOti. I
128.8
!0. 9
130.9
30.2
. 253
22.6 20.8
21. .5
240.6 153. 2
327.0
17.5 6.0
136.2
164.6 47.9
3R.1 30.8 46.4
43.7 17.1
25.8 28.1 29.8
I3, 830 9, 085
.066
. 557
. 088 9,130
200.0
111.0
120.3
41.7
146.1
32.6
. 253
23.2 22.0
19. 2
268.2 153.3
333. I
15.6 6.1
130.9
108.4 44.2
43.9 31.0 47.3
51.1 17.7
27.3 23.6 20.8
1, 780
846,769 251, 474 155, 091
617,143 612.327
4. 814
l.Gll 490
157,050 115, 442
3,360
7,921 1, 240
. 064
. 549
. 088 8, 131
201.9
110.9
124.4
47.0
143.5
30.4
. 238
27.0 23.4
19.2
253.1 137.0
326.6
'8. 5 '9. 5
'147. 2
117.2 42.1
44.3 29.4
'47. 7
67.0 20.6
'25. 0 27.2 25.2
3. 26fl 5. 678 2.369
110
3tll 112, 724
.366
1, 477 ---------
142.610 78. 107
71:l
238. 722 177.891
9. 520
4. 499 I, 530
P. 062
. 54~) P. 088
11.043
185.9
116.0
130. 1
54. I
163.8
34.0
P. 238
25.4 18.2
23.2
2G4. 4 140.2
:!33. I
2. 3 10.4
131. g
87.3 44.3
34.7 28.4 49.2
61.4 9. 7
26.3 25.3 29.1
Stocks, erude and refined (factory and warehouse), en<lofmonth _________________________ mil.oflh.. 130.6 30.7 29.2 27.9 31.2 30.5 30.8 29.6 26.9 23.6 31.0 '30.0 27.0
'ReYiscd. v Preliminary. 1 Beginning December I958 includes amounts for hydrogenated fats (vegetable and animal) and other fats and oils "in process"; strictly comparable' data for earlier months not available.
ci'Bags of 132.276 lb. !;'Includes data not sbown separately. §Price for New York and northeastern New Jersey. •:-Jew ser!e.s; comparable data prior to December I958 not available, except for corn oil which may be obtained from Census reports. b. For data on lard sec p. S-28. ,Consumption data exclude quantities used in refining. H'or January-November 19118 re;-isions, see Census report, "Fats and Oils, 1958" (Series M28-1-08). (')Consumption figure>
exclude data for cod, cod-li1·er, and other liHr oils, and etocks include only the quantities of these oils held by producing firms. $Production of refined oils covers once-refined oils (alkali refin~d).
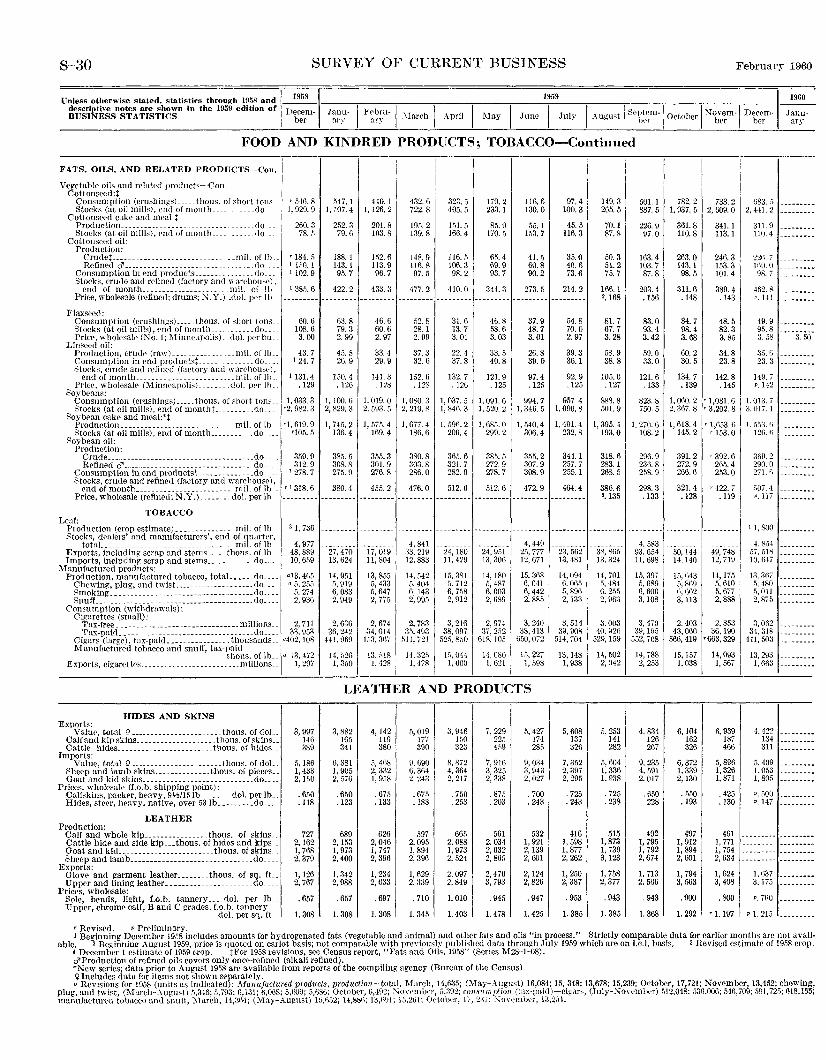
S-30 SURVEY OF CURRENT BUSINESS February 1H60
19:>9 Unless otherwise slated, statistics through 1958 and ~~~~
descriptive notes are shown in the 1959 edition of Dere_ nl· Janu- I F('bru-J I BUSINESS STATISTICS
1 ber m)· ary :\larch .\pril I l\Iay I June I July
1
1960
I Augmt I Septcm-1 October I :-.fovem-1 Decem-~ bPr ber ber ar)-
FOOD AND KINDRED PRODUCTS; TOBACCO-Continued
FATS, OILS, AND RELATED PRODUCTS-Con.
Vegetable oils and related products-Con. Cottonseed :t
Consumption (crushings) ____ . thous. of short tons Stocks (at oil mills), end of month .......... do
Cottonseed cake and meal t Production ______________ .______ . ____ _ Stocks (at oil mills), end of month ___ _
Cottonseed oil: Production:
do do _
Crudet------ ---------------- .. mil. of lb Refined <1'------------------------- _ do
Consumption in end products _______________ do . Stocks, crude and refined (factory ami wan' house).
end of month _____________________ mil. of lh Price, wholesale (refined; drums; "'.Y.) .dol. rwr lb
Flaxseed: Consumption (crnshings) ____ thous. of short ton,; _ Stocks (at oil mills), end of month___ __ ____ <Jo __ _ Price, wholesale (No.I; Minneapolis). dol. perbu _
Linseed oil: Production, crude (raw) ______________ mil. of lb .. Consumption in end productst----- _______ do ___ Stocks, crude and refined (factory and warchousP),
end of month __________________________ mil. of lh Price, wholesale (Minneapolis) ______ dol. per lh_
Soybeans: Consumption (crushings) ____ . thous. of short tom .. Stocks (at oil mills), end of month+ .. ________ do ..
Soybean cake and meal:*+ Production .. _______________________ .... miL of lb. Stocks (at oil mills), end of month ___________ <Jo __ __
Soybean oil: Production:
Crude ___________ -------- __________ ------ __ .do. __ Refined d' .. ________________ ------------ __ .. do. __
Consumption in end products+------------- .do __ __ Stocks, crude and refined (factory and \Yarrhouse),
end ofmonth _________________________ miL of !h .. Price, wholesale (refined; N.Y.)------ .. doL per !h.
TOBACCO Leaf:
'n4!l. 8 1, 929.9
260.3 78. ,,
'184. ·' l 1-'0.1 l 102.9
l 385.6
60.6 108.6 3. 00
43.7 124.7
1131.4 .129
1,033.3 •2, 982.3
··1, fil9. 9 •105. 5
359.9 312.9
1278.7
d 318.6
Production (crop estimate) _______________ miL of !h._ 31,736 Stocks, dralcrs' and manufacturC'rs', end of quartt'r,
totaL ____ .. _________________________ miL of lb __ Exports, including scrap and stems ..... thous. of lb .. Imports, including scrap and stems ____________ do ... _
Manufactured products: Production, manufactured tobacco, totaL ..... do ...
Chcwinv, plug, and twist. ___________________ do -P.mokiilg ____________________________________ do_. __ Snuff _______________________ ----------------. do. __ .
Consumption (withdrawals):
4, 977 48,889 10,659
ai3, 41)5 a 5, 255
5, 274 2, 936
Ciprcttes (small): Tax-free _______________________________ m!lllons.. 2, 711 Tax-paid _______________ ------------ _____ .. do .. __ 33,953
Cigars (large). t.ax-pald _______________ .thousands __ "402, 108 Manufactured tobacco and snuff, tax-paid
thous. of! b .. a 13,472 Exports, cigarettes .. ______ . ________________ mi!Eons.. I, 297
HIDES AND SKINS Exports:
Value, total ({ ------------ ___________ tl10us. of doL Calf and kip skins ____________________ thons. of skins __ Cattle hides ----------------------- thous. of hides ...
Imports: Value, total ({ ____ ------------------ _ tlwus. of doL_
Sheep and lamb skins .. ____________ thous. of pieces .. Goat and kid skins ____________________________ do __ __
Prices, wholesale (f.o.b. shipping point): Calfskins, packer, heavy, 9 ~~/15lb. _______ doL per lb .. Hides, steer, h<·avy, native, over 53lb ......... do ....
LEATHER Production:
Calf and whole kip ________________ thous. of skins._ Cattle hide and side kip .... thous. of hides and kips __ Goat and kid ________________________ fhous. of skins __ Sheep and lamb_. _____________________________ do ....
Exports: Glove and garment leather ........ thous. of sq. ft.. Upper and lining leather ______________________ do ....
Prices, wholesale: Sole, bends, light, f.o.b. ta1mery .... doL per !h .. Upper, chrome calf, Band C grades, f.o.b. tannery
doL per sq. ft..
3, 997 146 389
5, 186 I, 433 2,150
. 650
.118
727 2,162 1, 768 2, 379
I, 126 2, 767
. 657
1. 308
1, c07. 4
252.3 79. G
188. 1 143. I 95.7
422.2
63.8 79.3 2. 99
45. 5 26.9
150. 4 . 126
1,100. 6 2, 829. 3
1, 74!3. 2 136.4
38.5. 5 308.8 275.9
380.4
27, 470 13,624
14.951 5, 919 6, 083 2, 949
2, 636 36, 242
441, 9G9
14, ;,26 1, 350
i I
440. I I 1,126. 2 .
201.8 103.8
152.6 113.9 96.7
433.3
46.6 60.6 2. 97
33.4 29.9
141.3 .128
I, 019.0 2, 593. 5
I, 575.4 169.4
355.3 301.9 276.8
455. 2
17,019 11,804
13,855 5, 433 5, 647 2,77.5
2, 674 34.614
-!;i:i. 3()7
13, GIS 1, 428
432. G 722.8
10.5. 2 139.8
148.9 116.8 97.5
477.2
52. 8 28. I 2. 99
37.3 32.6
152.6 .128
I, 080.3 2, 219.8
1, 677.4 186.6
380.8 303.8 286.0
476.0
4, 841 33,219 12,883
14,542 5, 404 6,143 2, 995
2, 783 3fi. 493
511, 721
14. 32[; 1, 478
323.5 405.5
151.5 166.4
ll6. 5 106.3 98.2
410.0
31.6 13. 7 3. 01
22.4 37.8
132. 7 .126
I, 037. 5 I, 84(\. 3
1, 596.2 200.4
36.5. 6 321.7 282.9
512.6
24, ISO II, 429
15.381 fl. 712 6, 7.58 2, 912
179. 2 233.1
8.5. 9 170.5
65.4 69.9 93.7
344.3
46.8 58.6 3. 03
33. 5 40.8
121.9 .125
I, 091.6 I, 520. 2
1,685.0 299.2
385.5 272.9 278.7
512.6
24, 9fil 13,306
14. 180 5, 487 6, 003 2, (\89
I 116.6 130.0
55.1 !.53. 7
41.5 60.8 90.2
273.5
37.9 48.7 3.01
26.8 39.0
97.4 .125
994.7 l, 346. 5
I, 540.4 306.4
3.55. 2 307.9 308.9
472.9
97.4 100.3
45.5 116.3
35.0 40.6 73.6
214.2
54.8 70.0 2. 97
39.3 36.1
92.9 .125
957 4 1,090. 8
1,491.4 232.8
344.1 257.7 255. 1
464.4
,..,! 265.5
70.1 87.8
50.3 51.2 75.7
166.1 '· 168
81.7 67.7 3. 28
58.9 38.8
105.0 .127
888.8 501.9
1,395. 4 193.0
318.6 283.1 268.5
386.6 2,!35
4. 449 --------- ---------2fi, 777 23, .\62 3X, 86.5 12, 671./13, 481 13. 324
1-5, 368 14, 1194 14, 701 6, 041 G. Of\.5 5. 484 6, 442 5, 896 6. 255 2, 885 2, 133 2, \If,;)
3,216 2,97-1 3,2411 3, 514 39. \JOR
3.003 40. 92fi
529, 159 38,097 37, 252 38,413
s2.s. s.so 161s. 1o5 I 65o, o•2 1o, 044 14, ooo 115, 227 1,600 1,621 1,598
514,7041 13,148
I, 938 14, 5021
2, 042
LEATHER AND PRODUCTS
3, 882 165 341
6, 381 I, 905 2, 576
.650
.123
689 2,153 I, 973 2,400
1, 342 2, 988
. 657
1.308
4, 142 119 380
;,, 4G8 2,332 I, 958
. 675 '133
626 2,046 I, 747 2, 396
1, 234
2:::: I 1. 308
5, 019 177 390
9, 690 6,3f\4 2, 243
. 675
.183
597 2, 095 I, 894 2, 396
I, 629 2, 339
.710
I. 345
3, 946 lf>O 323
8, 872 4, 364 2, 217
. 750
. 253
665 2, 088 I, 973 2, 524
2, 097 2, 849
I. 010
I. 403
7, 229 22.1 4f>9
7, 916 3,325 2, 33R
. 87fJ
. 203
561 2. 034 2, 032 2, 865
2, 470 3, 793
. 945
1. 478
5,427 174 285
9, 034 3, 943 2, 027
. 700
. 243
532 I, 921 2,139 2, 601
2,124 2,826
. 947
1.425
5, 608 137 326
7, 352 2.397 2, 295
. 725
. 243
416 1, 598 1, 877 2, 262
I, 250 2, 387
.953
1. 385
5. 253 141 282
5, 604 1, 336 1. 938
. 725
. 238
515 1, 873 1, 739 3,123
1, 758 2,377
. 943
1. 385
501.1 887.5
226.9 97.0
163.4 103.7 87.8
203.4 .156
83.0 93.4 3.42
59.0 33.0
121.6 . 133
823.8 750.5
1, 270.6 108.2
296.9 236.8 258.9
298.3 .133
4. 583
782. 2 733. 2 I, 937. 5 2, 609. 0
361.8 341.1 110.8 113.1
263.0 246.3 143.1 153.3 98.5 101.4
311.6 389. 4 .148 . 143
84. 7 48. 5 98.4 82.3 3. 68 3. 85
60. 2 34.8 30. 5 23.8
134. 7 142.8 .139 .145
1, 060. 2 '1,081. 6 2, 367. 8 ' 3,202. 8
I, 618.4 'l,f\53. 6 145. 2 ' 153. 0
391. 2 '392. 6 272.9 265.4 266.6 253.0
321.4 '422. 7 .128 . 119
ti83 . .) 2, 441. 2
311.9 110.4
22H. 7 IC.O.O 98.7
462.8 P. J41
49.9
355~ ----a:5o· 3.5. G 23.3
149.7 P. 142
1.013. 7 :3.(117. I
1, ,).~3. ti l2fl.l)
30H. 2 290.0 271. H
:)07. 4 Jl. 117
93, 654 50, 144 49, 748
l 1,800
4. 854 57, 518 JO.fi-!7 II. 698 14,140 12,719
15,397 5, G89 6, 600 3,108
15,043 5, 86(1 0,062 3,113
14, 175 i 13,367 5, 610 i 5. 480 5, 677 5, 011 2, 888 2, 875
3, 470 I 2, 403 2, 85:l 3, 062 39, 105 43,060 36, 190 34.318
552,708 566, 419 •663, 329 441, 503
14, 788 15, 157 2, 253 I, 038
4. 834 126 267
9, 235 4, 591 2. 017
. f\50
. 228
492 I, 795 I, 792 2,6i4
1, 713 2. 566
. 943
1.368
6,104 162 326
6, 372 1,339 2,130
• 550 .193
497 I, 912 1,894 2,601
I, 794 3,563
. 900
1.292
14,093 13,293 1, 567 I I, 663
6, 939 187 466
5,896 1,326 I, 871
. 425
.130
461 1, 771 1, 754 2, 634
I, 624 3, 408
.800
'1.197
4.122 134 311
5. 409 1.053 I, 80,1
P, 500 P.J47
I. 637 3,175
P, 7()0
pI. 215
'Revised. • Preliminary. 1 Beginning December 1918 includes amounts for hydrogenated fats (vegetable and animal) and other fats and oils "in process." Strictly comparable data for earlier months arc not avail-
able. 2 Beginning August 1959, price is quoted on carlot basis; not comparable with previously published data through July 1959 which are on I.e. I. basis. a Revised estimate of 1958 crop. • December 1 estimate of 1959 crop. tFor 1958 revisions, sec Census report, "Fats and Oils, 1958" (Series M28-1-08). d'Production of refined oils covers only once-refined (alkali refined). *New series; data prior to August 1958 are available from reports of the compiling agency (Bureau of the Census) !I Includes data for items not shown separately. a Revisions for 1958 (tmits as indicated): llfanufactured products, production-total, March, 14,63,5; (May-August) 16,084; 15, 348; 13,678; 15,239; October, 17,721; November, 13,452; chewing,
plug, and twist, (rviar('h-August) .'1,346; 5,793; G,l31; (),068i 5,09~1; .1,6S6: October, 6,·!92; ~o,-emb('r, 5.392; cowwmption (t~n-paid)-eig<WS, (Ju1y-Xon:mber) 512,048: ;)36,000; 546,709; 591,72tl; (H8,1M; tnanufacturt.'{i tobacco and snutr, l\larch, 14,::SIW; ~~'lay-August) lb,t);)2; l4)·>lSG; l::S,6\Il; lb,:!til; Oct.oix·r, li, ~Ji; ~\ovember, 13,2(».
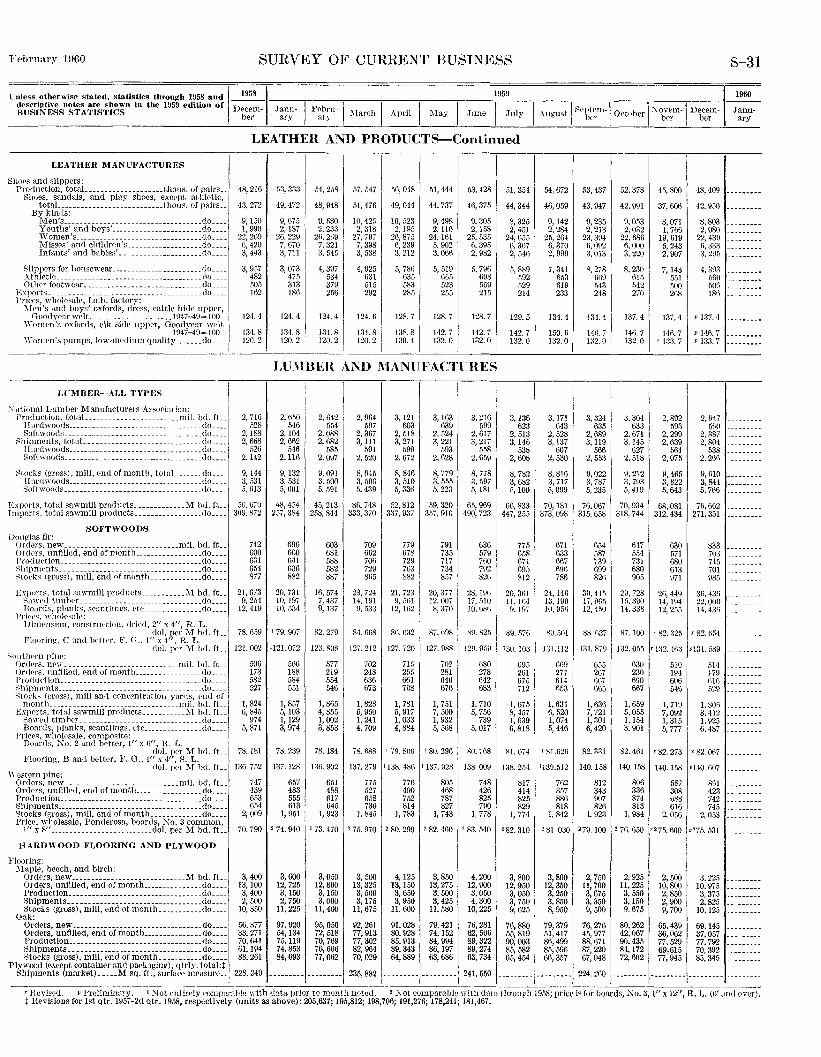
SURVEY OF CURRENT BUSINESS S-31
l'nless otherwise stated, statistics through 1958 and I~~ 1959 desCTiptive notes are shown in the 1959 edition of I , . I I I I I BUSINESS STATISTICS . Db'::'~m- J~~~~- F~~~~u- l\farch April l\Iay June July
1
1960
I \ugust I Septcm-1 Octo be I Novem-1 Decem- Janu-~ , ' bC'r r ber
1 brr ary
LEATHER AND PRODUCTS-Continued
LEATHER MANUFACTURES
Sho<'S and slippers: Production, totaL ................... thous. of pairs ..
Shoes, sandals, and play shoes, except athletic, .
Bf~~~.;~~:;~;~-~~~;;;;;;;;;;~h;l:~·:;;:~~~S:.I Misses' and childrrn's ................... do .... l Infants' and babies' _____________________ flo ___ _
Slippers for houscwcar ....................... do ... . .\thletic_ .................................... do ... . Other footwcar .............................. do ... .
Exports ....................................... do .. .. l'rkrs, whol('Salf', f.o.b. factory:
:l-Ien's and boys' oxfords, dress, cattle hide upprr, Goodyear welt. .................... 1947-49= 100 ..
Women's oxfords, elk si<lr upper, Goodyear writ 1947-49= 100 ..
\\'omrn's pumps, low-medium quallty ....... do .... , I
LUMBER-ALL TYPES I >,-,\tional r_~umher Manufacture-rs Asso('iation; . I
I roductwn, totaL .. _____________________ rml. od. ft..
1 liard 'voods __________________________________ do ___ _ Softwoorls ___________________________________ do ___ _
Shipments, totaL __ ---------- ________________ .do ___ _ llardwoods .................................. do ... . Soft woods ......... _ ............ ______ ._ ..... do .. ..
Stocks (gross), mill, end of month, total ....... do .. .. Hnnlwoods .................................. do ... . Softwoods ___________________________________ do ___ _
48,216
•13, 272
9,150 1,990
22,269 6, 420 3, 443
3, 957 482 505 162
124.4
134.8 120.2
2, 716 528
2,!88 2, 668
526 2,142
9,144 3, 531 5, (i!3
53,333
49,472
9, 675 2,187
26,229 7, 670 3, 711
3,073 47.5 313 186
124.4
134.8 1
120. z I
54, 25R
48,948
9, 580 2, 233
2fi,2tl9 1. 321 1
3, 545 I
4 39i I '534 379 256
124.4
134.8 120.2
::::;I 10, 425 2,318
27, 797 7, 398 3, 538
4, 925 631 515 292
124.6
134.8 120.2
.56, 048
49,044
10,523 2,195
26, 875 6, 239 3, 212
5, 786 635 583 285
128.7
138.8 130.4
51, 444
44,737
9, 498 2,110
24,161 5, 902 3, 066
5, 519 (\65 523 2-55
128.7
142.7 132.0
-53,428
46,375
9. 305 2, 158
25, 535 6, 39.5 2, 982
5, 79() 698 559 215
128.7
142. 7 132.0
LU:\1UEH. AND l\IANUFACTURES
2, ti-00 546
2,104 2, 6fi2
546 2,116
9, 132 3, .531 5, GO!
I I
2,\142 i 554 .
2, 088 2, 682
585 2,097
9.091 3 500 5:591
2, 964 597
2, 367 3,111
591 2, 520
8, 945 3, 506 5, 439
3,121 I 603
2, 518 3, 271
599 2. 672
8, 846 3, 510 5, 336
I !
3, 163
1
•
639 2, 524 3, 221
593 2, 628
8, 779 3, 555 5, 223
3, 216 599
2, 617 3, 217
558 2, 659
8, 778 3, 597 5, 181
51,354
44,344
8, 325 2, 451
24, 655 6,307 2,541)
5, ss9 1
.592 529 214
129.5
142.7 132.0
3,136 623
2, 513 3,146
538 2,608
8, 782 3, 682 5,100
54,672
46,059
9,142 2, 284
2.5, 264 6, 370 2, 999
7, 341 653 619 233
134.4
150.6 132. o I
3,171 043
2,528 3,137
607 2, 530
8, 816 3, 717 5, 099
53,437
43,947
9, 235 2,213
2:J, 394 6, 092 3, 013
8, 278 6fi9 543 248
134. 4
14fi. 7 I J:l2. 0
3, 324 635
2, 689
3,M~ 2, 553
9,022 3, 787 5, 235
52,3781
42,991
9,053 2,032
22.686 6,000 3, 220
8, 230 61.5 542 270
137.4
14fi. 7 132.0
3 3041 '633
2, 671 3,145
627 2, 518
9, 212 3, 793 5,419
45,800
37,606
8,071 1, 766
19,619 5, 243 2, 907
7,143 551 i 500 268
137,4
146.7 '1:13. 7
2, 892 593
2, 299 2, 639
564 2,075
9,465 3,822 5, 643
48, 409
42,950
8,803 2, 080
22,439 fi,333 3. 29ii
4,393 .'160 50G 186
p 137.4
p 14ft 7 p 133. 7
2, 947 5f.O
2, 387 2,804
538 2,2(}()
9,C.!O 3,R44 5, 766
Exports, total sawmill products ............. M bd. ft.. 51i, 670 48,454 4.5, 213 86, 748 52,812 59,320 65,969 66,833 70,181 76,067 70.934 68,081 76,662 Imports, total sawmill products ................. do .... 309, 872 257, 384 258, 844 333,370 3:37,937 357,910 490,723 447,255 373,098 315,658 318,744 312,434 271,351
SOFTWOODS Doll!'las fir:
Orders, new ............................. mll. bd. ft .. OrdPrs, unfilled, end ofmonth ................. do .. .. Production ____________________________________ do. __ _ Shipnwnts _______ -------- _____________________ do ___ _ ~toeks (gross), mill, end ofmonth _____________ cto ___ _
Exports, total sawmill products ........... l\1 bd. ft.. SawNl timlH'r _______________________________ do ___ _ Boards, planks, scantlings. rte _______________ cto ___ _
l'rie('.<..:, wh<Jksa.le: IHnwnsion, eonstruction, drit>d, 2" x 4", R. L.
dol. per M hd. ft.. Floorin).!.', ('and lwtt(•r. F. 0., 1" x 4", R. L. '
742 600 631 654 877
21,673 9, 254
12,419
78.6.09
696 660 641 (i36 882
20, 731 10, 197 10, 534
I 79. 907
dol. P<'r M hd. ft.. !21. 002 1121.072 ::-:outlu•rn pine:
Ord<•rs, np\1·. ____________________________ mil. bel. ft. .. Or<l<•rs, unfilled, end of rnont.h ................. do .. .. Produet ion ___ -------- ___ --------- _____________ do ___ _ 81lipllH'nts _____________________________________ do ___ _ StoC'k'-' (gross), mill anfl c0nec>ntration yards, Pnd of
IIIOHtiJ ..................... ,_, ________ rniJ. hd. ft .. I Exports, tot,! I sawmill products ........... l\1 hd. ft..
Sawed tim her _______________________________ do ___ _ Boards, plankR, seantlings, etc _______________ do ___ _
Priers, '''holrsale, eomposih': Bonnls, No.2 and better, 1" x fl", R. L.
506 173 .582 527
1,824 6, 845
974 5, 871
dol. prr M bd. ft... 78. 181 Flooring, B and better, F. G., 1" x 4", S. L.
dol. P<'r M bd. fL. 136. 752 Western pine:
Orders, new ............................. mil. hd. ft .. Orders, unfilled, end of mont.h ................. do ... . Product.ion .................................... do .•.. Shipments ..................................... do ..•. Stocks (gross), mill, end of month ............. do ... .
747 439 6.53 654
2, 009
566 188 584 551
1, 857 5,103 1, 129 3, 974
78.239
1:J7. !2S
657 483 555 613
1, 951
603 081 588 582 887
16, 574 7, 437 9, 137
82. 279
12~1. 80;:)
577 219 554 546
I, 865 4, 855 1, 002 3, 853
78. 184
13(). 902
~~~ I 617 645
1 923
709 662 706 729 8fi5
23, 724 14,191 9, 53:J
84. 6(;8
127.212 I 702 248 636 073
1, 828 5, 950 1, 241 4, 709
78. H8S
779 678 729 763 882
21,723 9. 5()1
12, lfi2
8fi. 032
127. 720
715 255 661 708
1, 781 5, 917 1,033 4, 884
791 735 717 734 8.57
20, 377 12,007 g, 370
~7. li98
127.988
702 281 646 676
1, 751 7, 500 1, 932 5, 568
I 79. 806 I 80. 296
137. 279 I 138. 481\ I 137. 928
775 527 658 736
1, 845
776 490 752 814
1, 783
805 468 787 827
!, 743
636 579 760 792 826
28. !9() 17, -"10 10. 68G
89.82.1
12\J. 959
(i80 278 642 683
1, 710 5, 756
739 5,017
80. 7li8
138.009
748 426 825 790
1, 778 Price, wholesale, Ponderosa, boards, 1'\o. 3 con1n1on,
I" x 8" .......................... dol. prr M bd. ft .. 70. 790 2 74. 940 2 73. 470 2 75. 970 2 so. 290 ' 82. 460 I ' 83. MO
HARDWOOD FLOORING AND PLYWOOD
Floorin)!: :1-Iaple, beech, and birch:
Ordc·rs, new ............................. M bd. ft .. Orders, unfilled, end of month ............... do .. .. Production .......... _ ....................... do ... . Shlpments ........................ __________ do ... . 8tocks (gross), mill, end of month ........... do ... .
3,400 13,100 3, 400 2, 500
10, 850 Oak: 1
Orders, new ................................. do.... 56,877 Orders, unfilled, end ofmonth ............... do.... 33 2'll Production .. _ ............................... do.... 10; 641 Shipments .................................. do.... 61,194 Stocks (gross), mill, end of month ........... do.... 88,261
Plywood (except container and packJging), qtrly. t.otal:t
3,600 12, 725 3,150 2, 750
11,225
97,920 54,134 75, 119 74,853 84,693
3,050 12,800 3,150 3,000
11,400
95,050 72,518 70,769 76,666 77,062
3, 500 13,325 3, 500 3,175
11,675
92,261 77,913 77,302 82,964 70,029
4,125 13,150 3, 650 3, 950
11, 600
91,028 80,928 85,913 89,343 64,889
3,850 13,275 3,500 3, 425
11,580
79,421 74,152 84,994 86,197 63,686
I 4,200
12,900 3,050 4,300
10,225
76,281 62,506 89,322 89,274 63,734
775 658 671 69!) 812
20,361 11, Hi4 H. 197
671 633 667 (\91)
786
21,146 13,190 10, 95f)
654 587 739 699 82(;
30, 4L1 li, f/65 12,4!)()
647 554 731 680 905
29, 728 15,3\10 14.338
630 571 680 613 971
2G, 449 14,194 12,255
833 7o:J 715 701 985
36,4311 22,000 14,43'i
89. 57G I ' Sll.501 KK. (i37 87. 100 • 82. :325 I p 82. (i54
1:1o. 103 1 131.!12 131.879 1:!2. 055 q:;z. 41\:l ]•131. 589
695 261 (i75 712
1, 675 8, 457 1, 639 6,818
669 277 614 653
1, 634 6, 520 1, 074 5, 446
(i55 267 667 6U5
1,636 7, 721 1, 301 6,420
630 230 690 667
1, 659 5,055 1, !54 3,901
510 194 606 546
1, 719 7,092 1, 315 5, 777
514 17!) li}()
52\i
1. SOfi 8, 412 I. 925 (), 487
81.074 I 81.626 82.331 82. 4lil '82. 273 P 82.007
13K 254 '139.512 140. 158 140.158 140. !.58 vHO. f\07
817 414 825 829
1, 774
762 357 886 818
I, 842
812 343 907 826
1, 923
806 336 874 813
1, 984
587 308 ti88 616
2, 056
R!>l 423 742 74.5
2, 053
082.310 Z 81.030 279.100 2 76.650 ''75. 600 v275. 531
3, 800 12,950 3, 050 3, 750 9, 625
76,880 55,819 90,003 85, 582 65,454
3,800 12,350 3,250 3,850 8, 950
79,379 51,417 86,499 85,596 66,357
2, 750 11,700 3,675 3,350 9, 500
76,276 45,977 88,671 87,220 67,048
224. 2fi0
2, 925 11,225 3, 550 3,150 9, 675
80,262 42,067 90,435 84,172 72,602
2, 500 10,800 2,850 2, 900 9, 700
65,439 36,062 77, 529 69,615 77, 945
3,225 10,97.5 3, 375 2,825
10,125
69.14.5 37,057 77,792 70,392 85,345
Shipments (market) ..... l\1 sq. ft.., surface mcasurr .. i 228,249 .................. 235,882 ......... ---------1 241,550 -------- ----- ---------1 ---- ---,-·--·---- ----,----·-,_---,-_:_ ___ ..:__--,-----,---_c---,---,-,---,..:__-:--:--...,..,-:-:-::--::---:
r Ht.rri.srd. J! Prelimllwry. t Not enti!·ely con!IX:.r-:lb!<J \nth d::!.ta prior UJ month llPted. 2 ?\ot rornparabl~ ".Yith d~1ta through 1958; price i-; for Uoard.s, 2\o. 3, l" x 12", H.. L. (h' and over). t Revisions for 1st qt.r. 1957-2d qtr, 1958, respectively (units as above): 205,637; 195,812; 198,706; 191,276; 178,241; 18!,467.
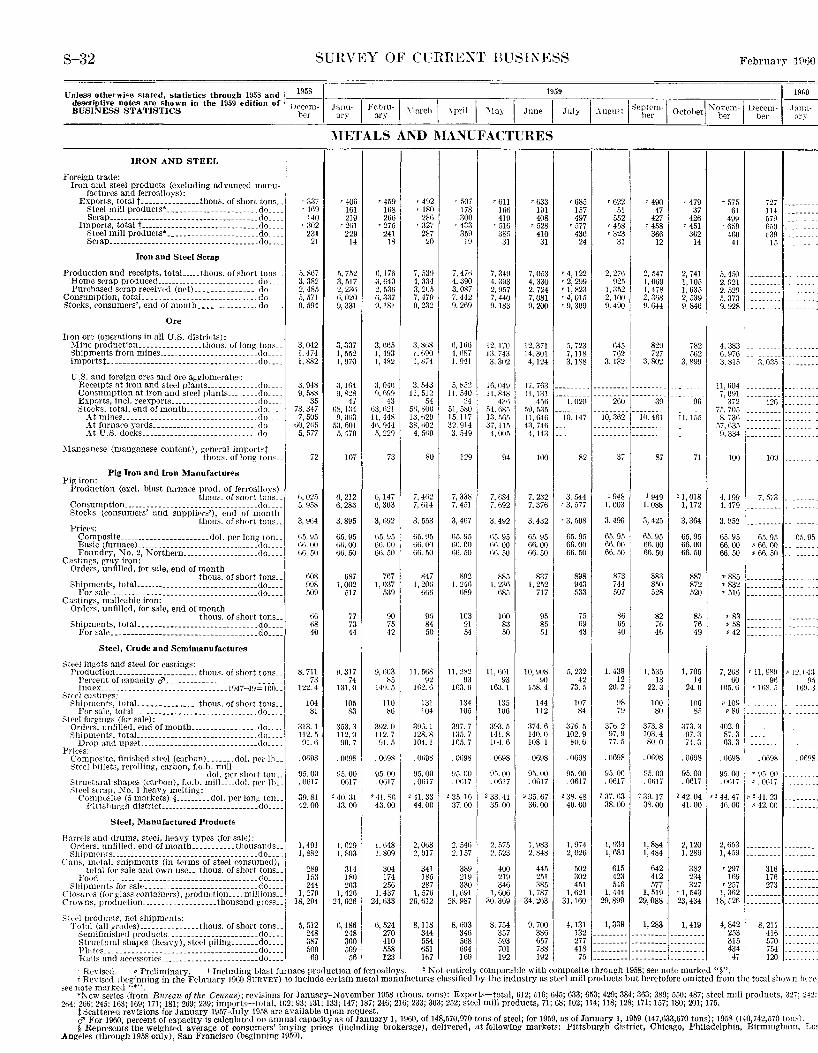
S-32 SURVEY OF Ct~RRE~T BUSI~ESS FebrnaQ' lHt\0
llnless otherwise stated, statistics through 1958 and' 1958 ~------,---,----,-------,----,----~,95:._9 ___ 1
__ 1
___ ,-----,--------,~- ~-~;~,o--~uS'iNt:.rssns!flTis~rcsn in the 1959 edition of' I )Perm- Janu- I Fcbru-1 :\hrch I _\pril I :\fay June I July I \non'! ,.~cptcm-1 October! :\ovem-1 Decem~ ~
bcr ary ary ' I - · · her her her ,,,.,-
IRON AND STEEL
Foreign trade: Iron and steel products (excluding advanced manu
factures and ferroalloys): Exports, total t ---------------tho us. of short tons __
Steel mill products*_------------------- ___ do ___ _ Scrap _____ ---------------------- __________ .do. __ _
Imports, total t ------------------------- _____ do. __ _ Steel mill products• ______________________ .do. __ _ ScraP----------------------------------- __ .do. __ _
Iron and Steel Scrap
Production and receipts, totaL ____ thous. of short tons._ Home scrap producecL _________________________ do ___ _ Purchased scrap received (net) ________________ do ___ _
Consumption, totaL _______ ----------------- ___ .do ___ _ Stocks, consumers', end of montb _______________ do ___ _
Ore
Iron ore (operations in all U.S. districts): :\line production ________________ thous. of long ton:- __ Shipments from mines. ________________________ do ___ _ Importst _ .. _____________________ ----- __________ do. __ _
U.S. and foreign ores and ore agl'lomerates: Receipts at iron and steel plants _____________ do ___ _ Consumption at iron and steel phmts ________ do ___ _ Exports, incl. reexports _____________ ------- __ do ___ _ Stocks, total, end of month __________________ do ___ _
A.t rnint>s ______ ---------- __________________ flo ___ _ At furnac·e yards ___________________________ do ___ _ At t'.S. docks _____________________________ do ___ _
)!anganese (manganese content), general importst thous. oflong tons __
Pig Iron and Iron Manufactures Pig iron:
Production (excl. hlast furnace prod. of fc'rToalloys) thous. of short tons __
Consumption __________________________________ do ___ _ Stocks (consumers' and suppliPrs'), end of month
tho us. of short tons._ Prices:
'337 • 169
140 '302
231 21
.). 8{)7 3, 382 2, 485 5, 57! 9. 594
3, 042 I. 474 I. 882
3. 948 n, 58R
35 73, 347
7, 505 \iO, 2(;fi
5, 577
72
n. 025 5. 958
3, 91j4
~\IETALS AND MANUFACTURES
'406 161 219
'2fi! 229
14
.1, 752 3, 517 2. 23ti 6, 020 9,331
3, 337 I, 552 I, 970
3. !f>4 9, ~:?8
47 ti~, 134
n, nn3 53,601
5, 470
107
ll, 212 6, 283
r 459 168 266
'275 241
18
(), 17t) :l,(i40 2 53G li: 337 9,181
3.1ili5 1; 493 I, 482
3, 041i H, fi99
43 1)3, fi21 11, 44X 41i, !)44
5, 229
73
6,147 6, 303
3, ()!)2
r 492 '180
286 '327
287 20
7, 539 4. 334 3, 205 7. 479 0. 232
3, 81i8 I, H90 1, 874
3, 543 !1, 512
54 50,800 13,629 3H, ti02
4, 5fi9
80
7, 402 7, (l!4
3, 553
r 507 178 300
'433 359
]()
7, 47fi 4. 390 3, 087 7, 442 9, 269
n, IGG 4.1i87 I. 941
5, X52 11.540
~4 51, 5SO 15, 117 32,\114 3.M!J
129
7, 338 7, 451
3, 467
'61J 166 410
'516 38.1
31
7. 34!) 4. 393 2, 957 7, 440 9.183
12. 1'il) 13. 74:l 3, 302
11\.049 ll. 8·18
431) 04. fiSS 13. !iG.S :l7. 115
4, OIJ5
94
7. oS4 7, 692
3,492
'633 191 408
'528 410 31
7,053 4, 330 2, 724 7,081 9, 200
12,371 14,301 4.124
17,763 ll, 131
4;)6 5\), ,)35 ll. 646 43. 74(\
4. 143
100
7, 232 7, 376
'685 157 497
'577 430
24
'4,122 '2, 299 'I, 823 '4,015 '9, 309
'622 ,)I
552 '458 '323
31
2. 276 92.)
I, 352 2,100 9. 490
'490 47
427 '4.58
366 12
2, 547 I, 069 I, 478 2, 368 9.GH
!i, 723 645 829 7, liS 762 727 3, 188 3, 1821 3. 802
===:::::: =::::==:: 1::::::::· 1, 020
10, 147
82
-3, ~4~ · 3, o7,
'3. 508
260
10,362
37
) 948 I, 003
3, 496
30
111. 461
87
I 949 1, 088
3, 425
'479 37
426 '451
3fl2 14
2, 741 I, 105 1, 635 2, 539 9, 846
782 562
3. 89\1
96
11, 155
il
11,018 I, 172
'575 61
499 '659
460 41
5,450 2, 921 2, 529 s, 373 9. 928
4, 383 G, 976 3. 815
11, 604 7, 091
372 7.j, 705 8, 73G
57, 635 9, 334
100
4,199 4.479
727 114 579 6ii0 539 15
3. 03.\
12G
~---------
109
7, 573 -
Composite _______________________ dol. per long ton .. (i5. 95 titi. 00 (i6. 50
3. 895
6.5. 95 tili.OO Gti. 50
()5. 95 1>6. 00 66.50
f\5. H5 tili. 00 uG. 50
t\5. \l5 lit). 00 (j(i. 50
115. 95 t10.00 6(), 50
3. 432
65.95 66.00 66. 50
65.95 66. ()I)
66.50
6,\. 95 66.00 66.50
65.95 66.00 66.50
3, 364
65.95 66.00 66.50
3. 052
65.95 66.00 66.50
6.~. 95 fif.. 95 Basic (furnace) _________ ------- ______________ .do ___ _ Foundry, No.2, Northern ___________________ do ___ _
Castings, gray iron: Orders, unfilled, for sale, end of month
thous. of short tons .. Shipments, totaL ______________________________ do ....
For sale __________ ----------------------------do. __ _ Castings, malleable iron:
Orders, unfilled, for sale, end of month thous. of short tons._
Shipments, totaL •• ------------ ____ ---------- .do. __ _ For sale._--------------------------- _______ .do .. __
Steel, Crude and Semimanufactures
Steel ingots and steel for castings: Production _____________________ thous. of short tons ..
Percent of capacity d' ___ ---------------- _________ _ Index __ ------------------------- _____ lfJ47-49= 100 ..
Steel castings: Shipments, totaL ______________ thous. of short tons ..
For sale, totaL __ ------------------------ ___ .do ___ _ ~tc~el forgings (for sale):
OrdPrs, unfillf'd, end ofmontb _________________ (lo ___ _ Shipments, total _________________ ----- _________ (lo ___ _
Drop and upseL _____________________________ do ___ _ Pri{'f'S:
Composite, finished steel (carhon) _______ dol. per lh .. Sh•rl billets, rerolling:, earbon, f.o.h. mill
dol. per short toiL. Structmal shapes (carbon), f.o.h. mi!L __ dol. per lb._ .Steel serap, No. I heaYy melting:
Composite (5 markets) § _________ dol. per long toiL Pitt.shurgh district_ ________________________ do ___ _
Steel, Manufactured Products
B:nrcls and drums, steel, heavy types (for sale):
?~r;~~~~·t'~~~~:~:-=~~-~:-~~~~~~~ ~ ~~ ~~~~~~::~~,:~~~~~~=~I Cans, m('tal, 8hipmrnts (in trrms of ste.el consumed),
total for sale and own use ___ thous. of short tons .. Food. _________ ----------------- _____________ do .... ,
Shipments for sale _______ -------------------- __ do ___ _ Closun?s (for ~las~ containers), production ___ . millions __ C'ro\vns, productiOn~--- ___ ------------ thousand g. ross __
nos 998 509
t\G tiS 40
8, 711 73
122.4
104 81
313.1 !12. 5 91.6
.060il
95.00 . OGI7
39.81 42.00
I, 491 I, 882
289 153 244
I, 279 18,294
1-\87 I, 002
517
77 73 44
0. 317 74
131.0
105 83
353.3 !12. 9 90.7
. OliOS
05.00 . Ofil7
'40. 31 43.00
1,1329 1, 803
314 180 263
1,42G 24,026
767 I, 037
539
!)0 75 42
9, U03 85
149.5
l!O ~n
392.0 !12. 7 91.5
. OG98
95.00 . OG17
~ 41. RG 43.00
1,\118 I, 809
304 174 256
I, 437 24,633
847 1, 201i
liliti
9tl 84 50
ll, 568 92
162. G
131 104
396.1 128.8 104.1
. Oti98
115.00 'Onl7
2 41.33 44.00
2, 068 2, 017
341 185 287
I, 576 26,612
892 1. 24fi
li89
103 91 54
11. 2~2 !J3
1113. g
134 105
397. 7 135. 7 105. 7
. Oti98
!15. 00 . Olil7
2 35. 16 37.00
2. 546 2.157
3H9 219 330
1, ti91 28. 987
885 I, 236
685
100 83 50
II.()()] 93
163. I
135 106
393.5 141.8 Jll4. 6
. 0698
n.s. oo . 0617
2 33.41 3.1. 00
2. 575 2, 523
400 219 346
l. 606 30.369
837 I, 252
717
95 85 51
10,908 90
158.4
144 112
374.6 140.0 108.1
. 0698
95.00 . 0617
2 35.67 36.00
I. 083 2, 848
441\ 251 385
I. 787 34.263
898 \)43 533
75 tl9 43
5, 232 42
73. 5
107 84
:!76. 5 102.9 ~0. 6
. 0608
!).>. 00 0617
'38. 48 40.00
1.\17 4 2, 026
502 302 451
I, 621 31,160
873 744 507
86 65 40
I, 439 12
20.2
3~¥: §I 77. 5
. 0698
95.00 . 061i
2 37. {)3 38.00
1, !)34 I. 684
615 423 546
I, 444 29,899
883 850 528
82 76 46
I. 535 13
22.3
101) 80
373.8 103.4 80.0
. 0698
U5. 00 . Otil7
'39.17 38.00
1.884 1,484
642 412 577
I, 519 29,088
887 872 520
8.\ 76 49
1, 705 14
24.0
JOG 85
373.3 97.3 74.3
• 885 • 832 p 516
p 83 p 58 p 42
p 66.00 p 66. 50
i, 268 ' 11, 98\l GO 96
105.61 ' 168 .. > Jl 109 --
p 86 ---------
402. 9 87. 3 63.3
. 0698 I . 0698 . OG%
95. 00 95. 00 p 95. 011 .0617 .06J7 P.Qf\17
2 42.04 " 44. 47 p '41. 23 41.00 4fi. 00 p 42. 00
2,120 1. 286
382 234 327
'I, 543 23,434
2,653 I, 459
'297 169
T 257 I, 362
18,526
316 176 273
Sth~l prod nets, net shipments: Total (all ?rades) _______________ thous. of short tons.. 5,512 ti,l86 6,524 8,118 8.<i03 8, 754 9,700 4,131 1,339 1,283 1,419 4,842
Semifinished products _______________________ do____ 248 248 270 344 346 357 386 132 --------- --------- _________ 253 8. 2ll
416 570 754 120
Structural shapes (hca\·y), steel piling _______ do.... 387 360 410 zgt z~~ ~~~ ~~~ m --------- --------- ------- m ~~~~\\~saiict(iceossorles::.-_:=:=============:::::~~::::i sg~ 5~~ ¥~~ 167 160 192 192 75 ::======= ::::::=:: ::::::: - 47
p 12. 04:~ ~J;)
ltJH. ;J
· H.nised. P Preliminary. ' Including blast furnace production of ferroalloys. ' Not entirely comparable with composite through 1958; see note marked ''§"'. t Revised \beginning in the February 1960 SFRVEY) to indude certain metal manufactures classified by the industry as steel mill products but heretofore omitted from the total shown h .. re
see notE' marked "*.'. *New series (from Burean of the Census); revisions for January-November 19.58 (thous. tons): Exports-total, 612; 516; 64.5; 633; 653; 429; 384; 363; 389; 5.50; 487; steel mill products, :J27: 212;
264: 266; 245; 163; 169; 171; 181; 269; 239; imports-total, 102; 93; 131; 133; 147; 187; 246; 216; 233; 303; 252; steel mill products, 71; 68; 102; 114; 118; 128; 171; 157; 180; 201; 175. t Scattered revisions for January 1957-July 19.\8 are available upon request. d" For 1960, percent of capacity is calcnlated on annual capacity as of January 1, 19fJO, of 148,570,970 tons of steel; for 1959, as of January I, 1959 (147,633,670 tons); 1958 (140,742,570 tons!. § Represents the weighted average of consumers' buying prices (including brokerage), delivered, at following markets: Pittsburgh district, Chicago, Philadelphia, Birmingham, Lo;
Angeles (through 1958 only), San Francisco (beginning 1959).
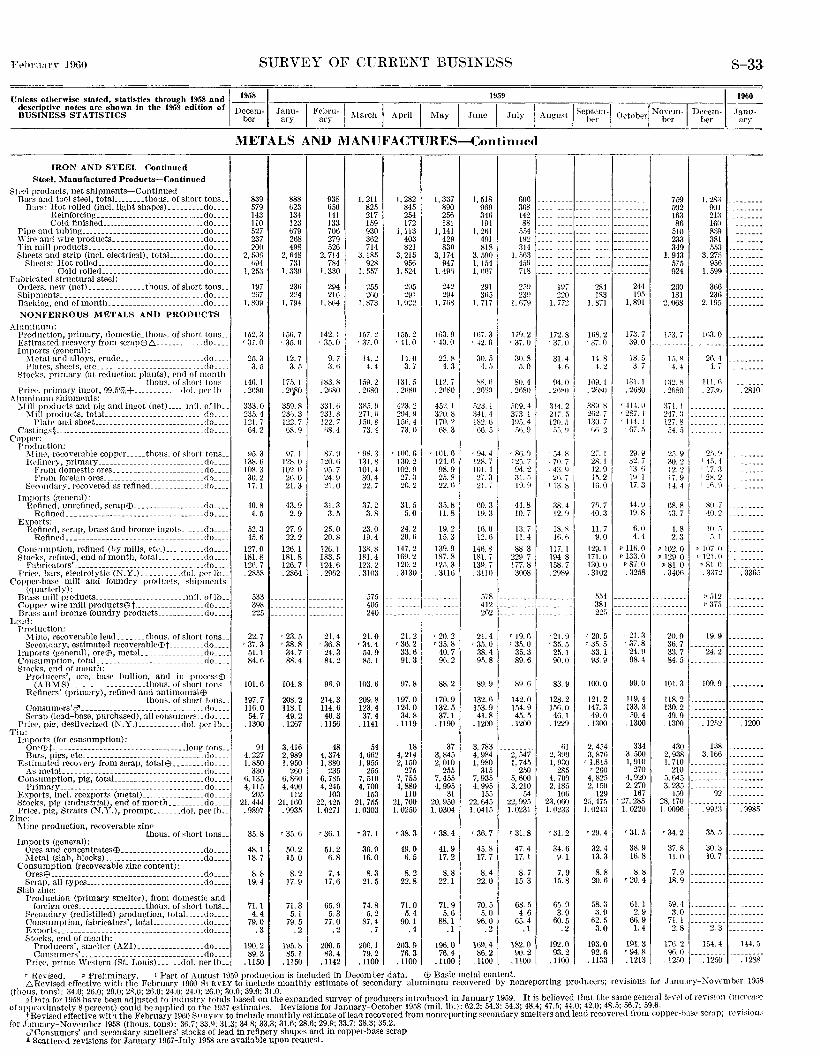
SURVEY OF CURRENT BUSINESS S-33
Unless otherwise stated, statistics through 1958 and ~~~ 1959 11960 " dBeUscSrliNptEivs"s"osteTsATarleSTshiCowsn in the 1959 edition of Decem- -:J:-n_n_u--TI-:F:-e:-b-r-ul,---~,----,,----~~--~~ ::_ __ '1~----.,-S-ep_t_e_n_l'i_o_"_to_b_e_rTI ]';-_-o_Y_e_n_,_,,-D-e-ce-,-~~-- .Tanu-
ber ary ary - March April May June July I August her. - , her ber ary
IRON AND STEEL--Continued
Steel, Manufactured Products-Continued Su•el products, net shipments-Continued
Bars and tool steel, totaL ______ thons. of short tons __ Baro: Hot rolled (incl. light shapes) _________ do ___ _
Rcinforcin~----------------------------do ___ _ Cold finished __________________________ do ____ _
Pipt• and tubing _______________________________ do ___ _ Wire and wire products _______________________ do ___ _ Tin mill products _____________________________ do ___ _ Sheets and strip (incl. electrical), totaL _______ do ___ _
Sheets: Hot rollcd ___________________________ do ___ _ Cold rolled ___ -------- __ ------------ .do ___ _
Fabrieated structural steel: Orders, new (net) ______________ thous. of short tons __ Shipments ______ ----------- ___________________ do ___ _ Backlog, end ofmonth ________________________ do ___ _
NONFERROUS METALS AND PRODUCTS
.\lnminunt: Production, primary, domestic_ thons. of short tons __ Estimated recovery from scrapE!l6----------- .. do ___ _ Imports (general):
"\ictal and alloys, crudc _____________________ do ___ _ Platrs, shpcts, etc ________________________ , __ do ___ _
Stoeks. primary (at reduction plants), t>nd of month thous. of ::;hort tons __
Priee. primary ingot, 99.5%+------------dol. IH'I' Jh __ Aluminunt shiprnents:
:\!ill prodnets and pig nnd ingot (net) ____ miL oflh __ :\Iill products, totaL _______________________ do ___ _
l'late and sheet_ ___ --------- _______________ do ___ _ Castings§ _____ --------------- __________________ do ___ _
Copper: l'roduction:
\Iitw, recoverable copppr _____ thous. of sbort tons __ Hefitwry, primary------------- ______________ do ___ _
From dornrstic ores ___________________ .. ___ flo ___ _ From foreign ores __________________________ do ___ _
SeC'ondary, recovered as refined _____________ do ___ _
Imports (general): Hrfined, unrefined, scra.p(B __________________ do ___ _
Refi nod ___________ - ______________________ .do ___ _
Exports: H.efinfd, scrap, brass and bronze ingots ______ do ___ _
Refined_-------------------- ______________ do ___ _ Consumption, refined (by mills, ott·.) _________ do ___ _ Storks, refined, end of month, total.. ___________ do ___ _
Fabrira.tors' ______ ----------- _____________ .. _.do ___ _ Pri0', hars, electrolytic (N.Y.) ________ .doL ppr lb __
Copper-base rni11 and foundry prodttrts, shipments (quarterly):
Brass mill products ________________________ miL oflb __ Copper wire mill products'llt------------------ do ___ _ Brass and bronze foundry products ____________ do ___ _
I.end: Production:
.:\line, recoverable lead _______ thous. of short tons __ Seeondary, estimated recoverableEBt _________ do ___ _
Imports (gf'n~ral), ore$, metaL _______________ do ___ _ Consumption, totaL _________________________ .do ___ _ Stocks, rnd of month:
Pro1luccr.s', ore, base bullion, and in proe('ssEB (A BMS) ___________________ tlwus. of short tons __
Refinrrs' (primary), refined and a.ntirnonia.l@ tho us. of short tons __
Consumers' d' --------------------- __________ do ___ _ Scrap (lead-hase, purchased), all consumers. _do ___ _
Price, pig-, desilverized (N.Y.) ___________ dol. per Jb __ Tin:
Imports (for consumption):
~~~.~~iis·,-eic-_-_-_-~_-_-_-_-_-~~~--~~----~----~~------!~~~~J~~~:: Es-timated recovery from scrap, tota.ltt) ________ do ___ _
As mcta!_ ___________________________________ do ___ _ Consumption, pig, totaL ______________________ do ___ _
Primary-------- ___ ------- ___ --- _____________ do ___ _ Exports, incl. reexports (metal) _______________ do ___ _ Stocks, pig (industrial), end of month _________ do ___ _ Price, pig, Straits (N.Y.), prompt_ ______ dol. per lb ..
Zilw: :\line production, recoverable zinc
thous. of short tons __ Imports (general):
Ores and conccntratesE!J _____________________ do ___ _ :\leta! (slab, blocks) _________________________ do ___ _
Consumption (recoverable zinc content): OresE!J __________ ------ _______________________ do ___ _ Scrap, all types ______________________________ do ___ _
Slab zinc: Production (primary smelter), from domestic and
foreign ores _________________ thous. of short tons __ Secondary (redistilled) production, totaL __ .do ___ _ Consumption, fabricators', totaL ____________ do ___ _ Exports. __________ -------- __ ----------- _____ do ___ _ Stocks, end of month:
Producers', smelter (AZI) _________________ do ___ _ Consumers' ___ --------------------------- _do ___ _
Price, prime Western (St. L01Iis) ______ tlol. per lh __
METALS AND MANUFACTURES-Continued
839 579 143 110 527 237 200
2, 500 fi94
I, 25:1
197 2()7
I. ~09
152.3 r 37.0
25.3 3. 5
141\.1 . 2tiXO
33:J.O 235.4 121.7 64.2
95.3 13Kfj IOH. 3 30.2 17.1
40.8 4. 5
52.3 45.6
127.0 181.8 121\. 7 . 285S
533 39H 225
22.7 '37. 3
51.1 84.6
101.6
197.7 I16. 0 54.7
.1300
94 4, 227 I, 850
330 6,135 4, I15
205 21,444 . 9897
35.8
48.1 18.7
8.8 19. 4
71.1 4.4
79.0 .3
190.2 89.3
. !150
888 623 134 123 679 21!8 498
2, 648 731
1.339
23ii 224
I, 794
150. 7 '35.0
12.7 3. 5
175. I . 21~0
359.8 23.i. 3 122.7 liR. 9
97.1 128.0 102.0 2l\. 0 21.3
43.9 2.9
27.9 22.2
126. 1 181.8 126.7 . 2864
'23. 5 '38.8
34.7 88.4
104.8
208.2 118.1 49.2
.1267
3,416 2,989 I, 950
260 G, 8no 4,490
112 21,160 . 9935
• 35.6
50.2 15.0
8. 2 17.9
71.3 5.1
79.5 .2
195.8 85.1
.1150
938 65li 141 133 70tl 279 526
2, 714 784
1,330
294 21G
1, 864
142. I r 35.0
9. 7 3. t)
183.8 . 2fi80
331.!\ 231.8 12:?.. 7 1!8. 4
g?. n 120. fi 95.7 24.9 21.0
31.3 3. 5
25.0 20.8
126. I 183.5 124.ll . 2962
21.4 '36. 8
24.3 84. 2
96.9
214.3 1!4.6 40.3
. 1!56
48 4, 374 I, 880
235 6, 785 4, 245
103 22,425 1.0271
'36. I
51.2 6. 8
7.4 17.6
65.9 5. 3
77.0 . 2
200.5 83.4
. 1142
I, 21! 825 217 !59 \l30 362 714
3,185 928
1. 557
255 21\0
1, 873
157. 2 '37.0
14. 2 4. 4
15\l. 2 . 21\80
3~5. ~j 271. (j 150.8 73.4
'98. 3 131.8 101.4 30.4 22.7
37. 2 3. 8
23.0 19.4
138.8 181.4 123.2 . 3103
575 405 240
21.0 '34. 4
54.9 85. I
103.6
209.8 123.4 37.4
.1!41
54 4, 662 I, 955
255 7, 510 4, 700
153 21,755 1. 030:J
'37.1
36.9 16.0
8.3 21.5
74.8 5. 2
87.4 .7
20G.I 79.2
.liOO
1, 282 845 254 172
I, 113 403 821
3, 215 956
1. 524
295 291
I. 922
155.2 '41.0
14.0 3. 7
131.5 . 21\80
-123. 2 2fl4. 9 151i. 4 73. ()
• !()(),(\
130.2 102.9 ~7. 3 20. 2
31.5 5. 0
24.2 20. ()
147.2 169.2 120.2 . 3130
21.2 '36. 2
33.6 91.3
97.8
!97.0 124.0 34.8
.1119
18 4, 214 2, !50
275 7, 755 4,880
110 21,700 1.0250
'38.3
49.0 6. 5
8.2 22.8
71.0 5. 4
90. I • 4
203.9 76.3
.1!00
1.337 890 256 181
I, 141 429 830
3,174 947
1.49G
242 294
1, 7fi8
1(\3. 0 '40. ()
22.8 4. a
112.7 . 21i80
452.1 320.8 170.2 68.3
• Ill!. 6 124. G 98.9 25.8 22.ll
35.8 11.8
19.2 15.3
139. ~ 187.8 125.3 . 3116
• 20.2 '35. 8
40.7 96.2
88.2
170.9 132.5 37. I
. 1190
37 3, 845 2, 010
255 7, 455 4, 995
31 20,950 1.0304
'38. 4
41.9 17.2
8. 8 22. I
71.9 5.6
88.1 .I
!96.0 76.4
.1100
1, 518 969 34G 191
I, 21H 491 818
3. 590 I, 154 1, H07
291 3ti5
I. 717
Hi7.3 '42. 0
30.5 4. J
~Kfi _ 2fiSO
;):lit 1 :m. -! 182. (j
G6 .• 1
• 94. 4 128.7 101.4 27.:3 21. i
G0.3 19.3
!G. 0 12.6
!46. 8 181. 7 139.7 . auo
o78 412 2ti2
21.4 '35.0
38.4 95.8
89.9
132.6 153.9 41.8
.1200
3, 783 4, 984 1, 980
315 7, 935 4, 995
155 22,645 1.0415
'36. 7
45.8 17.7
8. 4 22.0
70.5 5.0
96.0 .2
169.4 86.2
.1100
600 3G8 142 88
i)!J4 1\12 3H
I. i)fi3 15\1 71S
2!)\J 23\1
1. fi79
179.2 '37. 0
30.8 5. 0
80.4 . 2fl80
009.4 373 I 195.4
.1n. n
r 86. ~~ 125. 7 9-1.2 :ll .. \ 19.9
44.8 !0. 7
l:l. 7 II. 4
88.3 229. 7 177.8 . 3008
r 19.() '3.). 0
35.3 89.6
8\1.6
142.0 !54. 9 45.5
. 1200
2, 547 I, 74.)
2.)0 5, 600 3, 210
54 22,995 I. 0231
'31. 8
47.4 17.1
8. 7 15.3
68.5 4. 6
65.4 . 1
182.0 90.2
.1100
Hfi 220
l. 77'2
172.8 r 37.0
31.4 4. f)
94.0 • 2HSO
314. 2 217. 5 120. ,j
;"l:i. H
'34. 8 l 70.7 ! 43. n I 2(). i 1 1a. s
38.4 12. H
18.8 w. ()
117. 1 194.8 158.7 . 298\l
•21. 9 T 35.5
25.1 \10.0
83.9
!28. 2 1.%.0 46. I
. 1229
fj] 2.3!19 1, 930
285 4, 7fl0 2.185
lOll 23,060 1.0233
r 31.2
34.6 9. I
7. 9 15.8
65.9 3.9
60.5 .2
!92. 0 93.2
.1100
281 244 183 190
L 871 I, 891
HiS. 2 • 37.0
109. I . 2ft~o
38\1. ~ 2fi2. 7 1:;o. 7
fiti. 2
'27. 1 28.1 12.9 15.2 11\.0
j()_ 7 40.3
II. 7 9.0
129.1 171.0 130.(1 . 3102
554 381 22.-.
'20. 5 '3!i. 5
33.1 93.9
100.0
121.2 147.3 49.0
. 1300
2, 454 3,87fl
'1,845 • 260
4, 82[1 2. !50
129 20, 47S I. 0243
'29. 4
32.4 13.3
8. 8 20.6
58.3 3.9
62.5 3.0
193.0 92.6
. I133
173. 7 39.0
18.5 3. 7
131. I . 2tl80
• 414.0 • 2Ri. I '1H.l
r ()j_ 5
2H. Y :JZ.i J:l.li l!l I 17.3
44.9 19.8
D.O 4 . .[
p 116. 0 p 133.0
p 87.0 . 3258
'21. 3 • 37.8
24.9 98.4
99.0
119.4 133. a .\0. 4
. !300
334 3. 500 I, 910
270 4, 920 2, 270
167 r 27,285
I. 0220
• 3!. 5
38.9 16.8
8. H '20. 4
6!.1 2. 9
66.9 !.4
19!. 3 '94. R . 1213 '
759 502 163 86
510 233 349
1, 943 575 924
260 181
2.068
1;)3. 7
]:)2. 8 . 2680
:m. 1 247. ;.; 127. 8 54 .. )
2.\9 :!0. 2 12.2 17.9 11.4
68.8 43.7
4. 8 2.3
p 102. 0 p 129.0
p 81.0 . 340fi
20.9 36.7 3.1. 7 84.5
101.3
118.2 I:JO. 2 49.9
. 1300
430 2, 938 I, 710
210 o, 645 3, 235
159 28,170 1. 009()
l. 28:! 001 21a 160 859 381 553
3, 275 956
1,599
366 236
2,195
lfi3. 0 ---------
2tl. 4 4.7
11 J.(i . 27:{ij -2810
25. !-1 l..j.."i_t I 17. ;l 1 2.'-(. 2 llfl.\)
~0. 7 40.2
HI.;., ;).1
p IIJ7. 0 ·' 121.!1 "81.0 . 3372 . 336:.
19.9
24.2 ---------
109.9 ---------
. 12.12 . 1200
92
.991:! .9985
35 . . ~
37. 8 30. a 1!. 0 10.7
7.9 18.9
.)9, 4 3.0
71.1 2.8 2.;)
17ll. 21 154.4
. i~:,Z ---~i2~ii-144.5
.12S.'l
' Revised. • Preliminary. ' Part of August 1959 production is included in Deccm!Jer thlta. Ell Basic metal content. 6Revised effective with the February 1960 SPRVEY to include monthly estimate of secondary aluminum recovered by nonreporting producers; revisions for .January-);'owmber 19.'i8
(thous. tons): 34.0; 26.0; 29.0; 28.0; 26.0; 24.0; 24.0; 26.0; 30.0; 39.0; 31.0. ~D,lta for 1958 have been adjusted to industry totals based on the expanded survey of producers introduced in January 1959. It is believed that the same Rencrallt'wl uf revision (mrn'a'e
of approximately 8 percent) could be applied to the 1957 estimates. He visions for January-October 1958 (mil. lb.): 62.2; 54.3; 54.3; 48.4; 47.5; 44.0; 42.0; 48.5; 56.7; 59.6. t Revised effective with the February I9fi0 SnRVEY to include monthly estimate of!ead recovered from nonreportlng secondary smelters and lead recovered from CO(lllf'r-hllsc scrap; l'l'Vi<iOU.'
for J:munry-November 1958 (thous. tons): 36.7; 33.9; 31.3; 34.8; 33.3; 31.6; 28.6; 29.9; 33.7; 38.3; 35.2. d'C'onsumers' and secondary smelters' stocks of lead in refinery shapes and in copper-base scrap .t Scattered revisions for January 1957-Jnly 1958 are available upon reuuest.
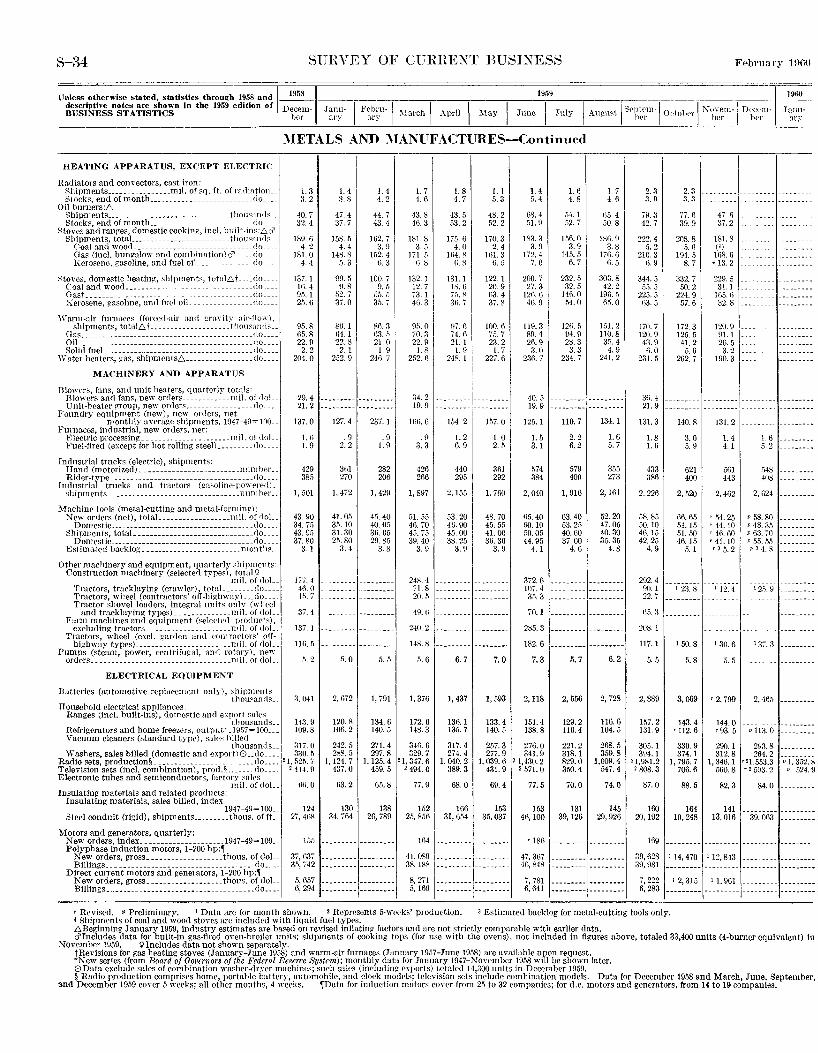
S-34 SURVEY OF CFHHEXT BUSIXESS February 1060
Unless otherwise stated, statistics through 1958 and 11958 ~~---
descriptive notes are shown in the 1959 edition or Decem J·uul BUSINESS STATISTICS ber - ~ry- I F~~;~u-1 ~larch I April I ~lay I June I July
1959 ---------~ -~ -~---1 Ano·ust li Srp_trm~ I O(-j b,. I No\·em-1 Decrm-
1-- ht>r 0 Ll her her
1960
Jann:Jrr
::\IETALS AND -'IANUFACTURES-Continued
HEATING APPARATUS, EXCEPT ELECTRIC
Radiators and convectors, cast iron: Shipments ________________ rnil. of sq. ft. of radiation_ Stocks, end of month _________________________ .do ___ _
Oil burners:6
~~~~~)~~~~~-.;(month====================: ~-0 '~"~{~'.1 ~:: ~toves ami ranges, domestic cooking, incl. huilt-ins:6ci' I
Shipments, totaL _______ ------------ _____ thou:-:and;.: __ Coal and wood ______________________________ do ____
1
Gas (incl. bungalow and com binationl d' ___ .do ___ _ Kerosene, gasoline, and fuel oiL _____________ <lo ___ _
Stoves, domestic heating, shipment~, total.6 t ____ do ___ _ Coal and wood ______________________________ do ___ _ Gust------------------- _____ .. _______________ do ___ _ Kerosene, ~·asoline, and fuel oiL _______________ do ___ _
\Yarm-air furnnres (forced-air and gravity air-flow), shipments, tota1.6 t __________________ .. thonsandR __
Gas ___________________________________________ do ___ _ OiL ___________________________________________ <lo ___ _ Solid fueL ____________________________________ <\o ___ _
Water heaters, gas, sbipmentsL', _________________ do_
MACHINERY AND APPARATUS
Blowers, fans, and unit beaters, quarterly totals: Rlowers and fans, new orders ____________ mil. of doL_ Unit-beater group, new orclers _________________ do __ _
Foundry equipn1ent (new), new orders, net JPonthly average shipments, 194i-49=100 ...
Furnaces, industrial, new orders, net: Electric processing ______________________ mil. of doL_ Fuel-fired (except for hot rollinv; steel)_ ________ do ____ _
Industrial trucks (electric), shipments: Hand (motorized) _____ --------- ___ .. ________ Hum her__ Rider-type ___ --------------------------- ---_do_--.
Industrial trucks and tractors (gasoline-powered), shipments __ ---------------------- __________ num her __
Machine tools (metal-cutting and metal-forming): New orders (net), totaL _________________ mil. of rloL
Domestic ______ -------.--------------------- _do_---Shipn,ents, totaL _____________________________ .do_. __ Domestic _______________ -------------------_ Jlo_. __
Estimated baeklog __ ----------------- ______ montll~-
Other machinery and equipment, quarterly shipments: Construction machinery (selected types), total<;?
mil. of doL. Tractors, tracklaying (cmwler), totaL _______ ,lo ___ _ Tractors, wheel (contractors' off-highway) ___ do ___ _ Tractor shovel loaders, integral units only (wheel
and track laying types) ______________ mil. of doL Farm machines and equipment (selected products),
excluding tractors ________ ------··- _____ nlil. of doL Tractors, wheel (excl. garden and rontrflrtors' off-
highway types)___________________ nlil. of doL_ Pumps (steam, power, centrifugal, and rot:try), new
orders ___________________________________ nlil. of doL
ELECTRICAl~ EQUIPMENT
1.3 3. 2
40.7 32.1
!S9. 6 4. 2
IRl. 0 4. 4
13i. I 16. 4 95. I 2.5. 6
9.1. 8 65. R 22.9
2. 2 204.0
29.4 21.2
13i. 0
1.6 1.9
429 38fi
1, 501
43.90 34. i.5 43. 9.5 37.80
3. 1
177. -4 4fi. 0 1!1. i
37. 4
137. 1
116 .. 5
,\. 2
Batteries (automotive. replacement only), shipments thou~ands__ 3. 041
Tiousehold electrical appliances: Ranges (incl. built-ins), domestic and export sales
thousands__ 113. 9 Refrigerators and horne freezPrs, output.' _1957= 100__ _ 109. 8 Vacuum cleaners (standard type), sales hilled
Washers, sales billed (domestic and export)0 __ do____ 330.5 thousands __ ! 317.0
Radio sets, production§ _________________________ do ____ 21. 525. 7 Television sets (incl. combination), prod.§. ______ do____ '4!4. !I Electronic tubes and semiconductors, factory sales
mil. of doL fiG. 0 Insulating materials and related, products:
Insulating materials, sales billed, index 1947-49= 100 __
Steel conduit (rigid), shipments _________ thous. of fL.
Motors and 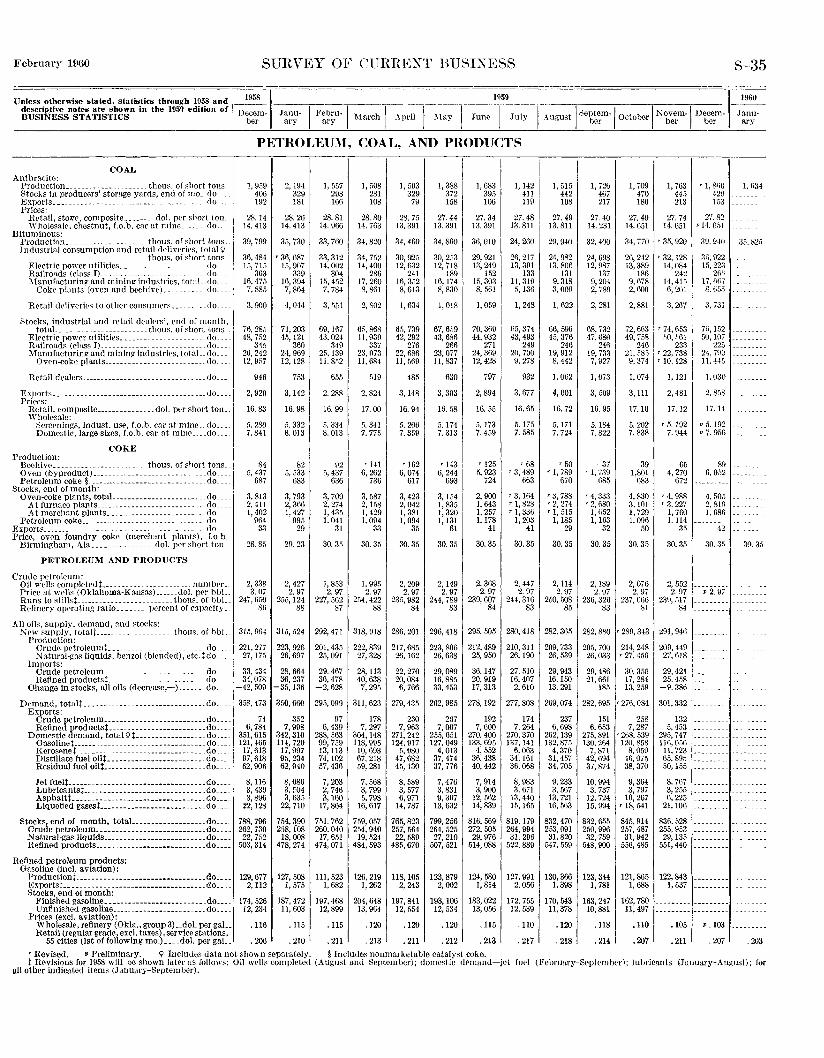
February 1960 SUHVEY OF CURHENT HUSI~ESS S-35
Unless otherwise stated, statistics through 1958 and~~~~---------------- ___ _____ _ __ 1 95~----- _______ ,_l960 descrip,tive notes are shown in the 1959 edition of ~ T
BUSINESS STATISTICS Decem- Janu- I Febru-1 March I \pril 11\!ay I June I July I August I ceptem-1 October I Novem-1 Decem- Janu-ber ary ary • · " ' · · - her her her ary
PETROLEUM, COAL AND PRODUCTS
COAL Anthracite:
Production _____________________ thous. of short tons __ Stocks in producers' storage yards, end of mo __ rlo. __ _ Export.s ... -------------------------- _______ _ do_._ Prices:
Rdail, sto:vc, composite. ______ doL per short ton __ Wholesale, chestnut, f.o.b. car at mine _____ - do.- --~
Bituminous: Production _____________________ thous. of short tons lndustrial consumption and retail deliveries, total?
thous. of short tons_ Electric power utilities______________ __ rio __ _ Railroads (class!)___________________ do __ _ l\1:anufactnring- and mining industries, totaL .do ___ _
Coke plants (oven and beehive).-. do __ _
Retail delivcriPs to otlwr consumer:<. __ .. do ...
Storks, industrial and retail dC'alPrs', C'nd of month, totaL______ _ ________ thous. of short tons ..
Electric power utilities. __________ . ______ .... do. __ . Railroad:< <class I)__ _________ __ ____ do __ _ Manufacturin~ and minlnv Industries, totaL do ....
Oven-coke plants____________________ do.
Retail dealers _________ ----------.----- __ do __ _
1, 9.19 406 192
28.14 14.413
39,799
36,484 1.1, 71.1
363 16,475 7,88.1
3, 900
7fl, 285 48, 7f>2
315 26, 242 12, 9iii
2, 194 329 181
28.26 14.413
3.;, 730
r 36, G87 15,907
339 16, 394 7, 864
4, 044
71,203 45,121
360 24,969 12, 128
1, 557 298 166
28.81 14.966
33,760
33,312 14,002
304 15, 4,1'>2 7, 784
3, 551
69,167 1
43,024 349
25,139 11, 8f>2
6;")5
1, .008 281 108
28. RO 1-1. 763
34,820
34,71\2 14,400
286 17,260 8, 861
2, 802
6fi, 868 !I, 939
337 23,073 11,684
519
1, 503 329 79
28.75 13.391
34,460
30,92,\ 12,632
241 16, 3.S2 8,613
1,634
6.1, 739 42, 292
276 22,686 11,569
I 1, 3881 372
!58
27.44 13.391
34.860
30, 2!'i3 12,718
189 16,174 8, 830
1,018
67,6.19 43,686
266 23,077 11,837
630
1, 683 39.) 106
27.34 13.391
36,010
29,921 13,249
152 15,303 8, 56!
1, 059
70,369 44,932
271 24,369 12,428
797
Exports .. _____________ ---------__________ __do __ _
946
2, 920
16.83
5. 280 7. 841
753
3,142
16.98
.). 332 8.013
2, 288
16.99
5. 334 8.013
2, 824
17.00
48.5
3,148
16.94
.s. 206 7. 359
3, 303 2, 894 Priees:
Rctall, composite ________________ dol. per short ton .. 16. 58 16. 55 Wholesale:
Scrcrnings, indust. use, f.o.b. car at mine_ do ___ . Domestic, large sizes. f.o.b. car at mlnr .... do . _
!i. 341 7. 775 ~:m I ~:m
COKE Production:
Beehive ______________________ thous. of short tons. Oven (byproduct) _____________________________ do __ _ Petroleum coke§ ______________________________ do __ _
Stocks, end of month: Oven-coke plants, totaL ______________________ do ___ _
At furnace plants ____________________________ do __ __ At merchant plants ______ ----------- ________ do ___
Petroleum coke ___________ .------.-.--.-.--.--. do ___ . Exports _________ . __ -----------------_-----.---_- do __ Price, oven foundry coke (merchant plants), f.o.b.
.Birmingham, Ala ______________ dol. per short ton_
PETROLEUM AND PRODUCTS
84 5, 437
687
3,813 2, 411 1, 402
964 33
28.85
82 5, 533
683
3, 793 2, 366 1, 427
995 29
29.23
92 f>,437
636
3, 709 2, 274 1, 43.1 1, 041
31
30. 3.5
'141 6, 262
736
3, 587 2, 158 1, 429 1,094
33
30. 3.5
'162 6, 074
617
3, 423 2, 042 1,381 I, 094
35
30.35
'143 6, 244
693
3,154 1, 835 1, 320 1,131
61
30.35
Crude petroleum: Oil wells completcdf_ ______________ - ----- number. 2, 338
3. 07 247, (i.~O
Sf>
2, 427 2. 97
255, 124 88
1,853 1,99!) 2,209 2,149 Price at wells (Oklahoma-Kansas) _____ .dol. per bbL 2. 97 2. 97 2. 97 2. 97 Huns to Rtillst__________________ -- tlwus. of hbL. 227, 562 2!>4, 422 23ii, 982 244, 789 Refinery operating ratio ___ ._._. pcrcmt of capacity_ 87 88 84 83
All oils, supply, demand, and :<tocks: I !\'cw supply, totalt_____ __ thous. of bbl. 315, 91i4
Production: Crudepctroieumt, _____________________ do __ ,221,27i Natural-gas liquids, benzol (blended), etc.tdo__ 27,17.1
Imports: 1
Crude petroleum ___________ --------- _____ do._ .. , 33,434 Refined productst .. ____ . ______ ----------_.do____ 34,078
Ohange ha stocks, all oils (decrease,-) ....... do... -42, 50V
315, 524 292, 471
223, 926 201, 43o 26, 697 25, 091
28,664 36,237
-35,136
29,467 36,478
-2,628
318,918 286, 201
222,839 217,685 27, 328 26, 162
28, 113 40,638 7, 295
22,270 20,084 6, 766
Demand, totalt ____ -- ___ -- _ ---------------.- .. do ..... 358, 4 73 350, 660 29.5, 099 3!1' 623 279,435
230 7, 963
271,242 124,917
f, 980 47,682 45,130
Exports: Crude petroleum ___ -----.-------------. ___ .do __ .. Refined prodnctst----------------------- . .do __ __
Domestic demand, total>' t------------------ do. __ _ Ga.solinei----------. _ ------------------- __ .do. __ Kerosend ____ . ____ . ---------------- _____ do ___ . Distillate fuel ollt-------------------------do .... Residual fuel oilt.------------------------ .do ___ .
Jet fueU.----------------------------------do. __ _ Lubricantst-- __ ---------------- _________ ._do ___ _
tfg~~A~~ gas-esc::::::::::::::::::::::::~~:::.
74 6, 784
351,615 121, 465 17,613 97,618 62,906
8,116 3, 439 3,896
22,128
352 7, 998
342,310 114,720 17,997 95, 234 62,940
8,086 3, E04 3j 635
22,710
97 6,439
288,563 99,759 13,113 74, 102 57,436
7, 203 2, 746 3,160
17,864
178 7, 297
304, 148 1!8, 995
10,693 67,218 59,281
7, .168 3, 799 5, 798
16.617
8, 589 3, .177 6, 971
14,787
Stocks, end of month, totaL ________________ _cto____ 788,796 754,390 751, 762 759,057 765,823 Crude petroleum.-------------------------- .do____ 262, 730 258, ios 260,040 254,940 257, 564 Natural-gas ilqulds __________________________ do____ 22,752 18,008 17,6.11 19,524 22,589 Refined products ______ --------------------- .do____ 503, 314 478, 274 474,071 484, 593 485, 670
Refined petroleum products: Gasoline (Incl. aviation):
Productiont. ___ - --. _ ---------------------._.do .. __ Exportst .. ___ .------------------------------do. __ . Stocks, end of month:
Finished gasoline. ____ .• --------------_. __ .do. __ . Unfinished gasoiiRe _____ ------------- ______ do. __ _
Prices (excL aviation): Wholesale, refinery (Okla., group 3) .. doL per gaL Retail (regular grade, excL taxes), service stations,
55 cities (lst of followhag mo.) .... doL per gaL
129,677 2,112
174,526 12,234
.116
. 206
127, 508 1,575
187,472 11,603
.115
. 210
111' 523 126, 219 118, 105 I, 682 1, 262 2, 243
197,468 204,648 197,841 12,899 13, 964 12, 554
.115 .120 .120
• 211 . 213 I • 211
296,418
223,806 26,638
29,089 16,885 33,453
262,985
267 7, 067
255, 651 127,049
4, 013 37,474 37, 776
7,476 3, 831 9, 367
13,632
799,256 264,525 27,210
507, 521
123,879 2,002
193, 106 12,534
.120
. 212
r 125 5, 923
724
2, 900 I, 643 1, 257 1,178
41
30.35
2, 368 2. 97
239,607 84
295, 505
212,489 25,950
36. 147 20,919 17,313
278, 192
192 7, 600
270,400 133,695
4, 552 36, 438 40,442
7, 914 3, 900
12,562 14,839
816, 569 272, 505
29,976 514,088
124, 580 1, 814
183,022 13, 056
.115
.213
' Revised. v Preliminary. 9 Includes data not shown separately. § Includes nonmarketable catalyst coke.
I, 142 411 119
27.48 13.811
24,260
2f\, 217 13,391
133 11,319 5, 136
1, 248
ll5,374 43,493
249 20, 700 9. 278
932
3, 677
16.65
5.175 7. 585
r 68 '3,489
663
'3,164 '1, 828 'I 336
1:203 41
30.35
1, 515 442 108
27.49 13.811
29,940
24,982 13,806
131 9, 318 3,009
1, 622
66,596 45,376
246 19,912 8, 442
1. 062
4,001
16.72
5.171 7. 724
'50 r 1, 789
670
r 3, 788 r 2, 274 r 1, 515
1,185 29
30.35
1, 726 467 217
27.40 14.231
32,400
24,698 12,987
137 9,2(}! 2, 789
2, 281
68,732 47,680
24f\ 19,733 7, 927
l, 073
3, 509
16. 9.5
5.184 7. 822
'37 r 1, 739
685
'4,333 '2, 680
1,1.52 1,163
a2
30.35
1, 709 470 180
27.40 14.651
34, 770
26,242 13,380
186 9,678 2, 600
2,881
72,663 49, 758
246 21, t:81 9, 374
1, 074
I, 763 44!) 213
27.74 14.651
'35, 920
'32, 128 14.084
242 14,41.1 6, 201
3,267
'74, 653 50, !'Gl
233 '22, 738 '10,128
1,121
'1, 8fi0 429 153
27.82 p 14.651
39,940
31\,922 l.\223
2flf\ 17, f)(\7 8. 65.\
3, 731
71\, ].12 50, 107
22.5 24, 7\lO 11,445
l. 030
3, 111 2, 481 2, 858
17.10 17.12 17.14
5.202 '.5.192 •5.192 7. 838 7. 944 p 7. 956
39 1,801
683
4,830 3.101 1, 729 1,096
50
30.35
65 4, 270
672
'4, 988 ':), 227
1, 760 1, 114
35
30.35
89 6, 052
4, 50.\ 2, 819 1,686
42
30. 3.)
2, 447 2. 97
244,316 83
2, 114 2, 189 2, 076 2, 552 2. 97 2. 97 2. 97 2. 97 p 2. 97
250, 508 236,326 237, 066 239, .117 85 83 81 84
280,418 282,365
210,311 26, 190
27,510 16,407 2. 610
209,733 26,539
29,943 16, 150 13, 291
282,880 '289, 343 291, 94fJ
205, 700 214, 248 209, 449 26, 033 ' 27, 456 27, 018
29,486 21,661
185
30,355 17,284 13,259
29,421 25,458
-9,38tl
277,808
174 7, 264
270,370 137,141
269,074 282, 695 '276, 084 301,332
6,063 34,161 36,068
8,983 3, 671
13,440 15,165
237 6,698
262,!39 132,875
4, 370 31,457 34,705
9, 233 3, 567
13, 721 16, 563
819, 179 832, 470 264, 994 253, 091 31, 296 31, 820
522,889 547, 559
127,991 2,056
172,755 12,539
.110
. 217
130,366 1,398
170,543 11,378
.120
. 218
151 6,653
275,891 130,264
7, 871 42, 6U4 37,874
10,994 3, 737
12,724 15,994
832,655 250,996 32,759
548,900
123,344 1, 781
163,247 10,881
.118
. 214
258 7, 287
'2fi8, 539 120, 858
8, 059 46,075 38,370
9,364 3, 797
10,267 ' 18, 541
845,914 257,487 31,942
556,485
121,865 1,688
162,780 11,497
.no
.207
132 5,453
295,747 llf1,0.55 11,723 65, 89!\ 50,155
8. 767 3, 255 6, 225
21,106
836,528 255,953
29,135 551,440
122,843 ---------1,537 ---------
.105 p. 103
• 211 . 207
1,1\34
35, 82fi
30. 3.\
. 21)3
t Revisions for 1958 will be shown later as follows: Oil wells completed (August anrl September); domestic demand-jet fuel (February-September); lubricants (January-August); for all other Indicated items (January-September).
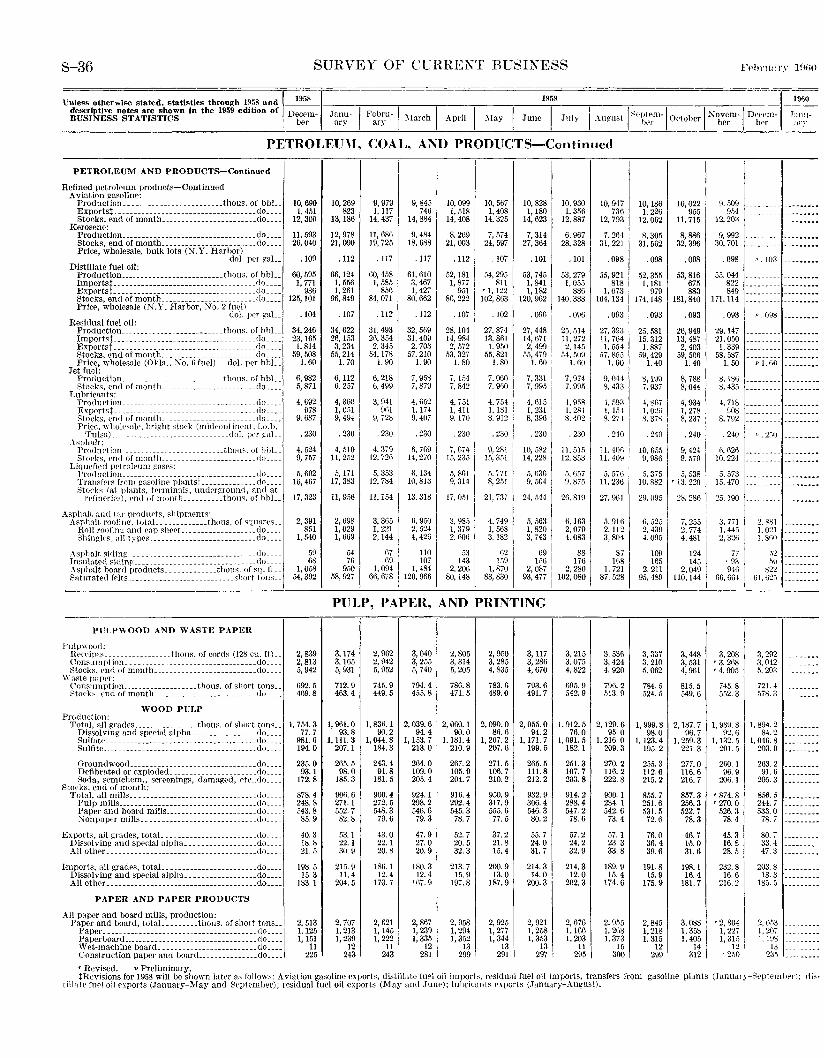
S-36 SURVEY OF CliRRENT BUSINESS
1959 Unless otherwise stated, statistics through 1958 and ~-~~- --descriptive notes are shown in the 1959 edition of Decem Janu I BUSINESS STATISTICS ber - ~ry- F~~~-"-ll\lurch I April I l\[ay ! June I July I
19/lO
1.\ugust I Septem-1 October I i'lovem-1 Decem- -];;;;-:-
- her · ber ber ary
PETROLEU\1, COAL, AND PRODUCTS-Continued
PETROLEUM AND PRODUCTS-Continued
Refined petroleum products-Continued Aviation gasoline:
Production ________________________ thous. of bbL. Exportst _ ----------------------------- ______ do ___ _ Stocks, end of month ________________________ do ___ _
Kerosene: Production. ________________________________ .do ___ _ Stocks, end of month ________________________ do ___ _ Price, wholesale, bulk lots (~.Y. Harbor)
dol. per gaL. Distiiiate fuel oil:
Production __________________________ thous. of hbL_ Importst--------------------------- ________ _r!o ___ _ Exports!. ___________________________________ clo ___ _ Stocks, end of month ________________________ do ___ _ Price, wholesale (N.Y. Harbor, !\o. 2 fuell
dol. per gaL_ Residual fuel oil:
ProdtiCtion ___ --------------------- __ thons. of hhL_ Importst. __ ------------------------ ________ .do ___ _ Exportst. ______________ --------------- _____ .do ___ _ Stocks, t)nd of month_~ ______________________ do ___ _ Price, wholesale (Okla., :\'o. 6 fue!L .dol. per bhL_
.Jet fuel: Production ____ --------------------- .thous. of bhL. Stoeks, end of month ________________________ do ___ _
Lubricants: Produetion __________________________________ do ___ _ Exportst. __________________________________ .do ___ _ Stocks, end of month ________________________ do ___ _ Price, who!Psale. bright stock (mi<lcontinent, f.o.b.
•rulsa) ______________________________ dol. JWr g,\L_ Asrhalt:
Produ('tion _____ ----··--- _____________ thous. of hhL_ Storkst t'nd of month ________________________ do ____ _
Liquefied prtrolpum g-nsr.s: Production _____________________ ··- ___________ do ___ _ Transfprs frotn gasoline plantst ______________ do ___ _ Stoeks (n.t plants, tPrrnin:lls, undrrgronnd, and at
refineries), end of nwnth __________ thons. of bhL_
Asphalt and tar products, shipments: Asphalt roofing, t.otaL ___________ thous. of sqrwrt•s __
Roll roofing and ""P shr<'L __________________ c]o ___ _ Shing!<-s, all types __________________________ c]o ___ _
Asphalt. siding ________________________________ ()o ___ _
Insnh1trd si<linp _____________ -------- __________ do ___ _ Asphalt bonn! products _____________ thous. of sq. fL_ Saturated frlts ___________________________ short tons __
Pl 1LPWOOD AND WASTE PAPER
Pulpwood: Re<'t•ipts _________________ thous. of cords (128 cu. ft) __ Consumption ________________ ---------------- .do ___ _ Stocks, t•nd of month __________________________ do ___ _
\Ynstf> pupt'r: Commmption ___________________ thous. of short tons __ Stoek~. t'IHl of month ______________ ------- _____ do ___ _
WOOD PUI,P Production:
Total, all grades ________________ thous. of short tons __ Dissolving and special alpha _________________ do ___ _ Sulfate _____ ----------- __ --------------- ____ .do ___ _ Sulfite. ______________________________________ do ___ _
OroundwoocL _______________________________ do ___ _ Defibrated or exploded.--------------- _____ .do ___ _ Soda, semichrm., screenings, damaged, etc"_do ___ _
8toeks, end of month: Total, all mills. __ -----------------------------""----Pulp mills ___________________________________ do ___ _
Paper and board mills _______________________ do ___ _ :\"on paper mills. ____ -------------------- ___ .do ___ _
Exports, all grades, totaL ___ ------------ _______ .<lo. __ _ Dissolving and special alpha ____ ----------- ... do ___ _ All other __ ------------------------------------do ___ _
1m pons, all ~rades, totaL _______________________ do ___ _ Dissolving and special a!plla __________________ do ___ _ All other ________ ------------------------------do ___ _
PAPER AND PAPER PRODUCTS I All paper and board mills, production: _
P'W~~e~~:l_ ~~~~~·-~~~~~--~::::::: ~~~~~~--~~ ~~-~·-t-~~~~:: ~· Paperboard ... _______________________________ do ___ _ Wet-machine board _______ -------------- ____ do ___ _ Construction paper and boanL _____________ do ___ _
IO, 690 I, 451
12,300
11, 593 26,040
.109
60, 595 1, 771
986 125, 101
.104
34,246 23,165 1,8I4
59, 508 1. 60
6,982 5,871
4, 692 978
9, 687
. 230
4, 524 9, 757
5, 602 16,467
I7, 323
2, 391 8.oi
1, 540
59 68
1,058 54,392
2, 8-39 2,8I3 5, 942
692.5 469.8
1, 754.3 77.7
981.6 I94. 0
235.0 93.1
172.8
878.4 248.8 543.8 85.9
40.3 18.8 21.!)
198.5 15.3
183.1
2, 513 1,125 1, I5I
11 225
10,269 823
13,186
12,978 2I, 090
.112
66,124 1, 556 1,261
96,849
.107
34,622 26,153 3, 234
55,214 1. 70
6,112 6. 257
4, 360 1, 051 9, 494
. 230
4, 510 11,252
5,171 17, 383
11,956
2, 698 1, 029 1, 669
54 76
950 58,927
9, 9791 1, 117
14,437
11,686 19,725
. 117
60,458 1, 585
856 84,071
.112
31,493 20,354 2, 345
54, 178 1. 90
6,218 6, 499
3, 941 91\1
9, 728
-230
4. 379 12. 72o
5, 353 12,784
11, 154
3, 365 1, 22I 2,144
67 69
1,094 66,678
I 9, 845 I
746 I 14,884
9, 484 18, 688
.117
61,610 3. 467 1, 427
80, 662
.112
32, 569 31,409
2, 703 57.210
1.90
7, 958 7,879
4, 652 1,174 9, 407
. 230
6, 7fl9 14,270
il, I34 10,813
13.318
6, 950 2, 524 4, 426
110 107
1, 484 120,9613
10,099 1,.118
14,408
8. 259 21,003
. 112
52,181 1,877
951 86,222
. 107
28, 104 14, 984 2, 572
53, 327 1. 80
i,IM 7, 842
4, 751 1, 4!1 9. 170
. 230
7, n74 15,235
,), SGI 9, 314
17, o.s1
3, 98.o I, 379 2, 60{\
531 143 2, 206
80.148
10, 567 I, 408
I4, 325
7, 574 24, 597
.107
54, 295 811
'1, 122 102, 863
.102
27,874 13,861
1, 950 55,821
I. 80
7,060 7, 9GO
4, 754 I, 181 8, 912
. 230
9, 281 15,351
5, 771 8, 251
21, 737
4, 749 1, 568 3.I82
62 159
I, 870 83,830 1
10,828 1,180
14,623
7,314 27,364
.10I
53,745 1,841 I,182
I20, 962
. 096
27,448 14,671
2, 499 55,479
I. 60
7, 331 7, 995
4, 615 1, 231 8, 396
-230
10,582 14,228
5, fi361 9, 504
21, 544 1
f: ~gg I 3, 743
69 I !5(i I
2, 087 93,477 I
PULP, PAPER, AND PRINTING
3,174 3,165 5, 931
7I2. 9 463.4
1, 961.0 93.8
1, lll. 3 207.1
265.5 98.0
I85. 3
90fl. 6 271.1 552.7 82.8
53. 1 22.I ao. 9
215.9 ll.4
204.5
2, 707 I,213 I,239
12 243
2, 962 2, 942 5, 952
745.9 449.5
1, 836. I 90.2
I, 044.8 184.3
243.4 91.8
181.5
900.4 272.5 548.3 79.6
43.0 22. 1 20.8
181i. 1 I2.4
17·3. 7
2, 621 1, 145 1, 222
ll 243
3,040 3, 255 5, 740
794.4 455.8
2, 039.6 94.4
I,153. 7 213.0
2f>4.0 I09.0 205.4
924.1 298.2 546.6 79.3
47.9 27.0 20.9
180.3 12.4
167.9
2, 867 1, 239 1, 335
12 281
2, 805 3, 314 5, 20.S
786.8 471.5
2, 060.I 90.0
l, I81. 4 210.9
267.2 105.9 204.7
916.4 292.4 545.3
78. i
52.7 20.5 32.3
213.7 I5. 9
197.8
2. 958 I 1,294 I,352
13 299
2, 950 3, 285 4, 835
783.6 489.0
2,090.0 86.6
I, 207.2 207.6
271.5 106.7 210.2
950.9 317.9 555.6 77. 5
37.2 21.8 15.4
200.9 13.0
187.9
2, 925 I, 277 I, 344
1a I 291
3,117 3, 286 4, 670
793.6 491.7
2, 055.0 94.2
I, I7l. 7 199.5
265.5 ll1.8 212.2
932.9 306.4 546.3 80.2
55. 7 24.0 31.7
214.3 14.0
200.3
2, 921 1, 258 I, 353
13 297 !
10,930 I. 356
12,887
6, 967 28,328
.101
53,279 1, 055
88{) 140,388
.096
25,.514 11, 272 2,145
c4. 5o~ 1. 60
7, 974 7. 995
4, 95R I 1. 281 8. 402 '
. 230
Il. 5t.o 12,853
.~. (Jf,7 9, 875
21>, 819
6,163 2, 079 4.083
88 176
2, 280 102,080
3, 215 3.075 4,822
695.9 542.9
10,947 736
12,793
7. 264 31.221
.098
55,921 818
1, 673 164, 134
.093
27, 39:J ll, 764 1, 554
ii7, 855 1.60
9,044 8, 433
4. 59~ 1, !54 8. 274
. 240
11. 40C. I!. 40~ i
1~:~~g i 27.961
5. 916 2.112 a,so4 I
87 I
H\81 1, 721 87, 528
3. 536 3, 424 4. 920
796.2 513.9
I, 912.5 2, 129.6 76.0 95.0
1, 091. 5 1, 2I6. 0 182. 1 209. 3
251.3 107. 7 203.8
914.2 288.4 547.2 78.6
57.2 24.2 32.9
214.3 12.0
202.3
2, 676 1,166 1. 203
2~~ I
270.2 116.2 222.8
900.I 234. 1 542.6
73.4
57. 1 23.3 33.8
189.9 15.4
174.6
2. 955 l, 268 1,373
15 300
10, 186 1, 226
12,062
8,305 31,562
.098
52,355 1,181
979 174.148
.093
25,581 15.312 1,887
59,429 1. 40
8,199 7. 937
l, 867 l, 02t) 8. 378
-240
10,655 9, 986
10,022 955
11,715
8,886 32,396
.098
53,816 675 883
181,840
.093
26,949 13,487 2, 403
59, 506 1.40
8, 788 8,044
4, 934 I, 278 8, 237
. 240
9, 424 9. 579
5, 375 5, 538 10.882 '13.22\J
29.095
f), 525 2, 430 4,095
!09 I65
2. 211 95. 489
3, 337 3. 210 .1. 062
784.5 524.5
28,286
7, 255 2, 774 4, 481
124 14!\
2,049 110,144
3,448 3,531 4, 961
815.5 549.6
1, 999. 8 2, 187. 7 98.0 96.7
1. 123.4 I, 259. 3 195. 2 221.3
255.3 112.6 215.2
855.7 251.6 531.5 72.6
76.0 36.4 39.6
191.8 15.9
175.9
2,845 1,218 l, 3I5
12 299 i
277.0 116.6 216.7
857.3 256.3 522.7
78.3
46.7 15.0 31.6
198.1 I6.4
181.7
3, 088 1,358 1, 405
14 312 I
9 .. 109 954
12, 2oa
9, 992 30,701
.098
55.044 822 849
171,114
. 093
29,147 21,050
1, 339 58, 587
1.50
p- !03 --------·
p- 098 ---------
8,186 1------- - ---------8, 435 '---- -----
4,7181---------1>08 ---------
8.792
. 240
6, 62~ 10,224
p. 2.)0
5. 5731 _________________ ..
15,470 ------------------
25,190
3, 771 1
1, 44.1 . 2. 32(1
77 '93 94G
66,664
3,208 '3, 268 '4, 905
745.8 552.3
1, 989. R 92.6
1, 132.5 201.5
260.1 96.9
206.1
'874. 8 '270. 0
526.3 78.4
45.3 16.8 28.5
232.8 16.6
216.2
'2. 804 1, 227 1, 31!\
12 i '2.o0 I
2, ,81 1.021 1. 8fi0
,')2 ;')g
~22 61, (j~;)
3, 292 3, 042 .5, 203
721.4 578.3
1, 894.2 84.2
1,046.8 203.0
263.2 91.6
205.3
856.5 244.7 533.0
78. i
80.7 33.4 47.3
203.8 18.3
185.5
2, 653 1, 207 1.198
13 23.~
' Revised. • Preliminary. ~Revisions for 1958 will bt• shown later as follows: Aviation gasoline exports, distillate fu"l oil imports, residual fuel oil imports, transfrrs from gasoline plants (January~S(•ptemher): dis·
tillute furl oil exports (.January-May and September); residual fuel oil exports (May and June): lubricants exports (January~.~ugust).
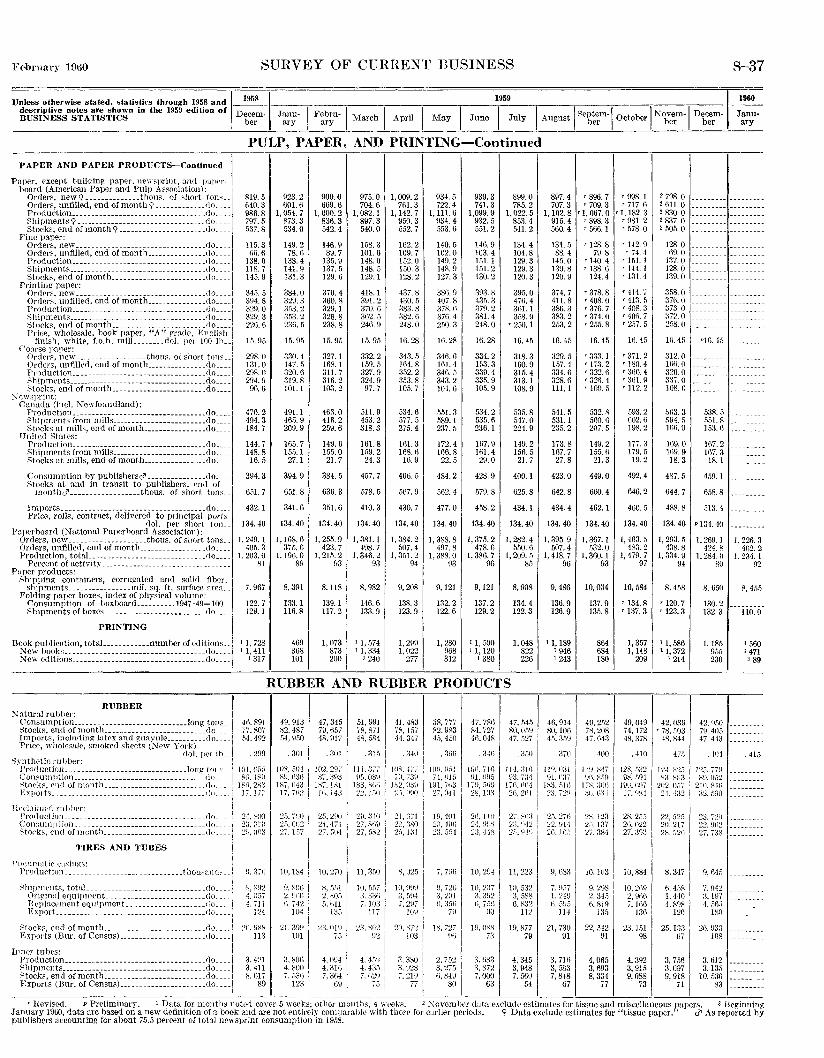
SURVEY OF CUHRE~T BUSINESS S-37
1959 Unless otherwise stated, statistics through I958 and ~_1_~-~----·
descriptive notes are shown in the 1959 edition of . Decem- Janu- I ~""ebru-BUSINESS STATISTICS , ber ary ~ry March I April I May I June I July 1
1960
I i\.ugust 18eptem-1 October I Novem-1 Decem- . Janu-• ber ber ber ary
PULP, PAPER, AND PRINTING-Continued ---------------------,-- ---,---,---,----,,---,---,---~---
PAPER AND PAPER PRODUCTS-Continued
Pa.per, except huilding paper, newsprint, and paper-hoard (American Paper and Pulp Association):
Orders, new 9------------- .thous. of short tons __ Orders, unfilled, end of month<;> _____________ do ___ _ Production _____ ------------_. _______________ do ___ _ Shipments<;>------------- ____________________ do ___ _ Stocks, end of month<;>------------------ ____ do __ _
Fio~J~~r.e~;ew _________________________________ do __ -I ?,~~~,~~~tf~:1~~1~~:-~~~ ~!-~~~~:~~~:::::::::: :: ::)~:: :I Shipmcnts ___________________________________ do __ .
1
Stocks, end of month ________________________ do __ Printing paper:
g~~l6~~: ~;,~ile<i;eii"Ciiii"fficifiii:l_~:::::::::::::~~::: I Shipmf'nts ______ ------- __ ------ _____________ .do __ _ Production _______ --------------- ___________ .do ___
1
,
~tocks, end of month ________________________ do __ _ Price, wholesnJe, hook paper, uAn gradt>, English
finish, whitr, f.o.h. milL _______ dol. per 100 lh __ Co<.lrse paper:
Ordrr~, new __________________ thous. of short ton:-: __ Orders, unfilled, end of month _______________ <lo __ _ Prnduction ______ --------------------------- _<}o ___ . ::;:hiptncnts ___________________________________ do ___ _ Stocks, end of month ________________________ do ___ _
~~wsprint: Canada (incl. Ne\\'foundland):
Production _____________ ---- _______ -------- __ do ____ 1 Shipments from mills ________________________ do ___ _ Stocks at mills, end of month .•...••...•..•.. do ___ _
United States: Production ___________________________________ do ___ _ Shipments from mills ________________________ do ___ _ Stocks at mills, end of month .....•.•...•.... do. __ _
Consumption by pnblishersc?'---------------do ___ _ Stocks at and in transit to publishers, end of
monthc?' ... _______________ thous. of short tons __
Imports ______ ------ __ ------- ________________ do ___ _ Price, rolls, contract, de1ivered to principal ports
1 dol. per short ton __
Pnperhoard (National Paperboard Association): I Orders, ne1v ____________________ thous. of short tons __ Orders, unfilled, end of month ________________ do ____ l Production, totaL.------------------------- .. do ____ ,
Percent of activity_------------------------·- __ _ Paper products:
,;;,;,hipping containers, corrugated and solid fiber, shipments ________________ mil. sq. ft. surface area __
Fol<ling paper boxes, in <lex of physical volume: Consumption of boxhoard __________ 1947-49=100. _
1
Shipments of boxe;~;~~;~~-----····-··---do. __ _
B~~J'~,~~~~:~~~:~~~~~~~~~:~~~~~~~~~-~~-~~~~:_e_<~~~~~~:~::l New cc!Jtrons .. _ ------- ...........•.•.•.. ____ ._do_. __
\
819.5 640.3 986.8 797.5 537.8
115.3 ()f).{)
138.0 IJ8. 7 145.9
34.5. 5 394.8 329.0 329.3 226.6
15.95
298.0 131.0 298.0 294. g 96.6
476.2 494.3 184.7
144.7 148.8 16.5
394.3
651.7
432.1
134.40
I, 249.1 40.5. 3
I, 203.0 81
7. 967
122.7 129.1
I I, 728 l 1, 411
I 317
923.2 601.6
1,0M.7 873.3 534.0
149.2 78.6
138.4 141.9 131.3
384.0 329.3 3DR 2 353.2 236.5
1.5. 95
.330. 4 147.5 320.6 319.8 101.1
491.1 46-5.9 209.9
Hl5. 7 155.1 27.1
394.9
651.8
341.6
134.40
I, 168.6 375.6
1,196.0 89
8,391
133. 1 116.8
469 368 101
900.0 669.6
1,000.2 836.3 542.4
146.9 89.7
135.9 137.5 129.6
370.4 :160.8 329.1 326.8 238.8
15.95
327.1 168. 1 311.7 316.2 103.2
466.0 416.2 259.6
149.6 155.0 21.7
384.5
636.3
351.6
134. 40
1,25.0.9 423.7
1, 2!.5. 2 93
8, 118
139.1 117.2
1,073 873 200
975.0 704.6
1,082.1 897.3 540.0
158.3 101.6 148.0 148.5 129.1
418.1 391.2 370.6 3G2. 5 246.9
15.95
332.2 159.5 327.9 324.9 97.7
511.9 453.2 318.3
161.8 11l9. 2 24.3
457.7
578.5
410.3
134.40
I, 381.1 498.7
I. 346.2 H3
8, 982
146.6 133.9
I I, 574 '1, 334
l 240
1, 009.2 761.3
1, 142.7 950.3 552.7
162.2 109.7 152.0 !50. 3 128.2
437.8 430.5 :l83.8 382. (i I 248.0
16.28
343.5 164.8 3:;2.2 353.8 105.7
534.6 577.5 275.4
161.3 168.6 16.9
466.5
567.9
430.7
134.40
1,384. 2 .107.4
1,351. 2 94
9, 208
138.3 123.9
1, 299 1, 022
277
934.5 722.4
I, 111.6 934.4 5.13. 6
140.5 102.0 149.2 148.9 127.3
386. g 407.8 37g. 6 376.4 2.oo. 3
16.28
346.6 161.4 346.5 343.2 104.6
551.3 589.1 237.5
172.4 166.8 22.5
484.2
562.4
477.0
134.40
I, 388.8 4H7. 8
1,388.0 93
9,121
132.2 122.6
1, 280 968 312
939.3 741.3
1,099. 9 932.5 551.2
146. n 103.4 151. I l.ol. 2 130.2
393. R 435.3 379.2 381.4 248.0
16.28
334.2 153.3 339.4 335.9 105.9
534.2 535.6 236.1
11l7. 9 161.4 29.0
428.9
579.8
458.2
134.40
1,375. 2 478.6
1,386. 7 96
9,121
137.2 129.2
I 1, 500 t I, 120
l 380
899.0 785.2
1,022. 5 853.4 541.2
134.4 104.8 129.3 129.3 120.3
39.o. o 476.4 301.1 358.9
'2.10.1
16.45
318.3 160.9 315.4 313.1 108.9
535.8 M7.0 224.9
149.2 156.5
21.7
400. I
625.8
434.1
134.40
1,282.4 550. (\
1, 209. 5 85
8, 908
134.4 122.3
1, 0481 822 226
RUBBER AND RUBBER PRODUCTS
RUBBER .'Jntural rubber:
~to;~f{~:1  2:\, (J02 27. 157
10, 184
47,345 79,657 4'\, 917
.:101
l02, 297 S'/.;{H:J
1:-';'/,l(\l Iii, 143
25, 2P(J 24,471 :n .. "ifl4
10,270
~ •. 5fll 2. c;o.o 5. till
13[i do __ -~
Stocks, C'f!d ofmonth ____________________ . ______ fl.n_ 1 :?LtlSH 2L3~lH ·>':{ fliU j Exports (Bw-. of Census) ______________________ do_ :~~~ 113 101 •... 751
Inner tubes: Production ____________________________________ do_ _ _ :::. 4-~!l 3. 80() 4, 01J4
~~~~k~:·~;,sd_oimO"ntii~:::~~::::::::::::::::::::~l~: :::II ~: m ~: ~~~ ~: ~~~ I Exports (Bur. of Census) ______________________ do ____ , 89 123 69
-------------~~------~-----~----
51,991 78,871 4K, 5R4
. 31!i
Ill. :J~; f'D. 0:'-\\1
JS3, ".Cii :1?. Jfi()
:zu. 010 27, :'.tiiJ 27. [i,<-;2
11, 351)
10. 557 a.:J:ln
1
, 7. 103
!17
:!3. ~n2 I \121
4. 4!1\J I 4. 435 7, t~29
75 I
41. 483 73, 157 44. 347
. :Hil
11),~. 471 i~l, (.;HI
J~2. msfl :.:.). HHO
21, (i';'l •Vl ~1'l,(\
~;: 1~11
H, 1125
10, fimJ ~~. 5!14 7, 297
1/JV
20, S721 103
I 3, 380 I ::s. 9281 7, 21il
77 ! !
38, 777 R2, 983 45, 450
J(J,401 2il, 491) n.GM
7, 79{)
f,, 72G l :l, 2\11 n. a5n
7B
IB, ·~~ I
<) 75') :;: 275 6, 849
80
47, 781) 84, 727 4fi, 048
. 341)
101\, 71t1 ~H. t\!)5
17H, ;,.;n 2H, 1:13
2{), l IH 24, H\','\ 23, -liS
10, 204
!S, OJ'H 7~
3. 683 :l, 872 7.000
63
47,545 so, o.o!l 47. 527
Il-l, :llli tt3 734
1/f< t\(14 2G, 21>1
27 ...... ,::~ :!:1. ~"12 ~[ .• \'-1\J
11,223
10,532 :J, .oSS G, ~:~2
!12
ID, 877 79
4. 345 3, 948 7, 560
54
897.4 707.3
1, 102.8 915. 4 560.4
131.5 88.4
145.0 139.8 I20. 9
374.7 411.8 386.3 383.2 253.2
16.45
329.5 157. 4 334.6 328.6 111.1
541.5 531. 1 235.2
173.8 167.7 27.8
423.0
642.8
434.4
134.40
1, 395. g 507.4
1, 418.7 96
9, 486
136.9 126.9
I 1, 189 I 946 I 243
46, 914 80, 106 4.o. :l.l\l
. :170
Jl!J, U31 HL c;{i
Jx:l.lilG 2~-L i2(j
'25. '276 :.:2. \.114 ~G. lt!i
7.\157 L 2HJ G, .~lJ:)
IH
21,730 91
3. 716 3, 583
7, 8481 67
'896. 7 '709. 3
'I, 067.0 '898. 3 '566.1
'128. 8 79.8
'140. 4 '138. 6
124.4
'378. 8 '408. 0 '376. 7 '374. 0 '255. 8
16. 45
'333. I '173. 2 r 322.G '32il. 4 '109. 5
532.8 5HO. 0 207.5
149.2 155.6 21.3
449.0
660.4
462. 1
134.40
1,367.1 532.0
1, 360.1 93
10,034
137.9 135.8
864 684 180
49,2!i2 78,208 47. n13
. 100
1W,t-<"li Vi.b."•fl I
17:-;, ;-::on : ;)I I tl.)~ ~
:?S, 1:!:1 -;;,_ 1:J7 '27. :384
10,103
9. 29s 1
2. 34.o , 6.819
13.5
22,.142 91
4, 06.5 3, 693 8,334
77
'998.1 '717. 6
'1, 182.3 '981. 2 ' 578. 0
'142. 9 '74. 4
T ]5}. J '144. I '131.4
r 414. 7 '413. 5 '408. 3 r 406.7 '257. 5
HJ. 45
'371.2 '180. 4 '3ri0. 4 '361. 9 '112. 2
593.2 602.6 198.2
177. 3 179. 5 19.2
492.4
646.2
460.5
134. 40
1,463. 5 483.2
I, 479. 7 97
10,584
'134. 8 '137.3
1, 357 I, 148
209
49,049 74,172 48,378
. 410
l2~) ;;:1~ m-.w1
190. !i()'j'
I I. \IS-:1
21'. 25'; 21i. ()~2 27. 39:~
10,884
10,2119 2, !1<>6 I 'i,JfiG I
136
23.151 98
4,392 3, 915 9,088
73
2 798.0 2 611.0 2 830.0 2 837.0 2 505.0
128.0 69.0
137.0 128.0 139.0
31\8.0 --------- ---------
~~~- g 1::::::: ----------~~§.2 =====-~-- ---------1() 45 JJ16 4~ ---------
312.0 W6.0 320.0 3:li. () 108.0
563.3 594.5 W6. g
169.0 1o9.9 18.3
487.5
644.7
538.5 !'i51. R 153.6
167.2 167.3
18. I
459. 1
658.8
488. 8 .513. 4
134. 40 p 134. 40
1, 293.5 438.8
1, 334. 9 94
8, 458
'120. 7 '123.3
I I, 586 I I, 372
l 214
42,039 '78, 503
48,844
22, 52!) 20,217 2h, :,21)
s,3n (), 458 I. 440 4. 898
120
25,133 97
3, 7.06 :l, 097 9,918
71
1,269. I 424. 8
I, 284.11 80
8,650
130.2 132.3
I, 185 fl55 230
42,%0 79. 405 47,413
23, 7:Zil 2'2. ~}(i~! 27. /;)8
9. 6-15
7,\142 3, 197 4. f)f,.)
180
2(i, 933 108
3. 612 3, 135
10, 531l 83
1, 226.3 462.2
1. 2:!4. 1 \l2
8, 4,1)5
110.0
,, 560 3 471
3 89
'415
r HcvJscd. P Prelim mary. I Data for nwntlls notl'Ci cov('r 5 weeks; other months, 4 \\"('Cks. 2 .i'\overnlwr ddt.l exclude estimates for tissue and miscellaneous papers. 3 Beginning January 1960, data are based on a new definition of a book and are not Pntirely com1w.raillc with those for c.Lrlier pe11o<ls. ¥ Data exclude estrmates for "tissue paper." c?' As reported by publishers accounting for ahout 75.5 percent of total ne"·sprint consumption in 1958.
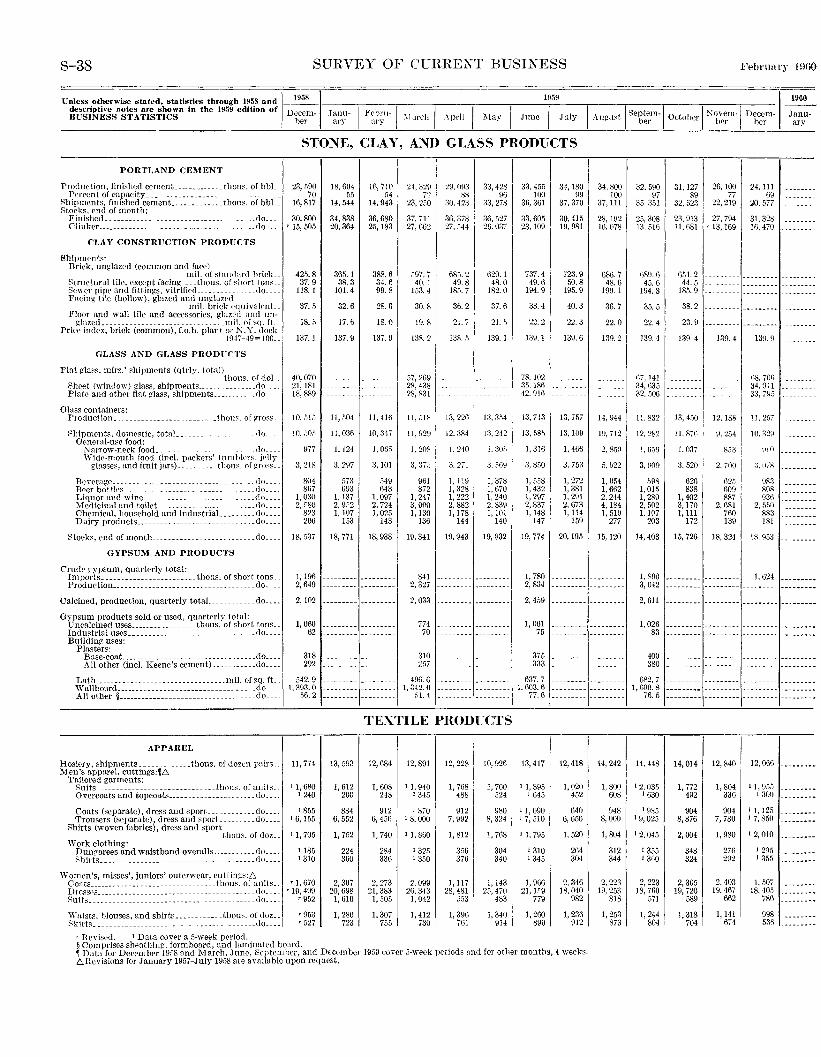
S-38 SURVEY OF CURRENT BUSINESS February 1960
1959 Unless otherwise stated, statistics through 1958 and 1- 1958
_, descriptive notes are shown in the 1959 edition of D cern J· ·~· F 'b · I I BUSINESS STATISTICS ber - ~:~u- ~~r~-~~- \[arch
I
.\ pril I May I J11ne I July 1
1960
I August 18eptem-l October I :'\"ovem-1 Decem- -Janu-ber ter her ary
STONE, CLAY, AND GLASS PRODUCTS
PORTLAND CEMENT
Production, finished ceruent_ ____________ t.hous. of bbL Percent of capacity ______________________________ _
Shipments, finished cement _____________ tlwns. of bbL. Stocks. end of month:
23, fi90 70
16,817
Finished _______________________________ . _ .... do.... 30,800 Clinker ______________________________________ .. do ... _ ' 15, 505
CLAY CONSTRUCTION PRODUCTS
Shipments: Brick, unglazed (common and face l
mil. of standard hrick .. Stmctural tile, except facing ___ tho us. of short tons._ Sewer pipe and fittings, vitrified __ . ______ . __ do .. __ Facing tile (hollow), glazed and 11111dazcd
miL brick {'quiv8knL~ Floor and wall tile and accessories, glazt'd and un-
glazed _______________________________ mil. of sq. ft Price index, brick (common), f.o.b. plant or K.Y. dock
1947-49= 100 ..
GLASS AND GLASS PRODUCTS
Flat glass, mfrs.' shipments (qtrly. total) tlwus. of dol..
Sheet (window) glass, shipments ..... ___________ do Plate and other flat glass, shipments. ________ .<lo _
Glass containers: Production ______________________ .. __ thom. of ~ross._
Shipments, domestic, totaL___________ .clo ... General-use food:
Narrow-neck food .. ____ .do Wide-mouth food (incl. packers' tumhl<'rs jPI!y
glasses, and fruit jars). _________ tllous. of gross ..
Revrragr ___ ---------------------------- _. __ do Beer bottles .. ----------------------- ______ .do Liquor and wine______________________ ... do Medicinal and toilet ________________________ do. Chemical, household and IndustriaL ___ .... do Dairy products _________ -------------- ..... do ....
42.o. 8 37.9
l18. I
37 .. o
18.5
137. 1
40, 070 21,181 18,889
10. !il.l
111,50.1
97i
3, 218
804 867
l,O:lO 2, f80
823 206
18,604 55
14,544
34,838 20,364
16.710 . 54
14,943
36,680 25,183
365. I 388.6 38.3 34.6
101.4 99. 8
32.6 28. 6
17.6
137.9
18.0
137.91
11,.004
II, 036
I, 124
3, 297
f"l73 693
I, 137 2, 9c2 I, 107
153
11,416
10,347
1, Q(),l)
3,101
!i49 643
1,097 2, 724 I, 025
143
I I I
I
21. 3?~ 1
1
23,2:,0
37. ill 1
27,662
[)97. 7 40. 1
153.4
30.8
19.8
138.2
.17, 269 28, 438 28,831
11, r.1~
11, 929
I, 208
3, 37!i
961 872
I, 247 3, 000 I, 130
136
29. 0931 88
30. 4z:l I 36,378 27. :-44
685.2 49.8
185.7
36.2/
'21. 7
138 .. I
13,226
12,384
1. 240
3, 271
1, 119 1, 328 I, 222 2, 882 I, 178
144
33,428 96
:l3, 278
36, D27 26. oa7 I
629. I 48.0
182.0
37.6
21. .s
139.1
13.3.14
13, 242
1. 30oi
3. ''69
I, 378 I, 670 I, 240 2, 839 I, 101
140
I
;J:3, 455 100
36,361
33,605 23, 109
737.4 49.6
194.9
38.4
22.2
139. I
78.102 35,186 42. 916
13,713
13, 58.5
1, 316
:J, 8.\0
1,Mi8 1, 432 1, 297 2, 837 1, 148
147
I :l4. 180
99 37, 370
30.415 19,981
723.9 50.8
195.9
40.3
22.3
13\J, 6
13, 757
13. 109
I, 466
3. 753
I, 272 1, 381 1. 291 2,673 1, 114
159
34.800 I 1001 37,lll
28. 102 lfi. 078
686.7 48.6
199. I
36.7
22. o I 139.2 I
14.944 I
HI, 712 i
2, 8.10
5. \!22
I, 054 I, 662 2, 244 4,184 I, 519
277
32. 590 97
3.5. 351
25, 308 13.516
6R9. 6 45.6
194.3
3.5. 5
22.4
139. 1
Ci, 141 34,635 32, .1()6
11.832
12,282
'· fic·91
3, \!09
598 I, 015 I, 289 2, 502 1.107
203
31, 127 26, 100 89 77
32, 5~3 i 22, 219
2:J, 913 27, 794 11, fi81 c 13,169
654.2 44.5
185. (I
38.2
23. D
139 4 139.4
::::::::: :::::::::) I
13, 450 12. 188 i i
II, 87f> 9. 254 1
1, 037
a, 520
626 838
1,402 3,170 1,111
172
853 i 2.100 1
nz.s I 609 887
2, 681 760 139
24,111 69
20, 577
31,328 16,470
139.9
ns. 71)1)
34.911 33. 7(,15
11.257
10.329
;J, ll/~
\!83 808 93tl
2, 55!) 883 181
Stocks,endofmonth ______________________ ... do .... 18,!i37 18,771 18,938 19,341 19,943 19,832 19,774 20,195 15,120 !4,403 15,726 18,324 1~.95:J
GYPSUM AND PRODUCTS
Crudr vypsum, quarterly total: Imports. _______________________ thot!s. of short tons __ Production .. _________________________ ___. __ .do ....
Calcined, production, quarterly totaL __ _ __ ___ do ....
Gypsum products sold or used, quartPrly total: Uncalcined uses _________________ thons. of short tons .. Industrial uses __________________________ . ____ .do. __ . Buildinv uses:
Plasters: Basc-coat. _________________________________ do .. All other (incl. Keene's cement) ___________ do
1,196 2,649
2,102
1, 060 62
318 292
Lath _________________________________ mil. of sq. ft. M2. 9 Wallboard _________________________________ .do____ 1, 393.0 All other § ___________________________________ do.... 56.2
APPAREL
HosiC'ry, sbipn1ents _____________ thous. of dozen pairs __ ~en's apparel. cuttings:~L:-.
Tailored garments: Suits ______________________________ thous. of units_ Overcoats and topcoats __________________ .. _ .clo ....
Coats (separate), dress and sport._ .. _______ .do. ___ Trousers (separate), dress and sport.__ ... do ... _
Shirts (woven fabrics), dress and sport thous. of doz._
Work clothing: Dunvarees and waistband overalls _______ .... do .... Shirts.-------------------- _____ . ________ . __ .do .. __
II, 774
I ),680 I 240
I 855 I 0,155
I I, 705
I 185 1310
\Vomcn's, tnisses', juniors' outonvear, cuttings:,6. Coots ________________________________ thous. of units.. ' I, 670 Drrssrs ____ ------------------ _________________ .do .. __ ' 19, 499 Suits _______________________________________ .. do.... '952
' Ileviscd. I Data cover a 5-week period.
'9.o3 '527
13, .\93
I, 612 200
884 6, 552
I, 752
224 360
2,307 20,698
1, 610
I, 280 723
841 2, 327
2, 033
774 70
310 2ti7
496.6 1, 342.0
51. 4
TEXTILE PRODUCTS
12,684
I, 608 248
912 6, 456
I, 740
284 336
2, 273 21,383
I, 505
I, 307 755
I 12.891 I
I I, 940 I 34.')
I 870 I 8, 000
I I, 860
132.1 \350
2,099 26,343
I, 042
I, 412 730
12,228
I, 768 488
912 7, 992
1,812
3.i6 376
1, 117 28,481
5.\3
I, 396 761
10,926
1, 700 524
980 8, 324
I, 768
304 340
I, 143 25, 470
483
I, 340 914
I, 780 2, 834
2, 459
1, 061 75
375 333
637.7 I, 603.6
77.6
13,417
I I, 89,\ I 645
I I, 090 I 7, 510
I I, 795
I 310 I 345
I, 966 21, 1.'9
779
12,418
1,020 452
640 6, 656
I. 520
264 304
2. 3-16 18. 040
982
1, 260 I I, 236 890 912
§Comprises sheathin~. form board, and laminated board. , Data for December 19c8 and March. June, September, and December 1959 cover 5-week periods and for other months, 4 weeks. L:;Revisions for January 1957-July 1958 are available upon request.
14,242
I, 800 608
948 8. 000
I, 804
312 344
2. 223 19, 253
818
I, 253 873
I, 890 3,042
2, 611
1,026 83
400 380
682.7 1,690. 8
76.5
14, 448
12,03.5 I 630
19% 19,025
12,045
I 355 I 360
2, 223 18,760
571
1, 244 804
14,014
1, 772 492
904 8,876
2,004
348 ' 324
2,365 19,720
589
1,318 704
12,840
I, 804 336
904 7, 780
1, 980
276 292
2, 403 19,467
662
1,141 674
I. 624
12,066
I I, 955 \300
I I, 12.1 I 7, 850
I 2,010
l 2Q5 1 355
I, 507 18,405
786
998 536
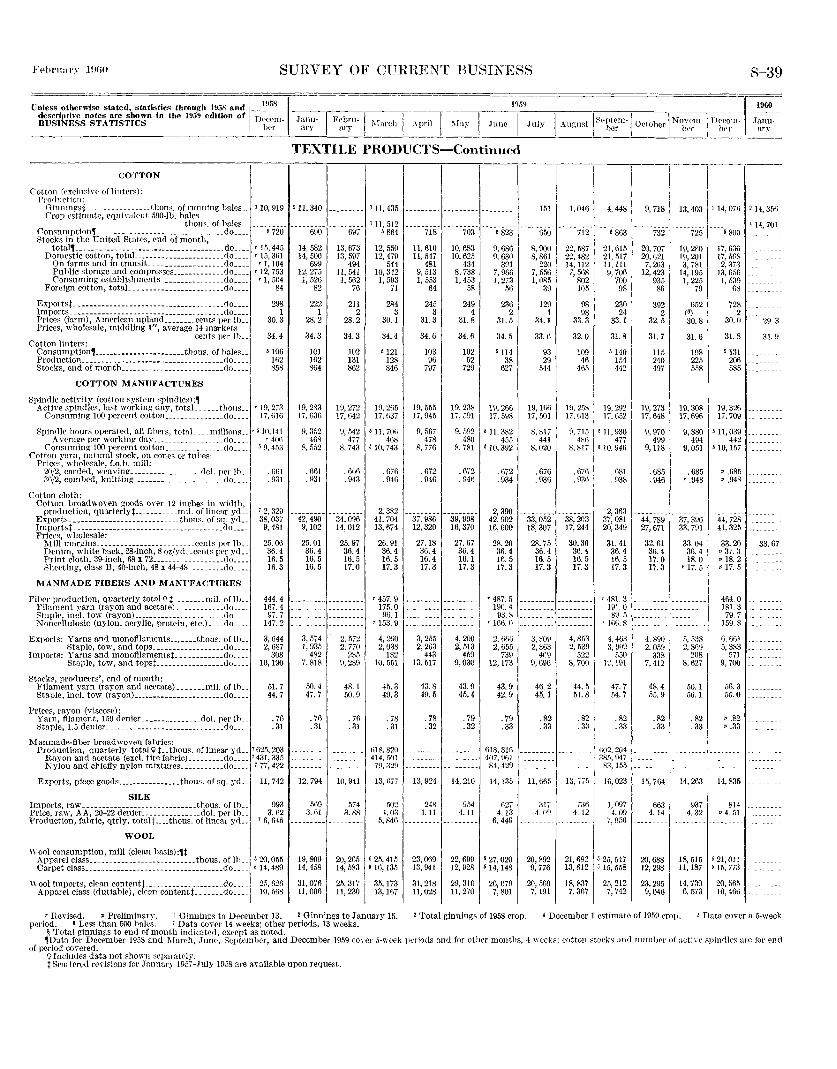
SURVEY OF CFRRENT BUSIXESS
Unle~s otherwise stated, statistics through 1958 and 1 195~~-~ descriptive notes are shown in the 1959 edition of Dt'cPm BUSINESS STATISTICS her - Janu- I Febru-~ 1~ 1 " ·c·.!J I -~\-~~~-~ -\'
ary ary " 1 • pn j - 'ay
1959
Juno I July
TEXTILE PRODUCTS-Continued
I August I Septem-1 Octo he I "<ovem-1 neee·n-1 - ber r hPr hrr
8-39
1960
January
------------,----.---.----;---,--,--,----,-----.-----,----,---,-----,--------~---·-
1 COTTON
Col ton (f'xclm;i\'P of! inters): Prn(lnction: Oinnin~ss~---------------thonB. of running bales __ '10,919 '11,340 --------- '11,435 --------------------------Crop est-imate, equi\'alent WO-lh. bales
151 1, 046 4, 448
thous. of hale.s __ -------- ___________________ '11. 512 _ _ ____________ _ Consumption, ________________________________ do____ '720 690 697 '864 ----718- -----763- ----6823- -----6.51]-- 712 '863 Stocks in the United States, end of month,
total~--------------------------------------do .... '15,445 14,582 13,673 12,550 11,610 10,683 9,686 8,900 22,587 21,615 Domestic cotton, totaL _____________________ do .... '15, 361 14, 500 13, 5(17 12,479 11,547 10,625 9, 630 8, 861 22,482 21,517
On farms and in transit ___________________ do____ • 1,104 699 494 544 481 434 391 220 !4,112 11,111 Public storage and compresses _____________ do ____ • 12, 753 12,275 11, 541 10,342 9, 5!3 8, 738 7, 966 7, 556 7, 568 9, 706 Consuming establishments ________________ do____ 'I, 504 1, 526 1, 5o2 1, 593 1, 553 1, 453 1, 273 I, 085 802 700
Foreign cotton, totaJ. _______________________ do.... 84 82 76 71 64 58 56 39 105 98
Exportst _ • ---- ___ ----------. _- _______ . _. ______ do. __ _ Imports. __ ----- _______ -----. __________ . __ ._~_ .do. __ _ Prices (farm), American upland ________ cents per lb .. Prices, wholesale, middling I", average 14 ma-rkets
Cotton linters: cents per lb ..
Consumption, _______________________ thous. of hales .. Production. ___ ----- ___ -------- ______________ . _do. __ _ Stocks, end of month __________________________ do ___ _
COTTON MANUFACTURES
298 I
30.3
34.4
6106 IB2 858
Spindle activity (cotton system spindles):, ~\cth·e spindles, last working day, totaL ____ tltous __ r 19,273
Consuming 100 percent cotton _______________ do.... 17,fiHi
Spindle hours operate<\, all fibers, totaL ___ millions .. • 5 10.H1 Avera~e per working day __________________ do ___ ~ • 40B
Consuming 100 percent cotton ______________ ~do .... '9.4.53 C'ott?n yarn, natural stock, on con('~ or tuhrf:: 1
Pnces, wholesale, f.o.h. mlll: 20/2, carded, weaving __________________ <loL per !h .. ! . fiG! 3f>/2, combed, knitting _______________________ <lo ____ l . 931
Cotton cloth: Cotton broadwoven goods oYer 12 inches in width,
production, quarterlyt ___________ mil. of linear yd .. Exports __________________________ .. thons. of sq. yd .. Importst. _ --------------------- _ ... _. _ ... _ .. __ do ___ . Prices, 'vholesale:
Mill margins _________________________ cents per lb .. Denim, white hack, 28-inch, 8 ozjy<L.cents per yd __ Print cloth, 39-inch, 68 x 72 __________________ do ___ _ Sheeting, class B, 40-inch, 48 x 44-48 ........ do ___ _
MANMADE FIBERS AND MANUFACTURES
Fiber pro<luction, quarterly total Q t, _______ mil. of lb __ Filament yarn (rayon and acetate) ____________ do ___ _ Staple, incl. tow (rayon) _______________________ do ___ _ Noncellulosic (nylon, acrylic, protein, etc.) ____ do ....
Exports: Yarns and monofilame.nts _______ thous. of! h .. Staple, tow, and tops __________________ do ....
Imports: Yarns and monofilamentsf ____________ do __ __ Stnple, tow, and topsf _________________ do __ __
Btorks, producers', end of month: Filament yarn (rayon and acetate) _______ mil. oflb __ Staple, incl. tow (rayon) _______________________ do ....
Prices, rayon (viscose): Yarn, filament, !50 denier _______________ dol. per lb .. Staple, 1.5 denier ______________________________ do ....
1\IIanmadc-fiber broad woven fabrics:
7 2, 329 38,037 9,481
25.06 36.4 16.5 16.3
444.4 167.4 97.7
147.2
3,644 2,687
308 10,190
51.7 44.7
. 76
. 31
Production, quarterly total\? t .. thous. of! in ear yd .. '625, 203 Rayon and acetate (excl. tire fabric) _________ do .... 7 431, 335 Nylon and chiefly nylon mixtures ___________ do .... 7 77,422
Exports, piece goods ___ ~~~~-------thous. of sq. yd .. ,
Imports, raw _____________________________ thous. of !h .. Price, raw, AA, 20-22 denier _______________ dol. per !h .. Production, fabric, qtrly. totalf ____ thous. of linear yd __
WOOL
\\' ool r,onsumption, mill (clean basis) :U
11, 742
993 3.62
7 6, 645
Apparel class ___________________________ thous. of lb .. '20, 055 Carpet class ___________________________________ do ____ '14,489
222 1
28.2
34.3
101 162 864
19,283 17, (136
9, 352 468
8, 552
. fi61
. 931
42,490 9,102
25.01 36.4 16.5 16.5
3, 574 I, 935
482 7, 818
50.4 47.7
. 76
. 31
211 2
28.2
34.3
102 131 862
284 3
30.1
34.4
'121 128 846
19,272119,265 17,!i42 17,637
9, 542 6 11. 70() 477 468
8, 743 ' 10, 743
. 660 . 076
. 943 . 941)
34,096 14,012
25.97 36.4 16.5 17.0
2, 572 2, 770
285 9,289
48.1 50.9
. 76
.31
2, 382 41,704 13,674
26.91 36.4 16.5 17.3
'457. 9 175.0 96.1
'153. 9
4, 260 2, 038
182 10, 551
45.3 49.3
. 78
.31
li18,820 414, 50!
79, 32\J
12, 794 10, 941 13, (i/7
509 574 502 4.03
5, 846 3. 61 3. 88
19,809 14,458
20, 265 ' 25, 415 14,583 '16, 135
245 3
31.3
34.6
103 96
797
19, 555 17,945
9, 567 478
8, i7f3
. 672
. 946
37,986 12,320
27.18 36.4 16.4 17.3
3,255 2,263
443 13,517
43.8 49.5
. 78
.32
249 4
31.8
34.6
102 52
729
19. 238 17. 591
9, 592 480
8, 781
.672
. 946
39,908 16,370
27.67 36.4 16.1 17.3
4,200 2, 5!3
459 9,030
43.9 45.4
. 79
.32
13, 924 14, 210
248 954 4. 11 4. 11
236 2
31.5
34.5
'114 38
627
19,266 17,598
'11. 382 455
'10,392
. 672
. 934
2,390 42,902 16,600
28.20 36.4 16.5 17.3
'487. 5 19fl. 4 93. H
T lGt). 0
2, t)~j(; 2, 655
739 12,173
43.9 42.9
. 79
.33
618, 31G 407,961 84,429
14,13.5
o27 4.13
6, 449
129 1
34.1
33.6
93 29
544
19,lfifl 17,501
8, 817 441
8,020
. 676
. 936
33,052 18,307
28.75 36.4 16.5 17.3
a. >·ogl 2,863 409
9,696
46.2 45. 1
.82
.33
23,069 13,941
22, 699 ' 27, 020 20, 892 !2, 928 ' 14, 148 9, 776
98 230 98 24
33.3 33. I
32.0 31.8
109 6 140 46 154
41l!i 442
19, 2.\S 19, 2112 17, f>J:l 17, 652
9, 7lf> ' 11. 930 4SD 477
8, 817 • 10. 946
. 67fi . 681
. 9313 . 938
38,203 17, 244
30.36 36.4 16.5 17.3
4,853 2, 539
522 8, 700
44.5 51.8
. 821
. 33 I
2,363 37,081 20,349
31.41 36.4 16. 5 17.3
'481.3 191.0 89.5
T lfiG. 8
4, 46:l 3, 902
()50 12, 191
47.7 54.7
. 82
.33
li02, 201 :Js.o, 947
83, 155
]f,, 023
1,097 4.09
7, 0.56
21,682 ' 25, 547 13, 612 ' 15, 558
9, 718
732
20,707 20,621
7, 2f>3 12,423
935 86
392 2
32.5
31.7
115 240 497
19,273 17,648
9, 970 499
9,118
.685
. 946
44,789 27,671
32.61 36.4 17.0 17.3
4,8\10 2,0.511
338 7, 412
48.4 .55. 9
.82
.33
13,40311 14, 07~ 725
19,2W 19,201 3, 781
14, 19.5 1, 225
79
652 (6) 30.8
31.6
108 22., 558
5 800
17,636 17, 5f>8 2,373
13, 65() 1, 539
68
728 2
30. ()
31.8
5 131 201\ 585
19,:!08 19,326 17,696 17,709
9, 880 ' 1\,039 494 442
9, 051 ' 10, !57
. 685 p .685 '.948 p .948
37,396 33, 7(11
33.04 36.4 18.0
'17. 5
fi, 538 2, 8G9
208 8,627
50. 1 56. 1
.82
.33
44,728 41,325
33.20 v 37. 3 p 18.2 p 17 .. 5
464.0 181.3 79.7
159.8
6, 61)1 5, 383
57! 9, 700
56.3 55.0
p .82 p .33
15,764 14,263 14,E35
663 937 814 4.14 4.32 p 4. 51
20,688 12, 298
18, 515 5 21,0\1 11, 187 '15, 773
1\'oolimports, clean conten(t ____________________ do____ 2.5, 626 31,076 11,006
25,317 11, 230
35,173 13,167
31,218 11,028
29, 31 r: 26, 079 20,569 7, 191
18,837 7,367
25,212 23,295 14,730 20, 565 Apparel class (dutiable), clean contentt-- _____ do____ 10, 508 11,270 7, 801 7, 742 9, 046 6, 573 10, 466
'14, 3SG
1 14,701
29.3
31. u
33.67
• Revised. v Preliminary. 1 Ginnin~s to December 13. 'Ginnings to January 15. 'Total ginnings of 1958 crop. 4 December I estimate of 1959 crop. 5 Data cover a 5-we<Jk period. 6 Less than 500 ball's. ' Data coYer 14 weeks; other periods, 13 weeks.
§ Total ginnings to end of month indicated, except as noted. 1Data for December 1958 and l\Tarch, June, September, and December 1959 coYer 5·week pl'riods and for other month:", 4 \H'C'ks; cotton stoeks and uumbrr of actiYe spind.lr.s an' Jor end
of period covered. ((Includes data not shown separaH'ly. t Scattered revisions for Jan nary !957-July 1958 are available upon request.
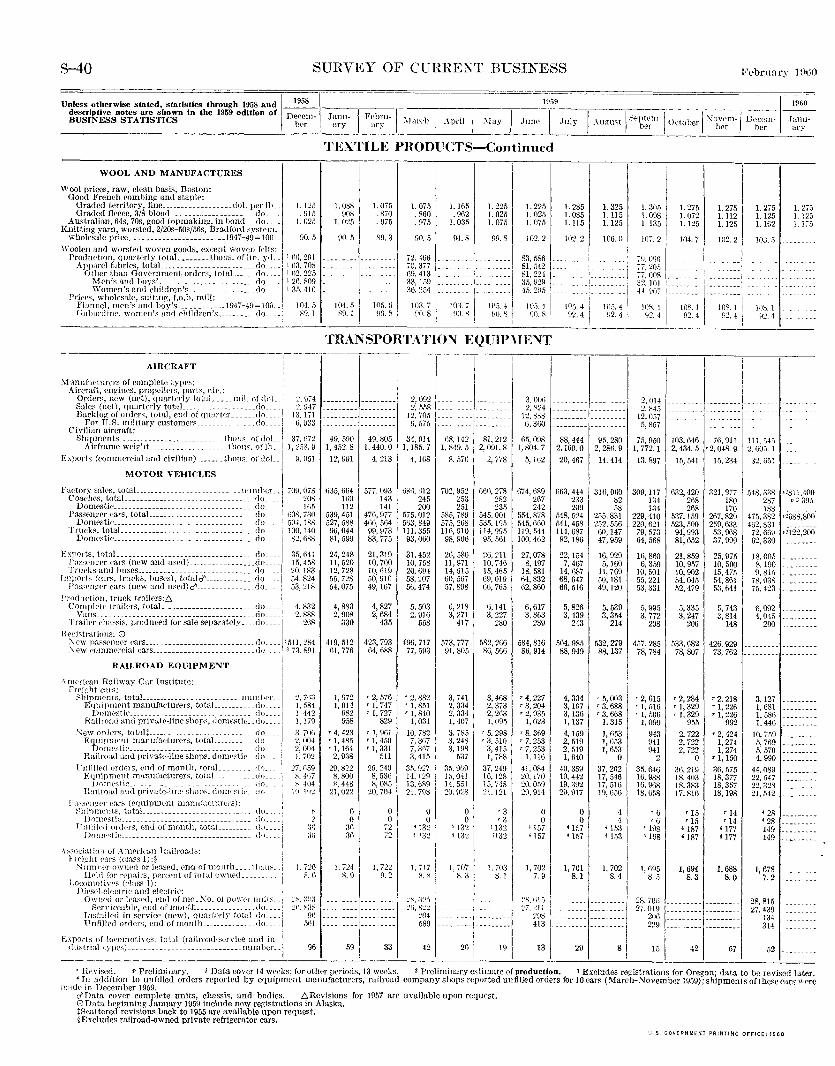
s-40 SURVEY OF Cl~RHE~T BUSINESS
====================~===y============~==========c==================---~---
U~~::ri~~r;:-:;:z,:~::'!:h:~~isi~~h~r;;S~heJr:i!:::~ j D:::~-~ Janu- I Febrn-j I :.ray J June l!lj59
July J.~u~rl't I >"PptPm-1 october I '\ovPm- -~-~:c~~: -~-J:~~ BUSINESS STATISTICS ber . ary ary :ITareh I .\pril her ' her . her ary
WOOL AND MANUFACTURES
\\~ool prices, raw, clean basis, Boston: Good French combing and staple:
Graded territory, fine __________________ dol. per !h __ Graded fleece, 3/8 blood _____________________ do ___ _
Australian, 64s, 70s, good top making, in hond ___ do ___ _ Knitting yarn, worsted, 2/20s-50s/56s, Bradford system,
wholesale price _____ -------------- ___ .. 1947-49= 100. _
I. 115 .n15
I. 0211
90.5
\\' oolen and worsted woven goods, except woven felts: 1
1 Production, quarterly totaL _______ thous. of !in. yd ... 'i\li,2nl
App<\rel fabrics, totaL _______________________ do ____ 1
lri3, 708 Other than Government orders, totaL. ___ do ____
1
lli2, 225 Men's and boys' _________________________ do .... 12ll, 8119 \" ' d •h'ld ' •1 1 1 3o 41<' ) . vornen san ~ .1 rcn 8----:------------- o ____
1
• • . ) I nrcs, wholesale, smtmr£, f.o.b. rmli:
Flannel, me-n's and b0y's ____________ l947-49=100 __ 1 liH .. ~ Oahardinr-. womrn'::.: anct f'hilrlren's __________ do_. __ : r.n. 1
'
TEXTILE PRODllCTS-Continued
1.088 LOiS . nos . k70
I. 02,5 . 975
90. 5 X9. 3
·;o~:sl·::n~-" 1
1
89. I !10. 8 . '
I. 075 1. 165 . 860 . 962 .975 1.035
90. 5 94. s
72,-166 ---------1-7g.37! i'---------1_ll" 413 --- .. ---- '-:13, 1.19 ---------':16. 254 1---- ---!-
Hl3. 7 I JO:l. 7 I no. 8 ! !10. ~ 1
1.225 1.025 1.075
00.8
-- ------
-- ----
;(),) 4 !JO. S
1. 225 1. 285 1. 025 L 085 I. 075 L 115
102. 2 102. 2
83, 5861 .. -------81,542 ---- ---81, 22-l ---- ----35,929 ---- ----4.).2\)5 , ___ ----
105. ~ 1, 105. 4 no. s ~~2. 4
TRANSPOHTATION EQUW.\IENT
1.325 L 115 I. 125
106.0
JOn. 41 !12.4
L 305 1.098 L 135
Hli. 2 :
I
1.275 1.072 I. 125
104. 7
1. 275 I. 112 L 125
lll2. 2
7\J,O\lll ~--------- ---------77, 205 ---------~---------77, 008 ------ --~---------.32. ]OJ ---------~--------H Vil7 1--------- ---------
llJ'<. I I 108.1 ' 108.1 fJ:?. 4 1 92. 4 1 ~~2. 4
I. 275 I. I25 I. 162
103. 5
1PS. 1 ~{.2. -1
1. 21.) l. 12.) 1. 175
-~~_:_ ___ . __ . ---------------------,------,~--.-----,---,------,---,------,~-~--
1
AIRCRAFT
.\! annhwturcrs of complete typeo: Aircraft, e.n12ines, propellers, parts, (\tc.:
Orders, new (net), quarterly totaL ____ mil. of doL.: '-\ \J/4 Sales (net), quarterly totaL _________________ do .. _ 2, 947 Backlog· of orders, total, end of (tuarter ______ do_ 1 1 a. 171
For U.S. military customcrfl _______________ do ____ j ti, U33 Civilian aircraft: j
Ahipments ___________________________ tho11s. of doL_ 37. !i72 Airframe weight_ __________________ tllou:::. of lh__ 1, :2.1:<. 9
Exports (commercial and civilian) ______ t!JOnE. of doL 9. fL51
MOTOR VEHICLES
Fuetory sales, totaL _________________________ numl)L~L-Coachcs, totaL _________________________ .. ____ .do. ___
Domestic ___________________ -------------- ___ do ____ 1
P¥,~~~~~i~~~-~~-t_o_t_a_I~~=== ========== ========~:: ~ ~}~~ ===!
Ex~:::~::~.~;::~~~~~~:~:~~:~~:~~~~::~:~:~::::~:-~:~:~: I Pas.::;Pn~n·r ears (new and usectL~--------------.do ____
1
l Trucks and hnses _______________ -------------_.do ___ _
Imports (f'ar~, trurks, husrs), totalc)'1 ____________ do ____ l J'assengrr cars (new and u:::E>d)d"-------------- do ____
1
!'roduetion, truck trai1rrs:.6. Compkte trailers, totaL _________________ . ___ .do .. _
Vans__ _ ___ ---·-------------------- _______ do __ _ Trailrr chassis, produced for sale separately ____ do ___ -I
709,078 208 lfl.o
nos, 730 594, 188 100,140 82.688
35, ti41 15,458 20, 183 54, 824 53,218
4, 832 2. 888
2118
Hegjstrat ions: 0 i ); C'W passr!lg('t' ('ftl'S ____ -------- ________ -- _____ .do ____ j'; 511, 284 .:"Pw commercial cars __________________________ do 3 73. 8!)1
RAILROAD EQlliPMENT
·\ HH'ri<•a.n Railway Car Institute: 1 rrrip:ht cars: .
1
Shipments, totaL _____________ -----·---- numhf!r_ Equipment manufacturers, totaJ ___________ do ___ _
Donwstic ____________________ . _ ·- do ____ i Railroad and privutr-linc sbop~. domestic:_ .do_-_-:.:~
_"\ew orders, totalt------------------· ------ rio __ EqnipnH•nt manufadurers, totaL __________ <lo __
DonH'Sti<·--------------------- ______ do_ --I Railroad awl private-line shop~, donw::.tit• __ do_._ !
tTnfilh_•d ordrrs, enct of month, totaL_____ 1
Eqnipmeut mannfaP1llrcrs. totaL___ ! Donwstic.------~----- ____________ _
R:1ilroad mtd private-lim' shonf.., donw~.t !(· hti<:~~~ngf'r ear:-. (C'quipnlent manufclctnrl·rs):
~hiptncntr-::, totaL_________________________ du_ Dont(•stic>. _____ --------------------- __ ---- dn. _
T~111lllrd orders~ owl of month, tot;1L ________ (_t•--·· Domf·<::tic _____ ---------------------------- <l{)_.-.
-\:-..So('btinn of Amrrican H;1i1ronds: Freight etrs (clnss 1):§ ~nmh•r ow1wct or lpased, e-nd nf month ___ llHJU:-;..
li('l(l for rr-pn.irs, prrcetlt of total ownPd __ I.ocomoti\7 •-'S (dass I):
Diescl-elr-ctrk and elrctric: Owned or h_•ased, end of mo_Xo. of pu\rn ll11it:::.
Sen·irea.hle, end of month _______________ cio ____ : Installed in service (new), qnartr,rly t.otal do ____ ! l'nfi!led orders, end ofmonth ______________ do .. !
Exports of loeomnti\·es, tot::11 (railroad-service and in-~ dns.trbl typrs) _------ ______________________ number __
2, 7!\3 I, 584
Ui~ 3, 70{) 2. 004 2, 004 1, 702
27, fi59 >--. 4tJ7 ,, cj(lj
1 ~I. 1(!2
] • 7~() ('-i.ti
~-;-.. aws ::•'· ....;;1s
!){)
51-il
96
4H, 5fl0 I, 452.8
12,991
635,664 lll9 112
539,451 .527, 588
Uli, 044 81,599
24,248 11, 520
;~: ~~~ 54,075
4, 883 2, 908
330
419,512 61, 776
1, 972 1, 014
982 958
'4, 423 '1, 485 '1, 164
2, 938
2~: ~66 8, 448
21,022
0 0
36 :)ll
], 724 8. 9
49,805 ], 440.0
4, 213
577, 093 143 HI
476,977 466, 5ll4 99,973 83, 775
21,319 10,700 10,619 50,916 49,167
4,827 2, 684
435
423,793 64, 688
r 2, 576 r 1, 747 'I, 727
829
'1, 961 '1, 450 '1, 331
511
29. 240 8, 53ll 8, 085
~o. 101
0 0
72 7::?
1, 722 9. ~
59 33
') 0\)')
2:5.18 12,705
t_i, 575
34, 014 1, 185.7
4,1GS
til"'tl, H12 245 200
575,012 5G3, 849 Ill, 355 93,060
31,452 10,758 20,694 58, 207 56,474
5, 503 2, 916
558
496, 717 77, -593
'2, 882 'I, 851 '1, 840
I, 031
10, 782 7, 3117 7, 307 3, 415
], 717 8. 8
42
I ___ J_
H8, 142 I, 849.5
8. 570
702, ~~~ 251
5R5, 7S9 575, 268 116,910 98,906
2G, 58G 11,971 I4, (i!5 co, 567 .)7, 898
(i, 218 3, 271
4I7
573, 777 91,805
3, 741 2, 334 2, 334 I, 407
3, 785 3, 248 3,198
537
81,212 2, 091.8
2, 778
GfiO, 278 282 135
545, 001 535, 195 Jl4, 995 95, 5Gl
26, 211 10, 74ll 15,465 69,019 66,765
tl, 141 3, 227
280
582,206 8fi, 566
3,468 2, 373 2, 2f.3 1,095
'5. 298 '3. 510
3, 415 I, 788
37,249 16, 128 15,748 ~ll 121
0 '3 0 r a
4 132 4132 '132 4132
I 1. 707 II 1. 703
H. 3 8.1
26 19
3, OOti :1. S:?4
12, sss G, 360
65,098 1, 804.7
5,162
074, l)89 207 242
554, 878 545, llGO 119,544 100,462
27, 078 8, 497
18,581 fi4,832 62,860
6,6I7 3, Sti3
289
584,816 86, 914
'4,227 '3, 204 '2, 935
1,023
'8, 369 '7,253 T '7 213 i: ll6 41,084 20,170 ~0, 059 20,914
0 0
'157 '157
--------- _________ I
88,444 2,160. 0
20, 467
66:l, 444 2:l3 209
548,524 541, 458 114,687 92,186
22,154 7, 467
I4. 687 68,647 66,516
5, 826 3, 439
243
ii64, 985 88, 949
4,334 3,I97 3, 13ll I, 137
4, I59 2,.519 2, 519 1, ll40
40, 359 I9, 442 I9, 392 20, 9I7
0 0
'157 '157
95,280 2, 286. 9
14. 414
3Hl, OtiO 82 .18
2.55, 8:H 252, 55ll
llO, 147 47,959
I6, 929 5, I60
11,769 ,)0, 181 49,120
5, 539 3,354
2I4
532,279 88, I37
r 5,003 '3, 688 '3, 668
I, 3I5 1, 653 I, 653 I, 653
0
37,2021 I7, 546 I7, 51ll 19,656
I 4 i
, 15~ I '153 1
i
1, 7021 I, 701 I, 702,~ 7. 9 8. 1 8. 4
I :!K, \)!,1 ::?7 . .!.11
298 413
1
:· __ :_ ::::.::::1 ---- ---------1
131 29 8 !
2. 014 :2, 84/)
I2, 0,57 5, 857
---------- ---------1 :::::~::: :::::::::I --------- ---------
75. 950 103, 646 76, 911 I, 772. I 2, 434. 5 '2, 048. 9
13, 897 15, 54 I I5, 234
309, II 71 632, 420 321, 9i7 134 ' 2ll8 180 134 268 170
229, 410 537,] 59 267, 829 220, 621 523, 500 259, 633
79, 573 94, 993 53, 9ll8 64, 568 81, 652 37, 999
16,860 6, 359
10, 50I 55, 22I 53,:331
5, \)9.5 3. 772
298
457, 285 78, 784
'2, 615 r I, 516 'I, 50ll
1,099
943 941 941
2
35, 646 I6, 988 I6, 968 18,658
1, 695 8.-5
28, 701) 2i' 019
206 229
2I, 859 IO, 957 IO, 902 54,045 52,479
.5,335 3, 247
206
533,682 78, 807
'2,284 '1,329 'I, 329
955
2, 722 2, 722 2, 722
0
36,219 18,403 18,383 17,816
'15 'I5
'187 4 187
I, 694 8.3
25,975 10, 500 IS, 475 54, 86I 53, 64I
5, 743 3, 814
I48
426,929 73, 762
•2.218 'I, 22() 'I, 226
992
'2, 424 I, 274 I, 274
'1, I50 36,575 18,377 I8,357 IS, 198
1,688 8.0
42 57
111. 545 2, 60.1. I
32,6.51
548, 338 p2811, 400 287 p' 395 188
475,382 •·'688,800 462,831
72, 6ll9 P2122,200 62,330
18,005 8.I90 9. 81.0
78.038 75,423
6,092 4, 04.0
200
3, I27 I, 681 I, 58fl I. 446
10,759 5, 769 5, 570 4, 990
44, 089 22, 547 22.328 21,542
'28 • 28 149 149
1, 678 7.2
28,815 27.439
134 314
52
' He vised. v Preliminary. J Data cover 14 weeks; for other periods, 13 weeks. 2 Preliminary estimate of production. :'!Excludes registrations for Oregon; data to be revised later. 4 In addition to unfilled orders reported by equipment manufacturers, railroad company shops reported unfilled orders for 10 ears (March-November I959); shipments of these ear:; "·ere
n::~d" iu December 1959, c/'Data cover complete units, chassis, and bodies. L.Revisions for I957 are available upon request. 0Data beginning January 1959 inclnde new registrations in Alaska. !Scattered revisions back to 1955 are available upon request. !Excludes railroad-owned private refrigerator cars.
J S. ~OVERNMENT PRINTING OFFICE: f960
INDEX TO MONTHLY BUSINESS STATISTICS, Pages Sl-S40
SECTIONS
Ge-neral:
Business indicators _______ --- __ ----- ........ .. Commodity prices ____ ------ __ .................... ... Construction and real estate _____________ _ Domestic trade ........ -- .... ---- ...... ----------
Employment and population ____________ _ Finance ___ -----------------------------International transactions of the U.S •••••• Transpol"tation and communications ............ ..
Industry:
1-5 6,7 7,8
9-11
11-15 16-20 21,22 23,24
Chemicals and allied products.----------- 24,25 Electric power and gas ___________________ 25,26 Food and kindred products; tobacco ••••••• 26-30 Leather and products-------------------- 30,31
Lumber and manufactures •••• ----------- 31 Metals and manufactures ________________ 32-34 Petroleum, coal, and products------------ 35,36 Pulp, paper, and printing ________________ 36,37
Rubber and rubber products______________ 37 Stone, clay, and glass product•------------ 38 Textile products .. ------------------···· 38-40 Transportation equipment................ 40
INDIVIDUAL SERIES Advertising ____________ ------------------- 9 Agricultural loans and foreign trade ______ 16,21,22 Aircraft and parts----------------- 3,12,13,14,40 Airline operations.------------------------ 23 Alcohol, denatured and ethyl_______________ 24 Alcoholic beverages.---------------------- 7,9, 26 Aluminum._. _____ ---- .• -.--_- •• ____ ----- 33 AppareL ___________ 2,3,6, 7,9, 10,12,13,14,15,38 Asphalt and tar products ___________________ 35,36 Automobiles ___________ 3, 9, 12,13,14, 15,17, 22,40
Bakery products .••• -----.------- ___ ••• 12,13, 14 Balance of payments.--.------------------ 21
~:i~~~======================:::::::::: 14, ~~ Barrels and drums •. ---------------------- 32 Battery shipment•------------------------ 34 Beef and veaL---------------------------- 28 Beverages _______________ 3,4, 7, 9, 12,13, 14, 15,26 Blast furnaces, steel works, etc ••..•.. ----- 12,13,14 Blowers and fan•-------------------------- 34 Bonds, outstanding, issued, prices, sales,
yield•------------------------------- 17, 19,20 Book publication .• ------------------------ 37 Brass and bronze .... ---------------------- 33 Brick. _______ ------------.--------------- 38 Brokers' loans and balances ________________ 16,19 Building and construction materials _____ 8,9,10,36 Building costs ______ --------- __ -----.----- 8 Business incorporations (new), failures_______ 5 Business sales and iaventories______________ 4 Butter ______ •• ------------------.-------- 27
Cans (metal), closures, crowns-------------- 32 Carloadings _____ • _____ ------------------. 23 Cattle and calves ___ ---------------------- 28 Cement and concrete products _____________ 7, 8,38 Cereal and bakery products ___________ 6,12,13,14 Chain-store sa!es, firms with 4 or more and
11 or more stores.----------------------- 10 Cheese .. __ . _________ -------- _________ ---- 27 Chemicals _____ . ___ 3, 4, 5, 6, 12, 13, 14, 15, 19, 22, 24 Cigarettes and cigars---------------------- 7,30 Civilian employees, FederaL __ .. ___ .... _.--- 12 Clay products .... ___ -------- ___ ..... __ .... _ 7, 38 Coal_ _______________ 3, 4, 6,11, 13,14, 15, 22, 23,35 Cocoa.---------------------------------- 22,28 Coffee __ •.. _. ___ ._ •• ___ .------ _______ ---- 22, 29 Coke ________________ • ____ ------------ ___ 23,35 Communications.---------- 12, 13,14,15, 19, 20,24 Confectionery, sales_----- .... ------------...... 29 Construction:
Contract awards .. ----------------------- 8 Costs _____ ._--------_. __________ .------ 8 Dwelling units.------------------------- 7,8 Employment, hours, earnings, wage rates..... 12,
13 14,15 Highways and roads ____________________ 7,8,15 New construction, dollar value____________ 1, 7
Consumer credit..------------------------ 17 Consumer goods output, index______________ 2,3 Consumer expenditures ...... _ ...... __ ----------.. 1, 9 Consumer price indeX---------------------- 6 Copper •• -------------------------------- 22,33 Com. ________ ----_._._- .• -----. __ ------- 27 Cost of living (see Consumer price index).-__ 6 Cotton, raw and manufactures __________ 6, 7, 22,39 Cottonseed, cl'ke and meal, oiL_____________ 30 Credit, short- and intermediate-term._______ 17 Crops ___________ ._. ______________ . 2, 6, 27, 30,39 Crude oil and natural gas _______ 3, 11, 13,14,15,35 Currency in circulation____________________ 18
Dairy products. _____ --------.----------- 2, 6, 26 Debits, bank.---------------------------- 16 Debt, U.S. Government____________________ 17 Department stores •• ------------------- 10, 11,17 Deposits, bank·---------------------------- 16,18 Disputes, industriaL---------------------- 15 Disttlled spirits __________________ • ______ ._ 27 Dividend payments, rates, and yields •.•••• 2, 19,20 Drug-store sales___________________________ 10 Dwelling units, new ___________ ·---------------- 7, 8
Earnings, weekly and hourlY--------------- 14,15 Eating and drinking places_________________ 10 Eggs and poultry------------------------ 2, 6, 28 Electric power_---- _______________ ----- __ 3, 6, 26 Electrical machinery and equipment_________ 3,
4, 5. 7,12,13, 14,19, 22,34 Employment estimates and indexes---------- 11,12 Employment Service activities ____ .--------- 15 Expenditures, U.S. Government_____________ 17 Explosives ________________________ ------- 25 Exports (see also individual commodities) ____ 21,22 Express operation•------------------------ 23
Failures, industrial and commerciaL...................... 5 Farm income, marketings, and prices ................. I, 2, 6 Farm wages.----------------------------- 15 Fats and oils, greases ____________________ 6,29,30 Federal Government finance________________ 17 Federal Reserve banks, condition of_________ 16 Federal Reserve reporting member banks.___ 16 Fertilizers _______ ------------------------- 6, 25 Fire losses·------------------------------- 8 Fish oils and fish.------------------------- 29 Flaxseed •• _____ -------------------------- 30 Floorin~:, hardwood·----------------------- 31 Flour, wheat.---------------------------- 28 Food products---------------------------- 3,4,
5,6,9,10,12,13,14,15,18,22,27,28,29,30 Foreclosures, real estate........................................... 8 Foreign trade·---------------------------- 21,22 Foundry equipment.---------------------- 34 Freight carloadings------------------------ 23 Freight cars (equipment>------------------- 3,40 Fruits and vegetable•-------------------- 6, 22,27 Fuel oiL--------------------------------- 35,36 Fuels _____ -------- _____ -------------- 3, 6, 35,36 Furnaces •. __________ • __ • _. ________ • _ •• _. _ 34 Furniture. ___ •• __ ------- 3, 4, 6, 9, 10,12, 13, 14,17 Furs _______ --------- ____ ----------------- 22
Gas, output, prices, sales, revenues~------ 3,6,26,27 Gasoline ____________ ------------------- 9, 35,36 Glass and product•------------------------ 38 Generators and motors .. ------------------- 34 Glycerin _____ ._. ___ .--------------------- 24 (}old ____________________________________ 18,21 Clrains and products _______________ 6, 22, 23, 27.28 Grocery stores---------------------------- 10 <lross national product_____________________ 1 Gross private domestic investment__________ 1 Gypsum and products.-------------------- 1,38
Hardware stores .• ------------------------ 9,10 Heating apparatus------------------------ 7,34 Hides and skins ... ------------------------ 7,30 Highways and roads.--------------------- 7,8, 15 Hogs.--------_. __ --.-----.-- _____ ------- 28 Home Loan banks, loans outstanding________ 8 Home mortgage•-------------------------- 8 Hosiery----- ________ -----------------____ 38 Hotels __________________________ 12, 13,14, 15,24 Hours of work per week____________________ 13 Housefumishings _________________________ 6, 9,10 Household appliances and radios ______ 3, 6, 9,10,34
Imports (see also individual commodities) ___ _ Income, personaL .... ____ .. _ .. __ .. ____ .................. .. Income and employment tax receipts _______ _ Industrial production indexes:
21,22 1
17
By industry-------------.-------------·------- 2, 3 By market grouping__________________________ 2, 3
Installment credit.------------------------ 17 Installment salest department stores ................... _ 11 Instruments and related products.----- 3,12, 13,14 Insulating materials_ ..• _.- ••••• _ ••• - ••• _._ 34 Insurance, life.--------------------------- 17,18 Interest and money rates-------------------- 16 Inventories, manufacturers' and trade _____ 4,10,11 Iron ond steel, crude and manufactures ___ .. __ 3,
4,5,7,8,12,14,19,22,32,33
Labor disputes, turnover___________________ 15 Labor force·------------------------------ 11 Lamb and mutton.------------------------ 28 Lard._---------------------_._.--------- 28 Lead ______ .----------------------------_ 33 Leather and products ______ 3, 7, 12, 13, 14,15,30,31 Linseed oiL.----------------------------- 30 Livestock.--------------------------- 2, 6, 23,28 Loans, real estate, agricultural, bank, brokers'
(see also Consumer credit) __________ 8,16,17,19 Locomotives.--- __ ._ ••• _____ ._. ____ •• ____ • 40 Lubricants.--------------------------- ___ 35,36 Lumber and products .• -------------------- 3,
4,5,7,8,9,10,12,13,14,18,31
Machine tool•---------------------------- 34 Machinery_---------- 3, 4, 5, 7, 12, 13, 14, 19,22,34 Mail-order sales, catalog___________________ 10 Manmade fibers and manufactures__________ 7,39 Manufacturers' sales, inventories, orders_____ 4,5 Manufacturing employment, production work ..
ers, payrolls, hours, earnings ____ 11, 12, 13, 14,15 Manufacturing production indexes __ ______ .. _ 2, 3 Margarine________________________________ 29 Meats and meat packing ____ ----- 2, 6,12, 13,14, 28 Medical and personal care__________________ 6 Metals _________ 3,4, 5, 7,11,12,13,14,15,19,32,33 Milk. __ ---- ________ - ________ -_- __ -_-____ 27 Mining and minerals ____ 2,3, 11, 12, 13, 14, 15, 19,20 Monetary statistics ...• _____ .--- ____ ._---__ 18 Money supply ••. ____ ••• ---------_.---.--. 18 Mortgage loans.------------------------ 8, 16,18 Motor carriers ______________ • ______ ------. 23 Motor vehicles ___ 3,4, 5, 7, 9, 10, 12, 13, 14,15,19,40 Motors .. --------- ____ ---- __________ --._--_ 34
National income and product--------------- 1 National parks, visits _____________________ ... 24 National security expenditures______________ 1,17 Newsprint.. ___________________________ ••• 22,37 New York Stock Exchange, selected data ____ 19,20 Nonferrous metals ______ ---------- ___ 7, 19, 22,33 Noninstallment credit_____________________ 17
Oats. ______ --------------------- __ ------- 27 Oil burners·------------------------------ 34 Oils and fats, greases ____________________ 6, 29,30 Orders, new and unfilled, manufacturers'----- 5 Ordnance .. --------------------------- 12,13,14
Paint and paint materials------------------ 6,25 Panama Canal traffic______________________ 23 Paper and products and pulP--------------- 3,
4, 5, 7' 12, 13,14, 15,18, 22,36,37 Parity ratio •• ---------------------------- 6 Passports issued.------------------------- 24 Payrolls, indexes-------------------------- 13 Petroleum and products____________________ 3,
4, 5, 6, 12, 13, 14, 15, 19, 22, 35,36 Pig iron ... ------------------------------- 32 Plant and equipment expenditures__________ 2,19 Plastics and resin material•----------------- 25 Plywood, hardwood.---------------------- 31 Population .• ___ -------------------------- 11 Pork·----------------------------------- 28 Postal savings---------------------------- 16 Poultry and egg•------------------------- 2,6,28 Prices (see also individual commodities)______ 6 Printing and publishing _________ 3,12, 13, 14,15, 37 Profits, corporate·---------------------- 1,18,19 Public utilities _____ 2, 3, 6, 7, 12,13,14,15,19, 20,26 Pullman Company------------------------ 24 Pulp and pulpwood·----------------------- 36 Pumps __________ -------- ____ ------ ____ --- 34 Purchasing power of the dollar______________ 7
Radiators and convectors__________________ 34 Radio and television ____________________ 3,6,9,34 Railroads. ____________ ----- 2, 12, 15, 19, 20, 23,40 Railways (local) and bus lines _____ 12,13,14,15,23 Rayon and acetate________________________ 39 Real estate.------------------------------ 8,16 Receipts, U.S. Government.________________ 17 Recreation _______ .. ___ .... ___ .. _____ ----_ ...... _ 6 Refrigeration appliances, output._---------- 34 Rents (housing>--------------------------- 6,9 Retail trade _______ ----_ 4, 5, 9, 10, 11, 13, 14,15, 17 Rice ... _________________ ------_.--------- 27 Roofing and siding, asphalt_________________ 36 Rubber and products .. 3, 4, 5, 7, 12, 13, 14, 15,22,37 Rye·------------------------------------ 27
Saving, personaL------------------------- 1 Savings deposits. _____ -----------------___ 16 Securities issued •• _------------------ __ --- 19 Services ____ ------.---------------- 1, 9, 12,13, 14 Sheep and lambs.------------------------- 28 Ship and boat building __________________ 12,13,14 Shoes and other footwear ___ ----------- 7, 9, 10,31 Silk, prices, imports, production_____________ 7,39 Silver _______________ --------------------- 18 Soybeans and soybean oiL_________________ 30 Spindle activity, cotton____________________ 39 Steel ingots and steel manufactures ________ 3,32,33 Steel scrap __________________ ------------- 32 Stocks, department stores._________________ 11 Stock prices, earnings, sales, etc_____________ 20 Stone, clay, and glass product•-------------- 3,
4,5,12,13,14,19,38 Stoves and ranges-------------------------- 34 Sugar.----------------------------------- 22,29 Sulfur ... -------------------------------- 25 Sulfuric acid _______ --------_-------------_ 24 Superphosphate ••• ------------_--------___ 25
Tea imports------------------------------ 29 Telephone, telegraph, cable, and radio-tele-
graph carriers _______________ 12,13,14,15, 20,24 Television and radio ____________________ 3,6,9,34 Textiles and product•--··------------------- 3,
4, 5, 7 ,12, 13, 14, 15,18, 22,38, 39,40 Tin _________________________ ---------- ___ 22,33 Tires and inner tubes __________________ 7,9, 10,37 Tobacco and manufactures.---------------- 3,
4, 5, 6, 1, 8,12, 13, 14, 15, 22,30 Tractors.----------- _____________________ 22,34 Trade _____ -------- 5, 9, 10, 11, 12, 13, 14,15, 17, 20 Transit lines, locaL .. ---------------------- 23 Transportation and transportation equip-
ment ___ 3,4, 5, 6, 9,12, 13, 14, 15,19, 22, 23, 24,40 TraveL ••• _-----------_-----------_______ 24 Truck trailers •••• ------------------------- 40 Trucks·---·------------------------- ____ • 34,40
Unemployment and compensation ___________ 11,15 U.S. Government bonds ______________ 16, 17, 19,20 U.S. <lovernment fmance------------------- 17 Utilities ____ ------- 2, 3, 6, 7, 12, 13, 14, 15, 19, 20, 26
Vacuum cleaners.------------------------- 34 Variety stores. ____ -- __ ---------------____ 10 Vegetable oils __________ ------------------_ 29,30 Vegetables and fruits ___ ----------------- 6, 22, 27 Vessels cleared in foreign trade______________ 23 Veterans' benefit•------------------------- 15,17
Wages and salarie•----------------- 1, 2, 13, 14,15 Washers ____ ---- _______ -----------------. 34 Water heaters ... ------------------------- 34 Wheat and wheat flour. __ ----------------- 27, 28 Wholesale price indexe•-------------------- 6, 7 Wholesale trade ______________ 4, 5, 11, 12, 13,14,15 Wood pulp.------------------------------ 36 Wool and wool manufactures ________ 6, 7, 22,39,40
Zinc.------------------------------- ---- 33
UNITED STATES GOVERNMENT PRINTING OFFICE
DIVISION OF PUBLIC DOCUMENTS
WASHINGTON 251 D.C.
OFFICIAL BUSINESS
First-Class Mail
PENALTY FOR PRIVATE USE TO AVOID PAYMENT OF POSTAGE. $300
!GPO I
~ The Office of Business Economics Calls Attention to
U.S. lntome and Output
c.A RECENTLY completed compilation of new and
revised income and product data for the period beginning
with 1946, for use in conjunction with the 1954 National
Income supplement.
The text includes an analysis of the American economy
as viewed through the national income accounts, a dis~
cussion of the development of the accounts over the past
quarter century and of the needed directions of future
research, and a review and evaluation of the statistical
basis of the estimates.
<{PRICE, $1.50 }----------
Orders may be placed with the Superintendent of
Documents, U.S. Government Printing Office, Wash
ington 25, D.C., or with any Field Office of the
U.S. DEPARTMENT OF COMlUEBCE