Spatial and seasonal variation in niche partitioning between blue manakin (Chiroxiphia caudata) and...
12
PLEASE SCROLL DOWN FOR ARTICLE This article was downloaded by: [Hasui, Érica] On: 7 December 2009 Access details: Access Details: [subscription number 917471261] Publisher Taylor & Francis Informa Ltd Registered in England and Wales Registered Number: 1072954 Registered office: Mortimer House, 37- 41 Mortimer Street, London W1T 3JH, UK Studies on Neotropical Fauna and Environment Publication details, including instructions for authors and subscription information: http://www.informaworld.com/smpp/title~content=t713817190 Spatial and seasonal variation in niche partitioning between blue manakin (Chiroxiphia caudata) and greenish schiffornis (Schiffornis virescens) in southeastern Brazil Érica Hasui a ; Verônica Souza da Mota Gomes a ; Mara Cíntia Kiefer a ; Jorge Tamashiro b ; Wesley Rodrigues Silva a a Departamento de Zoologia, Universidade Estadual de Campinas, Campinas, SP, Brazil b Departamento de Botânica, Universidade Estadual de Campinas, Campinas, SP, Brazil First published on: 20 November 2009 To cite this Article Hasui, Érica, Gomes, Verônica Souza da Mota, Kiefer, Mara Cíntia, Tamashiro, Jorge and Silva, Wesley Rodrigues(2009) 'Spatial and seasonal variation in niche partitioning between blue manakin (Chiroxiphia caudata) and greenish schiffornis (Schiffornis virescens) in southeastern Brazil', Studies on Neotropical Fauna and Environment, 44: 3, 149 — 159, First published on: 20 November 2009 (iFirst) To link to this Article: DOI: 10.1080/01650520903381729 URL: http://dx.doi.org/10.1080/01650520903381729 Full terms and conditions of use: http://www.informaworld.com/terms-and-conditions-of-access.pdf This article may be used for research, teaching and private study purposes. Any substantial or systematic reproduction, re-distribution, re-selling, loan or sub-licensing, systematic supply or distribution in any form to anyone is expressly forbidden. The publisher does not give any warranty express or implied or make any representation that the contents will be complete or accurate or up to date. The accuracy of any instructions, formulae and drug doses should be independently verified with primary sources. The publisher shall not be liable for any loss, actions, claims, proceedings, demand or costs or damages whatsoever or howsoever caused arising directly or indirectly in connection with or arising out of the use of this material.
-
Upload
independent -
Category
Documents
-
view
2 -
download
0
Transcript of Spatial and seasonal variation in niche partitioning between blue manakin (Chiroxiphia caudata) and...

PLEASE SCROLL DOWN FOR ARTICLE
This article was downloaded by: [Hasui, Érica]On: 7 December 2009Access details: Access Details: [subscription number 917471261]Publisher Taylor & FrancisInforma Ltd Registered in England and Wales Registered Number: 1072954 Registered office: Mortimer House, 37-41 Mortimer Street, London W1T 3JH, UK
Studies on Neotropical Fauna and EnvironmentPublication details, including instructions for authors and subscription information:http://www.informaworld.com/smpp/title~content=t713817190
Spatial and seasonal variation in niche partitioning between blue manakin(Chiroxiphia caudata) and greenish schiffornis (Schiffornis virescens) insoutheastern BrazilÉrica Hasui a; Verônica Souza da Mota Gomes a; Mara Cíntia Kiefer a; Jorge Tamashiro b; WesleyRodrigues Silva a
a Departamento de Zoologia, Universidade Estadual de Campinas, Campinas, SP, Brazil b
Departamento de Botânica, Universidade Estadual de Campinas, Campinas, SP, Brazil
First published on: 20 November 2009
To cite this Article Hasui, Érica, Gomes, Verônica Souza da Mota, Kiefer, Mara Cíntia, Tamashiro, Jorge and Silva, WesleyRodrigues(2009) 'Spatial and seasonal variation in niche partitioning between blue manakin (Chiroxiphia caudata) andgreenish schiffornis (Schiffornis virescens) in southeastern Brazil', Studies on Neotropical Fauna and Environment, 44: 3,149 — 159, First published on: 20 November 2009 (iFirst)To link to this Article: DOI: 10.1080/01650520903381729URL: http://dx.doi.org/10.1080/01650520903381729
Full terms and conditions of use: http://www.informaworld.com/terms-and-conditions-of-access.pdf
This article may be used for research, teaching and private study purposes. Any substantial orsystematic reproduction, re-distribution, re-selling, loan or sub-licensing, systematic supply ordistribution in any form to anyone is expressly forbidden.
The publisher does not give any warranty express or implied or make any representation that the contentswill be complete or accurate or up to date. The accuracy of any instructions, formulae and drug dosesshould be independently verified with primary sources. The publisher shall not be liable for any loss,actions, claims, proceedings, demand or costs or damages whatsoever or howsoever caused arising directlyor indirectly in connection with or arising out of the use of this material.
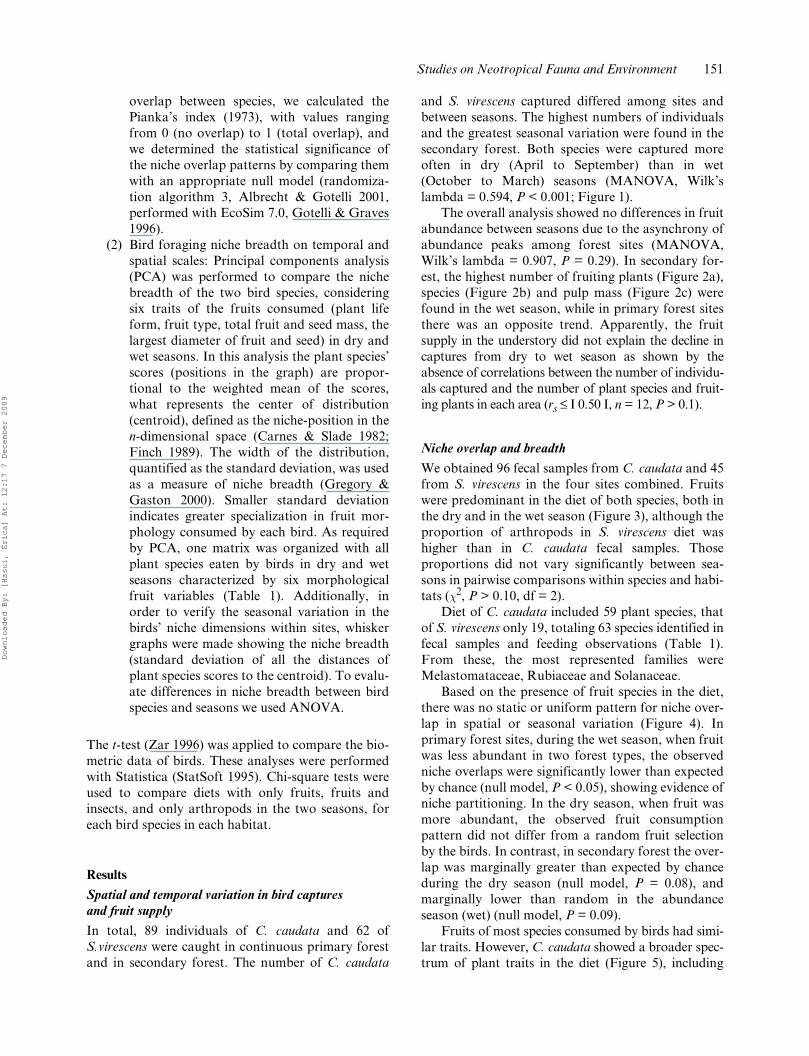
Studies on Neotropical Fauna and EnvironmentVol. 44, No. 3, December 2009, 149–159
ISSN 0165-0521 print/ISSN 1744-5140 online© 2009 Taylor & FrancisDOI: 10.1080/01650520903381729http://www.informaworld.com
NNFEORIGINAL ARTICLE
Spatial and seasonal variation in niche partitioning between blue manakin (Chiroxiphia caudata) and greenish schiffornis (Schiffornis virescens) in southeastern BrazilStudies on Neotropical Fauna and EnvironmentÉrica Hasuia*, Verônica Souza da Mota Gomesa, Mara Cíntia Kiefera†, Jorge Tamashirob & Wesley Rodrigues Silvaa
aDepartamento de Zoologia, Universidade Estadual de Campinas, Campinas, SP, Brazil; bDepartamento de Botânica, UniversidadeEstadual de Campinas, Campinas, SP, Brazil
(Received 28 January 2009; accepted 2 October 2009)
The diet of Chiroxiphia caudata and Schiffornis virescens were studied over three years in four forest sites in thesoutheastern Atlantic Forest of Brazil. Theory suggests that coexistence of similar species is possible byresource-use differences. To test this, patterns of niche overlap and niche breadth in diet were measured indifferent seasons and forest sites, based on fruit morphological traits and plant life forms. The results suggestseasonal and spatial variation in resource partitioning. During periods of high fruit availability, there was noevidence of fruit trait selection. In contrast, during periods of fruit scarcity in primary forests, there was evidenceof niche partitioning, where C. caudata foraged for larger fruits in canopy and S. virescens searched for under-story plants. The niche overlap was higher in secondary forest during periods of scarcity, when both species usedsmall understory fruits.
Foi estudada a dieta de Chiroxiphia caudata e Schiffornis virescens durante três anos, em quatro tipos de fisiono-mias florestais no sudeste da Mata Atlântica, Brasil. A teoria sugere que a coexistência de espécies semelhantes épossível pelas diferenças no uso dos recursos. Assim, nós mensuramos a amplitude e sobreposição de nichoconsiderando a morfologia dos frutos consumidos e a forma de vida das espécies de plantas utilizadas em quatrotipos florestais e em diferentes estações. Os resultados sugerem mudanças sazonais e espaciais na partilha derecursos. Durante períodos de alta disponibilidade de frutos, não há evidências de partilha de recursos. Já emperíodos de escassez de frutos nas florestas primárias, C. caudata consumiu frutos grandes presentes no dosselenquanto S. virescens utilizou os frutos pequenos do sub-bosque. Na floresta secundária, o período de escassez foimarcado por sobreposição intensa de nicho onde ambas as espécies consumiram frutos pequenos de sub-bosque.
Keywords: Atlantic Forest; bird; Brazil; food resource; fruit; insect
Introduction
Coexistence of similar species is frequently deter-mined by niche differentiation through resource par-titioning or differential use of the same resources inspace or time (Begon et al. 1996). In bird communi-ties, these differences in resource utilization can begenerated by changes in food availability, foraging,and nest site selection, and can be increased throughmorphological and behavioral traits (Moermond &Denslow 1985; Schoener 1965; Wiens 1989). Patternsof resource utilization are not static, but change withseasonal and spatial variation in resource abundanceand availability (Wiens 1989).
Chiroxiphia caudata (Shaw & Nodder, 1793; seesupplementary material available online S1) andSchiffornis virescens (Lafresnave, 1838) are two com-mon small passerines found in the understory of thesouthern coastal Atlantic Forest in Brazil, both
occurring in lowland and montane evergreen forest,as well as in secondary forest (Stotz et al. 1996). Theymay be considered facultative frugivores, since bothcan include arthropods in their diet (Del Hoyo et al.2004). In fact, few bird species could be consideredexclusively frugivorous (Izhaki & Safriel 1989;Moermond & Denslow 1985).
This paper focuses on the comparison of these twosimilar species’ diets considering especially the sea-sonal variation in food diversity and abundance. Dueto a high overlap in habitat and similar foragingbehaviors (Stotz et al. 1996), the food dimension isprobably the most important niche axis (Pérez &Bulla 2000). Thus, diet differentiation should occurbetween these bird species in order to reduce theinterspecific interference (McMartin et al. 2002). Inthis study, during two seasons we examined: (1)patterns of resource utilization by the two species
*Corresponding author. Present address: Departamento de Ciências Biológicas, Universidade Federal de Alfenas, Alfenas,MG, Brazil. Email: [email protected]†Present address: Departamento de Ecologia, Universidade do Estado do Rio de Janeiro, Rio de Janeiro, Brazil.
Downloaded By: [Hasui, Érica] At: 12:17 7 December 2009
150 É. Hasui et al.
considering morphological fruit traits and plant lifeforms; and (2) niche breadth and taxonomic fruitoverlap in diet.
Materials and methods
Study sites
The study was conducted in four Atlantic Forest sitesin the Parque Estadual Intervales (PEI) in southernSão Paulo State, southeastern Brazil. The four studysites were selected considering vegetation types andtopographic zones to cover the existing environmen-tal variation in Atlantic Forest, including continuousprimary forest at three elevations (hilltop: 24°16′42″S,48°24′28″W, 1000m; middle slope: 24°18′17″S,48°21′53″W, 900m; valley bottom: 24°18′59″S,48°25′00″W, 700m) and a tract of secondary forestwith 4 ha and approximately 50 years of naturalregeneration (24°16′09″S, 48°24′56″W, 800 m). Thefour sites share roughly the same climatic cycles: awet–hot season extending from October to Marchand a dry–cold one from April to September. In eachprimary forest site five transects were established toset up a line with 10 mist nets along each transect(36 mm mesh, 12 × 2.5 m) and three plots (25 × 10 m)per transect, where we estimated bird abundance,bird feeding habits and fruit availability. The nearestneighbor distances were at least 80 m betweentransects of the same site and from 2 to 20 kmbetween sites.
Bird and fruit sampling
Mist-nets were open for 6 h (from dawn to early after-noon) one day each month for one year (3600 net-hours total in each primary forest site). Due to thesmall area available for nets in the secondary forestwe used only six nets per line in that habitat, totaling2160 net-hours sampling, and only two plots pertransect. Middle Slope (MS) and Secondary Forest(SF) sites were sampled from April 1999 to March2000, Valley Bottom (VB) from April 2000 to March2001 and Hilltop (HT) from April 2001 to March2002. Bird capture was used as an estimate of birdactivity in forest understory. For each bird capturedwe recorded the body mass and bill length, width anddepth.
All the plots were monitored monthly (during oneyear) at the same time that birds were captured. Plantspecies with zoochorous fleshy fruits (sensu Van DerPijl 1982) were counted and fruit were collected forcalculation of the pulp mass. The fruit production ofeach plant species was calculated by multiplying thefruit number by mean individual pulp weight. The
total fruit production in each site per month wasobtained by adding the production of all plant speciessampled. The total fruit production was measuredonly for the understory plants (up to 10 m high), andthose with small seed diameter (<5.0 mm) due theirimportance as potential food resources for manakins,as they are gulpers and may be limited by fruit andseed diameters (Levey 1986; Moermond & Denslow1985). In the HT, however, the maximum height ofthe canopy was considerably lower than the otherstudy sites and did not allow a clear distinctionbetween the understory and the mid-canopy, espe-cially near the top of the terrain. Thus, in that area,the heights of plants sampled were reduced to lessthan 5 m. Samples of ripe fruits were collected fromdifferent individuals for each plant species. Wecharacterized them by type (berry, drupe, synconium,capsule, polychene and legume), weighed total fruitmass, seed mass and pulp mass, and measured thelargest diameters of fruit and seeds. In addition, wemeasured the total height of fruiting plants and char-acterized them according to the life form (shrub, tree,liana, herb and palm).
Two techniques were combined to collect data onthe diet: the analysis of bird droppings through mist-net captures and the direct observation of foragingbehavior. The latter was based on feeding bouts weobserved while walking along trails (Galetti et al.2000). In the fecal analysis, the proportion of samplescontaining fruits, arthropods, or both food types wasrecorded. Plant identification was made by compari-son with herbarium specimens in the Herbário daUniversidade Estadual de Campinas (UEC).
Statistical analysis
The fruit availability data (monthly number of fruit-ing plant species, biomass of pulp and fruiting plants/100 m2) was compared among sites and seasons usingmultivariate analysis of variance (MANOVA), fol-lowed by Tukey test to examine whether significantdifferences occurred in pairwise comparisons. Thesame test was also used for the number of C. caudataand S. virescens captured/100 net-hours per month todetermine if there were significant differences in thenumber of birds captured among sites and seasonsusing the monthly data as replicates. Additionally,Spearman Rank Correlation was applied to evaluatethe relationship between fruit availability and thenumber of birds captured using monthly samples.
The food data were used to examine distinct pat-terns of niche overlap:
(1) Fruit species niche overlap on temporal andspatial scales: To quantify patterns of niche
Downloaded By: [Hasui, Érica] At: 12:17 7 December 2009
Studies on Neotropical Fauna and Environment 151
overlap between species, we calculated thePianka’s index (1973), with values rangingfrom 0 (no overlap) to 1 (total overlap), andwe determined the statistical significance ofthe niche overlap patterns by comparing themwith an appropriate null model (randomiza-tion algorithm 3, Albrecht & Gotelli 2001,performed with EcoSim 7.0, Gotelli & Graves1996).
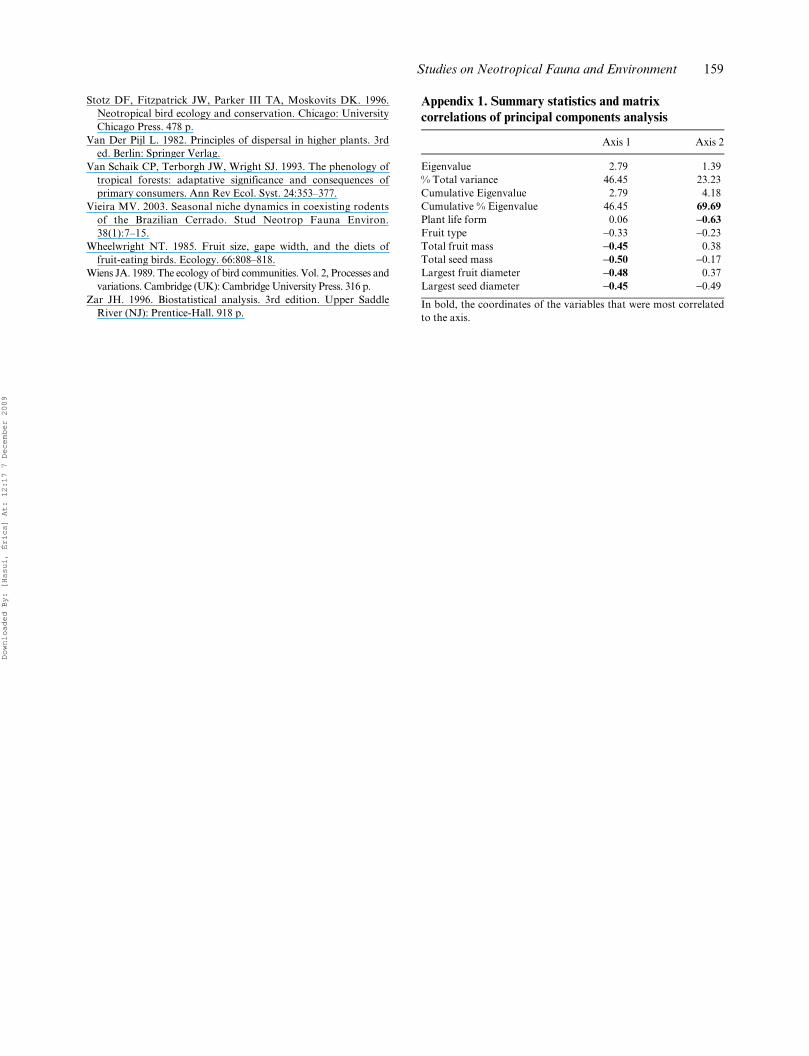
(2) Bird foraging niche breadth on temporal andspatial scales: Principal components analysis(PCA) was performed to compare the nichebreadth of the two bird species, consideringsix traits of the fruits consumed (plant lifeform, fruit type, total fruit and seed mass, thelargest diameter of fruit and seed) in dry andwet seasons. In this analysis the plant species’scores (positions in the graph) are propor-tional to the weighted mean of the scores,what represents the center of distribution(centroid), defined as the niche-position in then-dimensional space (Carnes & Slade 1982;Finch 1989). The width of the distribution,quantified as the standard deviation, was usedas a measure of niche breadth (Gregory &Gaston 2000). Smaller standard deviationindicates greater specialization in fruit mor-phology consumed by each bird. As requiredby PCA, one matrix was organized with allplant species eaten by birds in dry and wetseasons characterized by six morphologicalfruit variables (Table 1). Additionally, inorder to verify the seasonal variation in thebirds’ niche dimensions within sites, whiskergraphs were made showing the niche breadth(standard deviation of all the distances ofplant species scores to the centroid). To evalu-ate differences in niche breadth between birdspecies and seasons we used ANOVA.
The t-test (Zar 1996) was applied to compare the bio-metric data of birds. These analyses were performedwith Statistica (StatSoft 1995). Chi-square tests wereused to compare diets with only fruits, fruits andinsects, and only arthropods in the two seasons, foreach bird species in each habitat.
Results
Spatial and temporal variation in bird captures and fruit supply
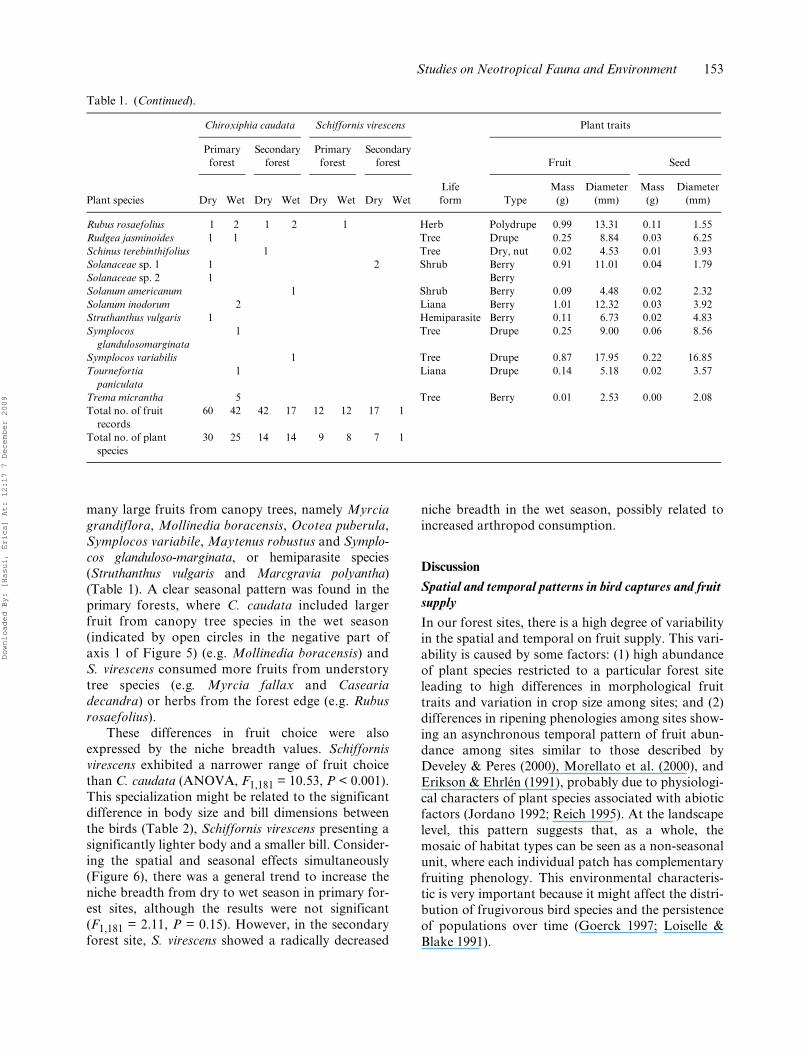
In total, 89 individuals of C. caudata and 62 ofS.virescens were caught in continuous primary forestand in secondary forest. The number of C. caudata
and S. virescens captured differed among sites andbetween seasons. The highest numbers of individualsand the greatest seasonal variation were found in thesecondary forest. Both species were captured moreoften in dry (April to September) than in wet(October to March) seasons (MANOVA, Wilk’slambda = 0.594, P < 0.001; Figure 1).
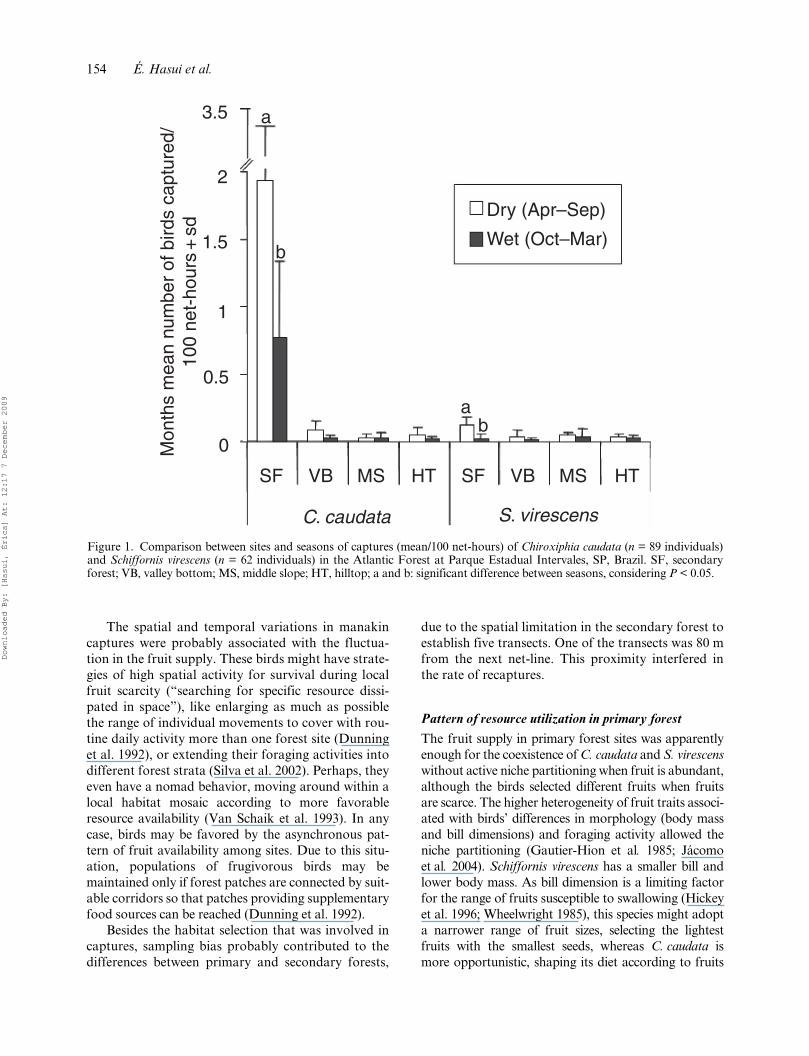
The overall analysis showed no differences in fruitabundance between seasons due to the asynchrony ofabundance peaks among forest sites (MANOVA,Wilk’s lambda = 0.907, P = 0.29). In secondary for-est, the highest number of fruiting plants (Figure 2a),species (Figure 2b) and pulp mass (Figure 2c) werefound in the wet season, while in primary forest sitesthere was an opposite trend. Apparently, the fruitsupply in the understory did not explain the decline incaptures from dry to wet season as shown by theabsence of correlations between the number of individu-als captured and the number of plant species and fruit-ing plants in each area (rs ≤ I 0.50 I, n = 12, P > 0.1).
Niche overlap and breadth
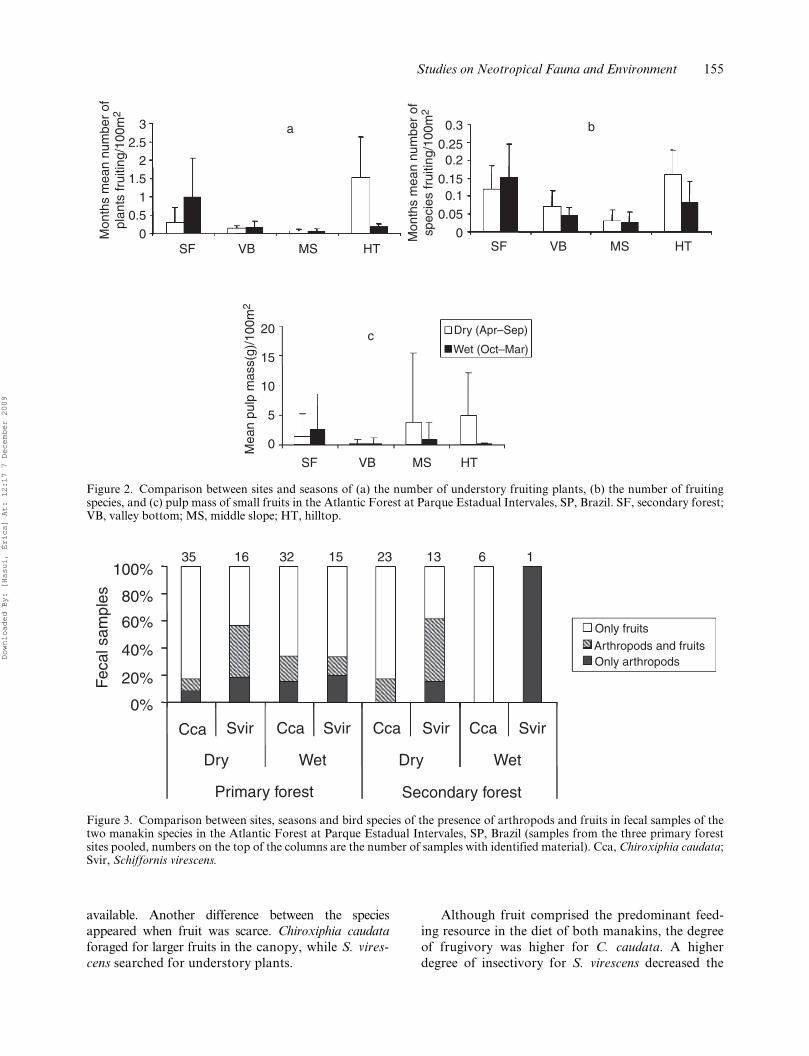
We obtained 96 fecal samples from C. caudata and 45from S. virescens in the four sites combined. Fruitswere predominant in the diet of both species, both inthe dry and in the wet season (Figure 3), although theproportion of arthropods in S. virescens diet washigher than in C. caudata fecal samples. Thoseproportions did not vary significantly between sea-sons in pairwise comparisons within species and habi-tats (c2, P > 0.10, df = 2).
Diet of C. caudata included 59 plant species, thatof S. virescens only 19, totaling 63 species identified infecal samples and feeding observations (Table 1).From these, the most represented families wereMelastomataceae, Rubiaceae and Solanaceae.
Based on the presence of fruit species in the diet,there was no static or uniform pattern for niche over-lap in spatial or seasonal variation (Figure 4). Inprimary forest sites, during the wet season, when fruitwas less abundant in two forest types, the observedniche overlaps were significantly lower than expectedby chance (null model, P < 0.05), showing evidence ofniche partitioning. In the dry season, when fruit wasmore abundant, the observed fruit consumptionpattern did not differ from a random fruit selectionby the birds. In contrast, in secondary forest the over-lap was marginally greater than expected by chanceduring the dry season (null model, P = 0.08), andmarginally lower than random in the abundanceseason (wet) (null model, P = 0.09).
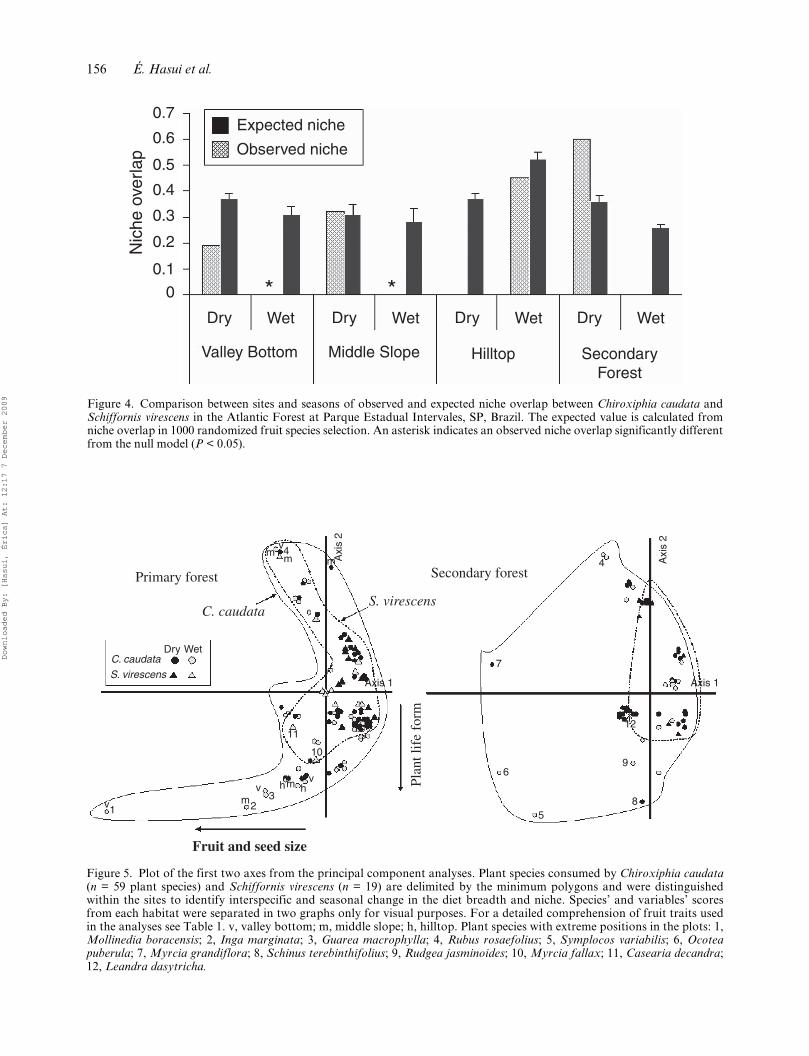
Fruits of most species consumed by birds had simi-lar traits. However, C. caudata showed a broader spec-trum of plant traits in the diet (Figure 5), including
Downloaded By: [Hasui, Érica] At: 12:17 7 December 2009
152 É. Hasui et al.
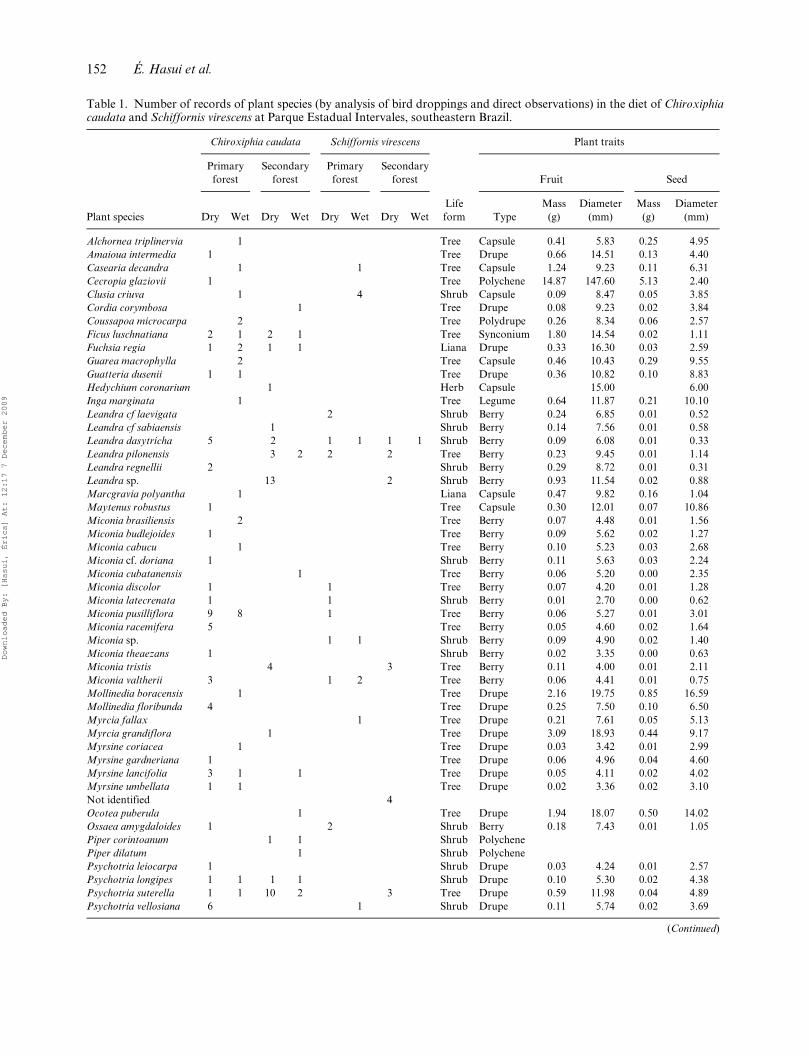
Table 1. Number of records of plant species (by analysis of bird droppings and direct observations) in the diet of Chiroxiphiacaudata and Schiffornis virescens at Parque Estadual Intervales, southeastern Brazil.
Plant species
Chiroxiphia caudata Schiffornis virescens Plant traits
Primary forest
Secondary forest
Primary forest
Secondary forest
Life form
Fruit Seed
Dry Wet Dry Wet Dry Wet Dry Wet TypeMass
(g)Diameter
(mm)Mass
(g)Diameter
(mm)
Alchornea triplinervia 1 Tree Capsule 0.41 5.83 0.25 4.95Amaioua intermedia 1 Tree Drupe 0.66 14.51 0.13 4.40Casearia decandra 1 1 Tree Capsule 1.24 9.23 0.11 6.31Cecropia glaziovii 1 Tree Polychene 14.87 147.60 5.13 2.40Clusia criuva 1 4 Shrub Capsule 0.09 8.47 0.05 3.85Cordia corymbosa 1 Tree Drupe 0.08 9.23 0.02 3.84Coussapoa microcarpa 2 Tree Polydrupe 0.26 8.34 0.06 2.57Ficus luschnatiana 2 1 2 1 Tree Synconium 1.80 14.54 0.02 1.11Fuchsia regia 1 2 1 1 Liana Drupe 0.33 16.30 0.03 2.59Guarea macrophylla 2 Tree Capsule 0.46 10.43 0.29 9.55Guatteria dusenii 1 1 Tree Drupe 0.36 10.82 0.10 8.83Hedychium coronarium 1 Herb Capsule 15.00 6.00Inga marginata 1 Tree Legume 0.64 11.87 0.21 10.10Leandra cf laevigata 2 Shrub Berry 0.24 6.85 0.01 0.52Leandra cf sabiaensis 1 Shrub Berry 0.14 7.56 0.01 0.58Leandra dasytricha 5 2 1 1 1 1 Shrub Berry 0.09 6.08 0.01 0.33Leandra pilonensis 3 2 2 2 Tree Berry 0.23 9.45 0.01 1.14Leandra regnellii 2 Shrub Berry 0.29 8.72 0.01 0.31Leandra sp. 13 2 Shrub Berry 0.93 11.54 0.02 0.88Marcgravia polyantha 1 Liana Capsule 0.47 9.82 0.16 1.04Maytenus robustus 1 Tree Capsule 0.30 12.01 0.07 10.86Miconia brasiliensis 2 Tree Berry 0.07 4.48 0.01 1.56Miconia budlejoides 1 Tree Berry 0.09 5.62 0.02 1.27Miconia cabucu 1 Tree Berry 0.10 5.23 0.03 2.68Miconia cf. doriana 1 Shrub Berry 0.11 5.63 0.03 2.24Miconia cubatanensis 1 Tree Berry 0.06 5.20 0.00 2.35Miconia discolor 1 1 Tree Berry 0.07 4.20 0.01 1.28Miconia latecrenata 1 1 Shrub Berry 0.01 2.70 0.00 0.62Miconia pusilliflora 9 8 1 Tree Berry 0.06 5.27 0.01 3.01Miconia racemifera 5 Tree Berry 0.05 4.60 0.02 1.64Miconia sp. 1 1 Shrub Berry 0.09 4.90 0.02 1.40Miconia theaezans 1 Shrub Berry 0.02 3.35 0.00 0.63Miconia tristis 4 3 Tree Berry 0.11 4.00 0.01 2.11Miconia valtherii 3 1 2 Tree Berry 0.06 4.41 0.01 0.75Mollinedia boracensis 1 Tree Drupe 2.16 19.75 0.85 16.59Mollinedia floribunda 4 Tree Drupe 0.25 7.50 0.10 6.50Myrcia fallax 1 Tree Drupe 0.21 7.61 0.05 5.13Myrcia grandiflora 1 Tree Drupe 3.09 18.93 0.44 9.17Myrsine coriacea 1 Tree Drupe 0.03 3.42 0.01 2.99Myrsine gardneriana 1 Tree Drupe 0.06 4.96 0.04 4.60Myrsine lancifolia 3 1 1 Tree Drupe 0.05 4.11 0.02 4.02Myrsine umbellata 1 1 Tree Drupe 0.02 3.36 0.02 3.10Not identified 4Ocotea puberula 1 Tree Drupe 1.94 18.07 0.50 14.02Ossaea amygdaloides 1 2 Shrub Berry 0.18 7.43 0.01 1.05Piper corintoanum 1 1 Shrub PolychenePiper dilatum 1 Shrub PolychenePsychotria leiocarpa 1 Shrub Drupe 0.03 4.24 0.01 2.57Psychotria longipes 1 1 1 1 Shrub Drupe 0.10 5.30 0.02 4.38Psychotria suterella 1 1 10 2 3 Tree Drupe 0.59 11.98 0.04 4.89Psychotria vellosiana 6 1 Shrub Drupe 0.11 5.74 0.02 3.69
(Continued)
Downloaded By: [Hasui, Érica] At: 12:17 7 December 2009
Studies on Neotropical Fauna and Environment 153
many large fruits from canopy trees, namely Myrciagrandiflora, Mollinedia boracensis, Ocotea puberula,Symplocos variabile, Maytenus robustus and Symplo-cos glanduloso-marginata, or hemiparasite species(Struthanthus vulgaris and Marcgravia polyantha)(Table 1). A clear seasonal pattern was found in theprimary forests, where C. caudata included largerfruit from canopy tree species in the wet season(indicated by open circles in the negative part ofaxis 1 of Figure 5) (e.g. Mollinedia boracensis) andS. virescens consumed more fruits from understorytree species (e.g. Myrcia fallax and Caseariadecandra) or herbs from the forest edge (e.g. Rubusrosaefolius).
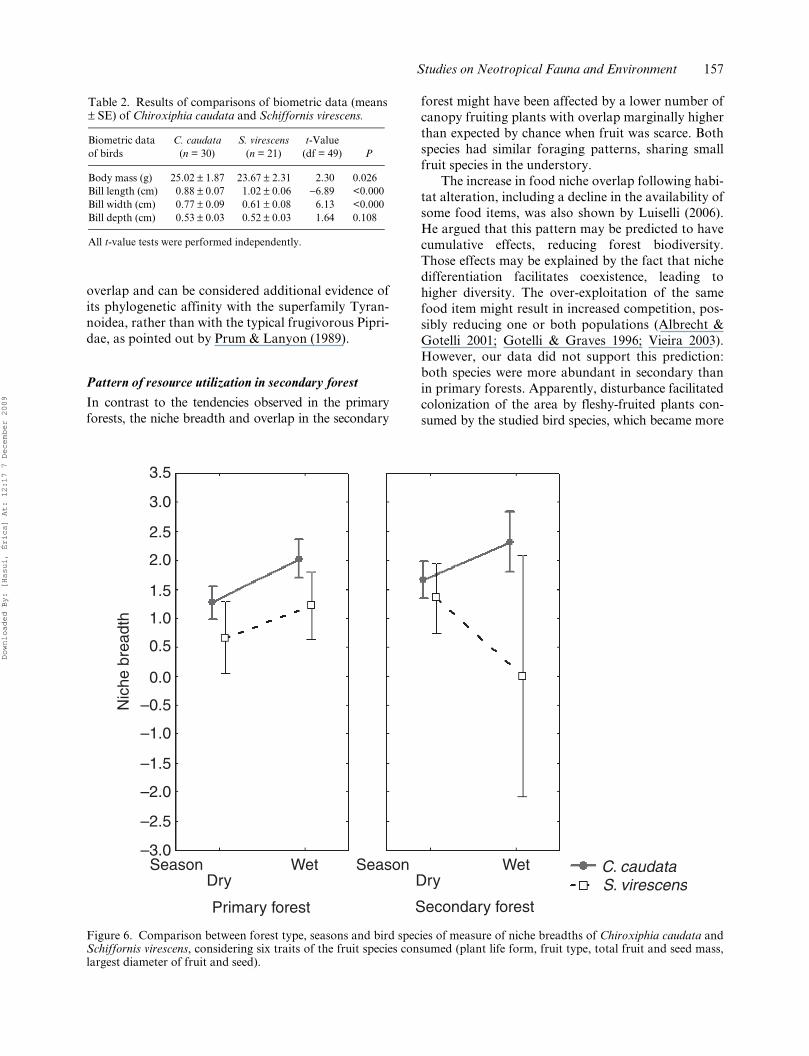
These differences in fruit choice were alsoexpressed by the niche breadth values. Schiffornisvirescens exhibited a narrower range of fruit choicethan C. caudata (ANOVA, F1,181 = 10.53, P < 0.001).This specialization might be related to the significantdifference in body size and bill dimensions betweenthe birds (Table 2), Schiffornis virescens presenting asignificantly lighter body and a smaller bill. Consider-ing the spatial and seasonal effects simultaneously(Figure 6), there was a general trend to increase theniche breadth from dry to wet season in primary for-est sites, although the results were not significant(F1,181 = 2.11, P = 0.15). However, in the secondaryforest site, S. virescens showed a radically decreased
niche breadth in the wet season, possibly related toincreased arthropod consumption.
Discussion
Spatial and temporal patterns in bird captures and fruit supply
In our forest sites, there is a high degree of variabilityin the spatial and temporal on fruit supply. This vari-ability is caused by some factors: (1) high abundanceof plant species restricted to a particular forest siteleading to high differences in morphological fruittraits and variation in crop size among sites; and (2)differences in ripening phenologies among sites show-ing an asynchronous temporal pattern of fruit abun-dance among sites similar to those described byDeveley & Peres (2000), Morellato et al. (2000), andErikson & Ehrlén (1991), probably due to physiologi-cal characters of plant species associated with abioticfactors (Jordano 1992; Reich 1995). At the landscapelevel, this pattern suggests that, as a whole, themosaic of habitat types can be seen as a non-seasonalunit, where each individual patch has complementaryfruiting phenology. This environmental characteris-tic is very important because it might affect the distri-bution of frugivorous bird species and the persistenceof populations over time (Goerck 1997; Loiselle &Blake 1991).
Table 1. (Continued).
Plant species
Chiroxiphia caudata Schiffornis virescens Plant traits
Primary forest
Secondary forest
Primary forest
Secondary forest
Life form
Fruit Seed
Dry Wet Dry Wet Dry Wet Dry Wet TypeMass
(g)Diameter
(mm)Mass
(g)Diameter
(mm)
Rubus rosaefolius 1 2 1 2 1 Herb Polydrupe 0.99 13.31 0.11 1.55Rudgea jasminoides 1 1 Tree Drupe 0.25 8.84 0.03 6.25Schinus terebinthifolius 1 Tree Dry, nut 0.02 4.53 0.01 3.93Solanaceae sp. 1 1 2 Shrub Berry 0.91 11.01 0.04 1.79Solanaceae sp. 2 1 BerrySolanum americanum 1 Shrub Berry 0.09 4.48 0.02 2.32Solanum inodorum 2 Liana Berry 1.01 12.32 0.03 3.92Struthanthus vulgaris 1 Hemiparasite Berry 0.11 6.73 0.02 4.83Symplocos
glandulosomarginata1 Tree Drupe 0.25 9.00 0.06 8.56
Symplocos variabilis 1 Tree Drupe 0.87 17.95 0.22 16.85Tournefortia
paniculata1 Liana Drupe 0.14 5.18 0.02 3.57
Trema micrantha 5 Tree Berry 0.01 2.53 0.00 2.08Total no. of fruit
records60 42 42 17 12 12 17 1
Total no. of plant species
30 25 14 14 9 8 7 1
Downloaded By: [Hasui, Érica] At: 12:17 7 December 2009
154 É. Hasui et al.
The spatial and temporal variations in manakincaptures were probably associated with the fluctua-tion in the fruit supply. These birds might have strate-gies of high spatial activity for survival during localfruit scarcity (“searching for specific resource dissi-pated in space”), like enlarging as much as possiblethe range of individual movements to cover with rou-tine daily activity more than one forest site (Dunninget al. 1992), or extending their foraging activities intodifferent forest strata (Silva et al. 2002). Perhaps, theyeven have a nomad behavior, moving around within alocal habitat mosaic according to more favorableresource availability (Van Schaik et al. 1993). In anycase, birds may be favored by the asynchronous pat-tern of fruit availability among sites. Due to this situ-ation, populations of frugivorous birds may bemaintained only if forest patches are connected by suit-able corridors so that patches providing supplementaryfood sources can be reached (Dunning et al. 1992).
Besides the habitat selection that was involved incaptures, sampling bias probably contributed to thedifferences between primary and secondary forests,
due to the spatial limitation in the secondary forest toestablish five transects. One of the transects was 80 mfrom the next net-line. This proximity interfered inthe rate of recaptures.
Pattern of resource utilization in primary forest
The fruit supply in primary forest sites was apparentlyenough for the coexistence of C. caudata and S. virescenswithout active niche partitioning when fruit is abundant,although the birds selected different fruits when fruitsare scarce. The higher heterogeneity of fruit traits associ-ated with birds’ differences in morphology (body massand bill dimensions) and foraging activity allowed theniche partitioning (Gautier-Hion et al. 1985; Jácomoet al. 2004). Schiffornis virescens has a smaller bill andlower body mass. As bill dimension is a limiting factorfor the range of fruits susceptible to swallowing (Hickeyet al. 1996; Wheelwright 1985), this species might adopta narrower range of fruit sizes, selecting the lightestfruits with the smallest seeds, whereas C. caudata ismore opportunistic, shaping its diet according to fruits
Figure 1. Comparison between sites and seasons of captures (mean/100 net-hours) of Chiroxiphia caudata (n = 89 individuals)and Schiffornis virescens (n = 62 individuals) in the Atlantic Forest at Parque Estadual Intervales, SP, Brazil. SF, secondaryforest; VB, valley bottom; MS, middle slope; HT, hilltop; a and b: significant difference between seasons, considering P < 0.05.
SF
Mon
ths
mea
n nu
mbe
r of
bird
s ca
ptur
ed/
100
net-
hour
s +
sd
0
0.5
1
1.5
2
3.5 a
a
b
b
VB MS
C. caudata S. virescens
HT SF VB MS HT
Dry (Apr–Sep)
Wet (Oct–Mar)
Downloaded By: [Hasui, Érica] At: 12:17 7 December 2009
Studies on Neotropical Fauna and Environment 155
available. Another difference between the speciesappeared when fruit was scarce. Chiroxiphia caudataforaged for larger fruits in the canopy, while S. vires-cens searched for understory plants.
Although fruit comprised the predominant feed-ing resource in the diet of both manakins, the degreeof frugivory was higher for C. caudata. A higherdegree of insectivory for S. virescens decreased the
Figure 2. Comparison between sites and seasons of (a) the number of understory fruiting plants, (b) the number of fruitingspecies, and (c) pulp mass of small fruits in the Atlantic Forest at Parque Estadual Intervales, SP, Brazil. SF, secondary forest;VB, valley bottom; MS, middle slope; HT, hilltop.
SF
Mon
ths
mea
n nu
mbe
r of
plan
ts fr
uitin
g/10
0m2
Mea
n pu
lp m
ass(
g)/1
00m
2
Mon
ths
mea
n nu
mbe
r of
spec
ies
frui
ting/
100m
2
0
0.51
1.52
2.53 0.3
0.250.2
0.150.1
0.05
0
0
5
10
15
20
VB MS
a b
c
HT SF VB MS HT
SF VB MS HT
Dry (Apr–Sep)
Wet (Oct–Mar)
Figure 3. Comparison between sites, seasons and bird species of the presence of arthropods and fruits in fecal samples of thetwo manakin species in the Atlantic Forest at Parque Estadual Intervales, SP, Brazil (samples from the three primary forestsites pooled, numbers on the top of the columns are the number of samples with identified material). Cca, Chiroxiphia caudata;Svir, Schiffornis virescens.
Cca
0%
20%
40%
60%
80%
100%35 16 32 15 23 13 6 1
Svir Cca CcaSvir Svir Cca Svir
Only fruits
Only arthropodsArthropods and fruits
Dry
Primary forest
Fec
al s
ampl
es
Secondary forest
Wet Dry Wet
Downloaded By: [Hasui, Érica] At: 12:17 7 December 2009
156 É. Hasui et al.
Figure 4. Comparison between sites and seasons of observed and expected niche overlap between Chiroxiphia caudata andSchiffornis virescens in the Atlantic Forest at Parque Estadual Intervales, SP, Brazil. The expected value is calculated fromniche overlap in 1000 randomized fruit species selection. An asterisk indicates an observed niche overlap significantly differentfrom the null model (P < 0.05).
Dry
0
Nic
he o
verla
p
0.1
0.2
0.3
0.4
0.5
0.6
0.7Expected niche
Observed niche
Valley Bottom Middle Slope Hilltop SecondaryForest
Wet
* *Dry Wet Dry Wet Dry Wet
Figure 5. Plot of the first two axes from the principal component analyses. Plant species consumed by Chiroxiphia caudata(n = 59 plant species) and Schiffornis virescens (n = 19) are delimited by the minimum polygons and were distinguishedwithin the sites to identify interspecific and seasonal change in the diet breadth and niche. Species’ and variables’ scoresfrom each habitat were separated in two graphs only for visual purposes. For a detailed comprehension of fruit traits usedin the analyses see Table 1. v, valley bottom; m, middle slope; h, hilltop. Plant species with extreme positions in the plots: 1,Mollinedia boracensis; 2, Inga marginata; 3, Guarea macrophylla; 4, Rubus rosaefolius; 5, Symplocos variabilis; 6, Ocoteapuberula; 7, Myrcia grandiflora; 8, Schinus terebinthifolius; 9, Rudgea jasminoides; 10, Myrcia fallax; 11, Casearia decandra;12, Leandra dasytricha.
Primary forest
Dry Wet
Axi
s 2
Axis 1 Axis 1
Axi
s 2
Fruit and seed size
Plan
t lif
e fo
rm
Secondary forest
C. caudata
C. caudata
S. virescens
S. virescens
mm m
11
7
6
58
9
12
4
10
vv
v13
2mhhm
v4
Downloaded By: [Hasui, Érica] At: 12:17 7 December 2009
Studies on Neotropical Fauna and Environment 157
overlap and can be considered additional evidence ofits phylogenetic affinity with the superfamily Tyran-noidea, rather than with the typical frugivorous Pipri-dae, as pointed out by Prum & Lanyon (1989).
Pattern of resource utilization in secondary forest
In contrast to the tendencies observed in the primaryforests, the niche breadth and overlap in the secondary
forest might have been affected by a lower number ofcanopy fruiting plants with overlap marginally higherthan expected by chance when fruit was scarce. Bothspecies had similar foraging patterns, sharing smallfruit species in the understory.
The increase in food niche overlap following habi-tat alteration, including a decline in the availability ofsome food items, was also shown by Luiselli (2006).He argued that this pattern may be predicted to havecumulative effects, reducing forest biodiversity.Those effects may be explained by the fact that nichedifferentiation facilitates coexistence, leading tohigher diversity. The over-exploitation of the samefood item might result in increased competition, pos-sibly reducing one or both populations (Albrecht &Gotelli 2001; Gotelli & Graves 1996; Vieira 2003).However, our data did not support this prediction:both species were more abundant in secondary thanin primary forests. Apparently, disturbance facilitatedcolonization of the area by fleshy-fruited plants con-sumed by the studied bird species, which became more
Figure 6. Comparison between forest type, seasons and bird species of measure of niche breadths of Chiroxiphia caudata andSchiffornis virescens, considering six traits of the fruit species consumed (plant life form, fruit type, total fruit and seed mass,largest diameter of fruit and seed).
DryWet
Primary forest
Nic
he b
read
th
Secondary forest
C. caudataS. virescens
Season–3.0
–2.5
–2.0
–1.5
–1.0
–0.5
0.0
0.5
1.0
1.5
2.0
2.5
3.0
3.5
Season WetDry
Table 2. Results of comparisons of biometric data (means± SE) of Chiroxiphia caudata and Schiffornis virescens.
Biometric data of birds
C. caudata (n = 30)
S. virescens (n = 21)
t-Value (df = 49) P
Body mass (g) 25.02 ± 1.87 23.67 ± 2.31 2.30 0.026Bill length (cm) 0.88 ± 0.07 1.02 ± 0.06 −6.89 <0.000Bill width (cm) 0.77 ± 0.09 0.61 ± 0.08 6.13 <0.000Bill depth (cm) 0.53 ± 0.03 0.52 ± 0.03 1.64 0.108
All t-value tests were performed independently.
Downloaded By: [Hasui, Érica] At: 12:17 7 December 2009
158 É. Hasui et al.
abundant. Thus, food abundance in secondary forest,even in the period of lowest abundance, promoteshigher diet overlap without affecting coexistence(González-Solís et al. 1997).
In summary, these results reinforce the idea ofGautier-Hion et al. (1985) that fruit traits areinvolved in choice and partitioning of the availablefruit spectrum. However, the effect on niche parti-tioning changed seasonally and spatially.
Acknowledgements
We wish to express our gratitude to Bette A.Loiselle for her suggestions. We are indebted toMaria F. Freitas, João R. Figueiredo, Maria L.Kawasaki and Renato Goldemberg, who identifiedthe plant species. We also thank Antonio M. Rosaand the staff of the Intervales States Park for assist-ing with the fieldwork and to Sandra M.J.P. Silvafor helping us with fruit measurements. We appre-ciate the improvements in English expression madeby Phil Stouffer through the Association of Field Orni-thologists program of editorial assistance. This studywas supported by CNPq, CAPES, FMB and is partof the BIOTA/FAPESP Program, the Virtual Insti-tute of Biodiversity (www.biota.org.br) throughgrant no. 98/05090-6 to W.R.S., and FAPESP grantno. 98/10968-0 to E.H.
References
Albrecht M, Gotelli NJ. 2001. Spatial and temporal niche parti-tioning in grassland ants. Oecologia. 126:134–141.
Begon MJ, Harper L, Townsend CR. 1996. Ecology: individuals,populations and communities. 3rd ed. Oxford: BlackwellScience. 1068 p.
Carnes BA, Slade NA. 1982. Some comments on niche analysis incanonical space. Ecology. 63:888–893.
Del Hoyo J, Elliott A, Christie DA. 2004. Handbook of the birdsof the world. Vol. 9, Cotingas to pipits and wagtails. Barcelona:Lynx Edicions. 863 p.
Deverley PF, Peres CA. 2000. Resource seasonality and the struc-ture of mixed species bird flocks in a coastal Atlantic forest ofsoutheastern Brazil. J Trop Ecol. 16:33–53.
Dunning JB, Danielson BJ, Pulliam HR. 1992. Ecological proc-esses that affect populations in complex landscapes. Oikos.65(1):169–175.
Erikson O, Ehrlén J. 1991. Phenological variation in fruit charac-teristics in vertebrate-dispersed plants. Oecologia. 86:463–470.
Finch DM. 1989. Habitat use and habitat overlap of riparian birdsin three elevation zones. Ecology. 70(4):866–880.
Galetti M, Laps R, Pizo MA. 2000. Frugivory by Toucans(Ramphastidae) at two altitudes in the Atlantic Forest of Brazil.Biotropica. 32(4):842–850.
Gautier-Hion AJ, Duplantier M, Quris R, Feer F, Sourd C,Decoux JP, Dubost G, Emmons L, Erard C, Hecketsweiler P,Moungazi A, Roussilhon C, Thiollay JM. 1985. Fruit charactersas a basis of fruit choice and seed dispersal in a tropical forestvertebrate community. Oecologia. 65(3):324–337.
Goerck JM. 1997. Patterns of rarity in the birds of Atlantic Forestof Brazil. Conserv Biol. 11(1):112–118.
González-Solís J, Oro D, Jover L, Ruiz X, Pedrocchi V. 1997.Trophic niche width and overlap of two sympatric gulls in thesouthwestern Mediterranean. Oecologia. 112(1):75–80.
Gotelli NJ, Graves GR. 1996. Null models in ecology. Washington(DC): Smithsonian Institution Press.
Gregory R, Gaston KJ. 2000. Explanations of commonness andrarity in British breeding birds. Separating resource and resourceavailability. Oikos. 88(3):515–526.
Hickey MB, Acharya L, Pennington S. 1996. Resource partitioningby two species of vespertilionid bats (Lasiurus cinereus) and(Lasiurus borealis) feeding around street lights. J Mammal.77(2):325–334.
Izhaki I, Safriel UN. 1989. Why are there so few exclusively fru-givorous birds? Experiments on fruit digestability. Oikos.54:23–32.
Jácomo ATA, Silveira L, Diniz-Filho JAF. 2004. Niche separationbetween the Maned-Wolf (Chrysocyon brachyurus), Crab-EatingFox (Dusicyon thous) and the Hoary-Fox (Dusicyon vetulus) inthe Cerrado of Central Brazil. J Zool. 262:99–106.
Jordano P. 1992. Fruit and frugivory. In: Fenner M, editor. Seeds:the ecology of regeneration in plant communities. Wallingford(UK): CAB International. p. 105–153.
Levey DJ. 1986. Methods of seed processing by birds and seeddeposition patterns. In: Estrada A, Fleming TH, editors. Frugi-vores and seed dispersal. Dordrecht (The Netherlands): Dr WJunk Publishers. p. 147–158.
Loiselle BA, Blake JG. 1991. Temporal variation in birds andfruits along an elevational gradient in Costa Rica. Ecology.72(1):180–193.
Luiselli L. 2006. Food niche overlap between sympatric potentialcompetitors increases with habitat alteration at different trophiclevels in rain-forest reptiles (omnivorous tortoises and carnivo-rous vipers). J Trop Ecol. 22(6):695–704.
McMartin B, Bellocq I, Smith SM. 2002. Patterns of consumptionand diet differentiation for three breeding warbler species duringa spruce budworm outbreak. Auk. 119(1):216–220.
Moermond TC, Denslow JS. 1985. Neotropical avian frugivorespatterns of behavior, morphology, and nutrition with conse-quences for food selection. In: Buckley PA, Foster MS, MortonES, Ridgely RS, Smith NG, editors. Neotropical ornithology.Washington (DC): American Ornithologists Union. p. 865–897(Ornithological monographs; 36).
Morellato LP, Talora DC, Takahasi A, Bencke CC, Romera EC,Zipparro VB. 2000. Phenology of Atlantic rain forest tree: acomparative study. Biotropica. 32(4):811–823.
Pérez EM, Bulla L. 2000. Dietary relationships among four graniv-orous doves in Venezuela savannas. J Trop Ecol. 16:865–882.
Pianka ER. 1973. The structure of lizard communities. Annu RevEcol Syst. 4:53–74.
Prum RO, Lanyon WE. 1989. Monophyly and phylogeny of theSchiffornis group (Tyrannoidea). Condor. 91:444–461.
Reich PB. 1995. Phenology of tropical forests: patterns, causes andconsequences. Can J Bot. 73:164–174.
Schoener TW. 1965. The evolution of bill size differences amongsympatric congeneric species of birds. Evolution. 19:189–213.
Silva WR, De Marco P, Hasui E, Gomes VSM. 2002. Patterns offruit–frugivore interactions in two Atlantic Forest bird commu-nities of South-eastern Brazil: implications for conservation. In:Levey DJ, Silva WR, Galetti M, editors. Seed dispersal and fru-givory: ecology, evolution and conservation. Wallingford (UK):CAB International. p. 423–435.
Statsoft. 1995. Statistics for Windows, release 6. Tulsa (OK):Statsoft.
Downloaded By: [Hasui, Érica] At: 12:17 7 December 2009
EricaHasui
Realce
Studies on Neotropical Fauna and Environment 159
Stotz DF, Fitzpatrick JW, Parker III TA, Moskovits DK. 1996.Neotropical bird ecology and conservation. Chicago: UniversityChicago Press. 478 p.
Van Der Pijl L. 1982. Principles of dispersal in higher plants. 3rded. Berlin: Springer Verlag.
Van Schaik CP, Terborgh JW, Wright SJ. 1993. The phenology oftropical forests: adaptative significance and consequences ofprimary consumers. Ann Rev Ecol. Syst. 24:353–377.
Vieira MV. 2003. Seasonal niche dynamics in coexisting rodentsof the Brazilian Cerrado. Stud Neotrop Fauna Environ.38(1):7–15.
Wheelwright NT. 1985. Fruit size, gape width, and the diets offruit-eating birds. Ecology. 66:808–818.
Wiens JA. 1989. The ecology of bird communities. Vol. 2, Processes andvariations. Cambridge (UK): Cambridge University Press. 316 p.
Zar JH. 1996. Biostatistical analysis. 3rd edition. Upper SaddleRiver (NJ): Prentice-Hall. 918 p.
Appendix 1. Summary statistics and matrix correlations of principal components analysis
Axis 1 Axis 2
Eigenvalue 2.79 1.39% Total variance 46.45 23.23Cumulative Eigenvalue 2.79 4.18Cumulative % Eigenvalue 46.45 69.69Plant life form 0.06 -0.63Fruit type −0.33 −0.23Total fruit mass -0.45 0.38Total seed mass -0.50 −0.17Largest fruit diameter -0.48 0.37Largest seed diameter -0.45 −0.49
In bold, the coordinates of the variables that were most correlatedto the axis.
Downloaded By: [Hasui, Érica] At: 12:17 7 December 2009