Adenovirus‐mediated inhibition of SPARC attenuates liver fibrosis in rats
Upload
independentCategory
view
2download
0
For Review O
nly
SPARC promotes cathepsin B-mediated melanoma invasiveness through a collagen I/α2β1 integrin axis.
Journal: Journal of Investigative Dermatology
Manuscript ID: JID-2011-0017.R1
Manuscript Type: Original Article
Date Submitted by the Author:
n/a
Complete List of Authors: Girotti, Maria; Instituto Leloir, Laboratory of Molecular and Cellular Therapy Fernandez Rodriguez, Marisol; Centro Nacional de Biotecnologia, Proteomics Unit Lopez, Juan; Centro Nacional de Investigaciones Cardiovasculares,
Proteomics Unit Camafeita, Emilio; Centro Nacional de Investigaciones Cardiovasculares, Proteomics Unit Fernandez, Elmer; Universidad Catolica de Cordoba, Intelligent Data Analysis Group Albar, Juan; Centro Nacional de Biotecnologia, Proteomics Unit Benedetti, Lorena; Instituto Leloir, Laboratory of Molecular and Cellular Therapy Valacco, Maria; Instituto Leloir, Laboratory of Molecular and Cellular Therapy Brekken, Rolf; Hamon Center for Therapeutic Oncology Research, Division of Surgical Oncology
Podhajcer, Osvaldo; Instituto Leloir, Laboratory of Molecular and Cellular Therapy Llera, Andrea; Instituto Leloir, Laboratory of Molecular and Cellular Therapy
Key Words: SPARC, epithelial mesenchymal transition, cathepsin B, N-cadherin, collagen I
Journal of Investigative Dermatology
For Review O
nly
SPARC and invasiveness in melanoma cells
1
SPARC promotes cathepsin B-mediated melanoma invasiveness through a
collagen I/α2β1 integrin axis.
María Romina Girotti1, Marisol Fernández Rodríguez
2, Juan Antonio López
3, Emilio Camafeita
3, Elmer
Fernández4, Juan Pablo Albar
2, Lorena Gabriela Benedetti
1, María Pía Valacco
1, Rolf Brekken
5,6,
Osvaldo Luis Podhajcer1, and Andrea Sabina Llera
1.
1 Laboratory of Molecular and Cellular Therapy, Fundación Instituto Leloir-CONICET, Buenos Aires,
Argentina.
2 Proteomics Unit, Centro Nacional de Biotecnología (CNB), Madrid, Spain.
3 Proteomics Unit, Centro Nacional de Investigaciones Cardiovasculares (CNIC), Madrid, Spain.
4 School of Engineering, Intelligent Data Analysis Group, Universidad Católica de Córdoba, Córdoba,
Argentina.
5 Division of Surgical Oncology, Department of Surgery, Hamon Center for Therapeutic Oncology
Research, University of Texas Southwestern Medical Center, Dallas, Texas, United States of America.
6 Department of Pharmacology, University of Texas Southwestern Medical Center, Dallas, Texas, United
States of America.
CORRESPONDING AUTHOR
Andrea Sabina Llera
Fundación Instituto Leloir – Av. Patricias Argentinas 435 – Buenos Aires 1405BWE – Argentina
Phone: +541152387500 – Fax +541152387501
E-mail [email protected]
RUNNING TITLE: SPARC and invasiveness in melanoma cells
Page 1 of 71 Journal of Investigative Dermatology
123456789101112131415161718192021222324252627282930313233343536373839404142434445464748495051525354555657585960

For Review O
nly
SPARC and invasiveness in melanoma cells
2
ABBREVIATIONS
A3: A375-derived clone expressing SPARC RNAi
AE: A375 cell line transfected with control plasmid
AW: A375 cell line
CA-074: [L-3-trans-(Propylcarbamoyl)oxirane-2-carbonyl]-L-isoleucyl-L-proline, cathepsin B-specific
inhibitor.
COLA I: collagen I
DIGE: differential in-gel electrophoresis
EMT: epithelial to mesenchymal transition
FAM3C: family with sequence similarity 3, member C
L2, L2F6: MEL-LES-derived clone expressing SPARC RNAi
LB, LBLAST: MEL-LES cell line transfected with control plasmid
SPARC, SP: secreted protein, acidic and rich in cysteines
KEYWORDS: SPARC, epithelial-mesenchymal transition, cathepsin B, N-cadherin, collagen I
ABSTRACT
In melanoma, the extracellular protein SPARC (secreted protein, acidic and rich in cysteines) is related to
tumour progression. Some of the evidence that links SPARC to melanoma progression indicates that
SPARC may be involved in the acquisition of mesenchymal traits that favour metastatic dissemination.
However, no molecular pathways that link extracellular SPARC to a mesenchymal phenotype have been
described. In this study, global protein expression analysis of the melanoma secretome following
enforced downregulation of SPARC expression led us to elucidate a new molecular mechanism by which
SPARC promotes cathepsin B-mediated melanoma invasiveness using collagen I and α2β1 integrins as
mediators. Interestingly, we also found that the TGFβ1 contribution to cathepsin B-mediated invasion is
Page 2 of 71Journal of Investigative Dermatology
123456789101112131415161718192021222324252627282930313233343536373839404142434445464748495051525354555657585960

For Review O
nly
SPARC and invasiveness in melanoma cells
3
highly SPARC-dependent. In addition, induction of the E- to N-cadherin switch by SPARC enabled
melanoma cells to transmigrate across an endothelial layer through a mechanism independent to that
enhancing invasion. Finally, SPARC also enhanced the extracellular expression of other proteins involved
in epithelial-mesenchymal transformation, such as FAM3C/ILEI.
Our findings demonstrate a novel molecular pathway for SPARC activity on invasion and support an
active role of SPARC in the mesenchymal transformation that contributes to melanoma dissemination.
INTRODUCTION
Cutaneous malignant melanoma is an aggressive melanocyte malignancy that is characterised by early
metastasis, bad prognosis and poor survival. The best chance of recovery depends on surgical removal
of the early stage melanoma, and there is no standardised treatment for the disseminated malignancy
(Tsao et al 2004). Understanding the molecular mechanisms that govern the initial melanoma
dissemination steps may provide new targets for successful management of melanoma.
As melanoma progresses, tumour cells usually undergo a series of molecular changes that allow them to
travel through neighbouring cells, invade the extracellular matrix and migrate until reaching circulation,
thus leading to metastasis. These changes, closely resembling the epithelial-to-mesenchymal transition
(EMT) (Alonso et al 2007), include a shift from E-cadherin to N-cadherin expression, which facilitates
malignant cell release from the original parenchyma and helps them pass through endothelial cells and
disseminate (Mack and Marshall 2010). Increased collagen-I expression is also associated with the
mesenchymal phenotype as it enhances collagen fibre formation, which constitutes “invasion highways”
along which cancer cells migrate (Egeblad et al 2010).
Several proteins, such as TGFβ1, Wnt, IL-6 and BMP, constitute induction signals that promote
mesenchymal transformation (Thiery et al 2009). Importantly, SPARC (secreted protein acidic and rich in
cysteines) has recently been mentioned in the context of EMT (Moreno-Bueno et al 2009). In normal
Page 3 of 71 Journal of Investigative Dermatology
123456789101112131415161718192021222324252627282930313233343536373839404142434445464748495051525354555657585960

For Review O
nly
SPARC and invasiveness in melanoma cells
4
cells, several biological functions are associated with SPARC including tissue remodelling, endothelial cell
migration, angiogenesis and chaperone activity (Bradshaw and Sage 2001); however, the most
remarkable aspect of SPARC is its correlation with tumour progression in certain cancers (Podhajcer et al
2008). Interestingly, tumour types associated with mesenchymal transformation, such as the highly
aggressive basal-like and metaplastic breast carcinomas, express high levels of SPARC, which is a poor
outcome marker (Lien et al 2007). This relationship of SPARC with bad prognosis correlates with SPARC
behaviour in in vitro and in vivo assays. For example, in glioma cells, SPARC induction has been shown to
promote cell motility and invasion along with an increase in certain matrix metalloproteinases in the
extracellular milieu (Golembieski et al 1999, Schultz et al 2002).
In melanoma, SPARC expression has been reported to increase with tumour progression, and its
expression was shown to be a marker for poor prognosis (Massi et al 1999). SPARC knockdown in
melanoma cells led to the complete loss of their in vivo tumorigenic growth in nude mice (Ledda et al
1997b) through a mechanism involving the activation of polymorphonuclear cell-antitumour activity
(Alvarez et al 2005, Prada et al 2007). Importantly, SPARC expression in melanoma cells has been
associated with the acquisition of mesenchymal characteristics. Melanoma cells that overexpress SPARC
have reduced E-cadherin expression (Smit et al 2007), and SPARC knockdown in melanoma cells
downregulates N-cadherin levels (Sosa et al 2007) and metalloproteinase activity (Ledda et al 1997a,
Ledda et al 1997b).
The search for molecular mechanisms that explain SPARC tumour cell activity has been unsuccessful.
There seems to be no consensus of the pathways affected by SPARC in normal and tumour cells. SPARC
is an extracellular protein, and some of the SPARC features in normal cells seem to be explained by
SPARC interaction with integrin β1 (Nie et al 2008, Weaver et al 2008), but were not reproduced in
tumour cells. No actual ligand was described for SPARC in tumour cells, even when several reports
related SPARC to FAK and ILK-mediated signalling pathways within glioma and melanoma cells (Fenouille
et al 2011, Shi et al 2007, Smit et al 2007, Thomas et al 2010). Particularly for melanoma, strong data
demonstrating extracellular SPARC interactions that lead to EMT-related changes and their biological
consequences are still lacking. To address this issue, we performed a comprehensive comparative
Page 4 of 71Journal of Investigative Dermatology
123456789101112131415161718192021222324252627282930313233343536373839404142434445464748495051525354555657585960

For Review O
nly
SPARC and invasiveness in melanoma cells
5
proteomic analysis of the melanoma cell secretome with regulated SPARC levels and evaluated the role
of some of the resulting differential proteins in invasion and transendothelial migration.
RESULTS
Secretome analysis of cell lines with differential SPARC expression reveals proteins associated with
increased tumour aggressiveness
Two differential in-gel electrophoresis (DIGE) experiments were performed on extracellular proteins
(secretome) from the SPARC-expressing human melanoma cell line LBLAST and its RNAi-bearing clone
L2F6, which expressed 80% less SPARC (Sosa et al 2007). Seventy-one proteins showed statistically
significant expression levels between LBLAST and L2F6 (Supplemental Table S1), and the LBLAST and
L2F6 samples were efficiently segregated by their expression levels in non-supervised hierarchical
analysis (Supplemental Figure S1). Differentially expressed proteins were classified according to their
molecular function using PANTHER (Thomas et al 2003a, Thomas et al 2003b), which shows that
proteases were the most common group among those affected by SPARC (Supplemental Figure S2a).
Moreover, gene ontology modular enrichment analysis using DAVID (Huang da et al 2009) demonstrated
that the highest enriched group was that of proteins involved in proteolysis (enrichment score 2.86 at
medium stringency; Supplemental Figure S2b).
Several differentially expressed genes were chosen for technical validation: cathepsin B, L and X,
FAM3C/ILEI, N-cadherin, vimentin and collagen I were consistently found to be down-regulated in the
L2F6 cell secretome as compared with LBLAST when assessed by antibody recognition based techniques
(Figures 1a-c and 5). Interestingly, changes seen with N-cadherin, vimentin, collagen-I and FAM3C/ILEI
levels are consistent with a relevant SPARC role in EMT.
Downregulation of SPARC expression levels decreased extracellular cathepsin B levels and activity
Page 5 of 71 Journal of Investigative Dermatology
123456789101112131415161718192021222324252627282930313233343536373839404142434445464748495051525354555657585960

For Review O
nly
SPARC and invasiveness in melanoma cells
6
Among the SPARC regulated proteases, we decided to further study cathepsin B, which was identified in
eight spots that showed downregulation in the L2F6 secretome (Supplemental Figure S3a). A lack of
significant cathepsin B expression was also observed in experimental L2F6 tumours confirming that
knocking down SPARC expression decreased cathepsin B production both in vitro and in vivo (Figure 1c).
L2F6 cell conditioned media also showed a reduced enzyme activity as compared with that of LBLAST
(Figure 1d). Moreover, treatment of L2F6 cells with 30 nM purified SPARC restored the levels of secreted
cathepsin B, and it did not significantly affect the secreted levels in LBLAST cells (Figure 1e).
Interestingly, the lack of significant changes at the mRNA level and in whole cell extracts suggested that
SPARC alteration of cathepsin B levels was only obvious in the extracellular milieu (Supplemental Figures
S3b and c).
SPARC is responsible for the cathepsin B-mediated invasiveness of melanoma cells
To determine whether SPARC modulation of cathepsin B secretion results in differences in the invasive
capacity of melanoma cells, we tested LBLAST and L2F6 cells in invasion assays in the presence or
absence of the specific cathepsin B inhibitor CA-074 (Turk et al 1995). LBLAST cells showed higher
invasiveness than SPARC-deficient L2F6 cells, and the inclusion of CA-074 resulted in a significant
decrease in LBLAST invasiveness and a complete loss of the already low L2F6 invasive capacity (Figures
2a-b). Interestingly, preincubation of L2F6 cells with 30 nM of SPARC for 24 h but not for 3 h (not shown)
restored the cathepsin B secretion (Figure 1e) and invasive capacity to levels similar to those of LBLAST,
although it did not affect LBLAST invasiveness (Figure 2b). A similar effect was observed with
adenovirus-mediated rescuing of SPARC expression in L2F6 cells (Supplemental Fig S4a). Moreover,
preincubation of SPARC-treated LBLAST and L2F6 cells with anti-SPARC antibodies inhibited the invasive
capacity of both cells, confirming that the effects observed are SPARC-dependent (Figure 2b).
The effect of SPARC in cathepsin B-mediated invasion was not cell line dependent: in A375 human
melanoma cells, a siRNA-mediated knocking down of SPARC expression (Figure 2c-d) was accompanied
by a strong decrease in the mature form of secreted cathepsin B (Figure 2e) and a concomitant
inhibition of cathepsin B-dependent invasion (Figure 2f).
Page 6 of 71Journal of Investigative Dermatology
123456789101112131415161718192021222324252627282930313233343536373839404142434445464748495051525354555657585960
For Review O
nly
SPARC and invasiveness in melanoma cells
7
Collagen I restores cathepsin B-dependent invasive capacity of SPARC-deficient cells
We next explored whether the SPARC mediated increase in cathepsin B secretion may be a consequence
of the known SPARC effects on the regulation of collagen expression or deposition (Brekken and Sage
2001, Klose et al 2006), as we have found significantly decreased secreted collagen-I α2 chain levels in
L2F6 cells vs. LBLAST, which could be restored at the mRNA level by SPARC treatment (Supplemental
Table S1 and Figure 3a). We observed that plating L2F6 cells for 24 h on monomeric collagen-I-coated
dishes completely restored the invasive capacity to that of LBLAST (Figure 3b). The effect was collagen I
specific, as fibronectin showed no effect on L2F6 invasion (Figure 3b). Invasion restoration was
accompanied by increased cathepsin B secretion (Figure 3c) without evident changes at the
transcriptional level (not shown) and was completely blocked by CA-074, demonstrating that the
collagen I effect on invasiveness was cathepsin B-mediated. These effects were not observed in LBLAST
cells, suggesting that these cells are refractory to further collagen I stimulation. No additive effect was
observed in cathepsin B levels and invasiveness capabilities upon plating cells on collagen-I with SPARC,
suggesting that these proteins converge in a common pathway already maximally stimulated (Figure
3b).
αααα2ββββ1 integrin mediates both SPARC- and collagen I- restoration of cathepsin B levels and invasiveness
As the α2β1 integrin interaction with collagen-I has been previously shown to promote cathepsin B
secretion (Klose et al 2006, Koblinski et al 2002), we decided to establish if α2β1 integrin might mediate
the SPARC/collagen-I effects on cathepsin B secreted levels and invasiveness. We observed that both
LBLAST and SPARC or collagen-I-treated L2F6 invasiveness were completely blocked in the presence of
neutralising anti-α2 and/or anti-β1 integrin antibodies. Importantly, the addition of CA-074 in the
presence of the neutralising antibodies failed to further reduce the amount of invading cells under any
of the conditions assayed (Figure 3d and Supplemental Figure S4b).
Role of TGFββββ1 on cathepsin B-mediated melanoma invasiveness induced by SPARC
Page 7 of 71 Journal of Investigative Dermatology
123456789101112131415161718192021222324252627282930313233343536373839404142434445464748495051525354555657585960

For Review O
nly
SPARC and invasiveness in melanoma cells
8
We next investigated whether TGFβ1 may be involved in the cathepsin B-mediated melanoma
invasiveness induced by SPARC, as a reciprocal regulatory loop has been demonstrated for SPARC and
TGFβ1 (Francki et al 1999, Reed et al 1994, Schiemann et al 2003).
Both a neutralising anti-TGFβ1 antibody (anti-TGFβ1) (Lee et al 2005) and a TGFβ1 receptor I inhibitor,
SB431542 (Laping et al 2002), were able to inhibit the LBLAST control cell invasive capacity. However,
restoration of the L2F6-invasive capacity by SPARC was only slightly inhibited (Figure 4a-b). Importantly,
in the presence of either anti-TGFβ1 or SB431542, the cathepsin B inhibitor CA-074 further inhibited the
SPARC-treated L2F6 invasiveness, indicating that TGFβ1 is not the main responsible of SPARC-induced
melanoma invasiveness (Figure 4a-b). No effect of anti-TGFβ1 reagents were observed when L2F6
invasiveness restoration was mediated by collagen-I, indicating that collagen-I overrides any TGFβ1
influence in SPARC-mediated invasion. Also, anti-SPARC antibodies further inhibited the invasiveness
partially decreased by anti-TGFβ1 (Figure 4c), suggesting that SPARC is a more direct modulator of
cathepsin B-mediated invasiveness than TGFβ1.
To clarify the TGFβ1 contribution to SPARC-induced invasiveness, we tested melanoma cells in the
presence of exogenously added TGFβ1. Figure 4d shows that TGFβ1 was able to completely restore the
L2F6 invasive properties to levels comparable to that of LBLAST. However, this effect was completely
abolished in the presence of anti-SPARC antibodies, demonstrating that TGFβ1-induced cathepsin B-
mediated melanoma invasiveness is completely mediated by SPARC. The most likely explanation is that
TGFβ1 may act directly by enhancing SPARC expression. Accordingly, we observed a slight but significant
increase in SPARC protein levels in the media from L2F6 cells when treated with TGFβ1, even though
these cells express a SPARC-specific RNAi (Supplemental Figure S4c-d).
SPARC promotes transendothelial migration of melanoma cells
Page 8 of 71Journal of Investigative Dermatology
123456789101112131415161718192021222324252627282930313233343536373839404142434445464748495051525354555657585960

For Review O
nly
SPARC and invasiveness in melanoma cells
9
The E- to N-cadherin switch is a widely accepted EMT hallmark (Li and Herlyn 2000). Given that SPARC
affects the E- and N-cadherin levels (Robert et al 2006, Sosa et al 2007), we investigated whether there
is a link between the SPARC-induced cadherin switch and tumour progression. Flow cytometry
confirmed that L2F6 cells induced E-cadherin surface expression with the consequent downregulation of
N-cadherin expression. Accordingly, preincubation of L2F6 cells with SPARC restored N-cadherin and
repressed E-cadherin expression (Figure 5a).
Transendothelial migration assays demonstrated that L2F6 cells exhibited a 50% lower capacity to
migrate as compared with LBLAST cells. Preincubation of L2F6 cells with SPARC restored the number of
transmigrating cells to levels close to that of LBLAST. The neutralising N-cadherin antibodies inhibited
both LBLAST and SPARC-induced L2F6 transendothelial migrations. Interestingly, SPARC-induced L2F6
migration was not affected by the neutralising anti-TGFβ1 or α2β1 integrin antibodies or by CA-074,
suggesting that SPARC-mediated transendothelial migration of melanoma cells is not regulated by
TGFβ1, collagen-I/α2β1 integrin and/or cathepsin B (Figure 5b-c).
DISCUSSION
The rationale for our study was that SPARC, acting within the extracellular milieu, was affecting several
biological pathways that lead to mesenchymal transformation and metastasis. Using a global, proteomic
approach, we demonstrated that SPARC drives a molecular pathway that starts and ends in the
extracellular milieu and induces cathepsin B-dependent invasion of melanoma cells. Indeed, SPARC-
dependent regulation of collagen-I expression and/or deposition acts through α2β1 integrin to promote
cathepsin B secretion, which in turn stimulates cell invasion. In addition, SPARC regulates the expression
of other genes directly involved in EMT such as N-cadherin, vimentin and FAM3C/ILEI. Moreover, SPARC-
induced N-cadherin expression gives melanoma cells the ability to transmigrate through endothelial
cells. Figure 6 summarises the molecular model that we postulate from the data shown in this
manuscript. Data from human tumours support our model i.e., gene expression analysis of metastatic
Page 9 of 71 Journal of Investigative Dermatology
123456789101112131415161718192021222324252627282930313233343536373839404142434445464748495051525354555657585960

For Review O
nly
SPARC and invasiveness in melanoma cells
10
and non-metastatic melanoma patient samples have demonstrated that the SPARC, N-cadherin and
cathepsin B (among other genes) levels correlated with metastasis in human melanoma (Alonso et al
2007).
SPARC has been shown to bind collagen-I and other collagens with high affinity (Giudici et al 2008,
Sasaki et al 1997); however, a functional consequence of this interaction has never been proven directly.
Our findings of a collagen-I-mediated, cathepsin B-dependent invasive capability induced by SPARC
signify the relevance of the SPARC-collagen-I interaction, which until now was obscured. SPARC induces
collagen-I expression (Francki et al 1999, Zhou et al 2006) and modulates fibre formation and
maturation. Accordingly, the collagen content in SPARC-null mouse skin is substantially reduced and has
approximately half the tensile strength as that of wild-type skin (Bradshaw et al 2003). The role of
matrix stiffness in tumour progression has been recently highlighted (Assoian and Klein 2008, Levental
et al 2009), and thus, we can speculate that the SPARC-mediated collagen effects may alter rheological
matrix properties and its ability to transduce signals through integrins. As an alternative, SPARC may
modulate signalling by altering the collagen-I-integrin affinity, as the collagen-I-SPARC binding region
partially overlaps with that of α2β1 integrin (Wang et al 2005).
Cathepsins are upregulated in a wide variety of cancers including melanoma (Mohamed and Sloane
2006). Cathepsin B is usually found at the invasive edges of human tumour biopsy specimens (Roshy et
al 2003). We observed that SPARC essentially affected the extracellular level (and not transcriptional
regulation) of cathepsin B. In invasive melanoma, collagen-I increased cathepsin B release in a β1
integrin-dependent manner, without affecting cathepsin B transcription (Klose et al 2006). A similar
effect was described in human breast fibroblasts (Koblinski et al 2002). Glioblastoma spheroids in a
collagen-I matrix also exhibited increased cathepsin B activity with no transcriptional or translational
changes (Gole et al 2009). Thus, SPARC probably regulates cathepsin B secretion (and not the
expression) for promoting melanoma invasiveness.
The absence of cathepsin B mature forms in the extracellular milieu has been described for other cell
lines (Giusti et al 2008, Keppler et al 1994, Koblinski et al 2002, Linebaugh et al 1999). It has been argued
Page 10 of 71Journal of Investigative Dermatology
123456789101112131415161718192021222324252627282930313233343536373839404142434445464748495051525354555657585960

For Review O
nly
SPARC and invasiveness in melanoma cells
11
that the presence of extracellular fully active cathepsin B may be deleterious for cells and tissues in the
immediate vicinity (Linebaugh et al 1999) and others). We postulate that procathepsin B maturation in
our melanoma cell lines may be physiologically controlled by local conditions, e.g., differential pH
gradients at the leading edge of invasion.
SPARC and TFGβ1 have reciprocal activation effects (Bassuk et al 2000, Francki et al 1999, Reed et al
1994, Schiemann et al 2003), and TGFβ1 is a major effector of EMT (Wendt et al 2009). TGFβ1 has also
been shown to upregulate cathepsin B expression (Reisenauer et al 2007). However, the effect of SPARC
on invasiveness could only be partially inhibited by anti-TGFβ1 antibodies or its receptor inhibitor
SB431545. Moreover, the restoration of melanoma invasiveness by TGFβ1 following SPARC
downregulation was completely inhibited by neutralising anti-SPARC antibodies. These results indicate
that TGFβ1-induced, cathepsin B-mediated invasiveness is attributed to its effect on SPARC expression.
Conversely, SPARC-induced TGFβ1 only partially affects invasiveness as indicated by our TGFβ1
antagonist results.
This study, along with previous reports (Robert et al 2006, Smit et al 2007, Sosa et al 2007) confirm that
SPARC is an important regulator of the E- to N-cadherin switch. As it is known that collagen-I
upregulates N-cadherin expression (Shintani et al 2008), we tested whether the SPARC-mediated
collagen I effects were also involved in N-cadherin dependent transendothelial migration of melanoma
cells. Our results suggest that intravasation occurs independently of collagen-I or α2β1integrins.
Moreover, these results also demonstrate that TGFβ1 does not mediate the SPARC effect on
intravasation. Our results underscore the relevance of SPARC as a TGFβ1-independent inducer of EMT
and suggest that an extracellular balance between SPARC and TGFβ1 may be ultimately responsible for
tumour progression.
Page 11 of 71 Journal of Investigative Dermatology
123456789101112131415161718192021222324252627282930313233343536373839404142434445464748495051525354555657585960

For Review O
nly
SPARC and invasiveness in melanoma cells
12
MATERIALS AND METHODS
Cell Culture
Melanoma cell lines and the clones LBLAST, L2F6, A375 (called AW in the Figures), AE and AC3 were
grown in DMEM/F12 supplemented with 10% (v/v) foetal bovine serum and antibiotics. Cultures were
maintained at 37°C, 5% CO2 in a humidified incubator. Detailed siRNA-related procedures are provided
in the Supplemental Materials and Methods section.
Immunoblotting analysis
Cells were seeded at 80% confluence in 150 mm-plates, grown for 24 h, washed three times with PBS
and incubated in serum-free medium for an additional 24 hr. Conditioned media were collected into a
protease inhibitor cocktail, cleared and concentrated 30-fold using a Centriprep-3 (Millipore, Billerica,
MA). The concentrated media were quantified by 2D-Quant Kit (GE Healthcare, Waukesha, WI), and a
fixed amount of total protein (generally 5 µg) was loaded into an SDS-PAGE gel. The proteins were
separated in a 12% SDS-polyacrylamide gel and transferred to nitrocellulose membranes. Uniform
loading was verified with a gel run in parallel and stained with SYPRO Ruby (Sigma, St Louis MO) and
rechecked by staining the membrane with Ponceau S Red. The membranes were incubated in
appropriate dilutions of each primary and secondary antibody (see Supplemental Materials and
Methods for details) and detected using ECL-Plus (GE Healthcare). Images were quantified using Image J
(Rasband WS. Image J). Values were normalised according to the total protein loading.
Invasion assays
Melanoma cell invasion assays were performed in a 48-well chemotaxis chamber (Neuro Probe Inc.,
Gaithersburg, MD) with an 8 µm-pore membrane pretreated with 0.5 mg/ml Matrigel (BD Biosciences,
Mountain View, CA). After 5 h, the cells were fixed and stained with Hoechst; images of 70% of each well
were captured under 100X magnification using a BX-60 Olympus fluorescent microscope and counted
with Cell Profiler (www.cellprofiler.com) (Carpenter et al 2006). Results were expressed as the
percentages of invading cells with respect to their corresponding controls (100%, see figures).
Page 12 of 71Journal of Investigative Dermatology
123456789101112131415161718192021222324252627282930313233343536373839404142434445464748495051525354555657585960

For Review O
nly
SPARC and invasiveness in melanoma cells
13
To study substrate-dependent differences in invasiveness, monomeric collagen-I (Sigma) or fibronectin
(BD Biosciences) coatings were prepared by incubating the culture dishes with 5 µg/cm2 collagen or
fibronectin at 4°C overnight. LBLAST and L2F6 cells were grown for 24 h on either uncoated or collagen
or fibronectin-coated dishes (> 90% cells attached to all substrates after 12 h). The cells were then
detached from the plate using EDTA and loaded into the invasion chamber.
For blocking experiments, cells were incubated 24 h in blocking concentrations of different antibodies
(details provided in the Supplemental Materials and Methods) in the presence or absence of SPARC. For
inhibition of TGFβ1 receptors, 10 µM SB431542 (Sigma) was added. For TGFβ1 reversion assays, cells
were previously incubated for 24 h with rhTGF-β 1 ng/ml (40 pM, PeproTech Inc., Rocky Hill, NJ).
Transendothelial migration assays
Human dermal microvascular endothelial cell (HDMEC) monolayers were assembled on 8.0 µm-pore size
PET-covered inserts (BD Biosciences). Cells were labelled with the fluorescent dye CM-DiI (Invitrogen,
Carlsbad, CA). Inserts were placed in 24-well plates containing DMEM, 10% FBS. Cocultures were fixed
after 6 h and stained with Hoechst. The cell number was counted in 8 sets of random fields for a total of
14 using a BX-60 Olympus fluorescent microscope (total magnification 100X), and red-negative nuclei
(endothelial cells) were subtracted. Results were expressed as the percentages of migrating cells with
respect to the control (100%).
For the inhibition studies, melanoma cells were preincubated with anti-N-cadherin antibody GC4 (A-
CAM, clone GC-4; Sigma), anti-α2- or β1-integrin, anti-TGFβ1 or control antibodies for 30 min at 4°C
before addition to the HDMEC monolayer (see Supplemental Materials and Methods for details).
Statistics
Page 13 of 71 Journal of Investigative Dermatology
123456789101112131415161718192021222324252627282930313233343536373839404142434445464748495051525354555657585960

For Review O
nly
SPARC and invasiveness in melanoma cells
14
For discrete variables such as the cell number in invasion and transmigration assays, the log of the cell
count was tested using generalised linear models (West et al 2007) with or without covariance
structure. Further details are included in the Supplemental Materials and Methods section.
Other methods
Further information about the materials and methods used in this work are provided in the
Supplemental Materials and Methods section.
CONFLICT OF INTEREST
The authors state no conflict of interest.
ACKNOWLEDGMENTS
This work was supported by grants from the ANPCYT-PICT 2007-0677 (to ASL) and PICT 2003-14290 (to
ASL and OLP), University of Buenos Aires-UBACYT 2004-2007 X-145 (to ASL) and CONICET-PIP 2009-2011
112-200801-03136 (to ASL).
We acknowledge the support of Fundación René Barón and AFULIC. MRG was a CONICET fellow and
received travel support from the Fundación Bunge y Born, ICRETT Fellowship, Journal of Cell Science and
Boehringer Ingelheim Fonds. LGB and MPV are CONICET fellows, and ASL, EF and OLP are CONICET
researchers. CNIC is supported by the Ministerio de Ciencia e Innovación and Fundación Pro CNIC.
Page 14 of 71Journal of Investigative Dermatology
123456789101112131415161718192021222324252627282930313233343536373839404142434445464748495051525354555657585960

For Review O
nly
SPARC and invasiveness in melanoma cells
15
REFERENCES
Alonso SR, Tracey L, Ortiz P, Perez-Gomez B, Palacios J, Pollan M et al (2007). A high-throughput study in
melanoma identifies epithelial-mesenchymal transition as a major determinant of metastasis. Cancer
Res 67: 3450-3460.
Alvarez MJ, Prada F, Salvatierra E, Bravo AI, Lutzky VP, Carbone C et al (2005). Secreted protein acidic
and rich in cysteine produced by human melanoma cells modulates polymorphonuclear leukocyte
recruitment and antitumor cytotoxic capacity. Cancer Res 65: 5123-5132.
Assoian RK, Klein EA (2008). Growth control by intracellular tension and extracellular stiffness. Trends
Cell Biol 18: 347-352.
Bassuk JA, Pichler R, Rothmier JD, Pippen J, Gordon K, Meek RL et al (2000). Induction of TGF-beta1 by
the matricellular protein SPARC in a rat model of glomerulonephritis. Kidney Int 57: 117-128.
Benjamini Y, Drai D, Elmer G, Kafkafi N, Golani I (2001). Controlling the false discovery rate in behavior
genetics research. Behav Brain Res 125: 279-284.
Bradshaw AD, Sage EH (2001). SPARC, a matricellular protein that functions in cellular differentiation
and tissue response to injury. J Clin Invest 107: 1049-1054.
Bradshaw AD, Puolakkainen P, Dasgupta J, Davidson JM, Wight TN, Helene Sage E (2003). SPARC-null
mice display abnormalities in the dermis characterized by decreased collagen fibril diameter and
reduced tensile strength. J Invest Dermatol 120: 949-955.
Brekken RA, Sage EH (2001). SPARC, a matricellular protein: at the crossroads of cell-matrix
communication. Matrix Biol 19: 816-827.
Page 15 of 71 Journal of Investigative Dermatology
123456789101112131415161718192021222324252627282930313233343536373839404142434445464748495051525354555657585960

For Review O
nly
SPARC and invasiveness in melanoma cells
16
Carpenter AE, Jones TR, Lamprecht MR, Clarke C, Kang IH, Friman O et al (2006). CellProfiler: image
analysis software for identifying and quantifying cell phenotypes. Genome Biol 7: R100.
Egeblad M, Rasch MG, Weaver VM (2010). Dynamic interplay between the collagen scaffold and tumor
evolution. Curr Opin Cell Biol 22: 697-706.
Fenouille N, Robert G, Tichet M, Puissant A, Dufies M, Rocchi S et al (2011). The p53/p21Cip1/ Waf1
pathway mediates the effects of SPARC on melanoma cell cycle progression. Pigment Cell Melanoma Res
24: 219-232.
Francki A, Bradshaw AD, Bassuk JA, Howe CC, Couser WG, Sage EH (1999). SPARC regulates the
expression of collagen type I and transforming growth factor-beta1 in mesangial cells. J Biol Chem 274:
32145-32152.
Giudici C, Raynal N, Wiedemann H, Cabral WA, Marini JC, Timpl R et al (2008). Mapping of SPARC/BM-
40/osteonectin-binding sites on fibrillar collagens. J Biol Chem 283: 19551-19560.
Giusti I, D'Ascenzo S, Millimaggi D, Taraboletti G, Carta G, Franceschini N et al (2008). Cathepsin B
mediates the pH-dependent proinvasive activity of tumor-shed microvesicles. Neoplasia 10: 481-488.
Gole B, Duran Alonso MB, Dolenc V, Lah T (2009). Post-translational regulation of cathepsin B, but not of
other cysteine cathepsins, contributes to increased glioblastoma cell invasiveness in vitro. Pathol Oncol
Res 15: 711-723.
Golembieski WA, Ge S, Nelson K, Mikkelsen T, Rempel SA (1999). Increased SPARC expression promotes
U87 glioblastoma invasion in vitro. Int J Dev Neurosci 17: 463-472.
Page 16 of 71Journal of Investigative Dermatology
123456789101112131415161718192021222324252627282930313233343536373839404142434445464748495051525354555657585960

For Review O
nly
SPARC and invasiveness in melanoma cells
17
Haber CL, Gottifredi V, Llera AS, Salvatierra E, Prada F, Alonso L et al (2008). SPARC modulates the
proliferation of stromal but not melanoma cells unless endogenous SPARC expression is downregulated.
Int J Cancer 122: 1465-1475.
Huang da W, Sherman BT, Tan Q, Kir J, Liu D, Bryant D et al (2007). DAVID Bioinformatics Resources:
expanded annotation database and novel algorithms to better extract biology from large gene lists.
Nucleic Acids Res 35: W169-175.
Huang da W, Sherman BT, Lempicki RA (2009). Systematic and integrative analysis of large gene lists
using DAVID bioinformatics resources. Nat Protoc 4: 44-57.
Hulkower KI, Butler CC, Linebaugh BE, Klaus JL, Keppler D, Giranda VL et al (2000). Fluorescent
microplate assay for cancer cell-associated cathepsin B. Eur J Biochem 267: 4165-4170.
Keppler D, Waridel P, Abrahamson M, Bachmann D, Berdoz J, Sordat B (1994). Latency of cathepsin B
secreted by human colon carcinoma cells is not linked to secretion of cystatin C and is relieved by
neutrophil elastase. Biochim Biophys Acta 1226: 117-125.
Klose A, Wilbrand-Hennes A, Zigrino P, Weber E, Krieg T, Mauch C et al (2006). Contact of high-invasive,
but not low-invasive, melanoma cells to native collagen I induces the release of mature cathepsin B. Int J
Cancer 118: 2735-2743.
Koblinski JE, Dosescu J, Sameni M, Moin K, Clark K, Sloane BF (2002). Interaction of human breast
fibroblasts with collagen I increases secretion of procathepsin B. J Biol Chem 277: 32220-32227.
Laping NJ, Grygielko E, Mathur A, Butter S, Bomberger J, Tweed C et al (2002). Inhibition of Transforming
Growth Factor (TGF)-beta 1-Induced Extracellular Matrix with a Novel Inhibitor of the TGF-beta Type I
Receptor Kinase Activity: SB-431542. Mol Pharmacol 62: 58-64.
Page 17 of 71 Journal of Investigative Dermatology
123456789101112131415161718192021222324252627282930313233343536373839404142434445464748495051525354555657585960
For Review O
nly
SPARC and invasiveness in melanoma cells
18
Ledda F, Bravo AI, Adris S, Bover L, Mordoh J, Podhajcer OL (1997a). The expression of the secreted
protein acidic and rich in cysteine (SPARC) is associated with the neoplastic progression of human
melanoma. J Invest Dermatol 108: 210-214.
Ledda MF, Adris S, Bravo AI, Kairiyama C, Bover L, Chernajovsky Y et al (1997b). Suppression of SPARC
expression by antisense RNA abrogates the tumorigenicity of human melanoma cells. Nat Med 3: 171-
176.
Lee EO, Kang JL, Chong YH (2005). The amyloid-beta peptide suppresses transforming growth factor-
beta1-induced matrix metalloproteinase-2 production via Smad7 expression in human monocytic THP-1
cells. J Biol Chem 280: 7845-7853.
Levental KR, Yu H, Kass L, Lakins JN, Egeblad M, Erler JT et al (2009). Matrix crosslinking forces tumor
progression by enhancing integrin signaling. Cell 139: 891-906.
Li G, Herlyn M (2000). Dynamics of intercellular communication during melanoma development. Mol
Med Today 6: 163-169.
Lien HC, Hsiao YH, Lin YS, Yao YT, Juan HF, Kuo WH et al (2007). Molecular signatures of metaplastic
carcinoma of the breast by large-scale transcriptional profiling: identification of genes potentially
related to epithelial-mesenchymal transition. Oncogene 26: 7859-7871.
Linebaugh BE, Sameni M, Day NA, Sloane BF, Keppler D (1999). Exocytosis of active cathepsin B enzyme
activity at pH 7.0, inhibition and molecular mass. Eur J Biochem 264: 100-109.
Mack GS, Marshall A (2010). Lost in migration. Nat Biotechnol 28: 214-229.
Massi D, Franchi A, Borgognoni L, Reali UM, Santucci M (1999). Osteonectin expression correlates with
clinical outcome in thin cutaneous malignant melanomas. Hum Pathol 30: 339-344.
Page 18 of 71Journal of Investigative Dermatology
123456789101112131415161718192021222324252627282930313233343536373839404142434445464748495051525354555657585960

For Review O
nly
SPARC and invasiveness in melanoma cells
19
Mi H, Guo N, Kejariwal A, Thomas PD (2007). PANTHER version 6: protein sequence and function
evolution data with expanded representation of biological pathways. Nucleic Acids Res 35: D247-252.
Mohamed MM, Sloane BF (2006). Cysteine cathepsins: multifunctional enzymes in cancer. Nat Rev
Cancer 6: 764-775.
Moreno-Bueno G, Peinado H, Molina P, Olmeda D, Cubillo E, Santos V et al (2009). The morphological
and molecular features of the epithelial-to-mesenchymal transition. Nat Protoc 4: 1591-1613.
Nie J, Chang B, Traktuev DO, Sun J, March K, Chan L et al (2008). IFATS collection: Combinatorial
peptides identify alpha5beta1 integrin as a receptor for the matricellular protein SPARC on adipose
stromal cells. Stem Cells 26: 2735-2745.
Perkins DN, Pappin DJ, Creasy DM, Cottrell JS (1999). Probability-based protein identification by
searching sequence databases using mass spectrometry data. Electrophoresis 20: 3551-3567.
Podhajcer OL, Benedetti LG, Girotti MR, Prada F, Salvatierra E, Llera AS (2008). The role of the
matricellular protein SPARC in the dynamic interaction between the tumor and the host. Cancer
Metastasis Rev 27: 691-705.
Prada F, Benedetti LG, Bravo AI, Alvarez MJ, Carbone C, Podhajcer OL (2007). SPARC endogenous level,
rather than fibroblast-produced SPARC or stroma reorganization induced by SPARC, is responsible for
melanoma cell growth. J Invest Dermatol 127: 2618-2628.
Reed MJ, Vernon RB, Abrass IB, Sage EH (1994). TGF-beta 1 induces the expression of type I collagen and
SPARC, and enhances contraction of collagen gels, by fibroblasts from young and aged donors. J Cell
Physiol 158: 169-179.
Page 19 of 71 Journal of Investigative Dermatology
123456789101112131415161718192021222324252627282930313233343536373839404142434445464748495051525354555657585960

For Review O
nly
SPARC and invasiveness in melanoma cells
20
Reisenauer A, Eickelberg O, Wille A, Heimburg A, Reinhold A, Sloane BF et al (2007). Increased
carcinogenic potential of myeloid tumor cells induced by aberrant TGF-beta1-signaling and upregulation
of cathepsin B. Biol Chem 388: 639-650.
Robert G, Gaggioli C, Bailet O, Chavey C, Abbe P, Aberdam E et al (2006). SPARC represses E-cadherin
and induces mesenchymal transition during melanoma development. Cancer Res 66: 7516-7523.
Roshy S, Sloane BF, Moin K (2003). Pericellular cathepsin B and malignant progression. Cancer
Metastasis Rev 22: 271-286.
Sasaki T, Gohring W, Mann K, Maurer P, Hohenester E, Knauper V et al (1997). Limited cleavage of
extracellular matrix protein BM-40 by matrix metalloproteinases increases its affinity for collagens. J Biol
Chem 272: 9237-9243.
Schiemann BJ, Neil JR, Schiemann WP (2003). SPARC inhibits epithelial cell proliferation in part through
stimulation of the transforming growth factor-beta-signaling system. Mol Biol Cell 14: 3977-3988.
Schultz C, Lemke N, Ge S, Golembieski WA, Rempel SA (2002). Secreted protein acidic and rich in
cysteine promotes glioma invasion and delays tumor growth in vivo. Cancer Research 62: 6270-6277.
Shevchenko A, Tomas H, Havlis J, Olsen JV, Mann M (2006). In-gel digestion for mass spectrometric
characterization of proteins and proteomes. Nat Protoc 1: 2856-2860.
Shi Q, Bao S, Song L, Wu Q, Bigner DD, Hjelmeland AB et al (2007). Targeting SPARC expression
decreases glioma cellular survival and invasion associated with reduced activities of FAK and ILK kinases.
Oncogene 26: 4084-4094.
Page 20 of 71Journal of Investigative Dermatology
123456789101112131415161718192021222324252627282930313233343536373839404142434445464748495051525354555657585960

For Review O
nly
SPARC and invasiveness in melanoma cells
21
Shintani Y, Fukumoto Y, Chaika N, Svoboda R, Wheelock MJ, Johnson KR (2008). Collagen I-mediated up-
regulation of N-cadherin requires cooperative signals from integrins and discoidin domain receptor 1. J
Cell Biol 180: 1277-1289.
Smit DJ, Gardiner BB, Sturm RA (2007). Osteonectin downregulates E-cadherin, induces osteopontin and
focal adhesion kinase activity stimulating an invasive melanoma phenotype. Int J Cancer 121: 2653-
2660.
Sosa MS, Girotti MR, Salvatierra E, Prada F, de Olmo JA, Gallango SJ et al (2007). Proteomic analysis
identified N-cadherin, clusterin, and HSP27 as mediators of SPARC (secreted protein, acidic and rich in
cysteines) activity in melanoma cells. Proteomics 7: 4123-4134.
Suckau D, Resemann A, Schuerenberg M, Hufnagel P, Franzen J, Holle A (2003). A novel MALDI LIFT-
TOF/TOF mass spectrometer for proteomics. Anal Bioanal Chem 376: 952-965.
Sweetwyne MT, Brekken RA, Workman G, Bradshaw AD, Carbon J, Siadak AW et al (2004). Functional
analysis of the matricellular protein SPARC with novel monoclonal antibodies. J Histochem Cytochem 52:
723-733.
Thiery JP, Acloque H, Huang RY, Nieto MA (2009). Epithelial-mesenchymal transitions in development
and disease. Cell 139: 871-890.
Thomas PD, Campbell MJ, Kejariwal A, Mi H, Karlak B, Daverman R et al (2003a). PANTHER: a library of
protein families and subfamilies indexed by function. Genome Res 13: 2129-2141.
Thomas PD, Kejariwal A, Campbell MJ, Mi H, Diemer K, Guo N et al (2003b). PANTHER: a browsable
database of gene products organized by biological function, using curated protein family and subfamily
classification. Nucleic Acids Res 31: 334-341.
Page 21 of 71 Journal of Investigative Dermatology
123456789101112131415161718192021222324252627282930313233343536373839404142434445464748495051525354555657585960

For Review O
nly
SPARC and invasiveness in melanoma cells
22
Thomas SL, Alam R, Lemke N, Schultz LR, Gutierrez JA, Rempel SA (2010). PTEN augments SPARC
suppression of proliferation and inhibits SPARC-induced migration by suppressing SHC-RAF-ERK and AKT
signaling. Neuro Oncol 12: 941-955.
Tiscornia G, Singer O, Verma IM (2006). Production and purification of lentiviral vectors. Nat Protoc 1:
241-245.
Tsao H, Atkins MB, Sober AJ (2004). Management of cutaneous melanoma. N Engl J Med 351: 998-1012.
Turk D, Podobnik M, Popovic T, Katunuma N, Bode W, Huber R et al (1995). Crystal structure of
cathepsin B inhibited with CA030 at 2.0-A resolution: A basis for the design of specific epoxysuccinyl
inhibitors. Biochemistry 34: 4791-4797.
Wang H, Fertala A, Ratner BD, Sage EH, Jiang S (2005). Identifying the SPARC Binding Sites on Collagen I
and Procollagen I by Atomic Force Microscopy. Anal Chem 77: 6765-6771.
Weaver MS, Workman GA, Sage EH (2008). The copper-binding domain of sparc mediates cell survival in
vitro via interaction with integrin beta 1 and activation of integrin-linked kinase. J Biol Chem 23: 23.
Wendt MK, Allington TM, Schiemann WP (2009). Mechanisms of the epithelial-mesenchymal transition
by TGF-beta. Future Oncol 5: 1145-1168.
West BT, Welch KB, Gatecki AT (2007). Linear Mixed Models: A practical guide using statistical software
Boca Raton, USA: Chapman & Hall/CRC Press.
Zhou X, Tan FK, Guo X, Arnett FC (2006). Attenuation of collagen production with small interfering RNA
of SPARC in cultured fibroblasts from the skin of patients with scleroderma. Arthritis Rheum 54: 2626-
2631.
Page 22 of 71Journal of Investigative Dermatology
123456789101112131415161718192021222324252627282930313233343536373839404142434445464748495051525354555657585960

For Review O
nly
SPARC and invasiveness in melanoma cells
23
FIGURE LEGENDS
Figure 1. Validation of SPARC-induced changes in extracellular proteins in melanoma cells.
(a-c) Immunoblotting and immunostaining confirm that SPARC downregulation decreases extracellular
proteases and EMT-related proteins. Different conditioned media from control LBLAST (LB) and SPARC-
deficient L2F6 (L2) cells were labelled a, b or c. The optical density of bands were normalised to SYPRO
Ruby-stained loading control intensities and expressed either as single relative percentages or the
mean-±-SEM (n=3; *,-p<0.05). Small L2 experimental tumours, contrary to LB tumours, show an absence
of positive vimentin or cathepsin B staining. Bar=100 µm. Inset: 2X-enlarged image. Arrows indicate
tumour cells. (d) A lower cathepsin B enzymatic activity in L2 cells correlates with decreased cathepsin B
levels (**,-p<0.01). (e) The addition of SPARC reverts cathepsin B deficiency in L2 cells.
Figure 2. SPARC-dependent cathepsin B effect on melanoma cell invasion.
(a). Matrigel-invading LBLAST (LB) and L2F6 (L2) cells (blue nuclei)-+/--SPARC (SP) and/or the cathepsin B
inhibitor CA-074. Bar=100 µm. (b). Invading cells (% of control LB cells) +/- CA-074 or anti-SPARC
antibodies (ANTI-SP). Error bars = mean-±-SEM (n=3). **, p<0.001 and *, p<0.05 both with respect to LB;
###, p<0.001 with respect to L2; <<<,-p<0.001 with respect to LB-SP; +++,-p<0.001 with respect to L2-SP.
SPARC mRNA (c), protein (d) and extracellular cathepsin B (e) in clone A3, which expresses SPARC
shRNA, with respect to A375 wild-type cells (AW) and control (empty vector) cells (AE). (f) Invading cells
(% of control AE cells),-+/--CA-074. Error bars = mean-±-SEM (n=3). ***, p<0.001 with respect to AE.
Figure 3. Effects of collagen I on LBLAST (LB) and L2F6 (L2) cell invasion.
(a). Real-time PCR for collagen I α2 chain in LB and L2 cells. *,-p<0.05, ***,-p<0.001 with respect to LB.
(b). Invasiveness after plating on collagen I or fibronectin with or without SPARC and/or CA-074. Error
bars =-mean-±-SEM (n=3). ***,-p<0.001 with respect to LB in plastic, collagen or fibronectin; ##,-p<0.01
with respect to L2; ^^^,-p<0.001 with respect to L2-SP. (c). A representative immunoblot of secreted
procathepsin B after treatment with SPARC and/or collagen I. Numbers represent normalised band
Page 23 of 71 Journal of Investigative Dermatology
123456789101112131415161718192021222324252627282930313233343536373839404142434445464748495051525354555657585960

For Review O
nly
SPARC and invasiveness in melanoma cells
24
intensities. (d). Invasiveness after treatment with anti-α2β1 integrin or control (MOPC) antibodies, in
the presence of SPARC, collagen I and/or CA-074. Error bars = mean-±-SEM (n=3). ***,-p<0.001 with
respect to its corresponding MOPC control.
Figure 4. TGFββββ1 effects on melanoma cell invasion.
Anti-TGFβ1 antibodies (a) or TGFβ1-receptor inhibitor SB-431542 (b) partially inhibited the SPARC-
dependent invasiveness of LBLAST (LB) and L2F6 (L2) cells preincubated with SPARC, but it did not alter
the collagen I effect. (c). Anti-SPARC antibodies supersede the anti-TGFβ1 antibody effect on SPARC-
dependent LB and L2 cell invasiveness. (d). TGFβ1 induces L2 cell invasion; however, this effect is
completely abolished by anti-SPARC antibodies. Error bars = mean-±-SEM (n=3). *, p<0.05 with respect
to LB-MOPC or LB-DMSO; ***, p<0.001 with respect to LB-MOPC; #, p<0.05 with respect to L2-SPARC-
MOPC or L2-SPARC-DMSO; ###, p<0.001 with respect to L2-SPARC-MOPC; ^, p<0.05 with respect to the
corresponding cell line plated on collagen I and MOPC-treated; +++, p<0.001 with respect to L2-MOPC.
Figure 5. N-cadherin effect on transendothelial migration of melanoma cells.
(a). Flow cytometry analysis of E-cadherin and N-cadherin in LBLAST (LB) or L2F6 (L2) cells in the
presence or absence of SPARC (SP). Cell populations expressing high (+) and low (-) levels of cadherins
are indicated. (b). Representative images of a transmigration assay. Blue nuclei represent total cells, and
the red cytoplasm corresponds to migrated cells. Top right, a HDMEC cell monolayer is shown. aNCAD:
anti-N-cadherin antibody. Bar=100 µm. (c). Cells (% of control) that transmigrated in the presence or
absence of SPARC, CA-074, anti-N-cadherin (anti-NCAD), anti-TGFβ1, anti-α2β1 integrin (α2β1-INT)
and/or control (MOPC ) antibodies. Error bar = mean-±-SEM (n=3). ***,-p<0.001 with respect to LB;
###,-p<0.001 with respect to L2; ^^,-p<0.01 with respect to L2-SP.
Figure 6. Proposed model for the SPARC tumour progression effect.
Page 24 of 71Journal of Investigative Dermatology
123456789101112131415161718192021222324252627282930313233343536373839404142434445464748495051525354555657585960

For Review O
nly
SPARC and invasiveness in melanoma cells
25
SPARC acts as a driver of a cathepsin B-mediated pro-invasive axis that involves TGFβ1 and collagen type
I/α2β1 integrin as mediators. Engagement of integrins by SPARC-derived collagen I might affect
trafficking of endocytic compartments, forcing accumulation of procathepsin B in pericellular locations
from where it could be secreted in local favourable conditions. SPARC also promotes the E- to N-
cadherin shift that enhances transendothelial migration of melanoma cells through a mechanism not
linked to TGFβ1 and collagen type I/integrin α2β1. This cadherin switch favours the establishment of N-
cadherin homotypic contacts with fibroblasts and endothelial cells, enabling malignant cells to enter the
bloodstream, travelling away from the primary tumour and disseminating to establish new metastatic
foci.
Page 25 of 71 Journal of Investigative Dermatology
123456789101112131415161718192021222324252627282930313233343536373839404142434445464748495051525354555657585960

For Review O
nly
SPARC and invasiveness in melanoma cells
1
SUPPLEMENTAL INFORMATION
SPARC promotes cathepsin B‐mediated melanoma invasiveness through
a collagen I/α2β1 integrin axis.
María Romina Girotti, Marisol Fernández Rodríguez, Juan Antonio López, Emilio Camafeita, Elmer
Fernández, Juan Pablo Albar, Lorena Gabriela Benedetti, María Pía Valacco, Rolf Brekken, Osvaldo Luis
Podhajcer, and Andrea Sabina Llera.
Supplemental Figures and Table
Page 26 of 71Journal of Investigative Dermatology
123456789101112131415161718192021222324252627282930313233343536373839404142434445464748495051525354555657585960

For Review O
nly
SPARC and invasiveness in melanoma cells
2
Figure S1. Heatmaps of MALDI‐identified, differentially expressed proteins for each DIGE experiment.
Clustering analysis of samples according to their expression differences is shown as a heatmap. The
colour key and histogram trace (top left) depict a colour representation of mean centred and scaled
expression values on the heatmap. The columns represent the samples analysed, and the rows
represent the NCBI GI accession number of the identified proteins. All control (LBLAST) replicas
clustered together as well as all treatment (L2F6) replicas.
Page 27 of 71 Journal of Investigative Dermatology
123456789101112131415161718192021222324252627282930313233343536373839404142434445464748495051525354555657585960

For Review O
nly
SPARC and invasiveness in melanoma cells
3
Figure S2. Differential protein expression analysis of secretome from LBLAST and L2F6 melanoma cells
by DIGE
(a) Ontological analysis of secreted differential proteins using PANTHER (Protein ANalysis THrough
Evolutionary Relationships). A pie chart shows the categorisation of the secretome differential data set
(71 proteins) into the molecular function categories listed in the left column.
(b) Ontological analysis of secreted differential proteins using David (Database for Annotation,
Visualisation and Integrated Discovery). The most abundant categories obtained by PANTHER analysis,
i.e., proteins involved in proteolysis, are detailed along with their associated GO terms.
Page 28 of 71Journal of Investigative Dermatology
123456789101112131415161718192021222324252627282930313233343536373839404142434445464748495051525354555657585960

For Review O
nly
SPARC and invasiveness in melanoma cells
4
Figure S3. Analysis of cathepsin B cellular levels in LBLAST and L2F6 cells.
(a) Multiple cathepsin B differential spots in DIGE experiment 2 (pH range = 4 to 7) are depicted in eight
panels. Each panel shows LBLAST (left) vs. L2F6 (right) master gel zoomed images in which a cathepsin B
spot is marked. Variations are in the range of size and pI, suggesting that they belong to products of
proteolysis and/or differences in posttranslational modifications.
(b) Real‐time PCR analysis of transcript levels of cathepsin B in LBLAST (LB) and L2F6 (L2) melanoma cells
cultured in the presence or absence of 30 nM SPARC. Statistical analysis was performed by ANOVA.
*, p < 0.05 with respect to LBLAST.
(c) A representative immunoblot of the cathepsin B forms present in cell extracts from melanoma cells
cultured in the presence or absence of 30 nM SPARC. Both procathepsin and cathepsin mature forms
are detectable. Actin expression levels were used as loading control.
Page 29 of 71 Journal of Investigative Dermatology
123456789101112131415161718192021222324252627282930313233343536373839404142434445464748495051525354555657585960
For Review O
nly
SPARC and invasiveness in melanoma cells
5
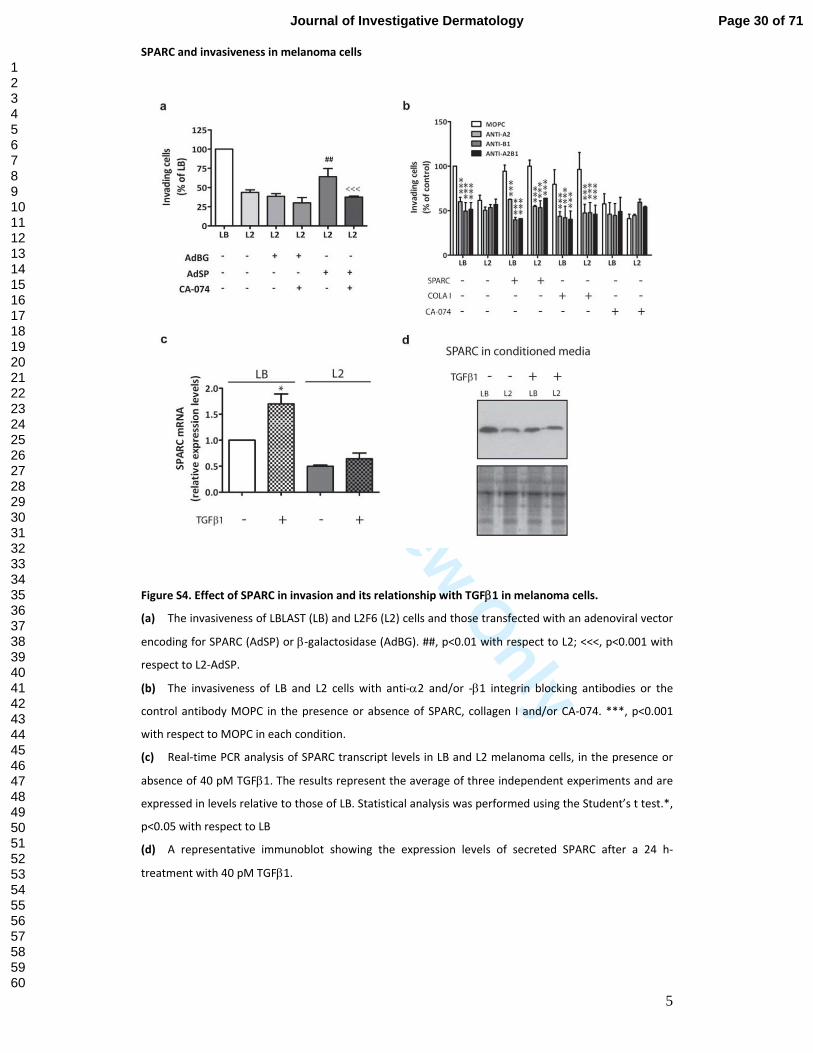
Figure S4. Effect of SPARC in invasion and its relationship with TGFβ1 in melanoma cells.
(a) The invasiveness of LBLAST (LB) and L2F6 (L2) cells and those transfected with an adenoviral vector
encoding for SPARC (AdSP) or β‐galactosidase (AdBG). ##, p<0.01 with respect to L2; <<<, p<0.001 with
respect to L2‐AdSP.
(b) The invasiveness of LB and L2 cells with anti‐α2 and/or ‐β1 integrin blocking antibodies or the
control antibody MOPC in the presence or absence of SPARC, collagen I and/or CA‐074. ***, p<0.001
with respect to MOPC in each condition.
(c) Real‐time PCR analysis of SPARC transcript levels in LB and L2 melanoma cells, in the presence or
absence of 40 pM TGFβ1. The results represent the average of three independent experiments and are
expressed in levels relative to those of LB. Statistical analysis was performed using the Student’s t test.*,
p<0.05 with respect to LB
(d) A representative immunoblot showing the expression levels of secreted SPARC after a 24 h‐
treatment with 40 pM TGFβ1.
Page 30 of 71Journal of Investigative Dermatology
123456789101112131415161718192021222324252627282930313233343536373839404142434445464748495051525354555657585960

For Review Only
Supplemental Table IMALDI-TOF/TOF identification of proteins with significant changes in levels in secretomes of LBLAST and L2F6 cells
Sample name a
Experiment number b
Accession code (NCBI) c Protein description
Decyder P value (T‐test)
Average ratio d MASCOT score Ion score e
Theoretical MW (Da) Theoretical pI % coverage f
1704 1 11596467 MHC class I antigen 8.9E‐03 ‐4.5 115 N 31776 5.6 351764 1 1418930 Type I collagen alpha 2 chain 1.9E‐03 ‐4.3 117 73 37887 6.1 201532 2 32451581 Type I collagen alpha 2 chain 6.1E‐03 ‐4.1 93 79 20373 5.5 71052 2 337347 Renin 1.2E‐02 ‐4.0 166 N 45097 7.6 252550 1 253483 N‐cadherin 4.7E‐03 ‐3.7 134 73 100132 4.6 61805 1 553801 Thrombospondin chain A 1.1E‐02 ‐3.6 191 N 22972 7.0 401064 2 337347 Renin 1.1E‐03 ‐3.6 158 N 37000 5.1 281592 2 32451581 Type I collagen alpha 2 chain 2.4E‐02 ‐3.5 103 89 20373 5.5 71148 2 4507171 Secreted protein, acidic, cysteine‐rich (SPARC) 1.9E‐02 ‐3.5 158 N 35465 4.5 171233 2 55956899 Cytokeratin 9 1.0E‐03 ‐3.2 114 85 62320 5.2 71288 1 54311156 Renin 2.0E‐02 ‐3.0 108 N 45097 7.6 141316 1 54311156 Renin 4.2E‐02 ‐2.9 75 N 45097 7.6 91657 2 553801 Thrombospondin 1 chain A 1.1E‐03 ‐2.9 111 N 22972 7.0 411885 2 5453549 peroxiredoxin 4 8.3E‐04 ‐2.8 119 63 30749 5.9 121034 2 337347 Renin 1.0E‐02 ‐2.8 164 22 45097 7.6 111053 2 337347 Renin 6.5E‐03 ‐2.8 140 N 45097 7.6 281227 2 15214962 cathepsin L , preproprotein 8.0E‐04 ‐2.7 90 50 37996 5.3 91056 2 337347 Renin 2.8E‐02 ‐2.7 134 N 45097 7.6 301567 2 553801 Thrombospondin 1, chain A 1.2E‐02 ‐2.6 100 42 22972 7.0 192265 1 3334194 Protein FAM3C precursor 3.3E‐02 ‐2.5 129 48 24950 8.5 251175 2 16307393 Cathepsin B, preproprotein 2.4E‐02 ‐2.3 106 N 38766 5.9 251801 1 61620560 TIMP‐1 3.0E‐03 ‐2.3 107 48 21293 8.8 251828 1 85687376 type V collagen preproprotein, alpha 1 4.7E‐02 ‐2.3 70 44 184131 4.9 31449 1 4503155 Cathepsin L, preproprotein 1.1E‐04 ‐2.2 252 98 37996 5.3 271370 1 16307393 Cathepsin B, preproprotein 1.2E‐02 ‐2.2 87 N 38766 5.9 222293 2 62896507 Niemann‐Pick disease, type C2 precursor variant 2.0E‐02 ‐2.2 113 N 16916 7.6 301382 1 16307393 Cathepsin B, preproprotein 2.6E‐02 ‐2.2 91 N 38766 5.9 221151 2 16307393 Cathepsin B, preproprotein 5.1E‐03 ‐2.2 123 N 38766 5.9 301346 1 16307393 Cathepsin B, preproprotein 2.2E‐02 ‐2.1 87 N 38766 5.9 221734 1 62896777 Lectin, mannose‐binding 2 variant 2.3E‐05 ‐2.1 112 N 40564 6.6 181162 2 16307393 Cathepsin B, preproprotein 4.8E‐03 ‐2.1 135 N 38766 5.9 341645 2 553801 Thrombospondin 1 chain A 2.9E‐02 ‐2.1 130 N 22972 7.0 421046 2 16307393 Cathepsin B, preproprotein 1.4E‐02 ‐2.0 172 63 38766 5.9 20779 2 21361657 Chain A, TapasinERP57 HETERODIMER 3.2E‐02 ‐2.0 154 16 54541 5.6 271204 1 27769056 SERPINE2 protein (PAI‐1) 2.1E‐02 ‐1.9 99 N 44200 9.4 181114 2 47115317 vimentin 4.1E‐02 ‐1.9 114 N 53619 4.8 261190 1 3135316 PCOLCE (procollagen C‐endopeptidase enhancer) 9.2E‐04 ‐1.9 129 N 48797 7.4 251090 2 16307393 Cathepsin B, preproprotein 2.5E‐03 ‐1.9 175 N 38766 5.9 201217 2 22538442 Cathepsin X, preproprotein 2.8E‐04 ‐1.9 121 N 33366 6.1 25916 2 21619971 PCOLCE (procollagen C‐endopeptidase enhancer) 2.2E‐03 ‐1.8 138 N 48797 7.4 23
Page 31 of 71 Journal of Investigative Dermatology
123456789101112131415161718192021222324252627282930313233343536373839404142434445464748495051525354555657585960

For Review Only
Sample name a
Experiment number b
Accession code (NCBI) c Protein description
Decyder P value (T‐test)
Average ratio d MASCOT score Ion score e
Theoretical MW (Da) Theoretical pI % coverage f
1699 2 553801 Thrombospondin 1 chain A 3.3E‐02 ‐1.8 114 N 27858 5.2 341744 1 553801 Thrombospondin 1 chain A 7.9E‐03 ‐1.8 145 74 22972 7.0 19902 2 6919941 PCOLCE (procollagen C‐endopeptidase enhancer) 3.4E‐02 ‐1.8 86 34 48797 7.4 171833 1 61620560 TIMP‐1 9.1E‐03 ‐1.7 97 N 16560 8.8 34970 1 4758412 polypeptide N‐acetylgalactosaminyltransferase 2 3.5E‐02 ‐1.7 96 N 65433 8.6 141630 2 553801 Thrombospondin 1 chain A 1.1E‐02 ‐1.7 139 N 22972 7.0 331865 1 61620560 TIMP‐1 8.2E‐03 ‐1.7 94 N 16560 8.8 291183 1 3135316 PCOLCE (procollagen C‐endopeptidase enhancer) 1.3E‐02 ‐1.6 109 N 48797 7.4 221239 1 27769056 SERPINE2 protein (PAI‐1) 1.4E‐02 ‐1.6 82 N 44200 9.4 18987 2 12654931 TXNDC5 protein/protein disulfide isomerase family a, member 6 4.9E‐02 ‐1.6 112 75 36725 5.3 121028 2 20139982 Serpin peptidase inhibitor, clade B (ovalbumin), member 7 5.0E‐02 ‐1.6 98 N 41329 6.6 141238 2 3719219 Cathepsin X, preproprotein 2.8E‐02 ‐1.6 75 27 33366 6.1 131219 1 56410847 GDP dissociation inhibitor 2 1.4E‐02 ‐1.5 98 N 46046 5.9 251163 2 12654615 Hsp40 5.3E‐03 ‐1.5 90 N 40774 5.8 72118 1 29126971 Proteasome (prosome, macropain) subunit alpha type 2 6.1E‐03 1.5 115 N 25996 6.9 291689 2 37594464 nudix hydrolase NUDT5 3.7E‐02 1.5 88 N 24597 4.9 131933 1 4506203 proteasome beta 7 subunit proprotein 1.8E‐02 1.5 73 N 27978 7.1 142026 2 4507511 TIMP‐2 6.7E‐03 1.5 222 129 24879 7.5 222279 2 1237406 Cu‐Zn Human Superoxide Dismutase/SOD 1 2.3E‐02 1.6 152 152 16096 5.9 481243 1 5453842 proliferation‐associated 2G4, 38kDa 5.8E‐03 1.6 118 N 44101 6.1 261709 1 38181963 Pyrophosphatase 1 1.5E‐02 1.7 72 N 33095 5.5 152051 2 31543380 Dj‐1, chain A 3.5E‐02 1.7 108 N 20063 6.3 472011 2 4507511 TIMP‐2 7.8E‐03 1.7 180 125 21363 8.0 121545 1 48257056 Transaldolase 1 2.3E‐03 1.7 111 58 37556 6.4 182022 2 2204207 Glutathione Transferase, chain A 2.7E‐02 1.7 175 78 23394 5.7 361238 1 12653201 Phosphogluconate dehydrogenase 1.5E‐03 1.8 176 118 53619 6.8 141537 2 85397510 pyrophosphatase 1 2.0E‐03 1.8 97 79 33095 5.5 32528 2 4504981 Galectin‐1 7.1E‐03 1.8 312 104 15048 5.3 571756 1 55749504 syntenin isoform 2 6.2E‐03 1.8 98 N 31913 7.1 191945 1 1199487 collagen binding protein 2 7.4E‐03 1.8 94 60 46620 8.9 81457 1 12653873 Capping protein (actin filament), gelsolin‐like 7.0E‐03 1.9 154 70 38779 5.9 261951 1 55977294 proteasome beta 7 subunit proprotein 4.1E‐03 1.9 96 22 25592 5.8 142246 1 134665 Mitochondrial Manganese Superoxide Dismutase/SOD2 1.5E‐02 1.9 100 38 22288 6.9 211352 1 3641398 NADP‐dependent isocitrate dehydrogenase 9.4E‐03 1.9 168 N 46944 6.3 331652 1 12804929 Mitochondrial malate dehydrogenase, precursor 2.4E‐02 1.9 191 N 35965 8.9 351742 1 5453908 phosphatidylinositol transfer protein, alpha 2.1E‐02 1.9 90 N 32014 6.1 232590 1 27695621 Coactosin‐Like Protein 4.3E‐03 1.9 90 51 16049 5.5 261922 1 15214636 chloride intracellular channel 4 2.4E‐02 1.9 129 N 28982 5.5 372409 1 1237406 Cu/Zn‐superoxide dismutase/SOD 1 7.5E‐03 1.9 131 N 16023 5.7 371430 1 23879 MAPK‐ 40kDa protein kinase 4.9E‐03 1.9 137 N 40794 6.7 281955 1 56208541 calcyclin binding protein isoform 2 1.6E‐02 1.9 92 N 21329 7.7 402036 2 4504183 Glutathione Transferase P1‐1, chain A 4.8E‐03 1.9 107 N 23394 5.7 361970 2 47496673 Growth factor receptor bound protein 2 5.1E‐03 2.0 96 N 25304 5.9 272254 2 4557797 non‐metastatic cells 1, protein (NM23A) expressed in isoform b 5.2E‐03 2.0 118 N 17309 5.8 421510 2 38566211 Eukaryotic translation elongation factor 1 delta, isoform 2 2.9E‐02 2.0 133 72 31217 4.9 25
Page 32 of 71Journal of Investigative Dermatology
123456789101112131415161718192021222324252627282930313233343536373839404142434445464748495051525354555657585960

For Review Only
Sample name a
Experiment number b
Accession code (NCBI) c Protein description
Decyder P value (T‐test)
Average ratio d MASCOT score Ion score e
Theoretical MW (Da) Theoretical pI % coverage f
2049 2 31543380 Dj‐1, chain A 5.0E‐02 2.0 110 N 20063 6.3 371897 2 3122258 p27BBP protein/eukaryotic initiation factor 6/integrin beta 4 binding protein 3.8E‐02 2.1 125 80 26845 4.6 152422 2 80479362 Ubiquitin‐conjugating enzyme E2N 4.7E‐03 2.1 131 93 17184 6.1 191916 1 15214636 chloride intracellular channel 4 1.6E‐03 2.1 124 53 28982 5.5 201834 2 68085578 14‐3‐3 Protein 3.9E‐02 2.1 143 N 29413 5.0 372510 1 56203164 ubiquitin‐conjugating enzyme E2 variant 1 1.9E‐03 2.1 112 51 11948 9.2 611280 1 55961217 fumarate hydratase precursor 2.5E‐02 2.1 209 122 54773 8.9 201009 1 31416989 pyruvate kinase, muscle 7.4E‐03 2.1 149 N 60277 8.2 232076 1 21361091 Ubiquitin carboxyl‐terminal esterase L1 (ubiquitin thiolesterase) 9.4E‐03 2.2 130 69 24850 5.2 151351 1 1353386 adenosine kinase 3.9E‐03 2.2 127 N 37887 6.1 231506 2 38566211 Eukaryotic translation elongation factor 1 delta, isoform 2 5.1E‐04 2.2 104 26 31217 4.9 201711 1 38181963 Pyrophosphatase 1 7.4E‐03 2.2 95 N 33095 5.5 241781 2 15214636 Chloride intracellular channel 4 2.8E‐03 2.3 133 96 28982 5.5 141874 2 76780069 Rho GDP dissociation inhibitor (GDI) alpha 2.0E‐03 2.3 107 N 23250 5.0 292229 1 913159 neuropolypeptide h3 or prostatic binding protein 4.7E‐04 2.3 144 N 21027 7.4 432558 1 80479362 Ubiquitin‐conjugating enzyme E2N 7.6E‐03 2.4 109 71 17184 6.1 191953 2 21361091 ubiquitin carboxy‐terminal hydrolase L1 2.6E‐02 2.5 105 86 23354 5.3 82618 1 417811 Mitochondrial Single Strand Dna Binding Protein 1.1E‐03 2.5 100 17 15186 8.2 402311 2 453133 eukaryotic translation initiation factor 5A 1.5E‐02 2.5 171 55 17049 5.1 312415 1 4557797 non‐metastatic cells nucleoside‐diphosphate kinase 1 9.6E‐04 2.6 156 N 17309 5.8 682451 1 66392203 NME1‐NME2 protein 6.2E‐03 2.6 112 88 32906 8.7 72242 1 18204954 peroxiredoxin 1 4.4E‐03 2.6 96 N 22324 8.3 452498 1 51895760 Cyclophilin A (peptidyl‐prolyl isomerase A) 7.8E‐03 2.6 108 57 18098 7.8 271802 2 68085578 14‐3‐3 Protein 1.6E‐03 2.7 147 77 29413 5.0 211884 2 5803227 14‐3‐3 Protein Theta chain A 1.2E‐02 2.7 175 112 29408 5.2 172465 1 4557251 ADAM 10 1.7E‐02 2.7 100 40 58773 6.8 91917 1 13528948 Proteasome (prosome, macropain) subunit, alpha type, 3 7.3E‐04 2.8 80 N 27858 5.2 231735 2 55961619 chloride intracellular channel 1 1.4E‐02 2.8 75 30 27248 5.1 102491 1 51895760 peptidylprolyl isomerase A (cyclophilin A) 2.3E‐03 2.9 191 97 18229 7.7 461827 1 55961619 chloride intracellular channel 1 1.1E‐02 2.9 110 N 27248 5.1 302340 1 15147369 Cofilin 1 (non‐muscle) 3.7E‐03 2.9 131 59 15877 8.5 322079 1 12653131 Ubiquitin carboxyl‐terminal esterase L1 9.8E‐04 3.0 176 N 25151 5.3 522403 1 15147369 Cofilin 1 (non‐muscle) 1.6E‐02 3.2 78 60 18719 8.2 181676 2 55961619 chloride intracellular channel 1 4.7E‐04 3.4 98 45 27248 5.1 172388 1 15147369 Cofilin 1 (non‐muscle) 1.3E‐02 3.6 131 59 15877 8.5 321736 2 55961619 chloride intracellular channel 1 6.9E‐04 4.0 112 N 27248 5.1 31
aSpot numbering according to location in 2D gels. bExperiment number: 1 and 2 are secretome experiments in 3‐11 NL and 4‐7 pH range respectively . cGI protein accesion code (NCBI database). dThe average ratio value indicates the standardized spot volume ratio between L2F6 and LBLAST. Values are displayed in the range of ‐∞ to –1 for decreases in expression in L2F6 and +1 to +∞ for increases in expression in L2F6. e N, not done. f
Percentage of coverage was calculated using the sequence of the full‐length protein.
Page 33 of 71 Journal of Investigative Dermatology
123456789101112131415161718192021222324252627282930313233343536373839404142434445464748495051525354555657585960
For Review O
nly
SPARC and invasiveness in melanoma cells
1
SUPPLEMENTAL INFORMATION
SPARC promotes cathepsin B-mediated melanoma invasiveness through
a collagen I/α2β1 integrin axis.
María Romina Girotti, Marisol Fernández Rodríguez, Juan Antonio López, Emilio Camafeita, Elmer
Fernández, Juan Pablo Albar, Lorena Gabriela Benedetti, María Pía Valacco, Rolf Brekken, Osvaldo Luis
Podhajcer, and Andrea Sabina Llera.
Supplemental Materials and Methods
Cell culture
Melanoma cell lines and clones were grown in DMEM/F12 containing no transferrin or epidermal
growth factor and supplemented with 10% (v/v) foetal bovine serum (FBS) and antibiotics. L2F6 and
LBLAST cells were derived by stably transfecting the human melanoma cell line MEL-LES with a vector
containing an siRNA directed against the 2175 to 2196 bp region of human SPARC or an empty vector
control, respectively (Sosa et al 2007). Clone L2F6 was obtained by limiting dilution, and these cells
expressed SPARC at 20% of the level of the control cell line LBLAST. Both L2F6 and LBLAST cells were
routinely maintained in selective media during further studies and checked for SPARC production. A-
Lenti51 and AE cell lines were first obtained by transducing A375 human melanoma cells with a
lentivirus containing an siRNA directed against the 51 to 72 bp region of human SPARC or an empty
vector control, respectively. Lentiviral supernatants were prepared according to Tiscornia et al.
(Tiscornia et al 2006) by cotransfecting 293FT cells (Invitrogen, Carlsbad, CA, USA) with the packaging
plasmids pCMV8.9, VSV-G protein envelope, Rev (all three generously provided by Dr. Y. Chernajovsky)
and the empty vector pRNATin-H1.4/Lenti (GenScript Corp, Piscataway, NJ, USA) or the siRNA version
named Lenti51. Transduction and selection of AE and A-Lenti51 cells were performed according to
GenScript guidelines http://www.genscript.com/vector/SD1260-pRNATin_H1_4_Lenti.html. SPARC
Page 34 of 71Journal of Investigative Dermatology
123456789101112131415161718192021222324252627282930313233343536373839404142434445464748495051525354555657585960

For Review O
nly
SPARC and invasiveness in melanoma cells
2
expression in ten individual A-Lenti51 clones were obtained by limiting dilution and checked by real-
time PCR and immunoblotting. Clone 3, which expressed SPARC at 30% of the level of the control AE cell
line, was designated A3 and selected for further studies.
All cultures were maintained at 37°C, 5% CO2 in a humidified incubator for no longer than 5 passages.
SPARC and other reagents
Tumour-derived SPARC, which was purified from serum-free A375 cell culture supernatants, was
obtained as previously described (Haber et al 2008). Preparations routinely yielded > 90% pure SPARC,
as verified by SDS-PAGE. For reversion assays, cells were previously incubated for 24 h with 1 µg/ml (30
nM) A375-derived hSPARC. Adenoviruses carrying SPARC (Ad-SPs) or β−galactosidase coding sequences
(Ad-BG) were obtained as previously described (Sosa et al 2007). The concentration of recombinant
vectors was expressed as the 50% tissue culture infective dose per millilitre in HEK 293 cells
(TCID50/mL). For cell transduction, 2.5 x 10⁵ LBLAST and 2.0 x 10
5 L2F6 cells were seeded in 35 mm-
plates and grown in serum-containing medium as described above. After 24 h, cell transduction
performed with the addition of 1 x 10⁹ TCID50/mL for 6 h in serum-free medium. Cells were then
incubated in 10% v/v FBS-supplemented culture medium for additional 24 h. Invasion assays were
performed after 72 h of transduction, a time at which the effect of the transgenic construct was
maximal.
Proteomic analysis by DIGE
Cells were seeded at 80% confluence in 150 mm plates, grown for 24 h, washed three times with PBS
and incubated in serum-free medium for an additional 24 h. Conditioned media were collected and
cleared of cells and debris by centrifugation. The resulting supernatants were supplemented with a
protease inhibitor cocktail (0.01 µM aprotinin, 1 µM leupeptin, 1 µM pepstatin, 1 mM PMSF and 0.14
µM E-64, all from Sigma, St. Louis, MO, USA) and concentrated 60-fold in a Centriprep-3 (Millipore,
Billerica, MA, USA). The proteins were then precipitated with 10% TCA/acetone, and the resulting pellet
was solubilised in standard lysis buffer (7 M urea, 2 M thiourea, 4% CHAPS, 30 mM Tris, pH 8.5).
Interfering substances were removed using the 2D Clean-Up Kit (GE Healthcare, Piscataway, NJ, USA),
and the protein pellets were resolubilised in standard lysis buffer. The protein concentration was
Page 35 of 71 Journal of Investigative Dermatology
123456789101112131415161718192021222324252627282930313233343536373839404142434445464748495051525354555657585960

For Review O
nly
SPARC and invasiveness in melanoma cells
3
measured with the 2D-Quant Kit (GE Healthcare, Piscataway, NJ, USA) or the RCDC Protein Assay Kit
(Bio-Rad). The proteins were labelled with CyDye according to the protocol of the manufacturer (GE
Healthcare, Piscataway, NJ, USA). Briefly, 50 µg of LBLAST or L2F6 extracts were minimally labelled with
400 pmol of the N-hydroxysuccinimide esters of Cy3 or Cy5 fluorescent cyanine dyes on ice and in the
dark for 30 min. All experiments comprised an internal standard that contained equal amounts of each
cell lysate, which was labelled with a Cy2 dye. Four different conditioned media, arbitrarily named A, B,
C and D, were assayed. The general experimental strategy is depicted in the following table:
GEL Cy2 STANDARD Cy3 Cy5
1
50 µg (6.25 µg each):
LBLAST (A,B,C,D);
L2F6 (A,B,C,D)
50 µg LBLAST A 50 µg L2F6 B
2
50 µg (6.25 µg each):
LBLAST (A,B,C,D);
L2F6 (A,B,C,D)
50 µg LBLAST B 50 µg L2F6 C
3
50 µg (6.25 µg each):
LBLAST (A,B,C,D);
L2F6 (A,B,C,D)
50 µg L2F6 D 50 µg LBLAST C
4
50 µg (6.25 µg each):
LBLAST (A,B,C,D);
L2F6 (A,B,C,D)
50 µg L2F6 A 50 µg LBLAST D
The labelling reaction was quenched with 1 µL of 10 mM lysine on ice for 10 min in the dark. The LBLAST
and L2F6 protein extracts and the internal standard protein samples were combined in pairs as shown in
the table and run in a single gel (150 µg total protein). The protein mixtures were diluted in Rehydration
Buffer (7 M urea, 2 M thiourea, 4% CHAPS, 0.5% IPG Buffer, pH 3 11NL) containing 10 mM DTT in a final
volume of 100 µl and applied by cup loading to 24 cm IPG strips pH 3-11 NL (Experiment 1) or 24 cm IPG
strips pH 4-7 (Experiment 2) (GE Healthcare, Piscataway, NJ, USA), previously rehydrated with 450 µl of
Rehydration Buffer containing 1.2% DeStreak (GE Healthcare, Piscataway, NJ, USA) The first dimension
was run at 0.05 mA/strip in the IPGphor IEF System (GE Healthcare, Piscataway, NJ, USA) followed by a 5
steps voltage increase: 300 V/h for 3 h, a linear gradient to 1000V in 6 h, a linear gradient to 8000 V in 3
h, a 8000 V/h until 43,000 V/h were reached. For the first dimension, the strips were equilibrated in the
dark with SDS Equilibration Buffer (75 mM Tris, pH 8.8, 6 M urea, 30% (v/v) glycerol, 2% (w/v) SDS, and
Page 36 of 71Journal of Investigative Dermatology
123456789101112131415161718192021222324252627282930313233343536373839404142434445464748495051525354555657585960

For Review O
nly
SPARC and invasiveness in melanoma cells
4
traces of bromophenol blue) containing 65 mM DTT for 15 min and then in SDS Equilibration Buffer
containing 216 mM iodoacetamide for an additional 15 min. The proteins were then separated in 12%
Tris–glycine gels using an Ettan Dalt Six device (GE Healthcare, Piscataway, NJ, USA) at 25ºC until the
tracking dye had migrated off the bottom of the gel. After electrophoresis, the gels were scanned with a
Typhoon 9400 scanner (GE Healthcare, Piscataway, NJ, USA) at 100 µm resolution using the appropriate
wavelengths and filters for Cy2, Cy3 and Cy5 dyes. Relative protein quantification across LBLAST and
L2F6 samples was performed using DeCyder software v6.5. After imaging for CyDye components and
DeCyder analysis, the gels were stained overnight in the dark with SYPRO Ruby (Molecular Probes Inc,
Eugene, OR, USA), and the spots of interest were automatically selected by the Spot Picking Robot (GE
Healthcare, Piscataway, NJ, USA). The gel was reimaged after spot cutting-out to ensure accurate
protein excision. A typical image of results is shown below.
Protein identification by mass spectrometry
Protein spots were digested automatically using a Proteineer DP robot (Bruker Daltonik, Bremen,
Germany) under the control of dpControl 1.2 software (Bruker Daltonik, Bremen, Germany)
(Shevchenko et al 2006). MALDI samples were prepared by mixing equal volumes of the digestion
solution and a matrix solution composed of α-cyano-4-hydroxycinnamic acid (Bruker Daltonik, Bremen,
Germany) in 50% aqueous acetonitrile and 0.25% trifluoroacetic acid. This mixture was deposited onto a
Page 37 of 71 Journal of Investigative Dermatology
123456789101112131415161718192021222324252627282930313233343536373839404142434445464748495051525354555657585960

For Review O
nly
SPARC and invasiveness in melanoma cells
5
600 µm AnchorChip prestructured MALDI probe (Bruker Daltonik, Bremen, Germany) and allowed to
dry. Samples were automatically analysed in an Ultraflex MALDI-TOF/TOF mass spectrometer (Bruker
Daltonik, Bremen, Germany) (Suckau et al 2003) using internal mass calibration under the control of
flexControl 2.2 software (Bruker Daltonik, Bremen, Germany). Automated analysis of the mass data was
performed using the flexAnalysis 2.2 software (Bruker Daltonik, Bremen, Germany). MALDI-MS and
MS/MS data were combined using the BioTools 3.0 program (Bruker Daltonik, Bremen, Germany) to
search a nonredundant protein database (NCBInr; ca. 6.5 x 10⁶ entries; National Center for
Biotechnology Information) using the Mascot software (Matrix Science) (Perkins et al 1999).
Gene ontology analysis
Differentially expressed proteins from the secretome and cell extracts were classified by using PANTHER
(Protein ANalysis THrough Evolutionary Relationships) (http://www.pantherdb.org) (Mi et al 2007). In
PANTHER, proteins are classified into families and subfamilies of shared function, which are then
categorised using ontology terms.
To determine protein functional relationships among the differentially expressed secretome proteins,
we used the Database for Annotation, Visualisation and Integrated Discovery (DAVID) (Huang da et al
2007, Huang da et al 2009) to annotate proteins identified by GeneID with their gene ontologies. The
GeneIDs were ontologically analysed using the GO Chart feature offered by DAVID 1.0 with settings of
intermediate coverage and specificity.
Immunoblotting
Cells were seeded at 80% confluence in 150 mm-plates, grown for 24 h, washed three times with PBS
and incubated in serum-free media for additional 24 h. Conditioned media was collected and cleared of
cells and debris by centrifugation. Soluble protein extracts from cell cultures were obtained immediately
after collection of supernatants. Cells were lysed in RIPA buffer (25 mM Tris-HCl pH 7.6, 150 mM NaCl,
1% NP-40, 1 mM Na3VO4 and 1 mM EDTA), and the lysates were sonicated on ice and cleared by
centrifugation. The resulting supernatants and cell extracts were supplemented with a protease
inhibitor cocktail (0.01 µM aprotinine, 1 µM leupeptin, 1 µM pepstatin, 1 mM PMSF and 0.14 µM E-64
(Sigma, St. Louis, MO, USA). Supernatants were concentrated 30-fold in a Centriprep-3 (Millipore,
Page 38 of 71Journal of Investigative Dermatology
123456789101112131415161718192021222324252627282930313233343536373839404142434445464748495051525354555657585960

For Review O
nly
SPARC and invasiveness in melanoma cells
6
Billerica, MA, USA). The concentrated media were quantified by 2D-Quant Kit (GE Healthcare,
Waukesha, WI), and a fixed amount of total protein that varied depending on the expected
immunoblotting signal (generally 5 µg) was loaded into an SDS-PAGE gel. Proteins were separated in a
12% SDS-polyacrylamide gel and transferred onto nitrocellulose membranes. A gel run in parallel was
stained for total protein with SYPRO Ruby (Molecular Probes Inc, Eugene, OR, USA), and this was used as
control for uniform loading.
Membranes were incubated in appropriate dilutions of the following antibodies: mouse anti-human
SPARC monoclonal AON-1 (Developmental Studies Hybridoma Bank), rabbit anti-cathepsin B or mouse
anti-cathepsin L or rabbit anti collagen I (all from Santa Cruz Biotechnology Inc., Santa Cruz, CA, USA) or
goat anti-cathepsin X/Y/Z (R&D Systems, Minneapolis, MN, USA) or rabbit anti-FAM3C (Abcam,
Cambridge, UK). When using cell extracts, actin was probed as a housekeeping gene. Membranes were
then incubated with peroxidase-conjugated AffiniPure goat anti-mouse IgG or goat anti-rabbit IgG (both
from Jackson Immunoresearch Laboratories, Wets Grove, PA, USA) or peroxidase-conjugated AffiniPure
donkey anti-goat (Santa Cruz Biotechnology Inc., Santa Cruz, CA, USA) and detected using ECL-Plus (GE
Healthcare, Piscataway, NJ, USA). Images were digitalised using an HP Scanjet 3670 scanner, cropped
with Adobe Photoshop CS3 and quantified using Image J. Total image brightness and contrast were
optimised for illustrations; originals are available upon request.
Cathepsin B activity assay
The cells used for the cathepsin B activity assay were seeded at 80% confluency in 100 mm plates,
grown for 24 h in serum-containing media, washed three times with PBS and incubated in serum-free
media for additional 24 h. Conditioned media was then collected and cleared of cells and debris by
centrifugation. The resulting supernatants were concentrated 10-fold in a Centriprep-3 (Millipore,
Billerica, MA, USA) in the absence of protease inhibitors. To assess the activity of cathepsin B present in
conditioned media, we applied an experimental procedure previously described (Hulkower et al 2000).
Briefly, 200 µl of conditioned media from LBLAST or L2F6 or the same amount of serum free media
(control) was incubated for 30 min at 37°C with 50 µl of 0.5 M sodium formate, 20 mM EDTA, pH 3.2,
and 6 µM pepsin. Cathepsin B activity was then assayed by adding 250 µl of 200 mM sodium phosphate
buffer, pH 6.7, containing 4 mM EDTA, 10 mM dithiothreitol, 0.1% Triton X-100, and 200 µM of the
Page 39 of 71 Journal of Investigative Dermatology
123456789101112131415161718192021222324252627282930313233343536373839404142434445464748495051525354555657585960

For Review O
nly
SPARC and invasiveness in melanoma cells
7
specific substrate Z-Arg-Arg-NHMec (Sigma, St. Louis, MO, USA; final substrate concentration 100 µM,
final pH 6.0). The selective membrane-impermeable epoxide derivative CA-074 (Peptide Institute Inc,
Osaka, Japan) was used as a specific inhibitor of secreted cathepsin B. Fluorescence was measured with
an Aminco Bowman Series 2 spectrofluorimeter. The results were expressed as pmoles of fluorescent
NH2Mec formed/sec/µg of protein.
Immunohistochemistry and in vivo assays
The animal experiments were performed in accordance with institutional guidelines approved by the
Institutional Committee for Care and Use of Experimental Animals (CICUAL) at Fundacion Instituto
Leloir.
Eight- to ten-week-old athymic N:NIH(S)-nu mice received s.c. inocula of 5 x 10⁶ melanoma cells (either
LBLAST or L2F6) in the left flank in a total volume of 100 µl. Perpendicular diameters were used to
determine the tumour volume as d126d2/2, where d1 is the smaller diameter and d2 is the larger one.
Surviving mice were followed for two months, and those harbouring tumours greater than 2 cm3 were
euthanised following approved procedures. For immunohistochemistry, 8-micrometer-thick tumour
sections were deparaffinised in xylene and rehydrated in graded ethanol. For antigen unmasking, the
sections were immersed in citrate buffer (pH 6) and boiled twice in a microwave oven. Endogenous
peroxidase activity was blocked by soaking the sections in 3% hydrogen peroxide in methanol for 15
minutes. Nonspecific binding sites were blocked by incubating the sections in normal goat serum (10%
in PBS). Excess serum was then removed, and the tissue sections were incubated overnight with anti-
vimentin antibody (clone V9, Chemicon International Inc, Temecula, CA, USA) at 5 µg/ml or anti-
cathepsin B (FL-339, Santa Cruz Biotechnology Inc., Santa Cruz, CA, USA) at 1 µg/ml. After washing twice
in PBS for 10 minutes, the sections were incubated with biotinylated goat anti-mouse antibody (BA-
9200, Vector Laboratories Inc, Burlingame, CA, USA) or biotinylated goat anti-rabbit antibody (BA-1000,
Vector Laboratories Inc, Burlingame, CA, USA) at 4 µg/ml for 45 minutes followed by a PBS wash. The
sections were subsequently incubated with Vectastain ABC reagent (Vector Laboratories Inc,
Burlingame, CA, USA) for 45 minutes. Colour was developed by incubating the sections with liquid
diaminobenzidine (substrate chromogen system, DakoCytomation). Finally, the sections were
counterstained with haematoxylin, dehydrated, and mounted.
Page 40 of 71Journal of Investigative Dermatology
123456789101112131415161718192021222324252627282930313233343536373839404142434445464748495051525354555657585960

For Review O
nly
SPARC and invasiveness in melanoma cells
8
Real-time PCR
Total RNA was extracted using Tri Reagent (Sigma, St. Louis, MO, USA). For cDNA synthesis, 5 µg of RNA
was reverse-transcribed with 200 U of SuperScript II Reverse Transcriptase (Invitrogen, Carlsbad, CA)
using 500 ng of Oligo(dT) primers. The cDNAs were then subjected to real-time PCR in an Mx3005P Real-
Time PCR System Stratagene (Agilent Technologies Inc, Stockport, UK). Each 25 µl reaction volume
contained one unit of Platinum Taq DNA polymerase (Invitrogen, Carlsbad, CA, USA), 1X PCR Reaction
Buffer (20 mM Tris–HCl, pH 8.4, 50 mM KCl), 1X ROX, 1.5 mM Mg2Cl, 2.5 mg BSA, 0.01% Glycerol, 200
µM of dNTPs, 0.3X SYBR Green Solution and 0.4 µM specific primers for SPARC, cathepsin B, collagen I
α2 chain and HPRT as a housekeeping gene (see table below for primer sequences). All reactions were
performed in triplicate. The results obtained for our genes of interest were normalised to those
obtained for HPRT and expressed as a fraction of the expression levels observed in LBLAST control cell
line.
Gene Sense sequence Antisense sequence
SPARC 5’ AACCGAAGAGGAGGTGGTG 3’ 5’ GCAAAGAAGTGGCAGGAAGA 3’
HPRT 5’ AGACTGAAGAGCTATTGTAAT 3’ 5’ CAGCAAGCTTGCGACCTTGAC 3’
Collagen I, αααα2 chain 5’ AAGGTCATGCTGGTCTTGCT 3’ 5’ GACCCTGTTCACCTTTTCCA 3’
Cathepsin B 5’ GGCCCCCTGCATCTATCG 3’ 5’ AGGTCTCCCGCTGTTCCACTG 3’
Invasion assays
Melanoma cell invasion was assayed in a 48 well micro chemotaxis chambers (Neuro Probe Inc.,
Gaithersburg, MD, USA) with an 8 µm-pore membrane pretreated with 0.5 mg/ml Matrigel (Becton
Dickinson, Mountain View, CA, USA) at 37°C using 10% FBS as a chemoattractant. LBLAST and L2F6 were
grown for 24 h on either uncoated or collagen- or fibronectin-coated dishes (> 90% cells attached to all
substrates after 12 h). The cells were then detached from the plate using EDTA and loaded into the
invasion chamber. After 5 h, the cells were fixed, stained with Hoechst and images from 70% of each
well were captured under 100X magnification using a BX-60 Olympus fluorescent microscope and
counted using Cell Profiler (www.cellprofiler.com) (Carpenter et al 2006).
Page 41 of 71 Journal of Investigative Dermatology
123456789101112131415161718192021222324252627282930313233343536373839404142434445464748495051525354555657585960

For Review O
nly
SPARC and invasiveness in melanoma cells
9
For blocking experiments, the cells were incubated for 24 h with 40 µg/ml anti-β1 (clone 6S6) or α2
integrin (clone P1E6) antibodies (Chemicon International Inc, Temecula, CA, USA), or the combination of
both, or 5 µg/ml of anti-TGF-β1 monoclonal antibody (MAB240, R&D Systems, Minneapolis, MN, USA) or
the isotype control antibody MOPC (Sigma, St Louis, MO, USA). For SPARC blocking assays, LBLAST or
L2F6 cells were incubated for 24 h with a mixture of 0.05 mg/ml of 293 Ab, 0.23 mg/ml of 303 Ab and
0.13 mg/ml of AON 1-RB antibodies (Sweetwyne et al 2004) in the presence or absence of 30 nM SPARC.
For inhibition of TGFβ1 receptors, 10 µM SB431542 (Sigma) was added. For TGFβ1 reversion assays, the
cells were incubated for 24 h with rhTGF-β 1 ng/ml (40 pM, cat. no. 100-21C, PeproTech Inc., Rocky Hill,
NJ).
Flow cytometry
Cells were detached and incubated with 10% v/v goat normal serum, 5 mg/ml BSA in PBS followed by an
additional 30 min incubation with 2 µg/ml of monoclonal anti-N-CAD antibody (anti-A-CAM, clone CG-4,
Sigma, St. Louis, MO, USA) or 0.1 µg/ml of monoclonal anti-E-CAD antibody (clone 180224, R&D
Systems, Minneapolis, MN, USA). Cells were fixed in 4% w/v paraformaldehyde in PBS for 10 min and
incubated for 30 min with 5 µg/ml of secondary goat anti-mouse IgG antibody conjugated to FITC
(Molecular Probes Inc, Eugene, OR) at 2 µg/ml. Flow cytometry was performed with a FACStar Plus
instrument (BD Biosciences, Mountain View, CA).
Transendothelial migration assays
Human dermal microvascular endothelial cell (HDMEC) monolayers were built on top of 8.0 µm-pore
size PET-covered inserts (BD Biosciences, Mountain View, CA). The cells were labelled with the
fluorescent dye CM-DiI (Invitrogen, Carlsbad, CA). Inserts were placed in 24-well plates filled with
DMEM, 10% FBS. Cocultures were fixed after 6 h and stained with Hoechst. The cell number was
counted in 8 sets of random fields from a total of 14 using a BX-60 Olympus fluorescent microscope
(total magnification 100X). Red-negative nuclei (endothelial cells) were subtracted. The results were
expressed as percentages of migrating cells with respect to the control (100%).
Page 42 of 71Journal of Investigative Dermatology
123456789101112131415161718192021222324252627282930313233343536373839404142434445464748495051525354555657585960

For Review O
nly
SPARC and invasiveness in melanoma cells
10
For the inhibition studies, melanoma cells were preincubated with 1 µg/ml anti-N-cadherin antibody
GC4 (A-CAM, clone GC-4; Sigma), 40 µg/ml anti-α2- or β1-integrin, 5 µg/ml anti-TGFβ1 or MOPC control
antibody for 30 min at 4°C before addition to the HDMEC monolayer.
Statistics
For continuous variables, one-way analysis of variance was used to determine statistically significant
differences among multiple conditions in real-time PCR and quantitative immunoblotting. The Student’s
t-test was used to calculate the statistical significance when only two conditions were compared. To
analyse discrete variables (i.e., cell number in cell invasion and transmigration assays) under the
different experimental conditions, the log of the cell counts were tested using generalised linear models
(West et al 2007) with or without covariance structure when appropriate. If the desired effect or
interaction was found to be significant, least squares estimates of the difference were calculated with
their associated p-values. When multiple least squares comparisons were performed, the false discovery
rate (FDR)-adjusted p-values were calculated using the Benjamini & Hochberg method (Benjamini et al
2001), and the expected proportion of false discoveries amongst the rejected hypotheses was
calculated. FDR-corrected p-values are shown in the figure legends. In the figures, the invasion and
transmigration results were expressed as the percentage of cells invading/migrating in the
corresponding control.
References for Supplemental Materials and Methods
Benjamini Y, Drai D, Elmer G, Kafkafi N, Golani I (2001). Controlling the false discovery rate in behavior
genetics research. Behav Brain Res 125: 279-284.
Carpenter AE, Jones TR, Lamprecht MR, Clarke C, Kang IH, Friman O et al (2006). CellProfiler: image
analysis software for identifying and quantifying cell phenotypes. Genome Biol 7: R100.
Page 43 of 71 Journal of Investigative Dermatology
123456789101112131415161718192021222324252627282930313233343536373839404142434445464748495051525354555657585960

For Review O
nly
SPARC and invasiveness in melanoma cells
11
Haber CL, Gottifredi V, Llera AS, Salvatierra E, Prada F, Alonso L et al (2008). SPARC modulates the
proliferation of stromal but not melanoma cells unless endogenous SPARC expression is downregulated.
Int J Cancer 122: 1465-1475.
Huang da W, Sherman BT, Tan Q, Kir J, Liu D, Bryant D et al (2007). DAVID Bioinformatics Resources:
expanded annotation database and novel algorithms to better extract biology from large gene lists.
Nucleic Acids Res 35: W169-175.
Huang da W, Sherman BT, Lempicki RA (2009). Systematic and integrative analysis of large gene lists
using DAVID bioinformatics resources. Nat Protoc 4: 44-57.
Hulkower KI, Butler CC, Linebaugh BE, Klaus JL, Keppler D, Giranda VL et al (2000). Fluorescent
microplate assay for cancer cell-associated cathepsin B. Eur J Biochem 267: 4165-4170.
Mi H, Guo N, Kejariwal A, Thomas PD (2007). PANTHER version 6: protein sequence and function
evolution data with expanded representation of biological pathways. Nucleic Acids Res 35: D247-252.
Perkins DN, Pappin DJ, Creasy DM, Cottrell JS (1999). Probability-based protein identification by
searching sequence databases using mass spectrometry data. Electrophoresis 20: 3551-3567.
Shevchenko A, Tomas H, Havlis J, Olsen JV, Mann M (2006). In-gel digestion for mass spectrometric
characterization of proteins and proteomes. Nat Protoc 1: 2856-2860.
Sosa MS, Girotti MR, Salvatierra E, Prada F, de Olmo JA, Gallango SJ et al (2007). Proteomic analysis
identified N-cadherin, clusterin, and HSP27 as mediators of SPARC (secreted protein, acidic and rich in
cysteines) activity in melanoma cells. Proteomics 7: 4123-4134.
Suckau D, Resemann A, Schuerenberg M, Hufnagel P, Franzen J, Holle A (2003). A novel MALDI LIFT-
TOF/TOF mass spectrometer for proteomics. Anal Bioanal Chem 376: 952-965.
Page 44 of 71Journal of Investigative Dermatology
123456789101112131415161718192021222324252627282930313233343536373839404142434445464748495051525354555657585960
For Review O
nly
SPARC and invasiveness in melanoma cells
12
Sweetwyne MT, Brekken RA, Workman G, Bradshaw AD, Carbon J, Siadak AW et al (2004). Functional
analysis of the matricellular protein SPARC with novel monoclonal antibodies. J Histochem Cytochem 52:
723-733.
Tiscornia G, Singer O, Verma IM (2006). Production and purification of lentiviral vectors. Nat Protoc 1:
241-245.
West BT, Welch KB, Gatecki AT (2007). Linear Mixed Models: A practical guide using statistical software
Boca Raton, USA: Chapman & Hall/CRC Press.
Page 45 of 71 Journal of Investigative Dermatology
123456789101112131415161718192021222324252627282930313233343536373839404142434445464748495051525354555657585960

For Review O
nly
128x196mm (300 x 300 DPI)
Page 46 of 71Journal of Investigative Dermatology
123456789101112131415161718192021222324252627282930313233343536373839404142434445464748495051525354555657585960

For Review O
nly
215x279mm (300 x 300 DPI)
Page 47 of 71 Journal of Investigative Dermatology
123456789101112131415161718192021222324252627282930313233343536373839404142434445464748495051525354555657585960

For Review O
nly
194x192mm (300 x 300 DPI)
Page 48 of 71Journal of Investigative Dermatology
123456789101112131415161718192021222324252627282930313233343536373839404142434445464748495051525354555657585960

For Review O
nly
190x183mm (300 x 300 DPI)
Page 49 of 71 Journal of Investigative Dermatology
123456789101112131415161718192021222324252627282930313233343536373839404142434445464748495051525354555657585960

For Review O
nly
87x202mm (300 x 300 DPI)
Page 50 of 71Journal of Investigative Dermatology
123456789101112131415161718192021222324252627282930313233343536373839404142434445464748495051525354555657585960

For Review O
nly
180x127mm (300 x 300 DPI)
Page 51 of 71 Journal of Investigative Dermatology
123456789101112131415161718192021222324252627282930313233343536373839404142434445464748495051525354555657585960

For Review O
nly
Response to reviewers MS# JID‐2011‐0017
1
RESPONSE TO REVIEWERS RE: MS# JID‐2011‐0017 TITLE: SPARC promotes metastatic features in melanoma cells using cathepsin B, collagen I and N‐cadherin as mediators. Reviewer comments: Reviewer: 1 Comments to the Author The rationale for this study remains obscure. The manuscript does not have an organized, fluent structure. After reading it both I and a senior fellow of my lab agreed that the manuscript would need a thorough rewriting and pondering of the message of the work. In its current form, it would not be understood by researchers from outside this field. The methods have been mentioned somewhere, but they do not follow the structure/of presentation of data. The text is disturbingly laconic (Results only about 5 pages containing disturbingly also discussion). The text has been thoroughly rewritten, and we hope that the new text is no longer laconic. We also changed the title of the paper to emphasise the most significant finding of our study. We struggled to enhance results and discussion sections while keeping within the 3500‐word limit for Introduction, Results, Discussion and Materials and Methods. Thus, we decided to minimise the Materials and Methods section in the body of the paper and expand the experimental details in the Supplemental Materials and Methods section. We hope that this is acceptable to the reviewers. The figure legends were also rewritten to allow for a better understanding of the figures. Lastly, the text has been revised by scientific writers at American Journal Experts, as suggested by JID (please see accompanying certificate). The concentrations should be presented as nM or pM throughout (not wt/vol) The concentrations in the manuscript were expressed in molar units whenever possible. In the case of Matrigel, the concentration was expressed as w/v, as Matrigel is a poorly characterised mixture of extracellular matrix proteins. The same is true for foetal bovine serum (FBS). Due to the heterogeneity of the antibodies, the polyclonal antibody concentrations were expressed in w/v because it is impossible to calculate the molar concentration of a specific antibody in a given mixture. For monoclonal antibodies, estimation of molar concentration is also inaccurate, as the exact MW of these glycoproteins varies with composition and it is usually not known. Most antibody concentrations in the literature are expressed as μg/ml.
Page 52 of 71Journal of Investigative Dermatology
123456789101112131415161718192021222324252627282930313233343536373839404142434445464748495051525354555657585960

For Review O
nly
Response to reviewers MS# JID‐2011‐0017
2
Concentrations of detergents, glycerol, p‐formaldehyde and hydrogen peroxide are usually expressed in % (w/v or v/v) and are difficult to compare with other experimental conditions when expressed in molarity. We preferred to keep them as %. Reviewer: 2 Comments to the Author SPARC is a multifunctional extracellular matrix protein that is often overexpressed in human cancer. Here, SPARC expression has been down regulated in melanoma cells using siRNA technology. The changes in the pattern of secreted proteins (secretome) have been listed. Some on the putatively SPARC regulated proteins have been studied further. Based on the results SPARC is claimed to regulate cathepsin B and cathepsin B dependent invasion in a manner that involves alpha2beta1 integrin and collagen I. Furthermore, TGF‐beta seems to participate in the process. The authors also show evidence that SPARC regulates E‐ and N‐cadherin. This is a very complex and confusing manuscript. For several reasons it is in many cases very difficult to know, what the authors have actually done and what is the meaning of the results. The text was thoroughly rewritten, and we tried to clarify our objectives and their relationship with the results. First, the figures are complex and the figure legends give minimal support. The legends were rewritten to clarify what is shown in the figures. To simplify the figures, we have eliminated some of the bars and comparisons. Some of this information has been placed in the Supplemental Section. We hope that the changes clarify the results without compromising the overall understanding of the experiments and their controls. The symbols indicating statistical significance are confusing and not telling what are the columns that have actually been compared to each other. As stated above, the figures have been simplified, and we believe that these changes make the statistical comparisons easier to understand. Second, the text itself is not very well written and lacks many important details about the technical performance of the experiments. We have added some experimental details either to the manuscript or to the extended Supplemental Materials and Methods section in response to the specific requests mentioned below. Third, different antibodies and inhibitors have been used without showing control experiments to confirm that the reagents are actually working in these experimental conditions. The specific control experiments that this reviewer requests are stated below. We do hope our responses are satisfactory to this reviewer.
Page 53 of 71 Journal of Investigative Dermatology
123456789101112131415161718192021222324252627282930313233343536373839404142434445464748495051525354555657585960

For Review O
nly
Respon
Finally,mechapotentmanusThe ratone biomore tapproametastexpresthan apcontribmechain vivo More dFigure from aThere wconcenHere w
To elimwould Our SYmateriinsteadimmun
nse to review
, the differennisms how SPtial mechanismscript. tionale for ouological pathwthan one metach, which ledtasis. We chosed by DIGE applying the mbution would nisms that re.
detailed comm1a. Why FAM separate expwere two diffntrations of ewe are enclosi
minate confusbe acceptabl
YPRO‐stained al in a separad of being tranoblots, the c
wers MS# JID‐2
t experimentPARC could wms in a more
ur study was tway that leadastatic pathwd us to severase to evaluatact together tmore classical encourage thegulate cathe
ments: M3C/ILEI lanesperiment? Stiferent filter pach replica toing the origin
sion, we decide to the revieloading contrate gel that wnsferred. Becontrol image
2011‐0017
ts mainly givework in cancerdetailed man
that SPARC, ads to metastaway. This is thal EMT‐relatee how severato promote mapproach of he SPARC‐relapsin B and N‐
s are in two sll the same lopieces for FAMo obtain an imal raw image
ded to separaewer. rols were per
was run in the cause the sam is the same f
e preliminary r. It would hanner and leav
acting from thsis. In this wae reason whyd proteins alral proteins thametastasis in Sstudying oneated scientific‐cadherin in r
separate pieceoading controM3C because mage that coue for the expe
ate all replicas
rformed by casame PAGE c
me conditionefor all cases. I
suggestions aave been mucve rest of the
he extracellulay, SPARC is ay we chose a ready knownat we found tSPARC‐expree pathway in dc community relationship w
es of filter, unol picture is usblotting was uld be quantiferiment you a
s with bars in
arefully loadincell and then ed media wasIn any case, w
about the diffch better to stdata outside
ar milieu, affea master geneglobal proteo to be involveto be differenssing melanodetail. It is ou to elucidate with SPARC bo
nlike the othesed. performed fofied without sre referring t
n Figure 1. We
ng the same vstained with s used for eacwe always con
ferent tudy one of te the
ects more thae that regulatomics ed in ntially omas rather ur wish that othe detailed oth in vitro an
ers? Is this blo
or two differesaturation. to.
e hope this
volume of SYPRO Ruby ch of these ntrolled for
3
he
an tes
our
nd
ot
ent
Page 54 of 71Journal of Investigative Dermatology
123456789101112131415161718192021222324252627282930313233343536373839404142434445464748495051525354555657585960

For Review O
nly
Response to reviewers MS# JID‐2011‐0017
4
gross loading mistakes by staining each membrane with Ponceau S Red; however, we have seen that Ponceau S Red lacks sufficient sensitivity for most of our protein loads and is not a consistent loading control, as it does not have a “final point” and continues to destain, sometimes in an irregular fashion. Figure 2. What is actually the role of cathepsin B in cell invasion? What does CA‐074 do (in addition to blocking the enzymatic activity of cathepsin B). Have the authors tested that it does not affect the expression levels of proteins that are critical for invasion? Can it penetrate through plasma membrane and block intracellular cathepsins? It is well known that cathepsin B is involved in in vitro and in vivo tumour invasion, particularly in melanoma (Mohamed and Sloane 2006, Roshy et al 2003, Rozhin et al 1994), among others). CA‐074 was designed many years ago as a specific inhibitor of cathepsin B based in the X‐ray structure of cysteine proteinases (Murata et al 1991, Towatari et al 1991, Turk et al 1995, Yamamoto et al 1997, Yamamoto et al 2000). It is generally believed that CA‐074, a modified dipeptide, cannot penetrate the cell membrane due to its negatively charged carboxylate group (Buttle et al 1992), although one reference suggests that CA‐074 may affect intracellular (probably cell‐membrane associated) cathepsin B at higher concentrations as well (Szpaderska and Frankfater 2001). The specificity of CA‐074 for cathepsin B has been well established, and our final working concentration (10 µM) is equivalent to 5,000X the IC50 of CA‐074 for cathepsin B (as measured in vitro) and well below the IC50 for cathepsin L (172 µM) and H (420 µM)(Buttle et al 1992, Murata et al 1991). Several papers have used CA‐074 as a specific inhibitor of cathepsin B both in vitro and in vivo without deleterious effects (Linebaugh et al 1999, Maekawa et al 1998, Matarrese et al 2010, Sameni et al 2000, Tu et al 2008). Moreover, the 10 µM concentration has been used in several papers in which several physiological conditions have been evaluated (Linebaugh et al 1999, Sameni et al 2000). Figure 3b. What has actually been done here? The cells were plated on collagen I or fibronectin for 24 h before invasion assay? How were they detached (trypsin, collagenase, EDTA?). Did all the cells attach or was there a selection of cells that could attach to different matrices? Did the cells proliferate similarly on both matrices? We apologise for the lack of sufficient detail for this experiment, as this is the consequence of word constraints. We have corrected this inaccuracy by moving some of the information from Supplemental Materials and Methods section into the body of the paper and adding some of the missing details. Briefly, monomeric collagen I or fibronectin coatings were prepared by overnight incubation of culture dishes with 5 µg/cm2 collagen or fibronectin at 4°C. LBLAST and L2F6 were grown for 24 h on either uncoated or collagen‐ or fibronectin‐coated dishes and > 90% cells attached on all substrates after 12 h. Cells were then detached from the plate using EDTA, washed twice in PBS, resuspended in serum‐free growth medium free and loaded into the invasion chamber. MTT assays performed on detached cells revealed no significant differences in proliferation rates.
Page 55 of 71 Journal of Investigative Dermatology
123456789101112131415161718192021222324252627282930313233343536373839404142434445464748495051525354555657585960

For Review O
nly
Response to reviewers MS# JID‐2011‐0017
5
Figure 3c. There is a lot of variation in the loading control. It would have been much better to blot with a control antibody and analyse the bands quantitatively. We admit that our loading control for this figure was not of sufficient quality. We redid the experiment with new preparations and added the new image to the figure. Please note that in this image, the highly increased intensity of the cathepsin B band seen at the “L2F6 treated with 30 uM SPARC” (fourth lane) condition has not been reproduced in other replicas (see Figure 1e in the manuscript as an example). We believe this difference is due to experimental variation. In any case, it does not go against our hypothesis but underscore the role of SPARC as a cathepsin B inducer. There is no consensus regarding proteins that can be used as loading controls for conditioned media. A survey of the literature indicates that > 90% of the papers that publish immunoblots of conditioned media use either Ponceau S Red membrane staining or a Coomassie‐ or SYPRO Ruby‐stained gel run in parallel. As we previously mentioned, we have seen that Ponceau S Red lacks sufficient sensitivity for most of our protein loads and is not a consistent loading control. In a recent paper, Fenouille et al. have used fibronectin as a loading control (Fenouille et al 2011). In previous proteomic experiments, we have seen some degree of dependence of fibronectin on the SPARC concentration. For this reason, we did not choose fibronectin as a loading control. Figures 4 and 5. Anti‐TGF‐beta and TGF‐beta receptor antagonist should be controlled by measuring their effects on TGF‐beta signaling e.g. Smad phosphorylation. It is not possible to say, whether the role of TGF‐beta is partial without information about the potency of the antibody/inhibitor concentrations used in the experiments. From a survey of the current literature, we have chosen a concentration of 10 µM SB431542 as effective for the blockage of TGFβ1 signalling (Ali et al 2008, Halder et al 2005, Laping et al 2002, Matsuyama et al 2003). However, we could perform a measurement of the level of Smad‐1 phosphorylation in cells treated with increasing concentrations of SB431542. Our result was as follows (the numbers are raw (non normalised) optical densities relative to LB with no inhibitor):
Page 56 of 71Journal of Investigative Dermatology
123456789101112131415161718192021222324252627282930313233343536373839404142434445464748495051525354555657585960

For Review O
nly
Respon
As shoabolishperformloadingintensiThe onwas PophosphsaturatRegardthe antArgentthat th2010, Ydatashin prol
nse to review
wn, a 10 uM hes SMAD‐1 pm a loading cg controls. Wity values, 10 nly loading coonceau S Red ho‐SMAD levetion effects. ding the blocktibody and wtina are commhe concentratYu et al 2009)eet, which iniferation assa
wers MS# JID‐2
inhibitor conphosphorylaticontrol with then using anyµM SB43154ntrol performstaining. As wels, actin was
king antibodyere not able tmon from moion used was). Furthermordicates that oays.
2011‐0017
centration, wion. We couldhis antibody. y of the putat42 inhibits momed in the mewe had to loas probed in a
y, we were noto obtain a nest our vendos enough to bre, the suppliour concentra
which is used td not obtain aFor this reastive loading core than 80% embrane expoad a fairly highmembrane w
ot able to perew aliquot in rs). However,lock TGFβ1 per, R+D Systeation of 5 µg/
throughout tan anti‐total Son, we decidcontrols to coof LBLAST phosed to anti‐ph amount of pwith 10 times
rform the exp time (delays, several datapathway (Leeems, provides/ml is effectiv
he paper, praSMAD‐1 antibed to show seorrect for phohospho‐SMADphospho‐SMAprotein to visless protein d
periment as w of > 60 days a in the literate et al 2005, Ws the followinve as a TGFβ1
actically body on time everal differeospho‐SMAD‐D‐1 levels. AD‐1 antibodsualise due to the
we ran out of on orders toture indicate Welser et al g figure in its1 blocking age
6
to ent 1
y
s ent
Page 57 of 71 Journal of Investigative Dermatology
123456789101112131415161718192021222324252627282930313233343536373839404142434445464748495051525354555657585960

For Review O
nly
Respon
DiscussWe havfinding ReviewCommMajor Figure It is noyou mecultureWe reapreparthis maform (aCells wPBS ancollect(MillipoHealthan SDSnitroceSYPROmembSupple
nse to review
sion is very spve rewritten gs of our work
wer: 3 ents to the APoints:
1: ot defined howeasure total pes? Which amalised that, toration and loaatter to all reand in the Suwere seeded and incubateded into a proore, Billericacare, WaukesS‐PAGE gel. Thellulose mem Ruby (Sigmranes were inemental Mate
wers MS# JID‐2
peculative. the discussiok. We hope th
uthor
w cell supernaprotein amoumount of supeo keep within ading proceduaders, the folpplemental Mat 80% conflud in serum‐fotease inhibita, MA). Thesha, WI), andhe proteins wbranes. Unifo
ma) and rechncubated in aerials and Me
2011‐0017
n section to dhis reviewer f
atants or cellunts or did yoernatants/cellthe word limure. This was llowing paragMaterials anduence in 150 ree medium or cocktail, ce concentratd a fixed amowere separateorm loading whecked by sappropriate dethods for d
decrease the finds the revis
extracts weru quantify thl extracts wasmits, we faileda serious misgraph was inc Methods secmm‐plates, gfor an addleared and coed media wount of total ped in a 12% Swas verified wstaining the dilutions of eaetails) and d
amount of spsions accepta
re prepared pe cell numbes loaded ontod to describe tstake and we cluded in the ction in its cogrown for 24 itional 24 hroncentrated were quantifprotein (geneDS‐polyacrylawith a gel runmembrane ach primary adetected usin
peculation anable.
prior to immurs of the corro the gels? the western bapologise fomanuscript inmplete form)h, washed thr. Conditione30‐fold usingfied by 2D‐erally 5 μg,) wamide gel andn in parallel awith Ponceaand secondarng ECL‐Plus (G
nd focus on th
noblotting. Dresponding ce
blot sample r it. To clarifyn an abridged): hree times wed media weg a CentriprepQuant Kit (was loaded ind transferrednd stained wau S Red. Try antibody (sGE Healthcar
7
he
Did ell
y d
with ere p‐3 GE nto to
with The see re).
Page 58 of 71Journal of Investigative Dermatology
123456789101112131415161718192021222324252627282930313233343536373839404142434445464748495051525354555657585960

For Review O
nly
Respon
Imagesthe tot Did youanalyseTo ansand X fkD) andwe bel
With recathepa physcathepbelow show tthis reaaccordwith cametast Please imagescell deand no
nse to review
s were quantital protein loa
u only find aced supernatawer the first for your evalud the matureieve that cath
egard to the spsin forms is tiologically reapsin B maturehave been prthat practicallason, we havance with ouathepsin B, netatic cell spre
provide betts. Did you quansity comparormalized to c
wers MS# JID‐2
ified using Imading.
ctive forms ofnts? If so, hoquestion, weuation. Accor form (ca. 24 hepsin X is se
second questthe result of tasonable equ forms in the roposed to coly all melanome not evaluatur results, Maeither chemicading and dis
er images of antify vimentred to the LB tcell number in
2011‐0017
mage J (Rasban
f cathepsin L aw do you exp are enclosingding to the mkD), in cathe
een as its prop
tion, we beliethe balance oilibrium. Pleaconditioned
ontrol the levma invasive cted the effecttarrese et al.cal nor biologssemination (
the vimentin tin positive cetumor. Vimenn both, L2 and
nd WS. Image
and X and noplain the secreg crude image
molecular weigepsin X as a diprotein and c
eve that the raf the differenase see belowmedium; at lels of other capacity is expts of other cathave recentl
gical inhibitorsMatarrese et
analysis, eithells in experimntin positive cd LB tumors.
e J). Values w
o proforms of etion of actives of whole wght expectedimer of light (athepsin L is
atio betweennt mechanismw for an explaleast some ofcathepsins. Plplained by catthepsins in my found that,s of cathepsint al 2010).
her a higher mmental tumorcells should b
were normalis
the proteaseve cathepsins western blotsd for the prop(4.8 kD) and hthe mature fo
n the immaturms that keep tanation for thf the mechanease note thathepsin B act
melanoma inv, in contrast tns D and L aff
magnificationrs? The L2 tumbe counted pe
sed according
es in the L and X?
s for cathepsinprotein (ca. 35heavy (19 kD)orm.
re and maturtheir activity ie absence of isms describeat our resultsion alone; forasion. In o what is seefect melanom
n or bigger mor shows leser visual field
8
g to
n L 5 ),
e in
ed s r
en ma
ss
Page 59 of 71 Journal of Investigative Dermatology
123456789101112131415161718192021222324252627282930313233343536373839404142434445464748495051525354555657585960

For Review O
nly
Respon
We havfield ofnoted The facthe sca
We havto showactuall b)+c) Esupernsame aequal cAs we preparproced Could yconcenof cathBut sinthe difactivity
nse to review
ve changed tf the same picwith arrows. ct that L2F6 tarcity of tumo
ve not quantiw a qualitativy showing (w
Especially connatant analyseamounts meacell numbers mentioned pration and loadure followed
you find activntrated or prehepsin B activnce this assay ferent amouny.
wers MS# JID‐2
he images to cture in whicLBLAST tumoumours practour cells in th
ified a relativve comparisonwithin the sen
cerning this eed. Was it conasured in µl? Oor did you mreviously, weading procedud for this imm
ve forms of caecipitated? Thvity. Concentruses pepsin tnts of procath
2011‐0017
larger ones (h the positiveour cells are ptically do not ese tumours.
e number of n (absence/psitivity limits
experiment itncentrated oOr did you loaeasure total pe realised thature. This was munoblot was
athepsin B behis would be rated supernato activate alhepsin B in th
400X) as reque signals are bpositive for vigrow in this . The followin
positive cellsresence), as wof this immu
t would be intr pure? How ad certain amprotein amout we failed toa serious misthe same as
esides to the palso of great atants were uso latent proche supernatan
uested. The inbest seen. Thmentin whilein vivo modeng are the dat
s because thewe think this nohistochem
teresting to kdid you norm
mounts of supunts? o describe thestake and we described ab
proform wheimportance rused for the acathepsin B, tnts rather tha
nsets show a e tumour cele L2F6 are notl (Sosa et al 2ta as publishe
purpose of tis what the im
mical staining)
know the amomalize? Did yopernatants co
e western bloapologise foove.
n supernatanregarding thessay to measthe result migan differences
2X‐enlargedls have been t. 2007) explainsed in Sosa et a
hese images mages are ).
ount of ou load the rresponding t
t sample r it. The
nts were e measuremesure activity. ght only refles in catalytic
9
s al.:
is
to
nt
ect
Page 60 of 71Journal of Investigative Dermatology
123456789101112131415161718192021222324252627282930313233343536373839404142434445464748495051525354555657585960
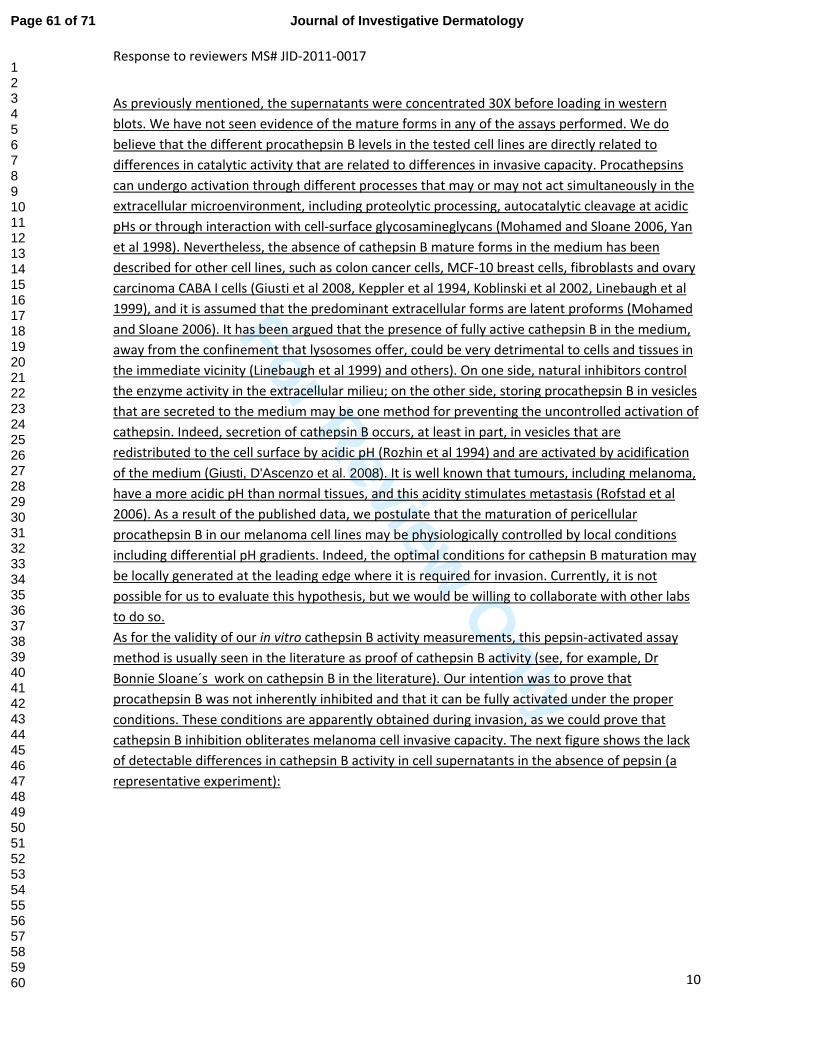
For Review O
nly
Response to reviewers MS# JID‐2011‐0017
10
As previously mentioned, the supernatants were concentrated 30X before loading in western blots. We have not seen evidence of the mature forms in any of the assays performed. We do believe that the different procathepsin B levels in the tested cell lines are directly related to differences in catalytic activity that are related to differences in invasive capacity. Procathepsins can undergo activation through different processes that may or may not act simultaneously in the extracellular microenvironment, including proteolytic processing, autocatalytic cleavage at acidic pHs or through interaction with cell‐surface glycosamineglycans (Mohamed and Sloane 2006, Yan et al 1998). Nevertheless, the absence of cathepsin B mature forms in the medium has been described for other cell lines, such as colon cancer cells, MCF‐10 breast cells, fibroblasts and ovary carcinoma CABA I cells (Giusti et al 2008, Keppler et al 1994, Koblinski et al 2002, Linebaugh et al 1999), and it is assumed that the predominant extracellular forms are latent proforms (Mohamed and Sloane 2006). It has been argued that the presence of fully active cathepsin B in the medium, away from the confinement that lysosomes offer, could be very detrimental to cells and tissues in the immediate vicinity (Linebaugh et al 1999) and others). On one side, natural inhibitors control the enzyme activity in the extracellular milieu; on the other side, storing procathepsin B in vesicles that are secreted to the medium may be one method for preventing the uncontrolled activation of cathepsin. Indeed, secretion of cathepsin B occurs, at least in part, in vesicles that are redistributed to the cell surface by acidic pH (Rozhin et al 1994) and are activated by acidification of the medium (Giusti, D'Ascenzo et al. 2008). It is well known that tumours, including melanoma, have a more acidic pH than normal tissues, and this acidity stimulates metastasis (Rofstad et al 2006). As a result of the published data, we postulate that the maturation of pericellular procathepsin B in our melanoma cell lines may be physiologically controlled by local conditions including differential pH gradients. Indeed, the optimal conditions for cathepsin B maturation may be locally generated at the leading edge where it is required for invasion. Currently, it is not possible for us to evaluate this hypothesis, but we would be willing to collaborate with other labs to do so. As for the validity of our in vitro cathepsin B activity measurements, this pepsin‐activated assay method is usually seen in the literature as proof of cathepsin B activity (see, for example, Dr Bonnie Sloane´s work on cathepsin B in the literature). Our intention was to prove that procathepsin B was not inherently inhibited and that it can be fully activated under the proper conditions. These conditions are apparently obtained during invasion, as we could prove that cathepsin B inhibition obliterates melanoma cell invasive capacity. The next figure shows the lack of detectable differences in cathepsin B activity in cell supernatants in the absence of pepsin (a representative experiment):
Page 61 of 71 Journal of Investigative Dermatology
123456789101112131415161718192021222324252627282930313233343536373839404142434445464748495051525354555657585960

For Review O
nly
Respon
d) Pleaor largpositivWe havnoted As prev(Sosa equantifqualitashowin f) The Lane 3 Also hereally pThe fol(right).We quvalues believediffereintensiof the mature
nse to review
ase provide beer images. Alve cells are neve replaced twith arrows. viously mentiet al 2007) exfied the relatative comparing (within the
cathepsin B icontains lessere it would bproof a decrellowing are th. In all cases, wantified the bon the top ofe this is accepnces into accity to the inteLB band and e form of cath
wers MS# JID‐2
etter images so here, the Learly not visibhe images wiLBLAST tumoioned, the facplains the scaive number oson (absencee sensitivity li
immunoblot ps protein and be important ase of cathephe crude imagwe loaded 5 bands on the f the image). ptable. Nevertcount. The noensity of the cdisplayed at thepsin B.
2011‐0017
of the cathepL2 tumor shoble in this presith larger oneour cells are pct that L2F6 tarcity of tumoof positive cele/presence), amits of this im
presented in might be a reto know, howpsin B in A3.ges obtained µg of total prwestern blotThe differenctheless, we crmalised dencorrespondingthe top of eac
psin B immunws less cell dsentation. es (400X) as repositive for caumours practour cells in thls because thas we believemmunohistoc
this figure is eason why now much super
for the westerotein from co and the laneces in loadingorrected the nsity of each bg SYPRO Rubych band. The
ostaining, eitensity compa
equested. Thathepsin B, wtically do not hese tumourshe purpose ofe this is what tchemical stain
not loaded eqo mature cathrnatant was a
ern blot (left)oncentrated ses of the SYPRg are not highimmunoblot band was calcy lane, and thonly significa
ther a higher ared to the LB
e tumour celhile L2F6 are grow in this . Again, we hf these imagethe images arning).
qually. hepsin B is deanalysed and
) and the SYPRsupernatantsRO Ruby gel (sher than 15%,results by taculated as a rhis ratio was rant change w
magnificationB tumor. The
ls have been not. in vivo modeave not es is to show are actually
etectable in Aif you could
RO ruby conts in the wells. shown as cru, and we king these ratio of their related to tha
was that of the
11
n
l
a
A3.
trol
de
at e
Page 62 of 71Journal of Investigative Dermatology
123456789101112131415161718192021222324252627282930313233343536373839404142434445464748495051525354555657585960
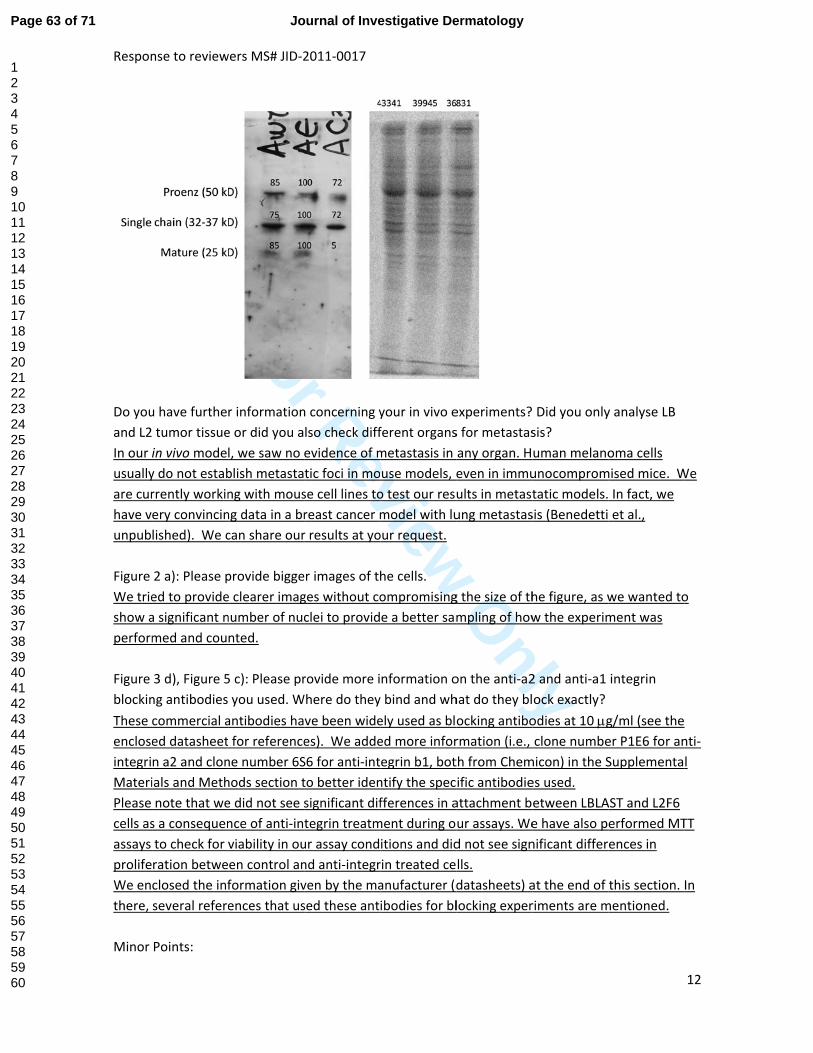
For Review O
nly
Respon
Do youand L2In our usuallyare curhave vunpub Figure We trieshow aperform Figure blockinThese encloseintegriMateriPlease cells asassays prolifeWe enthere, Minor
nse to review
u have furthe tumor tissuein vivo modey do not estabrrently workinery convincinlished). We c
2 a): Please ped to providea significant nmed and cou
3 d), Figure 5ng antibodiescommercial aed datasheetn a2 and clonials and Methnote that wes a consequento check for ration betweclosed the infseveral refere
Points:
wers MS# JID‐2
r informatione or did you al, we saw no blish metastang with mousng data in a brcan share our
provide biggee clearer imagnumber of nucnted.
5 c): Please pr you used. Wantibodies hat for referencene number 6Shods section te did not see snce of anti‐inviability in ouen control anformation givences that us
2011‐0017
n concerning ylso check diffevidence of mtic foci in mose cell lines toreast cancer mr results at yo
er images of thges without coclei to provid
rovide more iWhere do theyve been widees). We addeS6 for anti‐intto better idensignificant diftegrin treatmur assay condnd anti‐integrven by the mased these ant
your in vivo eferent organsmetastasis in use models, eo test our resmodel with luour request.
he cells. ompromisinge a better sam
nformation oy bind and whely used as bled more inforegrin b1, botntify the specfferences in ament during oitions and didrin treated ceanufacturer (dibodies for bl
experiments?s for metastasany organ. Heven in immuults in metastung metastas
g the size of thmpling of how
on the anti‐a2hat do they blocking antibormation (i.e., th from Chemific antibodieattachment bur assays. Wed not see signlls. datasheets) alocking exper
Did you onlysis? uman melanounocompromtatic models.sis (Benedetti
he figure, as ww the experim
2 and anti‐a1 ock exactly? odies at 10 μgclone numbe
micon) in the Ses used. etween LBLAe have also pnificant differ
at the end of riments are m
y analyse LB
oma cells mised mice. W In fact, we et al.,
we wanted toment was
integrin g/ml (see theer P1E6 for anSupplementa
AST and L2F6 erformed MTences in
this section. mentioned.
12
We
o
nti‐l
TT
In
Page 63 of 71 Journal of Investigative Dermatology
123456789101112131415161718192021222324252627282930313233343536373839404142434445464748495051525354555657585960

For Review O
nly
Response to reviewers MS# JID‐2011‐0017
13
p. 5, line 49: Please define DIGE. We defined DIGE in the text of the manuscript and added this abbreviation to the list of abbreviations. p. 10, line 10: Do you mean 0.1ng/ml or 0.1µg/ml TGFß1? Later on (Fig. S4) you say 0.1ng/µl TGFß1. Please check for consistent information. The concentration of TGFβ1 was erroneously stated; the final working concentration was 1 ng/ml obtained from a stock of 0.1 ng/µl. We apologise for this mistake. The change has been stated in the Materials and Methods section. p. 14, line 57: Is it a 10x or a 100x magnification? This experiment was conducted using a 100X total magnification, and this sentence was corrected in the text. p. 15, line 14: Please change 0,05 and 0,23 to 0.05 and 0.23 p. 15, line 20: Please change 0,1 to 0.1 These mistakes were corrected as suggested. Please note that antibody concentrations have been moved to Supplemental Materials and Methods. The TGFβ1 concentration was erroneously stated; it was 1 ng/ml and was therefore corrected. p. 16, line 23: 4°C This correction has been made to the revised text. p. 16, line 43: p‐value This information was moved to the Supplemental Materials and Methods section and corrected as suggested. p. 39, line 52: 2cm³ This correction has been made to the revised text. p. 40, lines 10 and 14: Please provide the concentration of the antibodies used and not the dilution. Information about clone or catalogue number of antibodies was added along with their concentration in μg/ml. p. 48, lines 37 and 40: See point 2. Please change 0,1 to 0.1. This correction has been made to the revised text.
Page 64 of 71Journal of Investigative Dermatology
123456789101112131415161718192021222324252627282930313233343536373839404142434445464748495051525354555657585960

For Review O
nly
Response to reviewers MS# JID‐2011‐0017
14
References for Response to Reviewers
Ali NA, Gaughan AA, Orosz CG, Baran CP, McMaken S, Wang Y et al (2008). Latency Associated Peptide Has In Vitro and In Vivo Immune Effects Independent of TGF‐β1. PLoS ONE 3: e1914.
Buttle DJ, Murata M, Knight CG, Barrett AJ (1992). CA074 methyl ester: a proinhibitor for intracellular cathepsin B. Arch Biochem Biophys 299: 377‐380.
Fenouille N, Robert G, Tichet M, Puissant A, Dufies M, Rocchi S et al (2011). The p53/p21Cip1/ Waf1 pathway mediates the effects of SPARC on melanoma cell cycle progression. Pigment Cell Melanoma Res 24: 219‐232.
Giusti I, D'Ascenzo S, Millimaggi D, Taraboletti G, Carta G, Franceschini N et al (2008). Cathepsin B mediates the pH‐dependent proinvasive activity of tumor‐shed microvesicles. Neoplasia 10: 481‐488.
Halder SK, Beauchamp RD, Datta PK (2005). A specific inhibitor of TGF‐beta receptor kinase, SB‐431542, as a potent antitumor agent for human cancers. Neoplasia 7: 509‐521.
Keppler D, Waridel P, Abrahamson M, Bachmann D, Berdoz J, Sordat B (1994). Latency of cathepsin B secreted by human colon carcinoma cells is not linked to secretion of cystatin C and is relieved by neutrophil elastase. Biochim Biophys Acta 1226: 117‐125.
Koblinski JE, Dosescu J, Sameni M, Moin K, Clark K, Sloane BF (2002). Interaction of human breast fibroblasts with collagen I increases secretion of procathepsin B. J Biol Chem 277: 32220‐32227.
Laping NJ, Grygielko E, Mathur A, Butter S, Bomberger J, Tweed C et al (2002). Inhibition of Transforming Growth Factor (TGF)‐beta 1‐Induced Extracellular Matrix with a Novel Inhibitor of the TGF‐beta Type I Receptor Kinase Activity: SB‐431542. Mol Pharmacol 62: 58‐64.
Lee EO, Kang JL, Chong YH (2005). The amyloid‐beta peptide suppresses transforming growth factor‐beta1‐induced matrix metalloproteinase‐2 production via Smad7 expression in human monocytic THP‐1 cells. J Biol Chem 280: 7845‐7853.
Linebaugh BE, Sameni M, Day NA, Sloane BF, Keppler D (1999). Exocytosis of active cathepsin B enzyme activity at pH 7.0, inhibition and molecular mass. Eur J Biochem 264: 100‐109.
Maekawa Y, Himeno K, Ishikawa H, Hisaeda H, Sakai T, Dainichi T et al (1998). Switch of CD4+ T cell differentiation from Th2 to Th1 by treatment with cathepsin B inhibitor in experimental leishmaniasis. J Immunol 161: 2120‐2127.
Page 65 of 71 Journal of Investigative Dermatology
123456789101112131415161718192021222324252627282930313233343536373839404142434445464748495051525354555657585960

For Review O
nly
Response to reviewers MS# JID‐2011‐0017
15
Matarrese P, Ascione B, Ciarlo L, Vona R, Leonetti C, Scarsella M et al (2010). Cathepsin B inhibition interferes with metastatic potential of human melanoma: an in vitro and in vivo study. Mol Cancer 9: 207.
Matsuyama S, Iwadate M, Kondo M, Saitoh M, Hanyu A, Shimizu K et al (2003). SB‐431542 and Gleevec inhibit transforming growth factor‐beta‐induced proliferation of human osteosarcoma cells. Cancer Res 63: 7791‐7798.
Mohamed MM, Sloane BF (2006). Cysteine cathepsins: multifunctional enzymes in cancer. Nat Rev Cancer 6: 764‐775.
Murata M, Miyashita S, Yokoo C, Tamai M, Hanada K, Hatayama K et al (1991). Novel epoxysuccinyl peptides. Selective inhibitors of cathepsin B, in vitro. FEBS Lett 280: 307‐310.
Rofstad EK, Mathiesen B, Kindem K, Galappathi K (2006). Acidic Extracellular pH Promotes Experimental Metastasis of Human Melanoma Cells in Athymic Nude Mice. Cancer Res 66: 6699‐6707.
Roshy S, Sloane BF, Moin K (2003). Pericellular cathepsin B and malignant progression. Cancer Metastasis Rev 22: 271‐286.
Rozhin J, Sameni M, Ziegler G, Sloane BF (1994). Pericellular pH affects distribution and secretion of cathepsin B in malignant cells. Cancer Res 54: 6517‐6525.
Sameni M, Moin K, Sloane BF (2000). Imaging proteolysis by living human breast cancer cells. Neoplasia 2: 496‐504.
Sosa MS, Girotti MR, Salvatierra E, Prada F, de Olmo JA, Gallango SJ et al (2007). Proteomic analysis identified N‐cadherin, clusterin, and HSP27 as mediators of SPARC (secreted protein, acidic and rich in cysteines) activity in melanoma cells. Proteomics 7: 4123‐4134.
Szpaderska AM, Frankfater A (2001). An intracellular form of cathepsin B contributes to invasiveness in cancer. Cancer Res 61: 3493‐3500.
Towatari T, Nikawa T, Murata M, Yokoo C, Tamai M, Hanada K et al (1991). Novel epoxysuccinyl peptides. A selective inhibitor of cathepsin B, in vivo. FEBS Lett 280: 311‐315.
Page 66 of 71Journal of Investigative Dermatology
123456789101112131415161718192021222324252627282930313233343536373839404142434445464748495051525354555657585960
For Review O
nly
Response to reviewers MS# JID‐2011‐0017
16
Tu C, Ortega‐Cava CF, Chen G, Fernandes ND, Cavallo‐Medved D, Sloane BF et al (2008). Lysosomal cathepsin B participates in the podosome‐mediated extracellular matrix degradation and invasion via secreted lysosomes in v‐Src fibroblasts. Cancer Res 68: 9147‐9156.
Turk D, Podobnik M, Popovic T, Katunuma N, Bode W, Huber R et al (1995). Crystal structure of cathepsin B inhibited with CA030 at 2.0‐A resolution: A basis for the design of specific epoxysuccinyl inhibitors. Biochemistry 34: 4791‐4797.
Welser JV, Li L, Milner R (2010). Microglial activation state exerts a biphasic influence on brain endothelial cell proliferation by regulating the balance of TNF and TGF‐beta1. J Neuroinflammation 7: 89.
Yamamoto A, Hara T, Tomoo K, Ishida T, Fujii T, Hata Y et al (1997). Binding mode of CA074, a specific irreversible inhibitor, to bovine cathepsin B as determined by X‐ray crystal analysis of the complex. J Biochem 121: 974‐977.
Yamamoto A, Tomoo K, Hara T, Murata M, Kitamura K, Ishida T (2000). Substrate specificity of bovine cathepsin B and its inhibition by CA074, based on crystal structure refinement of the complex. J Biochem 127: 635‐643.
Yan S, Sameni M, Sloane BF (1998). Cathepsin B and human tumor progression. Biol Chem 379: 113‐123.
Yu AL, Fuchshofer R, Kook D, Kampik A, Bloemendal H, Welge‐Lussen U (2009). Subtoxic oxidative stress induces senescence in retinal pigment epithelial cells via TGF‐beta release. Invest Ophthalmol Vis Sci 50: 926‐935.
Page 67 of 71 Journal of Investigative Dermatology
123456789101112131415161718192021222324252627282930313233343536373839404142434445464748495051525354555657585960

For Review O
nly
For research use only; not for use as a diagnostic.
2003-2005: CHEMICON International, Inc. - By CHEMICON International, Inc. All rights reserved. No part of these works may be reproduced in any form without permissions in writing.
USA & Canada • Phone: +1(800) 437-7500 • Fax: +1 (951) 676-9209 • Europe +44 (0) 23 8026 2233 Australia +61 3 9839 2000 • Germany +49-6192-207300 • ISO Registered worldwide
www.chemicon.com • [email protected] • [email protected]
07/17/02/MAB1950/LMF
MOUSE ANTI-HUMAN INTEGRIN α2 MONOCLONAL ANTIBODY
CATALOG NUMBER: MAB1950 LOT NUMBER: QUANTITY: 100 µg CONCENTRATION: 1 mg/mL SPECIFICITY: Human α2 integrin. ISOTYPE: IgG1 CLONE NAME: P1E6 APPLICATIONS: Suitable for use in attachment inhibition assays using fibroblasts, epithelial cells, endothelial
cells, and non-activated platelets on collagen types I, III, IV, VI and laminin. Suitable for immunofluorescence using fresh frozen or acetone fixed tissues or cell culture.
Not recommend for tradional formalin fixed paraffin embedded tissue. Final working dilutions must be determined by end user.
FORMAT: Purified from ascites fluid by protein A chromatography. PRESENTATION: Purified immunoglobulin in 0.02 M phosphate buffer, 0.25 M sodium chloride, pH 7.6, 0.1%
sodium azide. STORAGE/HANDLING: Maintain at 2-8°C in undiluted aliquots for up to 6 months. REFERENCES: Wayner, E. A., et al. (1988). J. Cell Biol., 107:1881. Sanchez-Mateos, P., et al. (1993). J. Immunol., 151:3817.
Kapron-Bras, C., et al. (1993). J. Biol. Chem., 268:20701. Pilcher, B., et al. (1997). J. Cell Bio. 137(6):1445-1457. Davis, G., et al. (1993). J. Immunol. 151(12): 7138-7150.
Important Note: During shipment, small volumes of product will occasionally become entrapped in the seal of the product vial. For products with volumes of 200 µl or less, we recommend gently tapping the vial on a hard surface or briefly centrifuging the vial in a tabletop centrifuge to dislodge any liquid in the container’s cap.
In general, the following secondary antibodies can be used with this primary antibody:
Immunohistochemistry - Rabbit anti-Mouse IgG, Peroxidase (AP160P) Immunohistochemistry - Rabbit anti-Mouse IgG, Alkaline Phosphatase (AP160A)
Immunofluorescent - Rabbit anti-Mouse IgG, FITC (AP160F) Immunofluorescent - Rabbit anti-Mouse IgG, Rhodamine (AP160R)
CHEMICON has a complete listing of our affinity purified second antibodies and conjugates listed in our Immunological Reagents Catalog. CHEMICON Technical Service would be happy to assist you in selecting an appropriate antibody for your system. Call our Technical Service Department for additional information now at 1-800-437-7500.
Page 68 of 71Journal of Investigative Dermatology
123456789101112131415161718192021222324252627282930313233343536373839404142434445464748495051525354555657585960

For Review O
nly
USA & Canada • Phone: +1(800) 437-7500 • Fax: +1 (909) 676-9209 • Europe +44 (0) 23 8026 2233 Australia +61 3 9839 2000 • Germany +49-6192-207300 • ISO Registered worldwide
www.chemicon.com • [email protected] • [email protected] 5/7/04/MAB2253/TB
MOUSE ANTI-HUMAN INTEGRIN beta1 [CD29] ADHESION-BLOCKING MONOCLONAL ANTIBODY
___________________________________________________________ CATALOG NUMBER:
MAB2253 QUANTITY: 100 µg
LOT NUMBER:
CONCENTRATION: 1 mg/mL
ALTERNATE NAMES:
CD29 HOST/ISOTYPE: Ms IgG1
CLONE NAME:
6S6
SPECIFICITY:
Reacts with the human integrin beta1 subunit. Specificity verified by preclearing of beta1 in immunoprecipitation, flow cytometry on transfectant cells displaying human beta1 integrin, and reactivity with purified beta1. Similar in behavior and characteristics to antibody clone 3S31.
IMMUNOGEN: Human synovial cells
APPLICATIONS:
Immunoprecipitation Immunohistochemistry on frozen sections Flow cytometry Blocks adhesion of cells to extracellular matrix proteins. Induces aggregation of certain lymphoid cells. Does not bind reduced beta1 integrin on Western blot. Optimal working dilutions must be determined by end user.
SPECIES REACTIVITY:
Human. Reactivity with other species has not been determined.
FORMAT: Purified immunoglobulin from Protein A Sepharose chromatography.
PRESENTATION:
Liquid in 0.02M PBS, pH 7.6, 0.25M NaCl containing 0.1% sodium azide.
STORAGE/HANDLING:
Maintain at 2-8°C for up to 12 months from date of receipt.
REFERENCES: Wilkins, JA, et al. (1996) J. Biol. Chemistry 271: 3046-3051 Gao, JX, et al. (1995) Cell. Immunol. 163: 178-186
For research use only; not for use as a diagnostic.
Important Note: During shipment, small volumes of product will occasionally become entrapped in the seal of the product vial. For
products with volumes of 200 µL or less, we recommend gently tapping the vial on a hard surface or briefly centrifuging the vial in a tabletop centrifuge to dislodge any liquid in the container’s cap.
Page 69 of 71 Journal of Investigative Dermatology
123456789101112131415161718192021222324252627282930313233343536373839404142434445464748495051525354555657585960

For Review O
nly
USA & Canada • Phone: +1(800) 437-7500 • Fax: +1 (909) 676-9209 • Europe +44 (0) 23 8026 2233 Australia +61 3 9839 2000 • Germany +49-6192-207300 • ISO Registered worldwide
www.chemicon.com • [email protected] • [email protected] 5/7/04/MAB2253/TB
2002-2004 CHEMICON® International, Inc. - By CHEMICON® International, Inc. All rights reserved. No part of these works may be reproduced in any form without permissions in writing.
Page 70 of 71Journal of Investigative Dermatology
123456789101112131415161718192021222324252627282930313233343536373839404142434445464748495051525354555657585960

For Review O
nly
American Jour 10 research u qualification quickest tu www.jou
nal Experts is aniversities. Ours to edit resear
urnaround timeurnalexperts.co
an association or editors come rch manuscriptss at the lowest
om, or for volum
of Ph.Ds and Phfrom nearly eves written by noprices in the in
me discounts fo
h.D. graduate stery research fien-native Englis
ndustry. For moor academic jou email at
tudents from Aeld and possessh speakers. We
ore informationurnals, please ct sales@journal
America's tops the higheste provide the, please visit
contact us byexperts.com
American Journal Experts Editorial Certification
This document certifies that the manuscript titled "SPARC promotes cathepsin B-mediated melanoma
invasiveness through a collagen I/21 integrin axis" was edited for proper English language,
grammar, punctuation, spelling, and overall style by one or more of the highly qualified native
English speaking editors at American Journal Experts. Neither the research content nor the authors'
intentions were altered in any way during the editing process.
Documents receiving this certification should be English-ready for publication - however, the author
has the ability to accept or reject our suggestions and changes. To verify the final AJE edited
version, please visit our verification page. If you have any questions or concerns over this edited
document, please contact American Journal Experts at [email protected]
Manuscript title: SPARC promotes cathepsin B-mediated melanomainvasiveness through a collagen I/21 integrinaxis
Authors: María Romina Girotti, Marisol FernándezRodríguez, Juan Antonio López, Emilio Camafeita,Elmer Fernández, Juan Pablo Albar, LorenaGabriela Benedetti, María Pía Valacco, RolfBrekken, Osvaldo Luis Podhajcer, and Andrea SabinaLlera.
Key: 5166-BFAA-26C9-E586-5819
This certificate may be verified at www.journalexperts.com/certificate
Page 71 of 71 Journal of Investigative Dermatology
123456789101112131415161718192021222324252627282930313233343536373839404142434445464748495051525354555657585960
Copyright © 2022 FDOKUMEN