Sonophotocatalytic (42kHz) degradation of Simazine in the presence of Au–TiO2 nanocatalysts
9
Applied Catalysis B: Environmental 160–161 (2014) 692–700 Contents lists available at ScienceDirect Applied Catalysis B: Environmental j ourna l h omepa ge: www.elsevier.com/locate/apcatb Sonophotocatalytic (42 kHz) degradation of Simazine in the presence of Au–TiO 2 nanocatalysts Panneerselvam Sathishkumar a,b,∗ , Ramalinga Viswanathan Mangalaraja a,∗ , Héctor D. Mansilla c , M.A. Gracia-Pinilla d,e , Sambandam Anandan f a Advanced Ceramics and Nanotechnology Laboratory, Department of Materials Engineering, Faculty of Engineering, University of Concepcion, Concepcion 407-0409, Chile b Department of Chemistry, Periyar Maniammai University, Vallam, Thanjavur 613403, Tamil Nadu, India c Faculty of Chemical Sciences, University of Concepcion, PO Box 160-C, Correo 3, Concepcion, Chile d Universidad Autónoma de Nuevo León, Facultad de Ciencias Físico-Matemáticas, Av. Universidad, Cd. Universitaria, San Nicolás de los Garza, NL, Mexico e Universidad Autónoma de Nuevo León, Centro de Investigación e Innovación en Desarrollo de Ingeniería y Tecnología, Avenida Alianza 101 Sur PIIT Monterrey, Apodaca 66600, NL, Mexico f Nanomaterials and Solar Energy Conversion Lab, Department of Chemistry, National Institute of Technology, Trichy 620 015, India a r t i c l e i n f o Article history: Received 12 April 2014 Received in revised form 27 May 2014 Accepted 17 June 2014 Available online 23 June 2014 Keywords: 42 kHz ultrasound Sonophotocatalysis Simazine HPLC and ESI-MS analysis a b s t r a c t The nano-size gold loaded visible light driven Au–TiO 2 nanophotocatalysts were synthesized using a commercial sonicator bath producing 42 kHz ultrasound. The X-ray diffraction (XRD), transmission electron microscopy (TEM) and high angle annular dark field (HAADF) scanning transmission electron microscopy (STEM) analyses revealed the gold nanoparticles incorporated in the TiO 2 resides at the sur- face of the nanocatalysts. An increased BET surface area was observed for the Au–TiO 2 when compared with the bare TiO 2 which gave the first notation that the gold nanoparticles modified the physico- chemical characteristics of the TiO 2 . The RAMAN spectrum shows the shift by ∼5 cm −1 at 639 cm −1 which indicated that the loaded gold nanoparticles were loaded on the surface of TiO 2 nanoparticles and thus confirms that the gold nanoparticles readily accepts the electronic charges created during the photoexcitation of Au–TiO 2 nanocatalysts. The Simazine (triazine based pesticide) was taken as the model pollutant to evaluate its sonocatalytic, photocatalytic and sonophotocatalytic degradation in the presence of TiO 2 and Au–TiO 2 nanocatalysts. The first order kinetics was observed for the Simazine degradation. The observed rate constants indicate that the order of degradation of Simazine was, sonopho- tocatalysis > sonocatalysis > photocatalysis. The additive effect was observed for the Au–TiO 2 assisted sonophotocatalytic degradation of Simazine. A 1.65 and 1.38 fold enhanced mineralization was achieved for the sonophotocatalytic degradation of Simazine when compared with the photocatalytic and sono- catalytic processes. The intermediates produced during the mineralization of Simazine were analyzed using ESI-MS analysis and based on that a suitable mechanism has been proposed. © 2014 Elsevier B.V. All rights reserved. 1. Introduction To increase the agricultural productivity, pesticides have been widely applied in its different forms such as insecticides, herbi- cides and fungicides. However the custom of pesticides in the ∗ Corresponding authors at: University of Concepcion, Department of Materials Engineering, Advanced Ceramics and Nanotechnology Laboratory, Edmundo Lare- nas 270, Concepcion, Chile. Tel.: +56 41 2207389; fax: +56 41 2203391. E-mail addresses: sathish [email protected], [email protected] (P. Sathishkumar), [email protected] (R.V. Mangalaraja). agricultural lands for the last five decades caused the notorious impact to the environment and its related hazardous effects to the living organisms [1–5]. Among the various pest control agents used in the agriculture, Simazine (2-chloro-4,6-bis(ethylamino)- s-triazine) (Fig. 1) is a triazine based synthetic pesticide which is the second largest one used to control the pest in the agricultural lands since 1956 [2,6–8]. The maximum solubility of Simazine in water is 5 mg/L [9], the excessive addition (or the undissolved quan- tity) of the Simazine in the agricultural lands was dissolved during the rainy season and the running water carries the Simazine from one end to the other end which tends to cause the environmental aquatic pollution. Arias-Estévez et al. [10] found that only a minor fraction of Simazine (0.1%) is effective for the pest killing action and http://dx.doi.org/10.1016/j.apcatb.2014.06.027 0926-3373/© 2014 Elsevier B.V. All rights reserved.
Transcript of Sonophotocatalytic (42kHz) degradation of Simazine in the presence of Au–TiO2 nanocatalysts
So
PHa
4b
c
d
e
Mf
a
ARRAA
K4SSH
1
wc
En
sm
h0
Applied Catalysis B: Environmental 160–161 (2014) 692–700
Contents lists available at ScienceDirect
Applied Catalysis B: Environmental
j ourna l h omepa ge: www.elsev ier .com/ locate /apcatb
onophotocatalytic (42 kHz) degradation of Simazine in the presencef Au–TiO2 nanocatalysts
anneerselvam Sathishkumara,b,∗, Ramalinga Viswanathan Mangalarajaa,∗,éctor D. Mansillac, M.A. Gracia-Pinillad,e, Sambandam Anandanf
Advanced Ceramics and Nanotechnology Laboratory, Department of Materials Engineering, Faculty of Engineering, University of Concepcion, Concepcion07-0409, ChileDepartment of Chemistry, Periyar Maniammai University, Vallam, Thanjavur 613403, Tamil Nadu, IndiaFaculty of Chemical Sciences, University of Concepcion, PO Box 160-C, Correo 3, Concepcion, ChileUniversidad Autónoma de Nuevo León, Facultad de Ciencias Físico-Matemáticas, Av. Universidad, Cd. Universitaria, San Nicolás de los Garza, NL, MexicoUniversidad Autónoma de Nuevo León, Centro de Investigación e Innovación en Desarrollo de Ingeniería y Tecnología, Avenida Alianza 101 Sur PIITonterrey, Apodaca 66600, NL, Mexico
Nanomaterials and Solar Energy Conversion Lab, Department of Chemistry, National Institute of Technology, Trichy 620 015, India
r t i c l e i n f o
rticle history:eceived 12 April 2014eceived in revised form 27 May 2014ccepted 17 June 2014vailable online 23 June 2014
eywords:2 kHz ultrasoundonophotocatalysisimazinePLC and ESI-MS analysis
a b s t r a c t
The nano-size gold loaded visible light driven Au–TiO2 nanophotocatalysts were synthesized usinga commercial sonicator bath producing 42 kHz ultrasound. The X-ray diffraction (XRD), transmissionelectron microscopy (TEM) and high angle annular dark field (HAADF) scanning transmission electronmicroscopy (STEM) analyses revealed the gold nanoparticles incorporated in the TiO2 resides at the sur-face of the nanocatalysts. An increased BET surface area was observed for the Au–TiO2 when comparedwith the bare TiO2 which gave the first notation that the gold nanoparticles modified the physico-chemical characteristics of the TiO2. The RAMAN spectrum shows the shift by ∼5 cm−1 at 639 cm−1
which indicated that the loaded gold nanoparticles were loaded on the surface of TiO2 nanoparticlesand thus confirms that the gold nanoparticles readily accepts the electronic charges created duringthe photoexcitation of Au–TiO2 nanocatalysts. The Simazine (triazine based pesticide) was taken asthe model pollutant to evaluate its sonocatalytic, photocatalytic and sonophotocatalytic degradationin the presence of TiO2 and Au–TiO2 nanocatalysts. The first order kinetics was observed for the Simazinedegradation. The observed rate constants indicate that the order of degradation of Simazine was, sonopho-
tocatalysis > sonocatalysis > photocatalysis. The additive effect was observed for the Au–TiO2 assistedsonophotocatalytic degradation of Simazine. A 1.65 and 1.38 fold enhanced mineralization was achievedfor the sonophotocatalytic degradation of Simazine when compared with the photocatalytic and sono-catalytic processes. The intermediates produced during the mineralization of Simazine were analyzedusing ESI-MS analysis and based on that a suitable mechanism has been proposed.© 2014 Elsevier B.V. All rights reserved.
. Introduction
To increase the agricultural productivity, pesticides have beenidely applied in its different forms such as insecticides, herbi-
ides and fungicides. However the custom of pesticides in the
∗ Corresponding authors at: University of Concepcion, Department of Materialsngineering, Advanced Ceramics and Nanotechnology Laboratory, Edmundo Lare-as 270, Concepcion, Chile. Tel.: +56 41 2207389; fax: +56 41 2203391.
E-mail addresses: sathish [email protected],[email protected] (P. Sathishkumar),[email protected] (R.V. Mangalaraja).
ttp://dx.doi.org/10.1016/j.apcatb.2014.06.027926-3373/© 2014 Elsevier B.V. All rights reserved.
agricultural lands for the last five decades caused the notoriousimpact to the environment and its related hazardous effects tothe living organisms [1–5]. Among the various pest control agentsused in the agriculture, Simazine (2-chloro-4,6-bis(ethylamino)-s-triazine) (Fig. 1) is a triazine based synthetic pesticide which isthe second largest one used to control the pest in the agriculturallands since 1956 [2,6–8]. The maximum solubility of Simazine inwater is 5 mg/L [9], the excessive addition (or the undissolved quan-tity) of the Simazine in the agricultural lands was dissolved during
the rainy season and the running water carries the Simazine fromone end to the other end which tends to cause the environmentalaquatic pollution. Arias-Estévez et al. [10] found that only a minorfraction of Simazine (0.1%) is effective for the pest killing action and
P. Sathishkumar et al. / Applied Catalysis B: En
N
N
N
Cl
NH NH
CH CH3
ttcrptm
tdpasttsfaowccstetmtt
epttcTntfOttwl3HetctaftcS
3
Fig. 1. Molecular structure of Simazine.
he remaining quantity enters into the environment which causeshe soil, air and water pollution. Moreover, triazine based pesti-ides have shown its reduced effect in the growth as well as theeproduction of zooplankton species [11]. Therefore, triazine basedesticides essentially need to be completely mineralized to avoidhe hazardous effects engendered by its presence in the environ-
ent.In order to completely mineralize the Simazine, some of the
echniques such as adsorption [12], ozonation [13,14], Fenton’s oxi-ation [7], UV photolysis [14] and biodegradation [15] have beenracticed in the past and among the various technologies avail-ble for the mineralization of Simazine, TiO2 photocatalysis havehown moderately enhanced degradation when compared withhe other methodologies. However, the disadvantages like adsorp-ion of the substrate and its derivatives on the surface of the solidupport, rate of migration of electronic charges produced at the sur-ace of nanocatalysts during photocatalysis need to be improved tottain the enhanced rate of mineralization. Hence, the combinationf photocatalysis with other advanced oxidation processes (AOPs)as expected to increase the rate of degradation of Simazine when
ompared to the effect of single-handed AOPs. In this study, weombined a 42 kHz low intensity ultrasound producing commercialonicator with the visible light assisted photocatalysis techniqueo improve the mineralization of Simazine. Concurrently, it isxpected that the combination of sonophotocatalysis can reducehe operating cost of the mineralization process and the develop-
ent of visible light responsive photocatalysts can further reducehe operating cost required for the sonophotocatalytic mineraliza-ion of organic contaminants.
Titanium dioxide is an extensively studied material for thenergy and environmental applications [16] and it could not behoto-excited by the wavelength greater than 387 nm which limitshe application of sunlight as an energy source for the excita-ion of TiO2. The loading of noble metals on the surface of TiO2an enhance the optical as well as catalytic properties [17–19].he surface plasmon resonance (SPR) emitted by the noble metalanoparticles can enhance the localized electric field in the con-iguous metal and/or semiconductor particles which allows toacilitate the formation of electronic charges (e− and h+) [20,21].n the other hand, the difference in the work function (ϕ) of
he gold nanoparticles (ϕAu = 5.1 eV) and TiO2 (ϕTiO2= 4.2 eV) fur-
her decreases the rate of recombination of electronic chargeshich are created during the photoexcitation of Au–TiO2 [22]. The
oaded gold nanoparticles can reduce the band gap of TiO2 from.2 eV and enhance the visible light response of the nanocatalysts.ence the loading of gold nanoparticles on the surface of TiO2nhances the physical separation of the electronic charges andhereby increasing the resulting quantum yield of the catalytic pro-esses. Based on the previous studies and the necessity to evaluatehe sonophotocatalytic efficiency of the gold loaded TiO2 nanocat-lysts, in this study, we synthesized the Au–TiO2 by a simple low
requency ultrasound (42 kHz) assisted sonochemical process andhe resulted nanocatalysts were employed to evaluate the sono-atalytic, photocatalytic, and sonophotocatalytic degradation ofimazine.vironmental 160–161 (2014) 692–700 693
2. Experimental
2.1. Materials and methods
Titanium dioxide (Aeroxide®P25) and Chloroauric acid trihy-drate (HAuCl4·3H2O) were purchased from Sigma-Aldrich and usedas the starting materials for the preparation of Au and Au–TiO2nanoparticles. Simazine (C7H12N5Cl) was received from Sigma-Aldrich and used without further purification. Unless otherwisespecified, all reagents used were of analytical grade and the solu-tions were prepared using double distilled water. The crystallitesize of the synthesized nanoparticles was calculated from theX-ray diffraction data (Philips PW1710 diffractometer, Cu K� radi-ation, Holland) using Scherrer equation. Surface morphology andmicrostructure of the nanocatalysts were analyzed by transmis-sion electron microscopy (TEM, FEI TITAN G2 80-300) operatedat 300 KeV. Diffuse reflectance UV–vis spectra of the nanocata-lysts were recorded using a Shimadzu 2550 spectrophotometerequipped with an integrating sphere accessory employing BaSO4as reference material. Raman spectra were recorded using a DilorLabRam-1B spectrometer, operating at a resolution of 1 cm−1. Thesurface area, pore volume and pore diameter of the nanocatalystswere measured with the assistance of Flowsorb II 2300 of Micro-metrics, Inc.
The kinetics of Simazine degradation was followed using aHPLC (Perkin Elmer) equipped with a PDA detector (model Flexar),the Brownlee analytical C18 column (5 um, 150 × 4.6 mm) wasemployed for the HPLC analysis. The UV detection was operatedat 222 nm. The mobile phase composition was H2O/acetonitrilewith a ratio of 40/60. The injection volume was 20 �L and theflow rate was 1 mL/min. The retention time for Simazine was 5 minunder these HPLC conditions. A fresh stock solution of Simazinewas prepared before the experiments. Simazine calibration curvewas prepared for concentrations between 0.0015 and 5 mg/L witha correlation coefficient of R2 = 0.9998. The calibration curve forSimazine was constructed using the peak areas of the standard sam-ples under the same conditions as that of the experimental samples.The total organic carbon (TOC) for all the samples was analyzed bydirect injection of the filtered sample solutions into a TOC analyzer(Vario TOC cube, Cientec Instrumentos South America). Prior to theanalysis, the instrument was calibrated with potassium hydrogenphthalate. TOC0 is the TOC measured after the equilibrium adsorp-tion of the dye on the nanocatalysts surface and TOC obtainedat various irradiation times is denoted as TOCt. The degradationproducts were analyzed by using LC/MSD Trap VL (G2445C VL)electrospray ionization mass spectrometry (ESI-MSn) system cou-pled with Agilent Chem Station (version B.01.03) data-processingstation. The mass spectra data were processed with the AgilentLC/MS Trap software (version 5.3).The instrument was calibratedusing the automatic tuning procedure with respect to the par-ent compound as the standard. The mass range scanned was m/z50–1200 and several spectra were obtained across each chromato-graphic peak.
2.2. Preparation of nanocatalysts
2.2.1. Preparation of gold nanoparticlesThe gold nanoparticles and gold loaded TiO2 was prepared
according the procedure reported by Anandan and Ashokkumar[23] with a slight modification in the synthesis procedure as fol-lows: the gold precursor solution (5.25 × 10⁻⁴ M) was preparedalong with 0.1 M isopropanol followed by the addition of 0.1 wt% of
polyethylene glycol under the vigorous stirring and then it is trans-ferred into a 42 kHz ultrasound producing commercial bath typesonicator. The irradiation was continued up to 30 min, the sampleswere withdrawn at regular intervals during the irradiation for the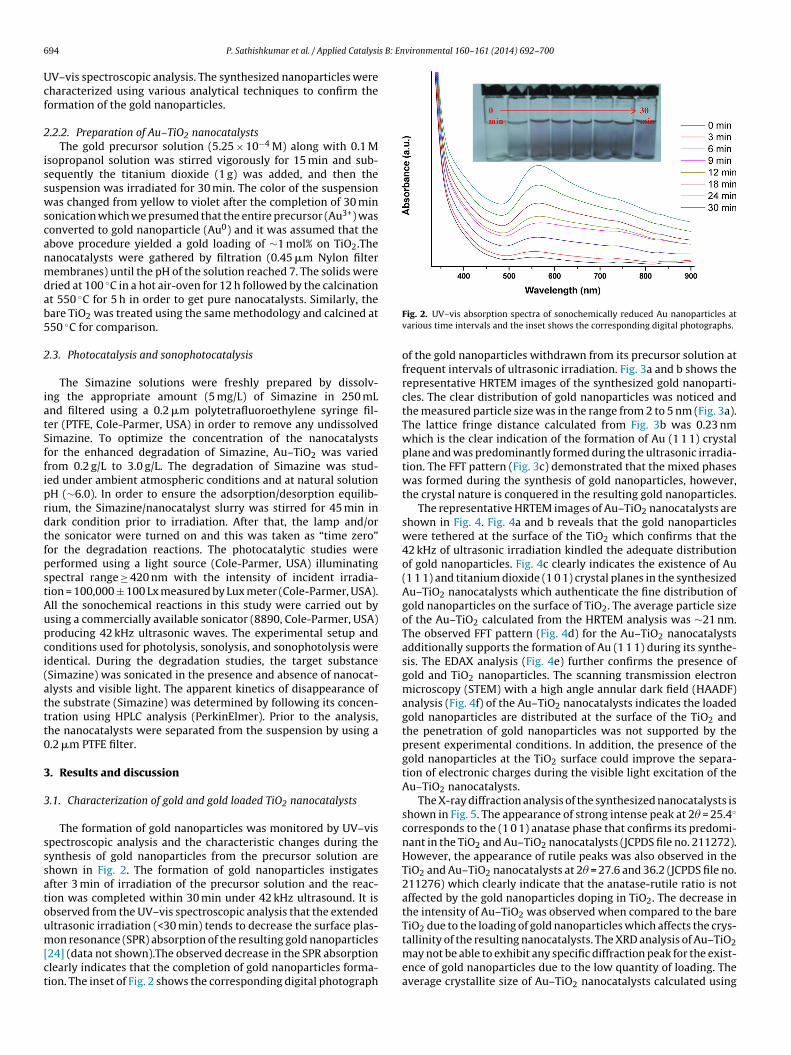
6 s B: Environmental 160–161 (2014) 692–700
Ucf
2
isswscanmdab5
2
iatSffiprdtfpstAupci(attt0
3
3
sssatoum[ct
94 P. Sathishkumar et al. / Applied Catalysi
V–vis spectroscopic analysis. The synthesized nanoparticles wereharacterized using various analytical techniques to confirm theormation of the gold nanoparticles.
.2.2. Preparation of Au–TiO2 nanocatalystsThe gold precursor solution (5.25 × 10⁻⁴ M) along with 0.1 M
sopropanol solution was stirred vigorously for 15 min and sub-equently the titanium dioxide (1 g) was added, and then theuspension was irradiated for 30 min. The color of the suspensionas changed from yellow to violet after the completion of 30 min
onication which we presumed that the entire precursor (Au3+) wasonverted to gold nanoparticle (Au0) and it was assumed that thebove procedure yielded a gold loading of ∼1 mol% on TiO2.Theanocatalysts were gathered by filtration (0.45 �m Nylon filterembranes) until the pH of the solution reached 7. The solids were
ried at 100 ◦C in a hot air-oven for 12 h followed by the calcinationt 550 ◦C for 5 h in order to get pure nanocatalysts. Similarly, theare TiO2 was treated using the same methodology and calcined at50 ◦C for comparison.
.3. Photocatalysis and sonophotocatalysis
The Simazine solutions were freshly prepared by dissolv-ng the appropriate amount (5 mg/L) of Simazine in 250 mLnd filtered using a 0.2 �m polytetrafluoroethylene syringe fil-er (PTFE, Cole-Parmer, USA) in order to remove any undissolvedimazine. To optimize the concentration of the nanocatalystsor the enhanced degradation of Simazine, Au–TiO2 was variedrom 0.2 g/L to 3.0 g/L. The degradation of Simazine was stud-ed under ambient atmospheric conditions and at natural solutionH (∼6.0). In order to ensure the adsorption/desorption equilib-ium, the Simazine/nanocatalyst slurry was stirred for 45 min inark condition prior to irradiation. After that, the lamp and/orhe sonicator were turned on and this was taken as “time zero”or the degradation reactions. The photocatalytic studies wereerformed using a light source (Cole-Parmer, USA) illuminatingpectral range ≥ 420 nm with the intensity of incident irradia-ion = 100,000 ± 100 Lx measured by Lux meter (Cole-Parmer, USA).ll the sonochemical reactions in this study were carried out bysing a commercially available sonicator (8890, Cole-Parmer, USA)roducing 42 kHz ultrasonic waves. The experimental setup andonditions used for photolysis, sonolysis, and sonophotolysis weredentical. During the degradation studies, the target substanceSimazine) was sonicated in the presence and absence of nanocat-lysts and visible light. The apparent kinetics of disappearance ofhe substrate (Simazine) was determined by following its concen-ration using HPLC analysis (PerkinElmer). Prior to the analysis,he nanocatalysts were separated from the suspension by using a.2 �m PTFE filter.
. Results and discussion
.1. Characterization of gold and gold loaded TiO2 nanocatalysts
The formation of gold nanoparticles was monitored by UV–vispectroscopic analysis and the characteristic changes during theynthesis of gold nanoparticles from the precursor solution arehown in Fig. 2. The formation of gold nanoparticles instigatesfter 3 min of irradiation of the precursor solution and the reac-ion was completed within 30 min under 42 kHz ultrasound. It isbserved from the UV–vis spectroscopic analysis that the extendedltrasonic irradiation (<30 min) tends to decrease the surface plas-
on resonance (SPR) absorption of the resulting gold nanoparticles24] (data not shown).The observed decrease in the SPR absorptionlearly indicates that the completion of gold nanoparticles forma-ion. The inset of Fig. 2 shows the corresponding digital photograph
Fig. 2. UV–vis absorption spectra of sonochemically reduced Au nanoparticles atvarious time intervals and the inset shows the corresponding digital photographs.
of the gold nanoparticles withdrawn from its precursor solution atfrequent intervals of ultrasonic irradiation. Fig. 3a and b shows therepresentative HRTEM images of the synthesized gold nanoparti-cles. The clear distribution of gold nanoparticles was noticed andthe measured particle size was in the range from 2 to 5 nm (Fig. 3a).The lattice fringe distance calculated from Fig. 3b was 0.23 nmwhich is the clear indication of the formation of Au (1 1 1) crystalplane and was predominantly formed during the ultrasonic irradia-tion. The FFT pattern (Fig. 3c) demonstrated that the mixed phaseswas formed during the synthesis of gold nanoparticles, however,the crystal nature is conquered in the resulting gold nanoparticles.
The representative HRTEM images of Au–TiO2 nanocatalysts areshown in Fig. 4. Fig. 4a and b reveals that the gold nanoparticleswere tethered at the surface of the TiO2 which confirms that the42 kHz of ultrasonic irradiation kindled the adequate distributionof gold nanoparticles. Fig. 4c clearly indicates the existence of Au(1 1 1) and titanium dioxide (1 0 1) crystal planes in the synthesizedAu–TiO2 nanocatalysts which authenticate the fine distribution ofgold nanoparticles on the surface of TiO2. The average particle sizeof the Au–TiO2 calculated from the HRTEM analysis was ∼21 nm.The observed FFT pattern (Fig. 4d) for the Au–TiO2 nanocatalystsadditionally supports the formation of Au (1 1 1) during its synthe-sis. The EDAX analysis (Fig. 4e) further confirms the presence ofgold and TiO2 nanoparticles. The scanning transmission electronmicroscopy (STEM) with a high angle annular dark field (HAADF)analysis (Fig. 4f) of the Au–TiO2 nanocatalysts indicates the loadedgold nanoparticles are distributed at the surface of the TiO2 andthe penetration of gold nanoparticles was not supported by thepresent experimental conditions. In addition, the presence of thegold nanoparticles at the TiO2 surface could improve the separa-tion of electronic charges during the visible light excitation of theAu–TiO2 nanocatalysts.
The X-ray diffraction analysis of the synthesized nanocatalysts isshown in Fig. 5. The appearance of strong intense peak at 2� = 25.4◦
corresponds to the (1 0 1) anatase phase that confirms its predomi-nant in the TiO2 and Au–TiO2 nanocatalysts (JCPDS file no. 211272).However, the appearance of rutile peaks was also observed in theTiO2 and Au–TiO2 nanocatalysts at 2� = 27.6 and 36.2 (JCPDS file no.211276) which clearly indicate that the anatase-rutile ratio is notaffected by the gold nanoparticles doping in TiO2. The decrease inthe intensity of Au–TiO2 was observed when compared to the bareTiO2 due to the loading of gold nanoparticles which affects the crys-
tallinity of the resulting nanocatalysts. The XRD analysis of Au–TiO2may not be able to exhibit any specific diffraction peak for the exist-ence of gold nanoparticles due to the low quantity of loading. Theaverage crystallite size of Au–TiO2 nanocatalysts calculated using
P. Sathishkumar et al. / Applied Catalysis B: Environmental 160–161 (2014) 692–700 695
(b)) an
Sp
n5pcgsstaAantsnA(cao
the resulting nanocatalysts as BET analysis (SBET) of Au–TiO2 showsan enhanced surface area (SBET = 46 m2/g) when compared with thebare TiO2 (SBET = 39 m2/g). Similarly, pore volume (Vp) and othercharacteristics (Table 1) were rehabilitated in the resulting Au–TiO2
Table 1Physicochemical characteristics of TiO2 and Au–TiO2 nanophotocatalysts.
S. no. Name ofthe
SBET (m2/g) Vp (cm3/g) Vo (cm3/g) Vm (cm3/g)
Fig. 3. Representative HRTEM ((a) and
cherrer formula was ∼21 nm which is in well accordance with thearticle size calculated from the HRTEM studies.
Fig. 6a shows the Raman analysis of the TiO2 and Au–TiO2anocatalysts, the appearance of the Raman peaks at 639 cm−1 (Eg),14 cm−1(B1g) and 395 cm−1 (A1g) can be assigned to the anatasehase of titania [25]. Raman analysis of the pure gold nanoparti-les cannot show any characteristic peaks or in other words theold nanoparticles has not shown any response against the Ramanpectral analysis. The raised hump (ca. ∼420 cm−1) in the Ramanpectrum of Au–TiO2 inspired us to find the reason for its forma-ion. Nonetheless, the absence of the characteristic peaks at 323nd 346 cm−1 ruled out the possibility of Au Cl bonding in theu–TiO2 nanocatalysts, similarly no other impurity is emanating
Raman response at ∼420 cm−1. To the best of our knowledgeo such peak (ca. ∼420 cm−1) was reported in the literature forhe Au–TiO2 nanocatalysts. Therefore it needs some more analy-is to confirm the context of the peak appeared in the Au–TiO2anocatalysts. The comparison of the Raman spectrum of TiO2 andu–TiO2 evidently shows the shift by ∼5 cm−1 (Fig. 6b) at 639 cm−1
Eg) for the corresponding nanophotocatalysts. The 639 cm−1 peakan be considered as the overtone of the Raman peak observedt 144 cm−1 for the single crystal TiO2 anatase phase [26,27]. Thebserved shift at 639 cm−1 for the Au–TiO2 nanocatalysts confirms
d FFT (c) images of gold nanoparticles.
the gold nanoparticles are loaded on the surface of TiO2. Thus, thegold nanoparticles acts as a sink for the electronic charges pro-duced during the photoexcitation. The delayed recombination ofthe electronic charges is expected to enhance the quantum yield ofthe Au–TiO2 assisted catalytic processes [20–22].
The physicochemical characteristics of TiO2 and Au–TiO2nanocatalysts were analyzed using BET analysis. The TiO2and Au–TiO2 nanocatalysts show type IV adsorption–desorptionisotherm during the analysis (Fig. 7). The loading of gold nanopar-ticles considerably changed the physicochemical characteristics of
nanocata-lyst
1 TiO2 39 0.06 0.02 0.042 Au–TiO2 46 0.09 0.02 0.07

696 P. Sathishkumar et al. / Applied Catalysis B: Environmental 160–161 (2014) 692–700
s of A
ntbntne
Fig. 4. HRTEM [(a) 10 nm, (b) 5 nm and (c) 2 nm] and FFT (d), EDAX (e) image
anocatalysts. Fig. 8 shows diffuse reflectance (DR) UV–vis spec-ral analysis of TiO2 and Au–TiO2 nanocatalysts. The absorptionand edge observed for the bare TiO2 was ∼390 nm which sig-
ificantly indicates that the bare TiO2 cannot be able to absorbhe visible portion of the sun light. Nevertheless the Au–TiO2anocatalysts conspicuously show the shift in the adsorption banddge (∼420 nm) which gives the first notation that the Au–TiO2u–TiO2 nanocatalysts and the corresponding HAADF-STEM was shown in (f).
nanocatalysts can be utilized as the visible light responsive photo-catalyst and the SPR peak observed at ∼565 nm further confirmsthat the visible light is adequate to generate the electronic charges
during the photocatalysis. The Tauc plot derived from KubelkaMunk Function (inset of Fig. 8) designates that the optical band gapof Au–TiO2 was 2.6 eV whereas the bare TiO2 shows 3.2 eV whichendorses the visible light excitation of the Au–TiO2 nanocatalysts.
P. Sathishkumar et al. / Applied Catalysis B: Environmental 160–161 (2014) 692–700 697
20 30 40 50 60 70 80 90
Co
un
ts (
arb
. u
nit
s)
Degree (2θθ)
TiO2
Au -TiO2
Fig. 5. XRD pattern of TiO2 and Au–TiO2.
800 700 60 0 50 0 40 0 30 0
Inte
ns
ity
(a
.u.)
Raman Shift (cm-1)
(b)
(a)
Inte
nsit
y (
a.u
.)
-1
Ti O2
Au-Ti O2
Au n anop arti cles
3n
etniTilTeodFwnm
1c1a
0.0 0.2 0.4 0.6 0.8 1.0
0
25
50
75
100
125
Vo
lum
e o
f A
dso
rpti
on
(m
l/g
)
Relati ve Pr essure (P/ P0)
TiO2
Au-TiO2
Fig. 7. BET analysis of TiO2 and Au–TiO2 nanophotocatalysts.
350 40 0 45 0 50 0 55 0 60 0 65 0 70 0 75 0
0.0
0.2
0.4
0.6
Ti O2
Au-TiO2
Ab
so
rban
ce (
a.u
.)
Wavelength (nm)
Fig. 8. Diffuse reflectance (DR)-UV–Vis spectra of TiO2 and Au–TiO2 nanophotocat-alysts and the inset shows the Tauc plot derived from the Kubelka Munk Functionfor TiO2 and Au–TiO2.
0 1 2 3 4 5
6050
4030
1020
0
Irra
diation ti
me (m
in)
Retention Time (min)
Inte
ns
ity
(a
.u.)
Raman Sh ift (cm )
Fig. 6. Raman spectra of Au, TiO2 and Au–TiO2 nanophotocatalysts.
.2. Degradation of Simazine in the presence of Au–TiO2anocatalysts
In this study, Simazine was taken as the model pollutant toxamine the sonolytic, sonocatalytic, photocatalytic and sonopho-ocatalytic degradation in the presence of TiO2 and Au–TiO2anocatalysts. The initial concentration of Simazine was fixed at
ts maximum solubility (5 mg/L) for all the degradation processes.he concentration of the nanocatalysts was varied from 0.2 to 3 g/Ln order to achieve the optimum concentration of the nanocata-yst which is required for the maximum degradation of Simazine.he kinetics of degradation was followed using a HPLC analyzerquipped with a PDA detector. A three dimensional representationf the HPLC chromatogram obtained during the sonophotocatalyticegradation of Simazine in the presence of Au–TiO2 is shown inig. 9. The concentration of Simazine (RT = 2.5 min) was decreasedith respect to the ultrasonic irradiation and the appearance ofew peaks (RT = 1 to 2 min) can be identified from the HPLC chro-atogram.The sonolysis (0.96 × 10⁻⁴ s−1) and photolysis (0.049 ×
0−4 s−1) of Simazine exhibit very low rate of degradation whenompared with the rate achieved for the sonocatalytic (1.61 ×0−4 s−1), photocatalytic (0.921 × 10⁻⁴ s−1) and sonophotocat-lytic degradation (2.38 × 10⁻⁴ s−1) of Simazine at the catalyst
Fig. 9. 3-D plot showing the evolution of the HPLC chromatogram for the sonopho-tocatalytic degradation of Simazine at its fixed initial concentration 5 mg/L and[Au–TiO2] = 1.5 g/L.

698 P. Sathishkumar et al. / Applied Catalysis B: Environmental 160–161 (2014) 692–700
Fig. 10. Plot of variation of concentration of Au–TiO2 up on irradiation time dur-ing sonophotocatalytic degradation of Simazine at its fixed initial concentration(5 mg/L).
0
1
2
3
4
5
6
0 0.5 1 1.5 2 2.5 3
k x
10
-4(s
- 1)
[Au-TiO2] gL-1
Fa
dotpdprrdc(dsstanctopoSb
0 1 2 3 4 5 6 7 8
0.5
0.6
0.7
0.8
0.9
1.0
TO
Ct/T
OC
0
Time (hours)
Photolysis
Sonolysis
Photocatalysis
Sonocatal ysis
Sonophotocatal ysis
applied to the mineralization. On the other hand, mass transfer of
ig. 11. Plot of rate constant vs [Au–TiO2] for the sonophotocatalytic (�), sonocat-lytic (�) and photocatalytic (�) degradation of Simazine.
osage was 0.2 g/L (Au–TiO2). This reveals that the degradationf Simazine needs a solid support to effectively interact withhe hydroxyl radicals produced during the advanced oxidationrocess. Fig. 10 shows the −ln (C/C0) vs time plot observeduring the sonophotocatalytic degradation of Simazine in theresence of Au–TiO2 at its various concentrations. The linearelationship between −ln (C/C0) vs time indicates that the linearegression coefficient (R2) was >0.97 for the sonophotocatalyticegradation of Simazine. Therefore, Simazine degradation can beonsidered to follow the first-order kinetics. The rate constantsk) observed for the various concentration of Au–TiO2 for theegradation of Simazine during sonocatalytic, photocatalytic andonophotocatalytic processes is depicted in Fig. 11. All the AOPshowed an increase in the rate constant with concentration ofhe nanocatalysts. The maximum sonocatalytic, photocatalyticnd sonophotocatalytic degradation was achieved at 1.5 g/L. Theanocatalysts concentration [1.5 g/L] was fixed as the optimumoncentration for the Simazine degradation. Further increase inhe nanocatalysts concentration leads to decrease the efficiencyf the process by reflecting the visible light entered into thehotocatalytic microenvironment rather than the photo-initiation
f electronic charges. On the other hand, it is observed from theimazine degradation that the catalysis reactions experimentedelow the optimum nanocatalyst dosage needs more effectiveFig. 12. Mineralization of Simazine (5 mg/L) during various advanced oxidationprocesses in the absence and presence of Au–TiO2 (1.5 g/L) nanophotocatalysts.
surface area to achieve the enhanced rate of mineralization. Therate constants observed for the various AOPs assisted degrada-tion of Simazine (SC = 5.45 × 10⁻⁴ s−1; PC = 2.03 × 10⁻⁴ s−1 andSPC = 5.88 × 10⁻⁴ s−1) revealed an enhanced rate of its degradationwhen compared with the rate constants observed in the pres-ence of bare TiO2 (SC = 1.12 × 10⁻⁴ s−1; PC = 0.21 × 10⁻⁴ s−1 andSPC = 1.37 × 10⁻⁴ s−1).
The application of ultrasound during the sonophotocatalyticprocess is not only creates the effective radicals which are requiredfor the degradation process but also it continuously clean the sur-face of the nanocatalysts to avoid the accumulation of Simazineand its intermediates produced during the sonophotocatalysis. Thecombination of ultrasound irradiation and visible light enhancesthe production of the effective radicals needed for the degra-dation of Simazine nevertheless one such process is absent inthe photocatalysis and sonocatalysis. However, sonophotocatalyticdegradation exhibited an additive effect when the rate constantsobserved for the various AOPs are substituted in the following equa-tion [28],
Synergy =k′
sonophotocatalysis
k′sonocatalysis + k′
photocatalysis
The optimized nanophotocatalyst concentration (1.5 g/L) wasemployed for the sonocatalytic, photocatalytic and sonophotocat-alytic mineralization of Simazine for the extended irradiation upto 7 h. Fig. 12 shows the visible light assisted photolysis alonecannot be able to initiate the mineralization of Simazine. Thesonolysis of Simazine achieved 11% of the TOC removal from theinitial concentration. However, the rate of mineralization attainedduring the photolysis and sonolysis are negligible when com-pared with the mineralization achieved for the sonocatalytic (31%),photocatalytic (26%) and sonophotocatalytic (43%) processes. Thesonophotocatalytic degradation shows its greater applicability tothe mineralization of Simazine since the direct band gap excita-tion and the utilization of ultrasound enhanced the number ofeffective radicals production which tends to attain the maximumrate of mineralization for Simazine. At the same time, the photo-catalysis and sonocatalysis process demonstrates that the effectiveradicals production was decreased when the particular AOP was
the organic contaminants to the bulk solution was improved dur-ing the sonophotocatalytic degradation when compared with thesonocatalytic and photocatalytic degradation processes.

P. Sathishkumar et al. / Applied Catalysis B: Environmental 160–161 (2014) 692–700 699
N
N
N
Cl
NH NH
CH3CH3
N
N
N
Cl
NH NH
OHOH
CH3CH3
N
N
N
OH
NH NH2
CH3
ON
N
N
Cl
NH2NH2
N
N
N
OH
NH2NH2
N
N
N
OH
OH OH
CO2 + H 2O +NH3
N
N
N
OH
NH NH
CH3CH3
+
+
6-chloro-N,N'-diethyl-1,3,5-triazine-2,4-diamine
1,1'- [(6-c hloro-1,3,5-triazine -2,4-diyl)dii mino ]diethano l
4,6-bis(ethylamino)-1,3,5-triazin-2-ol
6-c hloro-1,3,5-triazine -2,4-diamine N-( 4-amino -6-hydroxy- 1,3,5-triazin-2-y l)acetamide
4,6-diamino-1,3,5-triazin-2-ol 1,3,5-triazine -2,4,6-triol
m/z = 202
m/z = 14 6m/z = 17 0
m/z = 127 m/z = 12 9
m/z = 23 4
m/z = 18 4
(I)
(II)
(III)
(IV) (V)
(VI) (VII)
of Sim
ydiaisNoofitfl(am
Scheme 1. Proposed pathway for the mineralization
The electro spray ionization mass spectrometry (ESI-MS) anal-sis was performed to identify the various intermediates produceduring the sonophotocatalytic degradation of Simazine. The pos-
tive mode ESI-MS demonstrated that the various intermediatest m/z = 234, 184, 170, 146, 129 and 126 were produced dur-ng the mineralization. The ESI-MS analysis of the unprocessedolution clearly establishes the existence of Simazine (6-chloro-,N′-diethyl-1,3,5-triazine-2,4-diamine) at m/z = 202 (I), thus ruledut the possibility of other impurities. The hydroxylated derivativesf Simazines are the major intermediates (II and III) identi-ed from the ESI-MS analysis of the aliquots withdrawn fromhe sonophotocatalytically treated Simazine after 2 h. However,urther sonophotocatalytic treatment of Simazine and hydroxy-
ated Simazine lead to produce 6-chloro-1,3,5-triazine-2,4-diamineIV) and N-(4-amino-6-hydroxy-1,3,5-triazin-2-yl)acetamide (V)s the intermediates and thus confirm the progress of furtherineralization of Simazine. The aliquots withdrawn after 7 hazine during Au–TiO2 assisted sonophotocatalysis.
of the sonophotocatalytic treatment showed that 4,6-diamino-1,3,5-triazin-2-ol (VI) and 1,3,5-triazine-2,4,6-triol (VII) are themajor intermediates which clearly indicates that the triazinebased skeleton cannot be easily mineralized. On the other hand,further sonophotocatalytic irradiation (>7 h) was expected to com-pletely mineralize the Simazine and the various intermediatesproduced during its degradation into CO2, H2O and other smallmolecular products. Based on the identification of the interme-diates observed from the sonophotocatalytic mineralization ofSimazine in the presence of Au–TiO2, and the available literature[11,29-31], we proposed a pathway for the Simazine degrada-tion as shown in Scheme 1. The similar kind of pathway canbe proposed for the photocatalytic and sonocatalytic degrada-
tion of Simazine. The identification of various intermediates wasexpected for the photocatalytic and sonocatalytic degradationapart from the intermediates observed for the sonophotocatalyticdegradation.
7 s B: En
4
mbmttvaetcsSoqcocto
A
pC
R
[
[[
[
[
[
[[
[
[
[[[
[[
[
[[
[
00 P. Sathishkumar et al. / Applied Catalysi
. Conclusion
The complete mineralization of Simazine by the low costethodology was aimed in this study and it is demonstrated
y using various advanced oxidation processes. To achieve theineralization of Simazine, Au–TiO2 nanophotocatalysts were syn-
hesized using a commercial 42 kHz ultrasound producing bathype sonicator. The nanophotocatalysts were characterized usingarious analytic tools to confirm the existence of gold nanoparticleslong with TiO2. Significantly, Raman analysis confirms the exist-nce of the gold nanoparticles on the surface TiO2 which increasedhe visible light responsive nature of the Au–TiO2 nanophoto-atalysts. The Au–TiO2 supported sonophotocatalysis of Simazinehowed that 43% of the total organic carbon was removed from theimazine after 7 h of the irradiation which enhances the possibilityf using the electron acceptors for the rapid mineralization of largeuantity of Simazine. The HPLC and ESI-MS analyses confirmed theoncurrent and unselective decomposition of Simazine and its vari-us degradation intermediates. The rapid development of such lowost methodologies for the mineralization of various organic con-aminants significantly reduces the cost required for the advancedxidation processes.
cknowledgement
The authors would like to thank FONDECYT Postdoctoradoroject No.: 3120095 and FONDECYT no.: 1130916 Government ofhile, Santiago, for financial assistance.
eferences
[1] S. Navarro, J. Fenoll, N. Vela, E. Ruiz, G. Navarro, J. Hazard. Mater. 172 (2009)1303–1310.
[2] A.S. Gunasekara, J. Troiano, K.S. Goh, R.S. Tjeerdema, Rev. Environ. Contam.Toxicol. 189 (2007) 1–23.
[3] N.H. Spliid, A. Helweg, K. Heinrichson, Chemosphere 65 (2006) 2223–2232.
[
[[
vironmental 160–161 (2014) 692–700
[4] S. Devipriya, S. Yesodharan, Sol. Energy Mater. Sol. Cells 86 (2005) 309–348.[5] H.D. Burrows, L.M. Canle, J.A. Santaballa, S. Steenken, J. Photochem. Photobiol.
B: Biol. 67 (2002) 71–108.[6] A. García-Valcárcel, J. Tadeo, J. Agric. Food Chem. 47 (1999) 3895–3900.[7] L. Cox, R. Celis, M.C. Hermosin, J. Cornejo, J. Agric. Food Chem. 48 (2000)
93–99.[8] J. Troiano, D. Weaver, J. Marade, F. Spurlock, M. Pepple, C. Nordmark, D.
Bartkowiak, J. Environ. Qual. 30 (2001) 448–459.[9] E.C. Catalkaya, F. Kargi, J. Hazard. Mater. 168 (2009) 688–694.10] M. Arias-Estévez, E. López-Periago, E. Martínez-Carballo, J. Simal-Gándara, J.
Mejuto, L. García-Río, Agric. Ecosyst. Environ. 123 (2008) 247–260.11] M.J. López-Munoz, J. Aguado, A. Revilla, Catal. Today 161 (2011) 153–162.12] C. Flores, V. Morgante, M. González, R. Navia, M. Seeger, Chemosphere 74 (2009)
1544–1549.13] F.J. Beltran, J.F. Garcia-Araya, V. Navarrete, F.J. Rivas, Ind. Eng. Chem. Res. 41
(2002) 1723–1732.14] F.J. Beltran, J.F. Garcia-Araya, J. Rivas, P.M. Alvarez, E. Rodriguez, J. Environ. Sci.
Health B35 (2000) 439–454.15] T. Kodama, L.X. Ding, M. Yoshida, M. Yajima, J. Mol. Catal. B: Enzym. 11 (2001)
1073–1078.16] X. Chen, S.S. Mao, Chem. Rev. 107 (2007) 2891–2959.17] P. Sathishkumar, R.V. Mangalaraja, S. Anandan, M. Ashokkumar, Sep. Purif.
Technol. 102 (2013) 67–74.18] P. Sathish Kumar, R. Sweena, J.J. Wu, S. Anandan, Chem. Eng. J. 171 (2011)
136–140.19] S. Anandan, P. Sathish Kumar, N. Pugazhenthiran, J. Madhavan, P.
Maruthamuthu, Sol. Energy Mater. Sol. Cells 92 (2008) 929–937.20] V. Subramanian, E. Wolf, P.V. Kamat, J. Am. Chem. Soc. 126 (2004) 4943–4950.21] V. Subramanian, E. Wolf, P.V. Kamat, J. Phys. Chem. B105 (2001) 11439–11446.22] N. Fuke, A. Fukui, A. Islam, R. Komiy, R. Yamanaka, H. Harima, L. Han, Sol. Energy
Mater. Sol. Cells 93 (2009) 720–724.23] S. Anandan, M. Ashokkumar, Ultrason. Sonochem. 16 (2009) 316–320.24] P. Sathish Kumar, A. Manivel, S. Anandan, M. Zhou, F. Grieser, M. Ashokkumar,
Colloids Surf., A: Physicochem. Eng. Aspects 356 (2010) 140–144.25] R.A. Naphade, M. Tathavadekar, J.P. Jog, S. Agarkar, S. Ogale, J. Mater. Chem. A
2 (2014) 975–984.26] Y.L. Du, Y. Deng, M.S. Zhang, J. Phys. Chem. Solids 67 (2006) 2405–2408.27] Y. Li, H. Wang, Q. Feng, G. Zhou, Z. Wang, Energy Environ. Sci. 6 (2013)
2156–2165.28] P. Sathishkumar, R.V. Mangalaraja, O. Rozas, H.D. Mansilla, M.A. Gracia-Pinilla,
S. Anandan, Ultrason. Sonochem. 21 (2014) 1675–1681.29] V. Morgante, C. Flores, X. Fadic, M. González, M. Hernández, F. Cereceda-Balic,
M. Seeger, J. Environ. Manage. 95 (2012) S300–S305.30] W. Chu, Y. Rao, W.Y. Hui, J. Agric. Food Chem. 57 (2009) 6944–6949.31] Y. Rao, W. Chu, Ind. Eng. Chem. Res. 52 (2013) 13580–13586.