Autophagy Modulators: Mechanistic Aspects and Drug ... - MDPI
Upload
independentCategory
view
1download
0
1 23
Journal of Computer-AidedMolecular DesignIncorporating Perspectives in DrugDiscovery and Design ISSN 0920-654XVolume 25Number 12 J Comput Aided Mol Des (2011)25:1159-1169DOI 10.1007/s10822-011-9500-7
Some findings relevant to the mechanisticinterpretation in the case of predictivemodels for carcinogenicity based on thecounter propagation artificial neuralnetworkNatalja Fjodorova & Marjana Novič

1 23
Your article is protected by copyright and
all rights are held exclusively by Springer
Science+Business Media B.V.. This e-offprint
is for personal use only and shall not be self-
archived in electronic repositories. If you
wish to self-archive your work, please use the
accepted author’s version for posting to your
own website or your institution’s repository.
You may further deposit the accepted author’s
version on a funder’s repository at a funder’s
request, provided it is not made publicly
available until 12 months after publication.
Some findings relevant to the mechanistic interpretationin the case of predictive models for carcinogenicity basedon the counter propagation artificial neural network
Natalja Fjodorova • Marjana Novic
Received: 22 June 2011 / Accepted: 21 November 2011 / Published online: 3 December 2011
� Springer Science+Business Media B.V. 2011
Abstract The goal of the study was to contribute to a
better mechanistic understanding of so-called ‘‘general’’
QSAR models for non-congeneric chemicals based on the
counter propagation artificial neural network (CP ANN).
Possible mechanisms of action was proofed using the
Toxtree expert system based on structural alerts (SAs) for
carcinogenicity. We have illustrated how statistically
selected MDL descriptors, which refer to topological
characteristics as well as to polarizability and charge dis-
tribution related to reactivity, are correlated with particular
chemical classes (containing carcinogenic SA) with the
recognized mechanistic link to the carcinogenic activity
and consequently with the carcinogenic potency. Mecha-
nistic insight in CP ANN models was demonstrated using
an inherent mapping technique (i.e. Kohonen maps).
Keywords Counter propagation artificial neural
network � Mechanistic interpretation of model �Carcinogenicity � QSAR model � Structural alerts �Chemical descriptors � Kohonen maps �Non-congeneric chemicals � Classification model
Introduction
According to the OECD Member Countries and the
European Commission agreement a (quantitative) struc-
ture–activity relationships ((Q)SARs) model should follow
five principles to establish the scientific validity and its
acceptance for regulatory purposes. One of these principles
should be associated with mechanistic interpretation if
possible [1]. The mechanistic understanding of models is
very important for risk assessment to ensure the safety of
chemicals. In the modelling the mechanistic association
between descriptors and the endpoint should be considered.
The mechanistic investigation related to structure
activity relationships of chemical mutagens and carcino-
gens was reported in several papers [2–7]. The study of
individual QSAR models for congeneric series of chemi-
cals (aromatic amines, nitroaromatic compounds, N-nitroso
compounds, polycyclic aromatic hydrocarbons and etc.)
showed that in most cases electronic properties (HOMO,
LUMO) together with steric ones (size/shape) appeared to
determine the minimum requirement for the chemicals to
be metabolised and to differentiate the active from inactive
ones, while hydrophobicity (logP) determined the extent of
activity i.e. the potency of active compounds. The appli-
cation of QSAR modeling to individual classes of chemi-
cals showed good predictive ability and understanding the
biological activity (mutagenicity and carcinogenicity) and
provided information on the mechanisms of action
depending on the relevant properties/features of the
chemicals. On the other hand the individual QSAR models
are limited by using only certain class of chemicals [3].
Recently, the need for setting the priority of chemicals
due to the chemical regulation and tendency for reducing
animal testing has motivated the development of QSAR
models for non-congeneric set of chemicals (so-called
Electronic supplementary material The online version of thisarticle (doi:10.1007/s10822-011-9500-7) contains supplementarymaterial, which is available to authorized users.
N. Fjodorova (&) � M. Novic
National Institute of Chemistry, Hajdrihova 19,
SI-1001 Ljubljana, Slovenia
e-mail: [email protected]
M. Novic
e-mail: [email protected]
123
J Comput Aided Mol Des (2011) 25:1159–1169
DOI 10.1007/s10822-011-9500-7
Author's personal copy

‘‘general’’ QSARs) that are able to predict carcinogenicity
for a wide diversity of molecular structures, spanning an
undetermined number of chemical classes and biological
mechanisms. The most of ‘‘general’’ QSAR models focused
on the predicting rodent carcinogenicity. In the case of non-
congeneric chemicals multiple mechanisms of action can
lead to the same toxicity endpoint. The QSAR model for
non-congeneric chemicals has to model the various mech-
anisms of action of various types of chemicals present in a
studied data set. As a matter of fact, all ‘‘general’’ models
consist of multiple local models, whose definition may or
may not be readily apparent [4]. Hence, the ‘‘general’’
approaches for non-congeneric chemicals are able to pro-
vide little or no mechanistic information. On the other hand
they are able to generate correct predictions of activity for
untested chemicals. Therefore, the mechanistic insight into
a ‘‘general’’ model is of great interest nowadays.
Different approaches related to the ‘‘general’’ carcino-
genicity models were described in the papers [3, 5].
Generally, they can be divided into rule-based and statis-
tically-based methods. The rule-based (or knowledge-
based) methods combine toxicological knowledge, expert
judgment and fuzzy logic. The software such as Hazard-
Expert, OncoLogic, Toxtree, and DEREK attempt to codify
the existing knowledge, derived from the human expert
judgment, bioassay data, or any of modeling approaches,
into generalized rules to be used in a prediction. The fol-
lowing data relevant to the carcinogenic potency are con-
sidered: toxicokinetics and toxicodinamics parameters that
affect the delivery of biologically active intermediates to
target tissues for interaction with cellular macromolecules
or receptors. In contrast, the statistically-based methods
(i.e. statistical, multivariate, rule-induction, artificial intel-
ligence, cluster analysis, pattern recognition and etc.) deal
with limited or no prior chemical or biological classifica-
tion according to mechanism. MultiCASE, Leadscope,
TOPKAT, LAZAR and CAESAR belong to the statisti-
cally-based systems where discovery of genotoxic or
chemical fragments (SAR knowledge) are identified by
specific automated algorithms [6]. It is clear that each of
approaches has the potentials and limitations. The knowl-
edge-based approaches provide opportunity to gain insight
into the mechanism underlying the mutagenicity/carcino-
genicity whereas in the case of statistically based models it
is usually difficult to interpret the models and to provide
mechanistical reasoning of the predictions. On the other
hand, not all the rule-based models can explain the dif-
ferences of the activity within a chemical class. The main
advantage of the statistically-based models is high accu-
racy of prediction whereas the rule-base models usually
have lower accuracy of prediction than statistical ones [5].
Carcinogenicity models based on artificial neural net-
work (ANN) were reported recently [8, 9]. The main
advantage of ANN modelling of carcinogenicity is that
complex, non-linear relationship can be modelled without
any assumptions about form of the model. Large data set
can be examined. ANNs are able to cope with noisy data
and are fault tolerant [9]. On the other hand, ANNs act like
‘‘black boxes’’. The relationships are encoded as weight
vectors within the trained network, which is difficult to
explain in comprehensible form. The knowledge-based
information embedded within ANNs can be extracted and
expressed as a set of comprehensible data. Therefore, the
knowledge-based Toxtree expert system (based on the
decision tree approach) was employed as a supporting tool
in interpretation of obtained results in terms of possible
mechanism of action of studied chemicals. Such extracted
information enhances the understanding studied prediction
ANN model and enables the obtaining the mechanistic
interpretation.
The counter propagation artificial neural network (CP
ANN) model for prediction of carcinogenicity based on
eight MDL descriptors was considered in the article. From
statistical point of view the model showed good recall
ability and acceptable accuracy of prediction (73%) as was
reported in the article [8]. The mechanistic basis of the
model was determined a posteriori (after the modeling), by
interpretation of the final set of training structures and
descriptors.
The mechanistic interpretation of the model in this study
was determined using inherent to CP ANN mapping
technique (Kohonen maps) which enable researcher to
analyse the distribution of chemicals, individual descriptors
(in weight level maps) and carcinogenic potency (Yes/No)
in the same 2D space. The Toxtree expert system provided
the information about classes of used chemicals [on the
basis of carcinogenic structural alerts (SAs)] and their
possible mechanisms of action. Thus, the model became
transparent.
Data and method
Data used in the model
The dataset of 805 chemicals used for modeling was
extracted from initial dataset of 1,481 chemicals taken
from Distributed Structure-Searchable Toxicity (DSSTox)
Public Database Network http://www.epa.gov/ncct/dsstox/
sdf_cpdbas.html [10]. The carcinogenic potency for rats
was used as a response. Additionally, for each chemical in
the dataset we collected carcinogenic structural alerts
(SAs) (if available) using Toxtree expert system [7]. The
Toxtree represents the list of 33 SAs. Five of them refer to
non-genotoxic mechanisms of action while others refer to
genotoxic ones. The Toxtree rulebase was reported by
1160 J Comput Aided Mol Des (2011) 25:1159–1169
123
Author's personal copy
Benigni and Bossa [7]. Carcinogenic SAs are molecular
substructures or functional groups that have been mecha-
nistically and/or statistically associated with induction of
cancer [11]. Therefore, the set of chemicals characterised
by the same SA could compose a family of compounds
with the same mechanism of action (in a broad sense).
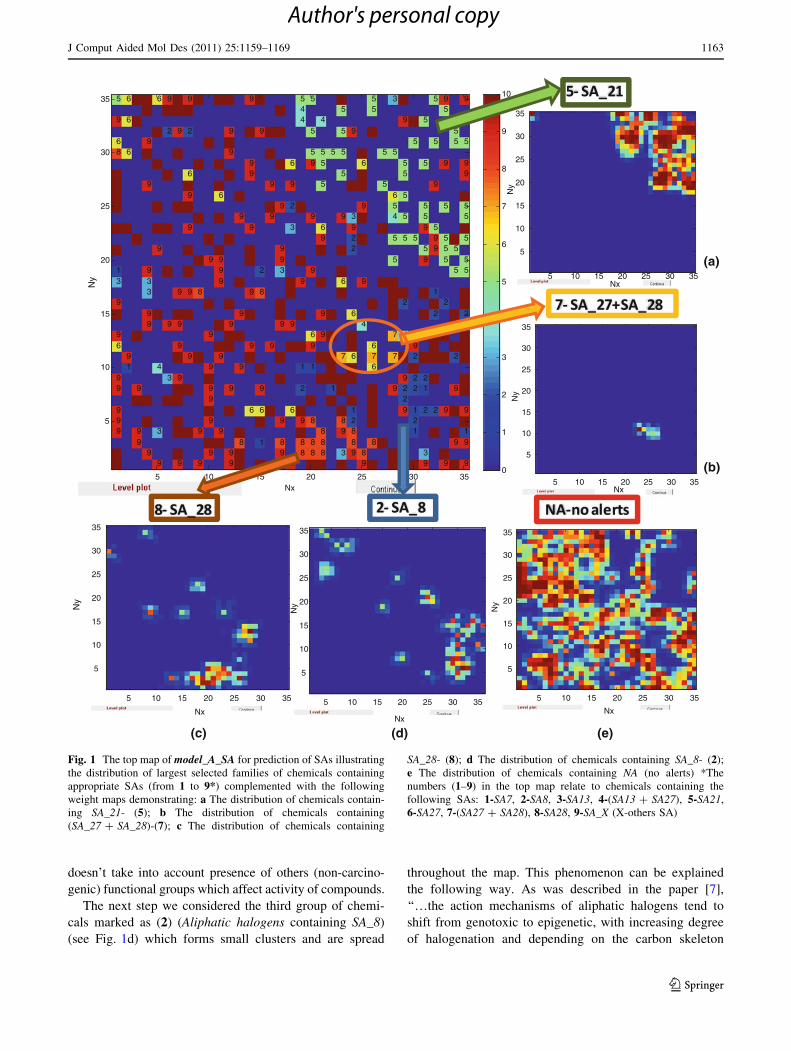
Table 1 containes the compilation of chemicals classes
coded as SA with recognized mechanistic link to carcino-
genicity. Two groups of chemicals from the studied dataset
containing two SAs were also considered in the model.
Eight MDL descriptors that maximally explain the
variance in observed carcinogenic potency (property or
activity of interest) were applied in the model as was
explained in the article [8]. The MDL QSAR version 2.2
software [12] generates descriptors derived from a molecular
graph theory or topological representation of structure. The
mechanistic interpretation of the model was made by
examination of changes in key structural features identified
by descriptors (that affect the observed properties of a
studied molecule) in the context of model training set.
The CP ANN method
The CP ANN method used in present study is described in
details in the recent paper [8]. It should be remarked that
CP ANN belongs to self organizing map technique that
often used to analyse the data in multi-dimensional space.
Basis of this technique is a non-linear projection from
multi-dimensional space onto two-dimensional map. The
topology preserving projection is achieved via non-linear
Table 1 Structure alerts (SAs)
used in the modelling SAs Order Number in the Kohonen Map
SAs and Appropriate Mechanisms of Action Structure of SAs
Amount of SAs in the Set
1 SA_7: Epoxides and aziridines Alkylating, Direct Acting Agents
R = any atom/group
22
2SA_8: Aliphatic halogensAlkylating, Direct Acting Agents
R = any atom/group
47
3 SA_13: HydrazineAlkylating, Indirect Acting Agents R = any atom/group
32
4 SA_13+SA_27 See SA_13 and SA_27 12
5 SA_21: Alkyl and Aryl N-nitroso groupsAlkylating, Indirect Acting Agents
R1 = aliphatic or aromatic carbon; R2 = any atom/group
107
6 SA_27: Nitro-aromaticAminoaryl DNA Adducts Forming, Indirect Acting Agents
Ar = any aromatic/heteroaromatic ring
75
7 SA_27+SA_28 See SA_27 and SA_28 14
8
SA_28: Primary aromatic amine, hydroxyl amine and its derived estersAminoaryl DNA Adducts Forming, Indirect Acting Agents
Or amine generating groupAr = any aromatic/heteroaromatic ring; R = any atom/group
52
9 SA_X X- others SAs used in modeling 110
10 NA No alert 334
J Comput Aided Mol Des (2011) 25:1159–1169 1161
123
Author's personal copy
algorithm known as training. The fundamental property of
the trained network is that the similar objects are located
close to each other. Therefore, it is expected that chemicals
with similar structure will form the clusters. The case of
our examination includes the analysis of similarities in
non-congeneric set of substances using three kinds of 2D
maps: the Kohonen top map (distribution of chemicals),
weight levels maps (distribution of individual descriptors)
and corresponding response surface output layer with dis-
tribution of carcinogenicity class (carcinogens/non carcin-
ogens). All maps are located one under another which
enable analyse and compare the obtained data.
Results and discussions
How selected descriptors correlate with SAs
for carcinogenicity
The distribution of the chemical classes coded as SAs
over the Kohonen map in the model for prediction of SAs
As was pointed above the eight MDL descriptors that
maximally correlated with carcinogenicity were selected in
the predictive model for carcinogenicity (model_A). The
following question arises: how selected descriptors are
correlated with SAs for carcinogenicity with relevant
possible mechanisms of action? For this reason the CP
ANN predictive model for SAs was built (model_A_SA).
This model was aimed to get insight into the distribution of
chemical classes coded as SAs over the Kohonen map.
Models for prediction of SAs were created using the
same parameters like in the case of predictive models for
carcinogenicity as was described in the article [8]. We
examined model (model_A_SA) based on eight MDL
descriptors, with 35 9 35 dimensional ANN trained for
800 epochs.
The chemicals containing the following SAs were con-
sidered in this study: SA_7- epoxides and aziridines
(22 chemicals), SA_8- aliphatic halogens (47 chemicals),
SA_13- hydrazine (32 chemicals), SA_21- alkyl and aryl
N-nitroso groups (107 chemicals), SA_27- Nitro-aromatic
amine (75 chemicals) and SA_28- primary aromatic amine,
hydroxyl amine and its derived esters (52 chemicals). We
also considered chemicals containing two SAs in one mol-
ecule: SA_13 ? SA_27 (12 chemicals) and SA27 ? SA_28
(14 chemicals). The studied data set contains the 334
chemicals marked as NA-no alert. These chemicals don’t
contain the carcinogenic SA as was determined in Toxtree.
Others alerts were marked as a SA_X.
Table 1 represents the SAs used in the modelling with an
appropriate mechanism of action, the structure of a special
SA, and total number of chemicals containing particular SA
in the dataset. The chemical classes coded as SAs are
numbered (1–10). They are also shown in the Kohonen map
(see Fig. 1). The Kohonen map enables to get insight within
congeneric sets of chemicals and to determine the similar-
ities or dissimilarities within groups of chemicals charac-
terised on the basis of particular carcinogenic SA.
Figure 1(a, b, c, d, e) shows the weight levels maps of
particular SAs and NA. The following groups of chemicals
generate clusters: 5-SA_21 (nitro compounds) (Fig. 1a), 7-
SA_27 ? SA_28 (nitro-aromatic, primary aromatic amines)
(Fig. 1b) while others groups of chemicals marked as 1, 3,
4, 6, 9 and 10 scatter in the whole map. The following
groups of chemicals generate clusters and spread through-
out the map: 8-SA_28 (primary aromatic amines) (Fig. 1c)
and 2-SA_8 (aliphatic halogens) (Fig. 1d). In the following
part of study we considered the possible mechanism of
action for chemicals containing the particular SA and tried
to find reasons of clustering or scattering of studied
chemicals over the Kohonen map.
Thus, the first group of chemicals (N-Nitroso com-
pounds containing SA_21) marked as (5) generate the
cluster. The chemicals in this group belong to alkylating,
indirect acting agents as was described in papers [11, 13].
The N-nitrosamines and N-nitrosamides represent a well
established class of chemical carcinogens [11]. The second
group of chemicals (the nitro-aromatic, primary aromatic
amines containing SA_27 ? SA_28) marked as (7) also
forms the cluster. The chemicals in this group belong to
aminoaryl DNA-adducts forming, indirect acting agents
[11]. The clusters of chemicals containing those two alerts
(SA27 ? SA28) are placed in the closest neurons because
of similarity due to presence of the same groups respon-
sible for the similar mode of action or biological activity. It
is interesting that all chemicals in this cluster are also
positive by results of mutagenicity tests (Salmonella
typhimurium TA98 strain).
The chemicals coded as SA27, SA28 and groups of
chemicals containing (SA27 ? SA28) and their structures
are shown in Tables 2SI–4SI in supplementary materials
‘‘Online resource’’. Why chemicals containing SA27 (6) and
SA28 (8) spread throughout the Kohonen map while group
of chemical containing two SAs (SA27 ? SA28) (7) forms a
cluster? Analysing structures of chemicals with SA_27 (75
chemicals) and SA_28 (52 chemicals) one can notice greater
diversity of represented structures here in comparison with
group of chemicals containing SA27 ? SA28 (14 chemi-
cals). Moreover, the studied chemicals in the dataset contain
not only SA 27 or SA 28 but others functional groups which
effect the activity of chemicals. The MDL descriptors
possess such features that enable to discriminate between
chemicals with great structural diversity. The SA approach
in some cases unable to make differences inside group of
chemicals with great diversity of structure because it
1162 J Comput Aided Mol Des (2011) 25:1159–1169
123
Author's personal copy
doesn’t take into account presence of others (non-carcino-
genic) functional groups which affect activity of compounds.
The next step we considered the third group of chemi-
cals marked as (2) (Aliphatic halogens containing SA_8)
(see Fig. 1d) which forms small clusters and are spread
throughout the map. This phenomenon can be explained
the following way. As was described in the paper [7],
‘‘…the action mechanisms of aliphatic halogens tend to
shift from genotoxic to epigenetic, with increasing degree
of halogenation and depending on the carbon skeleton
999
99
69
9
31
86
9
5
19
6
6
6
99
9
9
99
339
9
9
9
3
4
9
6
3
9
2
9
9
9
9
9
9
9
9
9
9
9
6
2
9
9
9
8
9
9
99
9
9
9
9
9
999
6
99
9
9
9
9
8
9
9
9
6
9
9
9
99
9
1
6
9
8
2
9
9
9
9
98
9
9
399
9
9
6
9
3
2
9
6
88
9
2
1
9
445
88
8
1
96
9
9
95
5
5
888
9
9
96
5
55
4
1
5
3
98
7
6
9
5
5
5
5
98821
6
6
2293
9
98
4
9
9
6
8
676
55
5
5
9
7
7
5
5
456
5
3
9229
4
2
5
5
5
55
9
121
22
292
5
5
93
2
12
95
955
5
5
2
2
1
995
9
5
5
9
9
2
555
5
9
59
9
9
2
5
5
55
9
91
9
2
55
5
55
99
5
9
Nx
Ny
5 10 15 20 25 30 35
5
10
15
20
25
30
35
0
1
2
3
4
5
6
7
8
9
10
Nx
Ny
5 10 15 20 25 30 35
5
10
15
20
25
30
35
Nx
Ny
5 10 15 20 25 30 35
5
10
15
20
25
30
35
Nx
Ny
5 10 15 20 25 30 35
5
10
15
20
25
30
35
Nx
Ny
5 10 15 20 25 30 35
5
10
15
20
25
30
35
Nx
Ny
5 10 15 20 25 30 35
5
10
15
20
25
30
35
(a)
(b)
(e)(d)(c)
Fig. 1 The top map of model_A_SA for prediction of SAs illustrating
the distribution of largest selected families of chemicals containing
appropriate SAs (from 1 to 9*) complemented with the following
weight maps demonstrating: a The distribution of chemicals contain-
ing SA_21- (5); b The distribution of chemicals containing
(SA_27 ? SA_28)-(7); c The distribution of chemicals containing
SA_28- (8); d The distribution of chemicals containing SA_8- (2);
e The distribution of chemicals containing NA (no alerts) *The
numbers (1–9) in the top map relate to chemicals containing the
following SAs: 1-SA7, 2-SA8, 3-SA13, 4-(SA13 ? SA27), 5-SA21,
6-SA27, 7-(SA27 ? SA28), 8-SA28, 9-SA_X (X-others SA)
J Comput Aided Mol Des (2011) 25:1159–1169 1163
123
Author's personal copy
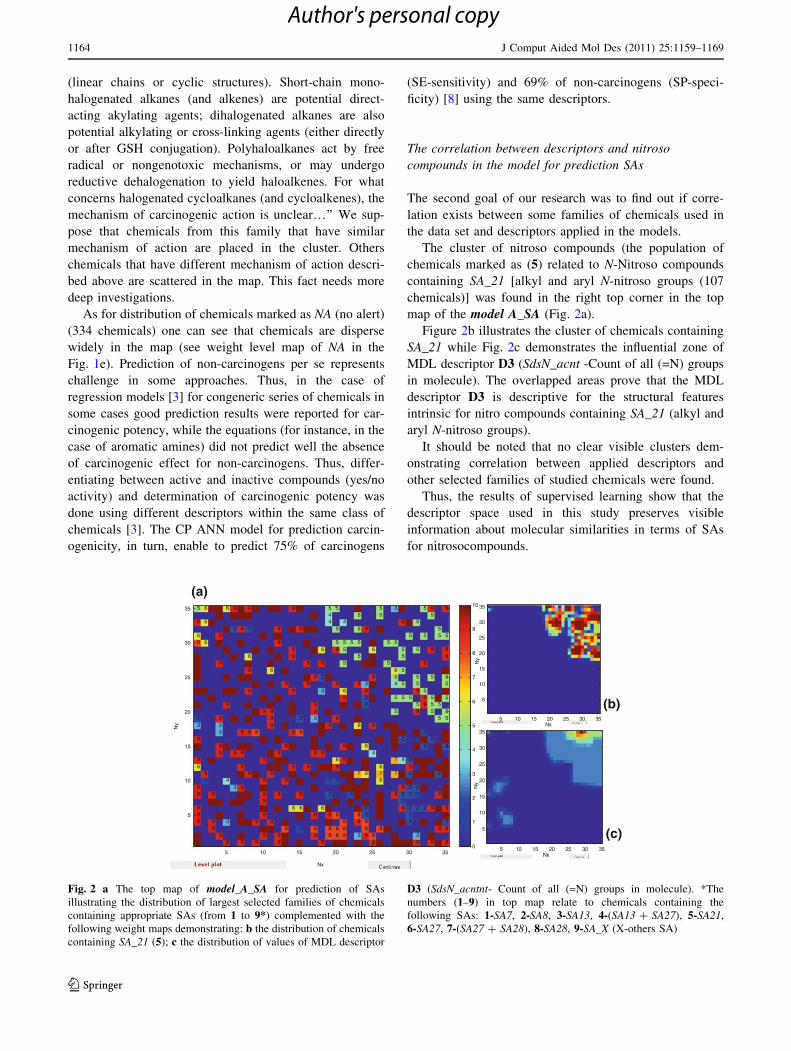
(linear chains or cyclic structures). Short-chain mono-
halogenated alkanes (and alkenes) are potential direct-
acting akylating agents; dihalogenated alkanes are also
potential alkylating or cross-linking agents (either directly
or after GSH conjugation). Polyhaloalkanes act by free
radical or nongenotoxic mechanisms, or may undergo
reductive dehalogenation to yield haloalkenes. For what
concerns halogenated cycloalkanes (and cycloalkenes), the
mechanism of carcinogenic action is unclear…’’ We sup-
pose that chemicals from this family that have similar
mechanism of action are placed in the cluster. Others
chemicals that have different mechanism of action descri-
bed above are scattered in the map. This fact needs more
deep investigations.
As for distribution of chemicals marked as NA (no alert)
(334 chemicals) one can see that chemicals are disperse
widely in the map (see weight level map of NA in the
Fig. 1e). Prediction of non-carcinogens per se represents
challenge in some approaches. Thus, in the case of
regression models [3] for congeneric series of chemicals in
some cases good prediction results were reported for car-
cinogenic potency, while the equations (for instance, in the
case of aromatic amines) did not predict well the absence
of carcinogenic effect for non-carcinogens. Thus, differ-
entiating between active and inactive compounds (yes/no
activity) and determination of carcinogenic potency was
done using different descriptors within the same class of
chemicals [3]. The CP ANN model for prediction carcin-
ogenicity, in turn, enable to predict 75% of carcinogens
(SE-sensitivity) and 69% of non-carcinogens (SP-speci-
ficity) [8] using the same descriptors.
The correlation between descriptors and nitroso
compounds in the model for prediction SAs
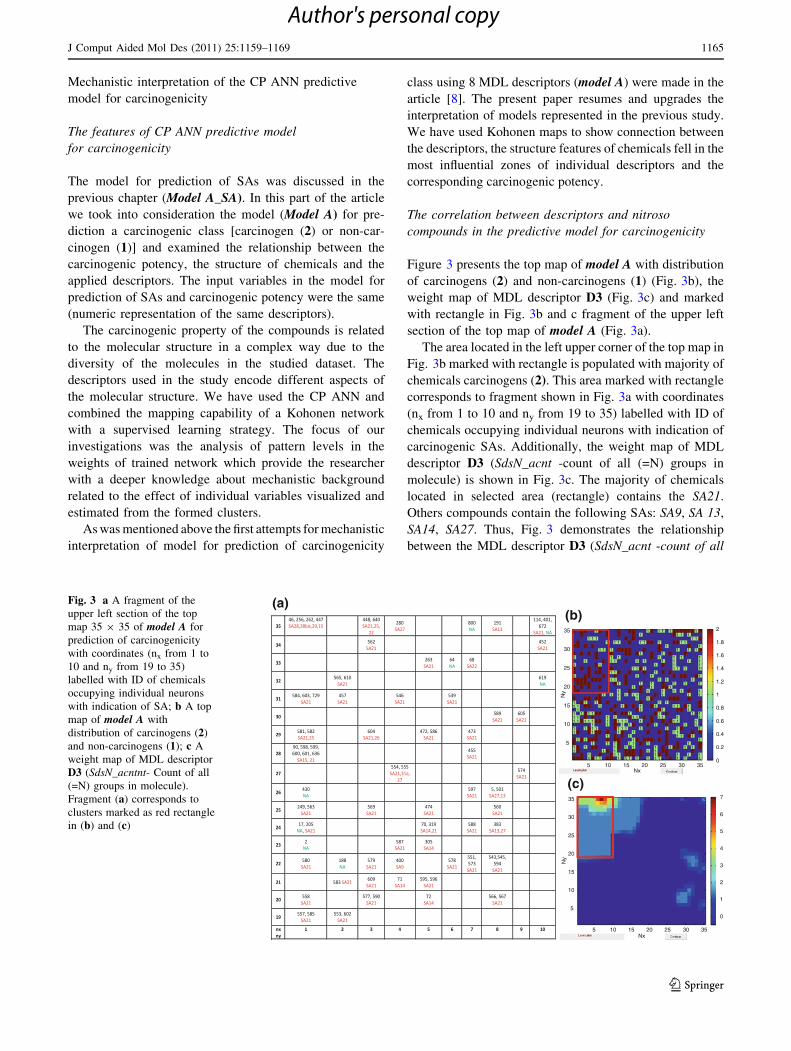
The second goal of our research was to find out if corre-
lation exists between some families of chemicals used in
the data set and descriptors applied in the models.
The cluster of nitroso compounds (the population of
chemicals marked as (5) related to N-Nitroso compounds
containing SA_21 [alkyl and aryl N-nitroso groups (107
chemicals)] was found in the right top corner in the top
map of the model A_SA (Fig. 2a).
Figure 2b illustrates the cluster of chemicals containing
SA_21 while Fig. 2c demonstrates the influential zone of
MDL descriptor D3 (SdsN_acnt -Count of all (=N) groups
in molecule). The overlapped areas prove that the MDL
descriptor D3 is descriptive for the structural features
intrinsic for nitro compounds containing SA_21 (alkyl and
aryl N-nitroso groups).
It should be noted that no clear visible clusters dem-
onstrating correlation between applied descriptors and
other selected families of studied chemicals were found.
Thus, the results of supervised learning show that the
descriptor space used in this study preserves visible
information about molecular similarities in terms of SAs
for nitrosocompounds.
999
99
69
9
31
86
9
5
19
6
6
6
99
9
9
99
339
9
9
9
3
4
9
6
3
9
2
9
9
9
9
9
9
9
9
9
9
9
6
2
9
9
9
8
9
9
99
9
9
9
9
9
999
6
99
9
9
9
9
8
9
9
9
6
9
9
9
99
9
1
6
9
8
2
9
9
9
9
98
9
9
399
9
9
6
9
3
2
9
6
88
9
2
1
9
445
88
8
1
96
9
9
95
5
5
888
9
9
96
5
55
4
1
5
3
98
7
6
9
5
5
5
5
98821
6
6
2293
9
98
4
9
9
6
8
676
55
5
5
9
7
7
5
5
456
5
3
9229
4
2
5
5
5
55
9
121
22
292
5
5
93
2
12
95
955
5
5
2
2
1
995
9
5
5
9
9
2
555
5
9
59
9
9
2
5
5
55
9
91
9
2
55
5
55
99
5
9
Nx
Ny
5 10 15 20 25 30 35
5
10
15
20
25
30
35
0
1
2
3
4
5
6
7
8
9
10
Nx
Ny
5 10 15 20 25 30 35
5
10
15
20
25
30
35Nx
Ny
5 10 15 20 25 30 35
5
10
15
20
25
30
35
(a)
(b)
(c)
Fig. 2 a The top map of model_A_SA for prediction of SAs
illustrating the distribution of largest selected families of chemicals
containing appropriate SAs (from 1 to 9*) complemented with the
following weight maps demonstrating: b the distribution of chemicals
containing SA_21 (5); c the distribution of values of MDL descriptor
D3 (SdsN_acntnt- Count of all (=N) groups in molecule). *The
numbers (1–9) in top map relate to chemicals containing the
following SAs: 1-SA7, 2-SA8, 3-SA13, 4-(SA13 ? SA27), 5-SA21,
6-SA27, 7-(SA27 ? SA28), 8-SA28, 9-SA_X (X-others SA)
1164 J Comput Aided Mol Des (2011) 25:1159–1169
123
Author's personal copy
Mechanistic interpretation of the CP ANN predictive
model for carcinogenicity
The features of CP ANN predictive model
for carcinogenicity
The model for prediction of SAs was discussed in the
previous chapter (Model A_SA). In this part of the article
we took into consideration the model (Model A) for pre-
diction a carcinogenic class [carcinogen (2) or non-car-
cinogen (1)] and examined the relationship between the
carcinogenic potency, the structure of chemicals and the
applied descriptors. The input variables in the model for
prediction of SAs and carcinogenic potency were the same
(numeric representation of the same descriptors).
The carcinogenic property of the compounds is related
to the molecular structure in a complex way due to the
diversity of the molecules in the studied dataset. The
descriptors used in the study encode different aspects of
the molecular structure. We have used the CP ANN and
combined the mapping capability of a Kohonen network
with a supervised learning strategy. The focus of our
investigations was the analysis of pattern levels in the
weights of trained network which provide the researcher
with a deeper knowledge about mechanistic background
related to the effect of individual variables visualized and
estimated from the formed clusters.
As was mentioned above the first attempts for mechanistic
interpretation of model for prediction of carcinogenicity
class using 8 MDL descriptors (model A) were made in the
article [8]. The present paper resumes and upgrades the
interpretation of models represented in the previous study.
We have used Kohonen maps to show connection between
the descriptors, the structure features of chemicals fell in the
most influential zones of individual descriptors and the
corresponding carcinogenic potency.
The correlation between descriptors and nitroso
compounds in the predictive model for carcinogenicity
Figure 3 presents the top map of model A with distribution
of carcinogens (2) and non-carcinogens (1) (Fig. 3b), the
weight map of MDL descriptor D3 (Fig. 3c) and marked
with rectangle in Fig. 3b and c fragment of the upper left
section of the top map of model A (Fig. 3a).
The area located in the left upper corner of the top map in
Fig. 3b marked with rectangle is populated with majority of
chemicals carcinogens (2). This area marked with rectangle
corresponds to fragment shown in Fig. 3a with coordinates
(nx from 1 to 10 and ny from 19 to 35) labelled with ID of
chemicals occupying individual neurons with indication of
carcinogenic SAs. Additionally, the weight map of MDL
descriptor D3 (SdsN_acnt -count of all (=N) groups in
molecule) is shown in Fig. 3c. The majority of chemicals
located in selected area (rectangle) contains the SA21.
Others compounds contain the following SAs: SA9, SA 13,
SA14, SA27. Thus, Fig. 3 demonstrates the relationship
between the MDL descriptor D3 (SdsN_acnt -count of all
2
1122
11
111
112
22
21221
12
2
2
2
22
1
2
11
11
2
22
22
22
2
2
1
2
222
2
2
22
1
1
1
122
212
222
1
2
2
11
2
22
1
1
2
2
22
222
2
1
2
212
111121
2
2
1
1
2
2221
2
2
12
2
2
2
22
1
1
12
2
2
2
1222
2
2
221
1
2
1
1
2
2
1
2
2
1212
111
2
1
22
22
2
1
1
12
1121
111122
22212
2
2121
1
1
11
222
11
1
111
1
2
1
2
1
22
22111
2
1
2
1221
1
1
2
2
1
222
2
22
2
122
1
1
1
21
2
2
22
2
2
22111
1
2
1
2
1
1
1
222
1
2
1
2
11
1
1
1
2
22
2
1
1
112
221
2
1
1
1
2
2
21
1
2
1
1
1
12
2
2
1
1
2
1
2
22
2
2
11
1
22
2
2
1111
1
2
1
2
1
1
12
2
2
112
1
1
1
221
1
22
21
1
1122
2
21
1
1
22
222212
2
1
2
1
1
2
1
2
2
1
2
2
1
2
1
1
1
2
1
1
2
1111
2
22
11
22
111
11
21
2
1
1
2
12
1
2
2
1
2
1
1
12
1
1
1
2
1
2
1
2
1
2
1
1
2
11
212
1
12
12
21
12
1
1
1
2
11
2
1
1
1
11
221
21
11
22
11
1
1
1111
21
2
2
Nx
Ny
5 10 15 20 25 30 35
5
10
15
20
25
30
35
0
0.2
0.4
0.6
0.8
1
1.2
1.4
1.6
1.8
2
Nx
Ny
5 10 15 20 25 30 35
5
10
15
20
25
30
35
0
1
2
3
4
5
6
7
(a)(b)
(c)
Fig. 3 a A fragment of the
upper left section of the top
map 35 9 35 of model A for
prediction of carcinogenicity
with coordinates (nx from 1 to
10 and ny from 19 to 35)
labelled with ID of chemicals
occupying individual neurons
with indication of SA; b A top
map of model A with
distribution of carcinogens (2)
and non-carcinogens (1); c A
weight map of MDL descriptor
D3 (SdsN_acntnt- Count of all
(=N) groups in molecule).
Fragment (a) corresponds to
clusters marked as red rectangle
in (b) and (c)
J Comput Aided Mol Des (2011) 25:1159–1169 1165
123
Author's personal copy
(=N) groups in molecule) and chemicals containing SA21
(alkyl and aryl N-nitroso groups), SA9 (Alkyl nitrite), SA 13
(Hydrazine), SA14 (Aliphatic azo and azoxy) and SA27
(Nitro-aromatic).
Descriptors identify the certain structural features or
particularities. Thus, we have found the relationship
between descriptors containing features for nitro com-
pounds that gave ability to neural network to organize
those families of chemicals in topologically near locations
(neurons). The majority of chemicals from this class are
carcinogens, i.e. possess the same biological activity.
Obviously, the nitro SAs are important for carcinogenic
activity which is in good agreement with the selection of
MDL descriptor D3 that resulted from our modelling
methodology.
The study of the influential zones of descriptors
using their weight maps
The following part of our study was dedicated to research
of influential zones of descriptors (areas with the largest
values) and there correlation with structure of chemicals
located in those areas. Analysing the individual descriptors
layers (weight maps) in the Self-Organizing Maps (Kohonen
map) one recognized the importance and role of individual
descriptors in a studied model. The results of our inves-
tigations represented in the Supplementary material
Tables 1SI–6SI of the Online Resources.
We have found that influential zones of some of descriptors
like MDL descriptors D1 (SdsCH- Sum of all (=CH–) E-State
values in molecule) (Fig. 1SI), D2 (SdssC_acnt- Count of all
(=C\) groups in molecule) (Fig. 2SI), D4 (dxp9 -Difference
simple 9th order path chi indices) and D7 (SHCsats- sum of
hydrogen E-State on sp3 C on saturated bond) (Fig. 4SI) cover
only small area. It was found that the pointed descriptors have
the highest value only for few chemicals in the studied dataset.
In contrast, the MDL descriptor D6 (Gmin- Smallest atom
E-State value in molecule) (Fig. 5SI) has influential zone
which covers the whole map. This phenomenon probably is
the evidence that descriptor D6 has features effecting on
majority of chemicals in the dataset.
The MDL descriptor D3 (SdsN_acntnt- Count of all
(=N) groups in molecule) (Fig. 3SI) forms the cluster
related to nitroso compounds with SA21 (alkyl and aryl
N-nitroso groups) distributed at the same location in
Kohonen maps as pointed descriptors. The majority of
these chemicals are carcinogens here.
The more detailed characterization of MDL descriptors
used in the modeling and their mechanistic interpretation is
given in supplementary materials of the Online Resource
(see Table 1SI and Figs. 1SI–6SI).
Descriptors used in the QSAR models as a general
features relevant to carcinogenicity
The goal of a QSAR approach is to find out general fea-
tures relevant to carcinogenicity. The question arises: is it
possible to find out descriptors used in QSAR models for
prediction of carcinogenicity that contain features relevant
to carcinogenicity. In contrast to investigations related to
congeneric chemicals, the so-called ‘‘general’’ studies for
non-congeneric chemicals contributes for searching of
general features related to carcinogenicity and relevant to
different classes of chemicals.
It is well known that mutagenicity and genotoxicity
related to each other and some of genotoxic carcinogens
can be also mutagenic. We have considered some models
for prediction of mutagenicity, genotoxicity and carcino-
genicity to find out if different QSAR approaches for
prediction endpoints listed above have similar or the same
features related to mutagenicity, genotoxicity or carcino-
genicity. The following descriptors that were selected in
our models for prediction of carcinogenicity [8] were found
in the models created by Votano [14] and Contrera [15]:
SdsCH Sum of all (=CH–) E-State values in molecule
[8, 15];
SdssC_acnt Count of all (=C\) groups in molecule
[8, 15];
SdsN_acnt Count of all (=N) groups in molecule
[8, 14, 15];
Gmin Smallest atom E-State value in molecule
[8, 14, 15];
SHBint2_Acnt Count of internal hydrogen bonds with 2
skeletal bonds between donor and acceptor [8, 15].
As was shown above, some of the E-state descriptors
relate directly to known sturctural alerts for carcinogenicity
[for example, SA21 (alkyl and aryl N-nitroso groups)].
Each of E-state descriptors encode the following three
aspects of structure: electron accessibility as well as pres-
ence/absence and the count of the atom or bond.
A model based on E-state descriptors represented as
continues values can correlate with carcinogenicity to a
specific range of descriptor value, whereas the use of SAs
limits the model to the presence or absence of a given
fragment (SA). The consideration of a SA fragment per se
does not take into account steric and electronic surrounding
in the whole molecule that can deminish or enhance car-
cinogenic potency. This can render the fragment non toxic,
or create a toxic fragment that has not previously been
identified. From other hand, SA approach provides the
clear determination of mechanism of action for particular
SAs that can be successfully used in a mechanistic inter-
pretation of QSAR models. We belive that an integration of
1166 J Comput Aided Mol Des (2011) 25:1159–1169
123
Author's personal copy

different approaches and tools contributes into larger per-
spective of the risk assesment process.
How energy of activation DE in processes
of metabolism affect carcinogenic potency
of chemicals with similar structure
As a rule, the chemicals located in the same neuron of the
Kohonen map in the training and test set have the similar
structure. In some cases the activity of chemicals with the
similar structure can differ resulting in a false prediction.
We have demonstrated here three examples of false pre-
diction due to the different energy of activation DE in the
processes of metabolism.
Firstly, we considered the biologically inactive chemical
N-Nitrosobis(2,2,2-trifluoroethyl) amine (CASRN 625-89-8)
which is a non-carcinogen. This chemical was predicted as
carcinogen (FP- false predicted) because the chemical with
similar structure N-Nitroso-bis-(4,4,4-trifluoro-N-butyl)a-
mine (CASRN 83335-32-4) from the training set located in the
same neuron is carcinogen (see Table 2). This phenomenon
was described in the papers [16, 17] dedicated to investigation
of a bioactivation of compounds in the process of a metabolic
biotransformations using the oxenoid model and the quantum
chemical calculation. The authors explained how the carcin-
ogenicactivity depends on the value ofactivation energyDE in
the oxidation reaction. The bioactivation of N-Nitrosobis-
(2,2,2-trifluoroethyl) amine is not possible because the energy
Table 2 Structures of false
predicted chemicals from test
and training set located in the
same or closest neurons
* FP false positive, FN false
negative; SA8-Aliphatic
halogens; SA13-Hydrazine;
SA21-alkyl and aryl N-nitroso
groups, DE-energy of activation
No Position of neurons nx*ny in test/trainingset
The chemical from the test set
The chemical from the training set
SA FP or FN
1 35x35/35x35
N-Nitrosobis(2,2,2-trifluoroethyl) amine;(CASRN 625-89-8);non-carcinogen;
ΔE= 27.21 kcal/mol
N-Nitroso-bis-(4,4,4-trifluoro-N-butyl)amine; (CASRN 83335-32-4);carcinogen; TD50=0,745 mg/kg;
ΔE= 22.92 kcal/mol
N-Nitroso(2,2,2-trifluoroethyl) ethylamine (82018-90-4);
carcinogen; TD50=2,52 mg/kg;ΔE= 23.42 kcal/mol
SA21 FP
2 17x33/17x33
2-Furaldehyde semicarbazone;
(CASRN 2411-74-7);non-carcinogen
Nitrofurazone;(CASRN 59-87-0);
carcinogen
SA13 FP
3 27x26/28x26
3-Chloro-4-(dichloromethyl)-5-hydroxy-
2(5H)-furanone(MX);(CASRN 77439-76-0);
carcinogen
L-Ascorbic acid ;(CASRN 50-81-7);non-carcinogen
SA8 FN
J Comput Aided Mol Des (2011) 25:1159–1169 1167
123
Author's personal copy
ofactivation is too high (DE=27.21 kcal/mol).Onlychemicals
with the energy of activation lower then 27 kcal/mol possess
the carcingenic potency. In the case of the N-Nitroso-bis-
(4,4,4-trifluoro-N-butyl)amine the energy of activation (DE) is
lower and equal to 22.92 kcal/mol therefore this compound is
carcinogen.
Secondly, we studied the 2-Furaldehyde semicarbazone
(CASRN 2411-74-7) which is a non-carcinogen (see
Table 2). The chemical in the training set located in the
same neuron Nitrofurazone (CASRN 59-87-0) is a carcin-
ogen. According to analysis presented in article [17]
Nitrofurazone (CASRN 59-87-0) has the nitro group as a
substitute in the furan ring. It was found that in the course of
metabolism the nitrogroup of this compound is restored to a
hydroxylamine metabolite, then nirenium ions and cation–
radicals. Then the active forms of oxygen are formed, which
results in the carcinogenic potency of studied chemical. The
bioactivation of 2-Furaldehyde semicarbazone in turn is not
possible (absence of the nitro group as a substitute in the
furan ring). Therefore 2-Furaldehyde semicarbazone was
predicted as carcinogen (FP- false positive).
Finally, we explored compound Chloro-4-(dichlorom-
ethyl)-5-hydroxy-2(5H)-furanone(MX) (CAS 77439-76-0)
(see Table 2) which was predicted as false negative (FN).
(This chemical we marked as MX). It is known that chlo-
rine atoms result in the mutagenic and carcinogenic prop-
erties of MX. This chemical has genotoxic alert SA8
(Aliphatic halogens) according to Toxtree [7]. MX is a
direct carcinogen able to form adducts with DNA, in par-
ticular, as a result of reaction with the CHCl2 group. In
training set the L-Ascorbic acid (CAS 50-81-7) (non-car-
cinogen) with similar structure placed in closed neuron.
This chemical is no-carcinogen because it doesn’t contain
atom of halogen in the structure.
Summarising analysis given above we can conclude that
using the knowledge about the bioactivation of chemicals
in the case of indirect chemicals carcinogens can bring the
explanation why the chemical with similar structure can
have in some cases different biological activity.
Conclusion
The new models for prediction of the carcinogenicity for
regulatory purpose using CP ANN were proposed recently
[8]. The descriptors employed in the modelling contain
information about topological characteristics, polarizability
and charge distribution of molecules related to the reac-
tivity but don’t include information about a carcinogenic
mechanism of action which is important in a mechanistic
interpretation of models. Therefore, the knowledge-based
Toxtree approach based on carcinogenic SAs (containing
information about a carcinogenic mechanism of action)
was integreated with the statistically-based method (CP
ANN) to obtaine the mechanistic interpretation of models.
The mechanistic insight in the CP ANN model was
demonstrated using the inherent mapping technique (i.e.
Kohonen maps) which enables the visualization of the
following features in 2D space: the carcinogenic potency;
the distribution of descriptors in individual layers which
express the structural and electronic features related to
activity of molecules as well as the distribution of groups
of chemicals containing the specific carcinogenic SAs
related to a mechanism of action.
In this study we demonstrated that the MDL descriptors
possess such features that enable to discriminate between
chemicals with great structural diversity. The advantage of
the CP ANN model is in the ability to obtain a non-linear
topological distribution of several small clusters of partic-
ular chemicals that are based on different modes of action.
The SA approach in turn is limited to make differences
inside group of chemicals with great diversity of structure
because it is oriented only on SAs.
It was shown that some E-state descriptors like the MDL
descriptor D3 (SdsN_acntnt- Count of all (=N) groups in
molecule) relate directly or are associated with known SAs
(like SA21 [alkyl and aryl N-nitroso groups)] for carcino-
genicity for such classes of chemicals like nitro com-
pounds, nitro-aromatic, primary aromatic amines, and
consequently carcinogens and non-carcinogens.
We demonstrated a few descriptors used in QSAR
modelling by different researchers (Voltano, Contrera)
containing the general features relevant to carcinogenicity.
The results presented in the articles demonstrate the
transparency of CP ANN algorithm which is one of the
main features of QSAR models used for regulatory pur-
poses. The mechanistic interpretation of models is very
important for assessment of safety of chemicals in the risk
assessment.
Acknowledgments Authors thank for the European Commission
for the financial support under project CAESAR (SSPI-022674) and
the Slovenian Ministry of Higher Education, Science and Technology
(grant P1-017).
References
1. Worth AP, Bassan A, Gallegos A, Netzeva TI, Patlewicz G,
Pavan M, Tsakovska I, Vracko M (2005) The characterisation of
(Quantitative) structure-activity relationships: preliminary guid-
ance EUR 21866 EN
2. Benigni R, Bossa C, Netzeva T, Worth A (2007) Collection and
evaluation of (Q)SAR models for mutagenicity and carcinogenic-
ity. EUR 22772 EN:119, http://ecb.jrc.ec.europa.eu/documents/
QSAR/EUR_22772_EN.pdf
3. Benigni R (2005) Structure-activity relationship studies of chem-
ical mutagens and carcinogens: mechanistic investigations and
1168 J Comput Aided Mol Des (2011) 25:1159–1169
123
Author's personal copy
prediction approaches. Chem Rev 105:1767–1800. doi:10.1002/
chin.200536232
4. Benigni R, Richard AM (1996) QSARS of mutagens and car-
cinogens: two case studies illustrating problems in the construc-
tion of models for noncongeneric chemicals. Mutat Res/Genetic
Toxicol 371(1–2):29–46. doi:10.1016/S0165-1218(96)90092-0
5. Serafimova R, Gatnik MF, Worth A (2010) Review of QSAR
models and software tools for predicting genotoxicity and car-
cinogenicity, EUR 24427 EN:58, http://ecb.jrc.ec.europa.eu/
DOCUMENTS/QSAR/EUR_24427_EN.pdf
6. Benfenati E, Benigni R, DeMarini DM, Helma C, Kirkland D,
Martin TM, Mazzatorta P, Ouedraogo-Arras G, Richard AM,
Schilter B, Schoonen WGE, Snyder RD, Yang C (2009) Predic-
tive models for carcinogenicity: frameworks, state-of-the-art, and
perspectives. J Environ Sci Health C 27:57–90. doi:10.1080/
10590500902885593
7. Benigni R, Bossa C, Jeliazkova N, Netzeva TI, Worth AP (2008)
The Benigni/Bossa rulebase for mutagenicity and carcinogenic-
ity—a module of Toxtree. EUR 23241 EN: 1–70
8. Fjodorova N, Vracko M, Novic M, Roncaglioni A, and Benfenati
E (2010) New public QSAR model for carcinogenicity. Chem
Central J 4 (suppl 1):S3 http://www.journal.chemistrycentral.
com/content/4/S1/S3. doi:10.1186/1752-153X-4-S1-S3
9. Fjodorova N, Vracko M, Tusar M, Jezierska A, Novic M, Kuhne
R, Schuurmann G (2010) Quantitative and qualitative models for
carcinogenicity prediction for non-congeneric chemicals using
CP ANN method for regulatory uses. Mol Divers 14(3):581–594.
doi: 10.1007/s11030-009-9190-4
10. CPDBAS: Carcinogenic potency database summary tables—All
species (http://www.epa.gov/ncct/dsstox/sdf_cpdbas.html)
11. Benigni R, Bossa C (2011) Mechanisms of chemical carcinoge-
nicity and mutagenicity: a review with implications for predictive
toxicology. Chem Rev 111(4):2507–2536. doi:10.1021/cr100
222q
12. MDL-QSARv version 2.2 (2002–2004) MDL Information Sys-
tems Inc., San Leandro, CA. 94577 [http://www.drugdiscovery
online.com/storefronts/mdl.html]
13. Luan F, Zhang R, Zhao C, Yao X, Liu M, Hu Z, Fan B (2005)
Classification of the carcinogenicity of N-nitroso compounds
based on support vector machines and linear discriminant anal-
ysis. Chem Res Toxicol 18:198–203. doi:10.1021/tx049782q
14. Votano JR, Parham M, Hall LH, Kier LB, Orloff S, Tropsha A,
Xie Q, Tong W (2004) Three new consensus QSAR models for
the prediction of ames genotoxicity. Mutagenesis 19:365–378.
doi:10.1093/mutage/geh043
15. Contrera JF, Matthews EJ, Benz RD (2003) Prediction the car-
cinogenic potential of pharmaceuticals in rodents using molecular
structural similarity and E-state indeces. Regul Toxicol Phar-
macol 38:243–259. doi:10.1016/S0273-2300(03)00071-0
16. D’Yachkov P, Kharchevnikova N, Zholdakova Z, Fjodorova N,
Novich M, Vrachko M (2010) Quantum chemical metabolism-
based simulation of carcinogenic potency of benzene derivatives
(p NA). Int J Quantum Chem 110:1402–1411. doi:10.1002/qua.
22226
17. Kharchevnikova N, Blinova V, Dobrynin D, Fedorova N, Novich
M, Vrachko M (2009) Data Mining on carcinogenicity of chem-
ical compounds by the JSM Method. Autom Document Math
Linguist 43(6): 330–335 Allerton Press Inc. ISSN 0005-1055
J Comput Aided Mol Des (2011) 25:1159–1169 1169
123
Author's personal copy
Copyright © 2022 FDOKUMEN