Solvent Systems for seperation of novel Anthocyanin aglycones with Methylated A- Rings from Plumbago...
57
SOLVENT SYSTEMS FOR SEPARATION OF NOVEL ANTHOCYANIN AGLYCONES WITH METHYLATED A - RINGS FROM PLUMBAGO AURICULATA LAM ON CELLULOSE THIN- LAYERS BY KAYIMA FESTO, (BSc.ED) (Mak) A DISSERTATION SUBMITTED TO THE DIRECTORATE OF RESEARCH AND INNOVATION IN PARTIAL FULFILMENT FOR THE AWARD OF MASTER OF SCIENCE DEGREE (CHEMISTRY) OF MAKERERE UNIVERSITY MARCH, 2012
Transcript of Solvent Systems for seperation of novel Anthocyanin aglycones with Methylated A- Rings from Plumbago...

SOLVENT SYSTEMS FOR SEPARATION OF NOVEL
ANTHOCYANIN AGLYCONES WITH METHYLATED A - RINGS
FROM PLUMBAGO AURICULATA LAM ON CELLULOSE THIN-
LAYERS
BY
KAYIMA FESTO, (BSc.ED) (Mak)
A DISSERTATION SUBMITTED TO THE DIRECTORATE OF
RESEARCH AND INNOVATION IN PARTIAL FULFILMENT FOR
THE AWARD OF MASTER OF SCIENCE DEGREE (CHEMISTRY)
OF MAKERERE UNIVERSITY
MARCH, 2012

i
Declaration
I Festo Kayima declare that this dissertation has never been submitted for any degree in
this or any other university or institution of higher learning. All the information in this
dissertation is based on my own findings with the exception of literature citations.
Festo Kayima
Signature
………………………………………………………………………………………………
Date
………………………………………………………………………………………............

ii
Approval:
This dissertation has been submitted for examination with the approval of the following
supervisors;
1. Dr. Byamukama Robert
Signature……………………………………………Date……………………………….....
2. Professor B.T. Kiremire
Signature……………………………………………Date……..……………………….......

iii
Dedication
I dedicate this work to my dear friend Wilter Nabankema Kamese who has always been
there for me all time whenever needed.

iv
Acknowledgement
First and fore most I would like to express my sincere gratitude to my supervisors; Dr.
Byamukama Robert and Professor B. T. Kiremire of Makerere University for the
guidance, encouragement and support extended to me throughout the research period.
Special thanks to Dr. Byamukama Robert for his endless guidance, reading of my drafts
and for sacrificing his own time for me whenever requested.
I want to thank Miss Jane Namukobe, a PhD student and Moses a senior laboratory
technician (Organic Lab.) at Makerere University for their laboratory assistance and
guidance as well as their willingness to attend to my very many questions during the
experimental period.
I am grateful to the Natural products research group under Prof. B.T Kiremire for having
welcomed me into the group and for supporting me with all the necessary materials and
chemicals needed to carry out this research.
I am also grateful to the DAAD (Deutscher Akademischer Autausch Dienst) German
Academic Exchange Service, for funding all my tuition fees.
Finally, I thank with great honor and due respect the “Almighty God” for His providence
with out which nothing would be done.

v
Table of Contents
Declaration ........................................................................................................................... i
Approval..............................................................................................................................ii
Dedication ......................................................................................................................... iii
Acknowledgement ............................................................................................................. iv
Table of Contents .................................................................................................................v
List of figures and Tables ................................................................................................ viii
Abstract .............................................................................................................................. ix
CHAPTER 1 INTRODUCTION………………………….………………........1
1.1 Anthocyanins, Anthocyanin aglycones and their relationship………………….....1
1.2 Anthocyanin equilibrium forms under various pHs.................................................1
1.3 Stability of anthocyanins..........................................................................................3
1.4 Importance of anthocyanin pigments.......................................................................4
1.5 Separation of anthocyanins and anthocyanin aglycones...……………………...…5
1.6 Statement of the Problem …....................................................................................7
1.7 Objective of the study…..........................................................................................7
1.8 Justification of the study…………………………………………………………..7
CHAPTER 2 LITERATURE REVIEW….........................................................9
2.1 Basic principles for Flavonoids Separation from Plant Materials……………..….9
2.2 Mobile phases or Solvent systems used in TLC analyses......................................11
2.2.1 Selection of the mobile phase....................................................................11
2.2.2 Optimizing solvent systems for analysis of anthocyanin/ aglycones on
TLC……………………………………………………………………....12

vi
2.2.3 The effect of methoxylation on the movement of aglycones on cellulose
thin layers……………………………………………….……………..…13
2.3 A review of the chemistry and sources of anthocyanins and their aglycones…...14
2.3.1 Chemistry of anthocyanins…....................................................................14
2.3.2 Natural anthocyanins with methylated A- rings…………………………15
2.4 A review of analytical methods for extraction, purification and isolation of
anthocyanins …………………………………………………………………….17
2.4.1 Extraction and Purification ……………………………………………...17
2.4.2 Isolation of anthocyanins………………………………………………...17
2.5 Identification techniques for anthocyanins and anthocyanin aglycones………....18
2.5.1 Thin layer chromatography……………………………………...……….19
2.5.2 Chemical degradation methods…………………………………………..22
CHAPTER 3 MATERIALS AND METHODS…............................................23
3.1 Sample Collection...........................................………………………………..….23
3.2 Extraction and Purification....................................................................................23
3.3 Acid hydrolysis of anthocyanins............................................................................25
3.4 The basis for developing a solvent system(s) for separating anthocyanin aglycones
from P. auriculata………………………………………………………………. 25
CHAPTER 4 RESULTS AND DISCUSSION………………………………..27
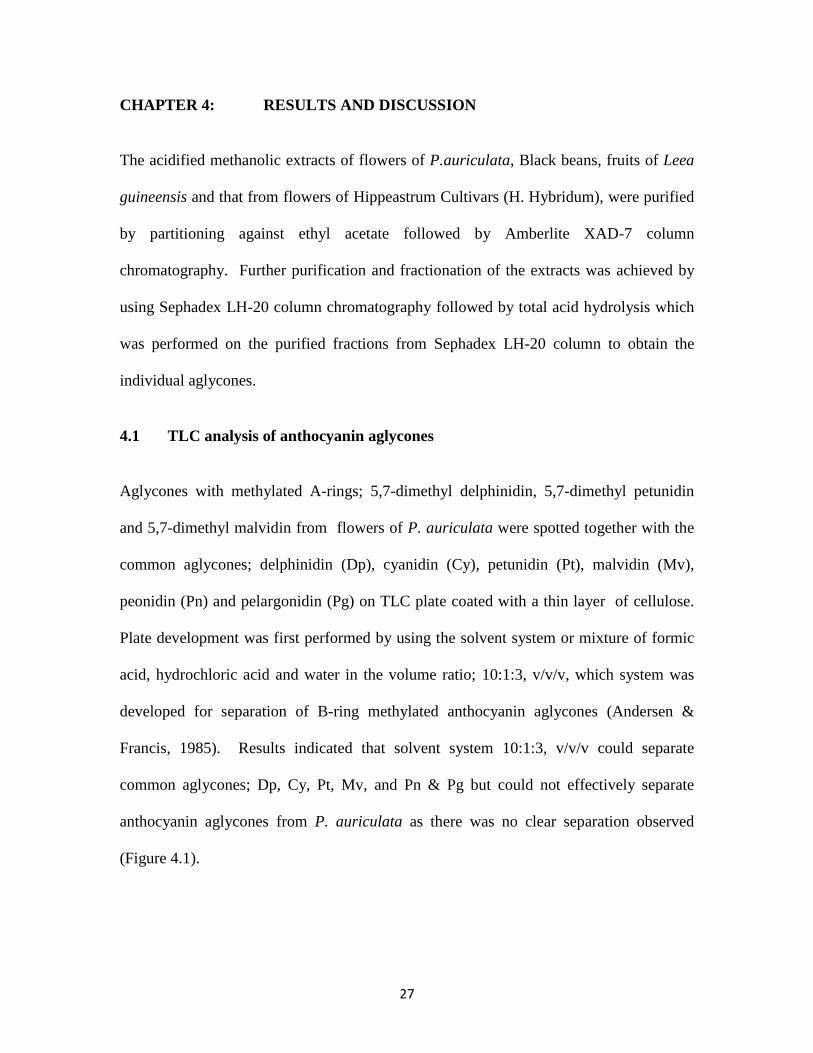
4.1 TLC analysis of anthocyanin aglycones…………………………………………27
4.2 Choosing the Best solvent system(s)…………………………………………….31
4.3 Separation of novel anthocyanins from P. auriculata on TLC…………………..33
CHAPTER 5 CONCLUSION AND RECOMMENDATIONS……………...36
5.1 Conclusion……………….………………………………………………………36
5.2 Recommendations……………….……………………………………………….37

vii
REFERENCES…………………………………….……………………………………38
APPENDIX A: TLC plates developed by using solvent systems, 6:1:3, 7:1:3 and 8:1:3
v/v/v for FHW solvent mixture…………………………………………………….....….45
APPENDIX B: A sample of the Thin layer cellulose coated plates showing separation of
anthocyanin aglycones, using Formic acid-hydrochloric acid-water mixture (FHW);
Variation of Formic acid alone with in the FHW mixture.................................................46

viii
List of Tables and Figures
Table page
Table 4.1: Rf values for anthocyanin aglycones...…...................................................30
Table 4.2: Rf values for anthocyanin aglycones in 5 solvent systems with their
calculated intervals….................................................................................32
Figure page
Figure1.1: The general scheme showing some possible anthocyanin transformations
in aqueous solution. X = glycoside, R1 and R2 can be hydroxyl and/or
methoxyl groups, depending on the type of aglycone.................................3
Figure 2.1: Chemical structures of six naturally occurring common aglycones……..15
Figure 2.2: Structures of the new anthocyanins from P .auriculata………….……...16
Figure 2.3: Illustration on how to establish the center of the spot when calculating RF
values.........................................................................................................21
Figure 2.4: Calculation of RF values by considering the top of the spot......................22
Figure 4.1: Cellulose thin layer plates showing separation of aglycones using the
solvent ratio, 10:1:3 v/v/v for FHW mixture…….....................................28
Figure 4.2: Cellulose thin layer plates showing separation of anthocyanins from p.
auriculata………………………………………………………………...35

ix
Abstract
Novel anthocyanin aglycones with methylated A-rings; 5, 7- dimethyl-delphinidin, 5, 7-
dimethyl- petunidin and 5, 7- dimethyl –malvidin were obtained from flowers of
Plumbago auriculata Lam. The common aglycones; delphinidin, petunidin and malvidin
were obtained from Black beans (Phaseolus vulgaris L), cyanidin and pelargonidin from
Hippeastrum cultivar (H. hybridum) flowers and the peonidin aglycone was got from the
fruits of Leea guineensis.
The plant materials were extracted for anthocyanin pigments with methanol containing
0.5% trifluoroacetic acid. Crude extracts were purified by solvent extraction and a
combination of chromatographic techniques and then isolated into individual
anthocyanins. The anthocyanin aglycones were obtained by carrying out total acid
hydrolysis on the respective anthocyanins.
Several solvent systems or solvent mixtures were generated by varying ratios of the
volumes of formic acid, hydrochloric acid and water (F: H: W, v/v/v). These were in turn
used as developing mobile phases in thin layer chromatography (TLC) experiments.
The solvent mixtures of formic acid, hydrochloric acid and water (F: H: W, v/v/v) in the
volume ratio; A (2:1:3), B (3:1:3), C (4:1:3), D (5:1:3), E (6:1:3), F (7:1:3), G (8:1:3), H
(9:1:3), I (10:1:3), and J (11:1:3) were generated by varying the ratio of the volume of
formic acid alone, keeping that of hydrochloric acid and water constant. Solvent
systems; K (10:0.125:3), L (10:0.25:3), M (10:0.5:3), N (10:1:3), O (10:1.5:3), P
(10:2:3), Q (10:2.5:3), R (10:3:3), S (10:3.5:3), and T (10:4:3), were generated by
varying the ratio of the volume of hydrochloric acid alone, keeping that of formic acid

x
and water constant, whereas in generating the solvent systems; U (10:1:0.5), V (10:1:1),
W (10:1:2), X (10:1:3), Y (10:1:4), and Z (10:1:5), the ratio of the volume of water alone
was varied with in the formic acid-hydrochloric acid-water mixture.
Among the generated solvent systems above, three solvent systems in the volume ratio of
formic acid: hydrochloric acid: water (F: H: W, v/v/v); E (6:1:3), F (7:1:3), and G (8:1:3),
were found to be effective in separating anthocyanin aglycones with methylated A-rings
on cellulose thin layers. The same solvent mixtures proved to be successful in the
separation of the six common aglycones with hydroxylated A-rings; delphinidin,
cyanidin, petunidin, malvidin, peonidin and pelargonidin on cellulose thin layers.

1
CHAPTER 1: INTRODUCTION
1.1 Anthocyanins, Anthocyanin aglycones and their relationship
Anthocyanins are a subgroup of the flavonoid family (Harborne, 1998). They are also
classified as phytochemicals, which are biologically active compounds found in plants.
Chemically anthocyanins are subdivided into the sugar-free anthocyanidin termed as the
aglycone and the anthocyanin glycosides. Anthocyanins are thus aglycones modified by
the addition of sugars or acids and or both sugars and acids (Kong et al., 2003). The
classical anthocyanin aglycone is based on a C15 skeleton (C6–C3–C6 skeleton) which
forms the flavylium cation (2-phenylbenzopyrylium), though pyranoanthocyanins with an
additional C3 unit were also reported to occur in nature (Andersen and Jordheim, 2006).
Approximately 90% of all anthocyanins are based on the six most common aglycones;
pelargonidin, cyanidin, delphinidin, peonidin, petunidin and malvidin regardless of the
fact that over 30 different anthocyanidins/ aglycones have been reported to exist in
nature. These aglycones only differ by the hydroxylation and methoxylation pattern on
their B-rings (Andersen and Jordheim, 2006). However, Anthocyanin aglycones with
methylated A- rings have been also reported with complete structure elucidation (Skaar et
al., 2012)
1.2 Anthocyanin equilibrium forms under various pHs
Anthocyanins are considered to occur in several equilibrium forms. The generally
accepted scheme with respect to the different transformations (proton transfer,
isomerisation and tautomerization) of the flavylium cation of simple anthocyanins under

2
various pH conditions was established by following the study of the thermodynamic and
kinetic properties of the compounds (Sondheimer, 1953; McClelland, 1980; Brouillard
and Dangles, 1994; Pina, 1998).
In strongly acidic solutions (below pH 2) the flavylium cation is predominant (Figure 1.1,
structure 1) giving rise to anthocyanin solutions which are red in color. In slightly acidic
or neutral aqueous solutions anthocyanins are believed to exist as neutral and/or ionized
quinonoidal bases (Figure 1.1, structure 2–4 and 5–7, respectively) after deprotonation.
By hydration in weakly acidic solutions the flavylium cation form is more or less rapidly
changed to the more stable colorless hemiketal (alternatively hemiacetal or carbinol
pseudo base) and chalcone form. The hydration at the flavylium cation seems to occur
mainly at the 2-position to give the hemiketal 2-adduct, but the possibility of a 4-adduct
is also present (Figure 1.1, structure 8 and 9).
The chalcone form is a result of a ring opening of the hemiketal form, and is considered
to be an equilibrium form of the hemiketal (Figure 1.1, structure 10 (Z, E) and 11 (Z, E)).
The different equilibrium structures have been proposed with different methods including
pH-jump method, UV-visible and fluorescence spectroscopy (Pina, 1998) and in a few
cases NMR spectroscopy (Cheminat and Brouillard, 1986; Mistry et al., 1991; Santos et
al., 1993; Jordheim et al., 2006).

3
Figure1.1.The general scheme showing some possible anthocyanin transformations in
aqueous solution. X = glycoside, R1 and R2 can be hydroxyl and/or methoxyl groups,
depending on the type of aglycone.
1.3 Stability of Anthocyanins
The stability of anthocyanin pigments is related to color, equilibrium forms and
copigmentation. These factors are again affected by pH, temperature, oxygen, light,
ascorbic acid, nucleophilic agents, free sugars, sulphur dioxide and enzymes present
(Jackman et al., 1987; Cabrita, 1999).

4
The individual reactions in the equilibrium scheme (Figure 1.1) were each endothermic
starting from the flavylium cationic form (Iacobucci and Sweeny, 1983). Equilibrium was
driven towards the chalcone form giving decreased quantities of the colored flavylium
cation form as an anthocyanin solution was heated whereas cooling the solution reversed
the change. Cyanidin 3-rutinoside was found to be more stable than cyanidin aglycone,
and the hydroxyl groups at the B-ring increased the stability of the anthocyanin compared
to analogues methoxyl groups (Iacobucci and Sweeny, 1983).
More studies on the stability of various acylated anthocyanins in weak acidic or neutral
aqueous solutions (mostly di- or polyacylated pigments) showed these anthocyanins to be
more resistant to hydration, and hence possess a higher color stability in weakly acid or
neutral solutions compared to nonacylated anthocyanins (Goto et al., 1984; Saito et al.,
1985, 1995).
In the alkaline pH area, aromatic acylated petanin (petunidin 3-O-β-(6''-O-(4'''-O-E-p-
coumaroyl-O-α-rhamnosyl)glucopyranoside)-5-O-β- glucopyranoside) afforded a higher
color intensity and higher or similar stability throughout the whole pH range compared to
the simple cyanidin 3-glucoside (Fossen et al., 1998). Cyanidin 3-(2''-glucosylglucoside)-
5-glucoside was found to be more unstable than cyanidin 3-glucoside at most pH values
(Torskangerpoll and Andersen, 2005).
1.4 Importance of anthocyanin pigments
In plants, anthocyanins are involved in attraction of insects and animals for pollination
and seed dispersal purposes as they constitute the chemical basis of flower color in

5
angiosperms (Harborne and Williams, 1995). Anthocyanins located at the upper surface
of the leaf or in the epidermal cells, have a role in the physiological survival of plants. It
has been outlined that foliar anthocyanins accumulate in young, expanding foliage, in
autumnal foliage of deciduous species, in response to nutrient deficiency, temperature
changes or ultraviolet (UV) radiation exposure, and in association with damage or
defense against browsing herbivores or pathogenic fungal infections (Simmonds, 2003).
To the humans, anthocyanins are important nutraceuticals. This is mainly due to their
possible antioxidant effects, and they have been given a potential therapeutic role related
to cardiovascular diseases, cancer treatment, inhibition of certain types of virus including
the human immunodeficiency virus type 1 (HIV-1), and improvement of visual acuity
(Talavera et al., 2006; Andersen et al., 1997). Anthocyanins have found wide use as food
colorants in the beverage industry (Bridle & Timberlake, 1997).
1.5 Separation of anthocyanins and anthocyanin aglycones
Analytical methods for separation of anthocyanins are essential in the study of these
pigments, especially if we are to exploit their potential health benefits as well as their use
in the beverage industry (Marston & Hostettmann, 2006). In earlier times, thin layer
chromatography (TLC), polyamide chromatography and paper electrophoresis were the
major separation techniques for phenolics. However, of the above techniques, TLC
remains the workhorse of flavonoid analysis as it’s a rapid, simple and versatile method
for following polyphenolics in plant extracts and fractionation work (Marston &
Hostettmann, 2006).

6
Despite the fact that the High Performance Liquid chromatographic technique has
become more popular in the qualitative and quantitative analysis of anthocyanins, TLC
still remains substantial in the analysis of anthocyanins and other flavonoids with the
advantages of having short preparation times, amenability to detect reagents, and the
possibility of running several samples at the same time. TLC is also suited for the
preliminary screening of plant extracts before HPLC analysis (Jork et al., 1994); that’s to
say, it’s used to follow up fractions on the Sephadex LH-20 column where it’s performed
to check for homogeneity of compounds.
Way back in 1984, a solvent system or mixture of formic acid hydrochloric acid and
water in the volume ratio (F:H:W,v/v/v); 10:1:3, v/v/v , was developed and used as a
mobile phase in the separation of anthocyanin aglycones on TLC whose methylation
occur only on their B –rings (Andersen & Francis, 1985). The F:H:W solvent system
10:1:3, v/v/v was developed following Nybom’s proposition of formic acid –
hydrochloric acid and water mixtures for separate analysis on cellulose layers of
anthocyanins and anthocyanidins (Nybom, 1964), and has been widely employed or used
in TLC analysis of flavonoids particularly anthocyanin aglycones with similar structural
formation (Marston & Hostettmann, 2006).
The formic acid – hydrochloric acid and water mixture in the volume ratio; 10:1:3, v/v/v
was also tried out as a mobile phase to establish whether it could also separate the novel
anthocyanin aglycones; 5, 7 – dimethyl delphinidin, 5, 7- dimethyl petunidin, and 5, 7 –
dimethyl malvidin with methylated A- rings on cellulose thin layers. The above
aglycones have recently been reported to occur in the sky- blue corollas of Plumbago

7
auriculata Lam (Skaar et al., 2012). However, no success was registered and this
compelled us into the search for a solvent system that could be used in TLC during the
separation and analysis of these A-ring methylated aglycones.
1.6 Statement of the Problem
Thin Layer Chromatography is one of the analytical techniques which have been
employed in the separation and analysis of anthocyanins and anthocyanin aglycones,
when used with appropriate solvents. Several solvent systems have been used in the
separation of anthocyanins and anthocyanin aglycones so far reported depending on their
structures. However for the newly reported anthocyanin aglycones with methylated A-
rings, the available solvent systems have not succeeded in separating them on cellulose
thin layers.
1.7 The objective of the study
To develop solvent systems for separating novel anthocyanin aglycones from P.
auriculata which have been reported to have methylated A-rings on cellulose thin
layers.
1.8 Justification of the study
Anthocyanins have been found to have an array of health-promoting benefits to humans,
as they can protect against a variety of oxidants through a number of mechanisms (Kong
et al., 2003). They have also found wide use as food colorants primarily in the beverage
industry (Bridle & Timberlake, 1997).

8
To obtain anthocyanin pigments both quantitatively and qualitatively, analytical and
preparative separation methods are necessary. These methods aid in the purification,
separation and analysis of anthocyanin pigments and with out them, studying these
pigments for their reported benefits would be difficult.
Solvent systems on the other hand, play a significant role as mobile phases used in
chromatography to effect the separation and analysis of anthocyanin pigments. Therefore
to be able to exploit the benefits of anthocyanins and their aglycones respectively,
separation methods, which make these pigments available from their plant sources, are
required and so are the solvent systems that are used during separation and analysis.

9
CHAPTER 2: LITERATURE REVIEW
2.1 Basic Principles for Flavonoid Separation from Plant Materials
Analysis of medicinal plants is traditionally one of the oldest fields of application for
TLC and particularly their identification. Since the early 1960s, TLC has been used in
flavonoid analysis majorly for the preliminary screening of plant extracts before further
analysis (Marston and Hostettmann, 2006). This technique replaced Paper
chromatography (PC) which was the preferred method in the past as new stationary
phases such as microcrystalline cellulose, polyamide, and silica were developed
(Markham, 1982).
TLC analysis of flavonoids is performed mostly on silica gel as the stationary phase,
using adsorption chromatography as the mode of separation. However, different solvent
and sorbent type (cellulose, polyamide, or silica) combinations have also been
recommended previously, depending on the particular flavonoid group (Markham, 1982).
Flavonoid aglycones and glycosides separations listed in the TLC atlas of plant drug
analysis were performed on silica gel TLC plates, containing fluorescence indicator
(Wagner, and Bladt, 1996). Ethyl acetate–formic acid–glacial acetic acid– water
100:11:11:26, v/v/v/v or formic acid–water–ethyl acetate mixed in different proportions
(with or without ethyl methyl ketone) were found to be suitable mobile phases for the
TLC screening of polar flavonoid glycosides (Markham, 1982).
A good start for investigation of less polar flavonoid aglycones is a mobile phase
composed of toluene–ethyl formiate–formic acid 5:4:1, v/v/v or toluene–dioxin glacial

10
acetic acid 90:25:4, v/v/v (Wagner & Bladt, 1996). However, a combination of
hydrophobic organic solvents such as n-hexane or chloroform with more polar ones
(ethyl acetate or methanol), with addition of acetic or formic acid (e.g., n-hexane–ethyl
acetate–acetic acid 31:14:5, v/v/v or chloroform– methanol–formic acid, 44:3.5:2.5, v/v/v
was found to be a good alternative (Jasprica, 2004).
Several solvent systems have been developed and used as mobile phases in the analysis
of anthocyanin pigments on TLC. Cellulose MN 300 (Macherey, Nagel) was found to be
a very satisfactory layer in the separation of anthocyanin aglycones on a two dimensional
TLC (Nybom, 1964). The mobile phase mixture used in the first direction along the short
side of the cellulose thin layer coated plate was the formic acid- hydrochloric acid –
water 10:1:3, v/v/v mixtures. In the second direction of the plate, amyl alcohol –acetic
acid-water 2:1:1, v/v/v mixture was used as the mobile phase (Nybom, 1964).
Three solvents were also reported to be ideal mixtures for use as mobile phase systems in
the analysis of anthocyanins and their aglycones respectively. These systems include
butanol-2M hydrochloric acid 1:1, v/v with 10% ethyl acetate, butanol-2M hydrochloric
acid 1:1, v/v with 20% ethyl acetate and butanol acetic acid –water 4:1:5, v/v/v for
anthocyanins analysis whereas for anthocyanin aglycones analysis, the solvent mixtures
reported are, acetic acid –hydrochloric acid-water 10:1:3, v/v/v and acetic acid-water,
3:2, v/v (Paris, 1963).

11
2.2 Mobile phases or solvent systems used in TLC analyses
2.2.1 Selection of the Mobile Phase
The choice of the optimum mobile phase composition is often the most difficult and most
time consuming procedure involved in the development of a TLC analytical method.
Even though the mobile phase may be selected on a rational basis, in the end, the
composition of the optimum solvent mixture will always need to be confirmed by careful
experiment (Poole & Dias, 2000).
As a rule, the type of interactions that are chosen to dominate in the mobile phase (for
example dispersive, polar or ionic) are made complimentary to those that have been
chosen to control retention in the stationary phase. For instance, if dispersive interactions
are chosen to control retention in the stationary phase (for example a reversed phase),
then strong polar interactions might be chosen to dominate in the mobile phase, that’s to
say, the mobile phase could comprise a mixture of methanol/water or, perhaps, a mixture
of acetonitrile and water (Poole & Dias, 2000). On the other hand, if strong polar
interactions are selected to control retention (silica gel for example chosen as the
stationary phase) then a strong dispersive solvent mixture might be selected for the
mobile phase such as an alkane or an alkane/methylene dichloride mixture.
To increase the elution rate of the solutes, the complementary interactions in the
stationary phase must be reduced and those interactions that dominate in the mobile
phase must be increased. Considering a reversed phase separation for example and using
an alkane bonded phase as the stationary phase, to reduce retention and, consequently

12
elute solutes more rapidly, the quantity of methanol or acetonitrile in the mobile phase
would need to be increased relative to that of water (Poole & Dias, 2000). More solvent
in the aqueous mixture would enhance the dispersive interactions in the mobile phase and
would compete with the dispersive interactions between the solute and the alkane chains
of the stationary phase. Coincidentally, and as a secondary effect, it would also reduce
the polar interactions in the mobile phase as the quantity of water in the mobile phase
would also be reduced. The net result, however, would be that the interactive forces
between the solutes and the mobile phase would increase relative to interactive forces
with the stationary phase and, as a consequence, the retention time of the solutes would
be shortened. Although, the retention of all the solutes would be reduced, they would not
necessarily be reduced proportionally and so the selectivity of the phase system may also
be changed. Consequently, the resolution of some solutes may be improved, whereas the
resolution of other solutes may be reduced (Nyiredy, 1999).
2.2.2 Optimizing solvent systems for analysis of Anthocyanins/Aglycones on TLC
The development and selection of the right mobile phase is vital in obtaining well
separated components of anthocyanins and anthocyanin aglycones (Andersen & Francis,
1985). Several different combinations of solvents are tested while considering the nature
of the stationary phase being used, before one is found that will separate the compounds
of interest successfully (Tits et al., 1992). The general procedure may involve variation of
the polarity of the solvent in several trial runs, a process of trial and error where results of
the chromatography in each solvent system are carefully observed and recorded.

13
Many different solvent systems have been developed and employed for the separation of
flavonoids (Markham, 1975; Marston & Hostettmann, 2006). For instance, highly
methylated or acetylated flavones and flavanols require non polar solvent mixtures such
as chloroform and methanol 15:1, v/v. One system that is of widespread application for
analysis of anthocyanins is the solvent formic acid-hydrochloric acid- water (FHW)
(HCO2H – conc. HCl – H2O; 25:24:51, v/v/v, or 1:1:2, v/v/v (mobile phase)) (Andersen
& Francis, 1985). In the FHW solvent system (1:1:2, v/v/v), anthocyanins with similar
structure regarding sugars and acyl units are separated with respect to the number of
hydroxyl and methoxyl groups on the B ring of the aglycone. Increasing hydroxylation
and methoxylation, results in a decreasing retention factor (Rf) and the hydroxyl groups
have a greater impact than the methoxyl groups. The retention time will also increase
with increasing number of sugars and acyl groups in the anthocyanin structure (Andersen,
1988b).
2.2.3 The effect of methoxylation on the movement of aglycones on cellulose thin
layers
The polarity of anthocyanin aglycones is one of the factors affecting retention times.
Aglycones become more polar as the number of the hydroxyl groups in the B-ring
increases, thereby decreasing retention. As the number of methoxyl groups in the B- ring
increase, polarity decreases (Costa et al., 2000).
The commercial plastic sheet, pre-coated cellulose layers (0.1mm) employed in TLC are
such that the Cellulose organic material behaves as a support for other substances
carrying the interactive groups which establish the degree of retention and selectivity. In
14
this case aqueous solvents are absorbed in the cellulose, and the absorbed solvents
become sole agents that interact with the solutes and control retention as cellulose acts as
a support. However, the hydroxyl groups on cellulose certainly act as a source for polar
interactions with solutes (Schreiber, 1979) and thus play a significant role in the
movement of polar anthocyanin aglycones on TLC. Since the polarity of aglycones
increases with increasing hydroxyl groups and decreases with increasing methoxyl
groups on the B- ring (Costa et al., 2000), delphinidin being the most polar aglycone has
the minimum Rf value followed by cyanidin, petunidin, malvidin, peonidin, and
pelargonidin in that order for the six common aglycones (Escribano-Bailon et al., 2004).
2.3 A Review of the Chemistry and Sources of Anthocyanins and their aglycones
2.3.1 Chemistry of anthocyanins
Anthocyanins are a subgroup of the flavonoid family (Harborne, 1998). They are also
classified as phytochemicals, which are biologically active compounds found in plants.
Chemically, anthocyanins are subdivided into the sugar-free anthocyanidin termed as
aglycone, and the anthocyanin glycosides. Anthocyanins are thus aglycones modified by
the addition of sugars or acids and or both sugar and acids (Andersen and Jordheim,
2006). There are close to 25 different aglycones that have been identified in nature
whereas only 6 of them, cyanidin, delphinidin, petunidin, peonidin, pelargonidin, and
malvidin, are commonly found in nature (Figure 2.1).

15
Common naturally occurring anthocyanins are known to vary in; the number and position
of hydroxyl and methoxyl groups on the basic anthocyanidin or aglycone skeleton, the
identity, number, and positions at which sugars are attached, and the extent of sugar
acylation and the identity of the acylating agent (Andersen and Jordheim, 2006). Some
possible sugar substituents include glucose, galactose, rhamnose, xylose, arabinose, and
malose. The possible acid substituents may include malonic, caffeic, coumaric, malic and
ferulic acids (Andersen and Jordheim, 2006).
2.3.2 Natural anthocyanin aglycones with methylated A-rings
Six naturally occurring anthocyanins have been reported to occur in the sky-blue corollas
of P. auriculata (Skaar et al., 2012). All of these anthocyanins are based on three
anthocyanidins or anthocyanin aglycones; 5, 7-dimethyl delphinidin, 5, 7-dimethyl
petunidin, and 5, 7-dimethyl malvidin which are reported to have methylation of both of
their A-ring hydroxyl groups. Two different sugars; a galactopyranoside and a
rhamnopyranoside were found to be attached in the 3-position of these aglycones
16
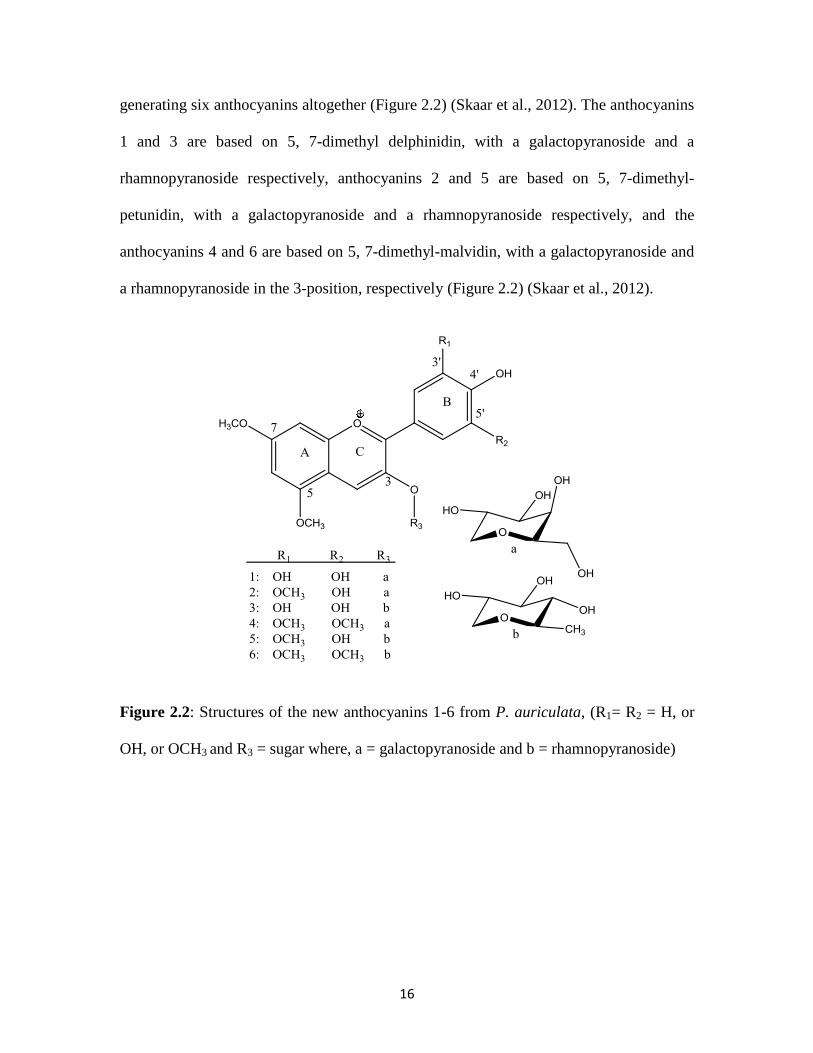
generating six anthocyanins altogether (Figure 2.2) (Skaar et al., 2012). The anthocyanins
1 and 3 are based on 5, 7-dimethyl delphinidin, with a galactopyranoside and a
rhamnopyranoside respectively, anthocyanins 2 and 5 are based on 5, 7-dimethyl-
petunidin, with a galactopyranoside and a rhamnopyranoside respectively, and the
anthocyanins 4 and 6 are based on 5, 7-dimethyl-malvidin, with a galactopyranoside and
a rhamnopyranoside in the 3-position, respectively (Figure 2.2) (Skaar et al., 2012).
Figure 2.2: Structures of the new anthocyanins 1-6 from P. auriculata, (R1= R2 = H, or
OH, or OCH3 and R3 = sugar where, a = galactopyranoside and b = rhamnopyranoside)

17
2.4 A review of the Analytical Methods for extraction, purification and isolation
of Anthocyanins
2.4.1 Extraction and purification
Anthocyanins are normally extracted from their plant sources using polar solvents such as
methanol which should be acidified with weak acids such as acetic acid, tartaric acid or
citric acid owing to the reduced stability of anthocyanins under neutral conditions
(Torskangerpoll, 2004). Small amounts of more volatile stronger acids such as
trifluoroacetic acid (TFA) 0.5-1% could also be used in the extraction process especially
for most complex polyacylated anthocyanins since such volatile acids could easily be
removed during pigment concentration (Marston & Hostettmann, 2006).
The Purification of the plant extracts follows a series of stages which may first involve
partition against another solvent such as ethyl acetate (Andersen and Francis, 2004) to
eliminate compounds such as Chlorophyll, carotenes, cytochromes, flavanols and other
unwanted polyphenols. To eliminate polar, nonphenolic compounds from anthocyanins,
Amberlite XAD-7 is used as column support where the sample may be loaded onto the
column, washed with distilled water and then eluted with acidified’ methanol ( Andersen,
1988a).
2.4.2 Isolation of anthocyanins
Several analytical methods have been employed in anthocyanins isolation which include;
the Sephadex LH-20 column Chromatography, the preparative High Performance Liquid
Chromatography (preparative HPLC), Counter Current Chromatography (CCC), and the
18
Droplet Counter Current Chromatography. These methods have been fully validated and
literature about them is well documented (Andersen &Francis, 2004; Marston &
Hostettmann, 1994; Markham, 1975 and Tanimura et al., 1970).
The Sephadex LH-20 column chromatographic technique is one method that has found
wide application in the isolation and fractionation of anthocyanin pigments. Sephadex
LH-20 material separates anthocyanins mainly on the basis of the size exclusion
principle, eluting pigments in order of decreasing molecule size. However, the pigments
may also be eluted according to other principles involving hydrogen bonding and
adsorption phenomena resulting from the interaction between solvent, solute and the
stationary phase. In this work, the Sephadex LH-20 column chromatography has been
used in purification of anthocyanins and their aglycones and to carry out fractionation
work.
2.5 Identification techniques for anthocyanins and anthocyanin aglycones
A number of analytical techniques have been employed in the identification of
anthocyanin pigments and their aglycones respectively. These include; Thin Layer
Chromatography (TLC), High performance Liquid chromatography (HPLC), Ultraviolet/
Visible spectroscopy (UV/VIS), Chemical degradation methods, Nuclear Magnetic
Resonance (NMR) and Mass spectrometry (MS). These methods are well documented in
literature (Andersen, 1988b; Schreiber, 1979; Markham, 1982; Giusti, et al., 1999;
Fossen, et al., 2003; Andersen & Fossen, 2003 and Braun et al., 1998). In this study
report, two methods; thin layer chromatography and chemical degradation were the

19
techniques used during the experimental process and thus have been reviewed briefly in
the subsequent sections.
2.5.1 Thin Layer Chromatography
Thin Layer Chromatography (TLC) is a sensitive, fast, simple and inexpensive analytical
technique used for separating dissolved compounds. TLC involves spotting the sample to
be analyzed near one end of a sheet of glass or plastic that is coated with a thin layer of
an adsorbent (Schreiber, 1979). The sheet, which can be the size of a microscope slide, is
placed one end in a covered jar containing a shallow layer of solvent. As the solvent rises
by capillary action up through the adsorbent, differential partitioning occurs between the
components of the mixture dissolved in the solvent and the stationary adsorbent phase
(Namiesnik & Górecki, 2000).
The differential movement of pigments is the result of each pigment having a
characteristic tendency to stick (be adsorbed) to the stationary phase. The pigment's
molecular size, polarity, and solubility determine the strength of this tendency. Pigments
adsorbed most strongly move slowly, whereas those weakly adsorbed move fastest. Thus
each pigment has a characteristic rate of movement, and the pigments can be separated
from each other (Ligor & Buszewski, 2001). The more strongly a given component of a
mixture is adsorbed onto the stationary phase, the less time it will spend in the mobile
phase and the more slowly it will migrate up the plate.
The relationship of the distance moved by a pigment to the distance moved by the solvent
front is specific for a given set of conditions and is usually expressed as the Rf value:

20
Thus, TLC technique can be used to identify each pigment by its characteristic RF. As the
RF value is constant for a given substance in a particular solvent-matrix system.
However to be able to determine whether an unknown substance is the same as a
substance of known structure, it is necessary to run the two substances side by side on the
same TLC plate using the same solvent-matrix system (Schreiber, 1979).
In calculating RF values, the distance the solvent travelled is measured from where the
compound was spotted on the plate to the solvent front recorded after plate elution was
finished, whereas the distance that the compound travelled is measured from where it was
spotted to where it ended up on the plate (Fried & Sherma, 1999). By definition, the RF
value is taken as the distance from the centre of the zone with the assumption that the
zone of the dye or component moved along the chromatography paper is a small,
compact disc-like structure. This is however prone to visual estimation errors, as in the
real world, the zones can be elongated (streak-like) and this brings the problem of where
one should take the measurement to calculate the Rf value - either taken from the top, or
the centre or the bottom of the zone.
In order to establish the center, it is suggested that the following two distances be
considered, that is to say; measurement from origin to the top edge of the zone and
measurement from origin to the bottom edge of the zone. The measurement of the central
part is then determined by average of the top and bottom edge distances, hence (Distance
top + Distance bottom / 2) (Figure 2.3).

21
Figure 2.3: Illustration on how to establish the center of the spot when calculating RF
values
However, in cases where shorter small, compact disc-like structure zones are obtained,
one can calculate the RF values by considering the center of the spot directly and with
clear demarcation of the point of origin of the spot though it’s prone to visualization
errors.
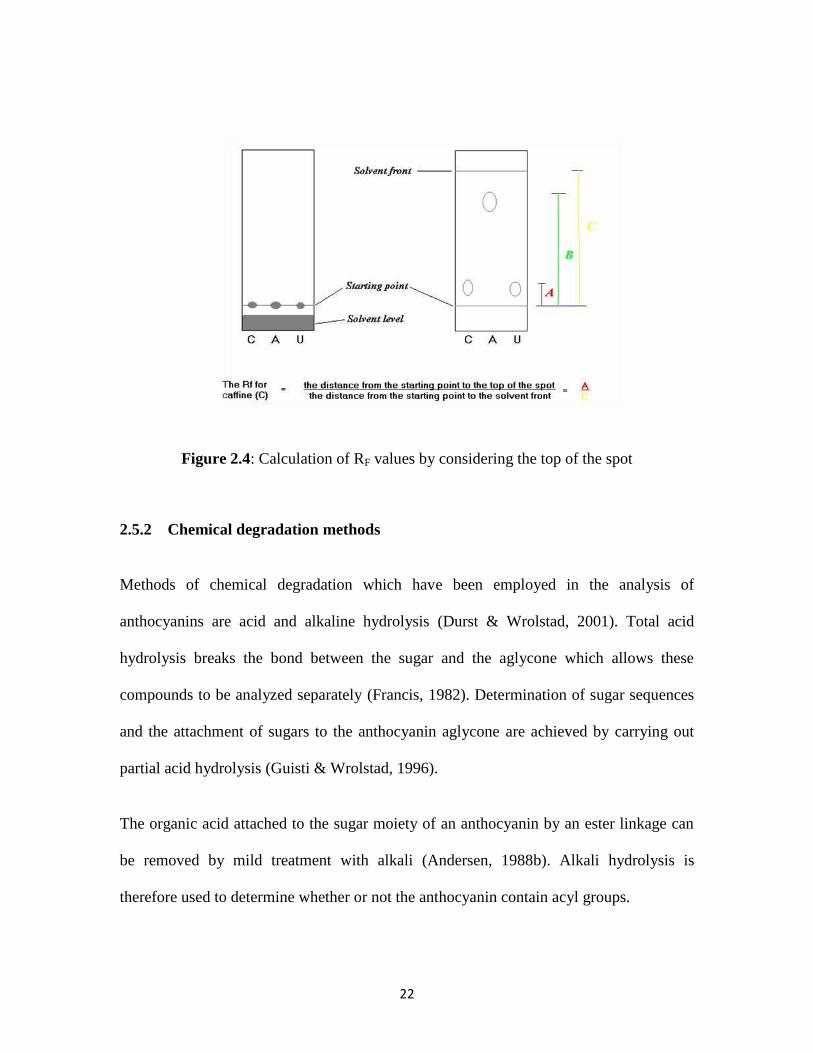
In this report, measurements of RF values were taken by considering the top of the spot as
illustrated in figure 2.4. This was majorly to ensure that consistent results be obtained as
the main objective was to establish the separating medium as opposed to obtaining RF
values for particular compound components.
22
Figure 2.4: Calculation of RF values by considering the top of the spot
2.5.2 Chemical degradation methods
Methods of chemical degradation which have been employed in the analysis of
anthocyanins are acid and alkaline hydrolysis (Durst & Wrolstad, 2001). Total acid
hydrolysis breaks the bond between the sugar and the aglycone which allows these
compounds to be analyzed separately (Francis, 1982). Determination of sugar sequences
and the attachment of sugars to the anthocyanin aglycone are achieved by carrying out
partial acid hydrolysis (Guisti & Wrolstad, 1996).
The organic acid attached to the sugar moiety of an anthocyanin by an ester linkage can
be removed by mild treatment with alkali (Andersen, 1988b). Alkali hydrolysis is
therefore used to determine whether or not the anthocyanin contain acyl groups.

23
CHAPTER 3: MATERIALS AND METHODS
3.1 Sample Collection
Bluish flowers of P. auriculata were collected from along the northern way bypass
connecting to Masanafu trading centre in Kampala district Uganda and were taken for
identification at the herbarium of Botany department, Makerere University. The black
beans from which the aglycones; delphinidin, petunidin and malvidin were obtained
(Takeoka et al., 1997) were got from Chemistry Department, University of Bergen,
Norway. The Ornamental flowers of Hippeastrum cultivar (H. hybridum) containing the
aglycones; cyanidin and pelargonidin (Byamukama et al., 2006), were obtained from the
flower garden around Mathematics Department of Makerere University, and were taken
for identification at the herbarium of Botany Department, Makerere University. The fruits
of Leea guineensis from which the peonidin aglycone was extracted (Namukobe, 2005),
were got from the herbarium of Botany Department, Makerere University. The flowers
and fruits of all plant materials collected, were weighed and stored in a deep freezer at the
Department of Chemistry, Makerere University in the organic research laboratory.
3.2 Extraction and purification
The plant materials; Plumbago auriculata flowers (92g), hippeastrum (H. hybridum)
cultivar flowers (50g), black beans (70g) and the fruits of Leea guineensis (80g) were
each placed in a separate flask and soaked in methanol (200ml) containing 0.5%
trifluoroacetic acid (TFA). The flasks were covered using parafilm and were left in a
deep freezer for 24 hours. The extracts of each plant were filtered through a filter funnel
containing cotton wool which removed solid particles. The filtrate for each plant material

24
was then concentrated under reduced pressure using a rotary vapor at 330
C after which
they were partially purified by partitioning against ethyl acetate to remove compounds
such as; chlorophylls, carotenes, cytochromes, flavanols and other unwanted
polyphenols. The lower aqueous layer containing the anthocyanins was collected off and
concentrated under reduced pressure using a rotary vapor at 330
C.
The concentrated partially purified extracts of each plant material were then loaded on
the Amberlite XAD-7 column chromatography carefully. The sample extracts were first
washed with distilled water until the eluent was neutral and then eluted with methanol
containing 1.0% TFA which allowed the sample extracts to run through Amberlite XAD-
7 column material. The collected eluent for the extracts of each individual plant material
were concentrated under reduced pressure using a rotary vapor at 330
C.
Further purification and fractionation was done by using the Sephadex LH-20 column
chromatography. The sample extracts from the Amberlite XAD-7 column were loaded on
to the Sephadex LH-20 column and allowed to run through the ion exchange resin with
20% aqueous methanol containing 0.5% TFA. Different fractions were collected in
volumes of 15-20 ml of the eluent, that’s to say for extracts of Plumbago auriculata (50
fractions), Black beans (20 fractions), Hippeastrum cultivar (H. hybridum) flowers (21
fractions), and 24 fractions for extracts from fruits of Leea guineensis. Preliminary TLC
was carried out on the fractions of the same extract to identify fractions containing
similar compounds which were then combined.

25
3.3 Acid hydrolysis of Anthocyanins
To obtain anthocyanin aglycones, total acid hydrolysis was carried out as follows: To the
anthocyanin sample extract (2ml) was added Hydrochloric acid (2M, 10ml) in a sample
bottle as described by Hong and Wrolstad (1986). The mixture was put in an oven at
120OC and heated for 1 hour. After cooling, sugars and aglycones were separated by
solvent extraction using 1 –pentanol (Hong & Wrolstad, 1986). Two layers were formed,
the upper organic layer containing the aglycones and the lower aqueous layer containing
sugars. The two layers were separated by a separating funnel. The upper layer containing
aglycones was concentrated to get rid of the solvent (pentan-1-ol). The same procedure
for hydrolysis above was carried out on all anthocyanins isolated from; flowers of
Hippeastrum cultivar (H. hybridum), Black beans and the fruits of Leea guineensis to
obtain the respective aglycones.
3.4 The basis for developing a solvent system(s) for TLC analysis of anthocyanin
aglycones from P. auriculata
Commercial plastic sheets, 0.1mm pre-coated cellulose layers (Art. 5565, Merck,
Darmstadt) were used to carry out all the TLC and the mobile phase mixtures were
prepared from analytical grades of formic acid, hydrochloric acid and with distilled
water. The solvent systems or mixtures were generated by varying the ratios of the
volumes of formic acid, hydrochloric acid, and distilled water. The major factor
considered in the variation process was the polarity of the F:H:W solvent mixture which
was varied by either increasing or decreasing the volume of one component at a time
while keeping others constant with in the solvent mixture.

26
Several various solvent compositions were generated and used with variations based on
the system mixture of formic acid, hydrochloric acid and water in the volume ratio;
10:1:3, v/v/v respectively, which is the mobile phase used in the separation of
anthocyanin aglycones which methylated B-rings on cellulose thin layers (Andersen &
Francis, 1985).
The solvent mixtures of formic acid, hydrochloric acid and water (F: H: W, v/v/v) in the
volume ratios; A (2:1:3), B (3:1:3), C (4:1:3), D (5:1:3), E (6:1:3), F (7:1:3), G (8:1:3), H
(9:1:3), I (10:1:3), and J (11:1:3) were generated by varying the ratio of the volume of
formic acid alone, keeping that of hydrochloric acid and water constant. Solvent
systems; K (10:0.125:3), L (10:0.25:3), M (10:0.5:3), N (10:1:3), O (10:1.5:3), P
(10:2:3), Q (10:2.5:3), R (10:3:3), S (10:3.5:3), and T (10:4:3), were generated by
varying the ratio of the volume of hydrochloric acid alone, keeping that of formic acid
and water constant, whereas in generating the solvent systems; U (10:1:0.5), V (10:1:1),
W (10:1:2), X (10:1:3), Y (10:1:4), and Z (10:1:5), the ratio of the volume of water alone
was varied with in the formic acid-hydrochloric acid-water mixture.
All variations above were geared at varying the polarity of the mobile phase which in
turn interferes with the interactions between the compound to be separated and the
mobile phase as well as the solid support cellulose coated layer and effect the separation
process. Developing tanks of size 12cm x 4cm x 12cm were lined with heavy-grade filter
paper and allowed to equilibrate overnight before use. The anthocyanin aglycones were
applied to the TLC plates coated with a thin layer of cellulose by spotting with small
capillary tubes and the plates were developed to a distance of 8.0 cm.
27
CHAPTER 4: RESULTS AND DISCUSSION
The acidified methanolic extracts of flowers of P.auriculata, Black beans, fruits of Leea
guineensis and that from flowers of Hippeastrum Cultivars (H. Hybridum), were purified
by partitioning against ethyl acetate followed by Amberlite XAD-7 column
chromatography. Further purification and fractionation of the extracts was achieved by
using Sephadex LH-20 column chromatography followed by total acid hydrolysis which
was performed on the purified fractions from Sephadex LH-20 column to obtain the
individual aglycones.
4.1 TLC analysis of anthocyanin aglycones
Aglycones with methylated A-rings; 5,7-dimethyl delphinidin, 5,7-dimethyl petunidin
and 5,7-dimethyl malvidin from flowers of P. auriculata were spotted together with the
common aglycones; delphinidin (Dp), cyanidin (Cy), petunidin (Pt), malvidin (Mv),
peonidin (Pn) and pelargonidin (Pg) on TLC plate coated with a thin layer of cellulose.
Plate development was first performed by using the solvent system or mixture of formic
acid, hydrochloric acid and water in the volume ratio; 10:1:3, v/v/v, which system was
developed for separation of B-ring methylated anthocyanin aglycones (Andersen &
Francis, 1985). Results indicated that solvent system 10:1:3, v/v/v could separate
common aglycones; Dp, Cy, Pt, Mv, and Pn & Pg but could not effectively separate
anthocyanin aglycones from P. auriculata as there was no clear separation observed
(Figure 4.1).

28
Figure 4.1: TLC plate developed by using the solvent mixture F: H: W in the ratio, 10:1:3, v/v/v
Plant sources; B
black beans aglycones; L
Aglycone from the fruits of Leea guineensis; H
aglycones from
flowers of Hippeastrum hybridum cultivars; P
aglycones from flowers of P. auriculata.
Owing to inability of the F: H: W solvent mixture in the volume ratio, 10:1:3, v/v/v to
separate A- ring methylated aglycones, the polarity of this system was varied by varying
the individual volume ratios of formic acid –hydrochloric acid and water so as to
establish a better solvent ratio which could give a better separation for A-ring methylated
aglycones. The F:H:W solvent mixtures in the volume ratios; A (2:1:3), B (3:1:3), C
(4:1:3), D (5:1:3), E (6:1:3), F (7:1:3), G (8:1:3), H (9:1:3), I (10:1:3), and J(11:1:3) were
generated by varying the ratio of the volume of formic acid while keeping that of
hydrochloric acid and water constant. Solvent systems; K (10:0.125:3), L (10:0.25:3), M
(10:0.5:3), N (10:1:3), O (10:1.5:3), P (10:2:3), Q (10:2.5:3), R (10:3:3), S (10:3.5:3),
and T(10:4:3), were generated by varying the ratio of the volume of hydrochloric acid
keeping that of formic acid and water constant. Whereas solvent systems; U (10:1:0.5), V
(10:1:1), W (10:1:2), X (10:1:3), Y (10:1:4), and Z (10:1:5) were generated by varying
the ratio of the volume of water alone with in the F: H: W, v/v/v mixture.

29
The solvent systems generated by varying the volume ratio of hydrochloric acid alone
with in the F: H: W, v/v/v solvent mixture did not succeed in separating anthocyanin
aglycones. These solvent systems which included; K (10:0.125:3), L (10:0.25:3), M
(10:0.5:3), N(10:1:3), O (10:1.5:3), P (10:2:3), Q (10:2.5:3), R(10:3:3), S (10:3.5:3), and
T(10:4:3) were discarded subject to no further discussion. The solvent systems; U
(10:1:0.5), V (10:1:1), W (10:1:2), X (10:1:3), Y (10:1:4), and Z (10:1:5) generated by
varying the ratio of the volume of water alone, were also discarded as they could not
effect any separation of the aglycones when used as mobile phases during TLC plate
development. Among solvent systems generated by varying the volume ratio of formic
acid, systems, A (2:1:3), and B (3:1:3) could not separate anthocyanin aglycones during
plate development and were discarded.
Solvent systems; C (4:1:3), D (5:1:3), E (6:1:3), F (7:1:3), G (8:1:3), H (9:1:3), I (10:1:3),
and J (11:1:3) gave results on plate development and the results obtained by using these
systems are discussed. Only six defined spots out of the expected nine (for nine
individual compounds) were observed for system C (4:1:3) and these indicated the
common six anthocyanin aglycones whose Rf values were calculated to be well below
0.32 (Table 4.1). Anthocyanin aglycones from the flowers of P. auriculata could not be
separated by system C (4:1:3) as a shift of compounds from the spotting point upwards
on the plate rather than their separation was observed. This led to the rejection of the
system. With solvent systems; D (5:1:3), E (6:1:3), F (7:1:3), G (8:1:3), and H (9:1:3),
nine well defined spots were observed on the developing TLC plate corresponding to
nine aglycones altogether. Six of the spots reflected the six common anthocyanin

30
aglycones; delphinidin (Dp), cyanidin (Cy), petunidin (Pt), malvidin (Mv), peonidin (Pn)
& pelargonidin (Pg) while the remaining three spots reflected anthocyanin aglycones; 5,7
dimethyl delphinidin, 5,7- dimethyl petunidin and 5,7-dimethyl malvidin from P.
auriculata (Table 4.1).
Table 4.1: Rf Values for anthocyanin aglycones obtained by using various solvent
mixtures of formic acid, hydrochloric acid and water (F:H:W, v/v/v) in different volume
ratios as developing solvents.
b Black beans aglycones.
h Aglycones from flowers of Hippeastrum hybridum cultivars.
l Aglycones from the fruits of Leea guineensis.
p Aglycones from flowers of P. auriculata.
solvent systems of various volume ratios of F:H:W C-J; C(4:1:3), D(5:1:3), E(6:1:3), F(7:1:3), G(8:1:3), H(9:1:3),
I(10:1:3), and J(11:1:3)
The number of spots observed for systems I (10:1:3) and J (11:1:3) were less than those
observed for systems D through H. These two systems, I (10:1:3) and J (11:1:3)
succeeded in separating anthocyanin aglycones with methylated B- rings which are the
common aglycones, Dp, Cy, Pt, Mv, Pn, and Pg. The results of system I (10:1:3) (Table
4.1) were in agreement with those earlier reported when this system was developed and
used for separation of aglycones with methylated B-rings on cellulose thin layers
(Andersen and Francis, 1985). This leaves system 10:1:3, v/v/v for F:H:W solvent
Aglycones (sources)
Solvent composition (systems C-J)
C D E F G H I J
Dp (b)
0.11 0.13 0.14 0.17 0.20 0.22 0.22 0.19
Pt (b)
0.16 0.19 0.21 0.25 0.27 0.31 0.31 0.36
Cy (h)
0.18 0.21 0.25 0.27 0.28 0.31 0.33 0.36
Mv (b)
0.23 0.23 0.32 0.37 0.39 0.44 0.46 0.50
Pn (l)
0.26 0.28 0.36 0.38 0.41 0.44 0.49 0.52
Pg (h)
0.31 0.35 0.39 0.41 0.44 0.47 0.50 0.52
5,7 dimethyl – Dp (p) - 0.32 0.34 0.40 0.40 0.48 - -
5,7 dimethyl – Pt (p) - 0.40 0.46 0.51 0.49 0.59 - -
5,7 dimethyl- Mv (p) - 0.53 0.61 0.63 0.61 0.71 - -

31
mixture substantial for separation of B-ring methylated aglycones. The two systems, I
(10:1:3) and J (11:1:3), however failed to separate A-ring methylated aglycones 5, 7-
dimethyl Dp, 5, 7-dimethyl Pt and 5, 7- dimethyl malvidin from flowers of P. auriculata
effectively following an observed shift of the compound on TLC plate as a whole from a
distance of 4.0 cm from the spotting point to a distance of 6.0 cm with no clear spot
separation. Therefore, solvent systems, I (10:1:3) and J (11:1:3) were considered
unsuitable as mobile phase systems for separation of A- ring methylated aglycones on
cellulose thin layers.
The rejection of systems C (4:1:3), I (10:1:3) and J(11:1:3) owing to their observed
drawbacks left systems; D (5:1:3), E (6:1:3), F (7:1:3), G (8:1:3), and H (9:1:3) from
among which the best developing solvent system(s) could be selected for use in the
separation of anthocyanin aglycones including the A- ring methylated ones.
4.2 Choosing the Best Solvent System (s) from solvent systems D to H
The basis for selecting a solvent system (s) which give the best separation was by
considering the intervals between each of the Rf values for all aglycones ranging from
Dp, Pt, Cy, Mv, Pn, Pg and then those from P. auriculata; 5, 7- dimethyl delphinidin,
5,7- dimethyl petunidin and 5,7- dimethyl malvidin for solvent systems D to H (Table
4.2). An increase in interval was an indication of a better separation. The system(s) with
greater interval(s) was taken to be the best.
Depending on calculated intervals, the order of separation of aglycones by solvent
systems was; system G (8:1:3) > system F (7:1:3) > system E (6:1:3) > system D (5:1:3)

32
> system H (9:1:3) (Table 4.2). Systems; G (8:1:3), F (7:1:3), and E (6:1:3) gave good Rf
values with high intervals compared to other systems and these can be adopted for use in
the separation of aglycones regardless of their methylation i.e. whether they are non
methylated or methylated in their A and B rings.
Table 4.2: Rf values for aglycones in solvent systems, D-H with their respective
calculated intervals between the spots on cellulose thin layers. Increased intervals depict
a better separation.
FHW Solvent systems D-H and their Rf values
System D (5:1:3) System E (6:1:3) System F(7:1:3) System G (8:1:3) System H (9:1:3)
Aglycone
(sources)
Rf interval Rf interval Rf interval Rf interval Rf interval
Dp(b) 0.13 0.14 0.17 0.20 0.22
0.0.6 0.07 0.08 0.07 0.09
Pt(b) 0.19 0.21 0.25 0.27 0.31
0.02 0.04 0.02 0.01 0.00
Cy(h) 0.21 0.25 0.27 0.28 0.31
0.02 0.07 0.10 0.11 0.13
Mv(b) 0.23 0.32 0.37 0.39 0.44
0.05 0.04 0.01 0.02 0.00
Pn(l) 0.28 0.36 0.38 0.41 0.44
0.07 0.03 0.03 0.03 0.03
Pg(h) 0.35 0.39 0.41 0.44 0.47
0.03 0.05 0.01 0.04 0.01
5,7-dim-
Dp(p)
0.32 0.34 0.40 0.40 0.48
0.08 0.12 0.11 0.09 0.11
5,7-dim-
Pt(p)
0.40 0.46 0.51 0.49 0.59
0.13 0.15 0.12 0.12 0.12
5,7-dim-
Mv(p)
0.53 0.61 0.63 0.61 0.71
b Black beans aglycones,
h Aglycones from flowers of Hippeastrum hybridum cultivars,
l Aglycone from the
fruits of Leea guineensis, p Aglycones from flowers of P. auriculata.
The Rf values for aglycones from P auriculata; 5, 7- dimethyl delphinidin, 5, 7- dimethyl
petunidin, and 5, 7- dimethyl malvidin (Table 4.1) are higher than those of comparable
common aglycones; Dp, Pt and Mv which differ only by the difference in the A-ring
substitution pattern where the latter aglycones are A-ring hydroxylated whereas the
former aglycones are A –ring methoxylated (Skaar et al., 2012; Takeoka et al., 1997).

33
This is attributed to the presence of methoxyl groups on the A- ring of aglycones from P
auriculata which tend to decrease the polarity of the compounds and consequently
increase the movement of these compounds on TLC as they tend to interact more with the
mobile phase (Andersen, 1988b).
4.3 Separation of novel anthocyanins from P. auriculata on cellulose thin layers
The solvent system 1:1:2 , v/v/v for formic acid- hydrochloric acid and water developed
for separation anthocyanins (Andersen & Francis , 1985), was investigated to find out if
it would separate well novel anthocyanins from P .auriculata with A- ring methylation as
it does for the B-ring methylated anthocyanins. The results obtained showed that system
1:1:2, v/v/v was successful in separating novel anthocyanins from P. auriculata.
However, with the glycosides of 5, 7- dimethyl malvidin being the major pigment found
in the flowers of P. auriculata (Skaar et al., 2012), careful observation was needed to be
able to clearly distinguish the spots of minor glycosides; 5, 7- dimethyl delphinidin and 5,
7- dimethyl petunidin with out which one could easily conclude that there was no
separation which was not the case.
Three defined spots were observed for anthocyanins from P. auriculata. Since it was
reported that the three aglycones have two different sugars (galactopyranoside and
rhamnopyranoside) attached on the aglycones independently generating six anthocyanins
all together (Skaar et al., 2012), it was expected that six spots for six anthocyanins would
be observed on the cellulose thin layer spot but this was not the case. Either the two
sugars; galactopyranoside and rhamnopyranoside attached in the 3-position of the three
aglycones (Figure 4.2) generating six glycosides all together were very close to each

34
other for the same aglycone and could not easily be identified or they had minimal impact
on the movement of the anthocyanins on the TLC plate.
Separation of anthocyanins from flowers P. auriculata was also performed using
developing solvent systems or mixtures of formic acid –hydrochloric acid – water, in
volume ratio; (2:1:2), (3:1:2), (4:1:2) and (5:1:2), on cellulose thin layer plates in the
search for a better system which could separate novel anthocyanins from P.auriculata.
Rf values obtained by using solvent system 2:1:2, v/v/v for anthocyanins from
P.auriculata were better than those by system 1:1:2, v/v/v as more clear distinguished
spots were observed though their number of spots remained the same as obtained for
system 1:1:2, v/v/v (Figure 4.2). It was observed that system 1:1:2, v/v/v still showed
better results for anthocyanin glycosides of delphinidin, cyanidin, petunidin, malvidin,
peonidin and pelargonidin. Systems; (3:1:2), (4:1:2) and (5:1:2) were discarded as a shift
rather than separation of anthocyanins was observed as the composition ratio of formic
acid was being increased.
In view of the above findings, solvent system in the volume ratio of 1:1:2, v/v/v for
formic acid- hydrochloric acid – water mixture, earlier developed for separating
anthocyanins whose methylation occurs only on their B-rings (Andersen & Francis,
1985); can also be adopted for separation of anthocyanins whose methylation occurs on
their A –rings. However, system 2:1:2, v/v/v proved to be ideal for separation of
anthocyanins especially those which are A-ring methylated and thus in cases of
anthocyanin compounds with this kind of methylation, system 2:1:2, v/v/v can be
adopted.

35
Figure 4.2: Cellulose thin layer plates showing anthocyanin separation using solvent systems or mixtures
of formic acid-hydrochloric acid-water in the ratio; 1:1:2 and 2:1:2, v/v/v b Black beans glycosides of
Dp delphinidin,
Pt petunidin, and
Mv Malvidin.
h Glycosides of
Cy Cyanidin, &
Pg Pelargonidin from flowers of Hippeastrum hybridum cultivars;
l Anthocyanin glycoside of
Pn Peonidin from the fruits of Leea guineensis;
p Glycosides of 5,7-dimethyl-Dp, 5,7-dimethyl-Pt and 5,7-dimethyl-Mv from flowers of P. auriculata

36
CHAPTER 5: CONCLUSION AND RECOMMENDATIONS
5.1 Conclusion
By varying the polarity of the solvent mixture of formic acid, hydrochloric acid and
water, starting with volume ratio; 10:1:3, v/v/v (F: H: W respectively) developed for
separation of B-ring methylated aglycones on cellulose thin layers, and specifically
through variation of the volume of formic acid with in the formic acid –hydrochloric
acid- water mixture, three solvent systems were found to be effective in separating novel
aglycones with methylated A- rings from P. auriculata. These systems are in the ratios,
8:1:3, v/v/v, 7:1:3, v/v/v and 6:1:3, v/v/v for formic acid- hydrochloric acid (2M) –water
mixture.
The interesting part with the reported systems above is their capability to separate the six
common aglycones; Dp, Pt, Cy, Mv, Pn and Pg in addition to the separation of novel
aglycones 5, 7-dimethyl delphinidin, 5, 7-dimethyl petunidin, and 5, 7-dimethyl malvidin
from P. auriculata.
Methoxylation on the A-ring of novel anthocyanin aglycones significantly affects the
chemistry of the compound in the same way B-ring methoxylation does. It was observed
during the experimentation that the A-ring methylated aglycones moved higher than
those of comparable structures; Dp, Pt, and Mv on the same TLC plate a condition
attributed to the presence of methoxyl groups on the A- rings of novel aglycones from P.
auriculata: 5, 7-dimethyl delphinidin; 5, 7-dimethyl petunidin and 5, 7-dimethyl malvidin
which renders these compounds less polar compared to common aglycones

37
5.2 Recommendation
This study majorly focused on establishing solvent systems for separating A – ring
methylated aglycones as well as the effect of methoxylation on the A – ring of aglycones.
However in establishing the solvent systems, only a mixture of formic acid- hydrochloric
acid and water was considered which may not be the only mixture or system for
achieving such separation, other solvents depending on their polarities could be tried out
to establish whether they give any better separation.
The separation of anthocyanin pigments prior to hydrolysis to aglycones presented
difficulties especially with TLC due to the structural formation of these pigments. The
solvent mixture of formic acid- hydrochloric acid and water in the volume ratio; 1:1:2
and 2:1:3, v/v/v could not give clear separations on TLC for A- ring methylated
anthocyanins. The implication of this is that using these systems may not give good TLC
preliminary results, especially on the number of components with in the anthocyanin
extract with anticipated A- ring methoxylation. It’s there fore important that an
alternative system or systems be established to effect such a separation or other wise.

38
REFERENCES
Andersen, Ø. M. (1988a). Semipreparative isolation and structure determination of
pelargonidin 3-O-α-Lrhamnopyranosyl-(1→2)-β-D-glucopyranoside and other
anthocyanins from the tree Dacrycarpus dacrydioides. Acta Chem. Scand. Series
B: Org. Chem. Biochem. 42, pp 462–468.
Andersen, Ø. M. (1988b). Chemical studies of anthocyanins in plants: isolation,
qualitative, quantitative determination, PhD Thesis, University of Bergen, pp11-
20.
Andersen, Ø. M. and Francis G. W. (2004). Techniques of pigment identification. In:
Plant pigments and their manipulation. Davies, K. (ed), Blackwell Publishing,
London. Chapter 10.
Andersen, Ø. M. and Francis G. W. (1985). Simultaneous analysis of anthocyanins and
anthocyanidins on cellulose thin layers. J. Chromatogr., 318, pp 450-454.
Andersen, Ø. M. and Fossen, T. (2003). Characterization of anthocyanins by NMR, Unit
F.1.4. In: Current Protocols in Analytical Chemistry, Wrolstad, R., Ed., John
Wiley: New York, pp 1– 24.
Andersen, Ø. M. and Jordheim, M. (2006). The Anthocyanins. In: Flavonoids;
Chemistry, Biochemistry and Applications, Andersen, Ø.M., Markham, K.R.
(Eds.), CRC Press Boca Raton, pp 471–553.
Andersen, Ø. M., Helland, D. E., Andersen, K. J. (1997). Anthocyanidin and
anthocyanidin derivatives, and their isolation, for treatment of cancer, diseases
caused by lesions in connective tissues, and diseases caused by viruses. PCT Int.
Appl.; pp 121

39
Byamukama, R., Jordheim M., Kiremire, B., Namukobe, J., Andersen Ø. M. (2006).
Anthocyanins from flowers of Hippeastrum cultivars. Scientia Horticulturae, 109,
pp 262-266.
Braun, S., Kalinowski, H. O. and Berger, S. (1998). 150 and more basic NMR
experiments. A practical course. Wiley-VCH, Weinheim, Germany, pp 501-504.
Bridle, P. and Timberlake, C. F. (1997). Anthocyanins as natural food colours-selected
aspects. Food Chem. 58, pp 103–109.
Brouillard, R. and Dangles, O. (1994). Flavonoids and Flower Color. In The Flavonoids:
Advances in Research since (1986), Harborne, J. B., Ed., Chapman & Hall:
London, pp 565–588.
Cabrita, L. (1999). Analysis and Stability of Anthocyanins. Ph.D. thesis, Dept. of
Chemistry, University of Bergen, Bergen, Norway.
Cheminat, A. and Brouillard, R. (1986). PMR investigation of 3-O-(β-D-glucosyl)
malvidin structural transformation in aqueous solutions. Tetrahedron Lett. 27, pp
4457–4460.
Costa, C. T., Horton, D., Margolis, S. A. (2000). Analysis of anthocyanins in foods by
liquid chromatography, liquid chromatography-mass spectrometry and capillary
electrophoresis. J. Chromatogr., 881, pp 403-410.
Durst, R. W., Wrolstad, R. E. (2001). Separation and characterization of anthocyanins by
HPLC. In: Current Protocols in Food Analytical Chemistry. Wrolstad, R. E., (Ed),
John Wiley & Sons: New York, units F1.3.1-F1.3.13.
Escribano-Bailon M.T, Santos-Buelga C, and Rivas-Gonzalo J.C. (2004). Anthocyanins
in cereals. J. Chromatogr. A., 1054, pp 129-141.
Fried, B. and Sherma, J. (1999). Thin-layer chromatography, fourth edition, Revised and
expanded, Marcel Dekker inc., New York - Basel, pp, 499, ISBN 0-8247-0222-0.

40
Fossen, T.; Cabrita, L.; Andersen, Ø. M. (1998). Color and stability of pure anthocyanins
influenced by pH including the alkaline region. Food Chem. 63, pp 435–440.
Fossen, T.; Slimestad, R.; Andersen, Ø. M. (2003). Anthocyanins with 4'-glucosidation
from red onion, Allium cepa. Phytochemistry, 64, pp 1367–1374.
Francis, F. J., (1982). Analysis of anthocyanins. In: Anthocyanins as Food Colors.
Markakis, P., (Ed), Academic Press: New York, pp 181.
Giusti, M, M, Rodriguez-Soana, L. E. and Wrolstad, R.E. (1999). Molar absorptivity and
color characteristics of acylated and non acylated pelargonidin – based
anthocyanins. J. Agric. Food Chem., 47, pp 4631-4637.
Guisti, M. M. and Wrolstad, R. E. (1996). Characterization of red radish anthocyanins. J.
Food Sci. 61, pp 322-326.
Goto, T., Kondo, T., Kawai, T., Tamura, H. (1984). Structure of cinerarin, a tetra-
acylated anthocyanin isolated from the blue garden cineraria, Senecio cruentus.
Tetrahedron Lett. 25, pp 6021–6024.
Harborne J.B. (1998). Phenolic compounds. In: Phytochemical Methods—A Guide to
Modern Techniques of Plant Analysis, J. B Harborne (Ed), New York: Chapman
& Hall, 3rd
edition, pp 66–74.
Harborne, J. B. and Williams, C. A. (1995). Anthocyanins and other flavonoids, Nat.
Prod. Rep. 12, pp 639–657.
Hong, V., and Wrolstad, R.E. (1986). Fruit and hit products. J. Assoc. Anal Chem.
69(2), pp 199-207.
Iacobucci, G. A. and Sweeny, J. G. (1983).The chemistry of anthocyanins,
anthocyanidins and related flavylium salts. Tetrahedron 39, pp 3005–3038.

41
Jackman, R. L., Yda, R. Y., Tung, M. A., Speers, R. A. (1987). Anthocyanins as food
colorants – a review. J. Food Biochem. 11, pp 201–247.
Jasprica, I. (2004). Investigation of the flavonoids in Croatian propolis by thin-layer
chromatography, J. Planar Chromatogr., 17, pp 95.
Jordheim, M., Fossen, T., Andersen, Ø. M. (2006). Characterization of hemiacetal forms
of anthocyanidin 3-O-β-glycopyranosides. J. Agric. Food Chem. 54, pp 9340–
9346.
Jork, H., Funk, W., Fischer, W., and Wimmer, H. (1994). Thin-Layer Chromatography:
Reagents and Detection Methods, 2nd ed., VCH Verlagsgesellschaft, Weinheim,
Germany, pp 496
Kong, J. M., Chia, L. S., Goh, N. K., Chia, T. F., & Brouillard, R. (2003). Analysis and
biological activities of anthocyanins. Phytochemistry, 64(5), pp 923-933.
Ligor, M. and Buszewski, B. (2001). Application of TLC and OPLC in the determination
of pigments from natural products, J. Planar Chromatogr.14, pp 334.
Markham, K.R. (1982).Techniques of Flavonoid Identification, Academic Press, London,
pp 1-49 and 72-99
Markham, K.R. (1975). Isolation Techniques for Flavonoids. In: The Flavonoids;
Advances in Research, Harborne, J.B., Mabry, T.J., and Mabry, H. (Eds.),
Chapman and Hall, London, pp 1–44.
Marston, A and Hostettmann, K. (2006). Separation and Quantification of Flavonoids.
In: Flavonoids; Chemistry, Biochemistry and Applications, Andersen, Ø.M.,
Markham, K.R. (Eds.), CRC Press Boca Raton, pp 9-11.
Marston, A. and Hostettmann, K. (1994). Counter current Chromatography as a
preparative tool- applications and perspectives. J. Chromatogr. A, 658, pp 315-
341

42
McClelland, R. A., Gedge, S. (1980). Hydration of flavylium ion. J. Am. Chem. Soc.
102, pp 5838–5848.
Mistry, T. V., Cai, Y., Lilley, T. H., Haslam, E. (1991). Polyphenol interactions. Part 5.
Anthocyanin copigmentation. J. Chem. Soc. Perkin Trans. 2. Pp 1287–1296.
Namiesnik, J. and Górecki, T. (2000). Sample preparation for chromatographic analysis
of plant material, J. Planar Chromatogr., 13, pp 404.
Namukobe, J. (2005). Analysis of anthocynanins from fruits of Leea guineens and
flowers of Acanthus pubescences. Theses & Dissertations (Science) Makerere
University repository, URL: http://hdl.handle.net/123456789/310
Nybom, N. (1964). Thin-layer chromatographic analyses of anthocyanidins. Physiol.
Plant 17, pp 157–164.
Nyiredy, S. (1999). Transfer possibilities of the mobile phases between different liquid
chromatographic techniques for the analysis and isolation of compounds of
biological matrices. Acta Pharm Hung, 69(1), pp 46-56.
Paris, R.R and Paris, M. (1963). Natural pigments. In: Thin layer chromatography:
Techniques of chemistry, Justus. G. Kirchner (1978), Volume XIV, 2nd
Edition:
Bull. Soc. Chim. Fr., pp 801-823.
Pina, F. (1998). Thermodynamics and kinetics of flavylium salts. J. Chem. Soc., Faraday
Trans. 94, pp 2109–2116.
Poole, C. F., & Dias, N. C. (2000). Practitioner's guide to method development in thin-
layer chromatography. J. Chromatogr. A, 892, pp 123-142.
Saito, N., Abe, K., Honda, T., Timberlake, C. F.; Bridle, P. (1985). Acylated delphinidin
glucosides and flavonols from Clitoria ternatea. Phytochemistry 24, pp 1583–
1586.

43
Saito, N., Tatsuzawa, F., Yoda, K., Yokoi, M., Kasahara, K., Iida, S., Shigihara, A.,
Honda, T. (1995). Acylated cyanidin glycosides in the violet-blue flowers of
Ipomoea purpurea. Phytochemistry 40, pp 1283–1289.
Santos, H., Turner, D. L., Lima, J. C., Figueiredo, P., Pina, F. S., Macanita, A. L. (1993).
Elucidation of the multiple equilibria of malvin in aqueous solutions by one- and
two-dimensional NMR. Phytochemistry 33, pp 1227–1232.
Schreiber, M. S. (1979). 75 Years of Chromatography-a Historical Dialogue, Elsevier
scientific publishing company, Amsterdam –Oxford New York, pp 413.
Simmonds, M. S. J. (2003). Flavonoid-insect interactions: Recent advances in our
knowledge. Phytochemistry, 64, pp 21–30.
Skaar, I., Jordheim, M., Byamukama, R., Mbabazi, A., Wubshet, S. G., Kiremire, B., and
Andersen, Ø. M. (2012). New anthocyanidin and anthocyanin pigments from blue
plumbago. J. Agric. Food Chem., 60 (6), pp 1510–1515.
Sondheimer, E. (1953). On the relation between spectral changes and pH of the
anthocyanins pelargonidin 3-monoglucoside. J. Am. Chem. Soc. 75, pp 1507–
1508.
Takeoka, G.R., Lan, T.D., Full, G.H., Wong, R.Y., Harden, L.A., Edwards, R.H., Berrios,
J.J., (1997). Characterization of black bean (Phaseolus vulgaris L.) anthocyanins.
J. Agric. Food Chem., 45, pp 3395–3400.
Talavera, S., Felgines, C., Texier, O., Besson, C., Mazur, A., Lamaison, J. L., Remesy,
C. (2006). Bioavailability of a bilberry anthocyanin extract and its impact on
plasma antioxidant capacity in rats. J. Sci. Food Agric. 86, pp 90–97
Tanimura, T., Pisano, J.J., Ito, Y. and Bowman, R.L. (1970). Droplet Countercurrent
Chromatography. Science, 169, pp 54-56

44
Tits, M., Poukens, P., Angenot, L., & Dierckxsens, Y. (1992). Thin-layer
chromatographic analysis of proanthocyanidins from Ribes nigrum leaves. J
Pharm Biomed Anal., 10(10-12), pp 1097-1100.
Torskangerpoll, K. (2004). Anthocyanins and other Flavonoids isolated from plants:
Methods, structures and properties, PhD thesis, Department of chemistry,
University of Bergen, pp 2-10.
Torskangerpoll, K. and Andersen Ø. M. (2005). Color stability of anthocyanins in
aqueous solutions at various pH values. Food Chem. 89, pp 427–440.
Wagner, H. and Bladt, S. (1996). Plant Drug Analysis—A Thin Layer Chromatography
Atlas, 2nd
edition, Springer, Berlin, chap 7.

45
APPENDIX: A
TLC plates developed by using solvent mixtures of formic acid-hydrochloric acid – water in volume ratios;
6:1:3, 7:1:3 and 8:1:3, v/v/v, which have been recommended in this report for separation of anthocyanin
aglycones (Both A-ring and B-ring methylated) on TLC.
The symbols L, H, B and P on the plates represent the source of anthocyanin aglycones, B
black beans aglycones; Dp
delphinidin, Pt
petunidin, and Mv
Malvidin. H
aglycones from flowers of Hippeastrum hybridum cultivars; CY
Cyanidin, & Pg
Pelargonidin L
aglycones from the fruits of Leea guineensis; Pn
Peonidin P
aglycones from flowers of P. auriculata; 5,7-dimethyl-Dp, 5,7-dimethyl-Pt and 5,7-dimethyl-Mv

46
APPENDIX: B
A sample of the Thin layer cellulose coated plates showing separation of anthocyanin
aglycones, using Formic acid-hydrochloric acid-water mixture (FHW); Variation of
Formic acid alone with in the FHW mixture