
Chemical Transformations of Nitrogen Oxides While Sampling ...

Atmospheric Environment 38 (2004) 5399–5409
ARTICLE IN PRESS
$Submitted
ment on ISCAT
*Correspond
603-862-2124.
E-mail addr
1352-2310/$ - se
doi:10.1016/j.at
Soluble reactive nitrogen oxides at South Pole duringISCAT 2000$
Jack E. Dibba,*, L. Gregory Hueyb, Darlene L. Slusherb, David J. Tannerb
aClimate Change Research Center, Institute for the Study of Earth, Oceans and Space, University of New Hampshire,
Durham, NH 03824, USAbSchool of Earth and Atmospheric Sciences, Georgia Institute of Technology, Atlanta, GA, USA
Received 15 August 2002; accepted 29 January 2003
Abstract
The mist chamber/ion chromatography technique was used to measure soluble gaseous nitrite (NO2�) and nitrate
(NO3�) within the lowermost atmosphere (2 cm up to 10m above the snow) and in the firn air at South Pole during the
last 2 weeks of December 2000. Collected NO2� and NO3
� are attributed to nitrous (HONO) and nitric (HNO3) acids,
respectively. Firn air mixing ratios of HONO were more than five times higher than those just above the snow. A single
day of measurements showed HONO mixing ratios to be significantly lower at 10m than 85 cm above the snow. These
gradients suggest that HONO is produced in the snowpack and fluxes out into the overlying air. A strong and persistent
local source of HONO is required to sustain mean mixing ratios of 30 ppt against very fast loss by photolysis under the
intense 24 h sunlight at South Pole. For HNO3, measurements in the atmosphere were made with two independent
techniques. A CIMS technique provided data at 1min resolution, at a sampling height of 10m. The mist chamber/ion
chromatography technique integrated over nominally 30min intervals, with most measurements made 85 cm above the
snow. Mixing ratios of HNO3 were highest (mean 38 ppt) at 85 cm above the snow, compared to those both in the firn
air and at 10m above the snow. Comparing HNO3 mixing ratios between 85 cm and firn air suggests flux into the snow,
while the comparisons between 85 cm and 10m suggest fluxes in the opposite direction. We speculate that the maximum
just above the snow surface reflects in situ production of HNO3, supported by fluxes of NOx and OH precursors (e.g.,
HONO, HCHO, HOOH) out of the snow. Comparison of NO3� concentrations in snow immediately upwind of the
Atmospheric Research Observatory, 50m away from the building and 15 km away from the station revealed no
significant differences. This finding indicates that the very high NO mixing ratios observed during ISCAT 1998 and
2000 cannot be attributed to NO3� contamination of the snow surrounding the sampling location.
r 2004 Elsevier Ltd. All rights reserved.
Keywords: Photochemistry in snow; South Pole; Nitric acid; Nitrous acid; ISCAT 2000
to the special section of Atmospheric Environ-
2000.
ing author. Tel.: +1-603-862-3063; fax: +1-
ess: [email protected] (J.E. Dibb).
e front matter r 2004 Elsevier Ltd. All rights reserve
mosenv.2003.01.001
1. Introduction
A series of discoveries in 1998 sparked intense interest
in the photochemical processing that occurs in sunlit
snow. An unexpected diurnal cycle in NOx above the
seasonal snowpack when the sun first returned to Alert
in March was the first surprise (Ridley et al., 2000). Just
a few months later, a team investigating the partitioning
of N oxides at Summit, the highest point on the
d.

ARTICLE IN PRESSJ.E. Dibb et al. / Atmospheric Environment 38 (2004) 5399–54095400
Greenland ice sheet, found NOx to constitute B30% of
NOy. Here too, there were indications that the
unexpectedly high abundance of NOx was supported
by fluxes out of the snow (Honrath et al., 1999). While
these findings from the Arctic were being presented and
discussed at the 1999 Fall meeting of the American
Geophysical Union, a third team of researchers inves-
tigating the interactions between gas and particulate S
species (ISCAT) was observing NO mixing ratios as high
as 600 ppt (e.g., 900 ppt NOx) above the snow at the
South Pole (Davis et al., 2001). In comparison, the
‘‘surprisingly high’’ mixing ratios of NOx at Alert and
Summit peaked below 100 ppt. The ISCAT team also
found that OH 10m above the snow at South Pole was
comparable to, or even higher than, the 24 h average
mixing ratios in the equatorial marine boundary layer
(one of the highest global OH production regions)
(Mauldin et al., 2001).
Continued investigations by the Summit team (at
Summit in summers 1999 and 2000 and also in northern
Michigan early in 1999) have demonstrated that a source
of snowpack NOx is photolysis of NO3� contained in/on
the snow grains (Honrath et al., 2000; Dibb et al., 2002).
This will likely also produce OH in/on the snow, leading
to possible production of HONO and HNO3. If these N
oxides are produced in the snowpack, their release into
the firn air and overlying atmosphere will lead to rapid
cycling between HONO, HNO3 and NOx. Elevated NO
mixing ratios should enhance OH levels in the gas phase
as well, through their impact on the HO2/OH ratio, and
photolysis of HONO will further boost both NO and
OH. We have also observed large enhancements of
HCHO, HCOOH, CH3COOH, CH3Br, CH3I, C2H4,
C3H6 and several light alkyl nitrates in the air filling
pore spaces (firn air) of the snowpack. Production of
these gases has been tentatively attributed to oxidation
of abundant, but not yet speciated, organic carbon in the
snow (Dibb and Arsenault, 2002; Jacobi et al., 2002;
Swanson et al., 2002). Fluxes out of the snow cause
enhancements of NOx, HONO, HCHO and HOOH at
least up to 1m above the snow (Honrath et al., 2002;
Jacobi et al., 2002), and probably higher. The large
enhancements of organic gases in firn air presumably
also support snow-to-air fluxes, but these have not yet
been quantified.
Photochemical modeling, constrained by observed
values of reactive gases above the snow, suggested that
OH is greatly enhanced at Summit, with photolysis of
HCHO and HONO constituting the dominant radical
sources, and photolysis of O3 contributing only a third
of total OH production (Yang et al., 2002). Chen et al.
(2001) also found that production of OH from snow-
released species such as HCHO and HONO was
sometimes required to account for the high OH mixing
ratios measured at South Pole during ISCAT 1998.
Similar production of reactive N species and organic
gases in snow, with release to the overlying atmosphere,
has been demonstrated by further work at Alert
(Sumner and Shepson, 1999; Zhou et al., 2001, and the
collection of papers in the special issue of Atmospheric
Environment on ALERT 2000 and Summit 2000,
volume 36, Issues 15/16). Investigations at the German
Neumayer station in coastal Antarctica have revealed
photochemical production of NOx in sunlit snow, and
have quantified snow-to-air fluxes (Jones et al., 2000,
2001). In addition, laboratory studies have targeted
improved understanding of photochemical processes in
and on ice (e.g., Dubowski et al., 2001, 2002).
When the ISCAT team returned to South Pole for a
second field campaign in November 2000, the focus (and
team composition) was significantly broadened (see the
ISCAT 2000 Overview, Davis et al., this issue a).
Important new efforts during ISCAT 2000 included
measurements of NOx snow/atmosphere flux and
sampling of surface and near surface snow, as well as
the firn air, using techniques developed at Summit. We
also added instrumentation to measure NO2, HNO3,
HONO and HO2NO2 along with NO (only NO was
measured in the 1998 campaign).
The primary focus of this paper is on HONO and
HNO3 in the firn air and atmosphere at South Pole. In
particular, we compare observations at South Pole to
those made at Summit using the same measurement
techniques. Because logistical requirements of several of
the ISCAT instruments required that they be operated
inside the Atmospheric Research Observatory (ARO)
building very close to the center of the station, we also
conducted a limited spatial survey in order to assess
whether station or building effects greatly modified the
composition of nearby snow (perhaps contributing to
the very high levels of NO measured in 1998).
2. Methods
Competition for space at the South Pole research
station was intense during the 2000/01 season. The
ISCAT team was generally limited to six persons on site
at any time. As a result, it was only possible to conduct
the sampling and analyses for soluble N-bearing acids
described herein for just over 2 weeks. To ensure that
these measurements would complement the full suite of
ISCAT data, our sampling began in mid-December after
all other instrumentation had been brought on line.
Most ISCAT measurements were made in or on the
ARO, but micrometeorological instruments to quantify
turbulent exchange just above the snow were mounted
on the NOAA tower B100m upwind of the building
(Davis et al., this issue b; Oncley et al., this issue).
Because of concerns that our equipment might impact
both radiation measurements (by NOAA) and the
ISCAT micrometeorological sensors if installed on the
ARTICLE IN PRESSJ.E. Dibb et al. / Atmospheric Environment 38 (2004) 5399–5409 5401
tower, we initially set up two mist chamber samplers
half-way between the tower and ARO, hoping to merge
gradient measurements of HONO and HNO3 with the
turbulent flux data. For the last half of the campaign,
both samplers were moved to a location immediately
upwind of ARO so that firn air could be sampled from
the same snow drift that other ISCAT investigators were
able to access through long inlets extending from the
second floor of the building (Davis et al., this issue a).
2.1. Gas sampling and analysis
We quantified HNO3 and HONO by operating two
mist chamber samplers simultaneously for 8–12 h every
day from 13 to 27 December (except for the 21st and
24th). Pairs of samples were collected over nominal
30min intervals. Details of this sampling technique, and
sample analysis by ion chromatography within 30min of
collection, have been provided in Dibb et al. (1994, 1998,
2002) and Dibb and Arsenault (2002). Briefly, the
samplers create a dense mist of ultrapure water, which
scavenges soluble gases from the sampled air stream.
Extensive laboratory, ground-based, and airborne test-
ing have established that HNO3 is quantitatively
collected and dissociates to NO3� in the sample. Further,
there are no known positive or negative interferants. At
Summit (in fact, in all samples we have ever collected
above sunlit snow) mist chamber samples are invariably
found to also contain NO2� (Dibb et al., 2002). We have
attributed the observed NO2� to the presence of HONO
in the sampled air, and have conducted laboratory tests
confirming that the technique does collect HONO with
high efficiency. So far we have not conducted the testing
required to assess whether other soluble N oxides could
contribute to the signal, or whether there may be
negative interferants in some air masses. Pernitric acid
(HO2NO2) is one candidate interferant which has been
observed above sunlit snow both at Alert (X. Zhou,
unpublished data) and at South Pole during the ISCAT
2000 study (Slusher et al., 2002). There was no strong
correlation between the measurements of HO2NO2 and
soluble NO2� at South Pole. Furthermore, we find that
soluble NO2� and NO increased when the temperature at
22m exceeded that at 2m (implying a very shallow
surface mixed layer collecting emissions from the snow,
Davis et al., 2001), while HO2NO2 showed little relation
to this stability indicator. In this paper, we will present
the soluble NO2� results as HONO mixing ratios. Chen
et al. (this issue) point out that the HONO levels we
report lead to significant over prediction of OH and
NOx in their photochemical box model. Model un-
certainties still remain, suggesting that the observation/
prediction discrepancy may be reduced by model
improvement, but it would also be valuable to compare
the mist chamber/ion chromatography technique to
other, more specific, measurements of HONO. The mist
chamber technique also quantitatively samples HCOOH
and CH3COOH; these results are discussed in Dibb and
Arsenault (2002).
During the summer at South Pole katabatic down-
slope winds prevail. The ARO is located upwind from
the rest of the station, and defines the vertex of a clean-
air sector (10–120o) in which all travel is strictly
controlled. The solar elevation is nearly constant
through the course of the day, though the ARO building
casts a sizeable shadow which can suppress photochem-
istry (Mauldin et al., 2001). Sampling was largely
restricted to the half-day when the sun was on the
upwind side of ARO. One of the samplers was fitted
with a Teflon prefilter attached directly to the sampler.
This was mounted 85 cm above the snow surface and
sampled ambient air from this height throughout the
experiment. The second sampler was equipped with a
2m length of heated 0.95 cm o.d. PFA tubing and then a
Teflon prefilter. The heated inlet allowed this sampler to
pull air from any height between 1m above and 1m
below the snow surface. On the first 2 days of sampling,
and usually for one or two sample pairs on the other
days, this inlet was suspended at B85 cm above the
snow in order to assess agreement between the two
samplers when they were both sampling the ‘‘same’’ air.
For 7 of the sampling days the heated inlet was used to
sample firn air from various depths (details of several of
these experiments are presented below). On the other 4
days, attempts were made to measure gradients in the air
above the snow; on 3 days the heated inlet was placed
2 cm above the snow, on the final day of sampling this
mist chamber was moved to the second floor of ARO
and the inlet was positioned adjacent to the CIMS inlet
B10m above the snow.
The CIMS instruments, and the specific techniques
used to measure HNO3 and HO2NO2 with it at South
Pole, are described in detail elsewhere (Leibrock and
Huey, 2000; Slusher et al., 2001). For most of the period
from 18 to 28 December the CIMS instrument sampled
air through a short inlet penetrating the wall in a second
floor laboratory in ARO. In this configuration, the
system measured HNO3, HO2NO2 and SO2 in ambient
air 10m above the snow. For 3 days (20–22 December)
the CIMS instrument was fitted with a long inlet in order
to measure NO2 in firn air. During these periods CIMS
data are not available at the 10m height. In this paper,
we are primarily interested in comparing simultaneous
measurements of HNO3 at 85 cm and at 10m above the
snow (made by mist chamber and CIMS techniques,
respectively).
2.2. Snow sampling and analysis
On 10 of the 13 days when mist chamber sampling
was conducted, surface snow was collected B3m
upwind of the gas phase samplers. Three adjacent
ARTICLE IN PRESSJ.E. Dibb et al. / Atmospheric Environment 38 (2004) 5399–54095402
replicates of the dominant surface layer were collected
into precleaned polyethylene bottles using lexan scra-
pers. Care was taken to collect a known area from only
the uppermost stratigraphic layer (see Dibb et al., 1994,
1998 for more details and rationale). All surface snow
samples collected at the site half way to the tower were
from an aged layer that was 1 cm thick. On 21 December
a snowstorm deposited a new surface layer that was
B0.7 cm deep. This layer was sampled directly upwind
of ARO on the last 5 days of the investigation. Both of
these surface layers were subjected to minor drifting, and
the addition of frequent diamond dust, in the intervals
between sample collection. In addition, three shallow
snowpits were sampled at 3 cm depth resolution. Two of
these were dug at the locations of the mist chamber
sampling to characterize the snow from which firn air
was sampled (one at the first location between ARO and
the tower, and the second in the drift right at the base of
ARO). The third pit was sampled at a location known as
E-30, 15 km from the station along grid 290�. All
samples were kept frozen during shipment back to our
laboratory in New Hampshire. They were melted in
small groups which were immediately analyzed by ion
chromatography. Concentrations of eight major ions
were determined but we report only on NO3� in this
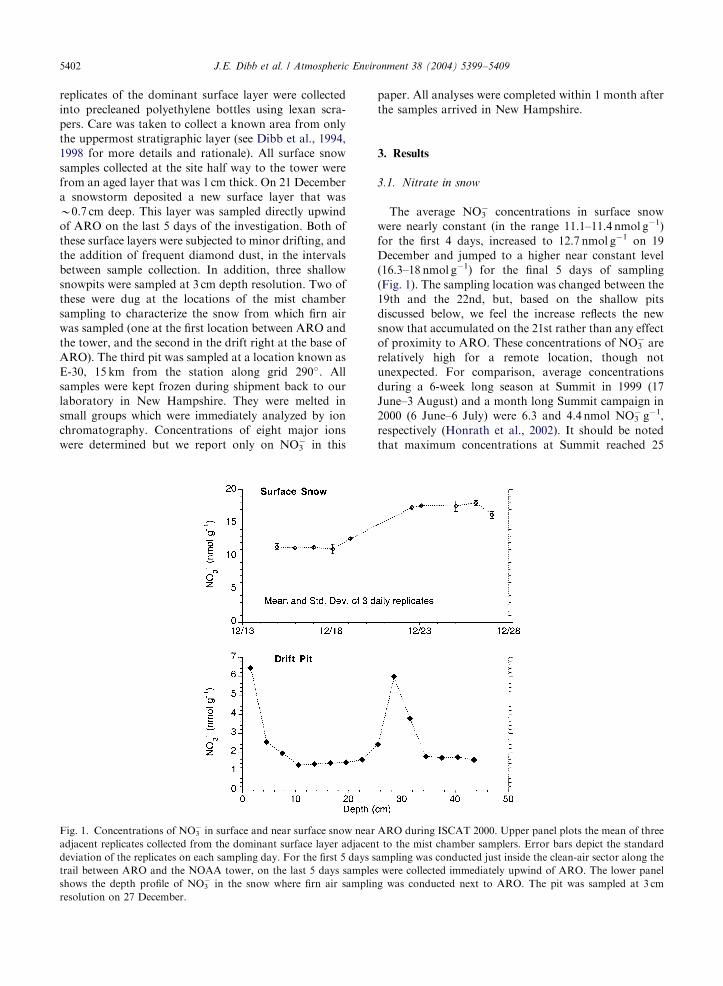
Fig. 1. Concentrations of NO3� in surface and near surface snow near
adjacent replicates collected from the dominant surface layer adjacen
deviation of the replicates on each sampling day. For the first 5 days s
trail between ARO and the NOAA tower, on the last 5 days sample
shows the depth profile of NO3� in the snow where firn air samplin
resolution on 27 December.
paper. All analyses were completed within 1 month after
the samples arrived in New Hampshire.
3. Results
3.1. Nitrate in snow
The average NO3� concentrations in surface snow
were nearly constant (in the range 11.1–11.4 nmol g�1)
for the first 4 days, increased to 12.7 nmol g�1 on 19
December and jumped to a higher near constant level
(16.3–18 nmol g�1) for the final 5 days of sampling
(Fig. 1). The sampling location was changed between the
19th and the 22nd, but, based on the shallow pits
discussed below, we feel the increase reflects the new
snow that accumulated on the 21st rather than any effect
of proximity to ARO. These concentrations of NO3� are
relatively high for a remote location, though not
unexpected. For comparison, average concentrations
during a 6-week long season at Summit in 1999 (17
June–3 August) and a month long Summit campaign in
2000 (6 June–6 July) were 6.3 and 4.4 nmol NO3� g�1,
respectively (Honrath et al., 2002). It should be noted
that maximum concentrations at Summit reached 25
ARO during ISCAT 2000. Upper panel plots the mean of three
t to the mist chamber samplers. Error bars depict the standard
ampling was conducted just inside the clean-air sector along the
s were collected immediately upwind of ARO. The lower panel
g was conducted next to ARO. The pit was sampled at 3 cm

ARTICLE IN PRESSJ.E. Dibb et al. / Atmospheric Environment 38 (2004) 5399–5409 5403
and 8 nmol g�1 in the two different seasons, and we
could select 2-week long intervals from the 1999 Summit
season where average NO3� concentrations were nearly
twice those at South Pole during ISCAT, or where they
were less than half as high. The NO3� concentrations in
surface snow at South Pole during the summer should be
considered generally comparable to those at Summit
during the same season.
The depth profile of NO3� in the drift in front of ARO
indicates a rapid decrease with depth (Fig. 1), as has
been noted in previous investigations (e.g., Whitlow
et al., 1992; Dibb and Whitlow, 1996). The gradient very
near the surface is particularly steep. The 6.5 nmol g�1
concentration in the uppermost (0–3 cm) pit sample
(Fig. 1 lower panel) represents the average of
B18 nmol g�1 in the 0.7 cm thick surface layer (Fig. 1
upper panel) andB5.2 nmol g�1 in the lowermost 2.3 cm
(based on measured densities of 0.11 and 0.28 g cm�3 in
the top 0.7 and 3.0 cm, respectively). The rapid decrease
of NO3� with depth in South Pole snow results in average
concentrations in the top 30–50 cm that are B12those at
Summit (see also Whitlow et al., 1992).
Depth profiles of NO3� in the other pits sampled in
2000 were similar to that in Fig. 1, decreasing rapidly
from surficial (0–3 cm) maxima between 7 and
8 nmol g�1 (not shown). To facilitate comparison, we
have simply averaged the NO3� concentration in the top
45 cm in all three pits (Table 1). The pit closest to ARO
was about 30% higher than the pit between the building
and the tower, but B5% lower than the E-30 pit 15 km
away. This would suggest that the small enhancement at
the foot of ARO compared to 50m further upwind is
not related to the building itself. Expanding the
comparison to three pits sampled 10 km from the station
in 1994, and a single pit sampled in 1988 40 km away
(along the edge of the clean-air sector) provides no clear
indication of NO3� enhancement right at South Pole
station compared to the surrounding region. Similar
ranges in average concentrations were found in both
years when two pits were sampled, and the value in the
1988 pit (which would be least likely to suffer any
impacts from the station) falls within these ranges.
Table 1
Average concentrations of NO3� (nmol g�1) in the top 45 cm of
seven snowpits sampled near South Pole from 1988 to 2000
ARO
Drifta Towerb E-30c ’94-1d ’94-2d ’94-3d ’88e
2.48 1.93 2.57 2.16 2.44 1.79 1.96
a Immediately upwind of ARO.bHalf way between ARO and NOAA tower.cFifteen kilometer from South Pole station.dFrom Dibb and Whitlow (1996).eFrom Whitlow et al. (1992).
3.2. Nitric and nitrous acids in air
The mixing ratio of HNO3 85 cm above the snow
ranged from 6 to 124 ppt (average 38, median 35)
(Fig. 2). At 10m above the snow the range was o5–
68 ppt (average 22, median 22) (Slusher et al., 2002). It
should be noted that these summary statistics represent
slightly different sampling intervals for the two techni-
ques. We compare simultaneous measurements made
over 8 days below. Nitrous acid ranged 5–71 ppt in the
samples collected at the 85 cm height (average 30,
median 33). In comparison, average mixing ratios of
HNO3 just above the snow at Summit in the 1999 and
2000 summer seasons were about 12those during the last
2 weeks of December at South Pole (17 and 20 ppt,
respectively). The mean HONO mixing ratio at Summit
was only 7 ppt in 1999, but reached 15 ppt in 2000. Zhou
et al. (2001) reported HONO mixing ratios 5m above
the snow at Alert in April that showed significant diel
variation, peaking near 10 ppt around noon and
dropping to near 6 ppt at night. Limited sampling just
20 cm above the snow at Alert revealed a larger
amplitude of variation, with the maximum near noon
reaching B40 ppt. At Summit the median HONO
mixing ratios were lower than the means (4 and 12 ppt,
respectively), while the reverse was true at South Pole.
The variability we have observed at Summit, from year
to year, and even within any season, indicates that
extreme caution should be taken when interpreting
results based on just 2 weeks of sampling at South Pole.
Given that caveat, the ISCAT 2000 sampling suggests
that HONO mixing ratios may be sustained at
significantly higher levels above the snow at South Pole
compared to Summit.
Despite their similar distributions, the mixing ratios of
HNO3 and HONO were not very well correlated 85 cm
above the snow at South Pole (r2 ¼ 0:14; n ¼ 179). A
notable exception is provided by the sharp increases in
HNO3 and HONO on 15 December, followed by low
mixing ratios of both gases the next day (Fig. 2).
Similarly, both acids tended to be enhanced 18–20
December, but overall it appears that the processes
controlling HNO3 and HONO above South Pole snow
are not tightly linked.
4. Discussion
At Summit, HNO3 constitutes a nearly negligible
fraction of NOy, unlike most regions in the remote
troposphere (Dibb et al., 1998; Ford et al., 2002).
Gradient measurements of HNO3 above the snow
suggest that sometimes there are upward fluxes (Dibb
et al., 1998; Honrath et al., 2002), a finding that is
completely at odds with the paradigm that deposition of
HNO3 and aerosol-associated NO3� constitutes the final
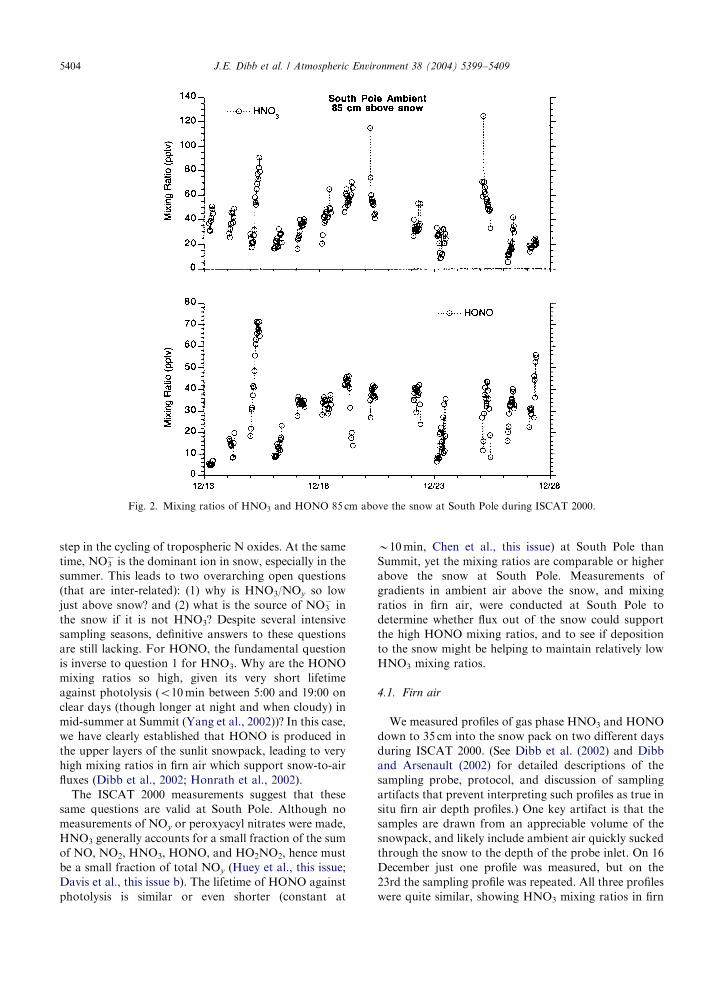
ARTICLE IN PRESS
Fig. 2. Mixing ratios of HNO3 and HONO 85 cm above the snow at South Pole during ISCAT 2000.
J.E. Dibb et al. / Atmospheric Environment 38 (2004) 5399–54095404
step in the cycling of tropospheric N oxides. At the same
time, NO3� is the dominant ion in snow, especially in the
summer. This leads to two overarching open questions
(that are inter-related): (1) why is HNO3/NOy so low
just above snow? and (2) what is the source of NO3� in
the snow if it is not HNO3? Despite several intensive
sampling seasons, definitive answers to these questions
are still lacking. For HONO, the fundamental question
is inverse to question 1 for HNO3. Why are the HONO
mixing ratios so high, given its very short lifetime
against photolysis (o10min between 5:00 and 19:00 on
clear days (though longer at night and when cloudy) in
mid-summer at Summit (Yang et al., 2002))? In this case,
we have clearly established that HONO is produced in
the upper layers of the sunlit snowpack, leading to very
high mixing ratios in firn air which support snow-to-air
fluxes (Dibb et al., 2002; Honrath et al., 2002).
The ISCAT 2000 measurements suggest that these
same questions are valid at South Pole. Although no
measurements of NOy or peroxyacyl nitrates were made,
HNO3 generally accounts for a small fraction of the sum
of NO, NO2, HNO3, HONO, and HO2NO2, hence must
be a small fraction of total NOy (Huey et al., this issue;
Davis et al., this issue b). The lifetime of HONO against
photolysis is similar or even shorter (constant at
B10min, Chen et al., this issue) at South Pole than
Summit, yet the mixing ratios are comparable or higher
above the snow at South Pole. Measurements of
gradients in ambient air above the snow, and mixing
ratios in firn air, were conducted at South Pole to
determine whether flux out of the snow could support
the high HONO mixing ratios, and to see if deposition
to the snow might be helping to maintain relatively low
HNO3 mixing ratios.
4.1. Firn air
We measured profiles of gas phase HNO3 and HONO
down to 35 cm into the snow pack on two different days
during ISCAT 2000. (See Dibb et al. (2002) and Dibb
and Arsenault (2002) for detailed descriptions of the
sampling probe, protocol, and discussion of sampling
artifacts that prevent interpreting such profiles as true in
situ firn air depth profiles.) One key artifact is that the
samples are drawn from an appreciable volume of the
snowpack, and likely include ambient air quickly sucked
through the snow to the depth of the probe inlet. On 16
December just one profile was measured, but on the
23rd the sampling profile was repeated. All three profiles
were quite similar, showing HNO3 mixing ratios in firn
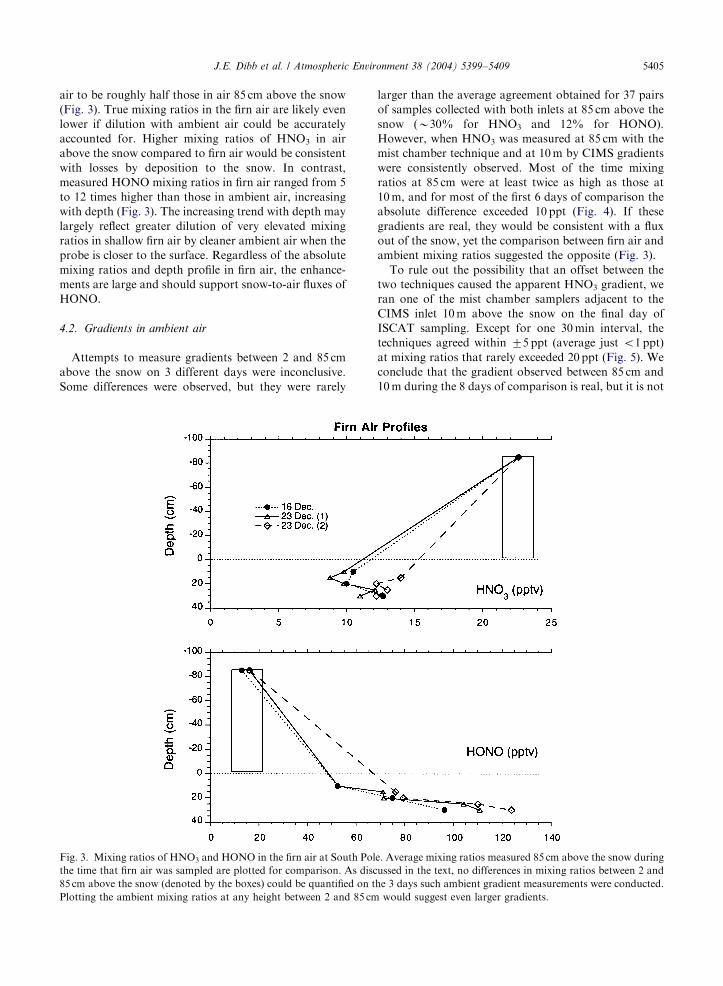
ARTICLE IN PRESSJ.E. Dibb et al. / Atmospheric Environment 38 (2004) 5399–5409 5405
air to be roughly half those in air 85 cm above the snow
(Fig. 3). True mixing ratios in the firn air are likely even
lower if dilution with ambient air could be accurately
accounted for. Higher mixing ratios of HNO3 in air
above the snow compared to firn air would be consistent
with losses by deposition to the snow. In contrast,
measured HONO mixing ratios in firn air ranged from 5
to 12 times higher than those in ambient air, increasing
with depth (Fig. 3). The increasing trend with depth may
largely reflect greater dilution of very elevated mixing
ratios in shallow firn air by cleaner ambient air when the
probe is closer to the surface. Regardless of the absolute
mixing ratios and depth profile in firn air, the enhance-
ments are large and should support snow-to-air fluxes of
HONO.
4.2. Gradients in ambient air
Attempts to measure gradients between 2 and 85 cm
above the snow on 3 different days were inconclusive.
Some differences were observed, but they were rarely
Fig. 3. Mixing ratios of HNO3 and HONO in the firn air at South Pol
the time that firn air was sampled are plotted for comparison. As disc
85 cm above the snow (denoted by the boxes) could be quantified on t
Plotting the ambient mixing ratios at any height between 2 and 85 cm
larger than the average agreement obtained for 37 pairs
of samples collected with both inlets at 85 cm above the
snow (B30% for HNO3 and 12% for HONO).
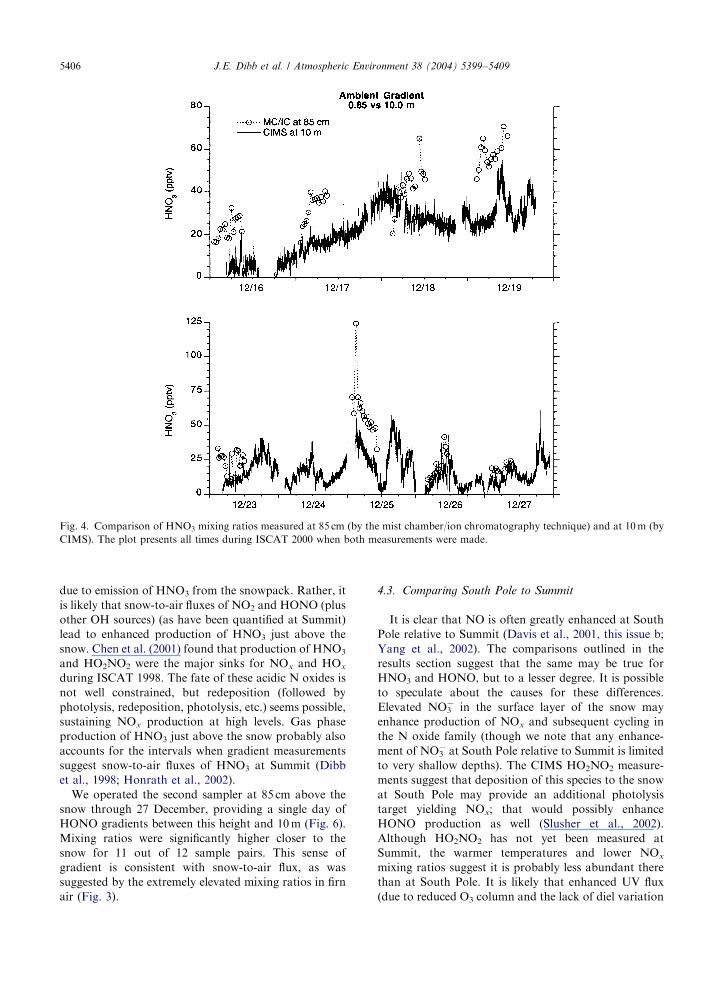
However, when HNO3 was measured at 85 cm with the
mist chamber technique and at 10m by CIMS gradients
were consistently observed. Most of the time mixing
ratios at 85 cm were at least twice as high as those at
10m, and for most of the first 6 days of comparison the
absolute difference exceeded 10 ppt (Fig. 4). If these
gradients are real, they would be consistent with a flux
out of the snow, yet the comparison between firn air and
ambient mixing ratios suggested the opposite (Fig. 3).
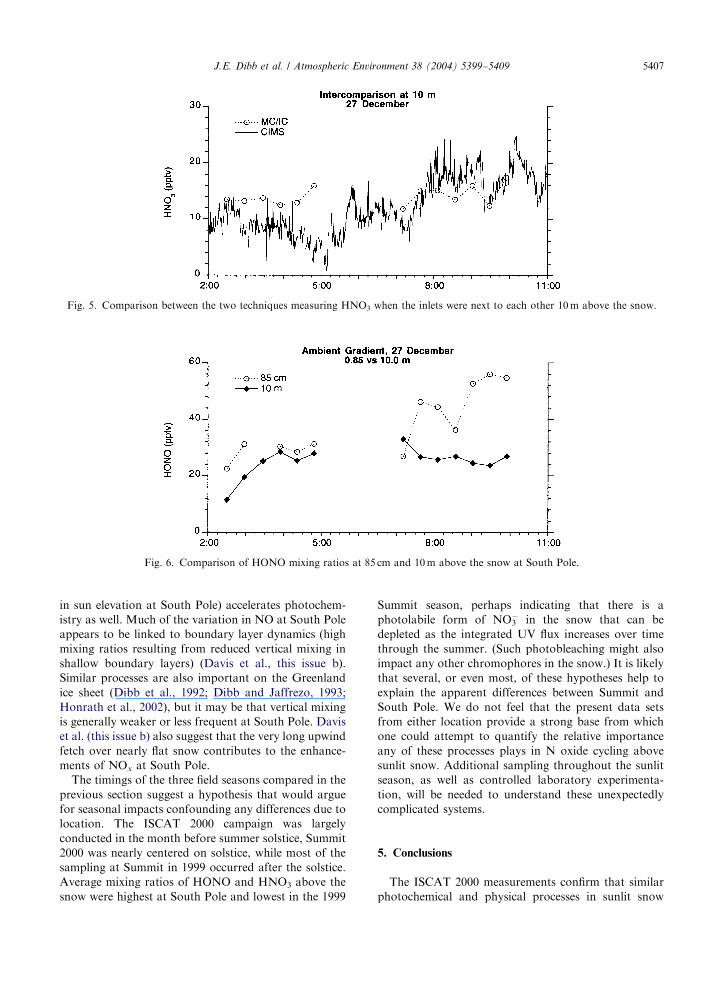
To rule out the possibility that an offset between the
two techniques caused the apparent HNO3 gradient, we
ran one of the mist chamber samplers adjacent to the
CIMS inlet 10m above the snow on the final day of
ISCAT sampling. Except for one 30min interval, the
techniques agreed within 75 ppt (average just o1 ppt)
at mixing ratios that rarely exceeded 20 ppt (Fig. 5). We
conclude that the gradient observed between 85 cm and
10m during the 8 days of comparison is real, but it is not
e. Average mixing ratios measured 85 cm above the snow during
ussed in the text, no differences in mixing ratios between 2 and
he 3 days such ambient gradient measurements were conducted.
would suggest even larger gradients.
ARTICLE IN PRESS
Fig. 4. Comparison of HNO3 mixing ratios measured at 85 cm (by the mist chamber/ion chromatography technique) and at 10m (by
CIMS). The plot presents all times during ISCAT 2000 when both measurements were made.
J.E. Dibb et al. / Atmospheric Environment 38 (2004) 5399–54095406
due to emission of HNO3 from the snowpack. Rather, it
is likely that snow-to-air fluxes of NO2 and HONO (plus
other OH sources) (as have been quantified at Summit)
lead to enhanced production of HNO3 just above the
snow. Chen et al. (2001) found that production of HNO3
and HO2NO2 were the major sinks for NOx and HOx
during ISCAT 1998. The fate of these acidic N oxides is
not well constrained, but redeposition (followed by
photolysis, redeposition, photolysis, etc.) seems possible,
sustaining NOx production at high levels. Gas phase
production of HNO3 just above the snow probably also
accounts for the intervals when gradient measurements
suggest snow-to-air fluxes of HNO3 at Summit (Dibb
et al., 1998; Honrath et al., 2002).
We operated the second sampler at 85 cm above the
snow through 27 December, providing a single day of
HONO gradients between this height and 10m (Fig. 6).
Mixing ratios were significantly higher closer to the
snow for 11 out of 12 sample pairs. This sense of
gradient is consistent with snow-to-air flux, as was
suggested by the extremely elevated mixing ratios in firn
air (Fig. 3).
4.3. Comparing South Pole to Summit
It is clear that NO is often greatly enhanced at South
Pole relative to Summit (Davis et al., 2001, this issue b;
Yang et al., 2002). The comparisons outlined in the
results section suggest that the same may be true for
HNO3 and HONO, but to a lesser degree. It is possible
to speculate about the causes for these differences.
Elevated NO3� in the surface layer of the snow may
enhance production of NOx and subsequent cycling in
the N oxide family (though we note that any enhance-
ment of NO3� at South Pole relative to Summit is limited
to very shallow depths). The CIMS HO2NO2 measure-
ments suggest that deposition of this species to the snow
at South Pole may provide an additional photolysis
target yielding NOx; that would possibly enhance
HONO production as well (Slusher et al., 2002).
Although HO2NO2 has not yet been measured at
Summit, the warmer temperatures and lower NOx
mixing ratios suggest it is probably less abundant there
than at South Pole. It is likely that enhanced UV flux
(due to reduced O3 column and the lack of diel variation
ARTICLE IN PRESS
Fig. 5. Comparison between the two techniques measuring HNO3 when the inlets were next to each other 10m above the snow.
Fig. 6. Comparison of HONO mixing ratios at 85 cm and 10m above the snow at South Pole.
J.E. Dibb et al. / Atmospheric Environment 38 (2004) 5399–5409 5407
in sun elevation at South Pole) accelerates photochem-
istry as well. Much of the variation in NO at South Pole
appears to be linked to boundary layer dynamics (high
mixing ratios resulting from reduced vertical mixing in
shallow boundary layers) (Davis et al., this issue b).
Similar processes are also important on the Greenland
ice sheet (Dibb et al., 1992; Dibb and Jaffrezo, 1993;
Honrath et al., 2002), but it may be that vertical mixing
is generally weaker or less frequent at South Pole. Davis
et al. (this issue b) also suggest that the very long upwind
fetch over nearly flat snow contributes to the enhance-
ments of NOx at South Pole.
The timings of the three field seasons compared in the
previous section suggest a hypothesis that would argue
for seasonal impacts confounding any differences due to
location. The ISCAT 2000 campaign was largely
conducted in the month before summer solstice, Summit
2000 was nearly centered on solstice, while most of the
sampling at Summit in 1999 occurred after the solstice.
Average mixing ratios of HONO and HNO3 above the
snow were highest at South Pole and lowest in the 1999
Summit season, perhaps indicating that there is a
photolabile form of NO3� in the snow that can be
depleted as the integrated UV flux increases over time
through the summer. (Such photobleaching might also
impact any other chromophores in the snow.) It is likely
that several, or even most, of these hypotheses help to
explain the apparent differences between Summit and
South Pole. We do not feel that the present data sets
from either location provide a strong base from which
one could attempt to quantify the relative importance
any of these processes plays in N oxide cycling above
sunlit snow. Additional sampling throughout the sunlit
season, as well as controlled laboratory experimenta-
tion, will be needed to understand these unexpectedly
complicated systems.
5. Conclusions
The ISCAT 2000 measurements confirm that similar
photochemical and physical processes in sunlit snow
ARTICLE IN PRESSJ.E. Dibb et al. / Atmospheric Environment 38 (2004) 5399–54095408
release reactive N oxides into the lowermost atmosphere
at both Summit, Greenland and South Pole. Quantita-
tive comparisons may be premature, but much higher
peak NO mixing ratios at South Pole suggest that
chemical processing in snow may be accelerated there. It
appears that HONO is also enhanced at South Pole
compared to Summit, but the very short ISCAT 2000
record probably does not afford a valid basis for
comparison. Perhaps the main factors leading to
larger enhancements in mixing ratios of N oxides
above the snow at South Pole are dynamical (weaker
vertical mixing and longer upwind fetch over active
sunlit snow). Determining whether there are differences
in the degree of photochemical processing, and per-
haps even in the dominant chemical mechanisms,
operating in sunlit snow on the two polar ice sheets will
require much additional experimentation in the field and
laboratory.
The concentrations of NO3� in surface and near
surface snow around ARO and the South Pole sta-
tion were relatively uniform. If, as we suspect, the
source of reactive N oxides in the firn air and lower-
most atmosphere is dominated by photolysis of snow
NO3�, these results indicate that the very high NO
mixing ratios measured in 1998 and 2000 are not an
artifact caused by sampling from the ARO building.
Comparing snow NO3� concentrations right at ARO in
2000 to those up to 40 km upwind in 1988 reveals no
trend over the past 13 years, and no evidence that
station activities have enhanced the levels above regional
values.
Mixing ratios of HONO at South Pole decreased
dramatically between firn air and 85 cm above the
snow, and were even lower at 10m on the single day
that measurements were made simultaneously at 85 cm
and 10m. This gradient is consistent with production in
the snow pack supporting snow-to-air fluxes of HONO,
as have been measured at Summit. Nitric acid mixing
ratios were found to be higher 85 cm above the snow
than they were either in the firn air or 10m above
the snow. The enhancement at 85 cm relative to firn
air suggests deposition to the snow, while the compa-
rison between 85 cm and 10m indicates an upward
flux. We hypothesize that the enhancement of HNO3
just above the snow is not due to snow-to-air flux of
HNO3. Rather, fluxes of NOx and HONO (and perhaps
other OH sources) out of the snow lead to enhanced
mixing ratios of NO2 and OH, hence production of
HNO3. This source may also operate at Summit,
accounting for the occasional intervals when gradient
measurements have indicated a snow-to-air flux of
HNO3 (Dibb et al., 1998; Honrath et al., 2002). It
should be noted that significant in situ production of
HNO3 above sunlit snow compounds our difficulty in
explaining why HNO3/NOy is so low at Summit and
South Pole.
References
Chen, G., Davis, D., Crawford, J., Nowak, J.B., Eisele, F.,
Mauldin III, R.L., Tanner, D., Buhr, M., Shetter, R., Lefer,
B., Arimoto, R., Hogan, A., Blake, D., 2001. An investiga-
tion of South Pole HOx chemistry: comparison of model
results with ISCAT observations. Geophysical Research
Letters 28, 3633–3636.
Chen, G., Davis, D., Crawford, J., Eisele, F., Mauldin, L.,
Hutterli, M., McConnell, J., Dibb, J., Shetter, R., Lefer, B.,
this issue. A reassessment of HOx chemistry based on
observation recorded during ISCAT 2000. Atmospheric
Environment, doi:10.1016/j.atmosenv.2003.07.018.
Davis, D., Buhr, M., Nowack, J.B., Chen, G., Arimoto, R.,
Hogan, A., Eisele, F., Mauldin, L., Tanner, D., Shetter, R.,
Lefer, B., McMurry, P., 2001. Unexpected high levels of NO
measured at South Pole: observations and chemical
consequences. Geophysical Research Letters 28, 3625–3628.
Davis, D., Eisele, F., Chen, G., Crawford, J., Huey, G., Tunner,
D., et al., this issue a. An overview of ISCAT 2000.
Atmospheric Environment, doi:10.1016/j.atmosenv.2004.
05.037.
Davis, D., Chen, G., Buhr, M., Crawford, J., Lenschow, B.,
Lefer, R., et al., this issue b. South Pole NOx chemistry: an
assessment of factors controlling variability and absolute
levels. Atmospheric Environment, doi:10.1016/j.atmosenv.
2004.04.039.
Dibb, J.E., Arsenault, M., 2002. Shouldn’t snowpacks be
sources of monocarboxylic acids. Atmospheric Environ-
ment 36, 2513–2522.
Dibb, J.E., Jaffrezo, J.-L., 1993. Beryllium-7 and lead-210 in
aerosol and snow in the dye 3 Gas, aerosol and snow sampling
program. Atmospheric Environment 27A, 2751–2760.
Dibb, J.E., Whitlow, S.I., 1996. Recent climate anomalies and
their impact on snow chemistry at South Pole, 1987–1994.
Geophysical Research Letters 23, 1115–1118.
Dibb, J.E., Jaffrezo, J.-L., Legrand, M., 1992. Initial findings of
recent investigations of air–snow relationships in the
Summit Region of Greenland. Journal of Atmospheric
Chemistry 14, 167–180.
Dibb, J.E., Talbot, R.W., Bergin, M.H., 1994. Soluble acidic
species in air and snow at Summit, Greenland. Geophysical
Research Letters 21, 1627–1630.
Dibb, J.E., Talbot, R.W., Munger, J.W., Jacob, D.J., Fan,
S.M., 1998. Air–snow exchange of HNO3 and NOY at
Summit, Greenland. Journal of Geophysical Research 103,
3475–3486.
Dibb, J.E., Arsenault, M., Peterson, M.C., Honrath, R.E.,
2002. Fast nitrogen oxide photochemistry in Summit,
Greenland Snow. Atmospheric Environment 36, 2501–2511.
Dubowski, Y., Colussi, A.J., Hoffmann, M.R., 2001. Nitrogen
dioxide release in the 302 nm band photolysis of spray-
frozen aqueous nitrate solutions. Atmospheric implications.
Journal of Physical Chemistry A 105, 4928–4932.
Dubowski, Y., Colussi, A.J., Boxe, C., Hoffmann, M.R., 2002.
Monotonic increase of nitrite yields in the photolysis of
nitrate in ice and water between 238 and 294K. Journal of
Physical Chemistry A 106, 6967–6971.
Ford, K.M., Campbell, B.M., Shepson, P.B., Bertman, S.B.,
Honrath, R.E., Peterson, M., Dibb, J.E., 2002. Studies of
peroxyacetyl nitrate (PAN) and its interaction with the
ARTICLE IN PRESSJ.E. Dibb et al. / Atmospheric Environment 38 (2004) 5399–5409 5409
snowpack at Summit, Greenland. Journal of Geophysical
Research, 10.1029/2001JD000547, 30 May 2002.
Honrath, R.E., Peterson, M.C., Guo, S., Dibb, J.E., Shepson,
P.B., Campbell, B., 1999. Evidence of no production within
or upon ice particles in the Greenland Snowpack. Geophy-
sical Research Letters 26, 695–698.
Honrath, R., Guo, S., Peterson, M., Dziobak, M., Dibb, J.,
Arsenault, M., 2000. Photochemical production of gas
phase NOx from ice crystal NO3�. Journal of Geophysical
Research 24, 183-24, 190.
Honrath, R., Peterson, M.C., Lu, Y., Dibb, J.E., Arsenault,
M.A., Cullen, N.J., Steffen, K., 2002. Vertical fluxes of
nitrogen oxides above the snowpack at Summit, Greenland.
Atmospheric Environment 36, 2629–2640.
Huey, L.G., Tanner, D.J., Slusher, D.L., Dibb, J.E., Arimoto,
R., Chen, G. et al., this issue. CIMS measurements of HNO3
and SO2 at the South Pole during ISCAT 2000. Atmo-
spheric Environment, doi:10.1016/j.atmosenv.2004.04.037.
Jacobi, H.-W., Frey, M.M., Hutterli, M.A., Bales, R.C.,
Schrems, O., Cullen, N.J., Steffen, K., Koehler, C., 2002.
Long-term measurements of hydrogen peroxide and for-
maldehyde exchange between the atmosphere and surface
snow. Atmospheric Environment 36, 2619–2628.
Jones, A.E., Weller, R., Wolff, E.W., Jacobi, H.-W., 2000.
Speciation and rate of photochemical NO and NO2
production in Antarctic snow. Geophysical Research
Letters 27, 345–348.
Jones, A.E., Weller, R., Anderson, P.S., Jacobi, H.-W., Wolff,
E.W., Schrems, O., Miller, H., 2001. Measurements of NOx
emissions from the Antarctic snowpack. Geophysical
Research Letters 28, 1499–1502.
Leibrock, E., Huey, L.G., 2000. Ion chemistry for the detection
of isoprene and other volatile organic compounds in
ambient air. Geophysical Research Letters 27, 1719–1722.
Mauldin III, R.L., Eisele, F.L., Tanner, D.J., Kosciuch, E.,
Shetter, R., Lefer, B., Hall, S.R., Nowak, J.B., Buhr, M.,
Chen, G., Wang, P., Davis, D., 2001. Measurements of OH,
H2SO4 and MSA at the South Pole during ISCAT.
Geophysical Research Letters 28, 3629–3632.
Oncley, S.P., Buhr, M., Lenschow, D.H., Davis, D., Semmer,
S.R., this issue. Observations of summertime NO fluxes and
boundary layer height at the South Pole during ISCAT 2000
using scalar similarity. Atmospheric Environment,
doi:10.1016/j.atmosenv.2004.05.053.
Ridley, B., Walega, J., Montzka, D., Grahek, F., Atlas, E.,
Flocke, F., Stroud, V., Deary, J., Gallant, A., Boudries, H.,
Bottenheim, J., Anlauf, K., Worthy, D., Sumner, A.L.,
Shepson, P., 2000. Is the Arctic surface layer a source and
sink of NOX in winter/spring? Journal of Atmospheric
Chemistry 36, 1–22.
Slusher, D.L., Pitteri, S.J., Haman, B.J., Tanner, D.J., Huey,
L.G., 2001. A chemical ionization technique for measure-
ment of pernitric acid in the upper troposphere and the
polar boundary layer. Geophysical Research Letters 28,
3875–3878.
Slusher, D.L., Huey, L.G., Tanner, D.J., Chen, G., Davis,
D.D., Buhr, M., Eisele, F.L., Kosciuch, Mauldin, R.L.,
Lefer, B.L., Shetter, R.E., Dibb, J.E., 2002. Measurements
of pernitric acid at the South Pole during ISCAT 2000.
Geophysical Research Letters, 29,2011, doi:10.1029/
2002GL015703.
Sumner, A.L., Shepson, P.B., 1999. Snowpack production of
formaldehyde and its effect on the Arctic troposphere.
Nature 398, 230–233.
Swanson, A.L., Blake, N.J., Blake, D.R., Rowland, F.S., Dibb,
J.E., 2002. Photochemically induced production of CH3Br,
CH3I, C2H5I, ethene and propene within surface snow.
Atmospheric Environment 36, 2671–2682.
Whitlow, S.I., Mayewski, P.A., Dibb, J.E., 1992. A comparison
of major chemical species seasonal concentration and
accumulation at South Pole and Summit, Greenland.
Atmospheric Environment 26A, 2045–2054.
Yang, J., Honrath, R.E., Peterson, M.C., Dibb, J.E., Sumner,
A.-L., Shepson, P.B., Frey, M., Jacobi, H.-W., Swanson, A.,
Blake, N., 2002. Impact of snowpack photochemistry on
HOx levels at Summit, Greenland. Atmospheric Environ-
ment 36, 2523–2534.
Zhou, X., Beine, H.J., Honrath, R.E., Fuentes, J.D., Simpson,
W., Shepson, P.B., Bottenheim, J.W., 2001. Snowpack
photochemical production of HONO: a major source of oh
in the Arctic boundary layer in spring time. Geophysical
Research Letters 28, 4087–4090.
Copyright © 2022 FDOKUMEN