Solid-state fermentation of agro-industrial wastes to produce bioorganic fertilizer for the...
11
Solid-state fermentation of agro-industrial wastes to produce bioorganic fertilizer for the biocontrol of Fusarium wilt of cucumber in continuously cropped soil Lihua Chen 1 , Xingming Yang 1 , Waseem Raza, Jia Luo, Fengge Zhang, Qirong Shen ⇑ Jiangsu Key Laboratory for Solid Organic Waste Utilization, Nanjing Agricultural University, Nanjing 210095, China article info Article history: Received 16 August 2010 Received in revised form 30 November 2010 Accepted 30 November 2010 Available online 6 December 2010 Keywords: Cattle dung Vinegar-production residue Trichoderma harzianum 6-Pentyl-a-pyrone High value-added abstract Agro-industrial wastes of cattle dung, vinegar-production residue and rice straw were solid-state fer- mented by inoculation with Trichoderma harzianum SQR-T037 (SQR-T037) for production of bioorganic fertilizers containing SQR-T037 and 6-pentyl-a-pyrone (6PAP) to control Fusarium wilt of cucumber in a continuously cropped soil. Fermentation days, temperature, inoculum and vinegar-production residue demonstrated significant effects on the SQR-T037 biomass and the yield of 6PAP, based on fractional fac- torial design. Three optimum conditions for producing the maximum SQR-T037 biomass and 6PAP yield were predicted by central composite design and validated. Bioorganic fertilizer containing 8.46 log 10 ITS copies g 1 dry weight of SQR-T037 and 1291.73 mg kg 1 dry weight of 6PAP, and having the highest (p < 0.05) biocontrol efficacy, was achieved at 36.7 fermentation days, 25.9 °C temperature, 7.6% inocu- lum content, 41.0% vinegar-production residue, 20.0% rice straw and 39.0% cattle dung. This is a way to offer a high value-added use for agro-industrial wastes. Ó 2010 Elsevier Ltd. All rights reserved. 1. Introduction Agro-industrial organic wastes have caused acute environmen- tal problems throughout the world, in both developed and devel- oping countries. China issued its First National Census of Pollution Sources on 6 February 2010 (Ministry of Environmental Protection of the PR China et al., 2010), which demonstrated that the over 0.4 billion tons of organic wastes from animal production produced annually had become a major source of environmental pollution in China. Organic wastes from animal production pollute the water of key rivers and lake basins (Chaohu Lake, Taihu Lake, Dianchi Lake and Three Gorges Reservoir Area) with 0.4575 million tons of total nitrogen and 0.09 million tons of total phosphorus annually. This amount is 2.48 times the total phosphorus from agricultural cropping industry and 2.42 times of total phosphorus from domestic sewage. The food industry of China also produces many organic wastes. Vinegar is a popular traditional condiment in China, and about 3.0 million tons of vinegar-production residue is produced each year. The disposal of this residue is complicated by its low pH and high cellulose and lignin contents. Converting vinegar-production residue into animal feed is energy intensive, while disposing of it in landfills has the potential for leakage caus- ing groundwater pollution (Yang et al., 2009). Cucumber (Cucumis sativus L.) is an important vegetable world- wide. However, Fusarium wilt of cucumber, caused by the patho- gen Fusarium oxysporum f. sp. cucumerinum, causes a great yield loss both in continuously cropped soils and protective production systems. It is the major limiting factor for cucumber production in China (Chen et al., 2010; Shen et al., 2008). Members of the genus Trichoderma have been used extensively against different plant pathogens (Harman et al., 2004). Antibiosis is believed to be one of the most effective mechanisms involved in disease con- trol by the Trichoderma spp. Many antibiotic metabolites have been identified from the culture of Trichoderma spp. and have been shown to have antagonistic effects on different species of microor- ganisms, both on their proliferation and metabolism in vitro and in practical applications (El-Hasan et al., 2008; Reino et al., 2008). Trichoderma colony-forming units and antibiotic metabolite contents were major factors in successful biocontrol (Weaver and Kenerley, 2005). The unsaturated D-lactone, 6-pentyl-a-pyrone (6PAP), with a strong, coconut-like aroma, was produced by Trich- oderma spp. at concentrations as high as 1.2 g l 1 in liquid culture (Bonnarme et al., 1997). This compound showed broad-spectrum antimicrobial characteristics against species such as Rhizoctonia solani, F. oxysporum f. sp. lycopersici (Scarselletti and Faull, 1994), Botrytis cinerea (Pezet et al., 1999) and Fusarium moniliforme (El-Hasan et al., 2008). In addition, Trichoderma spp. have demon- strated a high capacity to decompose cellulose and lignocellulose (Haddadin et al., 2009; Martins et al., 2008). The solid-state fermentation of agro-industrial waste with Trichoderma spp. to form a bioorganic fertilizer is a promising 0960-8524/$ - see front matter Ó 2010 Elsevier Ltd. All rights reserved. doi:10.1016/j.biortech.2010.11.126 ⇑ Corresponding author. Tel./fax: +86 025 84396291. E-mail address: [email protected] (Q. Shen). 1 Both authors are equally contributed to the paper. Bioresource Technology 102 (2011) 3900–3910 Contents lists available at ScienceDirect Bioresource Technology journal homepage: www.elsevier.com/locate/biortech
Transcript of Solid-state fermentation of agro-industrial wastes to produce bioorganic fertilizer for the...

Bioresource Technology 102 (2011) 3900–3910
Contents lists available at ScienceDirect
Bioresource Technology
journal homepage: www.elsevier .com/locate /bior tech
Solid-state fermentation of agro-industrial wastes to produce bioorganic fertilizerfor the biocontrol of Fusarium wilt of cucumber in continuously cropped soil
Lihua Chen 1, Xingming Yang 1, Waseem Raza, Jia Luo, Fengge Zhang, Qirong Shen ⇑Jiangsu Key Laboratory for Solid Organic Waste Utilization, Nanjing Agricultural University, Nanjing 210095, China
a r t i c l e i n f o a b s t r a c t
Article history:Received 16 August 2010Received in revised form 30 November 2010Accepted 30 November 2010Available online 6 December 2010
Keywords:Cattle dungVinegar-production residueTrichoderma harzianum6-Pentyl-a-pyroneHigh value-added
0960-8524/$ - see front matter � 2010 Elsevier Ltd. Adoi:10.1016/j.biortech.2010.11.126
⇑ Corresponding author. Tel./fax: +86 025 8439629E-mail address: [email protected] (Q. Shen)
1 Both authors are equally contributed to the paper.
Agro-industrial wastes of cattle dung, vinegar-production residue and rice straw were solid-state fer-mented by inoculation with Trichoderma harzianum SQR-T037 (SQR-T037) for production of bioorganicfertilizers containing SQR-T037 and 6-pentyl-a-pyrone (6PAP) to control Fusarium wilt of cucumber ina continuously cropped soil. Fermentation days, temperature, inoculum and vinegar-production residuedemonstrated significant effects on the SQR-T037 biomass and the yield of 6PAP, based on fractional fac-torial design. Three optimum conditions for producing the maximum SQR-T037 biomass and 6PAP yieldwere predicted by central composite design and validated. Bioorganic fertilizer containing 8.46 log10 ITScopies g�1 dry weight of SQR-T037 and 1291.73 mg kg�1 dry weight of 6PAP, and having the highest(p < 0.05) biocontrol efficacy, was achieved at 36.7 fermentation days, 25.9 �C temperature, 7.6% inocu-lum content, 41.0% vinegar-production residue, 20.0% rice straw and 39.0% cattle dung. This is a wayto offer a high value-added use for agro-industrial wastes.
� 2010 Elsevier Ltd. All rights reserved.
1. Introduction
Agro-industrial organic wastes have caused acute environmen-tal problems throughout the world, in both developed and devel-oping countries. China issued its First National Census ofPollution Sources on 6 February 2010 (Ministry of EnvironmentalProtection of the PR China et al., 2010), which demonstrated thatthe over 0.4 billion tons of organic wastes from animal productionproduced annually had become a major source of environmentalpollution in China. Organic wastes from animal production pollutethe water of key rivers and lake basins (Chaohu Lake, Taihu Lake,Dianchi Lake and Three Gorges Reservoir Area) with 0.4575 milliontons of total nitrogen and 0.09 million tons of total phosphorusannually. This amount is 2.48 times the total phosphorus fromagricultural cropping industry and 2.42 times of total phosphorusfrom domestic sewage. The food industry of China also producesmany organic wastes. Vinegar is a popular traditional condimentin China, and about 3.0 million tons of vinegar-production residueis produced each year. The disposal of this residue is complicatedby its low pH and high cellulose and lignin contents. Convertingvinegar-production residue into animal feed is energy intensive,while disposing of it in landfills has the potential for leakage caus-ing groundwater pollution (Yang et al., 2009).
ll rights reserved.
1..
Cucumber (Cucumis sativus L.) is an important vegetable world-wide. However, Fusarium wilt of cucumber, caused by the patho-gen Fusarium oxysporum f. sp. cucumerinum, causes a great yieldloss both in continuously cropped soils and protective productionsystems. It is the major limiting factor for cucumber productionin China (Chen et al., 2010; Shen et al., 2008). Members of thegenus Trichoderma have been used extensively against differentplant pathogens (Harman et al., 2004). Antibiosis is believed tobe one of the most effective mechanisms involved in disease con-trol by the Trichoderma spp. Many antibiotic metabolites have beenidentified from the culture of Trichoderma spp. and have beenshown to have antagonistic effects on different species of microor-ganisms, both on their proliferation and metabolism in vitro and inpractical applications (El-Hasan et al., 2008; Reino et al., 2008).Trichoderma colony-forming units and antibiotic metabolitecontents were major factors in successful biocontrol (Weaver andKenerley, 2005). The unsaturated D-lactone, 6-pentyl-a-pyrone(6PAP), with a strong, coconut-like aroma, was produced by Trich-oderma spp. at concentrations as high as 1.2 g l�1 in liquid culture(Bonnarme et al., 1997). This compound showed broad-spectrumantimicrobial characteristics against species such as Rhizoctoniasolani, F. oxysporum f. sp. lycopersici (Scarselletti and Faull, 1994),Botrytis cinerea (Pezet et al., 1999) and Fusarium moniliforme(El-Hasan et al., 2008). In addition, Trichoderma spp. have demon-strated a high capacity to decompose cellulose and lignocellulose(Haddadin et al., 2009; Martins et al., 2008).
The solid-state fermentation of agro-industrial waste withTrichoderma spp. to form a bioorganic fertilizer is a promising

L. Chen et al. / Bioresource Technology 102 (2011) 3900–3910 3901
agro-industrial waste management strategy. The bioorganic fertil-izer has been shown to promote the accumulation of antibioticmetabolites, maintain the vitality of Trichoderma spp. in the rhizo-sphere and enhance biocontrol efficacy (Binod et al., 2007; Harmanet al., 2004). Following these observations, a study using responsesurface methodology was planned to optimize the process of solid-state fermentation of cattle dung, vinegar-production residue andrice straw with Trichoderma harzianum SQR-T037 (CGMCC Acces-sion No.: 3175, China General Microbiology Culture CollectionCenter and Chinese Patent Application No. 200910233576.1) toproduce bioorganic fertilizer with high biocontrol efficacy of Fusar-ium wilt of cucumber in continuously cropped soil.
2. Methods
2.1. Microorganism
Trichoderma harzianum SQR-T037 (SQR-T037) from the JiangsuKey Laboratory for Organic Solid Waste Utilization, Nanjing Agri-culture University, Nanjing, China was cultured on potato dextroseagar (PDA) and kept at 4 �C.
2.2. Solid-state fermentation preparation
The SQR-T037 conidial suspension was prepared by rinsing a 10-day-old culture of SQR-T037 grown on PDA with sterile 0.05%Tween-80 (Sigma–Aldrich, St Louis, USA) and filtering through fourlayers of sterile cheesecloth into a sterile container. Hemocytometercounts of the conidial suspension estimated its concentration at7.22 � 108 conidia ml�1.
Different ratios of vinegar-production residue (JiangsuHengShun Group Co., Ltd., China) and rice straw comminuted intoapproximately 3-mm pieces with a disintegrator (Beijing KingshiliTechnology Development Co., Ltd., Beijing, China) and SQR-T037conidial suspension were added to cattle dung (Mengniu Dairy(Group) Co., Ltd., China) and thoroughly mixed by passing througha 5-mm sieve for three times. The mixtures (50 g) were put into250-ml flasks for solid-state fermentation and sealed with Parafilm(Pechiney Plastic Packaging, Chicago, USA) to diminish the evapo-ration of the water while permitting the exchange of air. Propertiesof the three agro-industrial organic wastes are shown in Table 1.
2.3. Extraction, identification and quantification of 6PAP
Fermentation samples were extracted by adding 50 ml metha-nol to the 10 g of solid substrate material. The samples wereblended with a rotator at 170 rpm for 1 h so that no lumps ofmycelium or substrate remained and then allowed to stand for4 h. Each sample was extracted three times and filtered throughWhatman filter paper (Grade 595, Whatman International, Ltd.,Maidstone, UK). The solvent was dried over anhydrous sodium sul-fate and then evaporated under vacuum in a rotary evaporator at15 �C. Five milliliters aliquots of the residues (crude extracts) werefiltered through 0.45-lm filter paper (25-mm GD/X, Whatman).
The extracts were submitted to Agilent 1200 semi-preparativeHPLC (Santa Clara, USA), using a ZORBAX Eclipse XDB-C18 analytical
Table 1Properties of the three organic wastes.
Organic wastes pH Water content(%)
Total N(%)
Total C(%)
C/N
Cattle dung 7.9 81.61 2.16 40.98 18.97Vinegar-production
residue4.5 73.56 2.51 37.88 15.09
Rice straw – 2.59 0.93 46.79 50.31
reversed-phase column (4.6 � 250 mm, 5 lm) and detected at300 nm. The elution method of Pezet et al. (1999) was used, and6PAP was quantified by comparison with a standard curve of pure6PAP at concentrations of 0.1, 0.5, 1.0 and 2.0 mg ml�1.
The identification of 6PAP was performed by mass spectrometry(Agilent 6430 Triple Quadrupole LC/MS) and 1H NMR and 13C NMRspectra (Bruker-400 MHz).
2.4. Quantitative analysis of T. harzianum SQR-T037 with Real-TimePCR
The total DNA from the fermentation samples was extractedaccording to the protocol prescribed for the E.Z.N.A.� Soil DNAKit (Omega Bio-Tek, Inc., Colorado, USA). The SQR-T037 ITS regionswere amplified in a Real-Time PCR assay using primers designed byLópez-Mondéjar et al. (2010) and detected with the probe ITS1TM-37 Fam: 50-FAM-AACTCTTTTTGTATACCCCCTCGCGGGT-TMR-30
(FAM: 6-carboxyfluorescein, TAMRA: 6-carboxy-tetramethylrhod-amine), which was modified from that described byLópez-Mondéjar et al. (2010). Reactions were performed in a50-ll final volume containing: Premix Ex Taq™ (Takara Bio Inc.,Japan), 1.0 ll 10 lM primers, 1.0 ll ITS1 TM-37 10 pM probe,1.0 ll ROX Reference Dye II (50�), 4 ll genomic DNA and 16 llsterile distilled water. The PCR was run in an ABI PRISM 7500Real-Time PCR System (Applied Biosystems, Foster City, CA, USA)using the following standard program: 30 s at 95 �C for the initialdenaturing followed by 40 cycles of 3 s at 95 �C and 40 s at 60 �Cfor extension. A standard curve was developed as described byLópez-Mondéjar et al. (2010).
2.5. Fractional factorial design
The ratios of rice straw and vinegar-production residue to thefermentation substrate (mixture of rice straw, vinegar-productionresidue and cattle dung), the SQR-T037 inoculum content, the fer-mentation temperature, the frequency of the agitation and thenumber of fermentation days were selected as the six main vari-ables for the experimental design. The experimental design ofcoded levels and actual levels for fractional factorial design isshown in Table 2. According to the 2-level, 6-variables concept, a26�2 design consisting of 16 factorial runs, along with 5 otherexperiments at the center of the design, was carried out. The fiveruns of the center points were used to estimate the experimentalerror and to check the adequacy of the model. The significancewas determined at the 95% confidence level (p < 0.05), and the re-sults were calculated using the following equation (1):
Y ¼ b0 þXk
i
bivi þXX
i<j
bijvivj þ e; ð1Þ
where Y is the response, b0 is the intercept of the plane, bi is the lin-ear coefficient, bij is the interaction coefficient, vi and vj are codedlevels of variables and e is the error term. The experiments were de-signed using the software Design Expert Version 7.0.0 (Stat Ease,Minneapolis, MN, USA).
2.6. Central composite design
Four significant factors (the number of fermentation days, fer-mentation temperature, inoculum content and amount of vine-gar-production residue) identified by the fractional factorialdesign were selected as main variables. A central composite designbased on the response surface method, including a full 24 factorialdesign, six replications of the center points, and eight axial points,was employed to illustrate the response behavior in the optimumregion. The axial distance was chosen as 2 to make this design

Table 2Fractional factorial design of variables (coded and actual levels) with SQR-T037 biomass and 6PAP yield as responses.
Run Experimental factorsa Responses
Coded level Actual level SQR-T037 biomass(log10 ITSC g�1 DWb)
6PAP yield(mg kg�1 DW)
v1 v2 v3 v4 v5 v6 X1 X2 X3 X4 X5 X6
1 �1 �1 �1 �1 �1 �1 20 20 2 30 10 4 4.12 622.722 1 �1 �1 �1 1 �1 45 20 2 30 30 4 6.42 713.233 �1 1 �1 �1 1 1 20 30 2 30 30 10 4.38 711.224 1 1 �1 �1 �1 1 45 30 2 30 10 10 7.02 1058.115 �1 �1 1 �1 1 1 20 20 10 30 30 10 7.28 939.896 1 �1 1 �1 �1 1 45 20 10 30 10 10 7.80 970.997 �1 1 1 �1 �1 �1 20 30 10 30 10 4 7.58 883.838 1 1 1 �1 1 �1 45 30 10 30 30 4 8.25 1123.029 �1 �1 �1 1 �1 1 20 20 2 50 10 10 3.83 993.69
10 1 �1 �1 1 1 1 45 20 2 50 30 10 6.73 962.8811 �1 1 �1 1 1 �1 20 30 2 50 30 4 3.68 824.3412 1 1 �1 1 �1 �1 45 30 2 50 10 4 7.31 1170.9513 �1 �1 1 1 1 �1 20 20 10 50 30 4 7.02 1069.5114 1 �1 1 1 �1 �1 45 20 10 50 10 4 7.88 1092.8715 �1 1 1 1 �1 1 20 30 10 50 10 10 6.82 882.5116 1 1 1 1 1 1 45 30 10 50 30 10 8.00 1110.3717 0 0 0 0 0 0 32.5 25 6 40 20 7 8.22 1167.9618 0 0 0 0 0 0 32.5 25 6 40 20 7 8.32 1123.3419 0 0 0 0 0 0 32.5 25 6 40 20 7 8.02 1169.7220 0 0 0 0 0 0 32.5 25 6 40 20 7 8.12 1115.4721 0 0 0 0 0 0 32.5 25 6 40 20 7 8.20 1117.39
a X1, fermentation days (d); X2, temperature (�C); X3, inoculum content (%, v/w); X4, vinegar-production residue (%, w/w); X5, rice straw (%, w/w); and X6, agitationfrequency (d).
b DW, dry weight.
3902 L. Chen et al. / Bioresource Technology 102 (2011) 3900–3910
rotatable. Other non-significant factors were held at the centralpoint of the central composite design. The behavior of the systemwas explained by the following second-degree polynomial equa-tion (2):
Y ¼ b0þXk
i¼1
bivi þXk
i¼1
biiv2i þ
XX
i<j
bijvivj þ e; ð2Þ
where Y is the response, b0 is a constant, bi is the linear coefficient,bij is the second-order coefficient, bii is the quadratic coefficient andvi and vj are the coded independent variables. The statistical signif-icance of the model was determined by Fischer’s test. The fit of theregression model was checked by the adjusted coefficient of deter-mination R2. The response surface plots were generated usingDesign Expert Version 7.0.0.
2.7. Experimental validation of the optimized condition
Optimized quantities of cattle dung, vinegar-production resi-due, rice straw and SQR-T037 inoculum (7.22 � 108 conidia ml�1)were thoroughly mixed, as described above. Five hundred gramsof these mixtures were loaded into 1-l flasks and sealed with Para-film for the validation of the optimized conditions. The solid-statefermentation was carried out at optimized temperatures in anincubator (Shanghai XinMiao Medical Instrument Co., Ltd., China).The fermenting mixtures were agitated every 7 days by dumpingout the flask contents and crumbling the cakes of mycelia and sub-strate by hands.
The products with the highest predicted yields of SQR-T037 bio-mass, 6PAP and both were named as bioorganic fertilizer BIO I, BIOII and BIO III, respectively. The SQR-T037 biomass and 6PAP con-tent were determined as described above.
2.8. Verification of the biocontrol efficacy of the bioorganic fertilizersagainst Fusarium wilt of cucumber in continuously cropped soil
Soils in which cucumbers were grown for five continuous crop-ping years were collected from Jinhua, Zhejiang Province, China,
and characterized. The soils had 40.28 mg g�1 organic matter con-tent, 2.66 mg g�1 total nitrogen, 2.09 mg g�1 total phosphorus, pH5.3, 660 mg g�1 clay particles of size > 0.01 mm, 340 mg g�1 clayparticles of size < 0.01 mm and 2.69 log10 ITS copies g�1 dry soilof F. oxysporum. The incidence of Fusarium wilt in the last seasonhad been as high as 71.3%. The pot experiments consisted of six dif-ferent treatments: the fertilizers, BIO I, BIO II and BIO III, and thechemical fungicides, Hymexazol (96% active content, ShandongTianda Bio-pharmacy Co., Ltd., Shandong, China) and Carbendazim(wettable power with 50% active content, Jiangyin ChaochenIndustry Co., Ltd., Jiangsu, China), and a control. In the pot experi-ments, five cucumber seedlings with four leaves were transplantedinto each pot (9.5 cm in diameter and 10 cm in height) containing300 g of soil. Six treatments with five replicates were designed asfollows:
1. Control;2. BIO I (soil to which 1% (w/w) BIO I was added);3. BIO II (soil to which 1% (w/w) BIO II was added);4. BIO III (soil to which 1% (w/w) BIO III was added);5. Hymexazol (soil to which 0.1% (w/w) Hymexazol was
added);6. Carbendazim (soil to which 0.2% (w/w) Carbendazim was
added).
The pot experiments were conducted in the greenhouse atJune–July, with temperatures of 21–35 �C (day) and 18–25 �C(night) and a natural photoperiod. The cucumber plants were wa-tered daily. The experiment was repeated twice.
The development of Fusarium wilt in cucumber plants was as-sessed 25 days after transplantation. Wilt development in eachcucumber plant was rated on a 5-point scale (Chen et al., 2010):0 (whole plant healthy); 1 (<10% of leaves wilted); 2 (11–20% ofleaves wilted); 3 (21–50% of leaves wilted); 4 (50–100% of leaveswilted); and 5 (whole plant dead). The disease incidence was trans-formed into a Percentage Disease Index (PDI) for use in an analysisof variance. The disease incidences were calculated based on thefollowing formula (4):
L. Chen et al. / Bioresource Technology 102 (2011) 3900–3910 3903
Percentage Disease Index
¼PðRating � Number of plants ratedÞ
Total number of plants � Highest rating� 100%: ð3Þ
The means and standard deviation of the PDIs of the cucumberplants were calculated and statistically analyzed using analysis ofvariance (ANOVA) and Duncan’s multiple range tests if a significantdifference was detected (p < 0.05). SPSS Version 13.0, was used forstatistical analysis (SPSS Inc., Chicago, IL, USA).
2.9. Changes in the SQR-T037 biomass and 6PAP content during thestorage of the bioorganic fertilizer
The bioorganic fertilizer was packaged in plastic bags tied shutand kept at 15 �C. The contents of the active components, SQR-T037 biomass and 6PAP, were determined as described above onthe 5th, 15th, 30th, 60th, 90th, 120th and 150th days of storage.
3. Results and discussion
3.1. Quantitative analysis of SQR-T037 with Real-Time PCR
The classical technique of counting colony-forming units onagar plates is excellent for static quantification of T. harzianum(Williams et al., 2003), but it is not suitable for quantificationduring the dynamic growth process of different model strains ofT. harzianum (data from International Sub-commission on Tricho-derma and Hypocrea Taxonomy). This technique is also unable todifferentiate colonies derived from actively growing hyphae orfrom quiescent spores (conidia and chlamydospores) (Thornton,2008). In contrast to biomass measures of fungal components(e.g., chitin, ergosterol or fatty acids) or monoclonal antibody tech-nology, the Real-Time PCR technique is faster and more sensitive(López-Mondéjar et al., 2010). The PCR primer set amplified thegenomic DNA fragment from SQR-T037 well. The probe ITS1 TM-37, modified from a probe used in a different strain of T. harzianum,T-78 (López-Mondéjar et al., 2010), worked well in SQR-T037
Fig. 1. Amplification plots (kinetics of fluorescence signal) of 10-fold diluted SQR-T037 ITITSCs on the right side.
quantification (Fig. 1). The standard curve was made by plottingthe cycle thresholds against the logarithm of the initial numberof target ITS copies (ITSC) with an efficiency of 3.141.
3.2. Identification and quantification of 6PAP from the product of solid-state fermentation
The main HPLC peak with a retention time of 21.35 min wasanalyzed by MS. The full scan of the compound by MS showedprominent ions of 6PAP at m/z 167.10 [M+H]+, 189.10 [M+Na]+
and 355.20 [M+M+Na]+. MS–MS analysis of the parent molecularion at m/z 167.10 showed prominent ion fragment peaks at m/z126.80, 121.90, 97.00, 82.00, 66.80 and 55.20.
Analysis of the 1H NMR (400 MHz, CDCl3) spectrum of 0.90 ppm(3H, C-11), 1.66 ppm (2H, C-10), 1.33 ppm (4H, C-9 and C-8) and2.48 ppm (2H, C-7) indicated the existence of a normal aliphaticchain. Otherwise, the spectrum contained signals for vinyl protonsat 5.98 ppm (1H, C-5), 6.14 ppm (1H, C-3) and 7.27 ppm (1H, C-4)and showed a double peak. Data of 1C NMR (400 MHz, CDCl3) were:d 13.85, 22.25, 26.52, 31.09, 33.73, 102.68, 112.94, 143.89, 163.01and 166.74. Analysis of the metabolite’s NMR spectral propertiesshowed that they were in good agreement with those reported inthe literature for naturally occurring 6-pentyl-a-pyrone(Bonnarme et al., 1997; Cutler et al., 1986).
3.3. Fractional factorial design
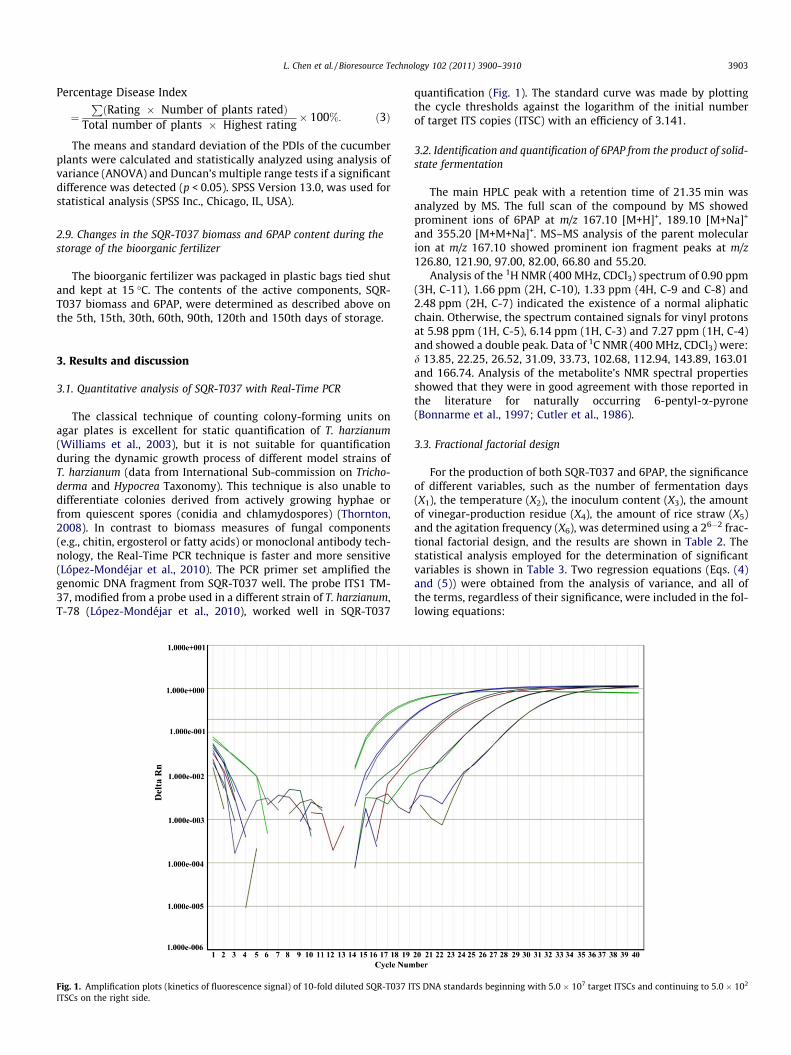
For the production of both SQR-T037 and 6PAP, the significanceof different variables, such as the number of fermentation days(X1), the temperature (X2), the inoculum content (X3), the amountof vinegar-production residue (X4), the amount of rice straw (X5)and the agitation frequency (X6), was determined using a 26�2 frac-tional factorial design, and the results are shown in Table 2. Thestatistical analysis employed for the determination of significantvariables is shown in Table 3. Two regression equations (Eqs. (4)and (5)) were obtained from the analysis of variance, and all ofthe terms, regardless of their significance, were included in the fol-lowing equations:
S DNA standards beginning with 5.0 � 107 target ITSCs and continuing to 5.0 � 102
Table 3Fractional factorial design determined effects of various factors on SQR-T037 biomass and 6PAP yield.
Sourcea SQR-T037 biomassb 6PAP yieldc
Sum of squares df Mean square F-value p-valueProb > F
Sum of squares df Mean square F-value p-valueProb > F
Model 37.282 13 2.868 162.55 <0.0001** 3.97E+05 13 3.05E+04 40.08 <0.0001**
X1 13.497 1 13.497 765.01 <0.0001** 1.02E+05 1 1.02E+05 133.42 <0.0001**
X2 0.241 1 0.241 13.68 0.0101* 9.93E+03 1 9.93E+03 13.04 0.0112*
X3 18.407 1 18.407 1043.28 <0.0001** 6.45E+04 1 6.45E+04 84.73 <0.0001**
X4 0.157 1 0.157 8.91 0.0245* 7.35E+04 1 7.35E+04 96.50 <0.0001**
X5 0.023 1 0.023 1.28 0.3018 3.06E+03 1 3.06E+03 4.02 0.0919X6 0.010 1 0.010 0.54 0.4902 1.04E+03 1 1.04E+03 1.37 0.2862X1X2 0.147 1 0.147 8.35 0.0277* 6.84E+04 1 6.84E+04 89.91 <0.0001**
X1X3 4.253 1 4.253 241.08 <0.0001* 3.35E+03 1 3.35E+03 4.41 0.0806X1X4 0.379 1 0.379 21.48 0.0036* 1.24E+03 1 1.24E+03 1.62 0.2496X1X5 0.024 1 0.024 1.36 0.2881 1.86E+04 1 1.86E+04 24.45 0.0026**
X1X6 0.003 1 0.003 0.18 0.6895 9.71E+02 1 9.71E+02 1.28 0.3019X2X4 0.102 1 0.102 5.76 0.0533 2.72E+04 1 2.72E+04 35.78 0.0010**
X2X6 0.040 1 0.040 2.26 0.1839 2.32E+04 1 2.32E+04 30.46 0.0015**
Curvature 10.565 1 10.565 598.84 <0.0001* 1.42E+05 1 1.42E+05 186.70 <0.0001**
Residual 0.106 6 0.018 4.57E+03 6 7.61E+02Lack of fit 0.055 2 0.027 2.16 0.2317 1.52E+03 2 7.60E+02 0.997 0.4454Pure error 0.051 4 0.013 3.05E+03 4 7.62E+02Cor. total 47.953 20 5.43E+05 20
R2 = 0.9886, Adj R2 = 0.9639 for model of 6PAP yield.a X1, fermentation days (d); X2, temperature (�C); X3, inoculum content (%, v/w); X4, vinegar-production residue (%, w/w); X5, rice straw (%, w/w); and X6, agitation
frequency (d).b log10 ITSC g�1 DW.c mg kg�1 DW.
* Significant at p < 0.05.** Highly significant at p < 0.001.
3904 L. Chen et al. / Bioresource Technology 102 (2011) 3900–3910
Y1ðSQR-T037 biomassÞ ¼ 6:509þ 0:918v1 þ 0:123v2 þ 1:073v3
� 0:099v4 � 0:038v5 � 0:024v6
þ 0:096v1v2 � 0:516v1v3 þ 0:154v1v4
� 0:039v1v5 � 0:014v1v6 � 0:080v2v4
� 0:050v2v6; ð4Þ
Y2ð6PAP yieldÞ ¼ 945:633þ 79:670v1 þ 24:910v2 þ 63:491v3
þ 67:756v4 � 13:825v5 þ 8:074v6
þ 65:400v1v2 � 14:480v1v3 � 8:791v1v4
� 34:102v1v5 � 7:789v1v6 � 41:258v2v4
� 38:066v2v6: ð5Þ
The F-value of 162.55 and the p-value of <0.0001 for the modelof SQR-T037 biomass and the F-value of 40.08 and the p-valueof <0.0001 for the model of 6PAP yield showed the significance ofthe model. The ‘‘Pred R2’’ values of 0.9251 and 0.8123 agreed rea-sonably well with the ‘‘Adj R2’’ values of 0.9910 and 0.9639, respec-tively, demonstrating that the model fit well with the results of thefractional factorial design. The variables with probability values ofless than 0.05, i.e., fermentation days, temperature, inoculum con-tent and vinegar-production residue, were considered as signifi-cant factors. In addition, the ‘‘Curvature F-values’’ of 598.84 and186.70 imply that there is a significant curvature (as measuredby the difference between the average of the center points andthe average of the factorial points) in the design space. Therefore,there was no need to do a steepest-ascent experiment.
3.4. Optimization using a central composite design
Based on the results of the experiment with the initial fractionalfactorial design, a further optimization of the fermentation days(X1), the temperature (X2), the inoculum content (X3) and the vin-egar-production residue (X4) was carried out to find more precise
factor values for the SQR-T037 biomass and 6PAP yield using a cen-tral composite design, and the results are shown in Table 4.
The F-test value and p-value of F = 56.58, p < 0.0001, andF = 19.56, p < 0.0001, for the models of the SQR-T037 biomassand 6PAP yield, respectively, indicated a good prediction of theexperimental results (Table 5). The determination coefficient R2
demonstrated that the fitted regression model explained 98.14%of the variation in the SQR-T037 biomass and 94.81% of the varia-tion in the 6PAP yield. The adjoint determination coefficients of themodels (Adj R2 = 0.9641 for the SQR-T037 biomass and AdjR2 = 0.8996 for the 6PAP yield) are also high, showing a high appli-cability of the model (Goswami et al., 2010). The coefficients of var-iation (1.64% and 9.11% for the models of SQR-T037 biomass and6PAP yield, respectively) were also lower than 10%, indicating ahigh precision and reliability of the experiment.
All four of the factors were identified as impacting SQR-T037biomass and 6PAP yield in the solid-state fermentation of theagro-industrial waste. Using the Design Expert Software, two sec-ond-order polynomials (Eqs. (6) and (7)) for the SQR-T037 biomassand 6PAP yield were obtained from regression analysis of the re-sults from the central composite design experiments.
Y1ðSQR-T037 biomassÞ ¼ 8:393þ 0:409v1 þ 0:067v2 þ 0:425v3
� 0:066v4 þ 0:006v1v2 � 0:273v1v3
þ 0:062v1v4 � 0:076v2v3 � 0:076v2v4
� 0:013v3v4 � 0:188v21 � 0:163v2
2
� 0:251v23 � 0:156v2
4; ð6Þ
Y2ð6PAP yieldÞ ¼ 1388:624� 47:142v1 � 71:850v2 � 58:933v3
þ 43:852v4 þ 19:115v1v2 þ 66:397v1v3
� 37:982v1v4 � 39:531v2v3 � 39:527v2v4
þ 20:792v3v4 � 181:144v21 � 122:677v2
2
� 157:310v23 � 84:368v2
4: ð7Þ

Table 4Central composite design of variables (coded and actual levels) with SQR-T037 biomass and 6PAP yield as responses.
Run Experimental factors Responses
Coded level Actual levela SQR-T037 biomassb 6PAP yieldc
v1 v2 v3 v4 X1 X2 X3 X4 Actual Predicted Actual Predicted
1 �1 �1 �1 �1 25 23 4 30 6.36 6.43 998.25 966.462 1 �1 �1 �1 45 23 4 30 7.68 7.66 742.64 777.123 �1 1 �1 �1 25 30 4 30 6.96 6.85 1034.29 942.654 1 1 �1 �1 45 30 4 30 7.98 8.11 856.11 829.765 �1 �1 1 �1 25 23 10 30 7.99 8.00 771.15 753.286 1 �1 1 �1 45 23 10 30 8.19 8.14 877.49 829.527 �1 1 1 �1 25 30 10 30 7.97 8.12 659.08 571.348 1 1 1 �1 45 30 10 30 8.27 8.28 765.51 724.059 �1 �1 �1 1 25 23 4 50 6.51 6.35 1129.41 1167.60
10 1 �1 �1 1 45 23 4 50 7.82 7.83 777.36 826.3311 �1 1 �1 1 25 30 4 50 6.26 6.47 976.47 985.6812 1 1 �1 1 45 30 4 50 8.13 7.97 706.27 720.8713 �1 �1 1 1 25 23 10 50 7.83 7.87 1050.00 1037.5914 1 �1 1 1 45 23 10 50 8.29 8.26 873.53 961.9015 �1 1 1 1 25 30 10 50 7.81 7.69 735.29 697.5416 1 1 1 1 45 30 10 50 8.01 8.10 705.29 698.3217 �2 0 0 0 15 26.5 7 40 6.87 6.82 663.45 758.3318 2 0 0 0 55 26.5 7 40 8.44 8.46 622.61 569.7619 0 �2 0 0 35 19.5 7 40 7.54 7.61 1112.62 1041.6220 0 2 0 0 35 33.5 7 40 7.97 7.87 641.18 754.2221 0 0 �2 0 35 26.5 1 40 6.51 6.54 896.10 877.2522 0 0 2 0 35 26.5 13 40 8.29 8.24 580.63 641.5223 0 0 0 �2 35 26.5 7 20 7.99 7.90 829.29 963.4524 0 0 0 2 35 26.5 7 60 7.57 7.64 1230.97 1138.8625 0 0 0 0 35 26.5 7 40 8.32 8.39 1447.38 1388.6226 0 0 0 0 35 26.5 7 40 8.46 8.39 1382.85 1388.6227 0 0 0 0 35 26.5 7 40 8.33 8.39 1400.43 1388.6228 0 0 0 0 35 26.5 7 40 8.33 8.39 1365.42 1388.6229 0 0 0 0 35 26.5 7 40 8.53 8.39 1441.41 1388.6230 0 0 0 0 35 26.5 7 40 8.38 8.39 1294.24 1388.62
a X1, fermentation days (d); X2, temperature (�C); X3, inoculum content (%, v/w); and X4, vinegar-production residue (%, w/w).b log10 ITSC g�1 DW.c mg kg�1 DW.
Table 5ANOVA for the response surface quadratic model.
Sourcea SQR-T037 biomassb 6PAP yieldc
Sum of squares df Mean square F-value p-valueProb > F
Sum of squares df Mean square F-value p-valueProb > F
Model 12.958 14 0.926 56.58 <0.0001** 2.06E+06 14 1.47E+05 19.56 <0.00011**
X1 4.023 1 4.023 245.92 <0.0001** 5.33E+04 1 5.33E+04 7.08 0.0178*
X2 0.106 1 0.106 6.50 0.0222* 1.24E+05 1 1.24E+05 16.46 0.0010*
X3 4.344 1 4.344 265.56 <0.0001** 8.34E+04 1 8.34E+04 11.07 0.0046*
X4 0.104 1 0.104 6.378 0.0233* 4.62E+04 1 4.62E+04 6.13 0.0257*
X1X2 0.000 1 0.000 0.03 0.8644 5.85E+03 1 5.85E+03 0.78 0.3921X1X3 1.191 1 1.191 72.84 <0.0001** 7.05E+04 1 7.05E+04 9.37 0.0079*
X1X4 0.062 1 0.062 3.78 0.0708 2.31E+04 1 2.31E+04 3.07 0.1004X2X3 0.092 1 0.092 5.60 0.0319* 2.50E+04 1 2.50E+04 3.32 0.0884X2X4 0.092 1 0.092 5.62 0.0316* 2.50E+04 1 2.50E+04 3.32 0.0884X3X4 0.003 1 0.003 0.16 0.6952 6.92E+03 1 6.92E+03 0.92 0.3530
X21
0.971 1 0.971 59.37 <0.0001** 9.00E+05 1 9.00E+05 119.54 <0.0001**
X22
0.729 1 0.729 44.59 <0.0001** 4.13E+05 1 4.13E+05 54.82 <0.0001**
X23
1.728 1 1.728 105.64 <0.0001** 6.79E+05 1 6.79E+05 90.15 <0.0001**
X24
0.671 1 0.671 41.01 <0.0001** 1.95E+05 1 1.95E+05 25.93 0.0001**
Residual 0.245 15 0.016 1.13E+05 15 7.53E+03Lack of fit 0.209 10 0.021 2.84 0.1302 9.71E+04 10 9.71E+03 3.06 0.1143Pure error 0.037 5 0.007 1.59E+04 5 3.17E+03Cor. total 13.203 29 2.18E+06 29
C.V.% = 1.64; R2 = 0.9814; Adj R2 = 0.9641; Pred R2 = 0.9050; Adeq precision = 23.3171 for model of SQR-T037 biomass production.C.V.% = 9.11; R2 = 0.9481; Adj R2 = 0.8996; Pred R2 = 0.7324; Adeq precision = 13.346 for model of 6PAP yield.
a X1, fermentation days (d); X2, temperature (�C); X3, inoculum content (%, w/w); and X4, vinegar-production residue (%, w/w).b log10 ITSC g�1 DW.c mg kg�1 DW.
* Significant at p < 0.05.** Highly significant at p < 0.001.
L. Chen et al. / Bioresource Technology 102 (2011) 3900–3910 3905

3906 L. Chen et al. / Bioresource Technology 102 (2011) 3900–3910
The significance of each coefficient was determined by the t-valuesand p-values listed in Table 5. The larger magnitude of the t-valuesand the smaller p-values indicate the high significance of the corre-sponding coefficients (Rocha-Valadez et al., 2006). A positive sign ofthe coefficient represents a synergistic effect, while a negative signindicates an antagonistic effect (Halim et al., 2009). All of the signsof the linear coefficients of the two equations (Eqs. (6) and (7)) werecompletely opposite. The signs of the linear and quadratic vinegar-production residue coefficients indicated a negative effect of vine-gar-production residue on SQR-T037 biomass production, whichmight result from the low pH of the vinegar-production residue(Zhang et al., 2009) and the introduction of much acetic-acid-producing bacteria (Gullo and Giudici, 2008). However, a differenteffect of the vinegar-production residue was found on the 6PAPyield when the coefficient of the linear vinegar-production residuewas positive.
Both the first-order and the quadratic main effects of the fourfactors were significant (p < 0.05) (Eqs. (6) and (7)) and this meantthat all four factors had strong effects on the SQR-T037 biomassand 6PAP yield and that small variations in them could cause largechanges in the results. The quadratic main effects of temperatureand vinegar-production residue on the SQR-T037 biomass(p < 0.0001) and of all four factors on the 6PAP yield (p < 0.0001)were much more significant than the first-order main effects(p < 0.05). Therefore, by changing the values of these factors to asmall extent, a large variation in response could be achieved. Withincreases in the values of these factors, the interface saturates withfactors at certain values where the SQR-T037 biomass or 6PAPyield reached their maximums. With further increases in the val-ues of the factors, the SQR-T037 biomass and 6PAP yield becameconstant or sometimes decrease.
Among the interaction effects, the interactions of the fermenta-tion days and inoculum content, the temperature and inoculumcontent, the temperature and vinegar-production residue in themodel of SQR-T037 biomass and the fermentation day and inocu-lum content interaction in the model of 6PAP yield were significant(p < 0.05). These data make it quite clear that the number of fer-mentation days and the inoculum content affect the productionof the bioorganic fertilizer containing both SQR-T037 and 6PAP ina greater way. A high inoculum content enhanced the SQR-T037colonization of the substrate; however, a quick consumption ofthe energy in the substrates hindered the accumulation of second-ary metabolites, including 6PAP (Feria-Gervasio et al., 2007).
The three-dimensional curves were plotted to explain the inter-actions of each factor against the SQR-T037 biomass (Fig. 2) and6PAP yield (Fig. 3). Each figure presents the effects of two factorswhile the other factor is held at zero. These three-dimensionalcurves provide a visualization of the interaction between two fac-tors and facilitate the location of optimal experimental conditions.An infinite number of combinations of two process variablesresulted in each of these response surface curves, in which thesmallest ellipse made the surface have the maximum response.The optimum ranges of a designed variable were its range corre-sponding to this ellipse. In the production of SQR-T037, thethree-dimensional curves showed that the optimum ranges ofthe factors were 35–45 fermentation days, a temperature of 25–28 �C, 7–10% inoculum content and 33–44% vinegar-productionresidue content (Fig. 2), while 30–35 fermentation days, a temper-ature of 24–26 �C, a 5–7% inoculum content and a 39–48% vinegar-production residue content were optimal for the 6PAP yield(Fig. 3). The fermentation days, temperature and inoculum contentthat promoted the primary growth of SQR-T037, however,exhibited negative effects on the yield of 6PAP, which might resultfrom the production of 6PAP in the process of secondary metabo-lism and its volatility (de Aráujo et al., 2002; Feria-Gervasioet al., 2007; Rocha-Valadez et al. 2006). Both the mycelia and the
anti-pathogen metabolites of Trichoderma spp. show biocontrolcapacity against soilborne diseases, but little is known about whichpart plays a major role in biocontrol (Harman et al., 2004). Also, theoptimum ranges of the factors for maximizing the SQR-T037 bio-mass and the 6PAP yield were not same. Therefore, in this work,to get a product with high biocontrol efficacy against Fusarium wiltof cucumber in continuously cropped soil, three optimal conditionswere predicted for obtaining the maximum yields of the SQR-T037biomass, 6PAP and of both products, as shown in Table 6.
3.5. Verification of the predicted optimal experimental conditions
To validate the adequacy of the optimal experimental condi-tions (Table 6), three verification experiments were carried out.Under the different conditions, BIO I (8.00 log10 ITSC g�1 dryweight (DW), 1403.25 mg kg�1 DW), BIO II (8.60 log10 ITSC g�1
DW, 1089.21 mg kg�1 DW) and BIO III (8.46 log10 ITSC g�1 DW,1291.73 mg kg�1 DW) were obtained. All of the BIOs were closeto the predicted values, especially the 6PAP yield, which couldresult from the increase in the stability of 6PAP in the process ofthe solid-state fermentation in a large volume. This result thereforecorroborated the predicted values and the effectiveness of themodel, indicating that the optimized solid-state fermentationconditions favor the production of both the biocontrol fungusSQR-T037 and antibiotic 6PAP. The fact that a disadvantageouscondition for SQR-T037 biomass production showed a high 6PAPyield in this experiment was in agreement with the findings ofRocha-Valadez et al. (2006) and was helpful in the practical treat-ment of the agro-industrial wastes because the inoculum contentand fermentation days were the most costly factors. Althoughthe 6PAP yield did not reach the 3–5 g kg�1 dry weight of solid-state fermentation substrate reported by de Aráujo et al. (2002)and Ramos et al. (2008), the additional energy spent on autoclavingthe fermentation substrate was saved in our experiment.
3.6. Biocontrol efficacy of the BIOs
The PDIs of Fusarium wilt were affected by different soil amend-ments in the cucumber continuously cropped soil in the two exper-iments (Fig. 4). Fusarium wilt PDIs of 69.2–73.0% were found in thecontrol treatment, all the three BIOs decreased the PDIs to 12.6–30.5%, and the chemical fungicides decreased the PDIs to 17.2–36.5%. Compared with the effective soil fungicide Hymexazol, allthree BIOs demonstrated statistically (p < 0.05) equal biocontrolefficacy on Fusarium wilt. Of the three BIOs, BIO III exhibited thelowest PDI of Fusarium wilt and higher (p < 0.05) biocontrol efficacythan Carbendazim. A high dose of the fungicide in the experimentshowed little effect on Fusarium wilt control, perhaps because thesuccessive applications of Hymexazol and Carbendazim in the pre-vious seasons of cucumber plantings (data not shown) caused path-ogen resistance (Chen and Zhou, 2009). The biocontrol efficacy ofTrichoderma spp. correlated with the population added into the soil,which favored competition with the pathogen’s infection nichewhile the Trichoderma spp. colonized the rhizoplane (Hoitink andBoehm, 1999). However, use of the biocontrol mechanism of com-petition by Trichoderma would a time delay in inhibiting the contactof F. oxysporum f. sp. cucumerinum with the growing plant roots. The6PAP already present in the bioorganic fertilizers could function asa retardant of mycelial growth and germination of F. oxysporumconidia (Scarselletti and Faull, 1994) and thus reinforce the biocon-trol capacity of the fertilizer. BIO III, with intermediate SQR-T037biomass and intermediate 6PAP content (Table 6), exhibited thehighest biocontrol efficacy; therefore, the following conditions forproducing BIO III were recommended: X1 (fermentation days) =36.7 d, X2 (temperature) = 25.9 �C, X3 (inoculum content) = 7.6%,X4 (vinegar-production residue) = 41.0%, X5 (rice straw) = 20.0%

Fig. 2. Three-dimensional response surface plot for SQR-T037 biomass as a function of variables. Vinegar residue = vinegar-production residue.
L. Chen et al. / Bioresource Technology 102 (2011) 3900–3910 3907
and X6 (cattle dung) = 39.0% (the initial C/N ratio of the substratewas 23.6 and its moisture content was 62.5%, respectively). This
is the first report of a biocontrol product effective against Fusariumwilt of cucumber in continuously cropped soil based on alive

Fig. 3. Three-dimensional response surface plot for 6PAP yield as a function of variables. Vinegar residue = vinegar-production residue.
3908 L. Chen et al. / Bioresource Technology 102 (2011) 3900–3910
mycelia and an anti-pathogen metabolite of T. harzianum producedby solid-state fermentation of agro-industrial wastes. Although
SQR-T037 showed broad-spectrum biocontrol of soilborne diseases,such as Fusarium wilt of C. sativus, Citrullus lanatus, Musa

Table 6Predicted optimum conditions for maximum of SQR-T037 biomass, 6PAP yield and both of them after solid-state fermentation.
Condition Products Maximize FD T IC VR RS CD Biomassa 6PAP yieldb
1 BIO I 6PAP yield 32.8 25.3 6.5 43.7 20.0 36.3 8.12 1419.012 BIO II Biomass 42.8 27.0 8.2 38.9 20.0 41.1 8.65 1196.483 BIO III Biomass and 6PAP yield 36.7 25.9 7.6 41.0 20.0 39.0 8.50 1373.41
FD, fermentation days (d); T, temperature (�C); IC, inoculum content (%, v/w); VR, vinegar-production residue (%, w/w); RS, rice straw; and CD, cattle dung (%, w/w).a Biomass, SQR-T037 biomass (log10 ITSC g�1 DW).b mg kg�1 DW.
1a
1b
1bc
1cd 1cd1d2c
2b
2bc2b2b
2a
0
20
40
60
80
100
1 2 3 4 5 6Treatment
Per
cent
age
Die
ase
Inde
x (%
)
Experiment 1
Experiment 2
Fig. 4. Percentage Disease Index as affected by different soil treatments. (1)Control; (2), BIO I; (3)BIO II; (4) BIO III; (5) hymexazol and (6) carbendazim.Different letters above columns indicate significant differences (p < 0.05).
7.5
8.0
8.5
9.0
0 5 15 30 60 90 120 150
Time (d)
SQR
-T03
7 bi
omas
s(L
og10
IT
SC g
-1 D
W)
0
500
1000
1500
6PA
P c
onte
nt (
mg
kg-1
DW
)
SQR-T037 biomas
6PAP content
Fig. 5. Changes in the active components (SQR-T037 and 6PAP) of BIO III over itsshelf life.
L. Chen et al. / Bioresource Technology 102 (2011) 3900–3910 3909
paradisiaca, Cucumis melo and Dioscorea opposita, Verticillium wiltof Gossypium spp., and Phytophthora blight of Capsicum annuumand Nicotiana tabacum (data not shown), different crops have differ-ent growing periods, and different pathogens show different sensi-tivities to 6PAP and live SQR-T037 mycelia; therefore, we will dofurther research work on an optimum product for biocontrol ofdifferent soilborne diseases.
Higher biocontrol efficacy of Fusarium wilt of the BIO III com-pared with those of heavily used fungicides proved a very promis-ing way to manage agro-industrial waste both in terms ofagricultural production and environmental protection.
3.7. Changes in the active components of the bioorganic fertilizers
The active components in BIO III decreased during the shelf lifeof 5 months (Fig. 5). Although the initial SQR-T037 biomass acutelydecreased to 33.88% log10 ITSC g�1 DW and the 6PAP contentdecreased 72.76% after 5 months, the fertilizer still contained asmany as 3.59 � 108 colony-forming units g�1 DW on T. harzianumselective medium (Williams et al., 2003). This finding might be aresult of lower genomic DNA extraction efficiency from conidiaor chlamydospores than from mycelia (Thornton, 2008). TheT. harzianum population and antibiotic metabolite concentrationare critical for successful biocontrol (Singh et al., 2007). Therefore,BIO III was a competent product.
4. Conclusions
The data obtained from the present experiments demonstratedthat the combination of cattle dung, vinegar-production residueand rice straw could be used as a substrate for the mass productionof the biocontrol fungus T. harzianum SQR-T037 with a high 6PAPcontent by solid-state fermentation. The resulting bioorganic fertil-izer could control Fusarium wilt of cucumber in continuouslycropped soil with high efficacy. The application of the bioorganicfertilizers is significant both in the economic crop productionindustry and in environmental protection. These findings can sup-port a new fertilizer industry worldwide.
Acknowledgements
This research was financially supported by the China AgricultureMinistry (201103004), the National Nature Science Foundationof China (40871126) and the Chinese Ministry of Science andTechnology (2010AA10Z401).
References
Binod, P., Sandhya, C., Suma, P., Szakacs, G., Pandey, A., 2007. Fungal biosynthesis ofendochitinase and chitobiase in solid state fermentation and their applicationfor the production of N-acetyl-D-glucosamine from colloidal chitin. Bioresour.Technol. 98, 2742–2748.
Bonnarme, P., Djian, A., Latrasse, A., Féron, G., Giniès, C., Durand, A., Le Quéré, J.L.,1997. Production of 6-pentyl-[alpha]-pyrone by Trichoderma sp. from vegetableoils. J. Biotechnol. 56, 143–150.
Chen, L.H., Yang, X.M., Raza, W., Li, J.H., Liu, Y.X., Qiu, M.H., Zhang, F.G., Shen, Q.R.,2010. Trichoderma harzianum SQR-T037 rapidly degrades allelochemicals inrhizospheres of continuously cropped cucumbers. Appl. Microbiol. Biotechnol.doi:10.1007/s00253-010-2948-x.
Chen, Y., Zhou, M., 2009. Sexual recombination of carbendazim resistance inFusarium graminearum under field conditions. Pest Manage. Sci. 65, 398–403.
Cutler, H.G., Cox, R.H., Crumler, F.G., Cole, P.D., 1986. 6-Pentyl-a-pyrone fromTrichoderma harzianum: its plant growth inhibitory and antimicrobialproperties. Agric. Biol. Chem. 50, 2943–2945.
de Aráujo, Á.A., Pastore, G.M., Berger, R.G., 2002. Production of coconut aroma byfungi cultivation in solid-state fermentation. Appl. Biochem. Biotechnol. 98,747–751.
El-Hasan, A., Walker, F., Buchenauer, H., 2008. Trichoderma harzianum and itsmetabolite 6-pentyl-alpha-pyrone suppress fusaric acid produced by Fusariummoniliforme. J. Phytopathol. 156, 79–87.
Feria-Gervasio, D., Jean-Roch, M., Nathalie, G., Gérard, G., Stéphane, E.G., 2007. Oleicacid delays and modulates the transition from respiratory to fermentative

3910 L. Chen et al. / Bioresource Technology 102 (2011) 3900–3910
metabolism in Saccharomyces cerevisiae after exposure to glucose excess. Appl.Microbiol. Biotechnol. 78, 319–331.
Goswami, D., Sen, R., Basu, J., De, S., 2010. Surfactant enhanced ricinoleic acidproduction using Candida rugosa lipase. Bioresour. Technol. 101, 6–13.
Gullo, M., Giudici, P., 2008. Acetic acid bacteria in traditional balsamic vinegar:phenotypic traits relevant for starter cultures selection. Int. J. Food Microbiol.125, 46–53.
Haddadin, M., Haddadin, J., Arabiyat, O., Hattar, B., 2009. Biological conversion ofolive pomace into compost by using Trichoderma harzianum and Phanerochaetechrysosporium. Bioresour. Technol. 100, 4773–4782.
Halim, S., Kamaruddin, A., Fernando, W., 2009. Continuous biosynthesis of biodieselfrom waste cooking palm oil in a packed bed reactor: optimization usingresponse surface methodology (RSM) and mass transfer studies. Bioresour.Technol. 100, 710–716.
Harman, G.E., Howell, C.R., Viterbo, A., Chet, I., Lorito, M., 2004. Trichoderma species-opportunistic, avirulent plant symbionts. Nat. Rev. Microbiol. 2, 43–56.
Hoitink, H.A.J., Boehm, M.J., 1999. Biocontrol within the context of soil microbialcommunities: a substrate-dependent phenomenon. Annu. Rev. Phytopathol. 37,427–446.
López-Mondéjar, R., Antón, A., Raidl, S., Ros, M., Antonio Pascual, J., 2010.Quantification of the biocontrol agent Trichoderma harzianum with real-timeTaqMan PCR and its potential extrapolation to the hyphal biomass. Bioresour.Technol. 101, 2888–2891.
Martins, L., Kolling, D., Camassola, M., Dillon, A., Ramos, L., 2008. Comparison ofPenicillium echinulatum and Trichoderma reesei cellulases in relation to theiractivity against various cellulosic substrates. Bioresour. Technol. 99, 1417–1424.
Ministry of Environmental Protection of the PR China, National Bureau of Statisticsof the PR China, Ministry of Agriculture of the PR China, 2010. Communique ofthe First National Census of Pollution Sources.
Pezet, R., Pont, V., Tabacchi, R., 1999. Simple analysis of 6-pentyl-a-pyrone, a majorantifungal metabolite of Trichoderma spp., useful for testing the antagonisticactivity of these fungi. Phytochem. Anal. 10, 285–288.
Ramos, A.S., Fiaux, S.B., Leite, S.G.F., 2008. Production of 6-pentyl-a-pyrone byTrichoderma harzianum in solid-state fermentation. Braz. J. Microbiol. 39, 712–717.
Reino, J., Guerrero, R., Hernández-Galán, R., Collado, I., 2008. Secondary metabolitesfrom species of the biocontrol agent Trichoderma. Phytochem. Rev. 7, 89–123.
Rocha-Valadez, J.A., Estrada, M., Galindo, E., Serrano-Carreón, L., 2006. From shakeflasks to stirred fermentors: scale-up of an extractive fermentation process for6-pentyl-[alpha]-pyrone production by Trichoderma harzianum usingvolumetric power input. Process Biochem. 41, 1347–1352.
Scarselletti, R., Faull, J.L., 1994. In vitro activity of 6-pentyl-[alpha]-pyrone, ametabolite of Trichoderma harzianum, in the inhibition of Rhizoctonia solani andFusarium oxysporum f. sp. lycopersici. Mycol. Res. 98, 1207–1209.
Shen, W., Lin, X., Gao, N., Zhang, H., Yin, R., Shi, W., Duan, Z., 2008. Land useintensification affects soil microbial populations, functional diversity andrelated suppressiveness of cucumber Fusarium wilt in China’s Yangtze RiverDelta. Plant Soil 306, 117–127.
Singh, A., Srivastava, S., Singh, H., 2007. Effect of substrates on growth and shelf lifeof Trichoderma harzianum and its use in biocontrol of diseases. Bioresour.Technol. 98, 470–473.
Thornton, C., 2008. Tracking fungi in soil with monoclonal antibodies. Eur. J. PlantPathol. 121, 347–353.
Weaver, M., Kenerley, C., 2005. Density independent population dynamics byTrichoderma virens in soil and defined substrates. Biocontrol Sci. Technol. 15,847–857.
Williams, J., Clarkson, J., Mills, P., Cooper, R., 2003. A selective medium forquantitative reisolation of Trichoderma harzianum from Agaricus bisporuscompost. Appl. Environ. Microbiol. 69, 4190.
Yang, Q., Peng, X., Yang, L., Han, J., Yang, Y., Wu, G., 2009. The utilisation of vinegarwaste. J. Shanxi Agric. Sci. 37, 44–46.
Zhang, L.J., Xu, W., Xu, H.Y., Zhang, X.M., Xu, Z.H., 2009. Analysis of organic acids inaerobic solid-fermentation culture of Hengshun vinegar. China Condiment 34,106–109.