A novel multicell dc-ac converter for applications in renewable ...

BATAAN PENINSULA STATE UNIVERSITY
COLLEGE OF ENGINEERING AND ARCHITECTURE
DEPARTMENT OF ELECTRONICS ENGINEERING
City of Balanga, Bataan
A Project Study on
SOLAR-POWERED AC/DC POWER SUPPLY FOR
ELECTRONICS ENGINEERING LABORATORY
In partial fulfillment of the requirements for the degree of Bachelor of Science in
Electronics and Communications Engineering for the subject ECPF – 521
(Project/Feasibility Study)
By:
Caraan, Irish Jane D.
De Leon, Teddy M.
De Jesus, Kimberly Rose P.
Llamzon, Syrah Dee O.
Parreño, Christian Joseph M.
April 2015

ABSTRACT
This project study aims to design and construct a solar independent AC
and DC power supply for powering low voltage experiment boards and
breadboard circuits in laboratory exercises of electronics engineering students.
By utilizing solar energy as a source, energy consumption from the electrical
power grid is lessened. It also provides students with a way to conduct their
experiments even in cases of power outage. The power supply will also have a
USB port similar to a universal charger that can charge smartphones and tablets
which are often used by students to search for datasheets, proper usage, and
calibrations of the different components and equipment used during experiments.
The prototype is design with consideration to voltage range, duration of use and
power requirement. The performance of the power supply will be assessed in
terms of time of operation, voltage stability, voltage regulation and efficiency.

A C K N O W L E D G E M E N T S
The proponents would like to extend their gratitude and appreciation to the
following persons who have shown their support and have been an integral part
in the progress and completion of this design.
To Engr. Rodrigo C. Muñoz, Jr., their project adviser, for his patience and
assistance in the preparation and completion of this study,
To their instructors and mentors, especially Engr. Jane Salenga and Engr.
Greg Mallari, for sharing their professional and educational knowledge that
served as the foundation of this project,
To their classmates, for supporting them despite undergoing the same
hardships in their own project studies,
To their families and friends, for inspiring them to work hard in this project
and for understanding and attending to their needs,
And above all, to the Lord God, who bestowed them with intelligence and
provided them with the determination to put this project together up to the end.

Chapter 1
INTRODUCTION
Background of the Study
Laboratory experiments play a crucial role in developing the skills and
knowledge of electronics engineering students. It serves as their stepping stone
in knowing the fundamentals of the ECE principles. It also familiarizes them to
the different components and equipment that they might encounter in their future
trainings or work. Furthermore, by performing these experiments and proving that
the principles are true and valid, students will become more appreciative of their
chosen course.
To provide a good learning experience, a laboratory must be well-
equipped with apparatus needed in the experiments. Since most laboratory
exercises for electronics engineering need to input different values of currents
and voltages to the circuit to be tested, a power supply is also required. However,
the power supply is useless in times of power outage because it is dependent on
the ac mains power source. This will interrupt or halt the ongoing experiments
and time will be wasted in waiting for the power to return. The inability of the

students to perform or finish the scheduled experiments due to power outage can
also fade the enthusiasm of the students in doing hands-on practicum.
As an alternative to the ac mains power source, a solar power supply can
be used. It can be used not only during power outage but also as a way to lessen
off the grid power consumption. Running the electric grid in the presence of
increasing fuel costs and growing environmental concerns will require new
technologies and ways to use them. Utilizing electricity from renewable energy
sources such as solar energy can reduce fossil fuel consumption and minimize
the environmental impact of electricity use.
Statement of the Problem
This project study aims to design and construct an AC and DC power
supply for electronics engineering laboratory by using solar energy instead of
using electricity from the AC mains outlet as with power supplies typically used in
school laboratories. Specifically, this study seeks to answer the following
questions?
1. How can solar energy be used as a power source for the power supply?
2. How long should the solar panel be exposed to sunlight before desired
results is acquired?
3. How can circuits for ac and dc voltage source be combined in the power
supply?

4. How can the prototype be designed to achieve high reliability and high
efficiency?
5. What are the materials to be used in constructing the prototype?
Significance of the Study
Power supply plays a vital role during laboratory activities of students in
the field of electronics. The students will benefit by using the solar powered AC
and DC power supply to continue their experiments even in times of power
outage.
This study may also spark the interest of succeeding graduating
electronics engineering students to utilize renewable energy in their projects.
Objectives
General Objective
To design and construct a prototype AC and DC power supply using solar
energy for the use of electronics engineering student in their laboratory
experiments.

Specific Objectives
1. To construct a solar powered power supply that can output an adjustable
DC output from 0 to 40 V DC, an adjustable AC output from 0 to 40 V AC
and charger output of 5V DC to charge portable devices like tablets,
smartphones and cellular phones.
2. To make a power supply that will last ten (10) hours using DC output, six
(6) hours using AC output and one and a half (1½) hours using the
charger for portable devices.
3. To assess the performance of the prototype power supply by computing
its efficiency and by testing its voltage regulation and output stability.
Scope and Delimitation
This study is limited on the use of AC and DC power supply for laboratory
experiments. The power supply is designed to be used on laboratory
experiments performed by Electronics Engineering students and may not reach
the requirements for experiments by Electrical, Mechanical and other engineering
students.

Since the power supply is battery based, it should be recharged when
there is sunlight for it to be useable in times of power outage. This study will
spend two months to be finished.

Chapter 2
Review of Related Literature
This chapter includes discussion on relevant facts about solar energy and
its application in electricity generation.
Presently, the world is highly dependent on petroleum, coal and natural
gas for its energy consumption. These fossil fuels amount to 78.4% of the total
world energy consumption compared to 2.6% for nuclear energy and 19% for
renewable energy (REN21 Renewables 2014 Global Status Report, 2014).
These fossil fuels are expended not only to run our vehicles and supply us with
all types of consumer goods thru manufacturing but also to provide us with
electricity.
Fossil fuels are exhausted to supply over 65% of the world’s electrical
energy needs. They are converted to electrical energy by steam turbine
generators and large scale fossil fuelled plants before distribution via the
electrical power grid. Since fossil fuels are non-renewable energy sources, they
are considered gone once they are used up because it will take millions of years
to replenish them. (Electricity Generation from Fossil Fuels, Retrieved from
http://www.mpoweruk.com/fossil_fuels.htm)

Due to our reliance to fossil fuels, a lot has been already said about
shifting from non-renewable resources to renewable resources, especially solar
energy. American inventor and businessman Thomas Edison (1931) said, “I'd
put my money on the sun and solar energy. What a source of power! I hope we
don't have to wait until oil and coal run out before we tackle that.” In one of her
speeches, Senator Hillary Clinton (2005) stated, “Clearly, we need incentives to
quickly increase the use of wind and solar power; they will cut costs, increase our
energy independence and our national security and reduce the consequences of
global warming.” Even Nobel Prize in Chemistry (1967) awardee Sir George
Porter remarked that, “I have no doubt that we will be successful in harnessing
the sun's energy... If sunbeams were weapons of war, we would have had solar
energy centuries ago.”
The Report of the Basic Energy Sciences Workshop on Solar Energy
Utilization (2015) states that the sunlight received by the Earth in one hour (4.3 ×
1020 J) is more than all the energy consumed on the planet in a year (4.1 × 10²⁰
J). Yet, in 2001, solar electricity only provided less than 0.1% of the world's
electricity needs. The huge gap between our present use of solar energy and its
enormous undeveloped potential defines a grand challenge in energy research.
Sunlight is a compelling solution to our need for clean, abundant sources of
energy in the future. It is readily available, secure from geopolitical tension, and
poses no threat to our environment through pollution or to our climate through
greenhouse gases.

According to Solar, an info book by The National Energy Education
Development Project (The NEED Project, 2014), photovoltaic or solar cells are
used to convert solar energy into direct current electricity using semiconducting
materials that exhibit the photovoltaic effect. A photovoltaic system employs solar
panels composed of a number of solar cells to supply usable solar power.
Electricity is produced when radiant energy from the sun strikes the solar cell,
causing the electrons to move around. The action of the electrons starts an
electric current.
Solar Photovoltaic Electricity Empowering the World by European
Photovoltaic Industry Association (EPIA) and Greenpeace (2011) mentions the
present status and the expected advancements of solar PV as an electricity
generator.
At the end of 2009 the world was running 23 GW of photovoltaic (PV)
electricity, the equivalent of 15 coal-fired power plants. At the end of 2010, this
number should reach more than 35 GW. The cost to produce solar power has
dropped by around 22% each time world-wide production capacity has doubled,
reaching an average generation cost of 15c€/KWh in EU. Average efficiencies of
solar modules have also improved a couple percentage points per year. The
most efficient crystalline silicon modules go to 19.5% in 2010 with a target of
23% efficiency by 2020, which will further lower prices.

Solar PV applications can be grid connected systems or stand-alone, off-
grid and hybrid systems. When a PV system is connected to the local electricity
network, any excess power that is generated can be fed back into the electricity
grid. The owner of the PV system is paid according to the law for the power
generated by the local electricity provider. This type of PV system is referred to
as being “on-grid”. On the other hand, off-grid PV systems have no connection to
an electricity grid. An off-grid system is usually equipped with batteries, so power
can still be used at night or after several days of low irradiation.
Example of an off-grid PV system is in consumer goods. PV cells are now
found in many everyday electrical appliances such as watches, calculators, toys,
and battery chargers. Services such as water sprinklers, road signs, lighting and
telephone boxes also often rely on individual PV systems.
In his white paper Photovoltaic Power Systems, Dahl discusses the design
requirements in employing a remote power or off-grid power system. These
design requirements are solar panels, batteries, charge controller and inverter.
Solar panels charge the batteries, and the charge controller prevents the
batteries from being overcharged when there is abundant solar insolation
available. The batteries provide DC voltage to the inverter, and the inverter
converts the DC voltage to AC voltage for various loads.

In Design and Construction of Variable DC Source for Laboratory Using
Solar Energy, Hnin Mar Wai and Zaw Min Min Htun of Mandalay Technological
University design and construct a variable DC power supply for laboratory using
switch mode DC to DC converter. In their design, 80W solar panel is used which
has 17.6V and 4.55A. Using a charge controller, voltage is charged into 12V
battery which is used as the source for the DC to DC converter. The regulated
power of the variable output voltage ranges from 0 to 36 V with a maximum
output current of 3A. The variable DC power supply is based on the step-down
and step-up output voltage process which use both buck and boost converter
topologies. A switching converter comprise of capacitors, an inductor, a diode
and a switch. A microcontroller is used to control output voltage for precision and
stability. The output voltage and duty cycle is displayed with LCD display.

Chapter 3
Theoretical Framework
This chapter discusses the founding theories and principles of the project
to provide an understanding of the operation of the different parts of the system.
Linear Series
Regulator
Variable DC
(0 - 50V)
Inverter
AC Regulator
Variable AC
(0 - 50V)
Buck Converter
USB Port
(Fixed 5V DC)
Battery Bank (Lead-Acid Batteries)
Input
(Sunlight)
Solar Panel
SOLAR CHARGER
Voltage Regulator
Boost Converter
MCU (Gizduino
ATMega328) LCD
Battery

The diagram shows the building blocks in the design of the solar
independent power supply that outputs an adjustable AC and DC voltage of 0 to
40V and a constant 5V DC for charging portable devices via a USB port. The
system is divided into two modes: charging mode and power supply mode.
During charging mode, the power discharged by the battery bank is replenished
by harnessing solar energy into electricity. In power supply mode, the battery
bank is used as the power source to produce the necessary AC and DC output.
In charging mode, the solar panel converts solar light energy or sunlight
into direct current voltage or electricity. This voltage is feed into the solar charger
circuit composed of a voltage regulator and a boost converter. The voltage
regulator is used to maintain a fixed voltage output regardless of the varying
amount of electricity produced by the solar panel due to the changing amount of
sunlight that it absorbs. The boost converter amplifies the fixed voltage output
from the voltage regulator to obtain sufficient voltage to charge the battery bank.
During power supply mode, the battery bank supplies three different
circuits depending on the desired output: the linear series regulator for adjustable
DC, the inverter and AC regulator for adjustable AC and the buck converter for
charging portable devices. The linear series regulator operates by using a
variable resistance element to change the value of the output voltage, thus
resulting to an adjustable DC output. The inverter converts the DC voltage from

the battery into AC voltage then feeds the output to an AC regulator to obtain
variable AC voltage. The buck converter down converts the higher battery bank
voltage into 5V to match the charging voltage of portable devices.
Solar Charger
A solar charger employs solar energy to supply electricity to devices or
charge batteries. They can charge lead acid or nickel-cadmium (Ni-Cd) battery
bank up to 48V and hundreds of ampere-hours (up to 400Ah) capacity. For such
type of solar chargers, charge controllers are used and solar panels are
connected to the battery bank.
A solar panel can produce a range of charging voltages depending upon
sunlight intensity, so a voltage regulator must be included in the charging circuit
so as to not over drive (over voltage) a device such as a twelve-volt battery.
Lead Acid Battery
All lead acid batteries consist of flat lead plates immersed in a pool of
electrolyte. Regular water addition is required for most types of lead acid
batteries although low-maintenance types come with excess electrolyte
calculated to compensate for water loss during a normal lifetime.
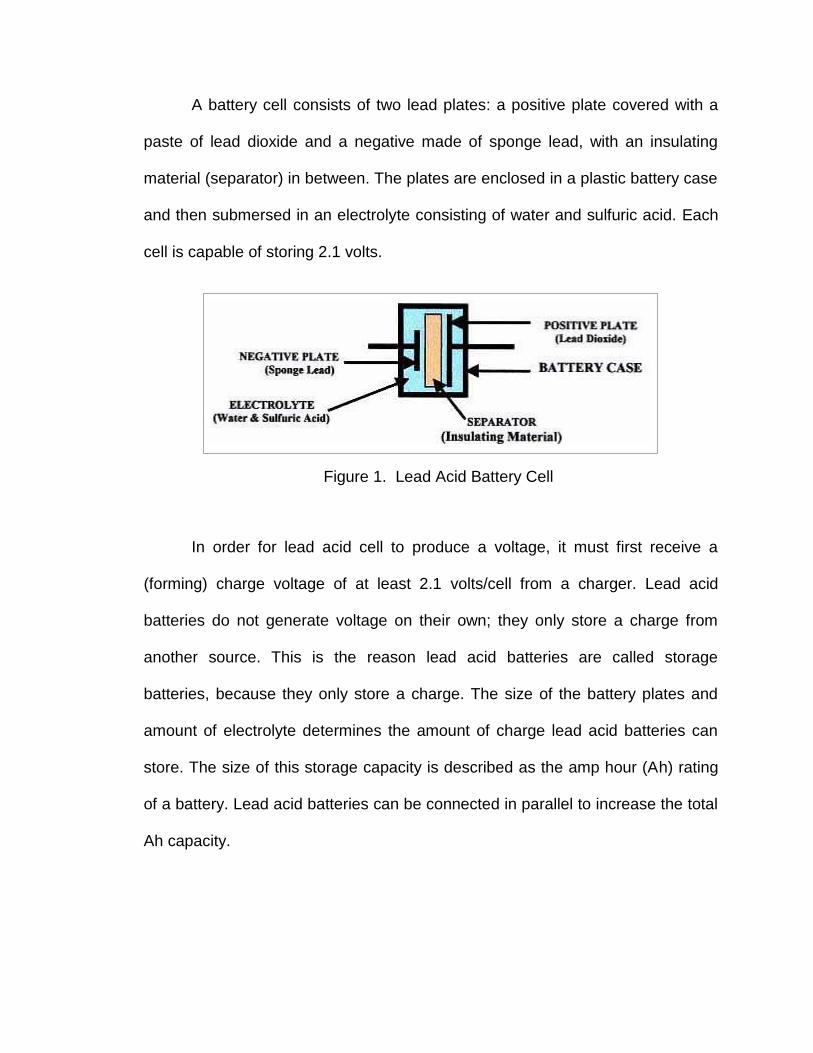
A battery cell consists of two lead plates: a positive plate covered with a
paste of lead dioxide and a negative made of sponge lead, with an insulating
material (separator) in between. The plates are enclosed in a plastic battery case
and then submersed in an electrolyte consisting of water and sulfuric acid. Each
cell is capable of storing 2.1 volts.
In order for lead acid cell to produce a voltage, it must first receive a
(forming) charge voltage of at least 2.1 volts/cell from a charger. Lead acid
batteries do not generate voltage on their own; they only store a charge from
another source. This is the reason lead acid batteries are called storage
batteries, because they only store a charge. The size of the battery plates and
amount of electrolyte determines the amount of charge lead acid batteries can
store. The size of this storage capacity is described as the amp hour (Ah) rating
of a battery. Lead acid batteries can be connected in parallel to increase the total
Ah capacity.
Figure 1. Lead Acid Battery Cell

In figure 2, a 12.6 volts fully charged battery is connected to a load (light
bulb) and the chemical reaction between sulfuric acid and the lead plates
produces the electricity to light the bulb. This chemical reaction also begins to
coat both positive and negative plates with a substance called lead sulfate, also
known as sulfation (shown as a yellow build-up on plates). This build-up of lead
sulfate is normal during a discharge cycle. As the battery continues to
discharge, lead sulfate coats more and more of the plates and battery voltage
begins to decrease from fully charged state of 12.6 volts.
In figure 3, the battery is now fully discharged, the plates are almost
completely covered with lead sulfate (sulfation) and voltage has dropped to 10.5
volts. Lead sulfate (sulfation) now coats most of the battery plates. Lead sulfate
is a soft material which can be reconverted back into lead and sulfuric acid,
provided the discharged battery is immediately connected to a battery charger. If
a lead acid battery is not immediately recharged, the lead sulfate will begin to
Figure 2. 12.6V Lead Acid Battery Powering a Light Bulb

form hard crystals, which cannot be reconverted by a standard fixed voltage
(13.6 volts) battery charger.
In order to recharge a 12-volt lead acid battery with a fully charged
terminal voltage of 12.6 volts, the charger voltage must be set at a higher
voltage. Most chargers on the market are set at approximately 13.6 volts. During
the battery recharge cycle lead sulfate (sulfation) begins to reconvert to lead and
sulfuric acid. As shown in figure 4 below, the discharged battery is connected to
a charger with its output voltage set at 13.6 volts.
Figure 3. 12.6V Lead Acid Battery Discharged to 10.5V
Figure 4. 12.6V Lead Acid Battery Connected to 13.6V
charger

During the recharging process, as electricity flows through the water
portion of the electrolyte and water, (H2O) is converted into its original elements,
hydrogen and oxygen. These gasses are very flammable and the reason lead
acid batteries must be vented outside. Gassing causes water loss and therefore
lead acid batteries need to have water added periodically. Sealed lead acid
batteries contain most of these gasses allowing them to recombine into the
electrolyte. If the battery is overcharged, pressure from these gasses will cause
relief caps to open and vent, resulting in some water loss. Most sealed batteries
have extra electrolyte added during the manufacturing process to compensate for
some water loss.
The battery shown in figure 5 has been fully recharged using a fixed
charging voltage of 13.6 volts. Notice that some lead sulfate (sulfation) still
remains on the plates. This build-up will continue after each recharging cycle and
gradually the battery will begin to loose capacity to store a full charge and
eventually must be replaced. Lead sulfate build up is reduced if battery is given
an equalizing charge. An equalizing charge increases charging voltage to 14.4
volts. This higher voltage causes gassing that equalizes (re-mixes) the electrolyte
solution.

The following factors are considered in the selection of batteries for PV
applications:
Deep discharge (70–80% depth discharge)
Low charging - discharging current
Long-duration charge (slow) and discharge (long duty cycle
Irregular and varying charge and discharge rate
Low self-discharge
Long lifetime
Less maintenance requirement
High energy storage efficiency
Low cost
Figure 5. Gassing in the Lead Acid Battery

Linear Power Supplies
A linear regulated power supply regulates the output voltage by dropping
excess voltage in a dissipative component. They use a moderately complex
regulator circuit to achieve very low load and line regulation. Linear regulated
power supplies also have very little ripple and very little output noise.
Linear power supplies gain their name from the fact that they use linear,
i.e. non-switching techniques to regulate the voltage output from the power
supply. The term linear power supply implies that the power supply is regulated
to provide the correct voltage at the output. Sometimes the sensing of the voltage
may be accomplished at the output terminals, or on some occasions it may be
achieved directly at the load. There are two main types of linear power supply:
series regulator and shunt regulator.
The series voltage regulator format or as it is sometimes called the series
pass regulator is the most commonly used format for providing the final voltage
regulation in a linear voltage regulator circuit. As the name suggests, the series
voltage regulator or series pass voltage regulator operates by using a variable
element in series with the load. By changing the resistance of the series element,
the voltage dropped across it can be varied to ensure that the voltage across the
load remains constant. The advantage of the series voltage regulator is that the
amount of current drawn is effectively used by the load, although some will be

consumed by any circuitry associated with the regulator. Unlike the shunt
regulator, the series regulator does not draw the full current even when the load
does not require any current. As a result the series regulator is considerably
more efficient.
Although the shunt voltage regulator is not widely used to provide the
main regulation in many applications, it nevertheless finds uses in many other
areas of circuitry. Essentially the load is operated with a resistor in series with the
voltage source and the shunt regulator then in parallel with the load. In order to
keep the voltage across the load constant, a level of current must be drawn
through the series resistor to maintain the required voltage across the load. The
load will take some and the remaining current is drawn by the shunt voltage
regulator. The circuit is designed so that at maximum load current the shunt
regulator draws virtually no current and at minimum load current, the shunt
voltage regulator passes the full current. As a result, it can be seen that shunt
regulators are inefficient because maximum current is drawn from the source
regardless of the load current, i.e. even when there is no load current.
While linear power supplies may not be as efficient as other types of
power supply technology, they offer the best performance and are therefore used
in many applications where noise is of great importance. Often audio amplifiers

and many other items of electronic equipment use linear power supplies to obtain
the best performance.
The use of any technology is often a careful balance of several
advantages and disadvantages. This is true for linear power supplies which offer
some distinct advantages, but also have their drawbacks.
The advantages of linear power supplies are low noise and its reputation
as an established technology. The use of the linear technology without any
switching element means that noise is kept to a minimum and the annoying
spikes found in switching power supplies are not found. It has also been in
widespread use for many years and their technology is well established and
understood.
On the other hand, efficiency, size and dissipation are the disadvantages
of linear power supplies. In view of the fact that a linear power supply uses linear
technology, it is not particularly efficient. Efficiencies of around 50% are not
uncommon, and under some conditions they may offer much lower levels. The
use of linear technology means that the size of a linear power supply tends to be
larger than other forms of power supply. The use of a series or parallel (less
common) regulating element means that significant amounts of heat are
dissipated and this needs to be removed.

Despite the disadvantages, linear power supply technology is still widely
used; although it is more widely used where low noise and good regulation is
needed. Typical applications of linear regulated power supplies
include but are not limited to the following:
Low noise amplifiers
Signal processing
Data acquisition - including sensors, multiplexers, A/D converters, and
sample & hold circuits.
Automatic test equipment
Laboratory test equipment
Control circuits
Anywhere that excellent regulation and/or low ripple is required
Switched Mode Power Supplies
A switched-mode power supply (switching-mode power supply, switch-
mode power supply, SMPS, or switcher) is an electronic power supply that
incorporates a switching regulator to convert electrical power efficiently. Like
other power supplies, an SMPS transfers power from a source, like mains power,
to a load, such as a personal computer, while converting voltage and current
characteristics. Unlike a linear power supply, the pass transistor of a switching-

mode supply continually switches between low-dissipation, full-on and full-off
states, and spends very little time in the high dissipation transitions, which
minimizes wasted energy. Ideally, a switched-mode power supply dissipates no
power. Voltage regulation is achieved by varying the ratio of on-to-off time. In
contrast, a linear power supply regulates the output voltage by continually
dissipating power in the pass transistor. This higher power conversion efficiency
is an important advantage of a switched-mode power supply. Switched-mode
power supplies may also be substantially smaller and lighter than a linear supply
due to the smaller transformer size and weight.
The main advantage of the switching power supply over linear power
supply is greater efficiency because the switching transistor dissipates little
power when acting as a switch. Other advantages include smaller size and
lighter weight from the elimination of heavy line-frequency transformers, and
lower heat generation due to higher efficiency. Disadvantages include greater
complexity, the generation of high-amplitude, high-frequency energy that the low-
pass filter must block to avoid electromagnetic interference (EMI), a ripple
voltage at the switching frequency and the harmonic frequencies thereof.
There are several topologies commonly used to implement SMPS. Any
topology can be made to work for any specification; however, each topology has
its own unique features. SMPS can be buck, boost or buck-boost type.

Buck Converter
A buck converter is a voltage step down and current step up converter.
The simplest way to reduce the voltage of a DC supply is to use a linear
regulator, but linear regulators waste energy as they operate by dissipating
excess power as heat. Buck converters, on the other hand, can be remarkably
efficient (95% or higher for integrated circuits), making them useful for tasks such
as converting the main voltage in a computer (12 V in a desktop, 12 – 24 V in a
laptop) down to the 0.8 – 1.8 volts needed by the processor.
The buck converter is used in SMPS circuits where the DC output voltage
needs to be lower than the DC input voltage. The DC input can be derived from
rectified AC or from any DC supply. It is useful where electrical isolation is not
needed between the switching circuit and the output, but where the input is from
a rectified AC source, isolation between the AC source and the rectifier could be
provided by a mains isolating transformer.

The switching transistor between the input and output of the buck
converter continually switches on and off at high frequency. To maintain a
continuous output, the circuit uses the energy stored in the inductor, during the
on periods of the switching transistor, to continue supplying the load during the
off periods. The circuit operation depends on what is sometimes also called a
flywheel circuit. This is because the circuit acts rather like a mechanical flywheel
that, given regularly spaced pulses of energy keeps spinning smoothly
(outputting energy) at a steady rate.
Figure 6. Basic Buck Converter Circuit

Boost Converter
A boost converter (step-up converter) is a DC-to-DC power converter with
an output voltage greater than its input voltage. It is a class of switched-mode
power supply containing at least two semiconductors (a diode and a transistor)
and at least one energy storage element, a capacitor, inductor, or the two in
combination. Filters made of capacitors (sometimes in combination with
inductors) are normally added to the output of the converter to reduce output
voltage ripple.
Switched mode supplies can be used for many purposes including DC to
DC converters. Often, although a DC supply, such as a battery may be available,
its available voltage is not suitable for the system being supplied. For example,
the motors used in driving electric automobiles require much higher voltages, in
the region of 500V, than could be supplied by a battery alone. Even if banks of
batteries were used, the extra weight and space taken up would be too great to
be practical. The answer to this problem is to use fewer batteries and to boost
the available DC voltage to the required level by using a boost converter. Another
problem with batteries, large or small, is that their output voltage varies as the
available charge is used up, and at some point the battery voltage becomes too
low to power the circuit being supplied. However, if this low output level can be
boosted back up to a useful level again, by using a boost converter, the life of the
battery can be extended.

The DC input to a boost converter can be from many sources as well as
batteries, such as rectified AC from the mains supply, or DC from solar panels,
fuel cells, dynamos and DC generators. The boost converter is different to the
buck converter in that its output voltage is equal to, or greater than its input
voltage. However it is important to remember that, as power (P) = voltage (V) x
current (I), if the output voltage is increased, the available output current must
decrease.
Figure 7 below illustrates the basic circuit of a boost converter. However,
in this example the switching transistor is a power MOSFET, both bipolar power
transistors and MOSFETs are used in power switching, the choice being
determined by the current, voltage, switching speed and cost considerations. The
rest of the components are the same as those used in the buck converter
illustrated in figure 6 except that their positions have been rearranged.
Figure 7. Basic Boost Converter Circuit

Inverter
A power inverter, or inverter, is an electronic device or circuitry that
changes direct current (DC) to alternating current (AC). The inverter does not
produce any power; the power is provided by the DC source.
To produce AC voltage, some inverters use electromagnetic switches that
flick on and off at high speed to reverse the current direction. Inverters like this
often produce what's known as a square-wave output: the current is either
flowing one way or the opposite way or it's instantly swapping over between the
two states:
These kind of sudden power reversals are quite brutal for some forms of
electrical equipment. In normal AC power, the current gradually swaps from one
direction to the other in a sine-wave pattern, like this:
Figure 8. Square Wave
Figure 9. Sine Wave

Electronic inverters can be used to produce this kind of smoothly varying
AC output from a DC input. They use electronic components called inductors
and capacitors to make the output current rise and fall more gradually than the
abrupt, on/off-switching square wave output from a basic inverter.
Inverters can also be used with transformers to change a certain DC input
voltage into a completely different AC output voltage (either higher or lower) but
the output power must always be less than the input power: it follows from
the conservation of energy that an inverter and transformer can't give out more
power than they take in and some energy is bound to be lost as heat as
electricity flows through the various electrical and electronic components. In
practice, the efficiency of an inverter is often over 90%.
A typical power inverter device or circuit requires a relatively stable DC
power source capable of supplying enough current for the intended power
demands of the system. The input voltage depends on the design and purpose of
the inverter. Examples include:
12V DC, for smaller consumer and commercial inverters that typically run
from a rechargeable 12V lead acid battery.
24 and 48V DC, which are common standards for home energy systems
200 to 400V DC, when power is from photovoltaic solar panels

300 to 450V DC, when power is from electric vehicle battery packs in
vehicle-to-grid systems
Hundreds of thousands of volts, where the inverter is part of a high voltage
direct current power transmission system
For battery-powered inverter, the runtime of an inverter is dependent on
the battery power and the number of plugs utilizing the inverter at a given time.
As the amount of equipment utilizing the inverter increases, the runtime will
decrease. In order to prolong the runtime of an inverter, additional batteries can
be added to the inverter.
When attempting to add more batteries to an inverter, there are two basic
options for installation: series configuration and parallel configuration. If the goal
is to increase the overall voltage of the inverter, batteries can be daisy-chained
into a series configuration. In a series configuration, if a single battery dies, the
other batteries will not be able to power the load. On the other hand, if the goal is
to increase capacity and prolong the runtime of the inverter, one can connect
batteries in a parallel configuration. In a parallel configuration, if a single battery
dies, the other batteries will be able to power the load.

AC Regulator (DIAC and TRIAC Phase Control)
A voltage regulator is designed to automatically maintain a constant
voltage level. Depending on the design, it may be used to regulate one or more
AC or DC voltages.
Phase control is often used in AC power supplies to control the amount of
voltage, current or power that is fed to its load. It does this in much the same way
that a pulse-width modulated (PWM) supply would pulse on and off to create an
average value at its output. If the supply has a DC output, its time base is of no
importance in deciding when to pulse the supply on or off, as the value that will
be pulsed on and off is continuous.
Phase control differs from PWM in that it addresses supplies that output a
modulated waveform, such as the sinusoidal AC waveform that the national grid
outputs. Here, it becomes important for the supply to pulse on and off at the
correct position in the modulation cycle for a known value to be achieved; for
example, the controller could turn on at the peak of a waveform or at its base if
the cycle's time base were not taken into consideration.
Phase control works by modulating a thyristor, SCR (silicon controlled
rectifier), TRIAC (triode for alternating current), thyratron, or other such gated

diode-like devices into and out of conduction at a predetermined phase of the
applied waveform. Example of a phase control circuit is that of a DIAC and
TRIAC phase control.
The basic full-wave TRIAC phase control circuit shown in figure 10 above
requires only five components: resistor, adjustable resistor, capacitor, DIAC and
TRIAC. Adjustable resistor R1 and C1 are a single-element phase shift network.
When the voltage across C1 reaches breakover voltage of the DIAC, C1 is
partially discharged by the DIAC into the TRIAC gate. The TRIAC is then
triggered into conduction mode for the remainder of that half-cycle. The unique
simplicity of this circuit makes it suitable for applications with small control range.
DIACs are often used in conjunction with TRIACs because these TRIACs
do not fire symmetrically as a result of slight differences between the two halves
of the device. This results in harmonics being generated and the less
Figure 10. DIAC and TRIAC Phase Regulator

symmetrical the device fires, the greater the level of harmonics produced. It is
generally undesirable to have high levels of harmonics in a power system.
To help in overcoming this problem, a DIAC is often placed in series with
the gate. This device helps make the switching more even for both halves of the
cycle. This results from the fact that its switching characteristic is far more even
than that of the TRIAC. Since the DIAC prevents any gate current flowing until
the trigger voltage has reached a certain voltage in either direction, this makes
the firing point of the TRIAC more even in both directions.
Microcontroller Unit (GIZDUINO ATMega328)
A microcontroller is a compact microcomputer designed to govern the
operation of embedded systems in motor vehicles, robots, office machines,
complex medical devices, mobile radio transceivers, vending machines, home
appliances, and various other devices. A typical microcontroller includes a
processor, memory, and peripherals.
The simplest microcontrollers facilitate the operation of the
electromechanical systems found in everyday convenience items. Originally,
such use was confined to large machines such as furnaces and automobile
engines to optimize efficiency and performance. In recent years, microcontrollers

have found their way into common items such as ovens, refrigerators, toasters,
clock radios, and lawn watering systems. Microcomputers are also common in
office machines such as photocopiers, scanners, fax machines, and printers.
The microcontroller was used to program the liquid crystal display to show
the different important instructions and warning in using the power supply.

Chapter 4
Methodology
This chapter enumerates the procedures applied in the design and
construction of the prototype solar powered AC and DC power supply. It also
specifies the methods of data collection and of the statistical treatment of the
data gathered.
CONCEPTUALIZATION OF THE PROJECT
ACQUISITION OF MATERIALS
ASSESMENT OF THE SYSTEM
STATISTICAL ANALYSIS OF DATA
CONSTRUCTION OF THE SYSTEM
PROTOTYPING
TROUBLESHOOTING

Conceptualization of the Project
The preliminary schematic diagram of the project was designed by using
the groundwork obtained from the review of related literature and theoretical
framework. The schematic diagram was simulated using Proteus until the
objective of the project was achieved.
Acquisition of Materials
The materials needed for the construction of the project are solar panel,
solar charger circuit, battery bank, linear regulator circuit, inverter, AC regulator,
buck converter circuit, USB port, microcontroller unit, LCD and casing. This also
included all the circuit components and equipment necessary to assemble the
system. Unavailable or expensive circuit components were replaced with similar
or alternative ones.
Construction of the System
First, a breadboard prototype of the system was constructed to test the
real-life response of the circuit compared to that of the simulated version.
Necessary adjustments were made until the preliminary prototype meets the
objectives of the project. Next, the necessary circuitry to connect the hardware
part to the software part was built. Then the final prototype of the system was

assembled. Lastly, the prototype was tested again before it was packaged in a
presentable casing.
Assessment of the System
The setup was verified by testing it to a circuit to check that the voltage
range in the objectives was achieved. The project was also tested for output
voltage stability and voltage regulation. The individual efficiencies of the AC and
DC supply and their overall efficiency was also computed.
To test for the output voltage stability, the output voltage of the unloaded
DC supply was observed for a period of two hours. Output voltage readings were
recorded every twenty (20) minutes. For the AC supply, the output voltage was
observed for a period of one hour with output voltage readings recorded every
ten (minutes). The input voltage from the battery was also recorded at the same
time with the output voltage readings for both DC and AC power supplies. This
was to check that the battery can output a stable voltage over an extended
period of time base on its discharge rate.
To test the DC supply voltage regulation, a 5kΩ potentiometer was
connected in series with the power supply as a test load. On the other hand, a
20k potentiometer in series connection with the power supply was used to

assess the voltage regulation of the AC supply. The values of the load
resistances were based on different research journals doing the same project
concept. The lowest test value was the resistance of the potentiometer where
there was still an output reading while the largest value was based on the voltage
regulation percentage industry tolerance of 5%. The resistance values per trial
were incremented 50Ω for DC supply and 500Ω for AC supply.
The individual efficiencies of the DC and AC power supply were
determined by computing the ratio of the output voltage over the input voltage at
50% regulation. The values at 50% regulation were used because it is the
standard followed by the industry.
Statistical Analysis of Data
The data gathered from the voltage stability test was subjected to
standard deviation. Standard deviation was used to get the amount of voltage
that the measured output voltage will vary with respect to the expected output
voltage over the set period of the power supply operation per class. The data
from battery discharge rate and voltage regulation was subjected to descriptive
method with respect to known standards for power supplies.

Chapter 5
Technical Study
This chapter covers the working methods that will be used to achieve the
objectives of the project which includes the project description, project design,
design considerations, design specifications, design computation, program and
system flowchart, programming tools, component selection and power supply
specifications.
.
Project Description
This project utilized solar light energy collected by photovoltaic cells in a
solar panel to store charge in the sealed lead-acid batteries. The power from the
batteries was used to get the desired adjustable DC and AC voltage output and
to charge phones and other portable devices. The DC and AC voltage value can
be varied from 0 to 50 volts while the charger outputted a constant 5 volts in DC
via a universal serial bus port.
The device was designed to be purely solar independent, thus the
exclusion of using the 220V AC mains outlet as an alternative to charge the
batteries. The solar panel was detachable from the power supply to lessen the
bulk and weight of the system. This increased ease of use by making the power
supply portable and with the solar panel being less of a hassle during

experiments. Toggle switches were used to mechanically switch the batteries
between charging mode (batteries in 12V parallel connection) to power supply
mode (batteries in 48V series connection). Since the solar panel had a maximum
output of 20V, connecting the batteries in parallel ensured that the voltage of the
batteries (12V) can be charged within the voltage capability of the solar panel.
On the other hand, connecting the batteries in parallel (48V) enabled the system
to reach the required AC and DC output voltage range.
Project Design
Figure 11. 3D Design of the Prototype Project

The casing of the prototype power supply was engineered with reference
to existing power supplies for laboratory use. The casing used metal sheets to
increase durability with proper grounding to prevent electric shock. The design
was kept as compact as possible while providing enough space to house the
batteries, electronic circuitries, and wirings. The back side of the casing has
punched holes for proper ventilation to prevent overheating during the operation
of the device. The front side was the location of the display of the specifics of the
power supply, mains switch (rocker switch) for AC (right side) and DC (left side),
output terminal of the AC (right side) and DC (left side) and a tuner for the
desired AC and DC voltage level. The left side was the location of the toggle
switches to switch the device from charging mode to power supply mode and
vice versa, the rocker switch for turning the solar charger on/off and the input
terminals for the solar panel.
Design Considerations
I. Voltage Range
Voltage range is the area of variation between the upper and lower limits
of the power supply output. Since the power supply was intended for laboratory
use, the prototype was designed in accordance to the laboratory power
requirements at the Department of Electronics Engineering, College of
Engineering and Architecture, Bataan Peninsula State University - Main Campus.

The laboratory experiments for ECE students uses the LabVolt Manual
(Volumes l, ll, lll, and lV) with activities from the following subjects: Circuits l
(Elementary Electrical Circuits), Circuits ll (Electrical Circuits 2), Electronics l,
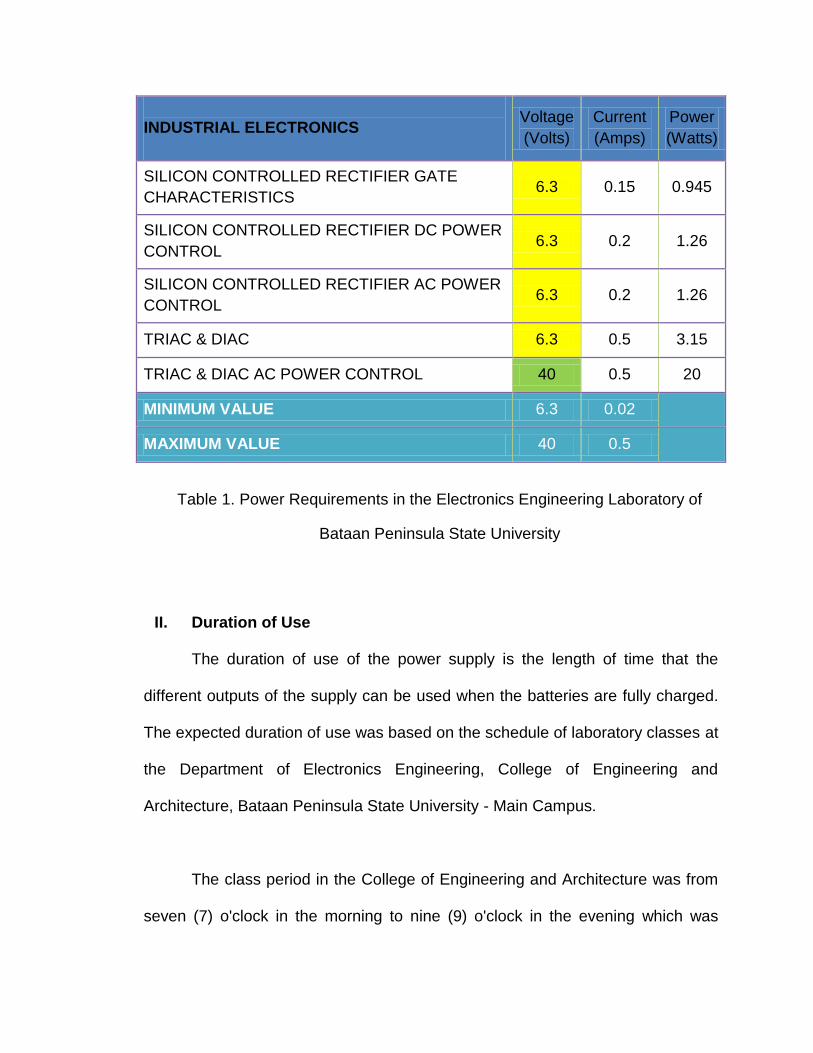
Electronics ll, Electronics lll, and Electronics V (Industrial Electronics). Based
from the laboratory requirements, the maximum DC voltage used was 40V and
the minimum voltage was 6V while the maximum AC voltage used was 40V and
the minimum AC voltage was 6.3V. The voltage range to be used for both AC
and DC will have a range of 0 to 40V.
LABORATORY EXERCISES (DC SOURCE)
CIRCUITS
Voltage
(volts)
Current
(amps)
Power
(watts)
SAFETY: USE OF SOURCES AND METERS 6 0.01 0.06
THE ELECTRONIC VOM 10 0.01 0.1
THE ELECTRONIC POWER SUPPLY 40 0.5 20
OHM’S LAW 30 0.025 0.75
POWER - HEAT – LIGHT 10 0.25 2.5
SERIES RESISTIVE CIRCUITS 25 0.25 6.25
SERIES CIRCUIT- KIRCHHOFF’S LAW 30 0.005 0.15
THE ELECTRONIC POWER SUPPY 40 0.25 10
ELECTRONICS
Voltage
(volts)
Current
(amps)
Power
(watts)
ZENER DIODE VOLTAGE REGULATION 40 0.1 4
COMMON BASE CIRCUIT 24 0.002 0.048

COMMON EMITTER CIRCUIT 24 0.002 0.048
COMMOM COLLECTOR CIRCUIT 24 0.002 0.048
RC COUPLING 24 0.002 0.048
INTRODUCTION TO SEMICONDUCTOR DIODES 40 0.01 0.4
INDUSTRIAL ELECTRONICS
Voltage
(volts)
Current
(amps)
Power
(watts)
SILICON CONTROLLED RECTIFIER (SCR) 6 0.15 0.9
SILICON CONTROLLED RECTIFIER GATE
CHARACTERISTICS
6 0.5 3
6 0.01 0.06
SILICON CONTROLLED RECTIFIER DC POWER
CONTROL 6 0.5 3
UNIJUNCTION TRANSISTOR (UJT) 10 0.02 0.2
UNIJUNCTION TRANSISTOR WAVEFORM
GENERATION 12 0.02 0.24
UNIJUNCTION TRANSISTOR – SCR TIME DELAY
CIRCUIT 12 0.5 6
TRIAC & DIAC
6 0.5 3
6 0.1 0.6
40 0.01 0.4
MINIMUM VALUE 6 0.002
MAXIMUM VALUE 40
LABORATORY EXERCISES (AC SOURCE)
ELECTRONICS
Voltage
(Volts)
Current
(Amps)
Power
(Watts)
RECTIFIERS, HALF-WAVE & FULL-WAVE 14 0.02 0.28
INDUSTRIAL ELECTRONICS
Voltage
(Volts)
Current
(Amps)
Power
(Watts)
SILICON CONTROLLED RECTIFIER GATE
CHARACTERISTICS 6.3 0.15 0.945
SILICON CONTROLLED RECTIFIER DC POWER
CONTROL 6.3 0.2 1.26
SILICON CONTROLLED RECTIFIER AC POWER
CONTROL 6.3 0.2 1.26
TRIAC & DIAC 6.3 0.5 3.15
TRIAC & DIAC AC POWER CONTROL 40 0.5 20
MINIMUM VALUE 6.3 0.02
MAXIMUM VALUE 40 0.5
II. Duration of Use
The duration of use of the power supply is the length of time that the
different outputs of the supply can be used when the batteries are fully charged.
The expected duration of use was based on the schedule of laboratory classes at
the Department of Electronics Engineering, College of Engineering and
Architecture, Bataan Peninsula State University - Main Campus.
The class period in the College of Engineering and Architecture was from
seven (7) o'clock in the morning to nine (9) o'clock in the evening which was
Table 1. Power Requirements in the Electronics Engineering Laboratory of
Bataan Peninsula State University

composed of fourteen (14) hours daily. The allocated time for every laboratory
subjects was three (3) hours, thus there were only four (4) laboratory subjects
that can be conducted daily. The maximum laboratory hours that can be
conducted daily in the Department of Electronics Engineering were only twelve
(12) hours.
Based on the laboratory schedules and the proponents own experience in
conducting experiments in BPSU, the power supply was designed to be used
daily for ten (10) hours for the DC output, six (6) hours for the AC output and one
and a half (1
) hours for the charger output. Thus, for each laboratory class, the
DC output can be used for 2
hours, the AC output for 1
hours and the charger
for about twenty (20) minutes. Significantly longer hours were allocated for DC
output because there were more experiments that used this kind of output (refer
to table 1). There were also times when the experiments conducted didn’t use
AC output at all. The charger output was only allotted twenty minutes so that
students will only use the charger when they really need to charge their portable
devices to search for datasheets, instructions and other research related to the
experiments. This was to discourage the students to use the charger for
extended periods of time and for personal use, especially if the need to charge
their portable devices was because they were texting, watching movies or
playing games in their gadgets instead of doing the experiments.
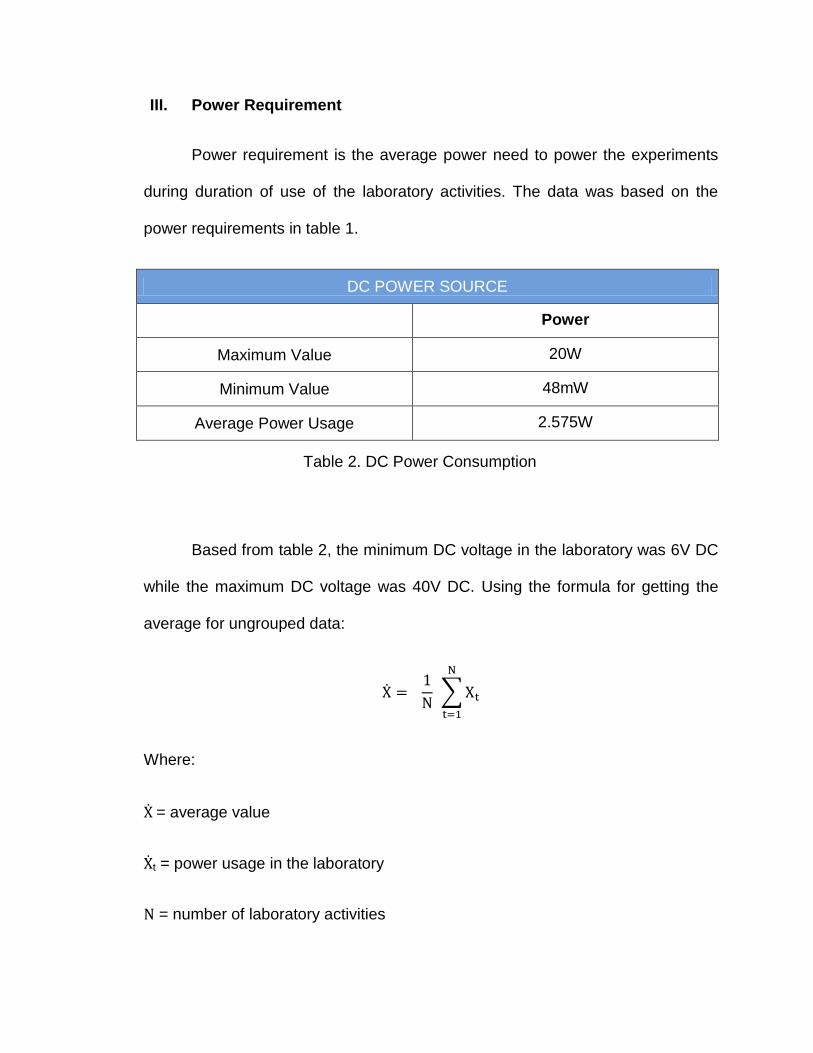
III. Power Requirement
Power requirement is the average power need to power the experiments
during duration of use of the laboratory activities. The data was based on the
power requirements in table 1.
DC POWER SOURCE
Power
Maximum Value 20W
Minimum Value 48mW
Average Power Usage 2.575W
Based from table 2, the minimum DC voltage in the laboratory was 6V DC
while the maximum DC voltage was 40V DC. Using the formula for getting the
average for ungrouped data:
∑
Where:
= average value
t = power usage in the laboratory
= number of laboratory activities
Table 2. DC Power Consumption

( ) ( )
The average power usage in the laboratory experiments for DC voltage
was 2.575 watts.
AC POWEER SOURCE
Power
Maximum Value 20W
Minimum Value 280mW
Average Power Usage 3.842W
Based from table 3, the minimum AC voltage in the laboratory was 6.3V
AC while the maximum AC voltage was 40V AC. The average power usage was
computed using the formula for getting the average for ungrouped data.
( )
Table 3. AC Power Consumption

The average power usage for AC voltage was 3.842 watts. For USB
charger, the specification used was based on the standard which is 5V DC with
0.5V DC tolerance and with a current of 500mA that will produce a power
consumption of 2.5 watts. The total power loading that the designed power
supply must be able to carry was 52.552W-h daily (summation of the product of
DC and AC average power usage together with the charger power consumption
with the duration of usage).
Design Specifications
VOLTAGE
RANGE
DURATION
OF USE
POWER
REQUIREMENT
Per
Class
Per
Day
Average
Power Usage
Average Power Consumption
per Day
DC
OUTPUT
Adjustable
0 – 50 V
DC
2
hours
10
hours 2.575 watts
25.75 watt-hour
AC
OUTPUT
Adjustable
0 – 50 V
AC
1
hours
6
hours 3.842 watts
23.052 watt-hour
CHARGER
OUTPUT
Fixed 5V
DC
0.5V DC
tolerance
20
minutes
1.5
hours 2.5 watts
3.75 watt-hour

Overall Schematic Diagram
Fig
ure
12
. O
ve
rall
Sche
ma
tic D
iag
ram
of
the
So
lar
– P
ow
ere
d A
C/D
C P
ow
er
Sup
ply
fo
r E
lectr
on
ics E
ng
ine
erin
g
La
bo
rato
ry

Design Computation
I. Solar Charger
Fig
ure
13
. S
ch
em
atic D
iag
ram
of
the
So
lar
Ch
arg
er
tog
eth
er
with
the
Se
rie
s -
Pa
ralle
l
Con
ne
ctio
n o
f th
e B
atte
rie
s

Solar Panel
SOLAR INSOLATION LEVELS
City Jan Feb Mar Apr May Jun Jul Aug Sep Oct Nov Dec Year
Avg
Cebu City
4.55 5.08 5.53 5.81 5.6 4.91 4.58 4.54 4.73 4.72 4.53 4.35 4.91
Manila 4.35 4.91 5.51 5.8 5.42 4.88 4.46 4.01 4.3 4.11 4.03 3.84 4.63
1. Values in kWh/m2/day
2. Source: NASA surface meteorology and solar energy. © 2012 Apricus Solar Co., Ltd. All rights reserved
The worst solar insolation in an area determines the minimum effective
daily charging time in that location. The solar insolation in Bataan is assumed to
be the same as that in Manila because it is hundreds of kilometres nearer
compared to Cebu City. The worst solar insolation is 3.84kWh/m2/day and it
occurs in December. Together with the daily power requirement of the system,
this solar insolation value will be used to solve for the number of 20-watts solar
panel required to charge the battery bank.
Solar Insolation x Solar Panel Power Rating = Harnessed Solar Power per Day
Table 4. Solar Insolation Level for Cebu and Manila

Thus,
= Number of Solar Panels
Battery
Panasonic Sealed Lead Acid battery with six (6) volts, 4.5Ah rating was
used in this design. The battery bank was set to be fully discharged after two
days of when used as specified in the duration of use. The following
computations showed how the batteries can meet the daily power consumption
of 52.552 watt-hours before it become fully discharged within two (2) days.
For the DC source:
For 6V, 4.5Ah
P = IV

( )( )
( )
For the AC Source and Charger:
( )
( )
The required voltage for the inverter to operate was only twelve (12) volts
and the maximum DC voltage range specified on the design consideration was
40V . Thus a minimum of seven (7) six - volt battery in series connection must be
used to produced the required output. In order to charged this batteries properly,
parallel configuration was used to meet the twelve (12) volts required by the
inverter and switching elements was used to charged the batteries for the DC
with additional one (1) battery. The output voltage of the charging circuit was set
to 14.4 volts to avoid lead sulfate build up mentioned on theoretical framework.
Since the LED can only handle a maximum of 30mA, a series resistor was added
to limit the current that will pass through the LED. This LED protection was

applied in the LED in the output of the regulator and in the LED in the output of
the charger.
Charging Time of the Battery
where:
Charging Current = 1.0A (Solar panel specification is 1.6A but the maximum
output current of the regulator is only 1.0A)
Battery Current Rating = 18Ah (4 branches with 4.5Ah each branch)
Considering Losses with the standard of forty percent (40%):
( )

II. Adjustable DC Stage
Eight (8) lead acid batteries were used to produce the maximum
voltage required in laboratory using linear series voltage converter.
Percentage Level of Batteries (%) Charging Time (h)
0 25.2
25 18.9
50 `12.6
75 6.3
Table 5. Charging Time Table

The circuit above could generate a maximum DC voltage of 50 volts that
could deliver 2A current. The 40 volts was within the maximum output voltage
thus achieving the stated objective. The voltage was varied by adjusting the
resistance value of the potentiometers RV1 and RV2. Increasing the resistance
on RV1 decreased the voltage output with respect to Ohm's Law (resistance and
voltage is inversely proportional with each other) while increasing the value of
RV2 increased the value of the output because the output was parallel with the
Figure 14. Schematic Diagram of Adjustable DC Stage

RV2 (the higher the resistance the lower the voltage that will pass through the
RV2). The figure below showed the effect of varying the two variable resistors to
the output voltage. When RV1 was set to 0Ω, the resistor became shorted thus
the output will be purely dependent with the resistance of RV2. When RV2 was
set to 0Ω, the output voltage was the forward voltage drop in the LED. The output
voltage can computed using Kirchhoff's voltage law (the sum of all the voltages
around the loop is equal to zero).
At no load condition, the output voltage can be determined at RV1 set to
minimum and RV2 set to maximum:
:
(a.) (b.) (c.)
Figure 15. The schematic representation of the: (a.) output stage of the adjustable
DC, (b.) At RV1 minimum and RV2 was set to maximum, and (c.) At
RV2 minimum and RV1 was set to maximum

Thus,
At RV2 set to minimum and RV1 set to maximum, the output voltage will
be the forward voltage drop of the LED which was approximately 0.7 volts.
The maximum voltage was set to 40 volts with the R5 and R6 through the
LM317. LM317 was a monolithic integrated circuit which is an adjustable linear

series voltage regulator with three (3) – terminal, positive - voltage regulator
designed that can supply more than 1.5A of load current with an output voltage
adjustable over a 1.2V to 37V range. It employs internal current limiting, thermal
shutdown, and safe area compensation.
The designation of values for R5 and R6 to produce the maximum output
voltage of 40V was derived from the equation given on the manufacturer’s
datasheet.
(
)
Iadj was controlled to less than 100µA,
(
) ( )

III. Adjustable AC Stage
An inverter was used to convert the DC voltage into AC voltage. Inside the
inverter was the buck converter that step down the 12V DC voltage to 5V DC
output on the universal serial bus output terminal. The AC waveform from the
inverter was phase shifted by the R3 and RV1 with C1 so that reduced
amplitude, phase delayed version of the AC waveform appears across C1.
When the amplitude across C1 reaches the breakover voltage of the DIAC, the
capacitor will discharge through the DIAC, thus also triggering the TRIAC into
Figure 16. Schematic Diagram of Adjustable AC Stage with the Charger

conduction. The TRIAC will conduct for the remainder of the AC waveform of the
half cycle, then turning off once zero voltage was reached. The process was
repeated for every cycle, only changing the polarity of the DIAC to be triggered
into conduction. As the resistance of RV1 was varied, the amount of phase delay
in the waveform across the capacitor also varies. This allowed the time during
each half cycle to control the firing time of the TRIAC and in turn the amount of
power delivered to the load can be varied. When the resistance of the
potentiometer was set to zero, the amplitude of the AC will peak to its maximum
value. The transformer will down convert the regulated AC waveform into the
maximum 50V in accordance to the maximum voltage required on the laboratory.
Programming Tools
The purpose of the microcontroller was to command the liquid crystal
display to give warning and important instruction in using the power supply.

(a.)
(b.)

(c.)
Figure 17. (a.) Circuit, (b.) Block Diagram of the Gizduino, and (c.) Schematic Diagram of the Microcontroller Unit

System Flowchart
Component Specification
SOLAR CHARGER
COMPONENT DESCRIPTION USAGE
Solar Panel
Power = 20 Watts
Current = 1.16A
Voltage = 17.6 Pmax
Open Circuit Voltage = 21 V
Converts solar light energy to
direct current voltage
Energy source of the power
supply
Battery
Panasonic Sealed Lead
Acid Battery
Voltage = 6V
Ampere Rating = 4.5AH
Stores the charge generated by
the solar panel
Power source of the power
supply
START
“USE 50V MAX -->FOR DC ONLY!”
“SOLAR POWERED POWER SUPPLY”
“USE 12V MAX -->FOR AC ONLY!”
END

7805
LM7805 IC
(Positive Voltage Regulator)
Can deliver up to 1.5 A of
output current
Regulates the varying DC voltage
from the solar panel to have a
stable DC output from the
converter
C1, C2 220µF electrolytic capacitor
Blocks ripple voltage from
entering the regulator
Filters DC voltage to have an
output with low ripple voltage
R1, R2 1.0kΩ resistor Current limiter for red LED
D4 Red LED
Indicates if the output of the solar
panel is enough or is entering the
charger circuit
R3 470Ω resistor Voltage limiter for analog input
port 2 on the microcontroller
Boost
Converter
eDC-2420 Step Up DC/DC converter can generate up to 24VDC output from a single +5V input. Available output power ranges from 2.5W with 5.0V input, rising in proportion to the input up to 7.5W at +12V input.
Increases the voltage from the regulator to 14.4V to charge the batteries. Boost converter will work with up to +12VDC input. Higher input voltage correspondingly results in increased output wattage reserve. Based from the technical manual, the converter has 4W when operated with +12VDC input.
C3 220µF electrolytic capacitor
Filters DC voltage to have an
output with low ripple voltage and
noise

D1, D2
1N5402 Diode
(Blocking Diode)
Blocking Voltage = 200V
Non−Repetitive Peak
Reverse Voltage = 300V
Average Rectified Forward
Current = 3A
Ensures that if there was low or
no voltage coming from the solar
panel the voltage from the battery
will be blocked from entering the
converter and regulator to
prevent damaging the
components
R4, R5 22kΩ and 2.2kΩ resistor
(Voltage Divider Network)
Ensures that the voltage entering
the analog input port 0 is within
the range of 0 - 5V
D3 Green LED Indicates if there is an output in
the charger
ADJUSTABLE DC SUPPLY
COMPONENT DESCRIPTION USAGE
Q1 TIP42C
Increases the voltage and current
capacity of LM317 using power
amplifier configuration with R4 and
R5
R4, R3 3.9Ω, 22Ω Limits the current that will pass
through the LM317 regulator
C1 100µF Filters ripple voltage to prevent
damage to DC components
U1 LM317 IC
(Adjustable Regulator)
Regulates the desired DC voltage
output and
R5, R6 6.8KΩ, 220Ω resistors Produces the required output of
the LM317
C2 10µF electrolytic capacitor
(Bypass Capacitor)
Ensures that ripple voltage will be
grounded and would not sum up
with the DC output

D1 1N4004 Diode
(Clamp Diode)
Protects the regulator from output
polarity reversals during start-up
and short-circuit operation
C3,C4 0.01µF, 220µF electrolytic
capacitor
Improves transient response of the
circuit
R7 4.7kΩ resistor Serves as current limiting resistor
for load protection
RV1, RV2 250kΩ resistor Adjusts the output voltage to get
desired value
D2 Green LED
Indicates whether the circuit is
operational and if the voltage is
reaching the output stage
ADJUSTABLE AC SUPPLY
COMPONENT DESCRIPTION USAGE
Inverter
Power Rating = 100W
Input Voltage = 12V DC
Output Voltage = 220V AC
Converts the DC to AC waveform
R3 10kΩ potentiometer Reduces the amplitude of the AC
from the inverter
RV1 500kΩ potentiometer Controls the amplitude of the AC
waveform received by the R3
D3 Diac
(Diode for AC)
Triggers the triac to conduction
mode
U1 Triac
(Triode for AC)
Controls the full waveform of the
AC voltage
C1 56nF electrolytic capacitor
Reduces the amplitude and phase
delay of the AC waveformControls
the time triggering of the diac and
triac

TR1
Step-down Transformer
Current = 3A
Voltage Conversion =
220V to 50V
Down converts the AC voltage to a
maximum of 50V
J1 USB port Serves as the output terminal of
5V DC charger
Power Supply Specifications
AC OUTPUT DC OUTPUT CHARGER
Voltage Range 0 - 50V AC 0 - 50V DC 5V 0.5V DC
Maximum Current 3A 2A 500mA
Duration of Use
Per Day 6 hours 10 hours 1.5 hours
Per Session
hours
hours
hours
Charging Time
75% 6.3 hours 9.45V DC
50% 12.6 hours 6.3V DC
25%
(not recommended) 18.9 hours 3.15V DC
0%
(not recommended) 25.2 hours 0V DC

Chapter 6
Results and Discussion
This chapter summarizes and interprets all the data collected to assess
the performance of the system. The tests conducted include those for voltage
stability, voltage regulation and efficiency.
Voltage Stability
Voltage stability measures the output voltage deviation of the power
supply with respect to time of operation and with the changing of input.
INPUT VOLTAGE
(VDC)
TIME LAPSE
(MINUTES)
OUTPUT VOLTAGE
(VDC)
52.5 10 40.0
52.5 20 40.0
52.5 30 39.9
52.5 40 40.1
52.5 50 40.0
52.4 60 40.0
52.4 70 39.8
52.4 80 40.0
52.4 90 40.0
52.4 100 40.0

52.4 110 40.0
52.3 120 40.0
Table 6. Voltage Stability Results for DC Power Supply
Mean = (8)(40) + 39.9 + 40.1 + 39.8 + 40.2
12
Mean = 40
Variance = ( ) ( )
( )
Variance = 0.005
Standard Deviation = √
Standard Deviation = 0.171
The DC output of the power supply was set to operate continuously for a
maximum of two hours every laboratory class. In the table above, the expected
output should be 40V DC. By solving for the standard deviation, it was calculated
that the output voltage of the circuit only varies from the expected output by
0.171 volts.
Within two hours of using the DC supply, the rate of discharge of the
battery showed that it can maintain the expected output voltage continuously
within the set time of operation.

INPUT VOLTAGE (VDC)
TIME LAPSE (MINUTES)
OUTPUT VOLTAGE (VAC)
12.4 5 15.5
12.3 10 15.7
12.3 15 15.8
12.3 20 15.8
12.3 25 15.8
12.3 30 15.8
12.3 35 15.8
12.3 40 15.8
12.2 45 15.8
12.2 50 15.8
12.2 55 15.8
12.2 60 15.8
Mean = 15.5 + 15.7 + (10)(15.8)
12
Mean = 15.767
Variance = ( ) ( ) ( ) ( )
( )
Variance = 0.093
Standard Deviation = √
Standard Deviation = 0.305
Table 7. Voltage Stability Results for AC Power Supply

The AC output of the power supply was set to operate continuously for a
maximum of one hour every laboratory class. In the table above, the expected
output should be 15.8V AC. By solving for the standard deviation, it was
calculated that the output voltage of the circuit only varies from the expected
output by 0.305 volts.
Within one hour of using the AC supply, the discharge of the battery
showed that it can maintain the expected output voltage continuously within the
set time of operation.
Voltage Regulation
Voltage regulation is the measure of change in voltage magnitude
between the sending and receiving end of a component. Voltage regulation
describes the ability of the system to provide near constant voltage over a wide
range of load conditions. It is expressed as the ratio of the difference between
no-load and full-load output voltage of a device to the full load output voltage,
expressed as a percentage.
( )

NO LOAD OUTPUT
VOLTAGE (VDC) LOAD
OUTPUT VOLTAGE
WITH LOAD (VDC)
VOLTAGE
REGULATION
PERCENTAGE (%)
30 1050Ω 9.6 212
30 1100Ω 10.2 194
30 1150Ω 11.4 163
30 1200Ω 12.6 138
30 1250Ω 13.7 118
30 1300Ω 15.5 93
30 1350Ω 17 76
30 1400Ω 19.6 53
30 1450Ω 20.4 47
30 1500Ω 22.5 33
30 1550Ω 25.7 16
30 1600Ω 27.5 9
30 1650Ω 28.5 5
30 1700Ω 29.4 2
30 1750Ω 29.5 1
30 1800Ω 29.6 1
30 1850Ω 29.8 0.67
30 1900Ω 30 0
30 1950Ω 30 0
30 2000Ω 30 0
30 2050Ω 30.4 -1
30 2100Ω 31.2 -1
30 2150Ω 31.6 -1
30 2200Ω 32.3 -2
30 2250Ω 32.8 -4
30 2300Ω 33 -5
30 2350Ω 33.9 -5
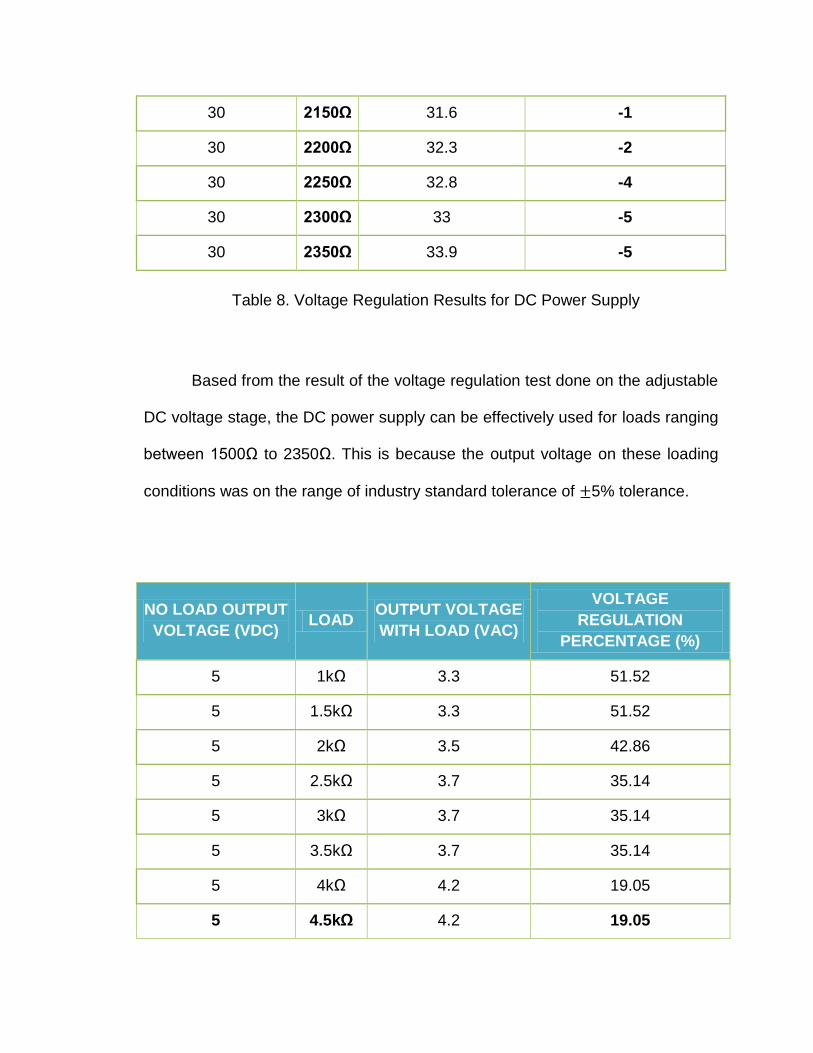
Based from the result of the voltage regulation test done on the adjustable
DC voltage stage, the DC power supply can be effectively used for loads ranging
between 1500Ω to 2350Ω. This is because the output voltage on these loading
conditions was on the range of industry standard tolerance of 5% tolerance.
NO LOAD OUTPUT
VOLTAGE (VDC) LOAD
OUTPUT VOLTAGE
WITH LOAD (VAC)
VOLTAGE
REGULATION
PERCENTAGE (%)
5 1kΩ 3.3 51.52
5 1.5kΩ 3.3 51.52
5 2kΩ 3.5 42.86
5 2.5kΩ 3.7 35.14
5 3kΩ 3.7 35.14
5 3.5kΩ 3.7 35.14
5 4kΩ 4.2 19.05
5 4.5kΩ 4.2 19.05
Table 8. Voltage Regulation Results for DC Power Supply

5 5kΩ 4.5 11.11
5 5.5kΩ 4.7 6.38
5 6kΩ 4.8 4.17
5 6.5kΩ 4.8 4.17
5 7kΩ 4.9 2.04
5 7.5kΩ 5 0.00
5 8kΩ 5 0.00
5 8.5kΩ 5 0.00
5 9kΩ 5 0.00
5 9.5kΩ 5 0.00
5 10kΩ 5.1 -1.96
5 10.5kΩ 5.2 -3.85
5 11kΩ 5.2 -3.85
5 11.5kΩ 5.2 -3.85
5 12kΩ 5.3 -5.66
5 12.5kΩ 5.4 -7.41
Table 9. Voltage Regulation for AC Power supply
Based from the results of the voltage regulation test for the adjustable AC
stage, the AC power supply can be effectively used for the load between 4.5kΩ
to 10.5kΩ. This is because the output voltage on these loading conditions was
on the range of industry standard tolerance of 5% tolerance.

Efficiency
Efficiency is the measure of how much power at the input appears at the
output and therefore, less waste. Efficiency measurement for dc-dc power
supplies is carried out in a similar fashion as ac-dc power supplies. In the case of
DC - DC power supplies, there will be no specifications for power factor, total
harmonic distortion and frequency. There are no changes in the loading
calculations for dc-dc power supplies. The formula for efficiency is the ratio of
output power to the input power.
∑
Where
η = Efficiency (%)
Po, i = Ouput power of the ith output
Pin = Input power
To test the efficiency for both DC and AC power supply, the power input
and output at 50% load regulation was used. For DC, the output voltage varies
from 30V to 19.6V with a resistance of 1400Ω and has an output power of
0.27W. For AC, the output voltage varies from 5.3V to 3.3V with a resistance of
1000 to 1500 ohms and has an output power of 0.01W.

DC SUPPLY EFFICIENCY AC SUPPLY EFFICIENCY
By getting the average efficiency of the DC and AC supply, the overall
system efficiency was 92.79%.

Chapter 7
Conclusion and Recommendation
Solar Powered AC/DC Power Supply for Electronics Engineering was a
solar independent stand-alone power supply for laboratory excercises of
Electronics Engineering students. The power supply was designed in accordance
to the power requirements in the laboratory of Bataan Peninsula State University,
College of Engineering and Architecture, Department of Electronics Engineering.
The power supply was divided into three main stages: the solar charger stage
composed of a boost converter, adjustable AC stage (0 to 50V AC) regulated by
a DIAC and TRIAC phase control with a step – down transformer and adjustable
DC (0.7 to 50V DC) composed of linear series voltage converter. The AC can be
used for six (6) hours per day, the DC can for ten (10) hours per day, and the
charger for one and a half hours (1½ ) per day. The AC and DC output of the
power supply was not intended for simultaneous operation.
The following were the recommendations based from the testing and
results gathered by the proponents:
1. Minimize the number of batteries and switches used in this design that
can be done using a switch mode buck-boost converter with its greater
efficiency advantage but consider the ripple and noise implications

2. Digital display for the output terminal of AC and DC voltages battery state
and conditions to enhance the safety and accuracy of the power supply
3. Use a voltage buffer and attenuator before the output stages to isolate
each stage to the load to improve its load regulation and line regulation to
avoid the loading effects.
4. Improve the interface of power supply to the user making it for easier to
the students to use.
6. Increase the system efficiency.
7. Improve the voltage stability.
8. Developed the system so that AC and DC and charger can be used
simultaneously.

References
Mohan, Undeland and Robbins, Wiley. (1989) Power Electronics: Converters,
Applications and Design.
B. M Hasaneen and Adel A. Elbaset Mohammed. (2008, December) Design and
Simulation of DC/DC Boost Converter.
Wens, M. Steyaert, M. (2011) DC - DC converter.
Dallas Semiconductor. (2000, October 19) DC-DC Converter Tutorial - MAXIM
power supply circuits.
Muhammad H. Rashid. (2001) Power Electronics Handbook. University of West
Florida
Boylestad, Robert l. and Nashelsky, Louis. (2009) Electronic Devices and Circuit
Theory, 10th Edition
Solar Energy. (2015, February 9)
Available: http://en.wikipedia.org/wiki/Solar_energy
(March 10, 2015)
Photovoltaics.
Available: http://en.wikipedia.org/wiki/Photovoltaics
(March 10, 2015)

Solar Charger.
Available: http://en.wikipedia.org/wiki/Solar_charger
March 10, 2015
Types of Renewable Energy.
Available: http://www.renewableenergyworld.com/rea/tech/home
(Match 10, 2015)
Why is renewable energy important?
Available: http://www.renewableenergyworld.com/rea/tech/why
(March 10, 2015)
Power Reliability
Available: http://www.westernpower.com.au/customer-service-power-
reliability-and-quality.html
(March 10, 2015)
Solar Power.
Available: http://www.westernpower.com.au/customer-service-power-
reliability-and-quality.html
(March 11, 2015)

Hnin Mar Wai and Zaw Min Min Htun. Design and Construction of Variable DC
Source for Laboratory Using Solar Energy.
Available: www.ijecse.org
(March 11, 2015)
Uses of Solar Energy.
Available: http://www.solarbuzz.com/going-solar/using/uses
(March 2015)
Why Solar?
Available:http://www.engineering.com/SustainableEngineering/Renewable
EnergyEngineering/SolarEnergyEngineering/WhySolarEnergy/tabid/3893/
Default.aspx
(March 2015)
Copyright © 2022 FDOKUMEN