Solar photocatalysis for the abatement of emerging micro-contaminants in wastewater: Synthesis,...
9
Applied Catalysis B: Environmental 117–118 (2012) 283–291 Contents lists available at SciVerse ScienceDirect Applied Catalysis B: Environmental jo ur n al homepage: www.elsevier.com/locate/apcatb Solar photocatalysis for the abatement of emerging micro-contaminants in wastewater: Synthesis, characterization and testing of various TiO 2 samples Helen Dimitroula a , Vasileia M. Daskalaki a , Zacharias Frontistis a , Dimitris I. Kondarides b , Paraskevi Panagiotopoulou b , Nikolaos P. Xekoukoulotakis a , Dionissios Mantzavinos a,∗ a Department of Environmental Engineering, Technical University of Crete, Polytechneioupolis, GR-73100 Chania, Greece b Department of Chemical Engineering, University of Patras, GR-26504 Patras, Greece a r t i c l e i n f o Article history: Received 10 November 2011 Received in revised form 17 January 2012 Accepted 18 January 2012 Available online 28 January 2012 Keywords: Characterization Degradation Estrogenicity Kinetics Preparation a b s t r a c t The photocatalytic degradation of a mixture of three compounds spiked in secondary treated wastewa- ter by means of simulated solar radiation over titania suspensions was investigated. Bisphenol-A (BPA) and 17-ethynylestradiol (EE2) were chosen as representatives of emerging micro-contaminants, while phenol was chosen as a reference contaminant. Ten titania samples were synthesized and employed to evaluate the effect of doping with nitrogen, phosphorous, calcium, silver, sodium and potassium, as well as platinum dispersion on photocatalytic activity. The catalysts were characterized by X-ray diffraction, diffuse reflectance UV–vis spectroscopy, nitrogen physisorption and selective chemisorption of CO or hydrogen. A 0.5% Pt/TiO 2 catalyst (38 m 2 /g surface area, 72:28 anatase:rutile, 20 and 2 nm crystallite size for TiO 2 and Pt, respectively) was highly active for the degradation of the contaminants, whose reactiv- ity increased in the order: phenol < BPA ≤ EE2; a commercially available Aeroxide P25 TiO 2 exhibited comparable activity. The effect of various operating conditions, such as 0.5% Pt/TiO 2 concentration (125–1000 mg/L), initial contaminant concentration (100–300 g/L each), photon flux (17.4 × 10 −8 –58 × 10 −8 einstein/(L s) pro- vided by a 150 W Xenon lamp) and the water matrix (wastewater and ultrapure water), on degradation was then assessed. Reaction rates increased linearly with catalyst concentration and photon flux, con- firming the photo-induced nature of the activation of the catalytic process; likewise, a linear dependence of rate on initial concentration occurred denoting first order kinetics. Degradation in wastewater was slower than in pure water by an order of magnitude, implying the scavenging behavior of effluent’s constituents against hydroxyl radicals. The implications for tertiary wastewater treatment (e.g. mineralization, disinfection and removal of estrogenicity) are also discussed. © 2012 Elsevier B.V. All rights reserved. 1. Introduction 1.1. The broader context Heterogeneous photocatalysis based on semiconducting mate- rials and driven by ultraviolet and/or visible light has extensively been researched for the development of several environmental applications including water splitting for hydrogen production, self cleaning surfaces, as well as the decontamination and disinfection of water and air [1]. What could ideally make the process attractive and sustainable would be the use of renewable energy to activate ∗ Corresponding author. Tel.: +30 2821037797; fax: +30 2821037852. E-mail address: [email protected] (D. Mantzavinos). an inexpensive, stable, readily available and of high quantum yield semiconductor. As far as the photocatalyst is concerned, the aforementioned requirements are uniquely fulfilled by titania and the fundamen- tals of TiO 2 photocatalysis can be summarized as follows [2]: the electronic structure of TiO 2 , consisting of an empty conduc- tion band and a filled valence band, facilitates the formation of electron–hole pairs when the semiconductor absorbs photonic energy greater than its band gap energy of about 3.2 eV, i.e. at wave- lengths below about 390 nm. Holes are strong oxidizing agents and electrons are good reducing agents, therefore both promote redox reactions. Most organic photodegradation reactions utilize the oxi- dizing power of holes either directly or indirectly, i.e. through the formation of hydroxyl radicals and other reactive oxygen species. Unfortunately, the wide band gap energy of TiO 2 overlaps only in the UV region of the electromagnetic spectrum; in this view, the 0926-3373/$ – see front matter © 2012 Elsevier B.V. All rights reserved. doi:10.1016/j.apcatb.2012.01.024
Transcript of Solar photocatalysis for the abatement of emerging micro-contaminants in wastewater: Synthesis,...
Sw
HPa
b
a
ARRAA
KCDEKP
1
1
rbacoa
0d
Applied Catalysis B: Environmental 117– 118 (2012) 283– 291
Contents lists available at SciVerse ScienceDirect
Applied Catalysis B: Environmental
jo ur n al homepage: www.elsev ier .com/ locate /apcatb
olar photocatalysis for the abatement of emerging micro-contaminants inastewater: Synthesis, characterization and testing of various TiO2 samples
elen Dimitroulaa, Vasileia M. Daskalakia, Zacharias Frontistisa, Dimitris I. Kondaridesb,araskevi Panagiotopouloub, Nikolaos P. Xekoukoulotakisa, Dionissios Mantzavinosa,∗
Department of Environmental Engineering, Technical University of Crete, Polytechneioupolis, GR-73100 Chania, GreeceDepartment of Chemical Engineering, University of Patras, GR-26504 Patras, Greece
r t i c l e i n f o
rticle history:eceived 10 November 2011eceived in revised form 17 January 2012ccepted 18 January 2012vailable online 28 January 2012
eywords:haracterizationegradationstrogenicityineticsreparation
a b s t r a c t
The photocatalytic degradation of a mixture of three compounds spiked in secondary treated wastewa-ter by means of simulated solar radiation over titania suspensions was investigated. Bisphenol-A (BPA)and 17�-ethynylestradiol (EE2) were chosen as representatives of emerging micro-contaminants, whilephenol was chosen as a reference contaminant. Ten titania samples were synthesized and employed toevaluate the effect of doping with nitrogen, phosphorous, calcium, silver, sodium and potassium, as wellas platinum dispersion on photocatalytic activity. The catalysts were characterized by X-ray diffraction,diffuse reflectance UV–vis spectroscopy, nitrogen physisorption and selective chemisorption of CO orhydrogen.
A 0.5% Pt/TiO2 catalyst (38 m2/g surface area, 72:28 anatase:rutile, 20 and 2 nm crystallite size forTiO2 and Pt, respectively) was highly active for the degradation of the contaminants, whose reactiv-ity increased in the order: phenol < BPA ≤ EE2; a commercially available Aeroxide P25 TiO2 exhibitedcomparable activity.
The effect of various operating conditions, such as 0.5% Pt/TiO2 concentration (125–1000 mg/L), initialcontaminant concentration (100–300 �g/L each), photon flux (17.4 × 10⁻⁸–58 × 10−8 einstein/(L s) pro-vided by a 150 W Xenon lamp) and the water matrix (wastewater and ultrapure water), on degradationwas then assessed. Reaction rates increased linearly with catalyst concentration and photon flux, con-
firming the photo-induced nature of the activation of the catalytic process; likewise, a linear dependenceof rate on initial concentration occurred denoting first order kinetics. Degradation in wastewater wasslower than in pure water by an order of magnitude, implying the scavenging behavior of effluent’sconstituents against hydroxyl radicals.The implications for tertiary wastewater treatment (e.g. mineralization, disinfection and removal ofestrogenicity) are also discussed.
. Introduction
.1. The broader context
Heterogeneous photocatalysis based on semiconducting mate-ials and driven by ultraviolet and/or visible light has extensivelyeen researched for the development of several environmentalpplications including water splitting for hydrogen production, selfleaning surfaces, as well as the decontamination and disinfection
f water and air [1]. What could ideally make the process attractivend sustainable would be the use of renewable energy to activate∗ Corresponding author. Tel.: +30 2821037797; fax: +30 2821037852.E-mail address: [email protected] (D. Mantzavinos).
926-3373/$ – see front matter © 2012 Elsevier B.V. All rights reserved.oi:10.1016/j.apcatb.2012.01.024
© 2012 Elsevier B.V. All rights reserved.
an inexpensive, stable, readily available and of high quantum yieldsemiconductor.
As far as the photocatalyst is concerned, the aforementionedrequirements are uniquely fulfilled by titania and the fundamen-tals of TiO2 photocatalysis can be summarized as follows [2]:the electronic structure of TiO2, consisting of an empty conduc-tion band and a filled valence band, facilitates the formation ofelectron–hole pairs when the semiconductor absorbs photonicenergy greater than its band gap energy of about 3.2 eV, i.e. at wave-lengths below about 390 nm. Holes are strong oxidizing agents andelectrons are good reducing agents, therefore both promote redoxreactions. Most organic photodegradation reactions utilize the oxi-
dizing power of holes either directly or indirectly, i.e. through theformation of hydroxyl radicals and other reactive oxygen species.Unfortunately, the wide band gap energy of TiO2 overlaps onlyin the UV region of the electromagnetic spectrum; in this view, the
2 B: Env
penbv
1
dmtwo[siEppm
ewstupaax
1
84 H. Dimitroula et al. / Applied Catalysis
rocess can utilize only about 6% of the solar energy reaching thearth’s surface [3]. This limitation can be overcome modifying tita-ia through e.g. doping with metals and non-metals to narrow theand gap energy and, consequently, enhance photoactivity underisible light [2,3].
.2. The specific problem
In recent years, there have been intensive efforts toward theevelopment of efficient technologies for the removal of persistenticro-contaminants from aqueous matrices. Discharges of conven-
ional wastewater treatment plants (WWTPs) typically contain aide array of such compounds at the ng/L–�g/L levels that can
nly partially be removed by biological and/or adsorption processes4]. Among others, endocrine disrupting compounds (EDCs) con-titute an important class of such contaminants, which pose anncreasing threat to aquatic organisms, as well as to human health.DCs include naturally occurring estrogens, synthetic estrogens,hyto-estrogens and xeno-estrogens (i.e. pesticides, plasticizers,ersistent organochlorines, organohalogens, alkyl phenols, heavyetals) [5].In this work, a mixture of bisphenol-A (BPA), 17�-
thynylestradiol (EE2) and phenol was spiked in secondaryastewater and treated by means of solar photocatalysis in titania
uspensions. BPA was chosen as a representative xeno-estrogenypically used in the manufacturing of numerous chemical prod-cts, while EE2 is a synthetic estrogen used in the oral contraceptiveill. Both are thought to be associated with endocrine disruption,s well as several other adverse effects [6,7]. Phenol was chosens a reference compound since it is the precursor of numerousenobiotics in the environment.
.3. Research aims
The aim of this work was three-fold:
(i) To prepare and characterize various TiO2 samples that couldpotentially function as effective photocatalysts. Nitrogen andphosphorous were chosen as examples of non-metallic dopantelements that may be used to expand the spectral responseof TiO2 into the visible region of the electromagnetic spec-trum by shifting the valence band edge of the semiconductorupwards to narrow its band gap energy [8,9]. Potassium,sodium and calcium were employed as surface promoters thatmay result in the creation of oxygen vacancies on the TiO2surface [10,11] and, therefore, promote adsorption of O2 andoxidation of organic compounds [12]. Deposition of Pt crys-
tallites on the photocatalyst surface is known to decrease therate of electron–hole recombination [13], which is one of thekey factors that limit overall photocatalytic efficiency. A sim-ilar effect is expected for Ag deposits which, depending onOH
phenol
C
CH3
CH3
HO
bisph enol A (B PA)
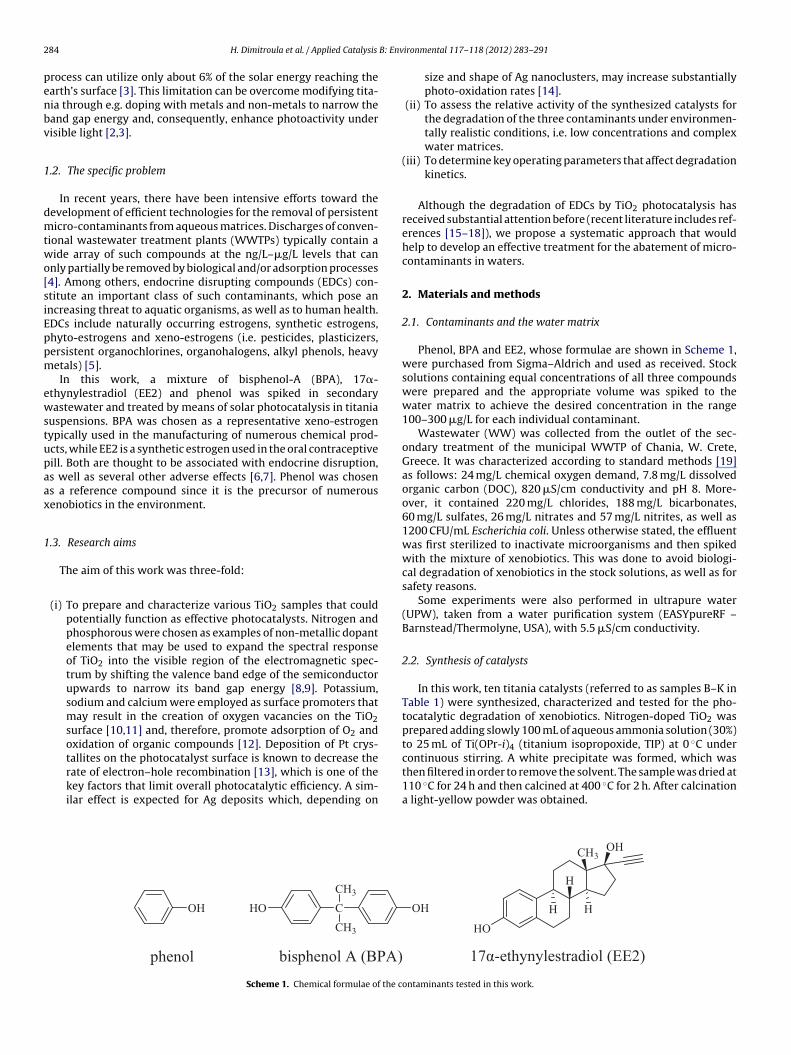
Scheme 1. Chemical formulae of the c
ironmental 117– 118 (2012) 283– 291
size and shape of Ag nanoclusters, may increase substantiallyphoto-oxidation rates [14].
(ii) To assess the relative activity of the synthesized catalysts forthe degradation of the three contaminants under environmen-tally realistic conditions, i.e. low concentrations and complexwater matrices.
(iii) To determine key operating parameters that affect degradationkinetics.
Although the degradation of EDCs by TiO2 photocatalysis hasreceived substantial attention before (recent literature includes ref-erences [15–18]), we propose a systematic approach that wouldhelp to develop an effective treatment for the abatement of micro-contaminants in waters.
2. Materials and methods
2.1. Contaminants and the water matrix
Phenol, BPA and EE2, whose formulae are shown in Scheme 1,were purchased from Sigma–Aldrich and used as received. Stocksolutions containing equal concentrations of all three compoundswere prepared and the appropriate volume was spiked to thewater matrix to achieve the desired concentration in the range100–300 �g/L for each individual contaminant.
Wastewater (WW) was collected from the outlet of the sec-ondary treatment of the municipal WWTP of Chania, W. Crete,Greece. It was characterized according to standard methods [19]as follows: 24 mg/L chemical oxygen demand, 7.8 mg/L dissolvedorganic carbon (DOC), 820 �S/cm conductivity and pH 8. More-over, it contained 220 mg/L chlorides, 188 mg/L bicarbonates,60 mg/L sulfates, 26 mg/L nitrates and 57 mg/L nitrites, as well as1200 CFU/mL Escherichia coli. Unless otherwise stated, the effluentwas first sterilized to inactivate microorganisms and then spikedwith the mixture of xenobiotics. This was done to avoid biologi-cal degradation of xenobiotics in the stock solutions, as well as forsafety reasons.
Some experiments were also performed in ultrapure water(UPW), taken from a water purification system (EASYpureRF –Barnstead/Thermolyne, USA), with 5.5 �S/cm conductivity.
2.2. Synthesis of catalysts
In this work, ten titania catalysts (referred to as samples B–K inTable 1) were synthesized, characterized and tested for the pho-tocatalytic degradation of xenobiotics. Nitrogen-doped TiO2 wasprepared adding slowly 100 mL of aqueous ammonia solution (30%)to 25 mL of Ti(OPr-i)4 (titanium isopropoxide, TIP) at 0 ◦C under
continuous stirring. A white precipitate was formed, which wasthen filtered in order to remove the solvent. The sample was dried at110 ◦C for 24 h and then calcined at 400 ◦C for 2 h. After calcinationa light-yellow powder was obtained.HO
OHCH3
HH
H
17α-ethynylestr adiol (EE2)
OH
ontaminants tested in this work.
H. Dimitroula et al. / Applied Catalysis B: Environmental 117– 118 (2012) 283– 291 285
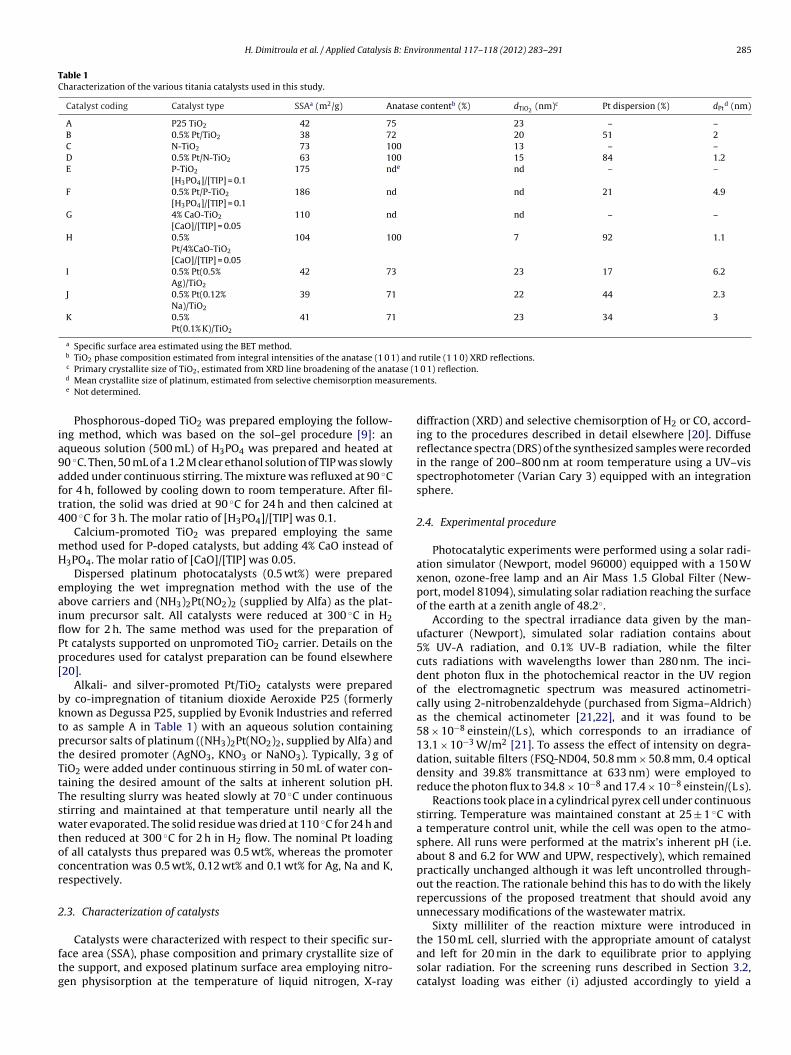
Table 1Characterization of the various titania catalysts used in this study.
Catalyst coding Catalyst type SSAa (m2/g) Anatase contentb (%) dTiO2(nm)c Pt dispersion (%) dPt
d (nm)
A P25 TiO2 42 75 23 – –B 0.5% Pt/TiO2 38 72 20 51 2C N-TiO2 73 100 13 – –D 0.5% Pt/N-TiO2 63 100 15 84 1.2E P-TiO2
[H3PO4]/[TIP] = 0.1175 nde nd – –
F 0.5% Pt/P-TiO2
[H3PO4]/[TIP] = 0.1186 nd nd 21 4.9
G 4% CaO-TiO2
[CaO]/[TIP] = 0.05110 nd nd – –
H 0.5%Pt/4%CaO-TiO2
[CaO]/[TIP] = 0.05
104 100 7 92 1.1
I 0.5% Pt(0.5%Ag)/TiO2
42 73 23 17 6.2
J 0.5% Pt(0.12%Na)/TiO2
39 71 22 44 2.3
K 0.5%Pt(0.1% K)/TiO2
41 71 23 34 3
a Specific surface area estimated using the BET method.b TiO2 phase composition estimated from integral intensities of the anatase (1 0 1) and rutile (1 1 0) XRD reflections.
ase (1urem
ia9aft4
mH
eaiflPp[
bktptTtTswtocr
2
ftg
c Primary crystallite size of TiO2, estimated from XRD line broadening of the anatd Mean crystallite size of platinum, estimated from selective chemisorption mease Not determined.
Phosphorous-doped TiO2 was prepared employing the follow-ng method, which was based on the sol–gel procedure [9]: anqueous solution (500 mL) of H3PO4 was prepared and heated at0 ◦C. Then, 50 mL of a 1.2 M clear ethanol solution of TIP was slowlydded under continuous stirring. The mixture was refluxed at 90 ◦Cor 4 h, followed by cooling down to room temperature. After fil-ration, the solid was dried at 90 ◦C for 24 h and then calcined at00 ◦C for 3 h. The molar ratio of [H3PO4]/[TIP] was 0.1.
Calcium-promoted TiO2 was prepared employing the sameethod used for P-doped catalysts, but adding 4% CaO instead of3PO4. The molar ratio of [CaO]/[TIP] was 0.05.
Dispersed platinum photocatalysts (0.5 wt%) were preparedmploying the wet impregnation method with the use of thebove carriers and (NH3)2Pt(NO2)2 (supplied by Alfa) as the plat-num precursor salt. All catalysts were reduced at 300 ◦C in H2ow for 2 h. The same method was used for the preparation oft catalysts supported on unpromoted TiO2 carrier. Details on therocedures used for catalyst preparation can be found elsewhere20].
Alkali- and silver-promoted Pt/TiO2 catalysts were preparedy co-impregnation of titanium dioxide Aeroxide P25 (formerlynown as Degussa P25, supplied by Evonik Industries and referredo as sample A in Table 1) with an aqueous solution containingrecursor salts of platinum ((NH3)2Pt(NO2)2, supplied by Alfa) andhe desired promoter (AgNO3, KNO3 or NaNO3). Typically, 3 g ofiO2 were added under continuous stirring in 50 mL of water con-aining the desired amount of the salts at inherent solution pH.he resulting slurry was heated slowly at 70 ◦C under continuoustirring and maintained at that temperature until nearly all theater evaporated. The solid residue was dried at 110 ◦C for 24 h and
hen reduced at 300 ◦C for 2 h in H2 flow. The nominal Pt loadingf all catalysts thus prepared was 0.5 wt%, whereas the promoteroncentration was 0.5 wt%, 0.12 wt% and 0.1 wt% for Ag, Na and K,espectively.
.3. Characterization of catalysts
Catalysts were characterized with respect to their specific sur-ace area (SSA), phase composition and primary crystallite size ofhe support, and exposed platinum surface area employing nitro-en physisorption at the temperature of liquid nitrogen, X-ray
0 1) reflection.ents.
diffraction (XRD) and selective chemisorption of H2 or CO, accord-ing to the procedures described in detail elsewhere [20]. Diffusereflectance spectra (DRS) of the synthesized samples were recordedin the range of 200–800 nm at room temperature using a UV–visspectrophotometer (Varian Cary 3) equipped with an integrationsphere.
2.4. Experimental procedure
Photocatalytic experiments were performed using a solar radi-ation simulator (Newport, model 96000) equipped with a 150 Wxenon, ozone-free lamp and an Air Mass 1.5 Global Filter (New-port, model 81094), simulating solar radiation reaching the surfaceof the earth at a zenith angle of 48.2◦.
According to the spectral irradiance data given by the man-ufacturer (Newport), simulated solar radiation contains about5% UV-A radiation, and 0.1% UV-B radiation, while the filtercuts radiations with wavelengths lower than 280 nm. The inci-dent photon flux in the photochemical reactor in the UV regionof the electromagnetic spectrum was measured actinometri-cally using 2-nitrobenzaldehyde (purchased from Sigma–Aldrich)as the chemical actinometer [21,22], and it was found to be58 × 10−8 einstein/(L s), which corresponds to an irradiance of13.1 × 10−3 W/m2 [21]. To assess the effect of intensity on degra-dation, suitable filters (FSQ-ND04, 50.8 mm × 50.8 mm, 0.4 opticaldensity and 39.8% transmittance at 633 nm) were employed toreduce the photon flux to 34.8 × 10⁻⁸ and 17.4 × 10⁻⁸ einstein/(L s).
Reactions took place in a cylindrical pyrex cell under continuousstirring. Temperature was maintained constant at 25 ± 1 ◦C witha temperature control unit, while the cell was open to the atmo-sphere. All runs were performed at the matrix’s inherent pH (i.e.about 8 and 6.2 for WW and UPW, respectively), which remainedpractically unchanged although it was left uncontrolled through-out the reaction. The rationale behind this has to do with the likelyrepercussions of the proposed treatment that should avoid anyunnecessary modifications of the wastewater matrix.
Sixty milliliter of the reaction mixture were introduced in
the 150 mL cell, slurried with the appropriate amount of catalystand left for 20 min in the dark to equilibrate prior to applyingsolar radiation. For the screening runs described in Section 3.2,catalyst loading was either (i) adjusted accordingly to yield a
2 B: Environmental 117– 118 (2012) 283– 291
c(Fps
2
Wi2b3aaF2dw
S
acm
pr
3
3
lppdtp1Tpsawc
tahspirwmridt70
80706050403020
(B)
(301)
(215)(220 )
(116)(204)
(213)
(211)(105)(200)(112)
(004)
(103)
(101)
*
(310)
*
(220)
*(211)
*(111)
*(101)*
(110)
0.5% Ag
0.1% K
0.12 % Na
none
0.5% Pt-X/TiO2
Inte
nsity (
a.u
.)
80706050403020
(A)
(301)
(215)
(220)(116)
(204)
(213)
(211)(105)
(200)
(112)
(004)
(103)
(101)
0.5% Pt/N-TiO2
0.5% Pt/ 4%CaO -TiO2
Inte
nsity (
a.u
.)
Diffraction angle (2θ)
Diffraction angle (2θ)
86 H. Dimitroula et al. / Applied Catalysis
ommon surface area of 1.26 m2 in the 60 mL reaction mixturethis corresponds to a P25 TiO2 concentration of 500 mg/L) as inig. 3 or (ii) set at 500 mg/L as in Fig. 4. Samples of 0.7 mL wereeriodically drawn from the reactor, centrifuged at 13,200 rpm toeparate the catalyst particles and then analyzed as follows.
.5. Analytical protocols
High performance liquid chromatography (Alliance 2690,aters) was employed to monitor the concentration of contam-
nants. Separation was achieved on a Luna C-18(2) column (5 �m,50 mm × 4.6 mm) and a security guard column (4 mm × 3 mm),oth purchased from Phenomenex. The mobile phase consisting of5:65 ultrapure water:acetonitrile eluted isocratically at 1 mL/minnd 30 ◦C, while the injection volume was 100 �L. Detection waschieved through a fluorescence detector (Waters 474 Scanningluorescence detector), in which the excitation wavelength was80 nm and the emission wavelength was 305 nm. The limit ofetection was 0.78, 0.68 and 0.63 �g/L and the limit of quantitationas 2.65, 2.32 and 2.11 �g/L for phenol, BPA and EE2, respectively.
DOC was measured by non-dispersive infrared gas analysis on ahimadzu 5050A TOC analyzer.
The yeast estrogen screening (YES) bioassay was employed tossess changes in effluent’s estrogenicity according to the proto-ol originally developed by Routledge and Sumpter [23] with someodifications described by Frontistis et al. [24].The detection and enumeration of E. coli in the effluent were
erformed using the serial dilution spread plate agar technique aseported in detail elsewhere [25].
. Results and discussion
.1. Catalyst properties
The main physicochemical properties of the synthesized cata-ysts are summarized in Table 1, including SSA, phase composition,rimary crystallite size of the doped TiO2 support (dTiO2
), Pt dis-ersion and Pt mean crystallite size (dPt). It is observed that SSAepends strongly on the synthesis method and the nature ofhe dopant. In particular, SSA is significantly high in the case ofhosphorous- and calcium-doped TiO2 carriers, taking values of75 m2/g and 110 m2/g, respectively, while the nitrogen-dopediO2 carrier is characterized by a lower SSA of 73 m2/g. The dis-ersion of Pt on the surface of the above carriers does not changeignificantly their SSA. The alkali- and silver-promoted Pt/TiO2 cat-lysts are characterized by lower SSAs in the range 39–42 m2/g,hich are similar to those of the unpromoted Pt/TiO2 and P25 TiO2
atalysts.X-ray diffraction spectra were obtained for all bare and pla-
inized catalysts and representative results for calcium-, nitrogen-,lkali- and silver-promoted Pt/TiO2 catalysts are shown in Fig. 1. Itas been found that nitrogen-, phosphorous- and calcium-dopedamples consist of anatase TiO2, whereas alkali- and silver-romoted Pt/TiO2 catalysts consist of about 72:28 anatase:rutile,
.e. their phase composition is similar to that of the parent mate-ial (P25 TiO2). This is in agreement with previous reports [9,12],hich show that introduction of foreign atoms into the crystallineatrix of TiO2 inhibits the phase transformation of anatase to
utile upon thermal treatment and, as discussed above, also resultsn materials with high SSA. The primary crystallite size of TiO2,
etermined by XRD peak broadening of the anatase (1 0 1) reflec-ion, varies significantly from one sample to another, ranging fromnm for 0.5%Pt/4%CaO–TiO2 to 23 nm for 0.5%Pt(0.5%Ag)/TiO2 and.5%Pt(0.1%K)/TiO2 catalysts.
Fig. 1. X-ray diffraction (XRD) spectra of representative titania samples used in thiswork. Peaks marked with an asterisk correspond to the rutile phase of TiO2.
Likewise, the dispersion of Pt and, concomitantly its meancrystallite size (dPt), vary significantly, taking values between17% (dPt = 6.2 nm) for 0.5%Pt(0.5%Ag)/TiO2 to 92% (dPt = 1.1 nm) for0.5%Pt/4%CaO–TiO2.
Diffuse reflectance spectra of the synthesized samples areshown in Fig. 2. It is observed that titania doping with CaO, P orN results in a shift of the absorbance toward the visible region ofthe electromagnetic spectrum. The same is also true for the corre-sponding platinized samples. These observations are in accordancewith results of previous studies focusing on the development ofvisible light-responsive TiO2 photocatalysts, which showed thatdoping of TiO2 with various kinds of anions [8,9,26,27] or cations[28,29] may lead to a narrowing of the band gap of the semicon-ductor. In the case of anion-doped TiO2, this has been attributedto mixing of the p states of the dopant (e.g., N, P, S, C) with theO2p states of the oxide that shifts the valence band edge upwards,whereas in the case of cation-doped TiO2 it has been explained byconsidering that the overlap of the d orbitals of Ti and the d orbitalsof the dopant metal ions can introduce new states close to the con-
duction band [28,30]. It should be noted, however, that shifting theabsorption pattern of the semiconductor toward the visible spec-tral region does not necessarily result in materials with improvedphotocatalytic performance [30].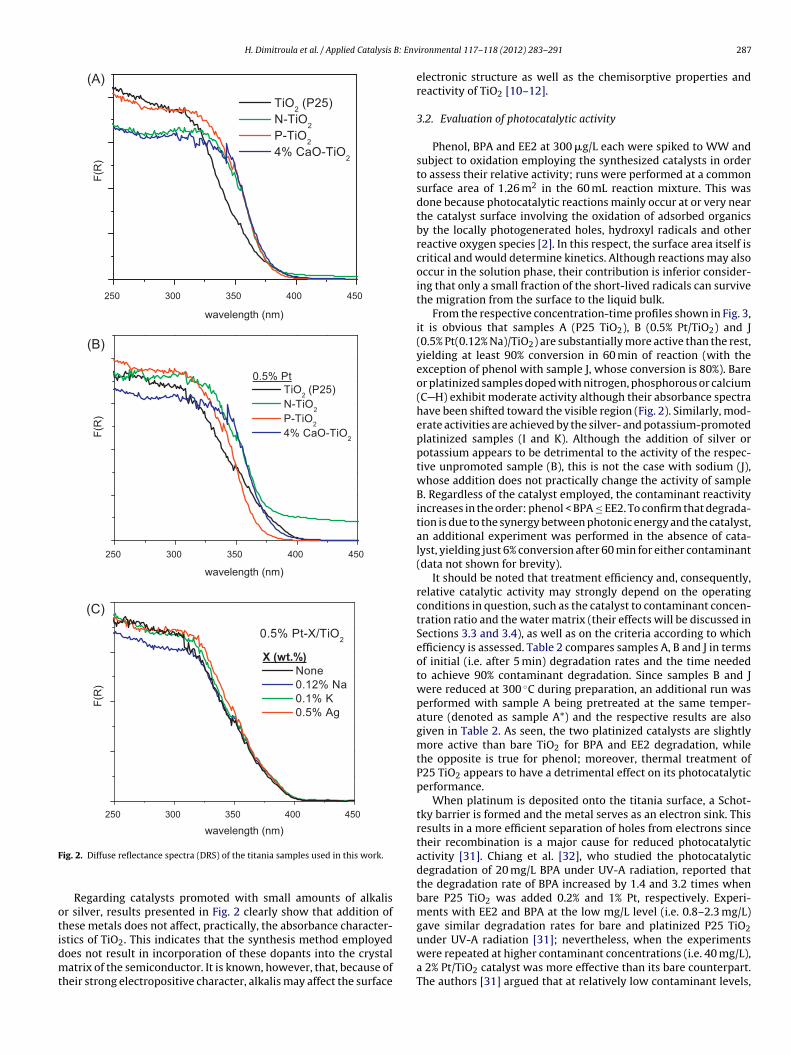
H. Dimitroula et al. / Applied Catalysis B: Env
450400350300250
(A)
TiO2 (P25 )
N-TiO2
P- TiO2
4% Ca O-TiO2
F(R
)
wavelength (nm)
450400350300250
(B)
0.5% Pt
TiO2 (P25)
N-TiO2
P-TiO2
4% CaO-TiO2
wavelength (nm)
F(R
)
450400350300250
(C)
0.5% Pt-X/TiO2
F(R
)
wavelength (nm)
X (wt. %)
Non e
0.12 % Na
0.1% K
0.5% Ag
F
otidmt
under UV-A radiation [31]; nevertheless, when the experiments
ig. 2. Diffuse reflectance spectra (DRS) of the titania samples used in this work.
Regarding catalysts promoted with small amounts of alkalisr silver, results presented in Fig. 2 clearly show that addition ofhese metals does not affect, practically, the absorbance character-stics of TiO2. This indicates that the synthesis method employed
oes not result in incorporation of these dopants into the crystalatrix of the semiconductor. It is known, however, that, because ofheir strong electropositive character, alkalis may affect the surface
ironmental 117– 118 (2012) 283– 291 287
electronic structure as well as the chemisorptive properties andreactivity of TiO2 [10–12].
3.2. Evaluation of photocatalytic activity
Phenol, BPA and EE2 at 300 �g/L each were spiked to WW andsubject to oxidation employing the synthesized catalysts in orderto assess their relative activity; runs were performed at a commonsurface area of 1.26 m2 in the 60 mL reaction mixture. This wasdone because photocatalytic reactions mainly occur at or very nearthe catalyst surface involving the oxidation of adsorbed organicsby the locally photogenerated holes, hydroxyl radicals and otherreactive oxygen species [2]. In this respect, the surface area itself iscritical and would determine kinetics. Although reactions may alsooccur in the solution phase, their contribution is inferior consider-ing that only a small fraction of the short-lived radicals can survivethe migration from the surface to the liquid bulk.
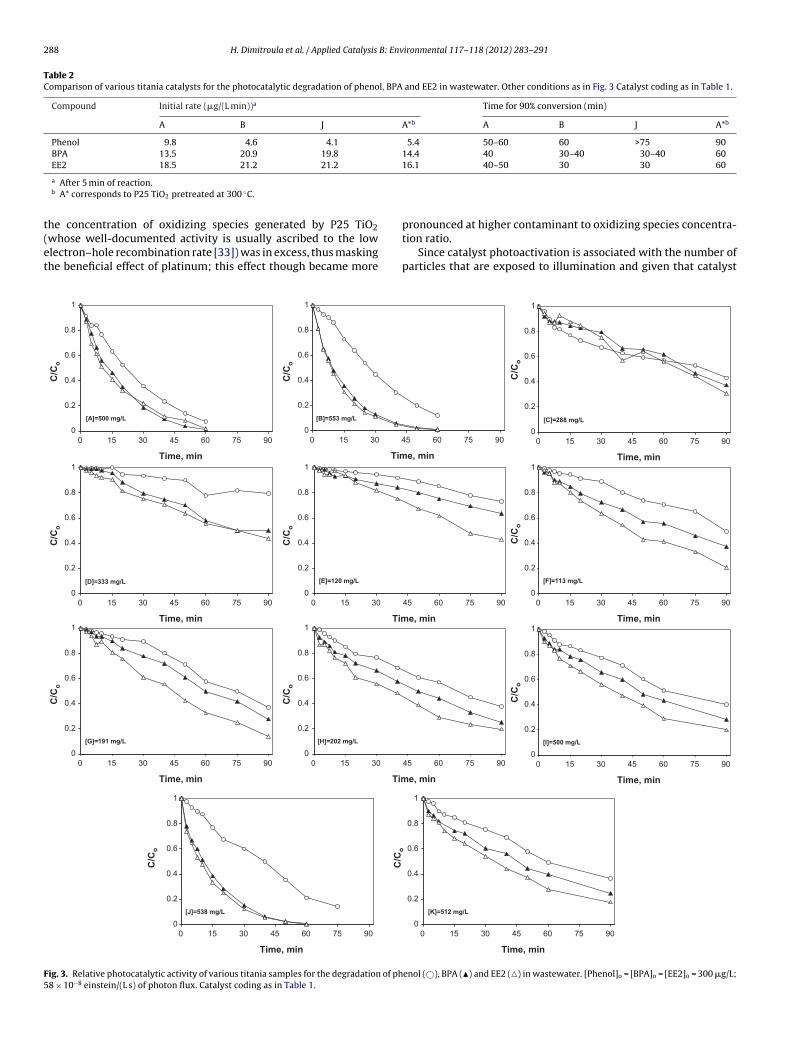
From the respective concentration-time profiles shown in Fig. 3,it is obvious that samples A (P25 TiO2), B (0.5% Pt/TiO2) and J(0.5% Pt(0.12% Na)/TiO2) are substantially more active than the rest,yielding at least 90% conversion in 60 min of reaction (with theexception of phenol with sample J, whose conversion is 80%). Bareor platinized samples doped with nitrogen, phosphorous or calcium(C H) exhibit moderate activity although their absorbance spectrahave been shifted toward the visible region (Fig. 2). Similarly, mod-erate activities are achieved by the silver- and potassium-promotedplatinized samples (I and K). Although the addition of silver orpotassium appears to be detrimental to the activity of the respec-tive unpromoted sample (B), this is not the case with sodium (J),whose addition does not practically change the activity of sampleB. Regardless of the catalyst employed, the contaminant reactivityincreases in the order: phenol < BPA ≤ EE2. To confirm that degrada-tion is due to the synergy between photonic energy and the catalyst,an additional experiment was performed in the absence of cata-lyst, yielding just 6% conversion after 60 min for either contaminant(data not shown for brevity).
It should be noted that treatment efficiency and, consequently,relative catalytic activity may strongly depend on the operatingconditions in question, such as the catalyst to contaminant concen-tration ratio and the water matrix (their effects will be discussed inSections 3.3 and 3.4), as well as on the criteria according to whichefficiency is assessed. Table 2 compares samples A, B and J in termsof initial (i.e. after 5 min) degradation rates and the time neededto achieve 90% contaminant degradation. Since samples B and Jwere reduced at 300 ◦C during preparation, an additional run wasperformed with sample A being pretreated at the same temper-ature (denoted as sample A*) and the respective results are alsogiven in Table 2. As seen, the two platinized catalysts are slightlymore active than bare TiO2 for BPA and EE2 degradation, whilethe opposite is true for phenol; moreover, thermal treatment ofP25 TiO2 appears to have a detrimental effect on its photocatalyticperformance.
When platinum is deposited onto the titania surface, a Schot-tky barrier is formed and the metal serves as an electron sink. Thisresults in a more efficient separation of holes from electrons sincetheir recombination is a major cause for reduced photocatalyticactivity [31]. Chiang et al. [32], who studied the photocatalyticdegradation of 20 mg/L BPA under UV-A radiation, reported thatthe degradation rate of BPA increased by 1.4 and 3.2 times whenbare P25 TiO2 was added 0.2% and 1% Pt, respectively. Experi-ments with EE2 and BPA at the low mg/L level (i.e. 0.8–2.3 mg/L)gave similar degradation rates for bare and platinized P25 TiO2
were repeated at higher contaminant concentrations (i.e. 40 mg/L),a 2% Pt/TiO2 catalyst was more effective than its bare counterpart.The authors [31] argued that at relatively low contaminant levels,
288 H. Dimitroula et al. / Applied Catalysis B: Environmental 117– 118 (2012) 283– 291
Table 2Comparison of various titania catalysts for the photocatalytic degradation of phenol, BPA and EE2 in wastewater. Other conditions as in Fig. 3 Catalyst coding as in Table 1.
Compound Initial rate (�g/(L min))a Time for 90% conversion (min)
A B J A*b A B J A*b
Phenol 9.8 4.6 4.1 5.4 50–60 60 >75 90BPA 13.5 20.9 19.8 14.4 40 30–40 30–40 60EE2 18.5 21.2 21.2 16.1 40–50 30 30 60
t(et
F5
a After 5 min of reaction.b A* corresponds to P25 TiO2 pretreated at 300 ◦C.
he concentration of oxidizing species generated by P25 TiO2whose well-documented activity is usually ascribed to the lowlectron–hole recombination rate [33]) was in excess, thus maskinghe beneficial effect of platinum; this effect though became more
0
0.2
0.4
0.6
0.8
1
9075604530150
Time, min
[A]=500 m g/L
0
0.2
0.4
0.6
0.8
1
430150
Tim
[B]=553 mg/L
0
0.2
0.4
0.6
0.8
1
9075604530150
Time, min
[D]=333 mg/L
0
0.2
0.4
0.6
0.8
1
30150
Tim
[E]=120 m g/L
0
0.2
0.4
0.6
0.8
1
9075604530150
Time, min
[G]=191 mg/L
0
0.2
0.4
0.6
0.8
1
30150
Tim
[H]=202 m g/L
0
0.2
0.4
0.6
0.8
1
9075604530150
Time, min
[J]=538 mg/L
C/C
C/C
o
C/C
oC
/Co
C/C
o
C/C
oC
/Co
C/C
o
ig. 3. Relative photocatalytic activity of various titania samples for the degradation of ph8 × 10−8 einstein/(L s) of photon flux. Catalyst coding as in Table 1.
pronounced at higher contaminant to oxidizing species concentra-tion ratio.
Since catalyst photoactivation is associated with the number ofparticles that are exposed to illumination and given that catalyst
9075605
e, min
0
0.2
0.4
0.6
0.8
1
9075604530150
Time, min
[C]=288 mg/L
90756045
e, min
0
0.2
0.4
0.6
0.8
1
9075604530150
Time, min
[F]=113 m g/L
90756045
e, min
0
0.2
0.4
0.6
0.8
1
9075604530150
Time, min
[I]=50 0 mg/L
0
0.2
0.4
0.6
0.8
1
9075604530150
Time, min
o
C/C
oC
/Co
C/C
o
[K]=512 m g/L
enol (©), BPA (�) and EE2 (�) in wastewater. [Phenol]o = [BPA]o = [EE2]o = 300 �g/L;
H. Dimitroula et al. / Applied Catalysis B: Env
Ftfl
lahsw(SgiHsf
3
Bs(ahaocaa
Fi[
kinetics with respect to C, i.e.:
r = −dC
dt= kC[Ox]n = kappC ⇔ ln
Co
C= kappt (1)
0
50
100
150
200
250
300
604530150
Time, min
Co
ncen
trati
on
, μ
g/L
Phenol
100
150
200
250
300
on
cen
trati
on
, μ
g/L
BPA
ig. 4. Relative initial rate of BPA and phenol degradation in wastewa-er at 500 mg/L catalyst loading. [Phenol]o = [BPA]o = [EE2]o = 300 �g/L. Photonux = 58 × 10−8 einstein/ (L s).
oading may affect the extent of light penetration in the reactornd/or its scattering [2], one may argue that relative activity shouldave been evaluated on the basis of a common mass rather thanurface area. In this view, a series of experiments were performedith samples A (P25 TiO2), C (N-TiO2), F (0.5% Pt/P-TiO2) and H
0.5% Pt/4%CaO–TiO2) at a common catalyst loading of 500 mg/L.amples C, F and H were selected because they have substantiallyreater SSAs and different structures than sample A (and B or J,ndeed). Fig. 4 shows initial degradation rates with samples C, F or
relative to the rate with sample A; as clearly seen, P25 TiO2 istill more active than the rest although the available surface areaor reactions is up to 4.5 times less.
.3. Effect of catalyst loading
The effect of 0.5% Pt/TiO2 loading on the degradation of phenol,PA and EE2 was studied in the range 125–1000 mg/L and repre-entative concentration-time profiles for BPA are shown in Fig. 5phenol and EE2 profiles exhibit similar trends and, therefore, theyre not shown for the sake of brevity). Degradation is favored atigher catalyst loadings, e.g. 90% BPA conversion can be achievedfter 25 min at 1000 mg/L or 50 min at 125 mg/L catalyst. The inset
f Fig. 5 shows a linear dependence of initial reaction rate, ro, onatalyst loading for either contaminant and this is characteristic ofheterogeneous catalytic regime [34]. Increasing catalyst loadingpparently results in an increased number of catalyst active sites
0
0.2
0.4
0.6
0.8
1
604530150
Time, min
C/C
o
1000mg/L
500mg/L
250mg/L
125mg/L
ig. 5. Effect of 0.5% Pt/TiO2 loading on the photocatalytic degradation of BPAn wastewater. Inset graph: dependence of initial rate on 0.5% Pt/TiO2 loading.Phenol]o = [BPA]o = [EE2]o = 300 �g/L. Photon flux = 58 × 10−8 einstein/ (L s).
ironmental 117– 118 (2012) 283– 291 289
that are available for photocatalytic reactions and this occurs up toa point where all catalyst particles become fully illuminated [35].
3.4. Effects of initial contaminant concentration and the watermatrix
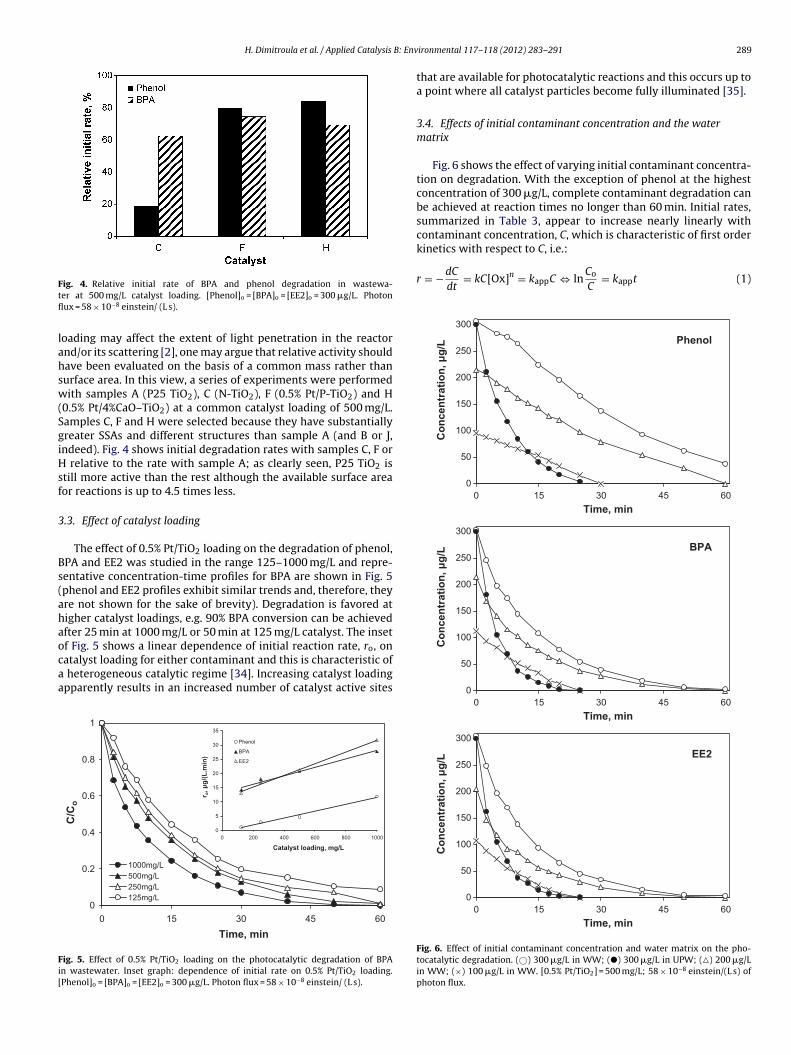
Fig. 6 shows the effect of varying initial contaminant concentra-tion on degradation. With the exception of phenol at the highestconcentration of 300 �g/L, complete contaminant degradation canbe achieved at reaction times no longer than 60 min. Initial rates,summarized in Table 3, appear to increase nearly linearly withcontaminant concentration, C, which is characteristic of first order
0
50
604530150
Time, min
C
0
50
100
150
200
250
300
604530150
Time, min
Co
ncen
trati
on
, μ
g/L
EE2
Fig. 6. Effect of initial contaminant concentration and water matrix on the pho-tocatalytic degradation. (©) 300 �g/L in WW; (�) 300 �g/L in UPW; (�) 200 �g/Lin WW; (×) 100 �g/L in WW. [0.5% Pt/TiO2] = 500 mg/L; 58 × 10−8 einstein/(L s) ofphoton flux.
290 H. Dimitroula et al. / Applied Catalysis B: Environmental 117– 118 (2012) 283– 291
Table 3Effect of initial contaminant concentration and photon flux on the initial degradation rate (calculated after 5 min in �g/(L min)) of phenol, BPA and EE2 in wastewater. [0.5%Pt/TiO2] = 500 mg/L.
Conditions Phenol BPA EE2
[Phenol]o = [BPA]o = [EE2]o = 100 �g/L, 58 × 10−8 einstein/(L s) 2.9 6.2 6.9[Phenol]o = [BPA]o = [EE2]o = 200 �g/L, 58 × 10−8 einstein/(L s) 4.9 14.5 17.3[Phenol]o = [BPA]o = [EE2]o = 300 �g/L, 58 × 10−8 einstein/(L s) 4.6 20.9 21.2[Phenol]o = [BPA]o = [EE2]o = 300 �g/L, 34.8 × 10⁻⁸ einstein/(L s) 3.9 16 18.2[Phenol]o = [BPA]o = [EE2]o = 300 �g/L, 17.4 × 10⁻⁸ einstein/(L s) 0 11.1 14.4
wrt
stfattHacttcttTqfrw
amsf2cpgriaa1n
athschbcEt(oFcr
reducing the quantum yield; in this case, the reaction rate appearsto be proportional to the square root of flux [2]. It should be notedthat the exact value of flux, at which such transition would occur
0
0.2
0.4
0.6
0.8
1
604530150
Time, min
C/C
o
here k is the reaction rate constant, kapp is an apparent, first order,ate constant [Ox] is the concentration of oxidizing species and n ishe reaction order regarding [Ox].
The ability of semiconductor photocatalysts to oxidize organicpecies is due to the valence band holes photogenerated onto theitania surface, as well as the hydroxyl radicals, HO•, producedrom the reaction of holes with surface-bound water and hydroxylnions. Moreover, the formation of perhydroxyl radicals, HO2
•,hrough reactions involving photogenerated conduction band elec-rons, dissolved oxygen and protons cannot be excluded [36,37].ydroxyl radicals are considered as the primary oxidizing agentcting not only on the surface but also in the solution phase [36]. Theollective concentration of all possible oxidizing species in the reac-ion mixture should be constant at fixed operating conditions sinceheir generation rate should only depend on the photon flux and theatalyst loading; in this respect, the term [Ox]n can be incorporatedo kapp. An increase in contaminant concentration would increasehe probability of [Ox] attack and, consequently, the reaction rate.his increase is almost linear for the range of concentrations inuestion, denoting first order kinetics. If experiments were per-ormed at higher concentrations [Ox] would become the limitingeactant and, consequently, a transition to lower order kineticsould most probably occur.
The experiment at the highest contaminant concentration waslso performed in UPW in an attempt to evaluate the effect of wateratrix on photocatalytic performance; from the respective profiles
hown in Fig. 6, it is obvious that reactions in UPW occur muchaster than in WW, e.g. complete degradation can be achieved in0–25 min for either contaminant. If the results of Fig. 6 at 300 �g/Loncentration and up to 90% conversion for each contaminant arelotted in the form of Eq. (1), straight lines passing through the ori-in fit the data very well (i.e. the coefficient of linear regression,2, is typically greater than 99%). From the slopes of the result-ng straight lines (not shown), the computed kapp values in WWre 30.8 × 10⁻³, 68.8 × 10⁻³ and 75.7 × 10⁻³ min−1 for phenol, BPAnd EE2, respectively, while the corresponding values in UPW are3.1 × 10−2, 20 × 10−2 and 19.9 × 10⁻² min−1, i.e. an order of mag-itude greater.
The detrimental impact of water matrix on kinetics is associ-ted with the organic and inorganic species inherently present inhe wastewater that compete with the spiked contaminants forydroxyl radicals and other oxidizing agents. We have recentlyhown that the effluent organic matter (EfOM), which typicallyonsists of biomass-associated products (e.g. polysaccharides) andumic-type substances, is highly resistant to advanced oxidationy homogeneous solar Fenton oxidation [38], UV-A/TiO2 photo-atalysis [39] and anodic oxidation [40]. At the conditions of Fig. 6,fOM, whose concentration is 11 times greater than that of thehree contaminants together, is highly resistant to mineralizationsee also Section 3.6); therefore, it is reasonable to assume that
xidizing species are partly consumed in reactions involving EfOM.urthermore, hydroxyl radicals may be scavenged by bicarbonates,hlorides and sulfates present in wastewater to form the respectiveadicals, whose oxidation potential is lower than that of hydroxylradicals [41,42]. Yap and Lim [43], who studied the solar photo-catalytic degradation of BPA in N-doped TiO2, reported that theaddition of inorganic ions such as chlorides, bicarbonates and sul-fates in UPW reduced kinetics and so did the presence of methanolcompeting with BPA for oxidizing species, as well as catalyst activesites.
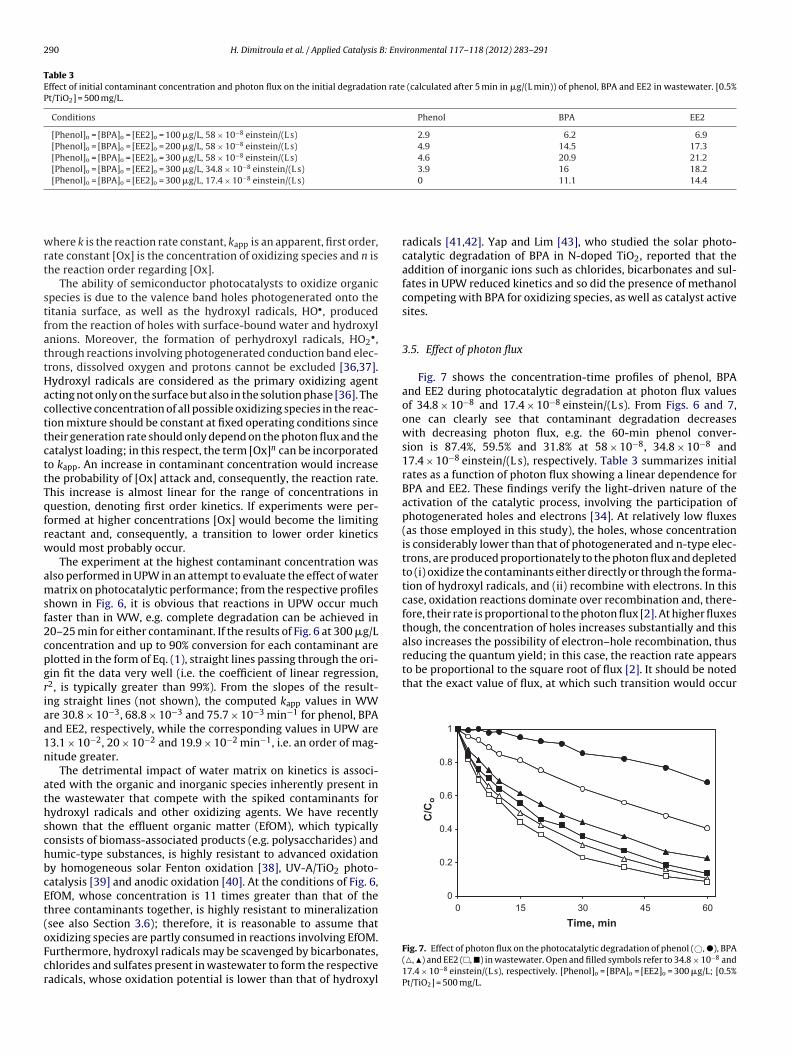
3.5. Effect of photon flux
Fig. 7 shows the concentration-time profiles of phenol, BPAand EE2 during photocatalytic degradation at photon flux valuesof 34.8 × 10⁻⁸ and 17.4 × 10⁻⁸ einstein/(L s). From Figs. 6 and 7,one can clearly see that contaminant degradation decreaseswith decreasing photon flux, e.g. the 60-min phenol conver-sion is 87.4%, 59.5% and 31.8% at 58 × 10−8, 34.8 × 10⁻⁸ and17.4 × 10−8 einstein/(L s), respectively. Table 3 summarizes initialrates as a function of photon flux showing a linear dependence forBPA and EE2. These findings verify the light-driven nature of theactivation of the catalytic process, involving the participation ofphotogenerated holes and electrons [34]. At relatively low fluxes(as those employed in this study), the holes, whose concentrationis considerably lower than that of photogenerated and n-type elec-trons, are produced proportionately to the photon flux and depletedto (i) oxidize the contaminants either directly or through the forma-tion of hydroxyl radicals, and (ii) recombine with electrons. In thiscase, oxidation reactions dominate over recombination and, there-fore, their rate is proportional to the photon flux [2]. At higher fluxesthough, the concentration of holes increases substantially and thisalso increases the possibility of electron–hole recombination, thus
Fig. 7. Effect of photon flux on the photocatalytic degradation of phenol (©, �), BPA(�, �) and EE2 (�, �) in wastewater. Open and filled symbols refer to 34.8 × 10⁻⁸ and17.4 × 10−8 einstein/(L s), respectively. [Phenol]o = [BPA]o = [EE2]o = 300 �g/L; [0.5%Pt/TiO2] = 500 mg/L.
H. Dimitroula et al. / Applied Catalysis B: Env
0
20
40
60
80
100
604530150
Time, min
Rem
oval, %
0.1
1
10
100
1000
10000Phenol BPA
EE2 YES
DOC E. coli
E. coli, cfu
/mL
FmP
dw
3
fbcaeo(paf
7ttseeb
4
rfbad
(
(
[[[[[
[
[
[
[[
[[[
[[
[
[[
[[[[[
[
[[[[
[
[
[
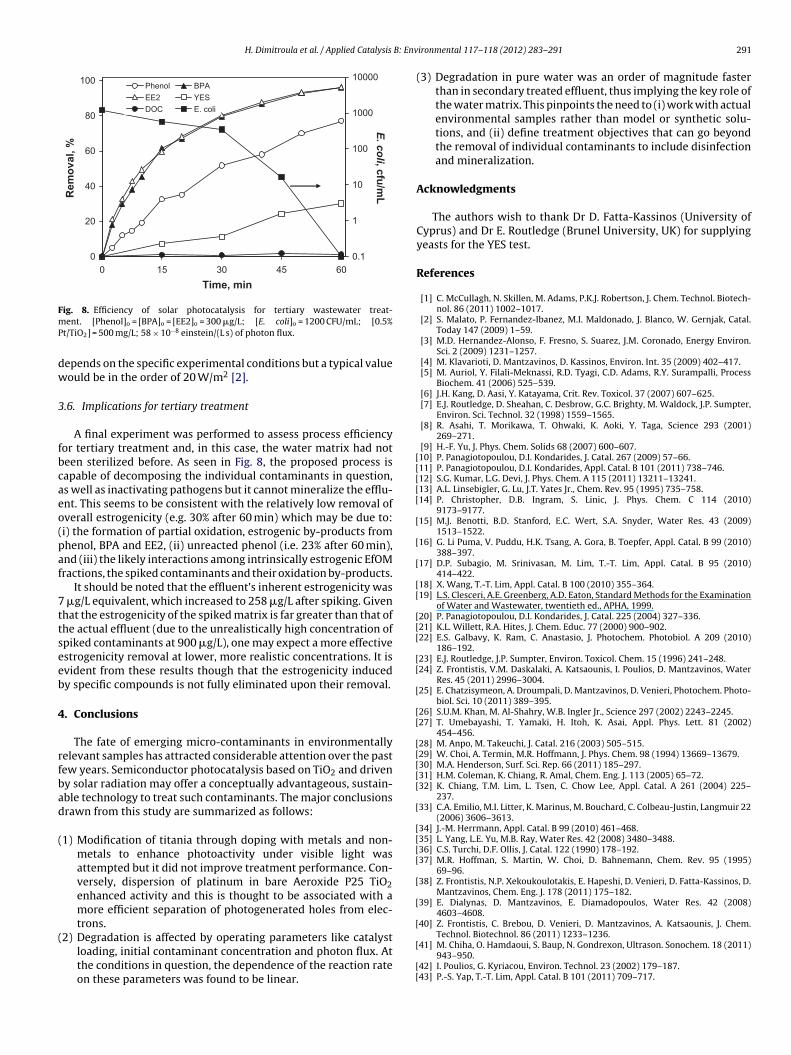
ig. 8. Efficiency of solar photocatalysis for tertiary wastewater treat-ent. [Phenol]o = [BPA]o = [EE2]o = 300 �g/L; [E. coli]o = 1200 CFU/mL; [0.5%
t/TiO2] = 500 mg/L; 58 × 10−8 einstein/(L s) of photon flux.
epends on the specific experimental conditions but a typical valueould be in the order of 20 W/m2 [2].
.6. Implications for tertiary treatment
A final experiment was performed to assess process efficiencyor tertiary treatment and, in this case, the water matrix had noteen sterilized before. As seen in Fig. 8, the proposed process isapable of decomposing the individual contaminants in question,s well as inactivating pathogens but it cannot mineralize the efflu-nt. This seems to be consistent with the relatively low removal ofverall estrogenicity (e.g. 30% after 60 min) which may be due to:i) the formation of partial oxidation, estrogenic by-products fromhenol, BPA and EE2, (ii) unreacted phenol (i.e. 23% after 60 min),nd (iii) the likely interactions among intrinsically estrogenic EfOMractions, the spiked contaminants and their oxidation by-products.
It should be noted that the effluent’s inherent estrogenicity was �g/L equivalent, which increased to 258 �g/L after spiking. Givenhat the estrogenicity of the spiked matrix is far greater than that ofhe actual effluent (due to the unrealistically high concentration ofpiked contaminants at 900 �g/L), one may expect a more effectivestrogenicity removal at lower, more realistic concentrations. It isvident from these results though that the estrogenicity inducedy specific compounds is not fully eliminated upon their removal.
. Conclusions
The fate of emerging micro-contaminants in environmentallyelevant samples has attracted considerable attention over the pastew years. Semiconductor photocatalysis based on TiO2 and driveny solar radiation may offer a conceptually advantageous, sustain-ble technology to treat such contaminants. The major conclusionsrawn from this study are summarized as follows:
1) Modification of titania through doping with metals and non-metals to enhance photoactivity under visible light wasattempted but it did not improve treatment performance. Con-versely, dispersion of platinum in bare Aeroxide P25 TiO2enhanced activity and this is thought to be associated with amore efficient separation of photogenerated holes from elec-trons.
2) Degradation is affected by operating parameters like catalystloading, initial contaminant concentration and photon flux. Atthe conditions in question, the dependence of the reaction rateon these parameters was found to be linear.
[
[[
ironmental 117– 118 (2012) 283– 291 291
(3) Degradation in pure water was an order of magnitude fasterthan in secondary treated effluent, thus implying the key role ofthe water matrix. This pinpoints the need to (i) work with actualenvironmental samples rather than model or synthetic solu-tions, and (ii) define treatment objectives that can go beyondthe removal of individual contaminants to include disinfectionand mineralization.
Acknowledgments
The authors wish to thank Dr D. Fatta-Kassinos (University ofCyprus) and Dr E. Routledge (Brunel University, UK) for supplyingyeasts for the YES test.
References
[1] C. McCullagh, N. Skillen, M. Adams, P.K.J. Robertson, J. Chem. Technol. Biotech-nol. 86 (2011) 1002–1017.
[2] S. Malato, P. Fernandez-Ibanez, M.I. Maldonado, J. Blanco, W. Gernjak, Catal.Today 147 (2009) 1–59.
[3] M.D. Hernandez-Alonso, F. Fresno, S. Suarez, J.M. Coronado, Energy Environ.Sci. 2 (2009) 1231–1257.
[4] M. Klavarioti, D. Mantzavinos, D. Kassinos, Environ. Int. 35 (2009) 402–417.[5] M. Auriol, Y. Filali-Meknassi, R.D. Tyagi, C.D. Adams, R.Y. Surampalli, Process
Biochem. 41 (2006) 525–539.[6] J.H. Kang, D. Aasi, Y. Katayama, Crit. Rev. Toxicol. 37 (2007) 607–625.[7] E.J. Routledge, D. Sheahan, C. Desbrow, G.C. Brighty, M. Waldock, J.P. Sumpter,
Environ. Sci. Technol. 32 (1998) 1559–1565.[8] R. Asahi, T. Morikawa, T. Ohwaki, K. Aoki, Y. Taga, Science 293 (2001)
269–271.[9] H.-F. Yu, J. Phys. Chem. Solids 68 (2007) 600–607.10] P. Panagiotopoulou, D.I. Kondarides, J. Catal. 267 (2009) 57–66.11] P. Panagiotopoulou, D.I. Kondarides, Appl. Catal. B 101 (2011) 738–746.12] S.G. Kumar, L.G. Devi, J. Phys. Chem. A 115 (2011) 13211–13241.13] A.L. Linsebigler, G. Lu, J.T. Yates Jr., Chem. Rev. 95 (1995) 735–758.14] P. Christopher, D.B. Ingram, S. Linic, J. Phys. Chem. C 114 (2010)
9173–9177.15] M.J. Benotti, B.D. Stanford, E.C. Wert, S.A. Snyder, Water Res. 43 (2009)
1513–1522.16] G. Li Puma, V. Puddu, H.K. Tsang, A. Gora, B. Toepfer, Appl. Catal. B 99 (2010)
388–397.17] D.P. Subagio, M. Srinivasan, M. Lim, T.-T. Lim, Appl. Catal. B 95 (2010)
414–422.18] X. Wang, T.-T. Lim, Appl. Catal. B 100 (2010) 355–364.19] L.S. Clesceri, A.E. Greenberg, A.D. Eaton, Standard Methods for the Examination
of Water and Wastewater, twentieth ed., APHA, 1999.20] P. Panagiotopoulou, D.I. Kondarides, J. Catal. 225 (2004) 327–336.21] K.L. Willett, R.A. Hites, J. Chem. Educ. 77 (2000) 900–902.22] E.S. Galbavy, K. Ram, C. Anastasio, J. Photochem. Photobiol. A 209 (2010)
186–192.23] E.J. Routledge, J.P. Sumpter, Environ. Toxicol. Chem. 15 (1996) 241–248.24] Z. Frontistis, V.M. Daskalaki, A. Katsaounis, I. Poulios, D. Mantzavinos, Water
Res. 45 (2011) 2996–3004.25] E. Chatzisymeon, A. Droumpali, D. Mantzavinos, D. Venieri, Photochem. Photo-
biol. Sci. 10 (2011) 389–395.26] S.U.M. Khan, M. Al-Shahry, W.B. Ingler Jr., Science 297 (2002) 2243–2245.27] T. Umebayashi, T. Yamaki, H. Itoh, K. Asai, Appl. Phys. Lett. 81 (2002)
454–456.28] M. Anpo, M. Takeuchi, J. Catal. 216 (2003) 505–515.29] W. Choi, A. Termin, M.R. Hoffmann, J. Phys. Chem. 98 (1994) 13669–13679.30] M.A. Henderson, Surf. Sci. Rep. 66 (2011) 185–297.31] H.M. Coleman, K. Chiang, R. Amal, Chem. Eng. J. 113 (2005) 65–72.32] K. Chiang, T.M. Lim, L. Tsen, C. Chow Lee, Appl. Catal. A 261 (2004) 225–
237.33] C.A. Emilio, M.I. Litter, K. Marinus, M. Bouchard, C. Colbeau-Justin, Langmuir 22
(2006) 3606–3613.34] J.-M. Herrmann, Appl. Catal. B 99 (2010) 461–468.35] L. Yang, L.E. Yu, M.B. Ray, Water Res. 42 (2008) 3480–3488.36] C.S. Turchi, D.F. Ollis, J. Catal. 122 (1990) 178–192.37] M.R. Hoffman, S. Martin, W. Choi, D. Bahnemann, Chem. Rev. 95 (1995)
69–96.38] Z. Frontistis, N.P. Xekoukoulotakis, E. Hapeshi, D. Venieri, D. Fatta-Kassinos, D.
Mantzavinos, Chem. Eng. J. 178 (2011) 175–182.39] E. Dialynas, D. Mantzavinos, E. Diamadopoulos, Water Res. 42 (2008)
4603–4608.40] Z. Frontistis, C. Brebou, D. Venieri, D. Mantzavinos, A. Katsaounis, J. Chem.
Technol. Biotechnol. 86 (2011) 1233–1236.41] M. Chiha, O. Hamdaoui, S. Baup, N. Gondrexon, Ultrason. Sonochem. 18 (2011)
943–950.42] I. Poulios, G. Kyriacou, Environ. Technol. 23 (2002) 179–187.43] P.-S. Yap, T.-T. Lim, Appl. Catal. B 101 (2011) 709–717.