Feasibility of Ultrasound Attenuation Imaging for Assessing ...
Upload
independentCategory
view
1download
0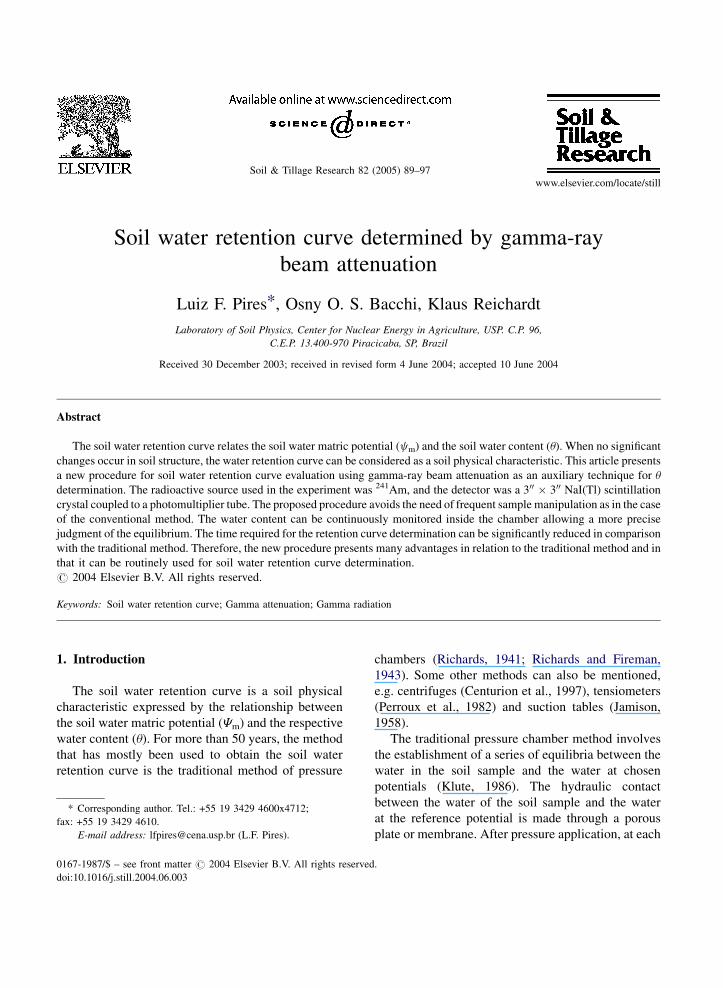
Soil water retention curve determined by gamma-ray
beam attenuation
Luiz F. Pires*, Osny O. S. Bacchi, Klaus Reichardt
Laboratory of Soil Physics, Center for Nuclear Energy in Agriculture, USP. C.P. 96,
C.E.P. 13.400-970 Piracicaba, SP, Brazil
Received 30 December 2003; received in revised form 4 June 2004; accepted 10 June 2004
Abstract
The soil water retention curve relates the soil water matric potential (cm) and the soil water content (u). When no significant
changes occur in soil structure, the water retention curve can be considered as a soil physical characteristic. This article presents
a new procedure for soil water retention curve evaluation using gamma-ray beam attenuation as an auxiliary technique for u
determination. The radioactive source used in the experiment was 241Am, and the detector was a 300 � 300 NaI(Tl) scintillation
crystal coupled to a photomultiplier tube. The proposed procedure avoids the need of frequent sample manipulation as in the case
of the conventional method. The water content can be continuously monitored inside the chamber allowing a more precise
judgment of the equilibrium. The time required for the retention curve determination can be significantly reduced in comparison
with the traditional method. Therefore, the new procedure presents many advantages in relation to the traditional method and in
that it can be routinely used for soil water retention curve determination.
# 2004 Elsevier B.V. All rights reserved.
Keywords: Soil water retention curve; Gamma attenuation; Gamma radiation
www.elsevier.com/locate/still
Soil & Tillage Research 82 (2005) 89–97
1. Introduction
The soil water retention curve is a soil physical
characteristic expressed by the relationship between
the soil water matric potential (Cm) and the respective
water content (u). For more than 50 years, the method
that has mostly been used to obtain the soil water
retention curve is the traditional method of pressure
* Corresponding author. Tel.: +55 19 3429 4600x4712;
fax: +55 19 3429 4610.
E-mail address: [email protected] (L.F. Pires).
0167-1987/$ – see front matter # 2004 Elsevier B.V. All rights reserved
doi:10.1016/j.still.2004.06.003
chambers (Richards, 1941; Richards and Fireman,
1943). Some other methods can also be mentioned,
e.g. centrifuges (Centurion et al., 1997), tensiometers
(Perroux et al., 1982) and suction tables (Jamison,
1958).
The traditional pressure chamber method involves
the establishment of a series of equilibria between the
water in the soil sample and the water at chosen
potentials (Klute, 1986). The hydraulic contact
between the water of the soil sample and the water
at the reference potential is made through a porous
plate or membrane. After pressure application, at each
.
L.F. Pires et al. / Soil & Tillage Research 82 (2005) 89–9790
equilibrium, the soil water content is determined
through gravimetry.
Since the idealization of the method, few improve-
ments were introduced despite the fact that some
practical problems still remain, e.g. (1) the difficulty
of a correct judgement of equilibrium (Bacchi et al.,
1998; Centurion et al., 1997); (2) the risk of changes in
soil structure and water retention characteristics of the
sample, due to its frequent manipulation during u
measurements at each chosen potential (Moraes et al.,
1993); and (3) the long time required for the whole
process, mainly due to sample weighing and re-
saturation (also affected by hysteresis) after each
equilibrium (Williams et al., 1992).
Bacchi et al. (1998), in a theoretical approach,
proposed the utilization of the gamma beam attenua-
tion technique as an auxiliary tool, associated to the
traditional pressure chambers, to obtain the water
retention curve. The gamma-ray attenuation technique
permits simultaneous nondestructive determinations
of soil bulk density and soil water content, and offers
many advantages in relation to the corresponding
conventional methods (Jalbert and Dane, 2001; Dane
et al., 1992; Ferraz and Mansell, 1979; Olesen, 1973;
De Swart and Groenevelt, 1971; Reichardt, 1965; van
Bavel, 1959).
The procedure idealized by Bacchi et al. (1998)
includes an adaptation of the conventional pressure
chamber to permit the gamma-ray beam to pass
through the soil sample inside the chamber, allowing
for a continuous soil moisture monitoring during the
whole process of soil water retention measurements,
without the opening of the chamber for u measure-
ments at each step. This new improvement leads also
to a more precise judgement of equilibria, since soil
moisture is continuously monitored inside the
chamber. Sample manipulation is eliminated since
it is saturated only once at the beginning of the
process, minimizing the risk of modifications in
structure and, as a consequence, the time required for
the whole water retention curve establishment is
shortened.
The present paper presents practical results of
water retention curves measured through the gamma
attenuation technique, as described by Bacchi et al.
(1998), for two soils different in texture and makes a
comparative analysis of the results with water
retention data obtained conventionally.
2. Theory
2.1. Richards method
The traditional method of determining soil water
retention curves involves establishing a series of
equilibria of the water in the soil sample at known
potentials (Klute, 1986). The instrument for determin-
ing these curves is a steel pressure chamber, inside of
which is a porous plate saturated with water, at the
bottom continuously submitted to atmospheric pres-
sure, on which soil samples are disposed in a way to
obtain hydraulic contact between sample and porous
plate. With constant pressure applications to the
chamber, soil samples lose water through the plate
until equilibrium is reached. A control panel with
pressure valves and manometers allows constant
pressure outputs in the range 0–1.5 MPa.
Initially, soil samples are water-saturated by
soaking them for 24 h, placing them on a tray with
a water level just below the top of the soil cores. After
that, soil samples are transferred to the previously
saturated porous plate, being sure to obtain hydraulic
contact between them. The chamber is closed and a
desired air pressure P is applied to it, driving away the
soil water retained at pressures below P, until
equilibrium is obtained.
Therefore, at each equilibrium condition, the pressure
applied to the soil sample represents the value of the
matric potential for the respective water content u. After
each equilibrium, the chamber is opened; soil samples
are weighted, re-saturated and placed again to be
submitted to a new pressure application. For the last
pressure value, the sample is oven-dried to recalculate u
for all pressure steps. The relationship between the soil
water matric potential and each respective water content
(obtained by weighing) for different equilibrium
conditions define the water retention curve.
2.2. Gamma-ray attenuation
When a gamma-ray beam passes through a soil
sample of thickness x (cm), photons are transmitted
following the Beer–Lambert law (Wang et al., 1975).
For soil samples, considering the two phases, solid
material and water, this law can be written as follows:
I ¼ I0 exp ½�xðmsrs þ mwuÞ (1)

L.F. Pires et al. / Soil & Tillage Research 82 (2005) 89–97 91
where I and I0 are, respectively, the rates of the
emerging and the incident photon beams; ms and
mw (cm2 g�1), the soil and water mass attenuation
coefficients; rs (g cm�3), the soil bulk density; and u(cm3 cm�3), the soil water content.
For soils in which the bulk density remains constant
during soil water content changes, if ms, mw, rs and x
are known, it is possible to obtain u by the gamma-ray
attenuation technique, by solving Eq. (1) for u:
u ¼ 1
xmw
lnI0
I
� �� xmsrs
� �(2)
For the case of swelling soils, a double energy
gamma-ray attenuation system can be used to evaluate
u and rs, simultaneously, using a set of equations
(Stroosnijder and De Swart, 1974). In this case, after
each pressure application, it is possible to measure u
and rs, taking into account changes in rs due to soil
shrinking.
2.3. Statistical error by nuclear method
Through the error propagation (Eq. (3)), it is
possible to estimate the error associated to soil water
content evaluation:
du ¼ @u
@AdA
� �þ @u
@xdx
� �þ @u
@rs
drs
� �
þ @u
@mw
dmw
� �þ @u
@ms
dms
� �(3)
where A = ln(I/I0). In ideal conditions, the parameters
x, rs, mw and ms can be considered constants and the
soil water content variation due to these parameters
become zero. In real laboratory conditions, these
parameters can be minimized turning very small the
second, third, fourth and fifth terms on the right side of
Eq. (3). In this case, these soil water content variations
can be considered directly related to the uncertainty of
the radioactive decay process.
The error associated to the rates of photon beam
measurements is given byffiffiI
p. When the increases of I
are small, it is possible to obtain:
dI
Iffi 1ffiffi
Ip (4)
Therefore, changes in Eq. (4) cause variations in u
values. Solving the first partial derivative in Eq. (3), it
is possible to obtain the uncertainty of soil water
content when it is measured by the nuclear method:
du ¼ � 1
xmw
ffiffiI
p�
ffiffiffiffiI0
pffiffiffiffiffiffiI0I
p� �
(5)
This soil water content error represents the
minimum measurable interval du when using the
nuclear method, and consequently, the u measurement
intervals are limited by du, which can be minimized
according to the choices of soil sample, radioactive
source, collimators, the distance between source and
detector, etc.
3. Material and methods
Soil core samples were taken from a soil profile of
an Oxisol (soil 1) and a Rhodic Kandiudox (soil 2),
from an experimental field of ESALQ/USP, in
Piracicaba, State of Sao Paulo, Brazil (22840S;
478380W; 580 m above sea level).
Samples were collected using aluminum cylinders
3.0 cm high and 5.0 cm in diameter. After sample
collection, top and bottom of the samples were
trimmed flat. The wetting procedure to saturate the
samples consisted in soaking them using a tray with
the water level just below the top of the cylinders. This
procedure is made over a period of 1 or 2 days to allow
saturation of the soil and to avoid the presence of the
entrapped air bubbles. After the wetting procedure,
soil samples were placed in contact with the porous
plate inside a pressure chamber and air pressure was
applied.
Water retention curves were determined on the very
same samples by (i) the traditional method, using a
commercial low-pressure extraction vessel (CAT No.
1600 – Soil Moisture Equipment Co.) that supports
pressures up to 0.5 MPa with pressure intervals
between points of 0.1 MPa and (ii) using the gamma
monoenergetic beam technique (Eq. (2)) applied to a
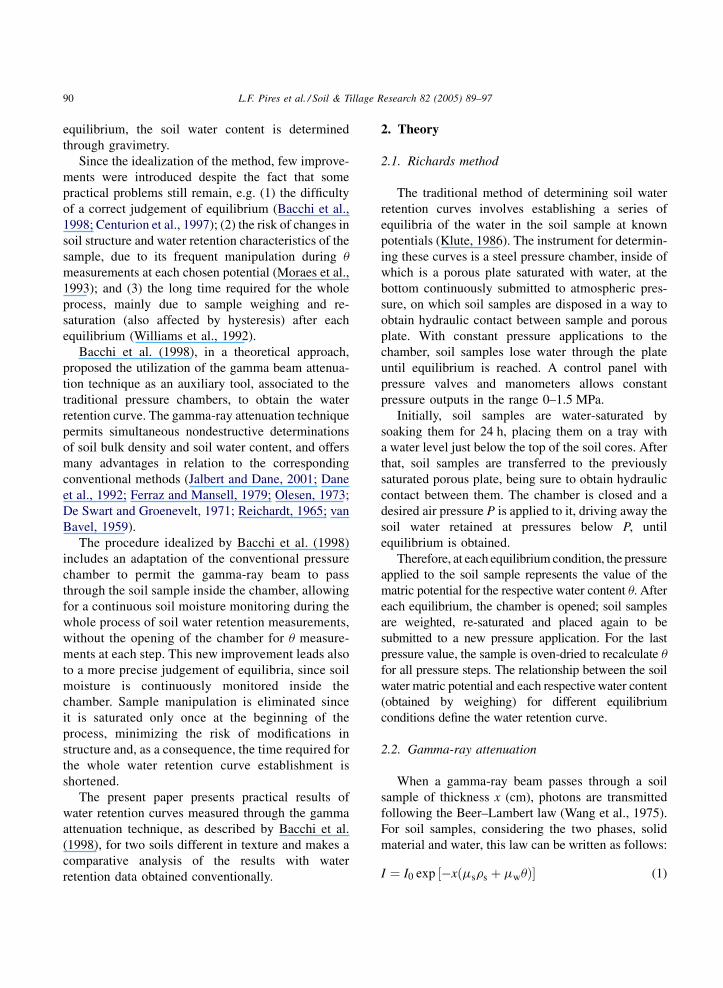
projected and constructed pressure chamber, consist-
ing of an acrylic cylinder 15.3 cm high, 7.1 and
7.9 cm, internal and external diameters, respectively,
with a ceramic porous plate at the bottom (Fig. 1). The
pressure chamber was positioned between the source
and the detector with the gamma-ray beam always
crossing the center of the chamber and the soil sample
L.F. Pires et al. / Soil & Tillage Research 82 (2005) 89–9792
Fig. 1. Acrylic pressure chamber built to obtain the water retention
curves by the nuclear method. Inside the chamber it is possible to see
the aluminum cylinder containing the soil sample, and in the top of
the chamber, the system for pressure input.
Table 1
(Fig. 2). The monoenergetic beam was used to
evaluate soil water contents u, since the employed
soils have a rigid structure.
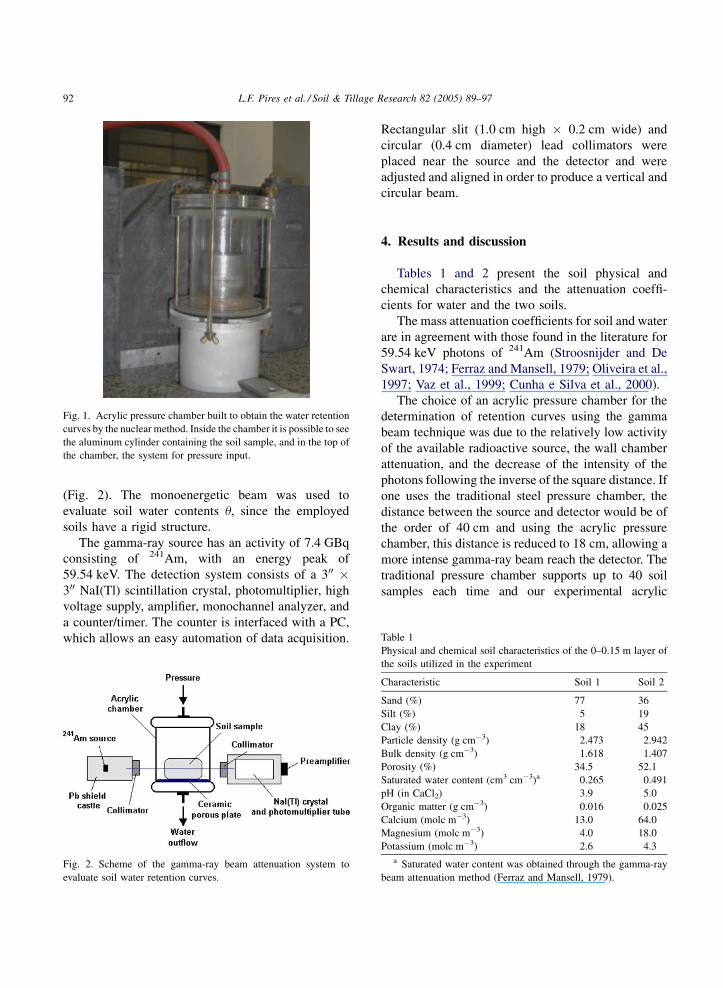
The gamma-ray source has an activity of 7.4 GBq
consisting of 241Am, with an energy peak of
59.54 keV. The detection system consists of a 300 �300 NaI(Tl) scintillation crystal, photomultiplier, high
voltage supply, amplifier, monochannel analyzer, and
a counter/timer. The counter is interfaced with a PC,
which allows an easy automation of data acquisition.
Fig. 2. Scheme of the gamma-ray beam attenuation system to
evaluate soil water retention curves.
Rectangular slit (1.0 cm high � 0.2 cm wide) and
circular (0.4 cm diameter) lead collimators were
placed near the source and the detector and were
adjusted and aligned in order to produce a vertical and
circular beam.
4. Results and discussion
Tables 1 and 2 present the soil physical and
chemical characteristics and the attenuation coeffi-
cients for water and the two soils.
The mass attenuation coefficients for soil and water
are in agreement with those found in the literature for
59.54 keV photons of 241Am (Stroosnijder and De
Swart, 1974; Ferraz and Mansell, 1979; Oliveira et al.,
1997; Vaz et al., 1999; Cunha e Silva et al., 2000).
The choice of an acrylic pressure chamber for the
determination of retention curves using the gamma
beam technique was due to the relatively low activity
of the available radioactive source, the wall chamber
attenuation, and the decrease of the intensity of the
photons following the inverse of the square distance. If
one uses the traditional steel pressure chamber, the
distance between the source and detector would be of
the order of 40 cm and using the acrylic pressure
chamber, this distance is reduced to 18 cm, allowing a
more intense gamma-ray beam reach the detector. The
traditional pressure chamber supports up to 40 soil
samples each time and our experimental acrylic
Physical and chemical soil characteristics of the 0–0.15 m layer of
the soils utilized in the experiment
Characteristic Soil 1 Soil 2
Sand (%) 77 36
Silt (%) 5 19
Clay (%) 18 45
Particle density (g cm�3) 2.473 2.942
Bulk density (g cm�3) 1.618 1.407
Porosity (%) 34.5 52.1
Saturated water content (cm3 cm�3)a 0.265 0.491
pH (in CaCl2) 3.9 5.0
Organic matter (g cm�3) 0.016 0.025
Calcium (molc m�3) 13.0 64.0
Magnesium (molc m�3) 4.0 18.0
Potassium (molc m�3) 2.6 4.3
a Saturated water content was obtained through the gamma-ray
beam attenuation method (Ferraz and Mansell, 1979).
L.F. Pires et al. / Soil & Tillage Research 82 (2005) 89–97 93
Table 2
Mass and linear attenuation coefficients for water and both soil types for the 59.54 keV gamma radiation
Sample Collimator m (cm�1) m/r (cm2 g�1) sm (cm2 g�1) CV (%)
Water Rectangular 0.19295 0.19295 0.00071 0.37
Soil 1 Rectangular 0.28561 0.25672 0.00103 0.40
Soil 2 Rectangular 0.48520 0.36341 0.00156 0.43
sm = Standard deviation; CV = coefficient of variation.
Table 3
Matric potential (cm), soil water content (u), standard deviation and coefficient of variation for each applied pressure, for both soils, and the two
methods
Soil 1 Soil 2
Traditional method
cm (MPa) uT (cm3 cm�3) suT (cm3 cm�3) CV (%) Number of curves uT (cm3 cm�3) suT (cm3 cm�3) CV (%) Number
of curves
0.020 0.1890 0.0054 2.9 13 0.3899 0.0113 2.9 10
0.040 0.1722 0.0060 3.5 13 0.3792 0.0095 2.5 10
0.060 0.1649 0.0058 3.5 13 0.3730 0.0114 3.1 10
0.080 0.1593 0.0058 3.7 13 0.3634 0.0127 3.5 10
0.100 0.1510 0.0046 3.0 13 0.3575 0.0101 2.8 10
Nuclear method
cm (MPa) uN (cm3 cm�3) suN (cm3 cm�3) CV (%) Number of curves uN (cm3 cm�3) suN (cm3 cm�3) CV (%) Number
of curves
0.000 0.2570 0.0189 7.4 6 0.4461 0.0364 7.6 6
0.025 0.1855 0.0065 3.5 6 0.4025a 0.0110 2.7 6
0.050 0.1717 0.0055 3.2 6 0.3851 0.0081 2.1 6
0.075 0.1625 0.0042 2.6 6 0.3708a 0.0087 2.4 6
0.100 0.1542 0.0068 4.4 6 0.3568 0.0084 2.4 6
su = Standard deviation.a Values calculated from theoretical adjustment.
1 The average soil water content in this case was obtained
through: u ¼ ðuPi þ uPiþ1Þ=2, where P represents air pressure. In
Fig. 5 was excluded the differences between pressures 0 and
0.025 MPa for all curves obtained by the nuclear method.
chamber operates with only one sample. This limitation,
however, can be surpassed by the development of a new
pressure chamber model and instrumentation of the
method. Table 3 and Figs. 3 and 4 show the results
concerning soil water contents for the different applied
pressures for both soils and methods.
The pressure interval, and consequent number of
points per curve for the nuclear method, was chosen in
order to have variations in u compatible with the
resolution of the method. Due to the fact that the
photon emission by a radioactive source is a statistical
process, the determination of u is related with the241Am photon emission per unit of time. Due to this,
there is a minimum measurable interval du (Eq. (5))
for the nuclear method, which has to be taken into
account when establishing pressure steps DP. This
explains the differences between the pressure steps
applied in the two methods, shown in Table 3. For the
case of soils 1 and 2, these average minimum intervals
du for the nuclear method were 0.0080 and
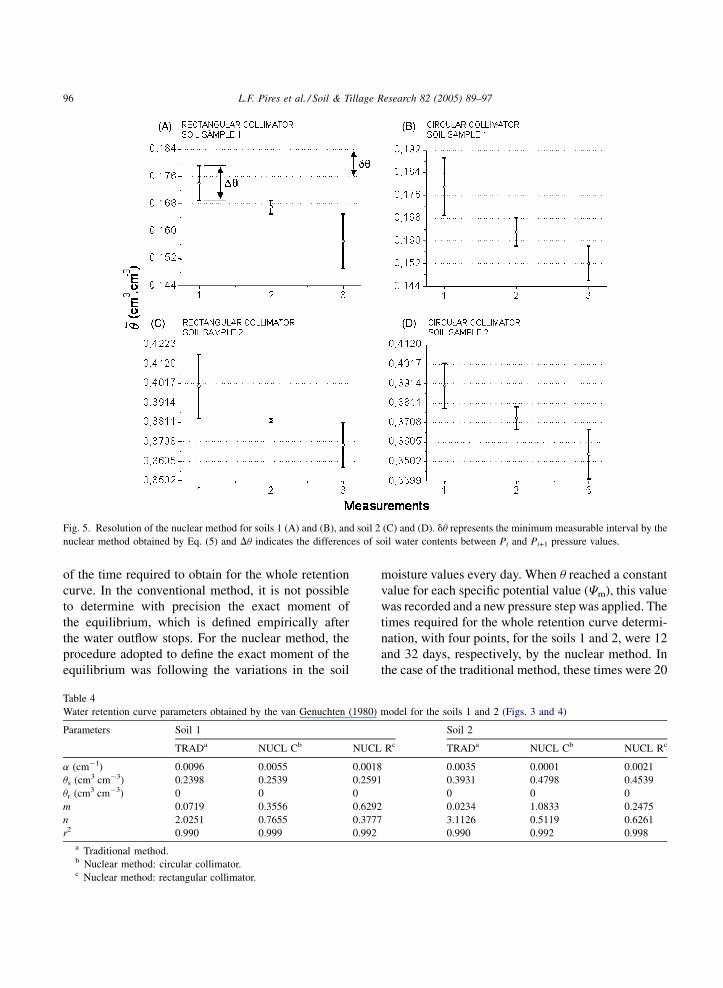
0.0103 cm3 cm�3, respectively. Fig. 5 shows results
of du for soil samples presented in Figs. 3 and 4.
Differences between each average soil water content1
value in y-axis (dash horizontal lines) represent the
minimum interval in which u can be evaluated with
guarantee. All Du values smaller than this interval
(average points in Fig. 5 with its respective Du values)
do not permit to identify if the variation obtained is
really due to the soil water content variation or due to
the uncertainty caused by the statistical process of
radioactive decay. Fig. 5 shows that soils 1 and 2
L.F. Pires et al. / Soil & Tillage Research 82 (2005) 89–9794
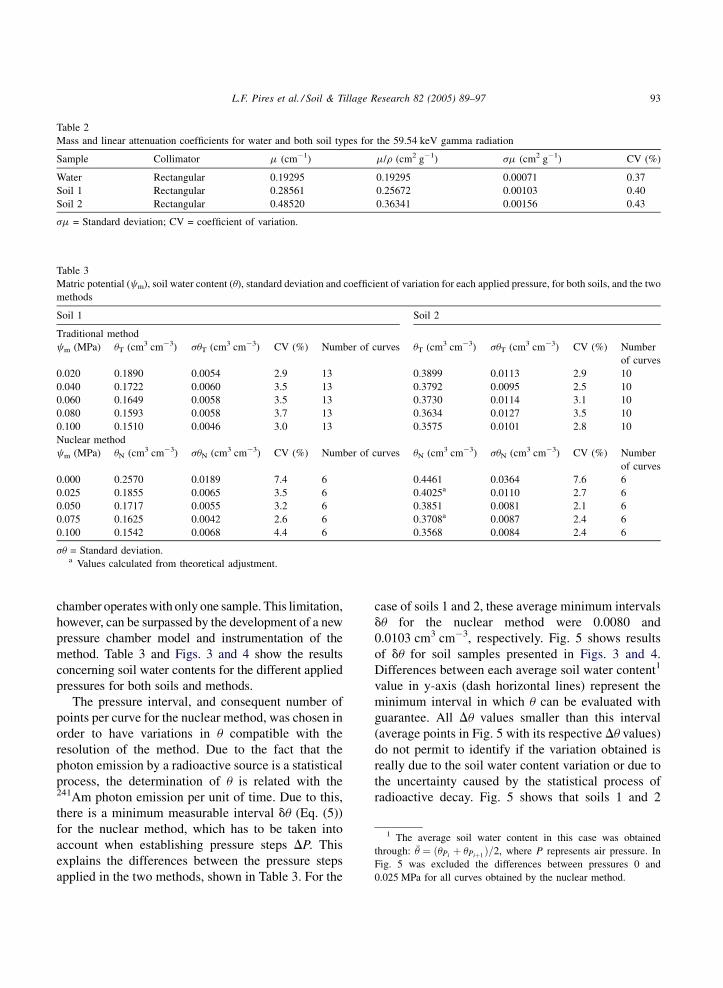
Fig. 3. (A) Soil water retention curves obtained by both, traditional and nuclear (rectangular slit collimator) methods for soil 1, (B) deviation
analyzes for the curve adjustments between the two methods, (C) soil water retention curves obtained by both, traditional and nuclear (circular
collimator) methods for soil 1, and (D) deviation analyzes for the curve adjustments between the two methods. Soil water contents represent the
mean of three values for each curve obtained (rectangular and circular collimators).
present, for rectangular collimators, an interval
between 0.050 and 0.075 MPa with Du smaller than
du. For soil 1, three curves with the same problem
were found and for soil 2 just one, showing that for soil
1 it is necessary to use larger number of soil samples in
order to have better soil water retention curve
evaluations using the nuclear method.
From Figs. 3 and 4, it is possible to compare the
results obtained by the two methods. Higher devia-
tions between the two methods for the two soils occur
for values of soil moisture near saturation. A possible
cause of this fact could be the variability between
samples or the process of soil sample saturation.
Variability of soil samples can explain this deviation
because samples utilized in water retention curve
measurements by two methods, although collected
near each other, were different. For soil saturation,
samples were submitted to the saturation process at
distinct days, and although the same procedure was
applied (EMBRAPA, 1998), differences in the
saturation level can occur during this process. These
differences can be reflected in the soil moisture values
near saturation. Higher deviations were found for soil
2 (Fig. 4). After the construction of the retention
curves, soil samples were destroyed, and it was
observed that the soil samples 2 presented some
fractures and small holes inside, which possibly
affected the soil moisture values obtained by the
nuclear method. This problem can be avoided with the
aid of the same gamma equipment, working as a
computed tomograph. In this way, it is possible to
obtain an image of the soil sample before performing
retention curves and then to choose the best soil
sample for the determinations.
The deviations between the two methods can also
be caused by small modifications in soil structure
during the determination of the retention curve,
mainly in the case of the traditional method, which
can affect the value of soil bulk density that is
considered constant in Eq. (2). However, for the water
potential range (0–0.1 MPa) utilized here to obtain the
retention curves, the possible changes in soil structure
that could affect soil bulk densities were smaller than
the possible errors caused by the statistics of the
L.F. Pires et al. / Soil & Tillage Research 82 (2005) 89–97 95
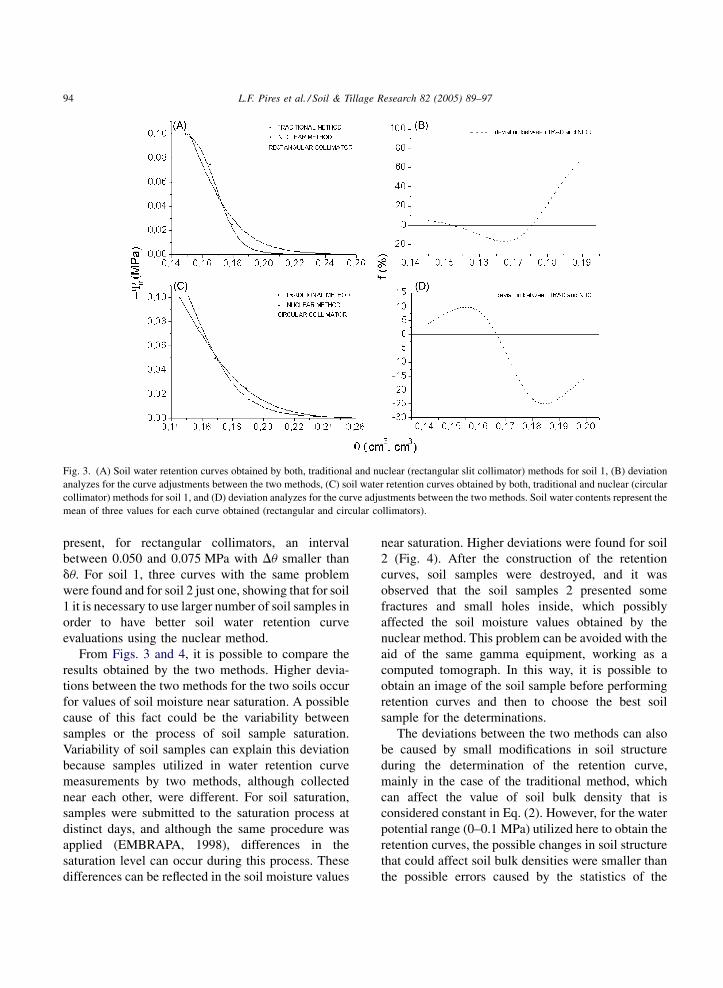
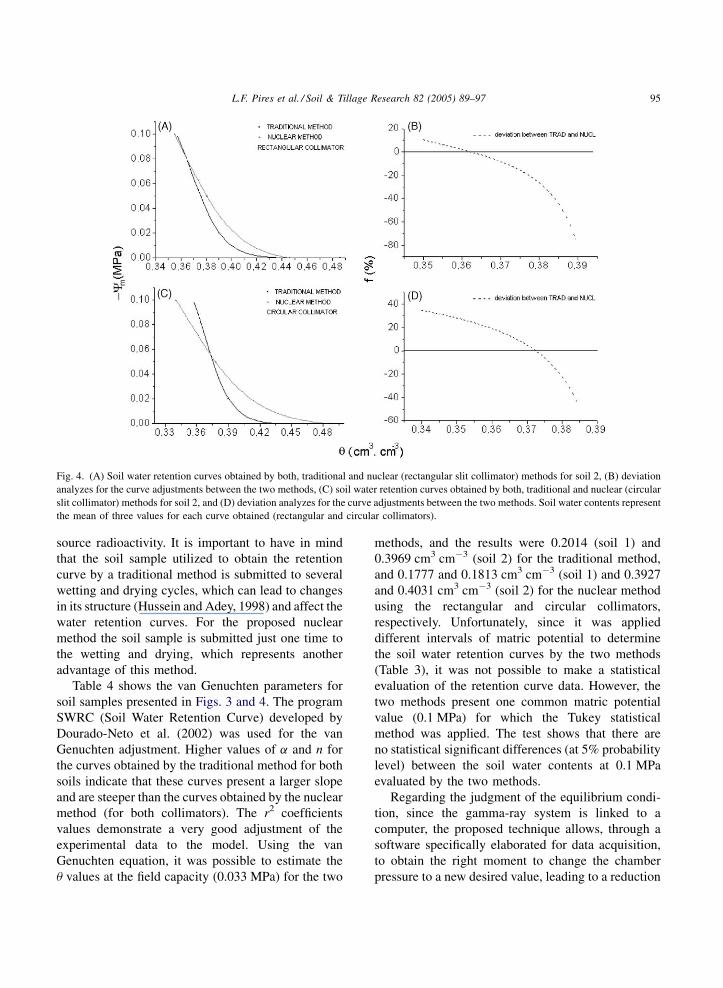
Fig. 4. (A) Soil water retention curves obtained by both, traditional and nuclear (rectangular slit collimator) methods for soil 2, (B) deviation
analyzes for the curve adjustments between the two methods, (C) soil water retention curves obtained by both, traditional and nuclear (circular
slit collimator) methods for soil 2, and (D) deviation analyzes for the curve adjustments between the two methods. Soil water contents represent
the mean of three values for each curve obtained (rectangular and circular collimators).
source radioactivity. It is important to have in mind
that the soil sample utilized to obtain the retention
curve by a traditional method is submitted to several
wetting and drying cycles, which can lead to changes
in its structure (Hussein and Adey, 1998) and affect the
water retention curves. For the proposed nuclear
method the soil sample is submitted just one time to
the wetting and drying, which represents another
advantage of this method.
Table 4 shows the van Genuchten parameters for
soil samples presented in Figs. 3 and 4. The program
SWRC (Soil Water Retention Curve) developed by
Dourado-Neto et al. (2002) was used for the van
Genuchten adjustment. Higher values of a and n for
the curves obtained by the traditional method for both
soils indicate that these curves present a larger slope
and are steeper than the curves obtained by the nuclear
method (for both collimators). The r2 coefficients
values demonstrate a very good adjustment of the
experimental data to the model. Using the van
Genuchten equation, it was possible to estimate the
u values at the field capacity (0.033 MPa) for the two
methods, and the results were 0.2014 (soil 1) and
0.3969 cm3 cm�3 (soil 2) for the traditional method,
and 0.1777 and 0.1813 cm3 cm�3 (soil 1) and 0.3927
and 0.4031 cm3 cm�3 (soil 2) for the nuclear method
using the rectangular and circular collimators,
respectively. Unfortunately, since it was applied
different intervals of matric potential to determine
the soil water retention curves by the two methods
(Table 3), it was not possible to make a statistical
evaluation of the retention curve data. However, the
two methods present one common matric potential
value (0.1 MPa) for which the Tukey statistical
method was applied. The test shows that there are
no statistical significant differences (at 5% probability
level) between the soil water contents at 0.1 MPa
evaluated by the two methods.
Regarding the judgment of the equilibrium condi-
tion, since the gamma-ray system is linked to a
computer, the proposed technique allows, through a
software specifically elaborated for data acquisition,
to obtain the right moment to change the chamber
pressure to a new desired value, leading to a reduction
L.F. Pires et al. / Soil & Tillage Research 82 (2005) 89–9796
Fig. 5. Resolution of the nuclear method for soils 1 (A) and (B), and soil 2 (C) and (D). du represents the minimum measurable interval by the
nuclear method obtained by Eq. (5) and Du indicates the differences of soil water contents between Pi and Pi+1 pressure values.
of the time required to obtain for the whole retention
curve. In the conventional method, it is not possible
to determine with precision the exact moment of
the equilibrium, which is defined empirically after
the water outflow stops. For the nuclear method, the
procedure adopted to define the exact moment of the
equilibrium was following the variations in the soil
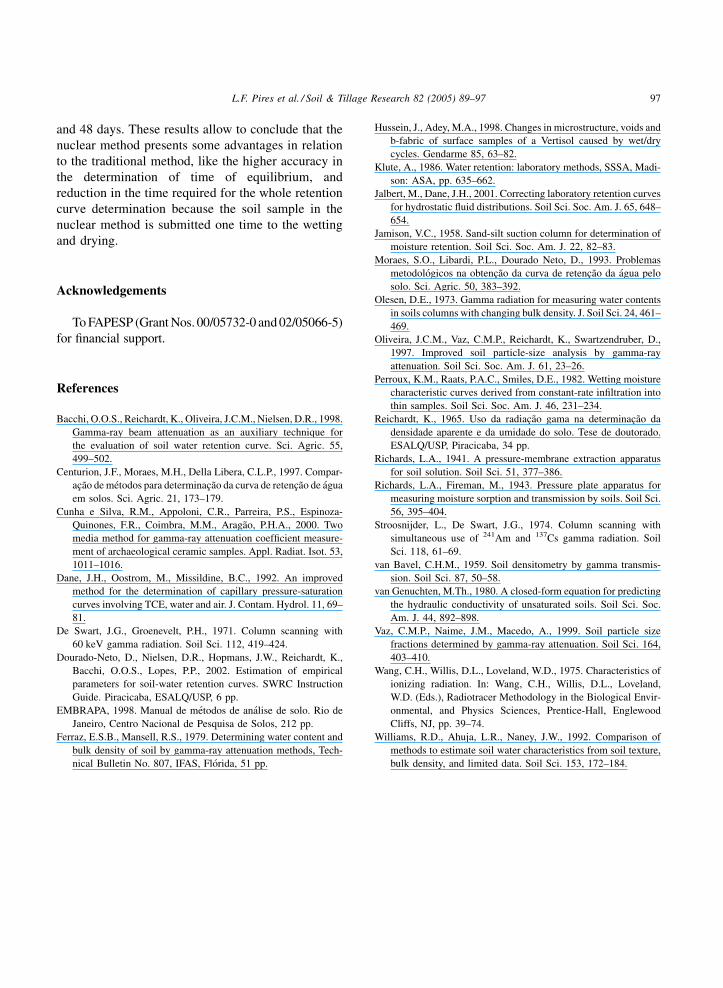
Table 4
Water retention curve parameters obtained by the van Genuchten (1980)
Parameters Soil 1
TRADa NUCL Cb NUCL
a (cm�1) 0.0096 0.0055 0.0018
us (cm3 cm�3) 0.2398 0.2539 0.2591
ur (cm3 cm�3) 0 0 0
m 0.0719 0.3556 0.6292
n 2.0251 0.7655 0.3777
r2 0.990 0.999 0.992
a Traditional method.b Nuclear method: circular collimator.c Nuclear method: rectangular collimator.
moisture values every day. When u reached a constant
value for each specific potential value (Cm), this value
was recorded and a new pressure step was applied. The
times required for the whole retention curve determi-
nation, with four points, for the soils 1 and 2, were 12
and 32 days, respectively, by the nuclear method. In
the case of the traditional method, these times were 20
model for the soils 1 and 2 (Figs. 3 and 4)
Soil 2
Rc TRADa NUCL Cb NUCL Rc
0.0035 0.0001 0.0021
0.3931 0.4798 0.4539
0 0 0
0.0234 1.0833 0.2475
3.1126 0.5119 0.6261
0.990 0.992 0.998
L.F. Pires et al. / Soil & Tillage Research 82 (2005) 89–97 97
and 48 days. These results allow to conclude that the
nuclear method presents some advantages in relation
to the traditional method, like the higher accuracy in
the determination of time of equilibrium, and
reduction in the time required for the whole retention
curve determination because the soil sample in the
nuclear method is submitted one time to the wetting
and drying.
Acknowledgements
To FAPESP (Grant Nos. 00/05732-0 and 02/05066-5)
for financial support.
References
Bacchi, O.O.S., Reichardt, K., Oliveira, J.C.M., Nielsen, D.R., 1998.
Gamma-ray beam attenuation as an auxiliary technique for
the evaluation of soil water retention curve. Sci. Agric. 55,
499–502.
Centurion, J.F., Moraes, M.H., Della Libera, C.L.P., 1997. Compar-
acao de metodos para determinacao da curva de retencao de agua
em solos. Sci. Agric. 21, 173–179.
Cunha e Silva, R.M., Appoloni, C.R., Parreira, P.S., Espinoza-
Quinones, F.R., Coimbra, M.M., Aragao, P.H.A., 2000. Two
media method for gamma-ray attenuation coefficient measure-
ment of archaeological ceramic samples. Appl. Radiat. Isot. 53,
1011–1016.
Dane, J.H., Oostrom, M., Missildine, B.C., 1992. An improved
method for the determination of capillary pressure-saturation
curves involving TCE, water and air. J. Contam. Hydrol. 11, 69–
81.
De Swart, J.G., Groenevelt, P.H., 1971. Column scanning with
60 keV gamma radiation. Soil Sci. 112, 419–424.
Dourado-Neto, D., Nielsen, D.R., Hopmans, J.W., Reichardt, K.,
Bacchi, O.O.S., Lopes, P.P., 2002. Estimation of empirical
parameters for soil-water retention curves. SWRC Instruction
Guide. Piracicaba, ESALQ/USP, 6 pp.
EMBRAPA, 1998. Manual de metodos de analise de solo. Rio de
Janeiro, Centro Nacional de Pesquisa de Solos, 212 pp.
Ferraz, E.S.B., Mansell, R.S., 1979. Determining water content and
bulk density of soil by gamma-ray attenuation methods, Tech-
nical Bulletin No. 807, IFAS, Florida, 51 pp.
Hussein, J., Adey, M.A., 1998. Changes in microstructure, voids and
b-fabric of surface samples of a Vertisol caused by wet/dry
cycles. Gendarme 85, 63–82.
Klute, A., 1986. Water retention: laboratory methods, SSSA, Madi-
son: ASA, pp. 635–662.
Jalbert, M., Dane, J.H., 2001. Correcting laboratory retention curves
for hydrostatic fluid distributions. Soil Sci. Soc. Am. J. 65, 648–
654.
Jamison, V.C., 1958. Sand-silt suction column for determination of
moisture retention. Soil Sci. Soc. Am. J. 22, 82–83.
Moraes, S.O., Libardi, P.L., Dourado Neto, D., 1993. Problemas
metodologicos na obtencao da curva de retencao da agua pelo
solo. Sci. Agric. 50, 383–392.
Olesen, D.E., 1973. Gamma radiation for measuring water contents
in soils columns with changing bulk density. J. Soil Sci. 24, 461–
469.
Oliveira, J.C.M., Vaz, C.M.P., Reichardt, K., Swartzendruber, D.,
1997. Improved soil particle-size analysis by gamma-ray
attenuation. Soil Sci. Soc. Am. J. 61, 23–26.
Perroux, K.M., Raats, P.A.C., Smiles, D.E., 1982. Wetting moisture
characteristic curves derived from constant-rate infiltration into
thin samples. Soil Sci. Soc. Am. J. 46, 231–234.
Reichardt, K., 1965. Uso da radiacao gama na determinacao da
densidade aparente e da umidade do solo. Tese de doutorado.
ESALQ/USP, Piracicaba, 34 pp.
Richards, L.A., 1941. A pressure-membrane extraction apparatus
for soil solution. Soil Sci. 51, 377–386.
Richards, L.A., Fireman, M., 1943. Pressure plate apparatus for
measuring moisture sorption and transmission by soils. Soil Sci.
56, 395–404.
Stroosnijder, L., De Swart, J.G., 1974. Column scanning with
simultaneous use of 241Am and 137Cs gamma radiation. Soil
Sci. 118, 61–69.
van Bavel, C.H.M., 1959. Soil densitometry by gamma transmis-
sion. Soil Sci. 87, 50–58.
van Genuchten, M.Th., 1980. A closed-form equation for predicting
the hydraulic conductivity of unsaturated soils. Soil Sci. Soc.
Am. J. 44, 892–898.
Vaz, C.M.P., Naime, J.M., Macedo, A., 1999. Soil particle size
fractions determined by gamma-ray attenuation. Soil Sci. 164,
403–410.
Wang, C.H., Willis, D.L., Loveland, W.D., 1975. Characteristics of
ionizing radiation. In: Wang, C.H., Willis, D.L., Loveland,
W.D. (Eds.), Radiotracer Methodology in the Biological Envir-
onmental, and Physics Sciences, Prentice-Hall, Englewood
Cliffs, NJ, pp. 39–74.
Williams, R.D., Ahuja, L.R., Naney, J.W., 1992. Comparison of
methods to estimate soil water characteristics from soil texture,
bulk density, and limited data. Soil Sci. 153, 172–184.
Copyright © 2022 FDOKUMEN