Soil Microbiology, Ecology, and Biochemistry - WordPress.com
535
-
Upload
khangminh22 -
Category
Documents
-
view
2 -
download
0
Transcript of Soil Microbiology, Ecology, and Biochemistry - WordPress.com

Soil Microbiology,
Ecology, and
Biochemistry
Prelims-P546807.qxd 11/20/06 11:18 AM Page i

Prelims-P546807.qxd 11/20/06 11:18 AM Page ii

AMSTERDAM • BOSTON • HEIDELBERG • LONDONNEW YORK • OXFORD • PARIS • SAN DIEGO
SAN FRANCISCO • SINGAPORE • SYDNEY • TOKYO
Academic Press is an imprint of Elsevier
Soil Microbiology,
Ecology, and
Biochemistry
T H I R D E D I T I O N
EditorEldor A. Paul
Prelims-P546807.qxd 11/20/06 11:18 AM Page iii

Academic Press is an imprint of Elsevier30 Corporate Drive, Suite 400, Burlington, MA 01803, USALinacre House, Jordan Hill, Oxford OX2 8DP, UK
Third edition 2007
Copyright © 2007, 1996, 1989, Elsevier Inc. All rights reserved.
No part of this publication may be reproduced, stored in a retrieval system, or transmitted in anyform or by any means, electronic, mechanical, photocopying, recording, or otherwise, without theprior written permission of the publisher.
Permissions may be sought directly from Elsevier’s Science & Technology Rights Department in Oxford, UK: phone: (44) 1865 843830, fax: (44) 1865 853333,e-mail: [email protected]. You may also complete your request on-line via the Elsevier homepage (http://elsevier.com), by selecting “Support & Contact”then “Copyright and Permission” and then “Obtaining Permissions.”
NoticeNo responsibility is assumed by the publisher for any injury and/or damage to persons or property as a matter of products liability, negligence or otherwise, or from any use or operation of any methods, products, instructions or ideas contained in the material herein.
Recognizing the importance of preserving what has been written, Elsevier prints its books on acid-free paper whenever possible.
Library of Congress Cataloging-in-Publication Data
Soil microbiology, ecology, and biochemistry / editor, Eldor A. Paul. — 3rd ed.p. cm.
Rev. ed. of: Soil microbiology and biochemistry / E.A. Paul, F.E. Clark. 1989.Includes bibliographical references and index.ISBN 13: 978-0-12-546807-7 (hardcover : alk. paper)ISBN 10: 0-12-546807-5 (hardcover : alk. paper) 1. Soil microbiology. 2. Soil biochemistry.
I. Paul, Eldor Alvin. II. Paul, Eldor Alvin. Soil microbiology and biochemistry.QR111.P335 2007579�.1757—dc22
2006036420
Typeset by Charon Tec Ltd (A Macmillan Company), Chennai, Indiawww.charontec.comPrinted in the United States of America
06 07 08 09 10 10 9 8 7 6 5 4 3 2 1
For information on all Academic Press publications visit our web site at www.books.elsevier.com
Prelims-P546807.qxd 11/20/06 11:18 AM Page iv
Contributors xviiPreface xix
PART I
Background
1Soil Microbiology, Ecology and Biochemistry
in PerspectiveE. A. Paul
General History and Scope 3Soil Microbiology 5Soil Ecology 10Soil Biochemistry 13In Perspective 19References and Suggested Reading 21
Contents
v
Prelims-P546807.qxd 11/20/06 11:18 AM Page v

2The Soil Habitat
R. P. Voroney
Introduction 25Soil Genesis and Formation of the Soil Habitat 26
Soil Profile 29Physical Aspects of Soil 29
Soil Texture 30Soil Structure 32
Soil Habitat Scale and Observation 33Scale of Soil Habitat 33Pore Space 35Soil Solution Chemistry 39Soil pH 43Soil Temperature 43Soil Water Content 45Environmental Factors, Temperature and Moisture Interactions 48
References and Suggested Reading 49
PART II
SOIL BIOTA
3Physiological and Biochemical Methods for
Studying Soil Biota and Their FunctionE. Kandeler
Introduction 53Scale of Investigations and Collection of Samples 54Storage and Pretreatment of Samples 56Microbial Biomass 57
Chloroform Fumigation Incubation and Extraction Methods 57Substrate-Induced Respiration 58Isotopic Composition of Microbial Biomass 58
Signature Molecules as a Measure of Microbial Biomass and MicrobialCommunity Structure 59
vi Contents
Prelims-P546807.qxd 11/20/06 11:18 AM Page vi
ATP as a Measure of Active Microbial Biomass 59Microbial Membrane Components and Fatty Acids 60Respiratory Quinones as a Measure of Structural Diversity 62Ergosterol as a Measure of Fungal Biomass 63Lipopolysaccharides, Glycoproteins, and Cell Walls 64Growth Rates from Signature Molecules 65
Physiological Analyses 65Culture-Based Studies 65Isolation and Characterization of Specific Organisms 66Soil Organic Matter Decomposition and Respiration 67Nitrogen Mineralization 72
Activities and Locations of Enzymes 72Spectrophotometric Methods 73Fluorescence Methods 75Techniques for Imaging the Location of Enzymes 77
Functional Diversity 77References and Suggested Reading 80
4Molecular Methods for Studying
Soil EcologyJ. E. Thies
Introduction 85Types and Structures of Nucleic Acids 86Use of Nucleic Acid Analyses for Soil Ecology Studies 88Direct Molecular Analysis of Soil Biota 90
Nucleic Acid Hybridization 90Confocal Microscopy 91
Biosensors and Marker Gene Technologies 92Extraction of Nucleic Acids (DNA/RNA) 93Choosing between DNA and RNA for Soil Ecology Studies 96Analysis of Nucleic Acid Extracts 96
DNA:DNA Reassociation Kinetics 96Microarrays 98Restriction Fragment Length Polymorphism (RFLP) Analysis 100Cloning 101DNA Sequencing 102Stable Isotope Probing 102
Partial Community Analyses—PCR-Based Assays 104Electrophoresis of Nucleic Acids 107
Contents vii
Prelims-P546807.qxd 11/20/06 11:18 AM Page vii

PCR Fingerprinting 107Similarity Analyses 112
Level of Resolution 112Other Factors That May Affect Molecular Analyses 113
Sample Handling 113Soil Chemical Factors 113Sampling Scale 114
Summary 114References 115
5The Prokaryotes
K. Killham and J. I. Prosser
Introduction 119Phylogeny 120
Cultivated Organisms 120Uncultivated Organisms 121Phylogeny and Function 125
General Features of Prokaryotes 126Cell Structure 127
Unicellular Growth Forms 127Filamentous and Mycelial Growth 129Cell Walls 129Internal Structure 131Motility 132
Metabolism and Physiology 132Carbon and Energy Sources 132Oxygen Requirements 133Substrate Utilization 134Autochthony and Zymogeny 136Oligotrophy, Copiotrophy, and the R–K Continuum 137Facultativeness 138
Biodegradation Capacity 138Cellulose 138Pollutants 139
Differentiation, Secondary Metabolism, and Antibiotic Production 141Conclusions 142References and General Reading 143
viii Contents
Prelims-P546807.qxd 11/20/06 11:18 AM Page viii
6Fungi and Eukaryotic Algae
R. G. Thorn and M. D. J. Lynch
Introduction 145Classification, Characteristics, and Ecological Roles in Soil 151
Fungus-like Protists 151Fungi (Chytridiomycota, Glomeromycota, Zygomycota, Ascomycota, and
Basidiomycota) 153Eukaryotic Algae 156
References and Suggested Reading 158
7Fauna: The Engine for Microbial Activity and
TransportD. C. Coleman and D. H. Wall
Introduction 163The Microfauna 166
Methods for Extracting and Counting Protozoa 168Impacts of Protozoa on Ecosystem Function 168Distribution of Protozoa in Soil Profiles 169
Rotifera 169Nematoda 170
Nematode Feeding Habits 170Zones of Nematode Activity in Soil 173Nematode Extraction Techniques 174
Microarthropods 174Enchytraeids 175Macrofauna 178
Macroarthropods 178Importance of the Macroarthropods 179Oligochaeta (Earthworms) 179Formicidae (Ants) 183Termitidae (Termites) 183
Summary 185References 186
Contents ix
Prelims-P546807.qxd 11/20/06 11:18 AM Page ix
PART III
CONCEPTS AND INTERACTIONS
8The Ecology of Soil Organisms
S. J. Morris and C. B. Blackwood
Introduction 195Mechanisms That Drive Community Structure 197
Physiological Limits 198Intraspecific Competition 199Dispersal in Space and Time 203Predicting Population Growth 204Interspecific Competition 204Direct Effects of Exploitation 207Indirect Effects of Exploitation 209Mutualisms 211Abiotic Factors 211Changes in Community Structure through Time and Space 212Historical and Geographic Contingency 214Hierarchical Community Assembly Rules 215
Ecosystem Dynamics 218Energy Flow 219Carbon, Nutrient, and Water Cycles 221Emergent Properties 224
Conclusion 225References and Suggested Reading 226
9The Physiology and Biochemistry of
Soil OrganismsW. B. McGill
Introduction 231Metabolic Classifications of Soil Organisms 233
Electrons and ATP 234Substrate-Level Phosphorylation 234
x Contents
Prelims-P546807.qxd 11/20/06 11:18 AM Page x
Electron Transport Phosphorylation 235Overview of Mechanisms to Generate ATP and Reducing Equivalents 238
Examples of Soil Microbial Transformations 241Nitrogen Fixation 241Aerobic Chemolithotrophic Examples 242Oxidation of Reduced C 245
How Can the Microbial Contributions Be Viewed in a Simplified and Unified Concept? 251A Model of Interconnected Cycles of Electrons 252The Anoxygenic Cycle 253The Oxygenic Cycle 253
References 256
10The Ecology of Plant–Microbial Mutualisms
J. Powell and J. Klironomos
Introduction 257Roots as an Interface for Plant–Microbial Mutualisms 258Mycorrhizal Symbioses 259Symbioses Involving N-Fixing Organisms 267Interactions among Mutualists 270Interactions with Pathogens 272Implications for Plant Populations and Communities 275Challenges in the Study of Interactions 276Conclusions 277References and Suggested Reading 279
11Spatial Distribution of Soil Organisms
S. D. Frey
Introduction 283Geographical Differences in Soil Biota 285Association of Soil Organisms with Plants 287Spatial Heterogeneity of Soil Organisms 290
Contents xi
Prelims-P546807.qxd 11/20/06 11:18 AM Page xi
Vertical Distribution within the Soil Profile 292Microscale Heterogeneity in Microbial Populations 296References and Suggested Reading 299
PART IV
BIOCHEMISTRY AND BIOGEOCHEMISTRY
12Carbon Cycling and Formation of Soil
Organic MatterW. Horwath
Introduction 303Long-Term Carbon Cycle 304The Short-Term C Cycle 307Ecosystem C Cycling 309Composition and Turnover of C Inputs to Soil 312
Plant and Microbial Lipids 315Starch 315Hemicelluloses, Pectins, and Cellulose 317Lignin 320Other Plant Cell Wall Carbohydrates and Proteins 324Plant Secondary Compounds 325Roots and Root Exudates 325Cell Walls of Microorganisms 327
Soil Organic Matter 329Soil Organic Matter Formation 329Classical Fractions of Soil Organic Matter 332Physical Analysis of Soil Organic Matter Fractions 333Structure of Soil Organic Matter 335
Quantity and Distribution of Organic Matter in Soils 335Role of Methane in the C Cycle 336Future Considerations 337References and Suggested Reading 337
xii Contents
Prelims-P546807.qxd 11/20/06 11:18 AM Page xii
13Nitrogen TransformationsG. P. Robertson and P. M. Groffman
Introduction 341Nitrogen Mineralization and Immobilization 343Nitrification 347
The Biochemistry of Autotrophic Nitrification 347The Diversity of Autotrophic Nitrifiers 349Heterotrophic Nitrification 352Environmental Controls of Nitrification 353
Inhibition of Nitrification 355Denitrification 355
Denitrifier Diversity 356Environmental Controls of Denitrification 358
Other Nitrogen Transformations in Soil 359Nitrogen Movement in the Landscape 360References and Suggested Reading 362
14Biological N Inputs
P. J. Bottomley and D. D. Myrold
Global N Inputs 365Biological Nitrogen Fixation 367Free-Living N2-Fixing Bacteria 372Associative N2-Fixing Bacteria 373Phototrophic Bacteria 374Symbiotic N2-Fixing Associations between Legumes and Rhizobia 375
Formation of the Symbiosis 375Rhizobial Nodulation Genes 378Plant Nodulation Genes 380Development of BNF and Nitrogen Assimilatory Processes in Nodules 381Symbiotic Associations between Actinorhizal Plants and Frankia 383
Biotechnology of BNF 385Acknowledgments 386References and Suggested Reading 386
Contents xiii
Prelims-P546807.qxd 11/20/06 11:18 AM Page xiii

15Soil Biogeochemical Cycling of Inorganic
Nutrients and MetalsA. F. Plante
Introduction 389Phosphorus 391
The Soil Phosphorus Cycle 391Nature and Forms of Phosphorus in Soil 393Biological Importance of Phosphorus 397Microbial Transformations of Phosphorus 398
Sulfur 400The Soil Sulfur Cycle 400Nature and Forms of Sulfur in Soil 402Biological Importance of Sulfur 406Microbial Transformations of Sulfur 406
Micronutrients and Trace Metals 413Micronutrient and Trace Metal Cycling in Soil 413Nature and Forms in Soil 414Biological Importance 415Microbial Transformations 417
Environmental Significance of P, S, and Metal Biogeochemistry 423Eutrophication 423Acid Sulfate Soils 423Acid Mine Drainage 424Heavy Metal Mining Using Microbes 426Microbial Corrosion of Buried Iron and Concrete Pipes 427
Conclusion: Microorganisms as Unifiers of Elemental Cycles in Soil 430References and Suggested Reading 430
16The Dynamics of Soil Organic Matter and
Nutrient CyclingA. F. Plante and W. J. Parton
Introduction 433Reaction Kinetics 434
Zero-Order Reactions 434First-Order Reactions 435
xiv Contents
Prelims-P546807.qxd 11/20/06 11:18 AM Page xiv
Enzymatic Kinetics 436Microbial Growth 437
Modeling the Dynamics of Decomposition and Nutrient Transformations 439Simple Models 441Multicompartmental Models 443Alternative SOM Models 453Models of Non-C Nutrient Elements 454Ecosystem Models: Interactions of Nutrient Cycling and SOM
Dynamics 457Establishing Pool Sizes and Kinetic Constants 459Model Selection and Evaluation 461References and Suggested Reading 464
PART V
Soil Organisms: Man and Nature
17Management of Organisms and Their Processes
in SoilsJ. L. Smith and H. P. Collins
Introduction 471Changing Soil Organism Populations and Processes 473
Tillage and Erosion 474Rangeland and Forest Health 477
Alternative Agricultural Management 480Organic Agriculture 480Biodynamic Agriculture 482Composting 483Crop Rotations and Green Manures 486
The Potential for Managing Microorganisms and Their Processes 487Management of Native and Introduced Microorganisms 487Managing Microbial Populations as Agents of Biological Control 488Control of Insects 490Weed Control 492Use of Synthetic and Natural Compounds to Modify Soil Communities
or Functions 493Manipulating Soil Populations for Bioremediation of Xenobiotics 495
Contents xv
Prelims-P546807.qxd 11/20/06 11:18 AM Page xv

Concluding Comments on Microbial Ecology 499References and Suggested Reading 500
18Soil Microbiology, Ecology, and Biochemistry
for the 21st CenturyJ. Schimel
Introduction 503Soil Community Ecology—Controls over Population and Community
Dynamics 506Microbial Life at the Microbial Scale—the Microbial Landscape 507A Whole Profile Perspective 509Scaling to the Ecosystem 510Application 511Conclusions 512References 512
Index 515
xvi Contents
Prelims-P546807.qxd 11/20/06 11:18 AM Page xvi

Christopher B. Blackwood Department of Biological Sciences, Kent StateUniversity, Kent, OH 44242
Peter J. Bottomley Department of Crop and Soil Science, Oregon State University,Corvallis, PR 97331-3804
David C. Coleman Institute of Ecology, University of Georgia, Athens, GA 30602-2360
Harold P. Collins USDA-ARS, Vegetable and Forage Research Unit, Prosser,WA 99350
Serita Frey Department of Natural Resources, University of New Hampshire,Durham, NH 03824
Peter M. Groffman Institute of Ecosystem Studies, Millbrook, NY 12545-0129
William H. Horwath Department of Land, Air, and Water Resources, Universityof California-Davis, Davis, CA 95616-8627
Ellen Kandeler Institute of Soil Science and Land Evaluation, Soil BiologySection, University of Hohenheim, D-70599 Stuttgart, Germany
Ken Killham School of Biological Sciences, University of Aberdeen, AberdeenAB24 3UU, Scotland
John Klironomos Department of Integrative Biology, College of BiologicalSciences, University of Guelph, Guelph, ON, N1G 2W1 Canada
Michael Lynch Department of Biology, University of Waterloo, Waterloo, OntarioN2L 3G1 Canada
W. Bill McGill University of Northern British Columbia, College of Science andManagement, Prince George, BC, Canada V2N 4Z9
Contributors
xvii
Prelims-P546807.qxd 11/20/06 11:18 AM Page xvii

Sherri J. Morris Biology Department, Bradley University, Peoria, IL 61625
David Myrold Department of Crop and Soil Science, Oregon State University,Corvallis, PR 97331-3804
Eldor A. Paul Natural Resource Ecology Laboratory and Soil and Crop Sciences,Colorado State University, Fort Collins, CO 80523-1499
William Parton Natural Resource Ecology Laboratory, Colorado State University,Fort Collins, CO 80523-1499
Alain Plante Department of Earth and Environmental Science, University ofPennsylvania, Philadelphia, PA 19104-6316
Jeff Powell Department of Integrative Biology, College of Biological Sciences,University of Guelph, Guelph, ON, N1G 2W1 Canada
Jim I. Prosser School of Biological Sciences, University of Aberdeen, Aberdeen4,Scotland AB24 3UU United Kingdom
G. Philip Robertson Department of Crop and Soil Sciences and W. K. KelloggBiological Station, Michigan State University, Hickory Corners, MI 49060
Joshua P. Schimel Department of Ecology, Evolution, and Marine Biology,University of California-Santa Barbara, Santa Barbara, CA 93106-9610
Jeffrey L. Smith USDA-ARS, Washington State University, Pullman, WA99164-6421
Janice E. Thies Department of Crop and Soil Science, Cornell University,Ithaca, NY
R. Greg Thorn Department of Biology, University of Western Ontario, London,ON, N6A 5B7 Canada
Paul Voroney Land Resource Science, University of Guelph, Guelph, ON, CanadaN1G 2W1
Diana H. Wall Natural Resource Ecology Laboratory and Department of Biology,Colorado State University, Fort Collins, CO 80523-1499
xviii Contributors
Prelims-P546807.qxd 11/20/06 11:18 AM Page xviii

Soil microbiology traditionally has been the study of microorganisms and theirprocesses in soil. The interaction of organisms with each other and their environ-ments involves soil ecology. Soil biochemistry includes microbial processes, soilenzymes, and the formation and turnover of soil organic matter. Soil, in thenonengineering definition, is usually defined as the surface of the earth affected byplant roots, even though life, especially that of microorganisms, occurs at greatdepths in geological deposits, caves, and sediments. Although the organismsinvolved are often different, their ecological and abiotic controls and the productsof their metabolism have great similarities in all locations. Thus, there is now arecognized similarity and interaction with soil and biogeochemical studies inmarine and fresh water systems, sediments, and the atmosphere. What we knowfrom these processes on earth will also guide future extraterrestrial investigationsand, as a result, the number of people interested in this field has greatly increased.The textbook “Soil Microbiology and Biochemistry” by Paul and Clark (1989,1996) is available in Chinese and Korean translations. It has been incorporatedinto the teaching of engineering, biogeochemistry, ecology, and general biology ina variety of university departments, including those of private, undergraduate, andteaching universities, and is widely used in many research applications.
The biological processes that occur in soil are intertwined with and inseparablefrom activities of the soil fauna, which feed on plants, soil microorganisms, andlitter. Their larger forms act as environmental engineers through their soil-mixingfunctions. They also contain microbial endophytes that carry out much of theirdecomposition function. The name of this edited volume has been changed toreflect its broader applicability and has been expanded to include both more basicand applied approaches. Soil microbiology, ecology, and biochemistry are being
Preface
xix
Prelims-P546807.qxd 11/20/06 11:18 AM Page xix

used in a broad range of applications from agronomy, plant pathology, general ecol-ogy, microbial ecology, engineering, organic agriculture, forestry, range manage-ment, and global change. We have thus included chapters on invertebrate–microbialinteractions, basic physiology, and ecological interpretations. Information on themanagement of microorganisms and their reactions has been expanded while wehave strived to retain readability, conciseness, and a reasonable cost.
The definition of microbiology is usually associated with organisms not seenwithout the use of a microscope, although this does not apply to many fungallichen and algal growth forms. The communal structure of the Armillaria associ-ated with tree roots in a number of areas is hectares in size, although it is still afungus by definition. The soil fauna also range in size and diversity. This bookreflects the great advances in molecular techniques, the broader use of tracers, andthe maturation of modeling in interpretation of data and development of new con-cepts. We finally know enough about our field to be able to impact management ofsuch modern problems as biodiversity, biological invasions, global change,ecosystem services, sustainable agriculture, and urban ecosystems. This textbookhas been designed to provide access to necessary knowledge for those working inthese diverse fields. The authors of the individual chapters hope that the readerswill find this a readable, accessible introduction to both the concepts involved andthe background literature.
xx Preface
Prelims-P546807.qxd 11/20/06 11:18 AM Page xx

PART
I
BACKGROUND
Ch01-P546807.qxd 11/18/06 5:21 PM Page 1

Ch01-P546807.qxd 11/18/06 5:21 PM Page 2
1SOIL MICROBIOLOGY,
ECOLOGY, AND BIOCHEMISTRY
IN PERSPECTIVE
E. A. Paul
General History and Scope
Soil Microbiology
Soil Ecology
Soil Biochemistry
In Perspective
References and Suggested Reading
3
GENERAL HISTORY AND SCOPE
The processes that occur within soil are closely related to those in sediments andaquatic environments. They are also associated with the beginning of life on thisplanet. Biochemical and biological changes were associated in the earth’s earlystages. Molecular biomarkers, isotope modification (such as differences in 34S and13C), and identifiable fossils are important in the study of the earth’s history. Theprimordial soup theory of Oparin and Haldane assumed that organic compoundsin water underwent polymerization and condensation reactions similar to those thatdescribe modern soil organic matter formation. The formation of macromoleculesthat catalyze their own replication is known to be assisted by clays, metals, imidazolederivatives, and selective adsorption onto mineral surfaces that promote concen-tration and polymerization (Bada and Lazcano, 2003). Carbon and associated Nsubstrates may have arrived on meteorites in association with minerals.
The first written history of soil and soil biota originated in the East, wherescholars were recognized in the early Chinese royal courts. Coleman et al. (2004)
Ch01-P546807.qxd 11/18/06 5:21 PM Page 3

4 Chapter 1 SOIL MICROBIOLOGY, ECOLOGY, AND BIOCHEMISTRY IN PERSPECTIVE
stated that soils were classified during the Yao Chinese dynasty from 2357 to 2261BCE. This dynasty should be recognized for both basic and applied studies of soilsas they used a soil classification for taxation purposes. The ancient Chinese regardedearthworms “as angels of the earth.” Romans, such as Aristotle, considered earth-worms as “intestines of the earth” (Coleman et al., 2004). Further evidence for theearly recognition of soil is that the Hebrew word for soil is “adama,” from which isderived Adam, the first man in Semitic religions (see Hillel, 1991). The ancient Vedicliterature of India classified soils by color (and thus organic matter content) andrecognized the importance of land forms, erosion, vegetation, land use, and humanhealth implications.
Fungi were known for their fermentation reactions in wine, beer, and breadmaking and also as a food source that could at times be toxic. Inscriptions onEgyptian walls from 2400 BCE show the production of beer and bread involved theuse of a starter and required an incubation time. Eastern, and later Roman, schol-ars recognized the soil-improving qualities of legumes and crop residue additions.Roman literature on agriculture and soil management was extensive. This wasupdated and condensed into a single volume by Petrus Crescentius in 1240 CE andfor many years was copied, even into the time of the printing press (e.g., RuraliumCommodorium libri duodecin Augsburg, 1471).
Knowledge stagnated in Europe for the one and a half thousand years prior tothe Renaissance at the end of the 15th century; not from a lack of intelligence, butfrom the firmly held belief that the world was governed from the outside and wasnot an object to be questioned (i.e., intelligent design). The end of the 15th centurymarked the end of the Western medieval world with the emergence of the perspec-tive that laws that govern the world are subject to study. The concept of biologicaland abiotic controls that can be studied and influenced by humans marked thebeginning of our present knowledge of the soil biota and their processes. The abil-ity to transmit this knowledge by the printed word after the invention of the print-ing press also greatly aided scientific discovery and discussion.
We are getting further away from our historical roots, an understanding ofwhich is so important to our thinking and ability to formulate scientific questions.The advent of the computer with its easy access to recent literature seems to delayvisits to the library to look at not only the original thinking in our field during theearly 20th century, but also important literature from 1950 to 1980. I have tried tosummarize briefly some of the important early discoveries. In doing so, I have notreferred to the original literature, but to reviews often found in textbooks thatshould be available in many libraries. The history of our science is not merely alisting of the important discoveries, but an important example of scientific thoughtprocesses and the relation between methodology, ideas, and concepts.
Our field is still methodology-driven as shown by the great increase in knowl-edge being derived from molecular techniques and tracers. Another methodologybreakthrough was nearly driven to excess, as shown by the fact that the three mostcited papers from the Soil Biology and Biochemistry Journal from 1975 to 2000
Ch01-P546807.qxd 11/18/06 5:21 PM Page 4
involved the application of the fumigation technique (earlier used by Schloesingand Müntz for nitrification studies) for the measurement of microbial biomass.Today we are benefiting greatly from the availability of automated techniques, theuse of computers in data transformation, modeling and knowledge dissemination,and the presence of active scientists in many new parts of the globe.
A look at our history shows how ideas were generated. It also shows that weshould look at some of the misconceptions of the past to help us clearly define ourthoughts and concepts. I realize that my biases show and that I have concentrated onthe positive. The literature is full of examples showing that many of our founders alsodeveloped some “doozies.” It would also be rewarding to look at what did not passthe test of time so that our own ideas do not end up in the same dustbin. A brief sur-vey of citations in some search engines, such as the U.S. National AgriculturalLibrary, Commonwealth Agricultural Bureau, ISI Science Citations, and BiologicalAbstracts, shows that the words “soil ecology” elicit more responses than “soilmicrobiology,” which is followed in interest by “soil biochemistry” and “microbialecology.” There are differences in relative rankings dependent on the search engines,but processes generally involve more citations than microorganisms. Soil N is mostpopular, followed by soil C, N2 fixation, and the rhizosphere. The citation surveyshows that new methods of analysis are being applied to continuing problems withpollutants and pesticides and their effects on the soil population. These topics arecontinuing to receive a great deal of attention, as is soil biodegradation. If you reallywant to gain a further appreciation of our field, try general search engines, such asGoogle, which lists 9,050,000 items for “soil microbiology,” 25,100,000 for “soilecology,” and 7,800,000 for “soil biochemistry.” An understanding of the interest inthe word “humus” would require the perusal of 4,760,000 items. This, however,includes recipes for a common Mediterranean prepared food, hummus, so maybe abetter search would be for “soil organic matter,” with 14,600,000 items.
SOIL MICROBIOLOGY
Fungi in certain forms can be readily seen without a microscope; thus, theyreceived early study. The first book solely about fungi (“Theatrum Fungorium”)published in 1675 by J. F. van Starbeck drew heavily on the drawings of Charlesde’Egeluse prepared as early as 1601 (see Atlas, 1984). In 1665, Hooke publisheda work on the fruiting bodies of fungi, and by 1724, spores were known as fungalreproductive agents. Fungus–root associations were noted by earlier authors, butin 1877, Pfeffer recognized their symbiotic nature, and in 1885, Franck coined theword “mycorrhiza.” Franck later distinguished between ecto and endo associa-tions; a classification that is still applicable in present, extensive literature on thissubject. In 1886, Adametz isolated fungi from soil and gave them names. The firstdetailed classification of soil fungi was conducted by Oedemans and Koning in1902 (see Waksman, 1932). In the 1920s, Charles Thom made a detailed study of
Soil Microbiology 5
Ch01-P546807.qxd 11/18/06 5:21 PM Page 5
soil fungi, especially Penicillium and Aspergillus, the dominant soil fungi on mostagar plates. Waksman also published extensively on soil fungi and actinomycetes.
Leeuwenhoek (1632–1723) is recognized as being the first to see bacteria inhis self-designed microscopes. He observed the small animalcules in natural waterand in water amended with a substrate (pepper or meat broth). The comprehensiveclassification system produced by Linnaeus in 1743 perhaps foretold the moderndifficulties in bacterial classification when he placed all the organisms seen byLeeuwenhoek in infusions of vegetable matter and meat broth into the genus Chaos.In 1776, Nagelli (see Atlas, 1984) suggested that bacteria be placed into their ownclass entitled Schizomycetes. The work of Warington, Lawes, and Gilbert estab-lished the biological nature of many of the processes involved in N transformations,especially those involved with the growth of leguminous crops. Pasteur (1830–1890),in discrediting the theory of spontaneous generation, laid the foundation for micro-biology. Although trained as a chemist, he developed vaccines for rabies and inves-tigated many food microbiology problems. Pasteur and Liebig had both postulatedthat the process of nitrification was bacterial in nature. While studying sewagepurification by land filters, Schloesing and Müntz found that the ammonia contentof sewage passed through a sand filter did not alter for 20 days. After this period,ammonia was changed to nitrate, but the process could be stopped by a small amountof chloroform. The process could be restarted by soil extract, thus proving that thisprocess was due to microorganisms or, as they said, “organized ferments.”
S. Winogradsky (1856–1953) is recognized as the founder of soil microbiologyfor his contributions to nitrification, anaerobic N2 fixation, sulfur oxidation, andmicrobial autotrophy (Winogradsky, 1949). He succeeded in isolating two bacterialtypes involved in nitrification with the keen insight that they obtained their C fromCO2. He thus also established autotrophy in microorganisms. In the period 1872–1876, Cohn published the first comprehensive study of the bacterial content of soil.Hellriegel and Wilfarth, in 1888, grew peas in the absence of a fixed N supply, show-ing that legumes obtained their N from the atmosphere, whereas oats did not have thiscapability. They knew that the peas had nodules, but could not isolate the bacteriawithin. Beijerinck, in 1888, isolated the bacteria that he called “Bacillus radicicola”(now usually called “Rhizobium”). This showed the dependence of the N cycle onbacteria. The N cycle was completed when Goppelsröder observed that nitrates werereduced to nitrites in the presence of soil organic matter. In 1868, Schoenbeinascribed the reaction to bacteria and Gayon and Dupetit further developed the knowl-edge that led to denitrification studies.
The latter half of the 19th century saw more details on microbial processes includ-ing symbiotic and asymbiotic N2 fixation, denitrification, and sulfate reduction andoxidation. The research on fermentation led to the delineation of anaerobic metabo-lism. Waksman, in his 1952 textbook “Soil Microbiology,” gives a detailed accountof the early contributions and also published photographs of many of our academicforefathers in soil microbiology. His 1932 book gives detailed historical referencesin each of the chapters, as well as a listing of the textbooks on the various topicsto that date. He gives credit (together with Winogradsky) for the foundation of soil
6 Chapter 1 SOIL MICROBIOLOGY, ECOLOGY, AND BIOCHEMISTRY IN PERSPECTIVE
Ch01-P546807.qxd 11/18/06 5:21 PM Page 6

microbiology as a discipline to Martinis Beijerinck (1851–1931), who not onlyextracted the first viruses from plants, but also isolated many N2-fixing organisms anddeveloped enrichment techniques. Basic and applied sciences were as intertwinedin the beginning of our science as they are now. Winogradsky and Beijerinck are alsorecognized as founding members of microbial physiology and microbial ecology.
The first textbook to include soil microbiology was that of Löhnis, “Vorlesunenüber Landwirtschaftliche Bäkteriologi,” published in 1910 and 1913. English readerscan gain an insight into its contents in the English version he published togetherwith E. B. Fred in 1923, entitled “Textbook of Agricultural Bacteriology.” Thattext contains very readable accounts of bacteria, fungi, and protozoa and a gooddiscussion of relationships of microorganisms to their environment. J. G. Lipman(1874–1939), who established the Department of Soil Chemistry and Bacteriologyat Rutgers University in 1901, was especially interested in the effects of soil organ-isms on soil fertility and plant growth. His 1911 book entitled “Bacteria in Relationto Country Life” was the first American treatise in this field. Waksman (1952)named the period from 1890 to 1910 as the Golden Age of soil microbiology whenrepresentatives of the soil biota carrying out the major soil and biogeochemicalprocesses were identified. The identification of at least representative members ofthe microorganisms mediating soil fertility and nutrient transformations led to thebelief that this knowledge could do for agriculture what the identification of majordisease organisms did for medical treatment.
Successes in legume inoculation led to several premature attempts to alter soilC and N transformations by inoculation and to relate microbial numbers to soilfertility. This discussion continues to this day in the many questions concerningbiodiversity and ecosystem functioning addressed later in this volume. The attemptsto inoculate bacteria, other than symbionts, and control microbial pathogens ofplants were seldom successful because of the lack of knowledge of microbialecology and the other controls involved. These studies did, however, help transferattention from pure cultures and laboratory investigations to field experiments andthe need for replication to account for soil heterogeneity. This period also containedthe interesting conclusion that if an organism did not grow on a gelatin or agar plate,it could not be important and thus was not worth studying.
The years from 1910 to the Second World War witnessed the employment ofsoil microbiologists in numerous new institutions in many parts of the world. Thisled to a better knowledge of the global distribution of, and management effects on,organisms capable of growth in the laboratory medium. The development and useof direct microscopy led to the realization that approximately only 1% of the soilpopulation could be grown on laboratory media. The failure of inoculants, exceptin the case of symbiotic N2 fixation, to create meaningful management effects wasa worry at that time. It is only now that we realize the huge number of unidentifiedorganisms and that the unknown interactions between them and their environment(ecology) explain the often observed lack of impact of introduced organisms.
It was at first assumed that bacteria were the major players in soil fertility anddecomposition as typified by the books of Löhnis in 1910 and Löhnis and Fred in
Soil Microbiology 7
Ch01-P546807.qxd 11/18/06 5:21 PM Page 7
1923. In 1886, Adametz showed that fungi are abundant in soil. Additionally,Hiltner and Störmer had studied actinomycetes, which at that time were thoughtto be different from the bacteria. Cutler had studied the protozoa, and Russell andHutchinson developed the theory that by consuming bacteria, protozoa could con-trol the soil population and, thus, soil fertility. The early textbooks took as muchlicense with their titles as modern ones. The Löhnis and Fred publication on agri-cultural bacteriology included extensive sections on the protozoa and fungi dis-cussed under sections such as “Bacteria and related microorganisms.” Waksman’s“Soil Microbiology” included sections we would today call biochemistry. The effectsof environmental factors on the rate of soil organic matter decomposition weredescribed by Waksman in his 1932 book entitled “Principles of Soil Microbiology”and the Waksman and Starkey 1931 book entitled “The Soil and the Microbe.”
The period between the two world wars saw work on microbial interactions andnutrient transformations. Fred, Baldwin, and McCoy’s 1932 comprehensive volumeon “Root Nodule Bacteria and Leguminous Plants” set the stage for the continuedsuccess in symbiotic N2 fixation. The C:N ratio required for plant-residue decompo-sition without N immobilization was determined as approximately 25:1, a number thatis still appropriate unless large amounts of poorly degradable residues are involved,as in forest litter. Attempts to measure many of the microbial processes in soil werefrustrated by the inaccuracy of the measurement techniques relative to the large stockof nutrients in soil. Waksman (1932) commented that it was difficult to measure N2
fixation by free-living organisms at levels less than 40 lb per acre, which was (andstill is) the inherent error in the Kjeldahl or other methods of measuring total N. TheFinnish scientist A. I. Virtanen received the 1945 Nobel Prize in Chemistry for hismajor contributions to legume nutrition, especially the role of rhizobia in symbioticN2 fixation. Lie and Mulder (1971), in “Biological Nitrogen Fixation in Natural andAgricultural Habitats,” provide a record of the many advances made in that field.
The Second World War led to a concentration on the war effort. This was, how-ever, not without its success as witnessed by the use of the fungal antibiotic, peni-cillin, and the development of streptomycin, for which Waksman received theNobel Prize in Medicine in 1952. The war also resulted in studies to overcome foodspoilage and rotting of clothes, as well as the beginnings of biological warfare inboth preventive and causative formats. Alexander’s 1961 and 1977 “Introductionto Soil Microbiology” continued the general organization utilized by Waksman inhis earlier volumes. He organized the section on the soil environment and bacteria,actinomycetes, fungi, algae, protozoa, and viruses into a section entitled “MicrobialEcology” and recognized the multitude of microbial and microbial–plant inter-actions. The 1960s saw an influx of new scientists that worked on symbiotic andasymbiotic N2 fixation, S cycling, the rhizosphere, mycorrhizas, and the effects ofherbicides, pesticides, and pollutants on the microbial population. The mycorrhizalhistory to 1969 can be found in Harley (1969). The use of 15N and alternate sub-strates and inhibitors for specific enzyme interactions made possible for the firsttime the quantification of the processes in the N cycle at the levels that they occurin soil. However, method availability still hindered testing of concepts regarding
8 Chapter 1 SOIL MICROBIOLOGY, ECOLOGY, AND BIOCHEMISTRY IN PERSPECTIVE
Ch01-P546807.qxd 11/18/06 5:21 PM Page 8

microbial populations and diversity, and it was not until the advent of nucleic acidmethodology, automated biochemical measurements, such as phospholipid fattyanalysis (PLFA), computers, and modeling that the great thrust of knowledge cov-ered in the subsequent chapters of this volume could come to fruition.
Volumes on soil microbiology include Subba Rao (1999), “Soil Organisms andPlant Growth,” 4th ed.; Killham (1994), “Soil Ecology;” Lynch (1983), “SoilBiotechnology;” Metting et al. (1992), “Soil Microbial Ecology;” Alef andNannipieri (1995), “Methods in Applied Soil Microbiology and Biochemistry;”Van Elsas et al. (1997), “Modern Soil Microbiology;” and Sylvia et al. (2005),“Principles and Applications of Soil Microbiology.” Other volumes include Tate in1994, “Soil Microbiology;” Harley and Smith in 1983, “Mycorrhizal Symbiosis;”Read et al. in 1992, “Mycorrhizas in Ecosystems;” and Makerji, Chamola, andSingh in 2000, “Mycorrhizal Biology.” A community and ecosystem approach tothe biology of soil is presented by Bardgett (2005) and the role of microbial diver-sity as a supplier of ecosystem services is presented in two edited volumes(Bardgett et al., 2005; Wall, 2004).
The advances in molecular techniques utilizing culture-independent directretrieval of 16S rRNA genes have allowed an examination of the occurrence andbiodiversity of microorganisms. A survey conducted by Morris et al. (2002)examined the primary scientific literature from 1975 to 1999 in 525 journals.Figure 1.1 shows data for six soil-associated habitats.
Soil Microbiology 9
Num
ber
of p
ublic
atio
ns p
er y
ear
Years
1975 1980 1985 1990 1995 2000
100
80
60
40
20
0
FIGURE 1.1 Publications per year from 1975 to 1999 in microbial diversity: (◆◆) fungal–plantpathosystems, (▲) rhizosphere and mycorrhiza, (▲▲▲▲) microbial habitats in soil, (◆) aquatic systems, (—) bacterium plant systems, and (■) food microbiology (Morris et al., 2002).
Ch01-P546807.qxd 11/18/06 5:21 PM Page 9
Fungus–plant pathosystems outnumbered the other five habitats and showed a10-fold increase in papers; however, that number peaked in 1996. The rhizos-phere, including mycorrhizas, was still rapidly increasing in popularity in 1999.Microbial habitats in soil showed a similar trend, as did aquatic systems.Molecular techniques hold great promise for increasing our understanding of thelinks between organisms, processes, and the environment; thus soil microbiology,biochemistry, and ecology are best treated in one volume. The recent finding ofammonia-oxidizer genes in previously immeasurable Archaea is one example ofnew functional groups and maybe even new functions and processes that will bediscovered by the readers of this book.
SOIL ECOLOGY
Soil ecology is the second leg of the scientific tripod supporting this textbook.Ecology has numerous definitions. The one that applies to this text is the interactionof organisms and their environment. Smith and Smith (2001) stated that Haeckeldeveloped the term “ecology” in 1869 from the Greek term “oikos,” meaning homeor place to live. The first ecological publications are credited to the Greek scholarTheophrastus (371–288 BCE), who wrote nine books on “The History of Plants”and six on “The Causes of Plants.” Continued work by naturalists during the 15thcentury, especially in the Middle East, was followed by the plant geographers,such as Wildenow (1765–1812) and Von Humboldt (1769–1859). These describedvegetation by physical type and environmental conditions and coined the word“association” (see Smith and Smith, 2001). More plant geography, such as that ofSchouw, who studied the effects of temperature on plant distribution, and Paczoski,who studied microenvironments created by plants, led to the study of plant com-munities. Scientists such as Coulter, Bessey, and Clements developed concepts ofsuccession and gave ecology its hierarchical framework (see Major, 1969).
Aquatic research contributed much to ecological theory. In 1887, Forbes, whointerestingly had no college degree (see Hagen, 1992), wrote the classic “The Lakeas a Microcosm,” which was a predecessor to ecosystem ecology and introducedthe concepts of interrelationships through food chains. In 1931, European biolo-gists Thieneman and Forel used the concept of organic nutrient cycling and devel-oped the terms “producers” and “consumers.” In 1926, agronomist Transeau wasinterested in improving agricultural production through a better understanding ofphotosynthetic efficiency and initiated our understanding of primary production.The early ecologists tended to concentrate on native plant and animal associations,whereas at that time soil microbiologists were associated with either agronomy ormicrobiology departments. Agronomists were primarily concerned with cultivatedfields and the processes therein. To the soil zoologists, these fields seemed depau-perate of interesting organisms, while the ecologist’s obsession with native sites,and to some extent the environmental movement, was thought by the agronomiststo greatly limit their interpretive capability.
10 Chapter 1 SOIL MICROBIOLOGY, ECOLOGY, AND BIOCHEMISTRY IN PERSPECTIVE
Ch01-P546807.qxd 11/18/06 5:21 PM Page 10
Ecosystem science, a term coined by Tansley in 1935 (see Hagen, 1992), led toa more experimental approach and interdisciplinary work. The textbook organizedaround the ecosystem concept, “Fundamentals of Ecology” by E. P. Odum (1971),went through three editions and was translated into more than 20 languages. TheInternational Biological Programme of the 1960s and 1970s demonstrated the needto investigate all the interacting components of the ecosystem and to model themusing mathematically defined transformation processes. This required the activeinteraction of soil microbiologists and biochemists with plant and animal ecologistsand agronomists. During this program, G. M. Van Dyne, a strong advocate of theecosystem concept, described the editor of this volume as standing on a four-strandedbarbed wire fence between ecology and agronomy, with the warning that someday I would slip, with the obvious drastic consequences. The title and chapters inthis book indicate to me that this fence has finally been ripped out. Future greatadvances lie in the study of our exciting field by scientists with a variety of back-grounds and employment in institutions often as heterogeneous as the soils andorganisms they study. At the same time, the more classically trained ecologistsrecognize that the soil, with its multitude of interacting organisms and complexityof interactions, is the last great frontier of ecology.
Today’s researchers are finding that replicated, managed fields are excellent forstudying and developing ecological and biogeochemical concepts in that theyoften have greater, more easily measured, nutrient fluxes than those in perennialvegetation. Uncultivated systems, whether prairie or forest, are essential as referencepoints, often with greater diversity. Other work, such as that in the Amazon Basin,is recognizing that many of the forests that were once thought to be pristine havehad major past human interventions.
Russell’s 11th edition of “Soil Conditions and Plant Growth,” edited by Wild(1988), noted that Gilbert White, in 1777, observed that earthworms were promotersof vegetation by perforating and loosening the soil and drawing leaves underground.Feller et al. (2003a) note that Darwin first reported on the effect of earthworms in1837, followed 34 years later by the publication “The Formation of VegetableMould through the Action of Earthworms.” At that time, the term “vegetable mould”was used to designate surface horizons in a manner not that different from the ear-lier use of the term humus. Darwin showed that earthworms were important in soilformation by affecting rock weathering, humus formation, and profile differentia-tion. This led Feller et al. (2003a) to credit Darwin for the first scientific publica-tion in Europe on the biological functioning of soils. In 1839, Ehrenberg hadshown the presence of soil protozoa (see Feller et al., 2003a). Russell’s work onpartial sterilization and its benefits to fertility had involved the protozoa. Cutlerand Crump, in 1920, observed the often reciprocal increase and decrease of amoe-bae and bacteria and attributed the concept of soil sickness resulting in loweredfertility to this phenomenon (see Waksman, 1932). This is in direct contrast toRussell’s, and more recent, concepts in which faunal-derived microbial turnoveris considered an advantage in nutrient release (Coleman et al., 2004). Stout et al.(1982) gave a detailed resume of the soil protozoa that included the slime molds.
Soil Ecology 11
Ch01-P546807.qxd 11/18/06 5:21 PM Page 11
The “Manual of Agricultural Helminthology” (Filipjev and Shuurmans-Stekhoven, 1941, published in The Netherlands), summarized nematode anatomy,systematics, methodology, and plant–parasite interactions to that date. G. Steinerstates in the edited volume on nematology (Sasser and Jenkins, 1960) that the Incasof Peru had a regulation by which the replanting of potatoes on the same landneeded to be deferred by a few years to control what must have been golden nema-tode infestation. He also stated that the “bush culture” that involved burning of trop-ical forests followed by planting of crops was not done on adjacent plots to stopinvasion of nematodes from the old agricultural plots to the new ones. Kevan’s 1965description and count of soil fauna per square meter of a European grassland werequoted in the first edition of this textbook. A good introduction to the various mem-bers of the soil fauna is given by Burges and Raw (1967) and is updated by Lavelleand Spain (2001) and Coleman et al. (2004).
Wilde (1946) stated that the principals of soil science and ecology were intro-duced to silviculture by the German forester Grebe in his doctor’s thesis in 1840.Grebe forecast Dokuchaiev’s studies by stating,
“As silviculture horizons widen, the importance of environmental conditionsbecomes more sharply pronounced. It appears clearly to foresters that the formof forest management is determined by a number of physical influences relatedto topography, geology, type of soil, and climate.”
In not mentioning organisms, maybe the quote does not belong in this book, but80% correct isn’t all bad.
Russian scientists have long credited Dokuchaiev and his associate Kostytchevwith being the founders of soil science and for having a great influence on ecology.Wilde (1946) quotes Dokuchaiev as saying,
“The eternal genetical relationships that exist between the forces of the envi-ronment and physical matter, living and nonliving domains, plants and animalsand man, his habits, and even his psychology—these relationships comprise thevery nucleus of natural science.”
Dokuchaiev recognized the effects of animals in soil formation in using the word“crotovina” for the filled-in remnants of mammal burrows. Russian soil science,ecology, geography, and plant ecology have always been closely associated (Major,1969). Their word “biogeocoenoses” emphasizes the biology–landscape inter-actions, as well as exchanges of matter and energy, discussed so often in this text.Hilgard translated Dokuchaiev’s work to English and mapped American soils rela-tive to landscape, climate, and vegetation. Wilde credits Hilgard’s 1906 publication“The Relation of Soils to Climate” for perhaps unintentionally laying the foundationof soil ecology in America. The interactions of Dokuchaiev’s five factors of soil for-mation, climate, parent material, organisms, topography, and time were reiteratedand placed in an equation form by Jenny (1941). Liebig has been credited as one ofthe first physiological ecologists for his work on mineral nutrition of plants.
12 Chapter 1 SOIL MICROBIOLOGY, ECOLOGY, AND BIOCHEMISTRY IN PERSPECTIVE
Ch01-P546807.qxd 11/18/06 5:21 PM Page 12

The influence of Müller’s 1878 monograph in characterizing forest soils in rela-tion to the type of organic matter (Mull, Moder, and Mor) has been extensive. Wildelists an extensive number of European authors who emphasized the role of soils inforest management. Other reviews on forest–microbiology–nutrient cycling includeJordan (1985), Pregitzer (2003), and Morris and Paul (2003). Rangeland science isequally dependent on soil processes, some of which are detailed in “Grasslands,Systems Analysis and Man,” edited by Breymeyer and Van Dyne (1980), and in“Grassland Ecophysiology and Grazing Ecology” (Lemaire et al., 2000).
I did not know whether to place microbial ecology under soil microbiology orsoil ecology. In concepts, methods, and application, microbial ecology has beencloser to soil microbiology than to classical ecology. Numerous authors havebemoaned the fact that there is not an extensive idea and concept exchange betweenmicrobial ecology and ecology in general. However, this is rapidly changing withthe recognition that the diverse and extensive soil and aquatic and sediment biotacan now be studied with molecular methods. The great diversity and close inter-actions of organisms with mineral particles makes soil an ideal place to developand test ecological concepts. According to Marshal (1993), microbial ecology hasthe goals of defining population dynamics in microbial communities and the phys-iochemical characteristics of microenvironments and understanding the metabolicprocesses carried out by microorganisms in nature. It recognizes as its foundersthe same scientists (Leeuwenhoek, Winogradsky, and Beijerinck) that developedsoil microbiological thought. Microbial ecology has the ability to transcend dif-ferent habitats, asking questions about soils, plants, animals, fresh waters, oceans,and sediments, as well as geological strata. It also has received great impetus fromthe recent advances in nucleic acid techniques and, thus, one of its more modernpioneering works has to be that of Watson and Crick, which eventually led to thenuclear-based techniques.
The first textbook published with the title “Microbial Ecology” was that of Brock(1966). Brock (1975), in “Milestones in Microbiology,” published the key papers ofPasteur, Koch, and others in a translated, annotated format. The publication of thetriennial meetings of the International Society of Microbial Ecology provides a use-ful chronology of advances in this field. Some include Ellwood et al. (1980),“Contemporary Microbial Ecology;” Klug and Reddy (1984), “Current Perspec-tives in Microbial Ecology;” and Guerrero and Pedros-Alio (1993), “Trends inMicrobial Ecology.” Other reviews include Lynch and Poole (1979) and the series“Advances in Microbial Ecology” published by Plenum Press. The training andbackground of microbial ecologists are often very different from those of classicalecologists, and until recently, there has not been enough cross-fertilization of ideasbetween the fields.
SOIL BIOCHEMISTRY
Soil biochemistry, as defined in this book, refers to the characteristics anddynamics of organic matter and the biochemical transformations brought about by
Soil Biochemistry 13
Ch01-P546807.qxd 11/18/06 5:21 PM Page 13
enzymes and organisms in soil. Biochemical reactions appear to have proceededwithout microorganisms. Later microorganisms were active without the presenceof plants and animals for long periods of the earth’s history. Biochemical reac-tions similar to those occurring in modern soils are thought to have occurred foran extended period before the occurrence of the first bacteria identified in rocksthat have an age of approximately 3.8 billion years. Phototrophic bacteria andcyanobacteria have been identified in rocks that are 2.8 billion years old. Vascularplants and mammals are a product of only the past 500 million years.
Experiments with iron sulfides, at the elevated temperatures and pressures foundin hydrothermal vents, have indicated the possibility of the formation of prebiotic,organic substrates. These are believed to involve organo-metal interactions oftenstudied in today’s soil biochemistry. Another theory involves an alkaline world inwhich the activity of negatively charged clay minerals, such as smectite, organizedfatty acid micelles and lipids into vesicles that contained active clays. These aresaid to have concentrated and polymerized RNA and DNA. Once formed, vesiclessuch as these are postulated to have grown by extrusion through small pores. Thesereactions are all familiar to the soil biochemist, as are the concepts involving micro-pores, enzymatic activity, and habitat formation so important in early life studies(Bada and Laszano, 2003).
Waksman (1938), in his book entitled “Humus,” states that from Theophrastus(373–328 BCE) to the time of Wallerius (1709–1778 CE), the concept of oleumuntuosm, equating fertile soil with the fatness of the land, dominated the ideasof naturalists. The word “humus” was extensively used in Virgil’s (79–19 BCE)poetry about farming, food production, and the joys of country life. His poetry isextensively quoted relative to soil fertility, decomposition, gardening, nature, theenvironment, and organic agriculture, with the 39 BCE quote from the secondGeorgics
“pinquis humus dulcique uliine laeta; Quique frequens hebis et fertilis übrecampus”
being the most familiar. The word humus, together with terra and solum, was usedfor earth. It is the root word for humans, homo, and even posthumous, after theearth or death. Virgil referred to dark soil as fertile, and the ancients knew thatdark-colored soil was more productive, absorbed more water, and was easier to tillthan its lighter colored counterparts in the landscape. They had also observed thatexposure to flames often lightened the soil. Feller (1997) quotes Pliny the Elder(23–79 CE) as saying
“the lupin penetrates the humus and wheat needs two feet of humus.”
The period of alchemy and the phlogistic theory continued to use the originalLatin definition of humus as soils or earth, as did Linnaeus (1707–1778), the greatSwedish botanist. He classified soils as Humus daedalea (garden soil), Humusrualis (field soil), and Humus latum (muck soil). The concept that the application
14 Chapter 1 SOIL MICROBIOLOGY, ECOLOGY, AND BIOCHEMISTRY IN PERSPECTIVE
Ch01-P546807.qxd 11/18/06 5:21 PM Page 14
of dung to the soil replaced some substances that had been removed by plants wasestablished in the 16th century. Van Helmont’s (1577–1644) experiments that con-cluded that water was the source of plant nutrition were repeated by Robert Boylewith the same conclusion. However, Woodward in 1699 showed that impure water,such as that from the river Thames, increased the growth of mint. He also reportedthat dung that returns parts of either vegetables or animals was the best way ofrestoring soil. Böerhavein, in a 1727 textbook of chemistry, wrote that plants absorbthe juices of the earth. Tull in 1730 stated that small, earth-like particles serve asnutrients for plants.
Wallerius in 1753 (see Feller, 1997) used the Latin word humus for loam ormold, which at that time referred to the organic surface horizon relative to decom-posing organic matter, and is thus credited with the modern use of humus for organicmatter. This was made easier by the fact that the later Roman and Latin texts thenutilized the word terra rather than humus for earth. Wallerius went along with thethinking of that time in assuming humus was the essential nutritive element andthat other soil constituents acted in mixing or dissolving it and, thus, assisted uptakeby plants. Lime was considered to help dissolve the fat (humus) of the land andthe function of clay was to fix or retain this fatness. The Russian scientist Komov,in his 1782 book on agriculture, associated the hydrophysical properties of soil andits richness in nutrients with the presence of humus and stated that the “nutritivejuice” of soil was produced by rotting.
De Saussure, known for his chemical studies, also spent considerable time onhumus. In 1804, he described humus as being of various complexes (oils and salts),capable of absorbing oxygen and producing CO2. He showed that it containedmore C and less O and H than the plant residues that went into its formation. Healso established that plants synthesize their organic matter from CO2 and give offO2. Thaer in 1808 differentiated between peat formed in limited O2 and mildhumus formed under adequate O2. He ascribed to the humus theory of plant nutri-tion, which stated that humus was the direct source of plant nutrients. Thaer alsohas been called the father of sustainable agriculture (see Feller et al., 2003b). Oneof his books stated,
“Latterly the practice of sowing white clover with the last crop has becomevery general; only a few apathetic and indolent agriculturalists or men who arefirmly wedded to old opinions and customs, neglect this practice.”
It took the work of Sprengel in 1826, Liebeg in 1840, and Boussingault in 1841 (seeFeller et al., 2003b) to found the concept of mineral nutrition of plants. However,modern organic agriculture still credits soil organic matter with properties otherthan nutrient supply, water and nutrient retention, complexation, and aggregation.Humic constituents in small quantities continue to be investigated for their effecton plant respiration as does the use of specific plant- and microbial-derived mole-cules as information signals for plant and microbial interactions (Vaughn, 1985;Bais et al., 2004).
Soil Biochemistry 15
Ch01-P546807.qxd 11/18/06 5:21 PM Page 15
Berzelius, first in 1806 and later in the 1830s, described the dark, black, andlighter yellow humic compounds and showed their interactions with metals. Fieldexperiments carefully conducted in 1834 by Boussingault, considered the father ofmodern scientific agronomy, analyzed the C, H, O, N, and mineral inputs in manurerelative to those in subsequent plant parts grown on manured soils. In 1826 and1837, Sprengel found that the C content of humus is 58%, described the most impor-tant characteristics of humates (its salts), and studied their decomposition and sol-ubility characteristics. The Russian scientist German, in 1837, still believed thathumus was a direct source of plant nutrition, but found that cultivated soils containedless humus than virgin ones and attempted to obtain scientific confirmation of thevalue of rotations. This was a prelude to modern-day sustainable agriculture andthe questions arising today regarding soil C and global change. He also was the firstto question whether humic acids were chemically individual compounds. The largenumber of fractions he, and later others, identified as constituents of humus was notfound to be reproducible and this led to a general questioning of the usefulness ofsoil organic matter fractionation. Danish scientist Müller (see Wilde, 1946) furtherdefined the solubility and characteristics of humics in his book “Natural Forms ofHumus” and developed the concepts of Mull and Mor in forest soils. Mull horizonshad earthworms and fungi, whereas earthworms were absent from Mor soils.
Dokuchaiev, the founder of Western soil science, recognized the involvement ofthe five interacting factors of soil formation (parent material, vegetation, organisms,climate, and time) in the development of rich, high-organic-matter, chernozemicsoils. Other scientists in this productive period include Kostychev, who in 1886suggested that products synthesized by bacteria participated in the production ofhumic substances (see Kononova, 1961). Hebert in 1892 and Dehérain in 1902developed the concept of humus formation as the interaction of lignin and proteina-ceous substances. Büchner is credited for his pioneering work in enzymology bydisrupting yeast cells to produce a cell-free system capable of alcoholic fermentation.This later led to the many investigations of enzyme reactions in soils.
During the period of 1908–1930, Shreiner, Shorrey, and their co-workers usedlarge-scale extraction equipment to isolate 40 identifiable organics including hydro-carbons, sterols, fats, organic acids, aldehydes, carbohydrates, and organic P and Ncompounds. These studies gained a great deal of attention because of their precision,but may have detracted from the overall study of soil organic matter as a naturalentity. They were a prelude to Waksman’s detailed studies on the proximate analy-sis of organic matter in which he rejected the concepts of humic and fulvic acids.However, Tyurin in his 1937 book (see Kononova, 1961) on the organic matter ofsoils and Springer in 1934–1935 (see Kononova, 1961) regarded Waksman’sdenial of the existence of specific humic soil compounds as unfounded and incorrect,and claimed that proximate analysis, as suggested by Waksman, would not standthe test of time in that it characterized only a small fraction of humus. However,some mistrust of humic acid characterization, generated by Waksman’s criticisms,continues today in Western soil science, although humic acid chemistry is wellaccepted in aquatic research in both marine and freshwater environments.
16 Chapter 1 SOIL MICROBIOLOGY, ECOLOGY, AND BIOCHEMISTRY IN PERSPECTIVE
Ch01-P546807.qxd 11/18/06 5:21 PM Page 16
The translation of earlier Russian volumes entitled “Soil Organic Matter, ItsNature, Its Role in Soil Formation and Soil Fertility” (Kononova, 1961) describedorganic matter much as it is defined today and brought together literature on therole of physical, chemical, and biological factors of soil formation and its effecton cultivation. Stevenson’s 1994 book entitled “Humus Chemistry” recognized therole of humic and fulvic acids and humic fractionation and delineated today’sknowledge of organic C, N, P, and S transformations. Aiken et al. (1985) in “HumicSubstances in Soil, Sediment and Water” recognize the similarity of humic sub-stances in soils, sediments, and water. They describe methods, such as NMR andpyrolysis mass spectrometry, for studying this series of complex, and still difficultto study, soil organic matter constituents that form such an important componentof present-day sustainable agriculture and global change investigations.
Nitrogen is important as a constituent of soil organic matter, as a nutrient in soilfertility, in water pollution, and in trace-gas, radiative forcing in global change. Itthus continues to receive a great deal of attention. It took a great deal of researchand many publications to delineate the processes of N2 fixation and N immobi-lization, mineralization, plant uptake, and denitrification. The reviews edited byBartholomew and Clark (1965), Stevenson (1982), and Mosier et al. (2004) delineatethe use of instrumentation, tracers, and inhibitors in determining the processes andrates in soils. In 1943, Norman and Werkman labeled soybeans with 15N. Addition ofthe labeled residue to soil showed that 26% of the tagged N was recovered by a sub-sequent crop. Work with both 15N and 13C by Broadbent and Norman in 1946, andBroadbent and Bartholomew in 1948 (see Jansson, 1958; Paul and Van Veen, 1978),established the principles for the use of soil tracers. The equations of Kirkham andBartholomew (1955) for mineralization–immobilization and the epic work of Jannson(1958) on soil N dynamics should be required reading for anyone today contem-plating tracer studies.
The advent of tracers in the 1940s came at a time when the principles affectingplant decomposition had been reasonably established. Harmsen and van Schreven(1955) summarized the early work on the effects of environmental factors and thepossibility of soil biota turnover in subsequent releases of N as follows:
“The study of the general course of mineralization of organic N was practicallycompleted before 1935. It is surprising that many of the modern publicationsstill consider it worthwhile to consider parenthetical observations dealing withthese entirely solved problems.”
These authors then pointed out that the relationships between C and N and theeffects of environmental factors had to be determined for each soil type, indicatingthat the underlying controls were not understood nor could the dynamics of resist-ant compounds be measured.
Libby developed the 14C dating technique in 1952. It was used for peats, buriedsoil profiles, and soil pedogenesis by Simonart and Mayaudon in 1958, Simonsonin 1959, and Tamm and Ostlund in 1960 (see Paul and Van Veen, 1978). In 1964,
Soil Biochemistry 17
Ch01-P546807.qxd 11/18/06 5:21 PM Page 17

Paul and co-workers carbon dated soil organic matter fractions to calculate theirmean residence times. The further interpretation of carbon dating by Scharpenseel,and Stout and Rafter (see Goh, 1991), did a great deal to establish pools and fluxesfor modeling purposes. Decomposition experiments with plant residues withlaboratory-enhanced 14C contents provided much information on the effects ofsoil type and climate management in studies by Sorensen in 1967, Jenkinson andRayner in 1977, and Sauerbeck and Führ in 1968 (see Paul and Van Veen, 1978).Differences in naturally occurring 13C resulting from C3 ↔ C4 plant vegetationswitches and from enhanced CO2 experiments are now being effectively utilizedto answer global change and soil and ecological sustainability questions involvingsoil organic matter (Coleman and Fry, 1991; Boutton and Yamasaki, 1996).
The use of tracers allows one to also measure nontracer soil C and N. There iscontinual turnover of organic matter during decomposition, and tracer experimentsoften show more soil C and N being released than can be determined in the absenceof the tracer. Some of today’s authors are mistakenly calling this priming. Fontaineet al. (2004) credit Löhnis as defining priming in 1926 as an increased availabilityof nutrients due to higher microbial activity resulting from the addition of substrate.With the use of tracers, Broadbent and Bartholomew (1948) also defined priming asthe increased mineralization of unlabeled soil organic matter constituents in the pres-ence of available fertilizer N or labeled plant residues. Replacement by the tracerof nontracer C or N during normal soil dynamics must be taken into considerationbefore priming is said to occur. It is hoped that today’s authors will read the originalliterature and not erroneously redefine what was established many years ago.Priming does occur. We must, however, use a mass balance approach together withthe tracers to determine that it is a net release of the nutrients from soil organic mat-ter and not a normal exchange of the tracer for nontracer isotopes during microbialgrowth and product formation.
There are excellent reviews on soil N, such as Bartholomew and Clark (1965),Stevenson (1994), and Mosier et al. (2004). These contain discussions of the sig-nificance of fixed ammonia as part of total soil N, especially with regard to depth,in clay soils. Today’s literature seems to have forgotten this constituent. It is hopedthat in the next 10 years, we will not read a spate of papers that claim to have newlydiscovered this not necessarily active, but important, N component.
Fred et al. (1932), Stewart (1975), and Graham (2000) have reviewed N2 fixation.Prosser (1986) and Norton (2000) reviewed nitrification, whereas N losses, especiallythose leading to pollution and global warming, have been covered in Robertson(2000) and Groffman (2000). Publications such as “Biogeochemistry” (Schlesinger,1997) and “Geomicrobiology” (Ehrlich, 1996) cover related areas of nutrient cyclesand exchange in soils, freshwater sediments, and the vadose zone. The fact that theprocesses and process controls are similar in all environments is heartening for ourlevel of knowledge. These controls lead to a rather similar composition for organicmatter in most aerobic terrestrial soils. Modeling, such as that used by Jenkinson andRayner (1977), is now an integral part of soil biochemistry used to test concepts andextrapolate information to different landscapes and for future predictions. Whetherthe ability to develop reasonably descriptive models based primarily on soil organic
18 Chapter 1 SOIL MICROBIOLOGY, ECOLOGY, AND BIOCHEMISTRY IN PERSPECTIVE
Ch01-P546807.qxd 11/18/06 5:21 PM Page 18

matter dynamics, but not soil population data, can be attributed to the great redundancyof microbial populations or to the fact that our models are not yet accurate enough torequire population input data is yet to be determined. The 10-volume, edited seriesentitled “Soil Biochemistry” initiated by McLaren and Peterson (1967) has since beencoedited by Paul and Ladd and by Stotsky and Bollag. It has brought together infor-mation on biologically related soil processes and components, nutrient cycles, andenzymes. It has also covered extraterrestrial life, soil enzymes, and pollutants as theyaffect soil organisms and the environment. The best way to summarize this section onsoil biochemistry is to republish the cartoon from the comic strip Peanuts that wasincluded in the first volume of the “Soil Biochemistry” series (Fig. 1.2).
IN PERSPECTIVE
The soil microbiologist, ecologist, and biochemist must be aware that theirorganisms and processes are affected by soil type, vegetation, landscapes, andmanagement. Forestry and rangelands are a very important component of our
In Perspective 19
PEANUTS
YOU DON'T KNOWIT, BUT YOUR
TROUBLES ARE JUST BEGINNING!
10-1
SC
HU
LZ
FIGURE 1.2 A dog’s eye view of decomposition and soil organic matter formation. Copyright1962; reprinted by permission of United Feature Syndicate, Inc.
Ch01-P546807.qxd 11/18/06 5:21 PM Page 19
studies. Wilde (1946), in his very readable book “Forest Soils and Forest Growth,”quotes the following from the Kalevala, the National Epic of the Finns, dated toapproximately 900 BCE, showing that early man recognized the interaction ofsoil type and vegetation.
Seeds upon the land he scatters,Seeds in every swamp and meadow,Forest seeds upon the loose earth,On the firm soil he plants acorns,Spreads the spruce seeds on the mountains,And the pine seeds on the hill-tops,In the swamps he sows the birches,On the quaking marshes alders,And the basswood in the valleys,In the moist earth sows the willows,Mountain ash in virgin places,On the banks of streams the hawthorn,Junipers on knolls and highlands;Thus his work did Pellerwoinen. . . .
20 Chapter 1 SOIL MICROBIOLOGY, ECOLOGY, AND BIOCHEMISTRY IN PERSPECTIVE
Investigative science
Methodology
ModelingEducation
Management
Concepts
Soil organic matter form – function
dynamics
C – N cycling Soil fertility
Soil biota
Processes Interactions
Biodiversity Microbes – Fauna
Plant – microbe interactions
Ecosystem services Bioremediation Pollution control
Soil health
S, P Metals Pedogenesis
Soil tilth
Global change Residue
decomposition Radiative gases
Food – Fiber Living space Agriculture
Forest Grassland
Urban
FIGURE 1.3 The interplay of soil biota, interactions, and processes in investigative science andmanagement.
Ch01-P546807.qxd 11/18/06 5:21 PM Page 20

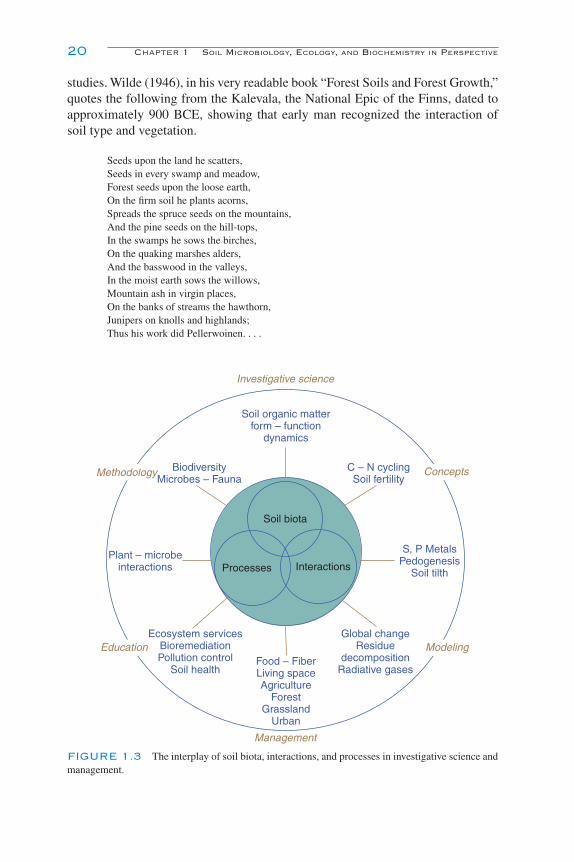
The great biodiversity of soil biota in both macro and micro forms, and the impor-tant questions that need to be answered, indicate to me that many of the new con-cepts in our field will come via the study of the physiology and ecology of soilorganisms, as well the processes they mediate relative to soil nutrient transforma-tions and global biogeochemical cycles. This text, therefore, has chapters on thephysiology–biochemistry of organisms as well as on ecology in an attempt toenhance the understanding required to provide a foundation for the interdisciplinaryapproaches that will continue to provide exciting new concepts in our field. It ishoped that the individual chapters will provide new breakthroughs, concepts, meth-ods, and ideas, as well as more individualized references. Figure 1.3 shows the inter-dependence of soil microbiology, ecology, and biochemistry, some of its fields ofstudy, and some of its applications.
The last chapter in this volume will provide an oversight of the individualchapters and, it is hoped, provide insights into the future.
This edition is dedicated to that great soil microbiologist, F. E. Clark, whosekeen insight and clear writing were such a joy to read in many early publications,as well as in the first two editions of “Soil Microbiology and Biochemistry.”
REFERENCES AND SUGGESTED READING
Aiken, G. R., McKnight, D. M., Wershaw, R. L., and MacCarthy, P. (1985). “Humic Substances in Soil,Sediment and Water.” Wiley, New York.
Alef, K., and Nanipieri, P. (1995). “Methods in Applied Soil Microbiology and Biochemistry.” AcademicPress, London.
Alexander, M. (1961, 1977). “Introduction to Soil Microbiology.” 2nd ed. Wiley, New York.Atlas, R. M. (1984). “Microbiology: Fundamentals and Application.” Macmillan, New York.Bada, J. L., and Lazcano, A. (2003). Prebiotic soup—revisiting the Miller experiment. Science 300,
745–746.Bais, H. P., Park, S. W., and Weir, T. L., et al. (2004). How plants communicate using the underground
information superhighway. Trends Plant Sci. 9, 26–32.Bardgett, R. (2005). “The Biology of Soil: A Community and Ecosystem Approach.” Oxford Univ.
Press, Oxford.Bardgett, R., Usher, M., and Hopkins, D. W., eds. (2005). “Biological Diversity and Function in Soils.”
Cambridge Univ. Press, Cambridge, UK.Bartholomew, W. V., and Clark, F. E. (1965). “Soil Nitrogen.” Am. Soc. Agronomy, Madison, WI.Boughton, T. W., and Yamasaki, S., eds. (1996). “Mass Spectrometry of Soils.” Dekker, New York.Breymeyer, A. I., and Van Dyne, G. M., eds. (1980). “Grassland, Systems Analysis and Man.” Cambridge
Univ. Press, Cambridge, UK.Broadbent, F. E., and Bartholomew, W. V. (1948). The effect of quantity of plant material added to soil
on its rate of decomposition. Soil Sci. Soc. Am. J. 13, 271–274.Broadbent, F. E., and Norman (1946). Some factors affecting the availability of the organic nitrogen in
soil – a preliminary report. Soil Sci. Soc. Amer. Proc. 11, 264–267.Brock, T. D. (1966). “Microbial Ecology.” Prentice-Hall, Englewood Cliffs, NJ.Brock, T. D. (1975). “Milestones in Microbiology.” Am. Soc. Microbiol., Washington, DC.Burges, A., and Raw, F. (1967). “Soil Biology.” Academic Press, New York.Coleman, D. C., Crossley, D. A., Jr., and Hendrix, P. F. (2004). “Fundamentals of Soil Ecology.”
Elsevier–Academic Press, New York.
References and Suggested Reading 21
Ch01-P546807.qxd 11/18/06 5:21 PM Page 21
Coleman, D. C., and Fry, B. (1991). “Carbon Isotope Techniques.” Academic Press, San Diego.Ehrlich, H. L. (1996). “Geomicrobiology.” 3rd ed. Dekker, New York.Ellwood, D. C., Hedger, J. N., Latham, M. J., et al. (1980). “Contemporary Microbial Ecology.” Academic
Press, London.Feller, C. (1997). The concept of soil humus in the past three centuries. In “History of Soil Science”
(D. H. Yaalon and S. Berkowicz, eds.), Vol. 29, pp. 15–46. Catena Verlag GmbH, Reiskirchen,Germany.
Feller, C. L, Brown, G. H., and Blanchart, E., et al. (2003a). Charles Darwin, earthworms and the nat-ural sciences: various lessons from the past to future. Agric. Ecosyst. Environ. 99, 29–49.
Feller, C. L., Thuries, L. J.-M., and Manlay, R. J., et al. (2003b). The Principles of Rational Agricultureby Albrecht Thaer (1752–1738). An approach to the sustainability of cropping systems at thebeginning of the 19th century. J. Plant Nutr. Soil Sci. 166, 687–698.
Filipjev, I. N., and Schuurmans-Stekhoven, J. H. (1941). “A Manual of Agricultural Helminthology.”E.J.B, Tuta Saegide Pallas, Leiden.
Fontaine, S., Bardoux, G., Benest, D., Verdier, B., Mariotti, A., and Abbadie, L. (2004). Mechanismsof the priming effect in a Savannah soil amended with cellulose. Soil Sci. Soc. Am. J. 68, 125–131.
Fred, E. B., Baldwin, I. L., and McCoy, E. (1932). “Root Nodule Bacteria and Leguminous Plants.”Univ. of Wisconsin Studies, Madison, WI.
Goh, K. M. (1991). Carbon dating. In “Carbon Isotope Techniques” (D. C. Coleman and A. Fry, eds.),pp. 125–151. Academic Press, San Diego.
Graham, P. H. (2000). Dinitrogen fixation. In “Handbook of Soil Science” (M. E. Sumner, ed.), pp. C-139–147. CRC Press, Boca Raton, FL.
Groffman, P. M. (2000). Nitrogen in the environment. In “Handbook of Soil Science” (M. E. Sumner,ed.), pp. C-19–200. CRC Press, Boca Raton, FL.
Guerrero, R., and Pedrós-Alió, C. (1993). “Trends in Microbial Ecology.” Spanish Soc. Microbiol.,Madrid.
Hagen, J. B. (1992). “An Entangled Bank: The Origins of Ecosystem Ecology.” Rutgers Univ. Press,New Brunswick, NJ.
Harley, J. L. (1969). “Biology of Mycorrhiza.” Leonard Hill, London.Harmsen, G. W., and van Schreven, D. A. (1955). Mineralization of organic nitrogen in soil. Adv. Agron.
7, 299–398.Hillel, D. (1991). “Out of the Earth, Civilization and the Life of the Soil.” Univ. California Press,
Berkeley.Jansson, S. L. (1958). Tracer studies of nitrogen transformation in soil with special attention to miner-
alization—immobilization relationships. Kungl. Landbrukshögkopans Annaler 24, 101–361.Jenkinson, D. H., and Rayner, J. H. (1977). The turnover of soil organic matter in some of the Rothamsted
experiments. Soil Sci. 123, 298–305.Jenny, H. (1941). “Factors of Soil Formation.” McGraw–Hill, New York.Jordan, C. F. (1985). “Nutrient Cycles in Tropical Forests.” Wiley, New York.Killham, K. (1994). “Soil Ecology.” Cambridge Univ. Press, Cambridge, UK.Kirkham, D., and Bartholomew, W. V. (1955). Equations for following nutrient transformations in soils
utilizing tracer data, II. Soil Sci. Soc. Am. J. 19, 189–192.Klug, M. J., and Reddy, C. A. (1984). “Current Perspectives in Microbial Ecology.” ASM, Washington,
DC.Kononova, M. M. (1961). “Soil Organic Matter, Its Nature, Its Role in Soil Formation and Soil
Fertility.” Pergamon, Oxford.Lavelle, P., and Spain, A. V. (2001). “Soil Ecology.” Kluwer Academic, Dordrecht.Lemaire, G., Hodgson, J., and Moraes, A., et al. (2000). “Grassland Ecophysiology and Grazing
Ecology.” CAB Int., Wallingford.Lie, T. A., and Mulder, E. G. (1971). “Biological Nitrogen Fixation in Natural and Agricultural
Habitats.” Nijhoff, The Hague.Lipman, J. G. (1911). “Bacteria in Relation to Country Life.” Macmillan Co., New York.Löhnis, F., and Fred, E. B. (1923). “Textbook of Agricultural Bacteriology.” McGraw–Hill, New York.
22 Chapter 1 SOIL MICROBIOLOGY, ECOLOGY, AND BIOCHEMISTRY IN PERSPECTIVE
Ch01-P546807.qxd 11/18/06 5:21 PM Page 22
Lynch, J. M. (1983). “Soil Biotechnology.” Blackwell Sci., Oxford.Lynch, J. M., and Poole, N. J. (1979). “Microbial Ecology, a Conceptual Approach.” Wiley, New York.Major, K. (1969). Historical development of the ecosystem concept. In “The Ecosystem Concept on
Natural Resource Management” (G. M. Van Dyne, ed.). Academic Press, New York.Marshall, K. C. (1993). Microbial ecology: whither goest thou. In “Trends in Microbial Ecology”
(R. Guerrero and C. Pedros-Alió, eds.), pp. 5–8. ISME Secretariat, Barcelona.McClaren, A. D., and Peterson, G. H. (1967). “Soil Biochemistry.” Dekker, New York.Metting et al. eds. (1992). “Soil Microbial Ecology: Applications in Agricultural and Environmental
Management.” Dekker, New York.Morris, C. E., Bardin, M., Berge, O., et al. (2002). Microbial biodiversity: approaches to experimental
design and hypothesis testing in primary literature from 1975 to 1990. Microbiol. Mol. Biol. Rev. 66,592–616.
Morris, S. J., and Paul, E. A. (2003). Forest soil ecology and soil organic matter. In “The Potential forU.S. Soils to Sequester Carbon” (J. M. Kimble, L. S. Heath, R. A. Birdsey, et al., eds.), pp. 109–126.CRC Press, Boca Raton, FL.
Mosier, A. R., Syers, J. K., and Freney, J. R., eds. (2004). “Agriculture and the Nitrogen Cycle:Assessing the Impacts of Fertilizer Use on Food Production and the Environment.” SCOPE Series65. Island Press, Washington, DC.
Norton, J. M. (2000). Nitrification. In “Handbook of Soil Science” (M. E. Sumner, ed.), pp. 139–147.CRC Press, Boca Raton, FL.
Odum, E. P. (1971). “Fundamentals of Ecology.” 3rd ed. Saunders, Philadelphia.Paul, E. A., and Clark, F. E. (1989, 1996). “Soil Microbiology and Biochemistry.” Academic Press,
San Diego.Paul, E. A., and Van Veen, J. A. (1978). The use of tracers to establish the dynamic nature of organic
matter. In 11th International Congress of Soil Science, Edmonton, AB.Pregitzer, K. S. (2003). Carbon cycling in forest ecosystems with an emphasis on below ground processes.
In “The Potential for U.S. Soils to Sequester Carbon” (J. M. Kimble, L. S. Heath, R. A. Birdsey, et al.,eds.), pp. 93–108. CRC Press, Boca Raton, FL.
Prosser, J. I. (1986). “Nitrification.” IRL Press, Oxford.Robertson, G. P. (2000). Denitrification. In “Handbook of Soil Science” (M. E. Sumner, ed.),
pp. 181–189. CRC Press, Boca Raton, FL.Sasser, J. N., and Jenkins, W. R. (1960). “Nematology: Fundamentals and Recent Advances.” Univ. of
North Carolina Press, Chapel Hill.Schlesinger, W. H. (1997). “Biogeochemistry: An Analysis of Global Change.” Academic Press,
San Diego.Smith, R. L., and Smith, T. H. (2001). “Ecology and Field Biology.” 6th ed. Benjamin–Cummings,
San Francisco.Stevenson, F. J. (1982). “Nitrogen in Agricultural Soils.” Agronomy Series 22. Am. Soc. Agronomy,
Madison, WI.Stevenson, F. J. (1994). “Humus Chemistry.” 2nd ed. Wiley, New York.Stewart, W. D. P. (1975). “Nitrogen Fixation by Free Living Microorganisms.” Cambridge Univ. Press,
Cambridge, UK.Stout, J. D, Bamforth, S. S., and Lousier, J. D. (1982). Protozoa. In “Methods of Soil Analysis.” Part 2.
Agron. Monogr. 9, 1103–1130. Am. Soc. Agronomy–SSSA, Madison, WI.Subba Rao, N. S. (1999). “Soil Microorganisms and Plant Growth.” Science Pub., Enfield, NH.Sylvia, D. M., Fuhrmann, J. H., Hartel, P. G., and Zuberer, D. A. (2005). “Principles and Approaches
of Soil Microbiology.” Prentice Hall, Upper Saddle River, NJ.Van Elsas, J. D., Trevors, J. T., and Wellington, E. M. (1997). “Modern Soil Microbiology.” Dekker,
New YorkVaughan, D., ed. (1985). “Soil Organic Matter and Biological Activity.” Kluwer Academic, Dordrecht.Waksman, S. A. (1932). “Principles of Soil Microbiology.” Williams & Wilkins, Baltimore.Waksman, S. A. (1938). “Humus: Origin, Chemical Composition and Importance in Nature.” 2nd ed.
Williams & Wilkins, Baltimore
References and Suggested Reading 23
Ch01-P546807.qxd 11/18/06 5:21 PM Page 23

Waksman, S. A. (1952). “Soil Microbiology.” Wiley, New York.Waksman, S. A., and Starkey, R. L. (1931). “The Soil and the Microbe.” Wiley, New York.Wall, D., ed. (2004). “Sustaining Biodiversity and Ecosystem Services in Soils and Sediments.” Island
Press, Washington, DC.Wild, A. (1988). “Russell’s Soil Conditions and Plant Growth.” 11th ed. Longman Sci. Tech., Essex.Wilde, S. A. (1946). “Forest Soils and Forest Growth.” Chronica Botanica, Waltham, MA.Winogradsky, S. N. (1949). “Microbiologie du Sol: Problems et Methodes.” Masson, Paris.
24 Chapter 1 SOIL MICROBIOLOGY, ECOLOGY, AND BIOCHEMISTRY IN PERSPECTIVE
Ch01-P546807.qxd 11/18/06 5:21 PM Page 24

2The Soil Habitat
R. P. Voroney
Introduction
Soil Genesis and Formation of the Soil Habitat
Physical Aspects of Soil
Soil Habitat Scale and Observation
References and Suggested Reading
At first sight nothing seems more obvious than that everything has a beginning and an endand that everything can be subdivided into smaller parts. Nevertheless, for entirely specu-lative reasons the philosophers of Antiquity, especially the Stoics, concluded this conceptto be quite unnecessary. The prodigious development of physics has now reached the sameconclusion as those philosophers, Empedocles and Democritus in particular, who livedaround 500 BCE and for whom even ancient man had a lively admiration. (Svante Arrhenius,Nobel Lecture, 1903)
INTRODUCTION
Soil is the naturally occurring, unconsolidated mineral and organic material at theearth’s surface that provides an environment for living organisms. Recently, it hasbeen referred to as the earth’s “critical zone” and as deserving special status,because of its role in controlling the earth’s environment and thus affecting thesustainability of life on the planet. This concept, that the earth’s physicochemicalproperties are tightly coupled to the activity of the living organisms it supports,was proposed in the early 1970s by James Lovelock as the Gaia hypothesis. Hetheorized that the Earth behaved as a superorganism, with an intrinsic ability tocontrol its own climate and chemistry and thus maintain an environment favorablefor life. However, it is only microorganisms that have proven they can sustain thebiosphere and can do so even without larger organisms.
25
Ch02-P546807.qxd 11/18/06 6:37 PM Page 25
26 Chapter 2 The Soil Habitat
The soil is where living organisms, or the biosphere, interact with rocks andminerals (geosphere), water (hydrosphere), atmosphere, and dead organic matter(detritosphere). Scientists study soil because of the fundamental need to under-stand the dynamics of geochemical–biochemical–biophysical interactions at theearth’s surface, especially in light of recent and ongoing changes in global cli-mate. What complicates this study is that while geochemical fluxes between thehydrosphere, atmosphere, and geosphere may take place over the time span ofhundreds to millions of years, biologically induced fluxes between the geosphere,atmosphere, biosphere, and detritosphere take place over a much shorter time frame,hours and days to months.
The soil habitat is defined as the totality of living organisms inhabiting soil,including plants, animals, and microorganisms, and their abiotic environment.The exact nature of the habitat in which the community of organisms is living isdetermined by a complex interplay of geology, climate, and plant vegetation. Thisinteraction of rock and parent material with temperature, rainfall, elevation, latitude,exposure to sun and wind, and many more factors, over broad geographical regionswith similar environmental conditions and characteristic plant communities, hasevolved into the current terrestrial biomes with their associated soils (Fig. 2.1).
Because soils provide such a tremendous range of habitats, they support anenormous biomass, with an estimated 2.6 � 1029 prokaryotic cells alone, and har-bor much of the earth’s genetic diversity—a single gram of soil contains kilome-ters of fungal hyphae and more than 109 bacterial cells, organisms belonging totens of thousands of different species. Micro-zones of good aeration may be onlymillimeters from areas poorly aerated. Areas near the soil surface may be enrichedwith decaying organic matter and other nutrients, whereas the subsoil may benutrient poor; the soil solution in some pores may be highly acidic, others morebasic, depending on soil mineralogy and biological activity. Temperature andwater contents of surface soil can vary widely from that of subsoils; and themicroenvironment of the surfaces of soil particles, where nutrients are concen-trated and water films vary in thickness, is very different from that of soil pores.
SOIL GENESIS AND FORMATION OFTHE SOIL HABITAT
By definition, soils are greater than 10 cm thick if formed from minerals andextend from the earth’s surface into the underlying parent material from whichthey are formed. Soil may even be covered with water to a depth of up to 0.5 m asin coastal tidal marshes or inland water areas where bodies of periodically sub-merged soils merge into bodies of water in the natural landscape.
When plant residues are submerged in water for prolonged periods of the yearand availability of O2 is limited, biological decay is slowed and organic matter invarious stages of decomposition accumulates. Deposits containing �30% organicmatter and extending to depths of �0.5 m or more form organic soils, and theyinclude peatland, muck or bog, and fen soils.
Ch02-P546807.qxd 11/18/06 6:37 PM Page 26
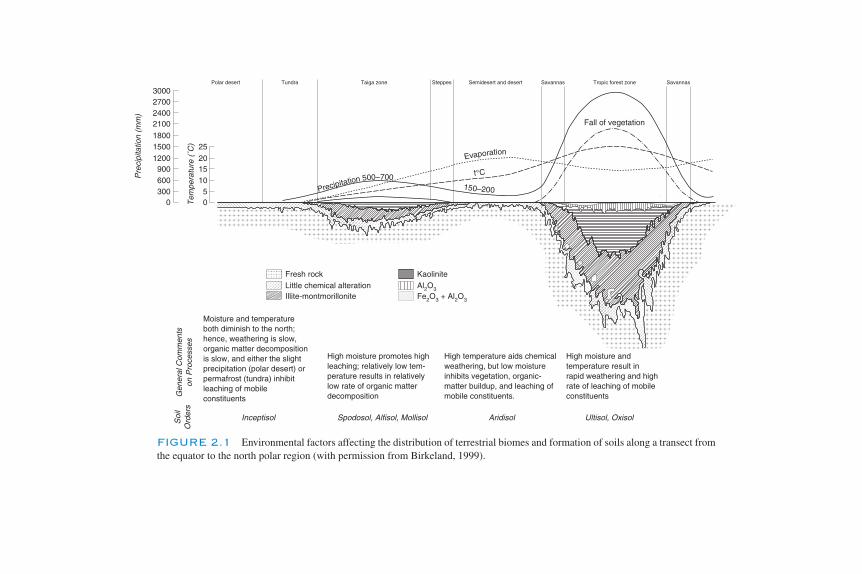
150–200Precipitation 500–700
Evaporation
t°CS
oil
Ord
ers
Gen
eral
Com
men
tson
Pro
cess
es
Inceptisol Spodosol, Alfisol, Mollisol Aridisol
KaoliniteFresh rockLittle chemical alterationIllite-montmorillonite
Al2O3
Fe2O3 + Al2O3
Ultisol, Oxisol
Pre
cipi
tatio
n (m
m)
Tem
pera
ture
(˚C
)
3000270024002100
18001500
1200900600300
0
25
201510
50
Fall of vegetation
SavannasSavannasSemidesert and desertSteppesTaiga zoneTundraPolar desert Tropic forest zone
Moisture and temperatureboth diminish to the north;hence, weathering is slow,organic matter decompositionis slow, and either the slightprecipitation (polar desert) orpermafrost (tundra) inhibitleaching of mobileconstituents
High moisture promotes highleaching; relatively low tem-perature results in relativelylow rate of organic matterdecomposition
High temperature aids chemicalweathering, but low moistureinhibits vegetation, organic-matter buildup, and leaching ofmobile constituents.
High moisture andtemperature result inrapid weathering and highrate of leaching of mobileconstituents
FIGURE 2.1 Environmental factors affecting the distribution of terrestrial biomes and formation of soils along a transect fromthe equator to the north polar region (with permission from Birkeland, 1999).
Ch02-P546807.qxd 11/18/06 6:37 PM Page 27

Mineral soils are formed by the physical and chemical weathering of the rocksand minerals brought to the earth’s surface by geological processes. The parentmaterial of mineral soils can be the residual material weathered from solid rockmasses or the loose, unconsolidated materials that often have been transportedfrom one location and deposited at another. The disintegration of rocks intosmaller mineral particles is a physical process brought about by heating and cool-ing, freezing and thawing, and abrasion from wind, water, and ice masses.Chemical and biochemical weathering processes are enhanced by the presence ofwater, oxygen, and the organic compounds resulting from biological activity.These reactions convert primary minerals such as feldspars and micas to second-ary minerals such as silicate clays, and they promote the release of constituent ele-ments in soluble forms available to soil organisms and plants.
Physical and chemical weathering of rocks to fine particles with large surfaceareas and the accompanying release of plant nutrients initiate the soil-formingprocess (Fig. 2.2).
The initial colonizers of soil parent material are usually organisms capable of bothphotosynthesis and N2 fixation. Early plant vegetation has intimate root–bacterial/fungal/actinomycetal associations with soil organisms to assist with supplyingnutrients and water.
Soil organisms together with plants constitute one of the five interactive factorsresponsible for soil formation. By 1870, Russian soil scientists had developed theconcept of soils as independent natural bodies each possessing unique propertiesresulting from parent material, climate, topography, and living matter, interacting
28 Chapter 2 The Soil Habitat
Erosion
Anthropogeniceffects
Clay-organic mattercomplexes
Soi
l pro
file
A
B
C
Leaching
LitterMicrobial inoculation
ProtozoaNematodes
Decompositionand predation
FungiBacteria
Uptake
Parent material
Colonization byalgae and lichens
DryWet
Deposition
(Rain) (Wind)
Exposed rock andMineral fragments
Nutrient solubilization – Mineralization and immobilization
TIME WEATHERING HUMUS FORMATION PROFILE DEVELOPMENT
Plant introduction
MycorrhizaN2 fixation
FIGURE 2.2 Interrelationships of organisms, organic matter, and parent materials in soil development.
Ch02-P546807.qxd 11/18/06 6:37 PM Page 28
Physical Aspects of Soil 29
over time. The approach to describing soil genesis as a biochemical product oforganisms participating in their own genesis was quantified by Hans Jenny in hisnow classic equation of soil-forming factors:
Soil � f [parent material, climate, living organisms, topography, time].
SOIL PROFILE
During formation soils develop horizontal layers, or horizons, that look differentfrom one another (Fig. 2.3).
The horizons within a soil profile vary in thickness depending on the intensityof the soil-forming factors, though their boundaries are not always easy to distin-guish. Uppermost layers of mineral soils are most altered during soil formation,whereas the deeper layers are most similar to the original parent material. Horizondifferences in the solum, the parent material most altered during soil formation,involve: (i) organic matter from plant residues and roots in the surface mineralhorizons decaying and forming humus, which gives these horizons a dark color—the organic-matter-enriched horizons nearest the soil surface are called A hori-zons; (ii) movement of soluble and colloidal inorganic and organic constituentsfrom surface layers; and (iii) accumulation of varying amounts of inorganic andorganic precipitates. These underlying, enriched layers in mineral soils arereferred to as B horizons. The C horizons are the least weathered part of the min-eral soil profile. Organic soils are commonly saturated with water and consistmainly of mosses, sedges, or other hydrophytic vegetation; the upper material isreferred to as the O layer. In upland areas where drainage is better and forest veg-etation supported, folic-derived organic materials accumulate to form the L–F–Hlayer. In both types of organic soils, it is the residual organic matter in the surfacelayer that most resembles the vegetation from which it is derived.
The vadose zone is the underlying, unsaturated, parent material extending (fromthe soil surface) downward to where it reaches the water table and the soil becomessaturated. Below the solum, this zone contains relatively unweathered parentmaterial, low in organic matter and nutrients and often deficient in O2. The thick-ness of the vadose zone can fluctuate considerably during the season, dependingon soil texture, soil water content, and height of the soil water table. When thewater table is near the surface, for example as in wetlands, it may be narrow ornonexistent. But in arid or semiarid areas where soils are well drained, the vadosezone can extend for several meters and even be hundreds of meters deep.
PHYSICAL ASPECTS OF SOIL
Dimensions of physical features commonly encountered when considering thesoil habitat range from meters (pedon, soil landscape, and watershed), down througha few millimeters (the fine-earth fraction), to a few micrometers (microorganismsand clay minerals) and nanometers (humic molecules) (Table 2.1).
Ch02-P546807.qxd 11/18/06 6:37 PM Page 29

SOIL TEXTURE
The larger mineral particles include stones, gravels, sands, and coarse silts thatare generally derived from ground-up rock and mineral fragments. While particles�2 mm in diameter may affect the physical attributes of a soil, they are excluded
30 Chapter 2 The Soil Habitat
Oi0-4 cm
A0-25 cm
Bt25-74
Bk96-152�
Ap0-23 cm
Oap0-18 cm
Oa18-48
Oe48-113
Oa'113-150�
Bo123-68
Bo268�
E4-23
Bhs23-60
Bs60-100
C100�
Btk74-96
FIGURE 2.3 Natural (undisturbed) mineral and organic soils showing the soil profile: mollisol(top left), spodosol (top right), oxisol (bottom left), and histosol (bottom right). (Soil profiles reproducedwith permission: spodosol and oxisol from University of Nebraska Press, mollisol from AmericanSociety of Agronomy; histosol from University of Idaho.)
Ch02-P546807.qxd 11/18/06 6:37 PM Page 30
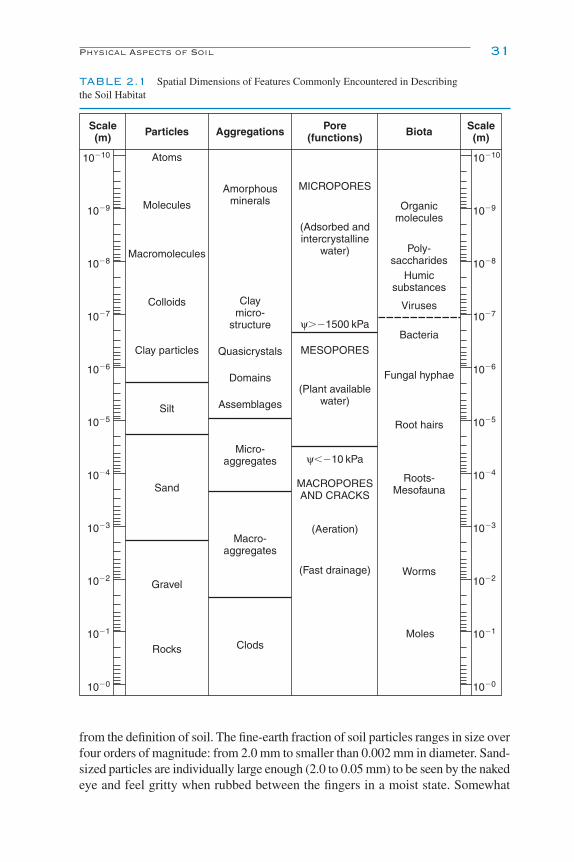
from the definition of soil. The fine-earth fraction of soil particles ranges in size overfour orders of magnitude: from 2.0 mm to smaller than 0.002 mm in diameter. Sand-sized particles are individually large enough (2.0 to 0.05 mm) to be seen by the nakedeye and feel gritty when rubbed between the fingers in a moist state. Somewhat
Physical Aspects of Soil 31
TABLE 2.1 Spatial Dimensions of Features Commonly Encountered in Describingthe Soil Habitat
Scale (m)
Pore(functions)AggregationsParticles Scale
(m)Biota
Atoms
Amorphousminerals
Claymicro-
structure
Macromolecules
Colloids
Clay particles Quasicrystals
Domains
Assemblages
Molecules
MICROPORES
(Adsorbed andintercrystalline
water)
MESOPORES
ψ��1500 kPa
ψ��10 kPa
(Plant availablewater)
Silt
Sand
Gravel
Rocks
Micro-aggregates
Macro-aggregates
Clods
MACROPORESAND CRACKS
(Aeration)
(Fast drainage)
Organicmolecules
Poly-saccharides
Humicsubstances
Viruses
Bacteria
Fungal hyphae
Root hairs
Roots-Mesofauna
Worms
Moles
10�10
10�9
10�8
10�7
10�6
10�5
10�4
10�3
10�2
10�1
10�0
10�10
10�9
10�8
10�7
10�6
10�5
10�4
10�3
10�2
10�1
10�0
Ch02-P546807.qxd 11/18/06 6:37 PM Page 31
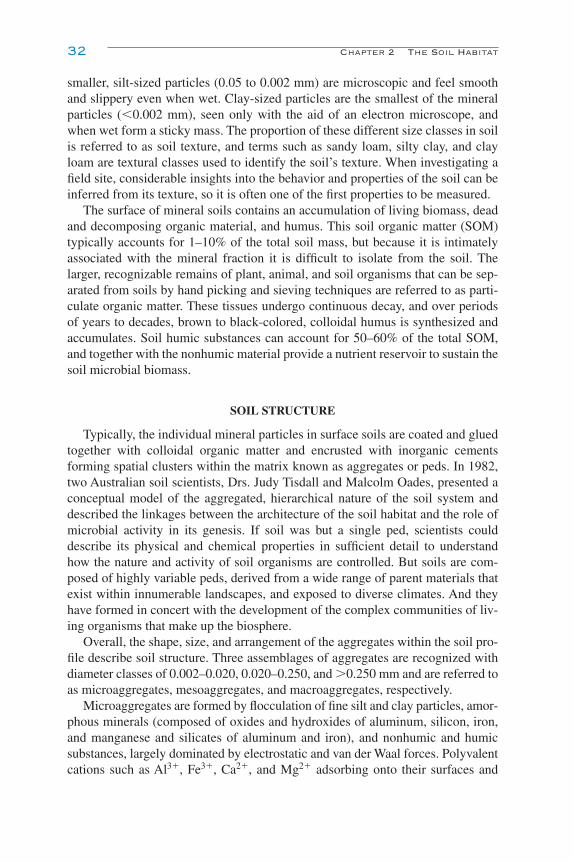
smaller, silt-sized particles (0.05 to 0.002 mm) are microscopic and feel smoothand slippery even when wet. Clay-sized particles are the smallest of the mineralparticles (�0.002 mm), seen only with the aid of an electron microscope, andwhen wet form a sticky mass. The proportion of these different size classes in soilis referred to as soil texture, and terms such as sandy loam, silty clay, and clayloam are textural classes used to identify the soil’s texture. When investigating afield site, considerable insights into the behavior and properties of the soil can beinferred from its texture, so it is often one of the first properties to be measured.
The surface of mineral soils contains an accumulation of living biomass, deadand decomposing organic material, and humus. This soil organic matter (SOM)typically accounts for 1–10% of the total soil mass, but because it is intimatelyassociated with the mineral fraction it is difficult to isolate from the soil. Thelarger, recognizable remains of plant, animal, and soil organisms that can be sep-arated from soils by hand picking and sieving techniques are referred to as parti-culate organic matter. These tissues undergo continuous decay, and over periodsof years to decades, brown to black-colored, colloidal humus is synthesized andaccumulates. Soil humic substances can account for 50–60% of the total SOM,and together with the nonhumic material provide a nutrient reservoir to sustain thesoil microbial biomass.
SOIL STRUCTURE
Typically, the individual mineral particles in surface soils are coated and gluedtogether with colloidal organic matter and encrusted with inorganic cementsforming spatial clusters within the matrix known as aggregates or peds. In 1982,two Australian soil scientists, Drs. Judy Tisdall and Malcolm Oades, presented aconceptual model of the aggregated, hierarchical nature of the soil system anddescribed the linkages between the architecture of the soil habitat and the role ofmicrobial activity in its genesis. If soil was but a single ped, scientists coulddescribe its physical and chemical properties in sufficient detail to understandhow the nature and activity of soil organisms are controlled. But soils are com-posed of highly variable peds, derived from a wide range of parent materials thatexist within innumerable landscapes, and exposed to diverse climates. And theyhave formed in concert with the development of the complex communities of liv-ing organisms that make up the biosphere.
Overall, the shape, size, and arrangement of the aggregates within the soil pro-file describe soil structure. Three assemblages of aggregates are recognized withdiameter classes of 0.002–0.020, 0.020–0.250, and �0.250 mm and are referred toas microaggregates, mesoaggregates, and macroaggregates, respectively.
Microaggregates are formed by flocculation of fine silt and clay particles, amor-phous minerals (composed of oxides and hydroxides of aluminum, silicon, iron,and manganese and silicates of aluminum and iron), and nonhumic and humicsubstances, largely dominated by electrostatic and van der Waal forces. Polyvalentcations such as Al3�, Fe3�, Ca2�, and Mg2� adsorbing onto their surfaces and
32 Chapter 2 The Soil Habitat
Ch02-P546807.qxd 11/18/06 6:37 PM Page 32

reacting with exposed functional groups promote these flocculation reactions.Sticky polysaccharides and proteins derived from plant and animal tissues, micro-bial cells, and exudates from roots, hyphae, and bacteria further enhance thesestabilization reactions. In particular, soil microorganisms produce extensiveexopolysaccharides, which they use to adhere to individual soil particles.
The core of mesoaggregates is usually the residual debris left from the decayof plant and microbial tissues. Bits of decaying particulate organic matter andtheir colonizing microbial biofilms become encrusted with fine mineral particlesand they act as nuclei for the formation of aggregates and contribute to theirresilience. Microaggregates can form throughout the surface soil matrix whereverintense microbial activity associated with organic matter decomposition occurs.The larger macroaggregates are formed only where a network of living and decayingplant roots, fungal hyphae, and microbial filaments physically enmesh clusters ofmicro- and mesoaggregates for a period sufficient for them to be chemically linked.
In the rhizosphere, hyphae of arbuscular mycorrhizal fungi contribute to theaggregation effect as they grow into small pores and bind soil particles together.Although macroaggregates comprise microaggregates, not all soil microaggre-gates exist as macroaggregates. Macroaggregates can contain soil primary particlesthat may eventually go on to form microaggregates. This hierarchical organizationof soil structure and aggregation, i.e., large aggregates being composed of smalleraggregates, which in turn are composed of even smaller aggregates, is character-istic of most soils (Fig. 2.4).
Micro- and mesoaggregates tend to be especially resistant to mechanicalbreakdown, for example, from the impact of rainfall or from slaking—rapidrewetting of dry soil—or from freezing and thawing. The restricted size of thepores within these aggregates (�0.01 mm diameter), also referred to as intra-aggregate pore space, can limit the interactions of soil organisms. The pore spacesurrounding microaggregates and contained within macroaggregates is collectivelyreferred to as the soil interaggregate pore space. It contains plant roots and is usuallyrich in fresh inputs of particulate macroorganic matter (�0.05 mm diameter).Macroaggregates usually remain intact as long as the soil is not disturbed, forexample, by earthworm and other faunal activity or by disturbance such as heavyrains. Macroaggregation is important for controlling microbial activity and soilorganic matter turnover in surface soils because it gives fine-textured, clayey andloamy-textured soils pore space characteristics similar to those of sandy soils. Thephysical properties affected by macroaggregation include pore size distribution,pore continuity and tortuosity (irregular, twisted pores), aeration, drainage, and tilth.
SOIL HABITAT SCALE AND OBSERVATION
SCALE OF SOIL HABITAT
The soil habitat is characterized by heterogeneities across all measured scales,from nanometers to kilometers, which differ in chemical, physical, and biological
Soil Habitat Scale and Observation 33
Ch02-P546807.qxd 11/18/06 6:37 PM Page 33
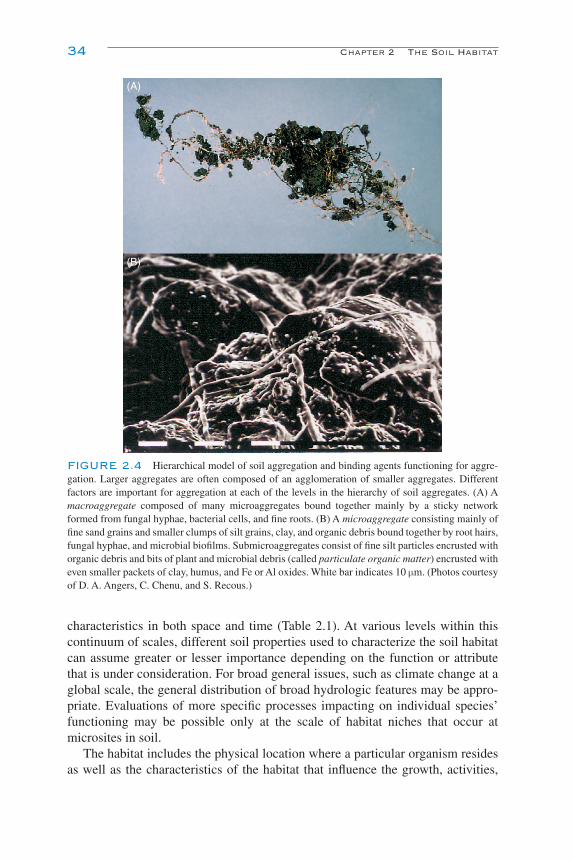
characteristics in both space and time (Table 2.1). At various levels within thiscontinuum of scales, different soil properties used to characterize the soil habitatcan assume greater or lesser importance depending on the function or attributethat is under consideration. For broad general issues, such as climate change at aglobal scale, the general distribution of broad hydrologic features may be appro-priate. Evaluations of more specific processes impacting on individual species’functioning may be possible only at the scale of habitat niches that occur atmicrosites in soil.
The habitat includes the physical location where a particular organism residesas well as the characteristics of the habitat that influence the growth, activities,
34 Chapter 2 The Soil Habitat
(A)
(B)
FIGURE 2.4 Hierarchical model of soil aggregation and binding agents functioning for aggre-gation. Larger aggregates are often composed of an agglomeration of smaller aggregates. Differentfactors are important for aggregation at each of the levels in the hierarchy of soil aggregates. (A) Amacroaggregate composed of many microaggregates bound together mainly by a sticky networkformed from fungal hyphae, bacterial cells, and fine roots. (B) A microaggregate consisting mainly offine sand grains and smaller clumps of silt grains, clay, and organic debris bound together by root hairs,fungal hyphae, and microbial biofilms. Submicroaggregates consist of fine silt particles encrusted withorganic debris and bits of plant and microbial debris (called particulate organic matter) encrusted witheven smaller packets of clay, humus, and Fe or Al oxides. White bar indicates 10 µm. (Photos courtesyof D. A. Angers, C. Chenu, and S. Recous.)
Ch02-P546807.qxd 11/18/06 6:37 PM Page 34

interactions, and survival of other organisms found in it. Together these character-istics define the range of habitats available for organisms and their enzymes tooccupy. They vary vertically, through the soil vadose zone, and horizontallyacross the landscape.
For higher organisms, such as animals that range over wide territories, thehabitat may be on the scale of a landscape or watershed and even beyond. At theother extreme, microorganisms, the habitat occurs on a microscale and thereforehas been referred to as microhabitat. The spatial characteristics of the generalhabitat, as well as the fine features of the microhabitats, must be considered indescribing the activity of soil microorganisms. Microregions within soil aggre-gates control the nature and availability of nutrient resources, directly impactingpopulation dynamics. Metabolically similar groups of microorganisms, referredto as guilds, occupy a unique ecological niche that encompasses their life strategy.Sets of guilds, which carry out interdependent physiological processes, formmicrobial communities. While ecological theory has proposed that no two speciesever occupy exactly the same ecological niche for long, in soils it is the rule thatdifferent species share aspects of their niche with others. Soil habitat spatial het-erogeneity is an important contributor to the coexistence of species in soil micro-bial communities, enhancing overall soil biodiversity by promoting the persistenceof individual populations.
Studies have confirmed that soil organisms are usually not randomly distrib-uted but exhibit predictable spatial patterns over wide spatial scales (Fig. 2.5).
Spatial patterns of soil biota also affect the spatial patterns of microbial activ-ity and processes they carry out. Accumulations of inorganic N may not beobserved where sites of plant residue decay are adjacent and closely linked tothose where ammonification of SOM is occurring. Inorganic N can accumulateand nitrification can occur where these microbial processes are physically sepa-rated in soil space. Recent studies of “trigger molecules” have identified sub-strates that appear to promote metabolic linkages over spatially diverse soilmicrobial communities (De Nobili et al., 2001).
Although the main factors influencing the gross behavior of soil organisms areknown, their relative importance and influence on spatial distribution have notbeen studied in detail. For soil microorganisms, there are few methods currentlyavailable that enable the study of their detailed activity in situ at the level of thesoil microhabitat. In fact, when collecting samples in the field from a soil profile,it is common practice for soil scientists to homogenize the samples before analy-sis, after removal of the plant debris and macrofauna, by passing the soil througha 2-mm sieve.
PORE SPACE
Between the solid (mineral and organic) components of soil is space formingpores that vary in size. On a volume basis, mineral soils are about 35–55% porespace, whereas organic soils are 80–90% pore space. But total soil pore space can
Soil Habitat Scale and Observation 35
Ch02-P546807.qxd 11/18/06 6:37 PM Page 35

vary widely for a variety of reasons, including soil mineralogy, bulk density, organicmatter content, and disturbance. Pore space can range from as low as 25% forcompacted subsoils in the lower vadose zone to more than 60% in well-aggregatedclay-textured surface soils. Sandy-textured soils, though having a higher meanpore size, tend to have less total pore space than do clay soils.
Soil pore space is defined as the percentage of the total soil volume occupiedby soil pores:
% pore space � (pore volume/soil volume) � 100. (2.1)
Direct measurement of the soil pore volume is somewhat tedious to carry out; it isusually estimated from data on soil bulk density and soil particle density using thefollowing formulas:
soil bulk density—Db (Mg/m3) � soil mass (Mg)/soil bulk volume (m3),(2.2)
soil particle density—Dp (Mg/m3) � soil mass (Mg)/soil particle volume (m3)(2.3)
(usually assumed to be 2.65 Mg/m3 for silicate minerals, but can be as high as 3.25 Mg/m3 for iron-rich tropical soils and as low as 1.3 Mg/m3 for volcanic soilsand organic soils),
% pore space � 100 – [(Db/Dp) � 100]. (2.4)
36 Chapter 2 The Soil Habitat
DisturbanceEnvironmental factors
Fine-scale effectsof roots, organicparticles andsoil structure
Plot-to fieldscaleeffects of burrowinganimals, individualplants and plantcommunities
Large-scale gradientsof texture, soil carbon,topography andvegetation systems
FIGURE 2.5 Determinants of spatial heterogeneity of soil organisms. Spatial heterogeneity insoil organism distributions occurs on nested scales and is shaped by a spatial hierarchy of environ-mental factors, intrinsic population processes, and disturbance. Disturbance operates at all spatialscales and can be a key driver of spatial heterogeneity, for example, through biomass reduction ofdominant organisms or alteration of the physical structure of the soil substrate. Feedback between spa-tial patterns of soil biotic activity and heterogeneity of environmental factors adds further complexity(dotted arrows) (from Ettema and Wardle, 2002, with permission from Elsevier).
Ch02-P546807.qxd 11/18/06 6:37 PM Page 36

Though total pore space is important, fundamentally it is the size, shape, andinterconnection of soil pores that are the key in determining the habitability of thesoil, for they directly control soil aeration and water relationships; this is largely afunction of soil texture and structure (Fig. 2.6).
Total pore space is usually divided into two size classes, macropores andmicropores, based on their ability to retain water after water drainage under theinfluence of gravity (Table 2.2). Macropores are those pores larger than �10 µmin diameter that allow rapid diffusion of air and rapid water infiltration anddrainage. They can occur as the spaces between individual sand and coarse siltgrains in coarser-textured soils and in the interaggregate pore space of well-structured loam- and clay-textured soils. Macropores can also be created by roots,earthworms, and other soil organisms, forming an important type of pore termed“biopore.” Biopores are typically lined with cutans rich in organic matter and clayand are ideal habitats for soil microorganisms. They provide continuous channelsextending throughout the soil, often for lengths of a meter or more.
Soil pores less than 10 µm in diameter are referred to as micropores. Thoughimportant for retention of water available for plants and providing an aqueoushabitat for microorganisms, the restricted size of micropores can limit interactionsof soil organisms and their access to potential substrates.
While the larger micropores together with the smaller macropores can accom-modate plant root hairs and microorganisms, pores smaller than �5 µm in diam-eter are not habitable by most microorganisms and may even be too small topermit entrance of their exoenzymes.
Soil Habitat Scale and Observation 37
FIGURE 2.6 A 3-D CT X-ray scan of a soil core 6.4 cm in diameter � 10 cm in length, with aresolution of 10 µm, showing pore space distribution. (Courtesy of R. Heck, University of Guelph.)
Ch02-P546807.qxd 11/18/06 6:37 PM Page 37

Molecular diffusion dominates the transport of gases in the soil. Diffusionthrough the air-filled pores maintains the gaseous exchange between the atmos-phere and the soil, and diffusion through water films of varying thickness main-tains the exchange of gases with soil organisms. Diffusion through both pathwayscan be described by Fick’s law,
J � –D dc/dx,
where J is the rate of gas diffusion (g cm–2 sec–1), D is the diffusion coefficient(cm2 sec–1), c is the gas concentration (g cm–3), x is the distance (cm), and dc/dxis the concentration gradient.
The diffusion coefficient in soil is much smaller than that in air because of thelimited fraction of total pore volume occupied by continuous air-filled pores andpore tortuosity, soil particles, and water, reducing the cross-sectional area andincreasing the mean path length for diffusion. It is referred to as the effective dif-fusion coefficient, De, and is a function of the air-filled porosity. In addition to thediffusive path in the air phase of the soil, diffusion of gases in water is �1/10,000of that in air (Table 2.4). Thus, gaseous diffusion through a 10-µm water filmoffers the same resistance as diffusion through a10-cm air-filled pore.
The work of Kubiena in the 1930s contributed significantly to our understand-ing of the nature of soil solid and pore space at the microscopic scale. Much of thisearly work was based on the examination of thin sections (25 µm thick) of intactblocks of soil. Adaptation of advancements in the acquisition and computer-assistedanalysis of digital imagery during the past quarter century have led to the quanti-tative spatial analysis of soil components. Thin sections represent only a single sliceof soil so it is practically impossible to extrapolate observations accurately intothree dimensions. Recent developments in microcomputerized X-ray tomography(CT scanning) allow study of the properties of the soil’s intact three-dimensional
38 Chapter 2 The Soil Habitat
TABLE 2.2 Pore-Size Characteristics across a Textural Range and Their Relation to Soil Water Potential (% of total soil porosity)
Textural classes
General pore Soil water Equivalent Sandy Loam Claycategories potential (kPa) diameter (µm) loam loam
Macropores 0 Pores filled–1 �300 5 3 2
Micropores –10 �30 15 8 2–100 �3 3 16 10
–1,000 �0.3 2 9 17–10,000 �0.03 1 5 15
Total pore 28 45 58space (%):
Ch02-P546807.qxd 11/18/06 6:37 PM Page 38
structure. These systems have resolution capabilities down to 10 µm, which allowdifferentiation of solids, and are able to quantify the distribution of organic andmineral materials. The technology is also able to readily distinguish air-filled andwater-filled pore space. Distinguishing microbes from soil particles with this tech-nology, however, is still not possible. A CT image of a soil core in three orthogo-nal planes is shown in Fig. 2.6. Highly attenuating features like iron oxide nodulesappear bright in the imagery, while features with low attenuation capability suchas pore space appear dark.
SOIL SOLUTION CHEMISTRY
An understanding of the chemistry of the soil solution providing an environmentfor soil organisms needs to take account of the nature and quantity of its majorcomponents: water, dissolved organic matter and inorganic constituents, and O2 andCO2. The biogeochemistry of the soil solution is mainly determined by acid–baseand redox reactions. Consequently the thermodynamic activities of protons andelectrons in soil solution define the chemical environment that controls microbialactivity. Both can be considered as flowing from regions of high concentration toregions of low concentration, and soil microbial activity has a profound effect onregulating this flow.
The most reduced material in the biosphere is the organic matter contained inliving biomass. Organic matter in soils ranges from total dominance, as in peat-lands, to the minor amounts found in young soils or at depth in the vadose zone.Soil organisms generate electrons during the metabolic oxidation of organic mat-ter, and these electrons must be transferred to an electron acceptor, the largest ofwhich is atmospheric O2 in freely drained, aerobic soils. The O2 trapped in the soilor present in the water can be consumed within hours by soil microbes and isreplenished by O2 diffusion. If O2 diffusion into the soil is impeded, for reasons ofwaterlogging, restricted pore sizes due to clay texture or to soil compaction, theresultant soil becomes practically devoid of O2. When microbial activity uses upall of the available dissolved O2, the soil solution as a whole changes from aero-bic (oxic) to anaerobic (anoxic). Microbial activity will then be controlled by themovement of electrons to alternative electron acceptors.
Development of anaerobic conditions results in a shift in the activity of the soilmicrobial populations, with the activity of aerobic and facultative organisms,which dominate well-drained soils, decreasing and the activity of obligate anaer-obic and fermentative organisms increasing. This switch in electron acceptorspromotes the reduction of several important elements in soil, including nitrogen,manganese, iron, and sulfur, in a process known as anaerobic respiration and car-bon dioxide by methanogenisis.
Redox potential (EH) measurements provide an indication of the soil aeration sta-tus. They are a measure of electron availability occurring as a result of electron trans-fer between oxidized (chemical species that have lost electrons) and reduced(chemical species that have gained electrons) chemical species. The measurements
Soil Habitat Scale and Observation 39
Ch02-P546807.qxd 11/18/06 6:37 PM Page 39
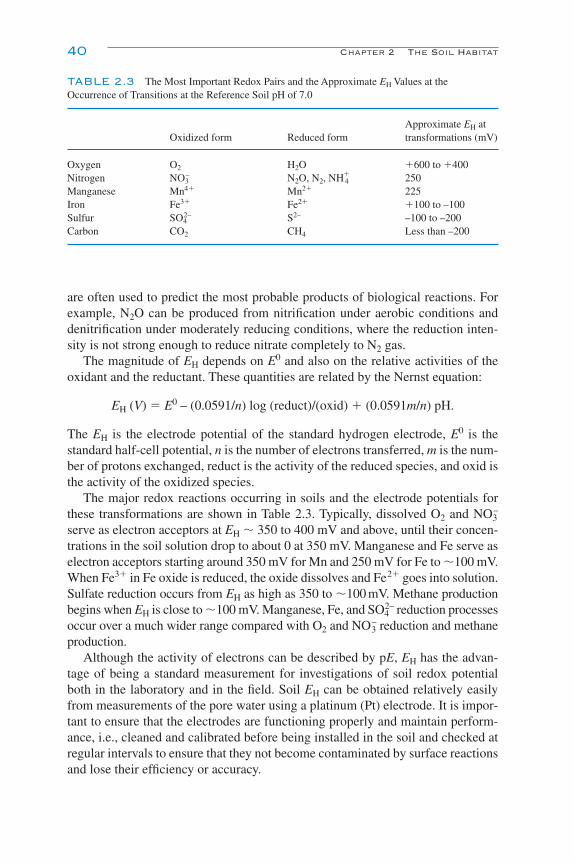
are often used to predict the most probable products of biological reactions. Forexample, N2O can be produced from nitrification under aerobic conditions anddenitrification under moderately reducing conditions, where the reduction inten-sity is not strong enough to reduce nitrate completely to N2 gas.
The magnitude of EH depends on E0 and also on the relative activities of theoxidant and the reductant. These quantities are related by the Nernst equation:
EH (V) � E0 – (0.0591/n) log (reduct)/(oxid) � (0.0591m/n) pH.
The EH is the electrode potential of the standard hydrogen electrode, E0 is thestandard half-cell potential, n is the number of electrons transferred, m is the num-ber of protons exchanged, reduct is the activity of the reduced species, and oxid isthe activity of the oxidized species.
The major redox reactions occurring in soils and the electrode potentials forthese transformations are shown in Table 2.3. Typically, dissolved O2 and NO3
–
serve as electron acceptors at EH � 350 to 400 mV and above, until their concen-trations in the soil solution drop to about 0 at 350 mV. Manganese and Fe serve aselectron acceptors starting around 350 mV for Mn and 250 mV for Fe to �100 mV.When Fe3� in Fe oxide is reduced, the oxide dissolves and Fe2� goes into solution.Sulfate reduction occurs from EH as high as 350 to �100 mV. Methane productionbegins when EH is close to �100 mV. Manganese, Fe, and SO4
2– reduction processesoccur over a much wider range compared with O2 and NO3
– reduction and methaneproduction.
Although the activity of electrons can be described by pE, EH has the advan-tage of being a standard measurement for investigations of soil redox potentialboth in the laboratory and in the field. Soil EH can be obtained relatively easilyfrom measurements of the pore water using a platinum (Pt) electrode. It is impor-tant to ensure that the electrodes are functioning properly and maintain perform-ance, i.e., cleaned and calibrated before being installed in the soil and checked atregular intervals to ensure that they not become contaminated by surface reactionsand lose their efficiency or accuracy.
40 Chapter 2 The Soil Habitat
TABLE 2.3 The Most Important Redox Pairs and the Approximate EH Values at theOccurrence of Transitions at the Reference Soil pH of 7.0
Approximate EH at Oxidized form Reduced form transformations (mV)
Oxygen O2 H2O �600 to �400Nitrogen NO3
– N2O, N2, NH4� 250
Manganese Mn4� Mn2� 225Iron Fe3� Fe2� �100 to –100Sulfur SO4
2– S2– –100 to –200Carbon CO2 CH4 Less than –200
Ch02-P546807.qxd 11/18/06 6:37 PM Page 40
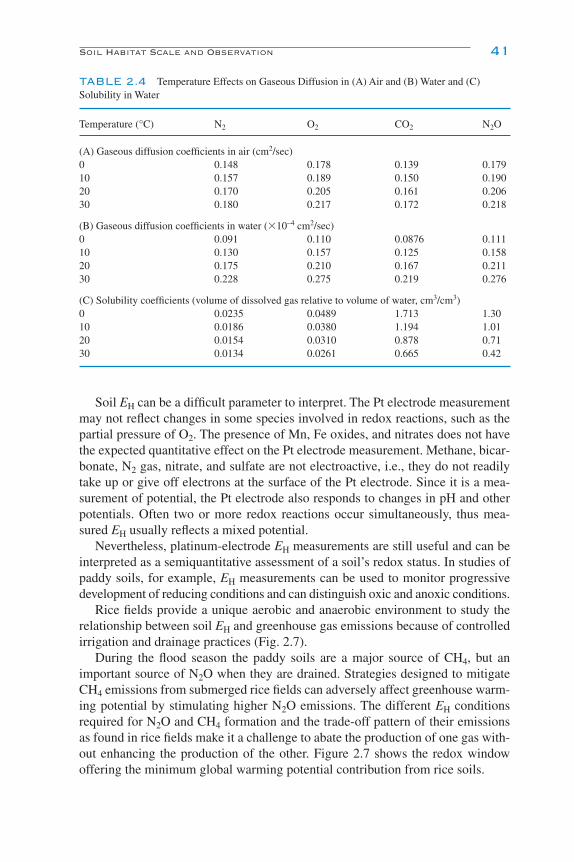
Soil EH can be a difficult parameter to interpret. The Pt electrode measurementmay not reflect changes in some species involved in redox reactions, such as thepartial pressure of O2. The presence of Mn, Fe oxides, and nitrates does not havethe expected quantitative effect on the Pt electrode measurement. Methane, bicar-bonate, N2 gas, nitrate, and sulfate are not electroactive, i.e., they do not readilytake up or give off electrons at the surface of the Pt electrode. Since it is a mea-surement of potential, the Pt electrode also responds to changes in pH and otherpotentials. Often two or more redox reactions occur simultaneously, thus mea-sured EH usually reflects a mixed potential.
Nevertheless, platinum-electrode EH measurements are still useful and can beinterpreted as a semiquantitative assessment of a soil’s redox status. In studies ofpaddy soils, for example, EH measurements can be used to monitor progressivedevelopment of reducing conditions and can distinguish oxic and anoxic conditions.
Rice fields provide a unique aerobic and anaerobic environment to study therelationship between soil EH and greenhouse gas emissions because of controlledirrigation and drainage practices (Fig. 2.7).
During the flood season the paddy soils are a major source of CH4, but animportant source of N2O when they are drained. Strategies designed to mitigateCH4 emissions from submerged rice fields can adversely affect greenhouse warm-ing potential by stimulating higher N2O emissions. The different EH conditionsrequired for N2O and CH4 formation and the trade-off pattern of their emissionsas found in rice fields make it a challenge to abate the production of one gas with-out enhancing the production of the other. Figure 2.7 shows the redox windowoffering the minimum global warming potential contribution from rice soils.
Soil Habitat Scale and Observation 41
TABLE 2.4 Temperature Effects on Gaseous Diffusion in (A) Air and (B) Water and (C)Solubility in Water
Temperature (°C) N2 O2 CO2 N2O
(A) Gaseous diffusion coefficients in air (cm2/sec)0 0.148 0.178 0.139 0.17910 0.157 0.189 0.150 0.19020 0.170 0.205 0.161 0.20630 0.180 0.217 0.172 0.218
(B) Gaseous diffusion coefficients in water (�10–4 cm2/sec)0 0.091 0.110 0.0876 0.11110 0.130 0.157 0.125 0.15820 0.175 0.210 0.167 0.21130 0.228 0.275 0.219 0.276
(C) Solubility coefficients (volume of dissolved gas relative to volume of water, cm3/cm3)0 0.0235 0.0489 1.713 1.3010 0.0186 0.0380 1.194 1.0120 0.0154 0.0310 0.878 0.7130 0.0134 0.0261 0.665 0.42
Ch02-P546807.qxd 11/18/06 6:37 PM Page 41
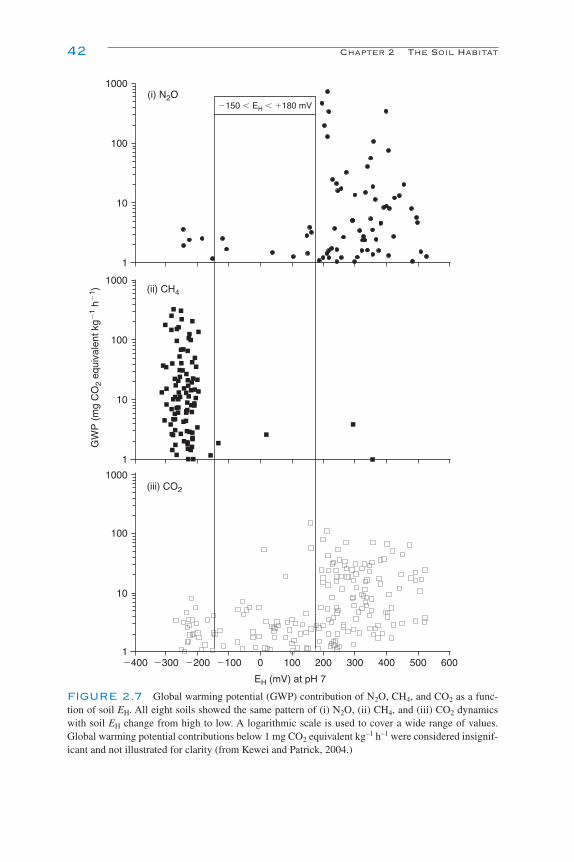
42 Chapter 2 The Soil Habitat
(iii) CO2
GW
P (
mg
CO
2 eq
uiva
lent
kg�
1 h�
1 )1000
100
10
1
(i) N2O
1000
100
10
1
1000
100
10
1
(ii) CH4
�400 �300 �200 �100 0 100 200 300 400 500 600
�150 � EH � �180 mV
EH (mV) at pH 7
FIGURE 2.7 Global warming potential (GWP) contribution of N2O, CH4, and CO2 as a func-tion of soil EH. All eight soils showed the same pattern of (i) N2O, (ii) CH4, and (iii) CO2 dynamicswith soil EH change from high to low. A logarithmic scale is used to cover a wide range of values.Global warming potential contributions below 1 mg CO2 equivalent kg–1 h–1 were considered insignif-icant and not illustrated for clarity (from Kewei and Patrick, 2004.)
Ch02-P546807.qxd 11/18/06 6:37 PM Page 42

Soil Habitat Scale and Observation 43
SOIL pH
Acidic protons supplied to the soil from atmospheric and organic sources reactwith bases represented by aluminosilicates, carbonates, and other mineralogicaland humic constituents. In a humid climate with excess precipitation, and givensufficient time, basic cations (Na�, K�, Ca2�, Mg2�) will be exchanged frommineral and organic constituents by H� and leached from the surface soil. Thepresence of clay minerals such as smectites, which are saturated with basiccations, retards the progress of acidification, and calcite buffers the soil betweenpH 7 and 8 until it is completely dissolved. Continued hydrolysis results in theformation of a residuum made up of such minerals as kaolinite, gibbsite, andgoethite, together with resistant minerals, of which quartz is common, that arebuffered between pH 3.5 and 5. Semiarid and arid conditions lead to an oppositetrend, a soil solution buffered at an alkaline pH and in the presence of sodium.
Soil pH influences a number of factors affecting microbial activity, like solu-bility and ionization of inorganic and organic soil solution constituents, and thesewill in turn affect soil enzyme activity. There are a large number of both organicand inorganic acids found in soils; the majority of these acids are relatively weak.Traditionally soil pH is measured in a soil paste prepared by the addition of adilute CaCl2 solution with an appropriate electrode. While achieving a pH meas-urement of the soil is relatively easy, interpretation of its affect on microbialprocesses is difficult. This is because concentrations of cations sorbed to the sur-faces of the negatively charged soil colloids are 10–100 times higher than those ofthe soil solution. The pH at the colloid surface will be much more acidic than thatof the measured pH of the bulk soil solution. For soil exoenzymes sorbed to col-loid surfaces, their apparent pH optimum would be 1–2 pH units higher than ifmeasured free in solution. An example of this is soil urease activity, which has anapparent pH optimum of 8.5–9.0 that is about 2 pH units greater than optimal ure-ase activity measured in solution.
SOIL TEMPERATURE
Many physical, chemical, and biological processes that occur in soil are influ-enced by temperature. Increasing temperature enhances mineralization of SOM ordecomposition of plant residues by increasing rates of physiological reactions andby accelerating diffusion of soluble substrates in soil. An increase in temperaturecan also induce a shift in the composition of the microbial community. Whereasrates of molecular diffusion always increase with increasing temperature, solubil-ity of gases in soil solution do not, and can even decrease, thereby slowing micro-bial activity (Table 2.4).
The relation between a chemical reaction rate and temperature was first pro-posed by Arrhenius:
k � A e–Ea/RT. (2.5)
Ch02-P546807.qxd 11/18/06 6:37 PM Page 43
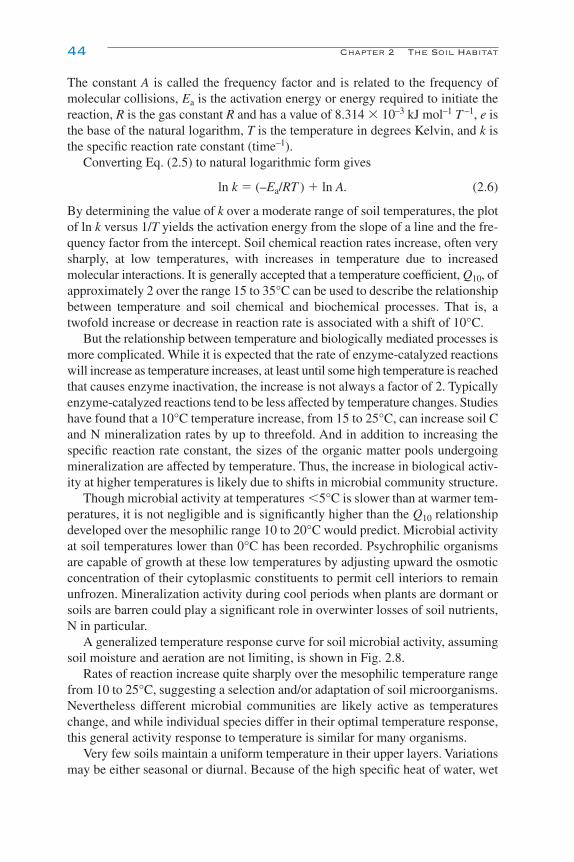
The constant A is called the frequency factor and is related to the frequency ofmolecular collisions, Ea is the activation energy or energy required to initiate thereaction, R is the gas constant R and has a value of 8.314 � 10–3 kJ mol–1 T –1, e isthe base of the natural logarithm, T is the temperature in degrees Kelvin, and k isthe specific reaction rate constant (time–1).
Converting Eq. (2.5) to natural logarithmic form gives
ln k � (–Ea/RT ) � ln A. (2.6)
By determining the value of k over a moderate range of soil temperatures, the plotof ln k versus 1/T yields the activation energy from the slope of a line and the fre-quency factor from the intercept. Soil chemical reaction rates increase, often verysharply, at low temperatures, with increases in temperature due to increasedmolecular interactions. It is generally accepted that a temperature coefficient, Q10, ofapproximately 2 over the range 15 to 35°C can be used to describe the relationshipbetween temperature and soil chemical and biochemical processes. That is, atwofold increase or decrease in reaction rate is associated with a shift of 10°C.
But the relationship between temperature and biologically mediated processes ismore complicated. While it is expected that the rate of enzyme-catalyzed reactionswill increase as temperature increases, at least until some high temperature is reachedthat causes enzyme inactivation, the increase is not always a factor of 2. Typicallyenzyme-catalyzed reactions tend to be less affected by temperature changes. Studieshave found that a 10°C temperature increase, from 15 to 25°C, can increase soil Cand N mineralization rates by up to threefold. And in addition to increasing thespecific reaction rate constant, the sizes of the organic matter pools undergoingmineralization are affected by temperature. Thus, the increase in biological activ-ity at higher temperatures is likely due to shifts in microbial community structure.
Though microbial activity at temperatures �5°C is slower than at warmer tem-peratures, it is not negligible and is significantly higher than the Q10 relationshipdeveloped over the mesophilic range 10 to 20°C would predict. Microbial activityat soil temperatures lower than 0°C has been recorded. Psychrophilic organismsare capable of growth at these low temperatures by adjusting upward the osmoticconcentration of their cytoplasmic constituents to permit cell interiors to remainunfrozen. Mineralization activity during cool periods when plants are dormant orsoils are barren could play a significant role in overwinter losses of soil nutrients,N in particular.
A generalized temperature response curve for soil microbial activity, assumingsoil moisture and aeration are not limiting, is shown in Fig. 2.8.
Rates of reaction increase quite sharply over the mesophilic temperature rangefrom 10 to 25°C, suggesting a selection and/or adaptation of soil microorganisms.Nevertheless different microbial communities are likely active as temperatureschange, and while individual species differ in their optimal temperature response,this general activity response to temperature is similar for many organisms.
Very few soils maintain a uniform temperature in their upper layers. Variationsmay be either seasonal or diurnal. Because of the high specific heat of water, wet
44 Chapter 2 The Soil Habitat
Ch02-P546807.qxd 11/18/06 6:37 PM Page 44
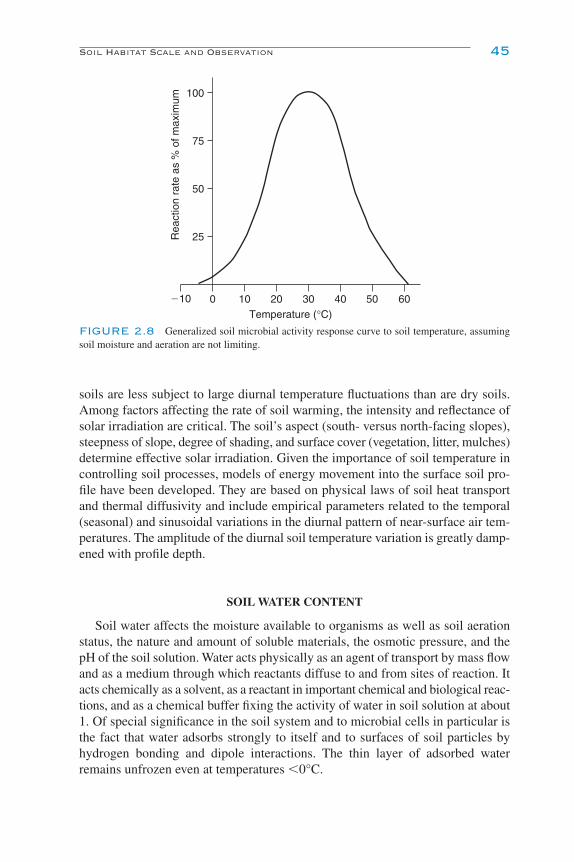
soils are less subject to large diurnal temperature fluctuations than are dry soils.Among factors affecting the rate of soil warming, the intensity and reflectance ofsolar irradiation are critical. The soil’s aspect (south- versus north-facing slopes),steepness of slope, degree of shading, and surface cover (vegetation, litter, mulches)determine effective solar irradiation. Given the importance of soil temperature incontrolling soil processes, models of energy movement into the surface soil pro-file have been developed. They are based on physical laws of soil heat transportand thermal diffusivity and include empirical parameters related to the temporal(seasonal) and sinusoidal variations in the diurnal pattern of near-surface air tem-peratures. The amplitude of the diurnal soil temperature variation is greatly damp-ened with profile depth.
SOIL WATER CONTENT
Soil water affects the moisture available to organisms as well as soil aerationstatus, the nature and amount of soluble materials, the osmotic pressure, and thepH of the soil solution. Water acts physically as an agent of transport by mass flowand as a medium through which reactants diffuse to and from sites of reaction. Itacts chemically as a solvent, as a reactant in important chemical and biological reac-tions, and as a chemical buffer fixing the activity of water in soil solution at about1. Of special significance in the soil system and to microbial cells in particular isthe fact that water adsorbs strongly to itself and to surfaces of soil particles byhydrogen bonding and dipole interactions. The thin layer of adsorbed waterremains unfrozen even at temperatures �0°C.
Soil Habitat Scale and Observation 45
100
75
50
25Rea
ctio
n ra
te a
s %
of m
axim
um
Temperature (°C)
�10 0 10 20 30 40 50 60
FIGURE 2.8 Generalized soil microbial activity response curve to soil temperature, assumingsoil moisture and aeration are not limiting.
Ch02-P546807.qxd 11/18/06 6:37 PM Page 45

Soil water content can be measured on a mass or volume basis. Gravimetric soilwater content is the mass of water in the soil, measured as the mass loss in a soil driedat 105°C (oven-dry weight) and is expressed per unit mass of oven-dry soil.Volumetric soil water content is the volume of water per unit volume of soil. Soilwater is also described in terms of its potential free energy, based on the concept ofmatric, osmotic, and gravitational forces affecting water potential. Soil water poten-tial is expressed in units of pascals (Pa) or, more commonly, kilopascals (kPa).Matric forces are attributed to the adhesive or adsorption forces of water attractionto surfaces of mineral and organic particles and to cohesive forces or attraction toitself. Since these forces reduce the free energy status of the water, matric forcesreduce the water potential to values less than 0; that is, matric forces result in neg-ative water potentials. Solutes dissolved in soil solution also contribute to a reduc-tion in the free energy of water and give rise to an osmotic potential that too isnegative. Combined, the matric and osmotic forces are responsible for the reten-tion of water in soils. They act against gravitational forces tending to draw waterdownward and out of the soil. Gravitational forces are usually positive.
When the gravitational forces draining water downward are exactly counter-balanced by the matric and osmotic forces holding onto the water, the soil is saidto be at field capacity or at its water holding capacity. This will occur after irriga-tion, after a heavy rainfall, or after spring thaw, which leave the soil saturated andhaving a soil water potential of 0 kPa. Gravitational forces begin immediately todrain away water in excess of that which can be retained by matric � osmoticforces, leaving the soil after 1–2 days at field capacity. By definition the fieldcapacity for loam and clay loam soils is a soil water potential of –33 kPa, and forsandy soils –10 kPa.
Water retention or soil water content at a given soil water potential is a functionof the size of pores present in the soil, or pore size distribution. Soils of differenttextures have very different water contents even though they have the same waterpotential (Table 2.2). An important property of water influencing its behavior insoil pores is surface tension. Because of the strong cohesive forces, water has ahigh surface tension. Based on matric forces and properties of surface tension, themaximum diameter of pores filled with water at a given soil water potential can beestimated using the Young–Laplace equation:
Maximum pore diameter retaining water (µm)� �300/(soil water potential (kPa)). (2.7)
Those soil pores greater than about 10 µm diameter drain under the influence ofgravitation forces, given that the soil water potential at field capacity is –33 kPa.
Soil water potential determines the energy that an organism must expend toobtain water from the soil solution. Generally aerobic microbial activity in soil isoptimal at a soil water potential of about –50 kPa and decreases as the soil eitherbecomes wetter and saturated, i.e., waterlogged, or dries (Fig. 2.9).
While plants are at their wilting point when the soil water potential reaches–1500 kPa, relative rates of soil microbial activity can still be quite high.
46 Chapter 2 The Soil Habitat
Ch02-P546807.qxd 11/18/06 6:37 PM Page 46
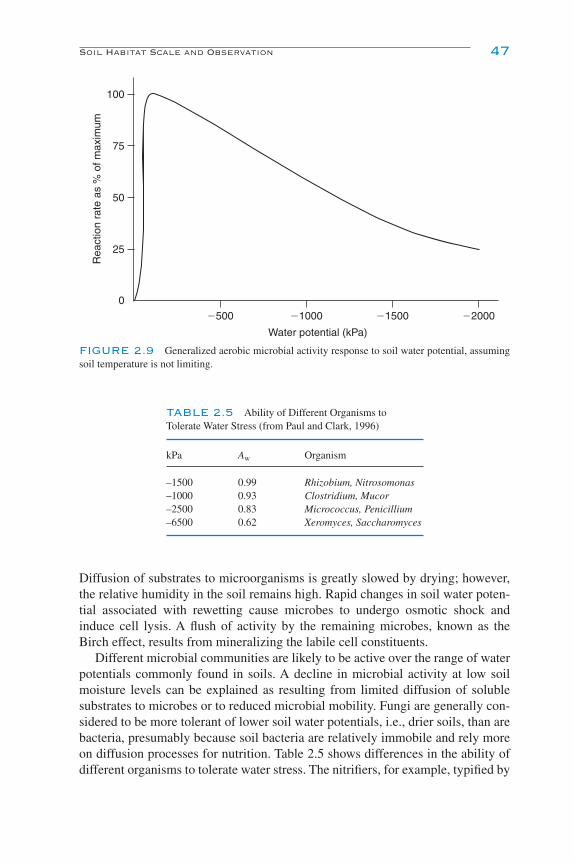
Diffusion of substrates to microorganisms is greatly slowed by drying; however,the relative humidity in the soil remains high. Rapid changes in soil water poten-tial associated with rewetting cause microbes to undergo osmotic shock andinduce cell lysis. A flush of activity by the remaining microbes, known as theBirch effect, results from mineralizing the labile cell constituents.
Different microbial communities are likely to be active over the range of waterpotentials commonly found in soils. A decline in microbial activity at low soilmoisture levels can be explained as resulting from limited diffusion of solublesubstrates to microbes or to reduced microbial mobility. Fungi are generally con-sidered to be more tolerant of lower soil water potentials, i.e., drier soils, than arebacteria, presumably because soil bacteria are relatively immobile and rely moreon diffusion processes for nutrition. Table 2.5 shows differences in the ability ofdifferent organisms to tolerate water stress. The nitrifiers, for example, typified by
Soil Habitat Scale and Observation 47
�500 �1000 �1500 �2000
100
75
50
Rea
ctio
n ra
te a
s %
of m
axim
um
25
0
Water potential (kPa)
FIGURE 2.9 Generalized aerobic microbial activity response to soil water potential, assumingsoil temperature is not limiting.
TABLE 2.5 Ability of Different Organisms toTolerate Water Stress (from Paul and Clark, 1996)
kPa Aw Organism
–1500 0.99 Rhizobium, Nitrosomonas–1000 0.93 Clostridium, Mucor–2500 0.83 Micrococcus, Penicillium–6500 0.62 Xeromyces, Saccharomyces
Ch02-P546807.qxd 11/18/06 6:37 PM Page 47

Nitrosomonas, are less tolerant of stress than are the ammonifiers, typified byClostridium and Penicillium. Ammonium may accumulate in a droughty soilbecause the nitrifiers do not have access to ammonium generated at water poten-tials at which the ammonifiers are still active.
ENVIRONMENTAL FACTORS, TEMPERATURE ANDMOISTURE INTERACTIONS
Soil moisture and temperature are the critical climatic factors regulating soilbiological activity. This control is affected by changes in the underlying rates ofenzyme-catalyzed reactions. Where water is nonlimiting, biological activity maydepend primarily on temperature, and standard Arrhenius theory can be used topredict temperature affects. But as soils dry, moisture is more controlling of bio-logical processes than is temperature. These two environmental influences do not affect microbial activity in linear fashion but display complex, nonlinear,interrelated effects that likely reflect the individual responses of the various micro-organisms and their associated enzyme systems.
The interaction of temperature, moisture, and organisms is exemplified by thecurrent discussions about climate change. A hundred years ago, Swedish scientistSvante Arrhenius asked the important question “Is the mean temperature of theground in any way influenced by the presence of the heat-absorbing gases in theatmosphere?” He went on to become the first person to investigate the effect thatdoubling atmospheric carbon dioxide would have on global climate. The globe iswarming because of increased CO2 in the atmosphere from man’s burning of pastSOM depositions (fossil fuels) and from management changes such as cultivationof forested soils as in the Amazon. This in turn is causing the extensive organicdeposits in frozen tundra to thaw. The melting allows the vegetation to change asthe former tundra becomes boreal in nature. In turn, the trees will result in lesslight reflection and further increase warming and primary productivity. Will thegenerally warmer globe result in less overall organic matter as decomposition isincreased? Theory such as the Arrhenius equation suggests that the more resistantorganic matter compounds with high activation energy should be more decom-posable at higher temperatures (Davidson and Janssens, 2006). But as always insoils there are interactions. What is the effect of physical protection by aggre-gates? Will there be more or fewer soil aggregates in a warmer climate with dif-ferent vegetation–decomposer interactions, given that aggregates are formed bymicroorganisms and roots? Many of the environmental constraints affect decom-position reactions by altering organic matter (substrate) concentrations at the siteat which all decomposition occurs, that of the enzyme reaction site. We must alsoconsider decomposition rates at the enzyme affinity level; Michaelis–Mentenmodels of enzyme kinetics are covered in Chap. 16 and energy yield in Chap. 9.Changes in microbial community structure (Chap. 8) also will have profoundinfluences. The goal of this chapter is to provide an environmental boundary of thesoil habitat and a description of its fundamental physical and chemical properties.
48 Chapter 2 The Soil Habitat
Ch02-P546807.qxd 11/18/06 6:37 PM Page 48
With this as a foundation, later chapters in this volume explore in detail informa-tion about organisms, their biochemistry, and their interactions.
REFERENCES AND SUGGESTED READING
Arrhenius, S. (1903). Nobel lecture.Birkeland, P. W. (1999). “Soils and Geomorphology.” 3rd ed. Oxford Univ. Press, Oxford.Brady, N. C., and Weil, R. R. (2002). “The Nature and Properties of Soils.” 13th ed. Prentice Hall,
Upper Saddle River, NJ.Davidson, E. A., and Janssens, I. A. (2006). Temperature sensitivity of soil carbon decomposition and
feedbacks to climate change. Nature 440, 165–173.De Nobili, M., Contin, M., Mondini, C., and Brookes, P. C. (2001). Soil microbial biomass is triggered
into activity by trace amounts of substrate. Soil Biol. Biochem. 33, 1163–1170.Ettema, C. H., and Wardle, D. A. (2002). Spatial soil ecology. Trends Ecol. Evol. 17, 177–183.Hillel, D. (1998). “Environmental Soil Physics.” Academic Press, San Diego.Kewei, Y., and Patrick, W. H., Jr. (2004). Redox window with minimum global warming potential con-
tribution from rice soils. Soil Sci. Soc. Am. J. 68, 2086–2091.McBride, M. B. (1994). “Environmental Chemistry of Soils.” Oxford Univ. Press, Oxford, UK.Paul, E. A., and Clark, F. E. (1996). “Soil Microbiology and Biochemistry.” 2nd ed. Academic Press,
San Diego.
References and Suggested Reading 49
Ch02-P546807.qxd 11/18/06 6:37 PM Page 49

Ch02-P546807.qxd 11/18/06 6:37 PM Page 50

PART
II
SOIL BIOTA
Ch03-P546807.qxd 11/18/06 6:15 PM Page 51

Ch03-P546807.qxd 11/18/06 6:15 PM Page 52
3PHYSIOLOGICAL AND
BIOCHEMICAL METHODS FOR
STUDYING SOIL BIOTA AND
THEIR FUNCTION
Ellen Kandeler
Introduction
Scale of Investigations and Collection of Samples
Storage and Pretreatment of Samples
Microbial Biomass
Signature Molecules as a Measure of Microbial Biomassand Microbial Community Structure
Physiological Analyses
Activities and Locations of Enzymes
Functional Diversity
References and Suggested Reading
INTRODUCTION
Biologically and biochemically mediated processes in soils are fundamental toterrestrial ecosystem function. Members of all trophic levels in ecosystems dependon the soil as a source of nutrients and depend on soil organisms to release andrecycle key nutrient elements by decomposing organic residues. These biotic decom-position processes are studied at three levels of resolution (Sinsabaugh et al.,2002). At the molecular level, plant fiber structure and enzymatic characteristicsof degradation are investigated. At the organismal level, the focus is on functionalgene analyses, regulation of enzyme expression, and growth kinetics, whereas at
53
Ch03-P546807.qxd 11/18/06 6:15 PM Page 53
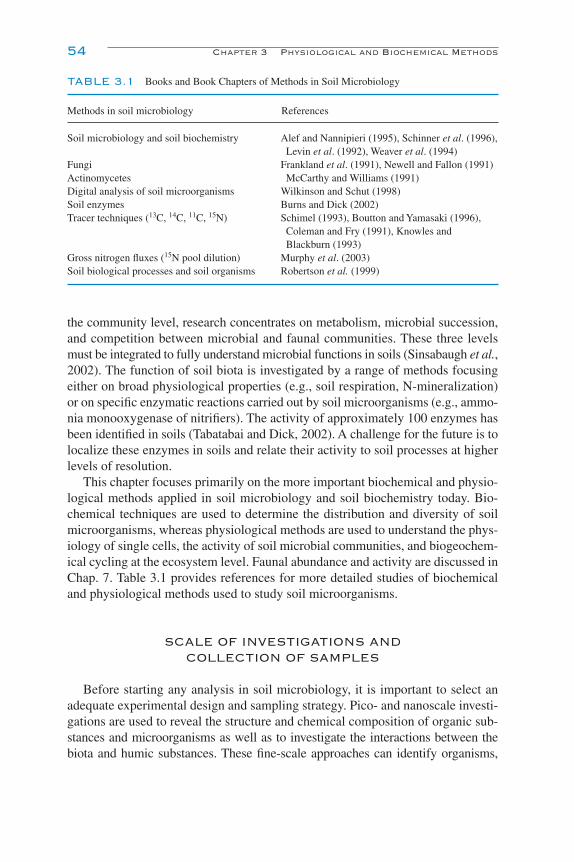
54 Chapter 3 Physiological and Biochemical Methods
the community level, research concentrates on metabolism, microbial succession,and competition between microbial and faunal communities. These three levelsmust be integrated to fully understand microbial functions in soils (Sinsabaugh et al.,2002). The function of soil biota is investigated by a range of methods focusingeither on broad physiological properties (e.g., soil respiration, N-mineralization)or on specific enzymatic reactions carried out by soil microorganisms (e.g., ammo-nia monooxygenase of nitrifiers). The activity of approximately 100 enzymes hasbeen identified in soils (Tabatabai and Dick, 2002). A challenge for the future is tolocalize these enzymes in soils and relate their activity to soil processes at higherlevels of resolution.
This chapter focuses primarily on the more important biochemical and physio-logical methods applied in soil microbiology and soil biochemistry today. Bio-chemical techniques are used to determine the distribution and diversity of soilmicroorganisms, whereas physiological methods are used to understand the phys-iology of single cells, the activity of soil microbial communities, and biogeochem-ical cycling at the ecosystem level. Faunal abundance and activity are discussed inChap. 7. Table 3.1 provides references for more detailed studies of biochemicaland physiological methods used to study soil microorganisms.
SCALE OF INVESTIGATIONS ANDCOLLECTION OF SAMPLES
Before starting any analysis in soil microbiology, it is important to select anadequate experimental design and sampling strategy. Pico- and nanoscale investi-gations are used to reveal the structure and chemical composition of organic sub-stances and microorganisms as well as to investigate the interactions between thebiota and humic substances. These fine-scale approaches can identify organisms,
TABLE 3.1 Books and Book Chapters of Methods in Soil Microbiology
Methods in soil microbiology References
Soil microbiology and soil biochemistry Alef and Nannipieri (1995), Schinner et al. (1996), Levin et al. (1992), Weaver et al. (1994)
Fungi Frankland et al. (1991), Newell and Fallon (1991)Actinomycetes McCarthy and Williams (1991)Digital analysis of soil microorganisms Wilkinson and Schut (1998)Soil enzymes Burns and Dick (2002)Tracer techniques (13C, 14C, 11C, 15N) Schimel (1993), Boutton and Yamasaki (1996),
Coleman and Fry (1991), Knowles and Blackburn (1993)
Gross nitrogen fluxes (15N pool dilution) Murphy et al. (2003)Soil biological processes and soil organisms Robertson et al. (1999)
Ch03-P546807.qxd 11/18/06 6:15 PM Page 54
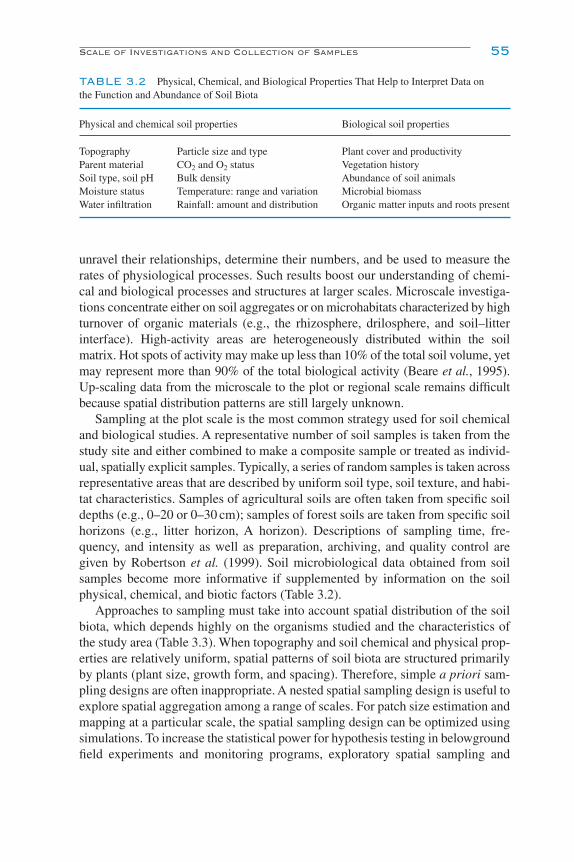
unravel their relationships, determine their numbers, and be used to measure therates of physiological processes. Such results boost our understanding of chemi-cal and biological processes and structures at larger scales. Microscale investiga-tions concentrate either on soil aggregates or on microhabitats characterized by highturnover of organic materials (e.g., the rhizosphere, drilosphere, and soil–litterinterface). High-activity areas are heterogeneously distributed within the soilmatrix. Hot spots of activity may make up less than 10% of the total soil volume, yetmay represent more than 90% of the total biological activity (Beare et al., 1995).Up-scaling data from the microscale to the plot or regional scale remains difficultbecause spatial distribution patterns are still largely unknown.
Sampling at the plot scale is the most common strategy used for soil chemicaland biological studies. A representative number of soil samples is taken from thestudy site and either combined to make a composite sample or treated as individ-ual, spatially explicit samples. Typically, a series of random samples is taken acrossrepresentative areas that are described by uniform soil type, soil texture, and habi-tat characteristics. Samples of agricultural soils are often taken from specific soildepths (e.g., 0–20 or 0–30 cm); samples of forest soils are taken from specific soilhorizons (e.g., litter horizon, A horizon). Descriptions of sampling time, fre-quency, and intensity as well as preparation, archiving, and quality control aregiven by Robertson et al. (1999). Soil microbiological data obtained from soilsamples become more informative if supplemented by information on the soilphysical, chemical, and biotic factors (Table 3.2).
Approaches to sampling must take into account spatial distribution of the soilbiota, which depends highly on the organisms studied and the characteristics ofthe study area (Table 3.3). When topography and soil chemical and physical prop-erties are relatively uniform, spatial patterns of soil biota are structured primarilyby plants (plant size, growth form, and spacing). Therefore, simple a priori sam-pling designs are often inappropriate. A nested spatial sampling design is useful toexplore spatial aggregation among a range of scales. For patch size estimation andmapping at a particular scale, the spatial sampling design can be optimized usingsimulations. To increase the statistical power for hypothesis testing in belowgroundfield experiments and monitoring programs, exploratory spatial sampling and
Scale of Investigations and Collection of Samples 55
TABLE 3.2 Physical, Chemical, and Biological Properties That Help to Interpret Data on the Function and Abundance of Soil Biota
Physical and chemical soil properties Biological soil properties
Topography Particle size and type Plant cover and productivityParent material CO2 and O2 status Vegetation historySoil type, soil pH Bulk density Abundance of soil animalsMoisture status Temperature: range and variation Microbial biomassWater infiltration Rainfall: amount and distribution Organic matter inputs and roots present
Ch03-P546807.qxd 11/18/06 6:15 PM Page 55

geostatistical analysis can be used to design a hot-spot stratified sampling scheme(Robertson, 1994; Klironomos et al., 1999).
Knowledge of the spatial dependency of soil biota attributes helps to interprettheir ecological meaning at the ecosystem scale. Biochemical processes in the soilare dynamic, leading to variation in both space and time. Landscape-scale analysesby geostatistical methods are useful tools for identifying and explaining spatialrelationships between soil biochemical processes and site properties. Furthermodel improvements, however, should focus on identifying and mapping time–spacepatterns using modern approaches such as fuzzy classification and geostatisticalinterpolation.
STORAGE AND PRETREATMENT OF SAMPLES
Biological analyses should be performed as soon as possible after soil sam-pling to minimize the effects of storage on soil microbial communities. Moist soilcan be stored for up to 3 weeks at 4ºC when samples cannot be processed imme-diately. If longer storage periods are necessary, the samples taken to measure mostsoil biochemical properties (soil microbial biomass, enzyme activities, etc.) canbe stored at �20ºC; the soil is then allowed to thaw at 4ºC for about 2 days beforeanalysis. The soil disturbance associated with sampling may itself trigger changesin the soil population during the storage interval. Observations on stored samplesmay not be representative of the undisturbed field soil. If samples are stored, careshould be taken to ensure that samples do not dry out and that anaerobic conditions
56 Chapter 3 Physiological and Biochemical Methods
TABLE 3.3 The Relationship of Soil Microbial Properties to Sampling Scale, TaxonomicResolution, and Ecosystema
DistanceMain factors causing sampled (m)
Ecosystem microbial spatial PatchProperty studied pattern size (m) Min Max
Microbial Arable and Land use and Corg 250 50 1500biomass pasture
Arable Topography, Corg and 21 5 1200moisture
Spruce–birch Tree species patch size 7 2 20Spruce Tree size and spacing 1.00 0.10 18
FAME profilesb Arable Corn rhizosphere and 0.05–0.97 0.02 80plant spacing
NH4� oxidizers Arable Soil pores, aggregates, 0.004 0.001 0.09
and fine roots
Patch size is estimated by the range parameter of the semivariogram model.aAdapted from Ettema and Wardle (2002).bFAME, fatty acid methyl ester profiles characterizing biomass of specific microbial isolates.
Ch03-P546807.qxd 11/18/06 6:15 PM Page 56
do not develop. Soil samples are often sieved through a 2-mm mesh screen to removestones, roots, and debris prior to analysis. Wet soil samples have to be either sievedthrough a 5-mm mesh or gently predried before using the 2-mm mesh sieve.
MICROBIAL BIOMASS
CHLOROFORM FUMIGATION INCUBATION ANDEXTRACTION METHODS
Microbial biomass is measured to give an indication of the response of soilmicrobiota to management, environmental change, site disturbance, and soil pol-lution. Two different approaches are both based on CO2 evolution. The chloro-form fumigation incubation (CFI) method (Jenkinson and Powlson, 1976)exposes moist soil to ethanol-free chloroform for 24 h to kill the indigenous micro-organisms. After removal of the fumigant, a flush of mineralized CO2 and NH4
� isreleased during a 10-day incubation. This flush is caused by soil microorganismsthat have survived the fumigation (as spores or cysts) and use cell lysates as anavailable C and energy source. The released CO2 is trapped in an alkaline solutionand is quantified by titration. Alternatively, the CO2 that accumulates in the head-space of the sample containers is measured by gas chromatography. An assay ofnonfumigated soil serves as a control. The amount of microbial biomass C is calculated as
biomass C � (FC � UfC)/KC,
where biomass C is the amount of carbon trapped in the microbial biomass, FC isthe CO2 produced by the fumigated soil, UfC is the CO2 produced by the nonfu-migated soil sample, and KC is the fraction of the biomass C mineralized to CO2.The KC value is a constant representative of the cell utilization efficiency of thefumigation procedure. This efficiency is considered to be about 40–45% for manysoils (e.g., a constant of 0.41–0.45). Deviations of this range are found for sub-surface and tropical soils. The KC factor of soil samples can be estimated by measur-ing the 14CO2 release of soil microorganisms isolated from different soils that useradiolabeled bacterial cells as substrates.
The chloroform fumigation extraction (CFE) method involves the extractionand quantification of microbial constituents (C, N, S, and P) immediately follow-ing CHCl3 fumigation of the soil (Brookes et al., 1985). The efficiency of soilmicrobial biomass extraction has to be taken into account. A Kec factor of 0.45 isrecommended for agricultural soils (Joergensen, 1996), and the Kec factor of soilsfrom other environments (subsurface soils, peat soils, etc.) should be experimen-tally derived. The CFE method can be applied to a wide range of soils. Soils con-taining large amounts of living roots require a preextraction procedure of rootsbecause these cells are also affected by the fumigation procedure.
Microbial Biomass 57
Ch03-P546807.qxd 11/18/06 6:15 PM Page 57
SUBSTRATE-INDUCED RESPIRATION
The substrate-induced respiration (SIR) method estimates the amount of C heldin living, heterotrophic microorganisms by measuring the initial respiration afterthe addition of an available substrate (Anderson and Domsch, 1978). In general, soilsamples are placed into airtight containers and then amended with glucose. EvolvedCO2 is followed for several hours (no proliferation of microorganisms should occurunder these conditions). The initial respiratory response is proportional to the amountof microbial C present in the soil sample. Applying the following conversion factor,derived from the calibration of substrate-induced respiration to the chloroform fumi-gation incubation technique, results can be converted to milligrams of biomass C,
y � 40.04x � 0.37,
where y is biomass C (mg 100 g�1 dry wt soil) and x is the respiration rate (ml CO2
100 g�1 soil h�1). Respired CO2 can be measured by use of an alkali trap followedby titration or by GC analysis of the headspace gas. The optimum concentrationof glucose leading to the maximal initial release of CO2 has to be independentlydetermined for each soil type and should be applied to that soil to standardize theSIR method between different soil types. The SIR method using titrimetric meas-urement of CO2 is frequently applied because it is simple, fast, and inexpensive.A disadvantage of the static systems with alkaline absorption of evolved CO2 isthat the O2 partial pressure may change, causing overestimations in neutral or alka-line soils. Nevertheless, most versions of the three methods for estimating micro-bial biomass (CFI, CFE, and SIR) gave identical ranking from a range of 20 arableand forest sites in an interlaboratory comparison (Beck et al., 1997).
Using selective antibiotics, the SIR approach can also be used to measure therelative biomass of fungi and bacteria in the soil microbial community. Glucose-induced respiration is determined for fungi in the presence of streptomycin, whichinhibits prokaryotes, and for bacteria in the presence of cycloheximide (actid-ione), which inhibits eukaryotes. An automated infrared gas analyzer system is usedto continuously measure CO2 produced, and a computer program is used to cal-culate the bacterial/fungal respiration based on the following criteria: (1) proof ofno unselective inhibition and (2) proof of no shifts in the biosynthesis rates of bac-teria and fungi in favor of one group (Bååth and Anderson, 2003).
ISOTOPIC COMPOSITION OF MICROBIAL BIOMASS
Determining the isotopic composition of microbial biomass C is a furtherimportant tool for studying soil microbial ecology and the decomposition andimmobilization of soil organic C. The use of the CFI method is restricted to theisotopes 14C, 13C, and 15N, whereas the CFE method can be used with a largerrange of isotopes (i.e., 14C, 13C, 15N, 32P, and 35S). Recently, 13C studies have
58 Chapter 3 Physiological and Biochemical Methods
Ch03-P546807.qxd 11/18/06 6:15 PM Page 58
gained increasing interest due to the improved sensitivity of 13C measurementsand due to its nonradioactive nature (in contrast to 14C studies). Since the tissuesof C3 plants (e.g., wheat) and C4 plants (e.g., maize) differ in their natural abun-dance of 13C, these plant materials have a natural label that can be used for decom-position studies in both microcosm and field studies. 13C/12C determinations areperformed with an offline sample preparation technique combined with isotopeanalysis by a dual-inlet IRMS (isotope ratio mass spectrometer) or an onlineanalysis using an element analyzer connected to an isotope ratio mass spectrome-ter. A new method is based on the UV-catalyzed liquid oxidation of fumigated andnonfumigated soil extracts combined with trapping of the released CO2 in liquidN2; δ13CO2–C is subsequently determined with a gas chromatograph connected toan IRMS (Potthoff et al., 2003). The 13C analysis can also be done using an auto-mated continuous-flow IRMS.
SIGNATURE MOLECULES AS A MEASURE OFMICROBIAL BIOMASS AND MICROBIAL
COMMUNITY STRUCTURE
Various cellular constituents can be used to estimate microbial biomass and sub-divide community members into broad groups. These signature molecules includeadenosine triphosphate (ATP), microbial membrane components, and respiratoryquinones. Each type of molecule differs in its level of resolution. The amount ofATP extracted from soil gives a measure of the energy charge of all soil biota,whereas ergosterol, a component of fungal cell walls, is attributed only to the fun-gal biomass. Signature molecules such as phospholipid fatty acids or respiratoryquinones are used as indicators of the microbial community’s structural diversity.A prerequisite for the use of biochemical compounds as signature molecules isthat they are unstable outside the cell, because the compound extracted from soilshould represent living organisms only.
ATP AS A MEASURE OF ACTIVE MICROBIAL BIOMASS
All biosynthetic and catabolic reactions within cells require the participation ofATP. ATP is sensitive to phosphatases and does not persist in soil in a free state. Itshould be ideal for determining the amount or activity of life within soil, sediment,or aquatic systems. The substrate luciferin, an aromatic N- and S-containing mol-ecule, reacts with ATP and luciferase in the presence of Mg2� to yield anenzyme–luciferin–adenosine monophosphate intermediate. This, in the presenceof O2, breaks down to produce free adenosine monophosphate, inorganic P, andlight. The light emitted is measured by a photometer or scintillation counter andplotted against ATP content to form a standard curve. If pure luciferase and
Signature Molecules 59
Ch03-P546807.qxd 11/18/06 6:15 PM Page 59
luciferin rather than firefly tails are used, the light output is extended and constant.Useful extracting reagents include combinations of anions (phosphate) and cationsthat adequately lyse cells, inhibit adsorption of the ATP to soil surfaces, and inhibitthe numerous soil ATPases. Most extraction reagents inhibit the luciferase reac-tion to some extent; therefore, the solution is diluted as much as possible beforemeasurement. A mixture consisting of phosphoric acid, urea, dimethyl sulfoxide,adenosine, EDTA, and polyoxyethylene-10-laryl ether is now often used. Totaladenylates (ATP, ADP, and AMP) can be measured after extraction with dimethylsulfoxide and a 0.01 M Na3PO4/0.02 M EDTA buffer by the HPLC (high-performanceliquid chromatography) method. During microbial growth, the C:ATP ratio canvary from 1000:1 to 40:1. In the resting state, the ATP:C:N:P:S ratios are usually1:250:40:9:2.6. ATP measures of both biomass and activity are influenced by thesoil P content. This method can be used most successfully to characterize soilswhose microbial population is mainly in the resting state at excess or constant Plevels. As such, it is a rapid and sensitive technique. The measurement of ATP con-tent relative to AMP and ADP plus ATP, (ATP � 0.5 � ADP)/(AMP � ADP �ATP), gives a measure of the adenylate energy charge of the soil biota.
MICROBIAL MEMBRANE COMPONENTS AND FATTY ACIDS
Lipids occur in microbial membranes and as storage products. More than 1000different individual lipids have been identified. Lipids can be extracted from the soilbiota with a one-phase chloroform methane extraction. Separation of the extractedlipids on silicic acid columns yields neutral lipids, glycolipids, and polar lipids.The neutral lipids can be further separated by HPLC, derivatization, and gas chro-matography to yield quinones, sterols, and triglycerides. Glycolipids, on hydrolysisand derivatization followed by gas chromatography, yield poly-β-hydroxybutyrate.The mixture of polymers can be analyzed to determine the nutritional status ofbacteria such as those associated with plant roots. Polar lipids are separated byhydrolysis, derivatization, and gas chromatography to yield phospholipid phos-phate, phospholipid glycerol, phospholipid fatty acids, and ether lipids (Table 3.4).Concentration of lipids in soil apart from those of microorganisms is low; the amountin organisms from different taxa is quite variable. It is thus difficult to relate thequantities extracted to biomass. Saponification and esterification after extractionfollowed by gas chromatography or HPLC produce a broad spectrum of the freeplus bound cell fatty acids. This is known as fatty acid methyl esters and is usefulin general community diversity analyses.
Phospholipids are found in the membranes of all living cells, but not in storageproducts, and are rapidly turned over upon cell death. They are therefore excellentsignature molecules. The phospholipid fatty acid (PLFA) technique has been used toelucidate different strategies employed by microorganisms to adapt to changed envi-ronmental conditions under a range of soil types, management practices, climaticorigins, and perturbations. PLFAs are extracted in single-phase solvent extractions
60 Chapter 3 Physiological and Biochemical Methods
Ch03-P546807.qxd 11/18/06 6:15 PM Page 60
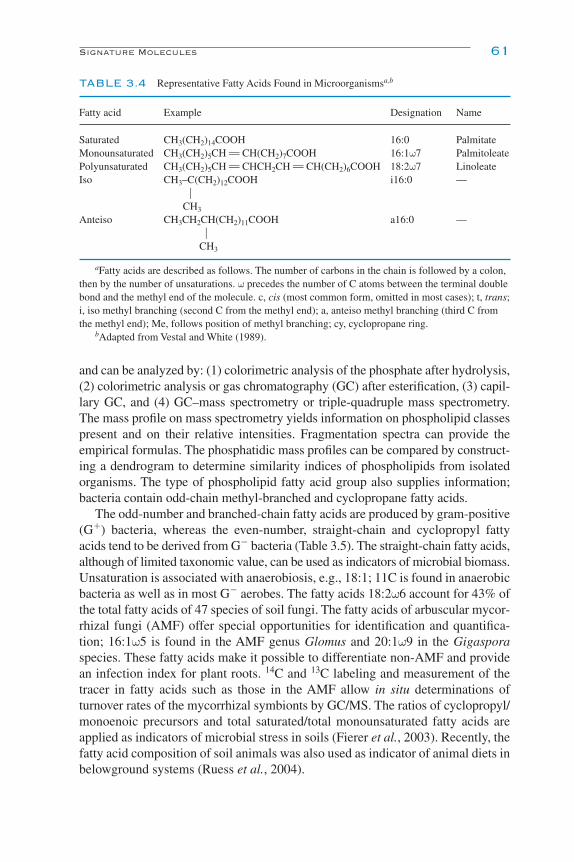
and can be analyzed by: (1) colorimetric analysis of the phosphate after hydrolysis,(2) colorimetric analysis or gas chromatography (GC) after esterification, (3) capil-lary GC, and (4) GC–mass spectrometry or triple-quadruple mass spectrometry.The mass profile on mass spectrometry yields information on phospholipid classespresent and on their relative intensities. Fragmentation spectra can provide theempirical formulas. The phosphatidic mass profiles can be compared by construct-ing a dendrogram to determine similarity indices of phospholipids from isolatedorganisms. The type of phospholipid fatty acid group also supplies information;bacteria contain odd-chain methyl-branched and cyclopropane fatty acids.
The odd-number and branched-chain fatty acids are produced by gram-positive(G�) bacteria, whereas the even-number, straight-chain and cyclopropyl fattyacids tend to be derived from G� bacteria (Table 3.5). The straight-chain fatty acids,although of limited taxonomic value, can be used as indicators of microbial biomass.Unsaturation is associated with anaerobiosis, e.g., 18:1; 11C is found in anaerobicbacteria as well as in most G� aerobes. The fatty acids 18:2ω6 account for 43% ofthe total fatty acids of 47 species of soil fungi. The fatty acids of arbuscular mycor-rhizal fungi (AMF) offer special opportunities for identification and quantifica-tion; 16:1ω5 is found in the AMF genus Glomus and 20:1ω9 in the Gigasporaspecies. These fatty acids make it possible to differentiate non-AMF and providean infection index for plant roots. 14C and 13C labeling and measurement of thetracer in fatty acids such as those in the AMF allow in situ determinations ofturnover rates of the mycorrhizal symbionts by GC/MS. The ratios of cyclopropyl/monoenoic precursors and total saturated/total monounsaturated fatty acids areapplied as indicators of microbial stress in soils (Fierer et al., 2003). Recently, thefatty acid composition of soil animals was also used as indicator of animal diets inbelowground systems (Ruess et al., 2004).
Signature Molecules 61
TABLE 3.4 Representative Fatty Acids Found in Microorganismsa,b
Fatty acid Example Designation Name
Saturated CH3(CH2)14COOH 16:0 PalmitateMonounsaturated CH3(CH2)5CH ¨ CH(CH2)7COOH 16:1ω7 PalmitoleatePolyunsaturated CH3(CH2)5CH ¨ CHCH2CH ¨ CH(CH2)6COOH 18:2ω7 LinoleateIso CH3–C(CH2)12COOH i16:0 —
ı
CH3
Anteiso CH3CH2CH(CH2)11COOH a16:0 —ı
CH3
aFatty acids are described as follows. The number of carbons in the chain is followed by a colon,then by the number of unsaturations. ω precedes the number of C atoms between the terminal doublebond and the methyl end of the molecule. c, cis (most common form, omitted in most cases); t, trans;i, iso methyl branching (second C from the methyl end); a, anteiso methyl branching (third C fromthe methyl end); Me, follows position of methyl branching; cy, cyclopropane ring.
bAdapted from Vestal and White (1989).
Ch03-P546807.qxd 11/18/06 6:15 PM Page 61

While PLFA profiling is a well-established method in soil ecology, phospho-lipid ether lipid (PLEL) analyses for the characterization of Archaea is a rathernew approach (Gattinger et al., 2003). PLEL-derived isoprenoid side chains aremeasured by GC/MS and provide a broad picture of the archaeal community in a mixed soil extract, because lipids identified in isolates belonging to theSubkingdom Eury- and Crenarchaeota are covered. Monomethyl-branched alka-nes dominate and account for 43% of the total identified ether-linked hydrocar-bons, followed by straight-chain (unbranched) and isoprenoid hydrocarbons,which account for 34.6 and 15.5%, respectively.
RESPIRATORY QUINONES AS A MEASURE OFSTRUCTURAL DIVERSITY
The quinone profile, which is represented as a molar fraction of each quinonetype in a soil, is a simple and useful tool to analyze population dynamics in soils;the total amount of quinones can be used as an indicator of microbial biomass (Fujieet al., 1998). Quinones are essential components in the electron transport systemsof most organisms and are present in the membranes of mitochondria and chloro-plasts. Isoprenoid quinones are chemically composed of benzoquinone (or naph-thoquinone) and an isoprenoid side chain (Fig. 3.1). There are two major groupsof quinones in soils: ubiquinones (1-methyl-2-isoprenyl-3,4-dimethoxypara-benzoquinone) and menaquinones (1-isoprenyl-2-methylnaphthoquinone). Thenomenclature of bacterial quinones is as follows: the abbreviation for the type ofquinone (ubiquinone, Q; menaquinone, MK) followed by a dash and the num-ber of isoprene units in its side chain and the number of hydrogen atoms in the
62 Chapter 3 Physiological and Biochemical Methods
TABLE 3.5 Marker Fatty Acids in the Phospholipid Fraction of Several Groups of Organisms
Fatty acid Organisms
16:1�9, 15:0, i15:0 Eubacteria in general, cyanobacteria, actinomycetesCy15:1 Clostridia16:0, 18:3ω3 Fungii16:0 Gram-positive bacteria16:1ω5 Cyanobacteria, AM fungi (e.g., Glomus)16:1ω7, 16:1ω7t Eubacterial aerobes16:1ω13t Green algaecy17:0, cy19:0 Eubacterial anaerobes, gram-negative bacteria17:1ω6, i17:1ω7 Sulfate-reducing eubacteria, actinomycetes18:1ω7 Eubacterial aerobes, gram-negative bacteria18:1ω9 Fungi, green algae, higher plants, gram-positive bacteria18:1ω11, 26:0 Higher plants18:2ω6 Eukaryotes, cyanobacteria, fungi18:3ω3, 18:3ω6 Fungi, green algae, higher plants20:1ω9 AM fungi (e.g., Gigasporea rosea)20:3ω6, 20:4ω6 Protozoa20:5, 22:6 Barophyllica, psychrophilic eubacteria
Ch03-P546807.qxd 11/18/06 6:16 PM Page 62
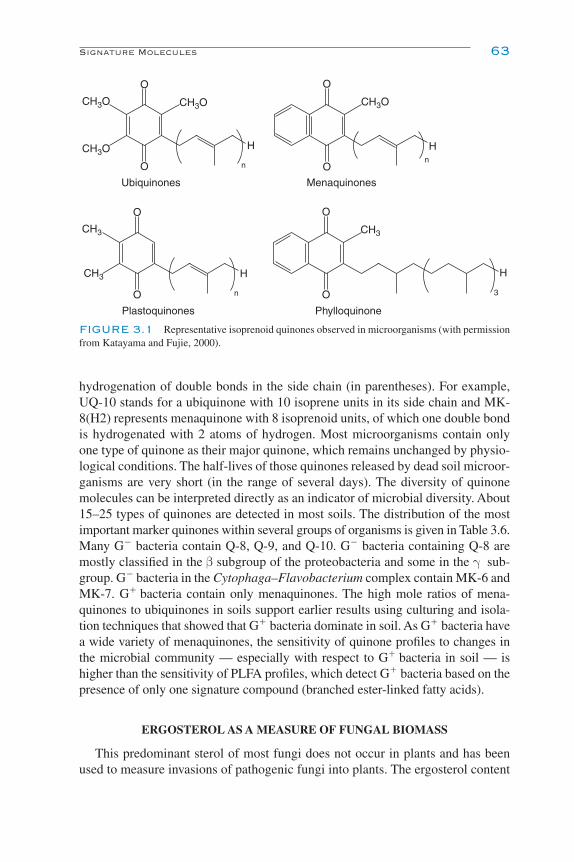
hydrogenation of double bonds in the side chain (in parentheses). For example,UQ-10 stands for a ubiquinone with 10 isoprene units in its side chain and MK-8(H2) represents menaquinone with 8 isoprenoid units, of which one double bondis hydrogenated with 2 atoms of hydrogen. Most microorganisms contain onlyone type of quinone as their major quinone, which remains unchanged by physio-logical conditions. The half-lives of those quinones released by dead soil microor-ganisms are very short (in the range of several days). The diversity of quinonemolecules can be interpreted directly as an indicator of microbial diversity. About15–25 types of quinones are detected in most soils. The distribution of the mostimportant marker quinones within several groups of organisms is given in Table 3.6.Many G� bacteria contain Q-8, Q-9, and Q-10. G� bacteria containing Q-8 aremostly classified in the β subgroup of the proteobacteria and some in the γ sub-group. G� bacteria in the Cytophaga–Flavobacterium complex contain MK-6 andMK-7. G� bacteria contain only menaquinones. The high mole ratios of mena-quinones to ubiquinones in soils support earlier results using culturing and isola-tion techniques that showed that G� bacteria dominate in soil. As G� bacteria havea wide variety of menaquinones, the sensitivity of quinone profiles to changes inthe microbial community — especially with respect to G� bacteria in soil — ishigher than the sensitivity of PLFA profiles, which detect G� bacteria based on thepresence of only one signature compound (branched ester-linked fatty acids).
ERGOSTEROL AS A MEASURE OF FUNGAL BIOMASS
This predominant sterol of most fungi does not occur in plants and has beenused to measure invasions of pathogenic fungi into plants. The ergosterol content
Signature Molecules 63
O
O
CH3O CH3O
CH3O H
n
Ubiquinones
CH3O
O
O
Hn
Menaquinones
O
O
CH3
CH3 H
n
Plastoquinones
CH3
O
O
H
3
Phylloquinone
FIGURE 3.1 Representative isoprenoid quinones observed in microorganisms (with permissionfrom Katayama and Fujie, 2000).
Ch03-P546807.qxd 11/18/06 6:16 PM Page 63

of soils indicates the extent of fungal membranes as well as fungal and ecto-mycorrhizal biomass. Ergosterol is extracted by methanol and detected using high-performance liquid chromatography with a UV detector. Since chromatographiccoelution might be a problem, reversed-phase liquid chromatography with positive-ion atmospheric pressure chemical ionization tandem mass spectrometrycan be used for full quantification and confirmation of ergosterol (Verma et al.,2002). The ergosterol content varies from 0.75 to 12.9 µg g�1 soil in arable, grass-land, and forest soils. These values correspond to 5 to 31 mg ergosterol g�1 fungaldry weight depending on species and growth conditions. The ratio of ergosterol tomicrobial biomass C is used as an index for fungal biomass to the total soil micro-bial biomass. Shifts in microbial community structure due to soil contaminationor changes in vegetation can be detected using the ergosterol to microbial biomassC ratio. In addition, the content of coprostanol, which is a sterol present aftersewage sludge disposal and contamination by municipal wastes, is a useful markerof human fecal matter contamination of soils.
LIPOPOLYSACCHARIDES, GLYCOPROTEINS, AND CELL WALLS
The outer cell membrane of G� bacteria contains unique lipopolysaccharidepolymers that can be used as biomarkers. The peptidoglycan of bacterial cell wallscontains N-acetylmuramic acid and diaminopimelic acid. Chitin, a polymer of N-acetylglucosamine, is found in many fungi. This compound is also present in theexoskeleton of invertebrates. The usefulness of chitin assays is limited by the need
64 Chapter 3 Physiological and Biochemical Methods
TABLE 3.6 Marker Quinones of Several Groups of Organismsa
Quinone Organisms
UbiquinonesQ-8 Gram-negative bacteria, mainly β-proteobacteria (Acinetobacter,
Alicaligenes, Enterobacteriaceae)Q-9 Gram-negative bacteria, mainly γ-proteobacteria, fungiQ-10 Gram-negative bacteriaQ-10(H2) FungiQ-10(H4) Fungi (Penicillium)
MenaquinonesMK-6 Gram-negative bacteria (Cytophaga–Flavobacterium),
δ- and ε-proteobacteriaMK-7 Gram-positive (low G � C contents, Bacillus) and gram-negative
bacteria (Cytophaga–Flavobacterium)MK-8 Gram-negative bacteria (Proteus, Enterobacter)MK-10(H6), MK-10(H8) Gram-positive bacteria, Streptomycineae, Micromonosporinae
in the Class of ActinobacteriaMK-10, MK-11, MK-12 Gram-positive bacteria (Agrococcus, Aureobacterium, Microbacterium)
aAdapted from Fujie et al. (1998), Katayama and Fujie (2000), and Hu et al. (2001).
Ch03-P546807.qxd 11/18/06 6:16 PM Page 64

for acid hydrolysis prior to analysis, the variability in the amount present, thepresence of chitin in a wide variety of other organisms, and its accumulation innonbiological soil components.
Arbuscular mycorrhizal fungi contain a recalcitrant AMF-specific glycoprotein,glomalin, in their cell walls, which can be quantified operationally in soils as glo-malin-related soil protein (Driver et al., 2005). An indirect immunofluorescenceassay is described by Wright (2000) to detect glomalin on AMF hyphae attachedto roots, in roots, on hyphae, and on the surfaces of soil aggregates. Since gloma-lin is a recalcitrant compound, this glycoprotein cannot be used as a signaturemolecule for living AMF.
GROWTH RATES FROM SIGNATURE MOLECULES
Growth and turnover rates can be determined by incorporating tracer isotopesof C into precursors of cytoplasmic constituents, membranes, or cell wall compo-nents. The increase in the tracer over short periods yields estimates of growth. Forexample, a technique to estimate relative fungal growth rates was based on theaddition of [14C]acetate to a soil slurry and measurement of the subsequent uptakeand incorporation of the labeled acetate into the fungus-specific sterol, ergosterol(Newell and Fallon, 1991). The specificity of this incorporation was shown byusing fungal and bacterial inhibitors. Incorporation rates were linear up to 18 hafter the acetate was added, but absolute growth rates could not be calculated dueto the uncertainty of conversion factors and problems associated with saturation ofthe incorporation of the added acetate. Similar techniques have also been devel-oped for C isotopes in microbial lipids. Fatty acids may also be used in combinationwith their role as biomarkers to monitor the C flux in a bacterial community bymeasuring the ratios of their C isotopes. Before fatty acids can be used as chemo-taxonomic markers and as indicators of substrate use in microbial communities,calibration studies on the degree and strain specificity of isotopic 13C fractionationwith regard to the growth substrate are necessary.
PHYSIOLOGICAL ANALYSES
A wide array of physiologically based soil processes are known, e.g., decom-position, ammonification, nitrification, denitrification, N2 fixation, P mineralization,and S transformations. These processes are described in detail in later chapters.Here I cover primarily culture-based studies, techniques to measure respiration,N-mineralization, and enzyme measurements.
CULTURE-BASED STUDIES
Culturing a soil organism involves transferring its propagules to a nutrientmedium conducive to its growth. Culture-based techniques allow specific soilmicroorganisms to be isolated from a wide range of soils. Culturing techniques
Physiological Analyses 65
Ch03-P546807.qxd 11/18/06 6:16 PM Page 65

are selective and designed to detect microorganisms with particular growth formsor biochemical capabilities. Bacterial cells from surfaces of soil particles andaggregates are liberated in sterile water, Windogradsky’s solution, or physiologicalsaline (0.85% NaCl). After extraction soil suspensions are diluted to an appropriateconcentration. The degree of dilution required is related to the initial number oforganisms (or propagules) in the soil. Serial dilutions, usually 1:10, stepwise, aremade, beginning with a known weight of wet soil. Aggregates are broken by briefmixing in a Waring blender, often in the presence of a dispersing agent such asNa4P2O7, prior to performing serial dilutions. Replicate 0.1-ml portions of appro-priate suspensions are transferred to solid or liquid medium in which individualpropagules develop into visible growth. After appropriate incubation, single colonieson solid media are counted, and each colony is equated with a single propagule inthe soil suspension (colony-forming unit).
The plate count of bacteria in soil, water, and sediment usually represents 1 to5% of the number determined by direct microscopy, leading to many discussionsconcerning viable but nonculturable bacteria in nature (Kjelleberg, 1993) and theusefulness of this method for quantitative soil microbiology. Plate count methodsare not suitable for enumerating fungal populations or densities because both indi-vidual spores and fragments of hyphae develop into colonies that are counted.Due to these strong limitations, many researchers doubt whether plate counts canbe used for quantification of soil microbiota.
Population densities of various groups of bacteria can be estimated by the mostprobable number (MPN) technique. This method uses a liquid medium to supportgrowth of soil microorganisms. The resulting dilution count is based on determiningthe highest soil dilution that will still provide visible growth in a suitable medium.An actual count of single cells or colonies is not necessary. Inoculating replicatetubes (10 usually, 5 minimum) from each of three successive serial dilutions at theestimated extinction boundary for growth enables resultant visual growth to be con-verted to numbers within statistical limits of reliability (Gerhardt et al., 1994). Com-puter software has been developed to determine MPN and related confidence limitsas well as to correct for biases (Klee, 1993). MPN methodology is useful because itallows a bacterial population to be estimated based on process-related attributessuch as nitrification by Nitrosomonas and Nitrobacter spp., denitrification by deni-trifiers, or nitrogen fixation by free-living aerobic and microaerophilic N2-fixingbacteria. The MPN technique requires an appropriate choice of growth medium andaccurate serial dilutions to obtain quantitative data. In general, the results are usuallyless precise than those obtained with direct plating methods and suffer from similarbiases due to the ability of cells to grow in artificial media.
ISOLATION AND CHARACTERIZATION OF SPECIFIC ORGANISMS
Specific, culturable organisms are usually isolated from soil by using liquid orsolid substrates. These can involve very general substrates from which individualcolonies are picked for further characterization. Also useful are media containing
66 Chapter 3 Physiological and Biochemical Methods
Ch03-P546807.qxd 11/18/06 6:16 PM Page 66
inhibitors such as chloramphenicol, tetracycline, and streptomycin, which inhibitprotein synthesis by binding to the 50S ribosomal subunit, or nalidixic acid, whichinhibits DNA synthesis of G� bacteria. Specific growth conditions include high orlow pH, aerobic or anaerobic, or high salinity. Plants are used to identify and enrichspecific soil populations. Growing compatible legumes in test soils makes it pos-sible to isolate and identify rhizobia from root nodules. Root or leaf pathogens andmycorrhizal fungi are often similarly enriched and identified. Isolations can beperformed without growth media by microscopic examination combined withmicromanipulators or optical laser tweezers, which can separate single cells,spores, or hyphal fragments.
Genetic markers that are incorporated into isolated organisms before soilreinoculation include antibiotic resistance, the lux operon for light emission, andgenes that code for specific enzyme activities. Resistance to most currently usedantibiotics is usually carried on a plasmid (see Chap. 5). The use of an appropri-ate vector makes it possible to transfer a plasmid containing an antibiotic resistancegene to soil isolates. These isolates can then be reintroduced into soil and recoveredby placing soil dilutions on the appropriate medium containing that antibiotic. Onlyorganisms carrying the antibiotic resistance gene(s) will be capable of growth.
Automated, multisubstrate approaches have been used as metabolic fingerprint-ing system. For example, the Biolog system makes it possible to test growth reac-tions of many isolates on a broad range of sole C substrate and to analyze thecommunity level respiratory response of culturable organisms in a soil sample. This,combined with the use of a broad range of known organisms and mathematical clus-tering techniques, allows researchers to characterize unknown organisms by sortingthem into affinity types occurring in a particular habitat. Because of their generallyoxidative and mycelial nature, it is not possible to characterize fungi using substrate-utilizing clustering analyses. A community-level physiological approach is based on soil dilutions into microtiter plates in which redoxdyes are added to multiple, single C substrates. This approach bypasses the need to work with isolated cultur-able organisms but still requires growth (reduction) on the appropriate substrate.Multiple substrate fingerprinting has limitations (like measuring an enzyme activityof a growing microbial population or the selectivity of the microbial response) andis controversial in soil microbiology.
SOIL ORGANIC MATTER DECOMPOSITION AND RESPIRATION
Heterotrophic microbial communities oxidize naturally occurring organic mate-rial such as carbohydrates according to the generalized equation
CH2O � O2 → CO2 � H2O � intermediates � cellular material � energy.
Under anaerobic conditions, the most common heterotrophic metabolic pathwayis that of fermentation, which in its simplest form is described as
C6H12O6 → 2 CH3CH2OH � 2 CO2 � intermediates� cellular material � energy.
Physiological Analyses 67
Ch03-P546807.qxd 11/18/06 6:16 PM Page 67
Measuring microbial activity is complex under anaerobic conditions. Fermen-tation products and CH4 produced within anaerobic microsites can diffuse to aer-obic areas, where oxidation to CO2 and H2O can occur. Microbial respiration isdetermined by measuring either the release of CO2 or the uptake of O2. Becausethe atmospheric CO2 concentration is only 0.036%, versus 20% for O2, measure-ments of CO2 production are more sensitive than those for O2. One method of CO2
measurement involves aeration trains; here, NaOH is used to trap evolved CO2
in an airstream from which CO2 is removed before the air is exposed to the soilsample. The reaction occurs as follows:
2 NaOH � CO2 → Na2CO3 � H2O.
Before titration, BaCl2 or SrCl2 is added to precipitate the CO32� as BaCO3 or
SrCO3, and excess NaOH is backtitrated with acid. The use of carbonic anhydraseand a double endpoint titration provides greater accuracy when CO2 concentra-tions are low. In the laboratory, NaOH containers placed in sealed jars are con-venient and effective for CO2 absorption. The jar must be opened at intervals sothat the O2 concentration does not drop below 10%. After incubation, the NaOHtrap is titrated as described above or the electric conductivity of the alkali trap ismeasured to calculate CO2 evolved. Gas chromatography can also be used to measuresoil respiration by placing soil samples in airtight, sealed containers and periodicallysampling the headspace gas to measure CO2 evolved. A gas chromatograph, witha thermal conductivity detector, is used to measure the CO2 concentration after CO2
is separated from other constituents on column materials such as Poropak Q.Computer-operated valves in conjunction with GC allow time-sequence studies tobe conducted automatically. Infrared gas analyzers are sensitive to CO2 and can beused for both static and flow systems in the laboratory and in the field after H2O,which adsorbs in the same general wavelength, has been removed. The results areexpressed either per unit of soil dry weight (µg CO2–C g�1 soil h�1) or per unit ofmicrobial biomass (mg CO2–C g�1Cmic h�1). The ratio of respiration to microbialbiomass is termed the metabolic quotient (qCO2) and is in the range of 0.5–3 mgCO2–C g�1 Cmic h�1. The metabolic quotient is particularly useful in differentiatingthe response of soil biota to sustainable soil management practices. For example,stress, heavy metal pollution, and nutrient deficiency increase qCO2 becausemicrobial biomass decreases and respiration increases.
The measurement of CO2 can also be augmented by incorporating 14C or 13Cinto chosen substrates. The tracer may be known molecules such as glucose, cel-lulose, amino acids, or herbicides or complex materials such as microbial cells orplant residues. The CO2 respired is trapped in alkali as described above. Themeasurement of 14CO2 or 13CO2 allows the calculation of the decomposition rateof soil organic matter as well as establishing a balance of the C used in growth rel-ative to substrate decomposition and microbial by-products. A mass spectrometer
68 Chapter 3 Physiological and Biochemical Methods
Ch03-P546807.qxd 11/18/06 6:16 PM Page 68
capable of directly analyzing a gaseous sample for 13CO2 is preferable to the pre-cipitation procedure.
Field studies can be performed by placing an airtight chamber on the soil surfaceto measure CO2 in situ. This procedure does not alter the soil structure and, therefore,field respiration rates of the indigenous microbial population are more reliablymeasured. Gas samples are taken from the field chamber using a gastight syringe andthen injected into a gas chromatograph or infrared analyzer. Measurement of N2Oand CH4 from the same samples is possible. Recently, a new sampling technique wasdeveloped to monitor trace gases (CO2, CH4, and N2O) below the soil surface atwell-defined depths (Kammann et al., 2001). Probes are constructed from siliconetubing closed with silicone septa on both ends, thereby separating an inner air spacefrom the outer soil atmosphere without direct contact (Fig. 3.2). Gas exchangebetween the inner and the outer atmosphere takes place by diffusion through thewalls of the silicone tube. The advantage of this method is that the silicone probeenables trace gas sampling in wet and waterlogged soils. In general, respirationmeasurements in the field show much higher analytical variability than those inthe laboratory. This is due to higher spatial variability of chemical and physicalsoil properties and to more variable environmental conditions. Since both soilmicroorganisms and plant roots contribute to the overall CO2 production in fields,CO2 release in the field has been viewed as a measure of the gross soil metabolicactivity.
The net ecosystem exchange (NEE) rate of CO2 represents the balance of grossprimary productivity and respiration in an ecosystem. The eddy covariance tech-nique is used to measure the NEE. The covariance between fluctuations in verticalwind velocity and CO2 mixing ratio across the interface between the atmosphereand a plant canopy is measured at a flux tower (Baldocchi, 2003). Although fluxtower data represent point measurements with a footprint of typically 1 � 1 km theycan be used to validate models and to spatialize biospheric fluxes at the regional scale(Papale and Valentini, 2003).
Soil organic matter decomposition in the field can be examined by followingthe decay process (i.e., weight loss) of added litter. Site-specific litter or standardlitter (e.g., wheat straw) is placed in nylon mesh bags, which are placed on or justbelow the soil surface. Organic matter decomposition can also be followed easilyby using a minicontainer-system (Fig. 3.3). The system consists of polyvinylchlo-ride bars as carriers and minicontainers enclosing the straw material, which can beexposed horizontally or vertically in topsoils as well as on the soil surface. Theminicontainers are filled with 150 to 300 mg of organic substrate and closed bynylon mesh of variable sizes (20 µm, 250 µm, 500 µm, or 2 mm) to exclude orinclude the faunal contribution to organic matter decomposition. After an expo-sure time of several weeks to months, organic matter decomposition is calculatedbased on the weight loss of the oven-dried material, taking into consideration theash content of the substrate. An analysis of the time series allows the dynamics ofdecomposition processes to be investigated.
Physiological Analyses 69
Ch03-P546807.qxd 11/18/06 6:16 PM Page 69

70 Chapter 3 Physiological and Biochemical Methods
60 50 40 30 20 10
Stopper
Flexible side wall of the septum
Silicone septum, side wall rolled up
Silicone coiled tube
Three-way stopcock, closed
Stainless steel tube(3.175 mm outer diameter)
(A)
(B)
Steel tool with knife blade
Horizontal cavity
Soil air probe Probe in place andsoil partly restored
1 2 3
FIGURE 3.2 (A) Sampling technique to monitor concentrations of CH4, NO2, and CO2 in air atwell-defined depths using a silicone soil air probe fitted with one stainless steel tube connection. Theflat silicone coil is fixed with wire mesh (not shown) to maintain the flat “snail” form. The silicone sep-tum used for the steel tube connection has flexible side walls that can be rolled up and pulled over thesilicone tubing to ensure better fixing. (B) Insertion of silicone probe into the soil. After a hole of ade-quate size is dug (1), the silicone probe is inserted into the hole. After insertion the pit is filled with pre-viously removed soil. Silicone probes can be installed at different soil depths and can also be used inwet or even waterlogged soils (with permission from Kammann et al., 2001).
Ch03-P546807.qxd 11/18/06 6:16 PM Page 70
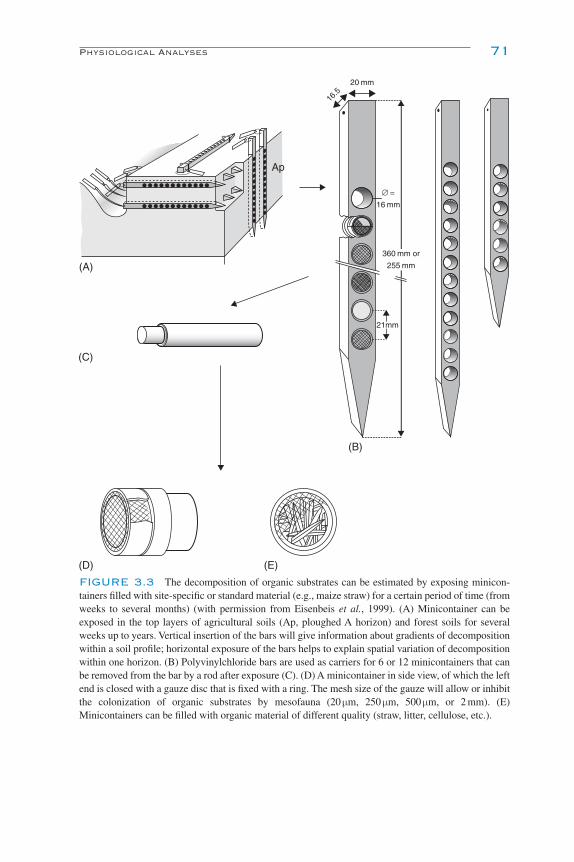
Physiological Analyses 71
Ap
(A)
(C)
(D) (E)
(B)
21mm
360 mm or
255 mm
20 mm
16.5
∅ =
16 mm
FIGURE 3.3 The decomposition of organic substrates can be estimated by exposing minicon-tainers filled with site-specific or standard material (e.g., maize straw) for a certain period of time (fromweeks to several months) (with permission from Eisenbeis et al., 1999). (A) Minicontainer can beexposed in the top layers of agricultural soils (Ap, ploughed A horizon) and forest soils for severalweeks up to years. Vertical insertion of the bars will give information about gradients of decompositionwithin a soil profile; horizontal exposure of the bars helps to explain spatial variation of decompositionwithin one horizon. (B) Polyvinylchloride bars are used as carriers for 6 or 12 minicontainers that canbe removed from the bar by a rod after exposure (C). (D) A minicontainer in side view, of which the leftend is closed with a gauze disc that is fixed with a ring. The mesh size of the gauze will allow or inhibitthe colonization of organic substrates by mesofauna (20 µm, 250 µm, 500 µm, or 2 mm). (E)Minicontainers can be filled with organic material of different quality (straw, litter, cellulose, etc.).
Ch03-P546807.qxd 11/18/06 6:16 PM Page 71
NITROGEN MINERALIZATION
Nitrogen mineralization is estimated in field or laboratory experiments as therelease of inorganic N from organic residues of soil organic matter. Alternatively,specific steps of the N mineralization can be estimated (e.g., arginine deaminase,urease, ammonia monooxygenase). Nitrogen availability is measured using aero-bic and anaerobic incubation tests as well as soil inorganic N measurements. Therecommended methods differ in incubation time and temperature, moisture con-tent, and extraction of ammonium and nitrate. Frequently, soils are incubatedunder aerobic conditions and analyzed for ammonium, nitrite, and nitrate beforeand after incubation. Since ammonium is partly immobilized into the microbialbiomass during incubation, these incubation methods yield the net production ofammonium and nitrate. Isotope pool dilution techniques enable gross rates ofnitrification (or mineralization) to be determined by monitoring the decline in the15N abundance in a nitrate or ammonium pool, labeled at t � 0, and receivingunlabeled nitrogen via nitrification or mineralization, respectively (Murphy et al.,2003). Labeled N can be applied as 15NH4
� solution or injected as 15NH3 gas intosoil. The use of 15N pool dilution and enrichment can also be used to separate theheterotrophic and autotrophic pathways of nitrification. An isotopic dilutionexperiment using 14NH4
15NO3 yielded rates of nitrification by the combined auto-trophic and heterotrophic paths. A parallel isotope dilution experiment with15NH4
15NO3 provided the gross mineralization rate and the size and 15N abundanceof the nitrate pool at different time intervals. Spatial variability of the tracer additionand extraction must be taken into account in interpreting such data.
ACTIVITIES AND LOCATIONS OF ENZYMES
Enzymes are specialized proteins that combine with a specific substrate and actto catalyze a biochemical reaction. In soils, enzyme activities are essential forenergy transformation and nutrient cycling. The enzymes commonly extractedfrom soil, and their range of activities, are given in Table 3.7. Some enzymes (e.g.,urease) are constitutive and routinely produced by cells; others such as cellulaseare adaptive or induced, being formed only in the presence of a compatible sub-strate or some other initiator or in the absence of an inhibitor. Dehydrogenases areoften measured because they are found only in living systems. Enzymes associ-ated with proliferating cells occur in the cytoplasm, the periplasm, and the cellmembrane. Figure 3.4 shows that soil enzymes are not only associated with prolif-erating cells but also associated, as extracellular enzymes, with humic colloidsand clay minerals.
Standardized methods for a broad range of enzymes are described by Tabatabai(1994), Alef and Nannipieri (1995), and Schinner et al. (1996). A general intro-duction to enzymes in the environment and their activity, ecology, and applica-tions is given by Burns and Dick (2002). This section will focus primarily on
72 Chapter 3 Physiological and Biochemical Methods
Ch03-P546807.qxd 11/18/06 6:16 PM Page 72

colorimetric and fluorimetric techniques to measure enzyme activities in soils andon some approaches to visualize the location of soil enzymes. Since many of theenzymes that are frequently measured can be intracellular, extracellular, bound,and/or stabilized within their microhabitat, assay results must be interpreted withcaution. Therefore, most assays determine enzymatic potential and not necessar-ily the activity of proliferating microorganisms.
SPECTROPHOTOMETRIC METHODS
Many substrates and products of enzymatic reactions absorb light either in thevisible or in the ultraviolet region of the spectrum or can be measured by a simplecolor reaction. Due to their higher sensitivity, methods based on the analysis of thereleased product are more frequently used than methods based on the analysis ofsubstrate depletion. Analyzing enzyme activities involves incubating soils with
Activities and Locations of Enzymes 73
TABLE 3.7 Some Enzymes Extracted from Soils, the Reactions They Catalyze, and TheirRanges of Activitya
Enzyme Reaction Range of activity
Cellulase Endohydrolysis of 1,4-β-glucosidic 0.4–80.0 µM glucose g–124 h–1
linkages in cellulose, lichenin, andcereal β-glucose
β-Fructofuranosidase Hydrolysis of terminal nonreducing 0.61–130 µM glucose g–1 h–1
(invertase) β-D-fructofuranoside residues in β-fructofuranosides
β-Glucosidase Hydrolysis of terminal, nonreducing 0.09–405 µM p-nitrophenol g–1 h–1
β-D-glucose residues with releaseof β-D-glucose
Proteinase Hydrolysis of proteins to peptides 0.5–2.7 µM tyrosine g–1 h–1
and amino acids
Urease Hydrolysis of urea to CO2 and NH4� 0.14–14.3 µM N–NH3 g–1h–1
Alkaline phosphatase Orthophosphoric monoester � 6.76–27.3 µM p-nitrophenol g–1 h–1
H2O → an alcohol �
orthophosphate
Acid phosphatase Orthophosphoric monoester � 0.05–86.3 µM p-nitrophenol g–1 h–1
H2O → an alcohol �
orthophosphate
Arylsulfatase A phenol sulfate � H2O → 0.01–42.5 µM p-nitrophenol g–1 h–1
a phenol � sulfate
Catalase 2 H2O2 → O2 � 2H2O 61.2–73.9 µM O2 g–1 24 h–1
aAdapted from Tabatabai and Fung (1992) and Nannipieri et al. (2002).
Ch03-P546807.qxd 11/18/06 6:16 PM Page 73

Resting structure
Living cell
Dead intact cell
Dead disintegratedcell
Clay-enzyme complexHumus-enzyme complex
Extracellular enzymes
Enzyme-substratecomplex
(v)
(ii)
(l)(i)
(vii)
Secretion
Growth
/Divi
sion
(iii)
(vii)
(vi)
(vi)
(vii)
Clay minerals
Adsorbed enzymesEntrapped enzymes
(viii)
(ix)(x)
Humic acidsLiving cells
Release(iv)
LysisDeath
Lysis
FIGURE 3.4 Locations of enzymes (from Burns, 1982, adapted by Klose, 2003). (i) Intracellular enzymes. (ii) Periplasmaticenzymes. (iii) Enzymes attached to outer surface of cell membranes. (iv) Enzymes released during cell growth and division. (v)Enzymes within nonproliferating cells (spores, cysts, seeds, endospores). (vi) Enzymes attached to dead cells and cell debris. (vii)Enzymes leaking from intact cells or released from lysed cells. (viii) Enzymes temporarily associated in enzyme– substrate complexes.(ix) Enzymes absorbed to surfaces of clay minerals. (x) Enzymes complexed with humic colloids. (Reproduced with permission fromTaylor & Francis Group, LLC.)
Ch03-P546807.qxd 11/18/06 6:16 PM Page 74
the respective substrate at specific temperature, pH, and time; subsequentlyextracting the product; and then colorimetrically determining its concentration.
Dehydrogenases, which are intracellular enzymes catalyzing oxidation–reductionreactions, can be detected using a water-soluble, almost colorless tetrazolium salt,which forms a reddish formazan product after an incubation period of severalhours. A commonly used tetrazolium salt is 2-(p-iodophenyl)-3-(p-nitrophenyl)-5-phenyltetrazolium chloride (INT), which is transformed into an intensely col-ored, water-insoluble formazan (INT-formazan). The production of INT-formazancan be detected spectrophotometrically by quantifying total INT-formazan produc-tion. Another enzyme assay system used to reflect general or total microbial activ-ity in soil samples is based on the hydrolysis of fluorescein diacetate. Fluoresceindiacetate is hydrolyzed by a wide variety of enzymes including esterases, pro-teases, and lipases.
Enzymes involved in C cycling (xylanase, cellulase, invertase, and trehalase)are measured based on the release of sugars after incubating soils with a bufferedsolution (pH 5.5) containing their corresponding substrates (xylan, carboxymethyl-cellulose, sucrose, or trehalose). The incubation period depends on the substrateused: high-molecular-weight substrates are incubated for 24 h, whereas low-molecular-weight substrates are incubated for only 1 to 3 h. Reducing sugarsreleased during the incubation period cause the reduction of potassium hexa-cyanoferrate(III) in an alkaline solution. Reduced potassium hexacyanoferrate(II)reacts with ferric ammonium sulfate in an acid solution to form a complex of ferrichexacyanoferrate(II) (Prussian blue), which is determined colorimetrically.
Enzymes involved in P cycling (phosphomonoesterase, phosphodiesterase,phosphotriesterase) are preferably determined after the addition of a substrateanalog, p-nitrophenyl phosphate. Phosphomonoesterase hydrolyzes the phosphate–ester bond of the p-nitrophenyl phosphate, and the p-nitrophenol released is yellowunder alkaline conditions. The concentration can be determined spectrophotomet-rically against a standard curve. For determining arylsulfatase, which catalyzesthe hydrolysis of organic sulfate esters, p-nitrophenyl sulfate is used as a substrateanalog. The widespread use of p-nitrophenyl substrates for different enzymeassays is due to the possibility of quantitatively extracting the released product p-nitrophenol. Urease is an important extracellular enzyme that hydrolyzes urea intoCO2 and NH3. The urease assay involves measuring the released ammonia either bya colorimetric procedure or by steam distillation followed by a titration assay ofammonia.
FLUORESCENCE METHODS
Fluorogenic substrates are used to assay extracellular enzymes in aquatic andterrestrial environments. These substrates contain an artificial fluorescent mole-cule and one or more natural molecules (e.g., glucose, amino acids) and they arelinked by a specific binding (e.g., peptide binding, ester binding). The substratesused are conjugates of the highly fluorescent compounds 4-methylumbelliferone
Activities and Locations of Enzymes 75
Ch03-P546807.qxd 11/18/06 6:16 PM Page 75
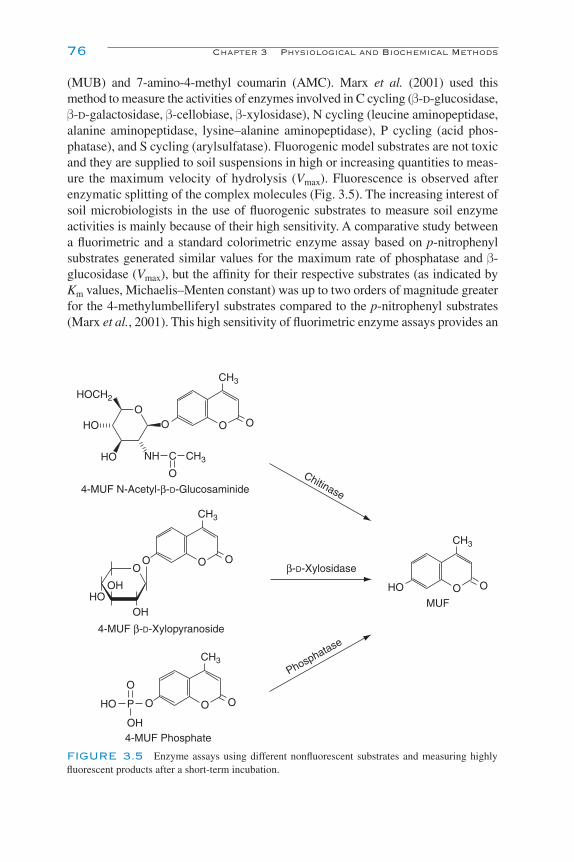
(MUB) and 7-amino-4-methyl coumarin (AMC). Marx et al. (2001) used thismethod to measure the activities of enzymes involved in C cycling (β-D-glucosidase,β-D-galactosidase, β-cellobiase, β-xylosidase), N cycling (leucine aminopeptidase,alanine aminopeptidase, lysine–alanine aminopeptidase), P cycling (acid phos-phatase), and S cycling (arylsulfatase). Fluorogenic model substrates are not toxicand they are supplied to soil suspensions in high or increasing quantities to meas-ure the maximum velocity of hydrolysis (Vmax). Fluorescence is observed afterenzymatic splitting of the complex molecules (Fig. 3.5). The increasing interest ofsoil microbiologists in the use of fluorogenic substrates to measure soil enzymeactivities is mainly because of their high sensitivity. A comparative study betweena fluorimetric and a standard colorimetric enzyme assay based on p-nitrophenylsubstrates generated similar values for the maximum rate of phosphatase and β-glucosidase (Vmax), but the affinity for their respective substrates (as indicated byKm values, Michaelis–Menten constant) was up to two orders of magnitude greaterfor the 4-methylumbelliferyl substrates compared to the p-nitrophenyl substrates(Marx et al., 2001). This high sensitivity of fluorimetric enzyme assays provides an
76 Chapter 3 Physiological and Biochemical Methods
OO
O O
CH3
HOCH2
HO
HO NH CH3C
O
4-MUF N-Acetyl-β-D-Glucosaminide
4-MUF Phosphate
O O O
CH3
HO P
O
OH
4-MUF β-D-Xylopyranoside
OO O O
CH3
OH
OHHO
HO O O
CH3
MUF
Phosphatase
Chitinase
β-D-Xylosidase
FIGURE 3.5 Enzyme assays using different nonfluorescent substrates and measuring highlyfluorescent products after a short-term incubation.
Ch03-P546807.qxd 11/18/06 6:16 PM Page 76

opportunity to detect enzyme activities of small sample sizes (e.g., microaggre-gates and rhizosphere samples) and/or low activity (e.g., samples of subsoil, peat, and soil solutions). The development of an improved automated assay usinga 96-well microplate reader provides a convenient system for processing largenumbers of different samples; it also allows the activity rates to be measured for arange of enzymes in a number of soils with an appropriate number of replicates(Vepsäläinen et al., 2001). Alternatively, a multiple-substrate approach is avail-able, which is based on the simultaneous measurement of seven enzyme activitiesestimated after incubation, separation of the nonhydrolyzed 4-MUF and 7-AMCsubstrates by HPLC, and quantification by UV-absorption at 320 nm (Stemmer,2004).
TECHNIQUES FOR IMAGING THE LOCATION OF ENZYMES
Thin-section techniques are combined with histochemical and imaging tech-niques to visualize the location of enzymes and their activities. Early papers byFoster et al. (1983) showed peroxidase, succinic dehydrogenase, and acid phos-phatase bound to roots, bacterial cell walls, and organic matter in soil by usingeither transmission electron microscopy or scanning electron microscopy. In thefuture, atomic force microscopy, which measures small-scale surface topographicalfeatures, will help us to understand enzyme–clay interactions. Confocal microscopyhas the potential to reconstruct the detailed three-dimensional distribution ofenzyme proteins in soils.
Enzymatic properties of single cells have been screened in the aquatic environ-ment, biofilms, and activated sludge by a new type of fluorogenic compound, ELF-97 (Molecular Probes, Eugene, OR, USA), which is combined with sugar, aminoacid, fatty acid, or inorganic compounds such as sulfate or phosphate. This substrateis converted to a water-insoluble, crystalline, fluorescent product at the site of enzy-matic hydrolysis, thus reporting the location of active enzymes when viewed byfluorescence microscopy. Kloeke and Geesey (1999) combined this technique witha 16S rRNA oligonucleotide probe specific for the Cytophaga–Flavobacteria groupto prove the importance of these microorganisms in liberating inorganic orthophos-phate in discrete, bacteria-containing areas of the floc matrix in aerobic activatedsludge (Fig. 3.6). Phosphatase activity was primarily localized in the immediatevicinity of the bacterial cells rather than dispersed throughout the floc or associatedwith rotifers (see Figs. 3.6A and 3.6B). These new substrates have the potential to beused for visualizing the location of enzyme activities in microenvironments in soil.
FUNCTIONAL DIVERSITY
Microbial diversity reflects the variation in species assemblages within a com-munity. A broader view of functional diversity has advanced our understanding of
Functional Diversity 77
Ch03-P546807.qxd 11/18/06 6:16 PM Page 77

the significance of biodiversity to biochemical cycling. This includes several levelsof resolution: (1) the importance of biodiversity to specific biogenic transformations,(2) the complexity and specificity of biotic interactions in soils that regulate biogeo-chemical cycling, and (3) how biodiversity may operate at different hierarchically
78 Chapter 3 Physiological and Biochemical Methods
(A) (D)
(E)
(F)
(B)
(C)
20 µm
FIGURE 3.6 (A) Phase-contrast photomicrograph of activated sludge floc material and associ-ated microorganisms. Arrows indicate protozoa grazing on the floc particles. (B) Epifluorescence pho-tomicrograph of the same field of view as in (A) of whole floc material revealing the areas of intensephosphatase activity (yellow spots where ELF crystals have precipitated, arrow). (C) Epifluorescencephotomicrograph of thin section of a floc particle stained red-orange with acridine orange, revealingdiscrete regions within the floc displaying phosphatase activity (green spots) as a result of incubationin the presence of ELP-P. (D) Epifluorescence photomicrograph image of a homogenized activated sludgefiltrate showing floc bacteria from the Cytophaga–Flavobacteria group by using a filter combinationthat reveals cells that react with CF319a oligonucleotide probe (red). (E) Epifluorescence photomicro-graph of the same field of view as in (D) using a filter combination that resolves crystals of ELF (greenspots), indicating areas of phosphatase activity. (F) Merged image of (D) and (E), revealing the sub-population of cells that react positively with the CF319a and also display phosphatase activity (accord-ing to Kloeke and Geesey, 1999; pictures are reproduced with the permission of Springer-Verlag).
Ch03-P546807.qxd 11/18/06 6:16 PM Page 78
arranged spatial and temporal scales to influence ecosystem structure and function(Beare et al., 1995). Most methods used for measuring functional diversity con-sider only the importance of biodiversity of those groups that regulate biochemi-cal cycling. Several approaches enable functional diversity to be measured insituations in which taxonomic information is poor. These include using binarybiochemical and physiological descriptors to characterize isolates, evaluatingenzymatic capabilities for metabolizing particular substrates, extracting DNA andRNA from the soil, and probing genes that code for functional enzymes. Recentadvances in genomic analysis and stable isotope probing are the first steps towardresolving a better linkage between structure and function in microbial communi-ties (see also Chaps. 4, 7, and 8).
Commercially available Biolog bacterial identification system plates or community-level physiological profiles (CLPP) have been used to assess functionaldiversity of microorganisms, based on utilization patterns of a wide range (up to128) of individual C sources. The culturable subpart of the microbial community,which exhibits the fast growth rates typical of r-strategists, primarily contributesto CLPP analysis. Preston-Mafham et al. (2002) assessed the pros and cons of itsuse and point out inherent biases and limitations and possible ways of overcom-ing certain difficulties. A modification of the SIR method (Degens and Harris,1997) involves determining patterns of in situ catabolic potential as a measure offunctional diversity. These profiles are determined by adding a range of simple Csubstrates to the soils and measuring short-term respiration response. The use ofwhole soil in a microplate assay as described by Campbell et al. (2003) can alsobe used to explore the metabolic capacity of the soil microbial community. Analternative approach was proposed by Kandeler et al. (1996), using the prognos-tic potential of 16 soil microbial properties, including microbial biomass, soil res-piration, N-mineralization, and analyses for 13 soil enzymes involved in cyclingof C, N, P, and S. Multivariate statistical analysis is used to calculate the func-tional diversity from measured soil microbial properties. The latter approach isbased on the following assumptions: The composition of the microbial speciesassemblage (taxonomic diversity) determines the community’s potential forenzyme synthesis. The actual rate of enzyme production and the fate of producedenzymes are modified by environmental effects as well as by ecological interac-tions. The spectrum and amount of active enzymes are responsible for the func-tional capability of the microbial community irrespective of being active inside oroutside the cell. Presence or absence of a certain function, as well as the quantifi-cation of the potential of the community to realize this function, has to be consid-ered in ecological studies. This approach may permit evaluation of the status ofchanged ecosystems (e.g., by soil pollution, soil management, global change)while providing insight into the functional diversity of the soil microbial commu-nity of the undisturbed habitat.
Physiological methods are applied to understand the physiology of single cellsand soil biological communities, as well as biogeochemical cycling in terrestrialecosystems. Small-scale studies explain biological reactions in aggregates, in the
Functional Diversity 79
Ch03-P546807.qxd 11/18/06 6:16 PM Page 79
rhizosphere, or at the soil–litter interface. Combining physiological and molecularmethods helps us to understand gene expression, protein synthesis, and enzymeactivities at the micro- and nanoscales. Linking these methods can also explainwhether the abundance and/or the function of organisms is affected by soil man-agement, environmental change, or soil pollution.
At the field scale, researchers use biochemical and physiological methods toinvestigate the functional response of soil organisms to the manipulation orpreservation of soils. These applications include microbe–plant interactions andcontrolling plant pathogens, as well as understanding organic matter decomposi-tion and its impact on local and global C and N cycling. Soil biologists investigatethe effects of soil management (tillage, fertilizer, pesticides, crop rotation) or dis-turbance on the function of soil organisms. In many cases, soil microbial biomassand/or soil microbial processes can be early predictors of the effects of soil man-agement on soil quality and can indicate the expected rapidity of these changes.Monitoring of soil microbial properties is also included in environmental studiesthat test the use of soil microorganisms in bioremediation and composting. Futurechallenges in functional soil microbiology are to use our present knowledge toscale-up these data to the regional and global scale.
REFERENCES AND SUGGESTED READING
Alef, K., and Nannipieri, P. (1995). “Methods in Applied Soil Microbiology and Biochemistry.”Academic Press, San Diego.
Anderson, J. P. E., and Domsch, K. H. (1978). A physiological method for the quantitative measure-ment of microbial biomass in soils. Soil Biol. Biochem. 10, 215–221.
Bååth, E., and Anderson, T. H. (2003). Comparison of soil fungal/bacterial ratios in a pH gradientusing physiological and PLFA-based techniques. Soil Biol. Biochem. 35, 955–963.
Baldocchi, D. D. (2003). Assessing the eddy covariance technique for evaluating carbon dioxideexchange rates of ecosystems: past, present and future. Global Change Biol. 9, 479–492.
Beare, M. H., Coleman, D. C., Crossley, D. A., Hendrix, P. F., and Odum, E. P. (1995). A hierarchicalapproach to evaluating the significance of soil biodiversity to biochemical cycling. Plant Soil170, 5–22.
Beck, T., Joergensen, R. G., Kandeler, E., Makeschin, F., Nuss, E., Oberholzer, H. R., and Scheu, S.(1997). An inter-laboratory comparison of ten different ways of measuring soil microbial biomass C.Soil Biol. Biochem. 29, 1023–1032.
Bloem, J., Bolhuis, P. R., Vininga, R. M., and Wierenga, J. (1995). Microscopic methods to estimatethe biomass and activity of soil bacteria and fungi. In “Methods in Soil Microbiology andBiochemistry” (K. Alef and P. Nannipieri, eds.). Academic Press, New York.
Boutton, T. W., and Yamasaki, S.-I. (1996). “Mass Spectrometry of Soils.” Dekker, New York.Burlage, R. S., Atlas, R., Stahl, D., Geesey, G., and Sayler, G. (1998) “Techniques in Microbial
Ecology.” Oxford Univ. Press, New York/Oxford.Burns, R. G. (1982). Enzyme activity in soil: location and possible role in microbial ecology. Soil Biol.
Biochem. 14, 423–427.Burns, R. G., and Dick, R. P. (2002). “Enzymes in the Environment—Activity, Ecology, and
Applications.” Dekker, New York.Brookes, P. C., Landman, A., Puden, G., and Jenkinson, D. S. (1985). Chloroform fumigation and the
release of soil nitrogen: a rapid direct extraction method to measure microbial biomass nitrogen insoil. Soil Biol. Biochem. 17, 837–842.
80 Chapter 3 Physiological and Biochemical Methods
Ch03-P546807.qxd 11/18/06 6:16 PM Page 80

Campbell, C. D., Chapman, S. J., Cameron, C. M., Davidson, M. S., and Potts, J. M. (2003). A rapidmicrotiter plate method to measure carbon dioxide evolved from carbon substrate amendments soas to determine the physiological profiles of soil microbial communities by using whole soil. Appl.Environ. Microbiol. 69, 3593–3599.
Coleman, D. C., and Fry, B., eds. (1991). “Carbon Isotope Techniques.” Academic Press, San Diego.Degens, B. P., and Harris, J. A. (1997). Development of a physiological approach to measuring the
catabolic diversity of soil microbial communities. Soil Biol. Biochem. 29, 1509–1320.Driver, J. D., Holben, W. E., and Rillig, M. C. (2005). Characterization of glomalin as a hyphal wall
component of arbuscular mycorrhizal fungi. Soil Biol. Biochem. 37, 101–106.Eisenbeis, G., Lenz, R., and Heiber, T. (1999). Organic residue decomposition: the minicontainer-
system—a multifunctional tool in decomposition studies. Environ. Sci. Pollut. R. 6, 220–224.Ettema, C. H., and Wardle, D. A. (2002). Spatial soil ecology. Trends Ecol. Evol. 17, 177–183.Fierer, N., Schimel, J. P., and Holden, P. A. (2003). Variations in microbial community composition
through two soil depth profiles. Soil Biol. Biochem. 35, 167–176.Foster, R. C., Rovira, A. D., and Cock, T. W. (1983). “Ultrastructure of the Root–Soil Interface.”
Am. Phytopathol. Soc., St. Paul, MN.Frankland, J. C., Dighton, J., and Boddy, L. (1991). Fungi in soil and forest litter. In “Methods in Micro-
biology” (R. Grigorova and J. R. Norris, eds.), Vol. 22, pp. 344–404. Academic Press, London.Fujie, K., Hu, H. K., Tanaka, H., Urano, K., Saitou, K., and Katayama, A. (1998). Analysis of respira-
tory quinones in soil for characterization of microbiota. Soil Sci. Plant Nutr. 44, 393–404.Gattinger, A., Gunther, A., Schloter, M., and Munch, J. C. (2003). Characterisation of Archaea by polar
lipid analysis. Acta Biotechnol. 23, 21–28.Gerhardt, P. G., Murray, R. G. E., Wood, W. A., and Krieg, N. R. (1994). “Methods for General and
Molecular Bacteriology.” Am. Soc. Microbiol., Washington, DC.Grigorova, R., and Norris, J. R., eds. (1991). “Methods in Microbiology,” Vol. 22. Academic Press,
London.Harris, D., Voroney, R. P., and Paul, E. A. (1997). Measurement of microbial biomass N:C by chloro-
form fumigation-incubation. Can. J. Soil Sci. 77, 507–514.Herbert, R. A. (1991). Methods for enumerating microorganisms and determining biomass in natural
environments. In “Methods in Microbiology” (R. Grigorova and J. R. Norris, eds.), Vol. 22, pp. 1–39. Academic Press, London.
Horwath, W. R., Paul, E. A., Harris, D., Norton, J., Jagger, L., and Horton, K. A. (1996). Defining arealistic control for the chloroform fumigation–incubation method. Can. J. Soil Sci. 76, 459–467.
Hu, H. Y., Lim, B. R., Goto, N., and Fujie, K. (2001). Analytical precision and repeatability of respi-ratory quinones for quantitative study of microbial community structure in environmental samples.J. Microbiol. Methods 47, 17–24.
Jenkinson, D. S., and Powlson, D. S. (1976). The effects of biocidal treatments on metabolism in soil. V.A method for measuring soil biomass. Soil Biol. Biochem. 8, 209–213.
Joergensen, R. G. (1996). The fumigation–extraction method to estimate soil microbial biomass: cali-bration of the KEC value. Soil Biol. Biochem. 28, 25–31.
Kammann, C., Grünhage, L., and Jäger, H. J. (2001). A new sampling technique to monitor concen-trations of CH4, N2O and CO2 in air at well-defined depths in soils with varied water potential. Eur.J. Soil Sci. 52, 297–303.
Kandeler, E., Kampichler, C., and Horak, O. (1996). Influence of heavy metals on the functional diver-sity of soil microbial communities. Biol. Fertil. Soils 23, 299–306.
Kandeler, E., Tscherko, D., and Spiegel, H. (1999). Long-term monitoring of microbial biomass, N-mineralization and enzyme activities of a chernozem under different tillage management. Biol.Fertil. Soils 28, 343–351.
Katayama, A., and Fujie, K. (2000). Characterization of soil microbiota with quinone profile. In “SoilBiochemistry” (J. M. Bollag and G. Stotzky, eds.), Vol. 10, pp. 303–347. Dekker, New York.
Kjelleberg, S. (1993). “Starvation in Bacteria.” Plenum, New York.Klee, A. J. (1993). A computer program for the determination of most probable number and its confi-
dence limits. J. Microbial. Methods 18, 91–98.
References and suggested reading 81
Ch03-P546807.qxd 11/18/06 6:16 PM Page 81
Klironomos, J. N., Rilling, M. C., and Allen, M. F. (1999). Designing belowground field experimentswith the help of semi-variance and power analyses. Appl. Soil Ecol. 12, 227–238.
Kloeke, F. V., and Geesey, G. G. (1999). Localization and identification of populations of phosphatase-active bacterial cells associated with activated sludge flocs. Microbial Ecol. 38, 201–214.
Klose, S. (2003). “Enzyme Mediated Reactions and Microbial Biomass of Agricultural and Fly AshInfluenced Forest Ecosystem.” Dresden University of Technology, Dresden. [Habilitation dissertation]
Knowles, R., and Blackburn, T. H., eds. (1993). “Nitrogen Isotope Techniques.” Academic Press, San Diego.
Levin, M. A., Seidler, R. J., and Rogul, M. (1992). “Microbial Ecology: Principles, Methods andApplications.” McGraw–Hill, New York.
Maier, R. M., Pepper, I. L., and Gerba, C. P., eds. (2000). “Environmental Microbiology.” AcademicPress, San Diego.
Marx, M. C., Wood, M., and Jarvis, S. C. (2001). A microplate fluorimetric assay for the study ofenzyme diversity in soils. Soil Biol. Biochem. 33, 1633–1640.
McCarthy, A. J., and Williams, S. T. (1991). Methods for studying the ecology of actinomycetes. In“Methods in Microbiology” (R. Grigorova and J. R. Norris, eds.), Vol. 22, pp. 533–563. AcademicPress, London.
Murphy, D. V., Recous, S., Stockdale, E. A., Fillery, I. R. P., Jensen, L. S., Hatch, D. J., and Goulding,K. W. T. (2003). Gross nitrogen fluxes in soil: theory, measurement and application of N-15 pooldilution techniques. Adv. Agron. 79, 69–118.
Nannipieri, P. (1994). Enzyme activity. In “The Encyclopaedia of Soil Science and Technology” (C. W. Finke, Jr., ed.). Van Nostrand Reinhold, New York.
Nannipieri, P., Kandeler, E., and Ruggiero, P. (2002). Enzyme activities and microbiological and bio-chemical processes in soil. In “Enzymes in the Environment—Activity, Ecology and Applications”(R. G. Burns and R. P. Dick, eds.), pp. 1–34. Dekker, New York.
Newell, S. Y., and Fallon, R. D. (1991). Toward a method for measuring instantaneous fungal growthrates in field samples. Ecology 72, 1547–1559.
Nylund, J. E., and Wallander, H. (1992). Ergosterol analysis as means of quantifying mycorrhizal bio-mass. Methods Microbiol. 24, 77–88.
Papale, D., and Valentini, R. (2003). A new assessment of European forests carbon exchange by eddyfluxes and artificial neural network spatialization. Global Change Biol. 9, 525–535.
Potthoff, M., Loftfield, N., Buegger, F., Wick, B., Jahn, B., Joergensen, R. G., and Flessa, H. (2003).The determination of δ13C in soil microbial biomass using fumigation–extraction. Soil Biol.Biochem. 35, 947–954.
Preston-Mafham, J., Boddy, L., and Randerson, P. F. (2002). Analysis of microbial community functionaldiversity using sole-carbon-source utilisation profiles—a critique. FEMS Microbiol. Ecol. 42, 1–14.
Robertson, J. P. (1994). The impact of soil and crop management practices on soil spatial heterogene-ity. In “Soil Biota” (C. E. Pankhurst, B. M. Doube, V. Gupta, and P. Grace, eds.), pp. 156–161.CSIRO, East Melbourne.
Robertson, G. P., Coleman, D. C., Bledsoe, C. S., and Sollins, P. (1999). “Standard Soil Methods forLong-Term Ecological Research.” Oxford Univ. Press, New York.
Ruess, L., Häggblom, M. M., Langel, R., and Scheu, S. (2004). Nitrogen isotope ratios and fatty acidcomposition as indicators of animal diets in belowground systems. Oecologia 139, 336–346.
Schimel, D. S. (1993). “Theory and Application of Tracers.” Academic Press, San Diego.Schinner, F., Öhlinger, R., Kandeler, E., and Margesin, R., eds. (1996). “Methods in Soil Biology.”
Springer, Berlin.Sinsabaugh, R. L., Carreiro, M. M., and Alvarez, S. (2002). Enzymes and microbial dynamics of litter
decomposition. In “Enzymes in the Environment—Activity, Ecology, and Applications.” (R. G. Burns and R. P. Dick, eds.), pp. 249–266. Dekker, New York.
Stemmer, M. (2004). Multiple-substrate enzyme assays: a useful approach for profiling enzyme activ-ity in soils? Soil Biol. Biochem. 36, 519–527.
Stotzky, G., and Bollag J.-M., eds. (1996). “Soil Biochemistry.” Vol. 9. Dekker, New York.
82 Chapter 3 Physiological and Biochemical Methods
Ch03-P546807.qxd 11/18/06 6:16 PM Page 82

Tabatabai, M. A. (1994). Soil enzymes. In “Methods of Soil Analysis,” Part 2, “Microbiological andBiochemical Properties” (R. W. Weaver, J. S. Angel, and P. S. Bottomley, eds.), pp. 775–833. SoilSci. Soc. of America, Madison, WI.
Tabatabai, M., and Fung, M. (1992). Extraction of enzymes from soil. In “Soil Biochemistry” (G. Stotzky and J.-M. Bollag, eds.), Vol. 7, pp. 197–227. Dekker, New York.
Tabatabai, M. A., and Dick, W. A. (2002). Enzymes in soil—research and development in measuringactivities. In “Enzymes in the Environment—Activity, Ecology and Applications” (R. G. Burnsand R. P. Dick, eds.), pp. 567–596. Dekker, New York.
Tunlid, A., and White, D. C. (1992). Biochemical analysis of biomass, community structure, nutri-tional status, and metabolic activity of microbial communities in soil. In “Soil Biochemistry” (G. Stotzky and J.-M. Bollag, eds.), Vol. 7, pp. 229–262. Dekker, New York.
Vepsäläinen, M., Kukkonen, S., Vestberg, M., Sirviö, H., and Niemi, R. M. (2001). Application of soilenzyme activity test kit in a field experiment. Soil Biol. Biochem. 33, 1665–1672.
Verma, B., Robarts, R. D., Headley, J. V., Peru, K. M., and Christofi, N. (2002). Extraction efficienciesand determination of ergosterol in a variety of environmental matrices. Commun. Soil Sci. PlantAnal. 33, 3261–3275.
Vestal, J. R., and White, D. C. (1989). Lipid analysis in microbial ecology. Bioscience 39, 535–541.Weaver, R., Angle, S., and Bottomley, P. (1994). “Methods of Soil Analyses,” Part 2, “Biochemical and
Biological Properties of Soil.” Am. Soc. Agronomy, Madison, WI.Wilkinson, M. H. F., and Schut, F., eds. (1998). “Digital Image Analysis of Microbes—Imaging,
Morphology, Fluorometry and Motility Techniques and Applications.” Wiley, Chichester.Wright, S. F. (2000). A fluorescent antibody assay for hyphae and glomalin from arbuscular mycorrhizal
fungi. Plant Soil 226, 171–177.
References and suggested reading 83
Ch03-P546807.qxd 11/18/06 6:16 PM Page 83

Ch03-P546807.qxd 11/18/06 6:16 PM Page 84
4MOLECULAR METHODS FOR
STUDYING SOIL ECOLOGY
Janice E. Thies
Introduction
Types and Structures of Nucleic Acids
Use of Nucleic Acid Analyses for Soil Ecology Studies
Direct Molecular Analysis of Soil Biota
Biosensors and Marker Gene Technologies
Extraction of Nucleic Acids (DNA/RNA)
Choosing between DNA and RNA for Soil Ecology Studies
Analysis of Nucleic Acid Extracts
Partial Community Analyses—PCR-Based Assays
Level of Resolution
Other Factors That May Affect Molecular Analyses
Summary
References
85
INTRODUCTION
No other area of soil ecology has developed more rapidly in recent years than theuse of molecular methods to characterize the soil microbial community. The abilityto extract deoxyribonucleic acids (DNA) and ribonucleic acids (RNA) from cellscontained within soil samples and their direct analysis in hybridization experimentsor use in polymerase chain reaction (PCR) amplification experiments have allowedus to detect and begin to characterize a vast diversity of microbes unimagined previously. Direct microscopic counts of soil bacteria are typically one to two ordersof magnitude higher than counts obtained by culturing (Chap. 5). Molecular
Ch04-P546807.qxd 11/20/06 3:04 PM Page 85
86 Chapter 4 Molecular Methods for Studying Soil Ecology
methods have the potential to provide access to this, as yet undescribed, 90–99% ofthe soil community.
Molecular microbial ecology relies on extracting and characterizing nucleicacids and other subcellular components, such as phospholipid fatty acids (Chap. 3), from soil organisms. Once extracted, nucleic acids or other markermolecules may be analyzed directly; or for DNA, specific target sequences maybe amplified by PCR and the resulting PCR products characterized further. In thecase of RNA (ribosomal (rRNA) or messenger (mRNA)), complementary DNA(cDNA) is derived from the RNA extract by reverse transcriptase (RT) PCR andthe cDNA produced is analyzed subsequently. Both extracting nucleic acids fromsoil and amplifying them by PCR may have considerable biases associated withthem and these must be taken into account when interpreting the results of subse-quent analyses.
The aim of many molecular community analyses is to describe populationdiversity by calculating taxon richness and evenness. Due to bias in DNA andRNA extraction and PCR amplification, it is difficult, if not impossible, to assessthe true abundance of different taxa using these approaches. In addition, thesemethods alone, although very powerful, cannot be used to assign function unam-biguously to different taxa. Hence, molecular methods should be used in concertwith other approaches (termed a polyphasic or multiphasic approach) to achieve amore holistic understanding of the structure and function of soil microbial com-munities. The focus of this chapter is on methods for extracting and analyzingsoil- and sediment-derived nucleic acids and drawing ecological information fromanalysis results.
TYPES AND STRUCTURES OF NUCLEIC ACIDS
There are two types of nucleic acids present in all cells: DNA and RNA. Theseare the target molecules for most molecular analyses. The structure of DNA wasdeduced by Watson and Crick in 1953. They described a double helix of nucleotidebases that could “unzip” to make copies of itself. DNA was known to containequimolar ratios of adenine (A) and thymine (T) and of cytosine (C) and guanine(G). Watson recognized that the adenine–thymine pair, held together by two hydro-gen bonds, and the cytosine–guanine pair, held together by three hydrogen bonds,resulted in similar shapes and could fit together to form the rungs of a ladder ofnucleotides. Molecular methods employing nucleic acids take advantage of the base-pairing rules between these four nucleotides (Fig. 4.1).
The DNA backbone is composed of deoxyribose (sugar), phosphates, and theassociated purine (A and G) and pyrimidine (T and C) bases. It is the base-pairingspecificity between the nucleotides that leads directly to the faithful copying of bothstrands of the DNA double helix during replication and that can be exploited to makecopies of selected genes (or regions of the DNA molecule) in vitro by use of the PCR.
Ch04-P546807.qxd 11/20/06 3:04 PM Page 86

Base-pairing specificity in DNA also allows for the transcription of genes codingfor rRNA to produce ribosomes, which facilitate protein synthesis; mRNA, whichcarries the genetic instructions for protein assembly; and tRNA, which is requiredfor transporting and linking amino acids during protein assembly (Fig. 4.2)(Campbell and Reece, 2005). RNA transcripts are single-stranded, contain riboseinstead of deoxyribose, and substitute uracil (U) for thymine in the nucleic acidsequence, thus necessitating reverse transcription to cDNA to analyze RNAextracted from soils. Most molecular analyses target either DNA or rRNA, althoughlimited analysis of mRNA from environmental samples has become possible.
Types and Structures of Nucleic Acids 87
NH2
H
H
CC
CC
N
NN
H
N
H
H
HH
H
N
O
CC
CC
N
NN
H
N
H
H
HH
H
N
O
CC
CC
N
NN
C
N
H
H
H
CC
CC
N
N
H
O
NH2
H
H
CC
CC
N
N
H
O
O
H
H
CC
CC
N
N
H
H
O
O
H
H3C
CC
CC
N
N
H
H
O
NH2
CC
CC
N
NN
C
N
H
H
H
NH2
Cytosine C CytosineC
GGuanine G Guanine
AAdenine A Adenine
T ThymineUUracil
replaces Thyminein RNA
NitrogenousBases
RNA
Ribonucleic acid
DNA
Deoxyribonucleic acidNitrogenous
Bases
AUCG’S
ATCG’S
Base pair
Sugarphosphatebackbone
FIGURE 4.1 The basic structure of DNA and RNA. DNA is double-stranded, whereas RNA issingle-stranded. The nucleotide, thymine, in DNA is replaced with uracil in RNA. Image adapted fromthe National Human Genome Research Institute Talking Glossary of Genetic Terms, available at http://www.genome.gov/Pages/Hyperion/DIR/VIP/Glossary/Illustration/rna.cfm?key=ribonucleic%20acid%20%28RNA%29.
Ch04-P546807.qxd 11/20/06 3:04 PM Page 87
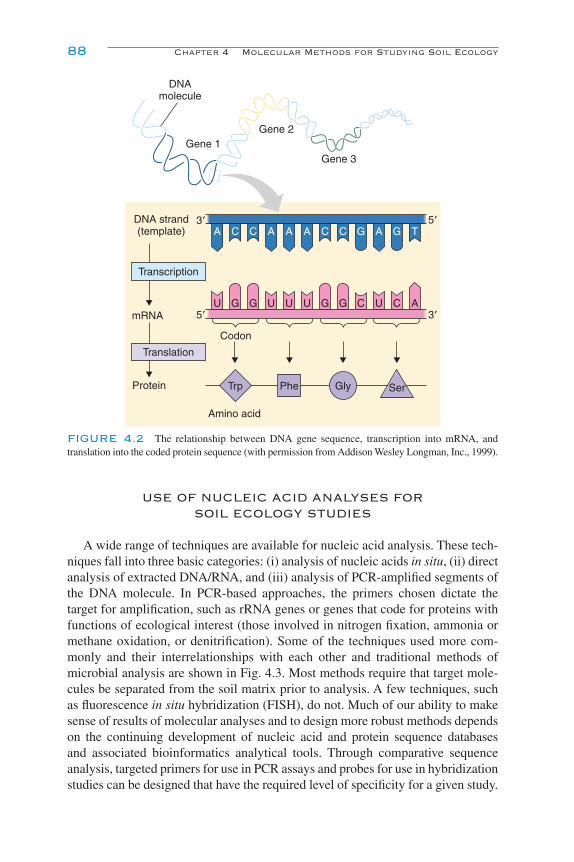
USE OF NUCLEIC ACID ANALYSES FOR SOIL ECOLOGY STUDIES
A wide range of techniques are available for nucleic acid analysis. These tech-niques fall into three basic categories: (i) analysis of nucleic acids in situ, (ii) directanalysis of extracted DNA/RNA, and (iii) analysis of PCR-amplified segments ofthe DNA molecule. In PCR-based approaches, the primers chosen dictate thetarget for amplification, such as rRNA genes or genes that code for proteins withfunctions of ecological interest (those involved in nitrogen fixation, ammonia ormethane oxidation, or denitrification). Some of the techniques used more com-monly and their interrelationships with each other and traditional methods ofmicrobial analysis are shown in Fig. 4.3. Most methods require that target mole-cules be separated from the soil matrix prior to analysis. A few techniques, suchas fluorescence in situ hybridization (FISH), do not. Much of our ability to makesense of results of molecular analyses and to design more robust methods dependson the continuing development of nucleic acid and protein sequence databases and associated bioinformatics analytical tools. Through comparative sequenceanalysis, targeted primers for use in PCR assays and probes for use in hybridizationstudies can be designed that have the required level of specificity for a given study.
88 Chapter 4 Molecular Methods for Studying Soil Ecology
DNAmolecule
Gene 2Gene 1
DNA strand(template)
Protein
Codon
Amino acid
mRNA
Gene 3
3�
5� 3�
5�A
U U U U U
A A A AC C C C G
G G G AG C C
G T
Translation
Transcription
Trp Phe Gly Ser
FIGURE 4.2 The relationship between DNA gene sequence, transcription into mRNA, andtranslation into the coded protein sequence (with permission from Addison Wesley Longman, Inc., 1999).
Ch04-P546807.qxd 11/20/06 3:04 PM Page 88
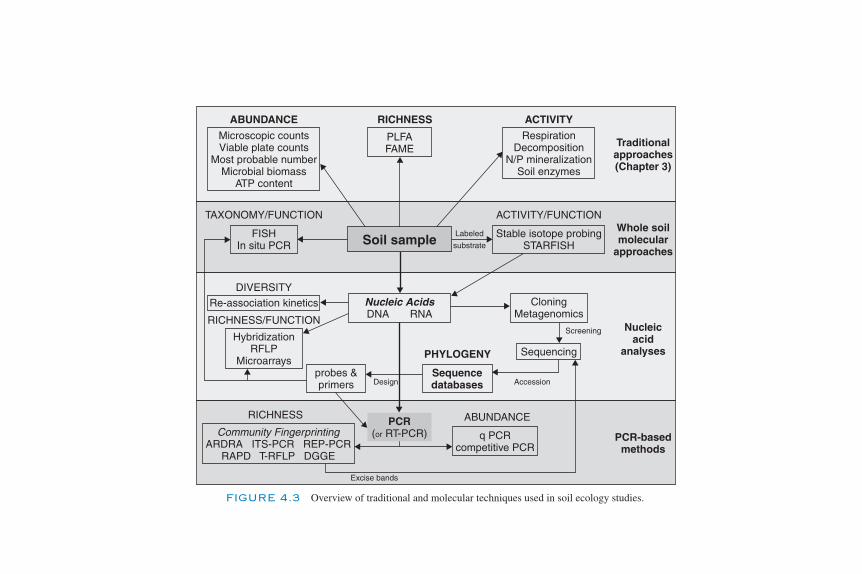
ABUNDANCE
TAXONOMY/FUNCTION
Re-association kinetics
HybridizationRFLP
Microarrays
RICHNESS/FUNCTION
DIVERSITY
probes &primers
q PCRcompetitive PCR
Excise bands
Community FingerprintingARDRA ITS-PCR REP-PCR
RAPD T-RFLP DGGE
RICHNESS
Design
RICHNESS ACTIVITY
ACTIVITY/FUNCTION
Traditionalapproaches(Chapter 3)
Nucleicacid
analyses
PCR-basedmethods
RespirationDecomposition
N/P mineralizationSoil enzymes
Sequencedatabases
PHYLOGENY
ABUNDANCE
Accession
CloningMetagenomics
Sequencing
Screening
Nucleic AcidsDNA RNA
PLFAFAME
Microscopic countsViable plate counts
Most probable numberMicrobial biomass
ATP content
FISHIn situ PCR Soil sample
Labeled
substrate
Whole soilmolecular
approaches
Stable isotope probingSTARFISH
PCR(or RT-PCR)
FIGURE 4.3 Overview of traditional and molecular techniques used in soil ecology studies.
Ch04-P546807.qxd 11/20/06 3:04 PM Page 89
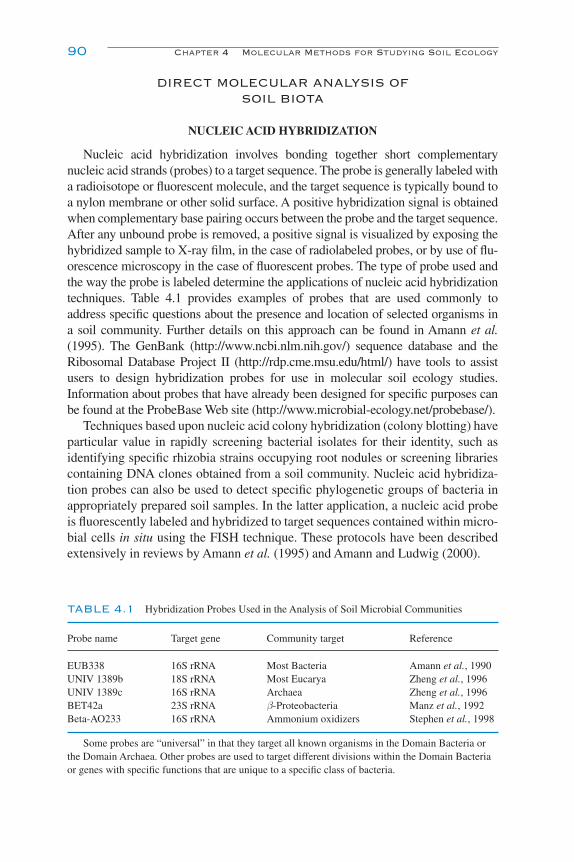
DIRECT MOLECULAR ANALYSIS OF SOIL BIOTA
NUCLEIC ACID HYBRIDIZATION
Nucleic acid hybridization involves bonding together short complementarynucleic acid strands (probes) to a target sequence. The probe is generally labeled witha radioisotope or fluorescent molecule, and the target sequence is typically bound toa nylon membrane or other solid surface. A positive hybridization signal is obtainedwhen complementary base pairing occurs between the probe and the target sequence.After any unbound probe is removed, a positive signal is visualized by exposing thehybridized sample to X-ray film, in the case of radiolabeled probes, or by use of flu-orescence microscopy in the case of fluorescent probes. The type of probe used andthe way the probe is labeled determine the applications of nucleic acid hybridizationtechniques. Table 4.1 provides examples of probes that are used commonly toaddress specific questions about the presence and location of selected organisms in a soil community. Further details on this approach can be found in Amann et al.(1995). The GenBank (http://www.ncbi.nlm.nih.gov/) sequence database and theRibosomal Database Project II (http://rdp.cme.msu.edu/html/) have tools to assistusers to design hybridization probes for use in molecular soil ecology studies.Information about probes that have already been designed for specific purposes canbe found at the ProbeBase Web site (http://www.microbial-ecology.net/probebase/).
Techniques based upon nucleic acid colony hybridization (colony blotting) haveparticular value in rapidly screening bacterial isolates for their identity, such asidentifying specific rhizobia strains occupying root nodules or screening librariescontaining DNA clones obtained from a soil community. Nucleic acid hybridiza-tion probes can also be used to detect specific phylogenetic groups of bacteria inappropriately prepared soil samples. In the latter application, a nucleic acid probeis fluorescently labeled and hybridized to target sequences contained within micro-bial cells in situ using the FISH technique. These protocols have been describedextensively in reviews by Amann et al. (1995) and Amann and Ludwig (2000).
TABLE 4.1 Hybridization Probes Used in the Analysis of Soil Microbial Communities
Probe name Target gene Community target Reference
EUB338 16S rRNA Most Bacteria Amann et al., 1990UNIV 1389b 18S rRNA Most Eucarya Zheng et al., 1996UNIV 1389c 16S rRNA Archaea Zheng et al., 1996BET42a 23S rRNA β-Proteobacteria Manz et al., 1992Beta-AO233 16S rRNA Ammonium oxidizers Stephen et al., 1998
Some probes are “universal” in that they target all known organisms in the Domain Bacteria orthe Domain Archaea. Other probes are used to target different divisions within the Domain Bacteriaor genes with specific functions that are unique to a specific class of bacteria.
90 Chapter 4 Molecular Methods for Studying Soil Ecology
Ch04-P546807.qxd 11/20/06 3:04 PM Page 90

The FISH technique employs an oligonucleotide probe conjugated with a fluores-cent molecule (or fluorochrome). The probe is designed to bind to complementarysequences in the rRNA of the 16S subunit of the ribosomes within bacterial cells.Because metabolically active cells contain a large number of ribosomes, the concen-tration of fluorescently labeled probe is relatively high inside the cells, causing themto fluoresce under UV light. The final result is high binding specificity and typicallylow background fluorescence. For simultaneous counting of subpopulations in agiven sample, probes can be designed that bind to specific sequences of rRNA thatare found only in a particular group of organisms (i.e., Archaea, Bacteria, or subdivi-sions of the Bacteria; see Table 4.1) and used in conjunction with one another. FISHcan also be combined with microautoradiography to determine specific substrateuptake profiles for individual cells within complex microbial communities(STARFISH, substrate-tracking autoradiographic fluorescence in situ hybridization;Ouverney and Fuhrman, 1999; Lee et al., 1999). Because these methods label onlymetabolically active cells, the samples can be labeled simultaneously with dyes thatbind to nucleic acids, such as 4�,6-diamidino-2-phenylindole (DAPI) or acridineorange, to facilitate a total cell count using fluorescence microscopy (Li et al., 2004).FISH is useful especially when used in conjunction with confocal laser scanningmicroscopy (CLSM; see below) as it allows three-dimensional visualization of therelative positions of diverse populations, even within complex communities such asbiofilms and the surfaces of soil aggregates (Binnerup et al., 2001). The key advan-tage of FISH is the ability to visualize and identify organisms on a microscale in theirnatural environment. Such techniques have enormous potential for studying micro-bial interactions with plants and the ecology of target microbial populations in soil;however, the binding of fluorescent dyes to organic matter resulting in nonspecificfluorescence is a common problem in soils with high organic matter contents, such aspeats, or other particles with high surface charge, such as black carbon. Image analy-sis software is readily available and may be “trained” to detect only those aspects ofan image that meet specified criteria.
CONFOCAL MICROSCOPY
CLSM, combined with in situ hybridization techniques, has been applied withconsiderable success to visualize the structure of soil microbial communities. Thebasic principle of CLSM is to first create an image that is composed only of emit-ted fluorescence signals from a single plane of focus. This is done using a pinholeaperture, which eliminates any signal that may be coming from portions of thefield that are out of focus. A series of these optical sections is scanned at specificdepths and then each section is “stacked” using imaging software, giving rise toeither a two-dimensional image that includes all planes of focus in the specimenor a computer-generated three-dimensional image. This gives us unprecedented res-olution in viewing environmental specimens, allowing for better differentiation of organ-isms from particulate matter as well as giving us an insight into the three-dimensionalspatial relationships of microbial communities within their environment (Fig. 4.4).
Direct Molecular Analysis of Soil Biota 91
Ch04-P546807.qxd 11/20/06 3:04 PM Page 91

BIOSENSORS AND MARKER GENE TECHNOLOGIES
Introduced marker genes, such as luxAB (luminescence), lacZ (β-galactosidase),and xylE (catechol 2, 3-dioxygenase) are now being used more frequently in soilmicrobial ecology studies (Table 4.2). One such gene that has attracted a lot ofattention in rhizosphere studies is gfp, which encodes the green fluorescent protein(GFP). Green fluorescent protein is a unique bioluminescent genetic marker, whichcan be used to identify, track, and count specific organisms into which the gene hasbeen cloned that have been reintroduced into the environment (Chalfie et al.,1994). The gfp gene was discovered in and is derived from the bioluminescent jelly-fish Aequorea victoria (Prasher et al., 1992). Once cloned into the organism of inter-est, GFP methods require no exogenous substrates, complex media, or expensiveequipment to monitor and, hence, are favored over many fluorescence methods forenvironmental applications (Errampalli et al., 1999). GFP-marked cells can be iden-tified using a standard fluorescence microscope fitted with excitation and emissionfilters of the appropriate wavelengths. One reason for such keen interest in GFP isthat there is no background GFP activity in plants or the bacteria and fungi thatinteract with them, thereby making gfp an excellent target gene that can be intro-duced into selected bacterial or fungal strains and used to study plant–microbe inter-actions (Errampalli et al., 1999). Basically, gfp is transformed into either thechromosome or a plasmid in a bacterial strain, where it is subsequently replicated.Various gene constructs have been made, which differ in the type of promoters orterminators used, and some contain repressor genes such as lacI for control of gfpexpression. Once key populations in a sample are known and isolates obtained, theycan be subsequently marked with gfp or other genes producing detectable productsin order to track them and assess their functions and interactions in soil and therhizosphere. In addition to GFP, red-shifted and yellow-shifted variants have been
92 Chapter 4 Molecular Methods for Studying Soil Ecology
Zoom � 20 T � 2s C � 724 B � 189 F0 L488
0 µm9.5 µm19 µm
FIGURE 4.4 Confocal laser scanning microscopy image of a nematode feeding on a bacterialbiofilm (with permission from W. C. Ghiorse, Cornell University).
Ch04-P546807.qxd 11/20/06 3:04 PM Page 92
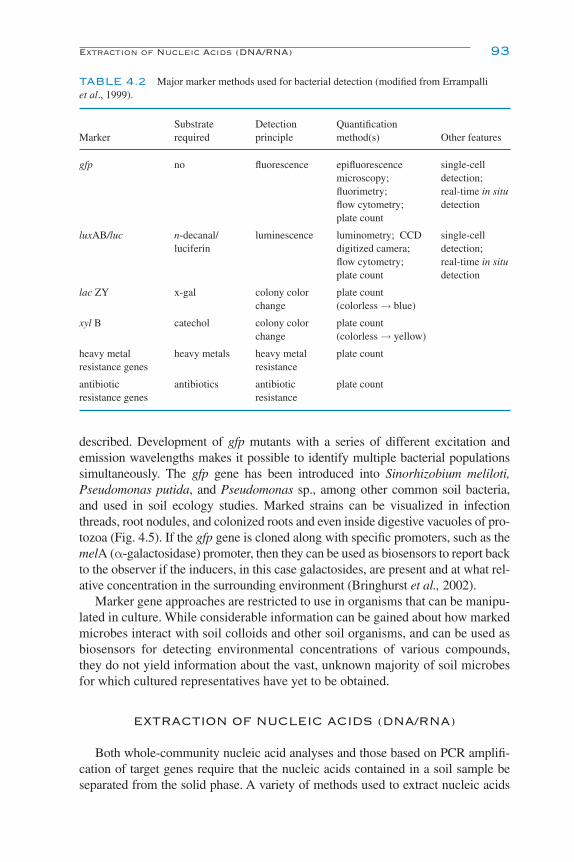
described. Development of gfp mutants with a series of different excitation andemission wavelengths makes it possible to identify multiple bacterial populationssimultaneously. The gfp gene has been introduced into Sinorhizobium meliloti,Pseudomonas putida, and Pseudomonas sp., among other common soil bacteria,and used in soil ecology studies. Marked strains can be visualized in infectionthreads, root nodules, and colonized roots and even inside digestive vacuoles of pro-tozoa (Fig. 4.5). If the gfp gene is cloned along with specific promoters, such as themelA (α-galactosidase) promoter, then they can be used as biosensors to report backto the observer if the inducers, in this case galactosides, are present and at what rel-ative concentration in the surrounding environment (Bringhurst et al., 2002).
Marker gene approaches are restricted to use in organisms that can be manipu-lated in culture. While considerable information can be gained about how markedmicrobes interact with soil colloids and other soil organisms, and can be used asbiosensors for detecting environmental concentrations of various compounds,they do not yield information about the vast, unknown majority of soil microbesfor which cultured representatives have yet to be obtained.
EXTRACTION OF NUCLEIC ACIDS (DNA/RNA)
Both whole-community nucleic acid analyses and those based on PCR amplifi-cation of target genes require that the nucleic acids contained in a soil sample beseparated from the solid phase. A variety of methods used to extract nucleic acids
Extraction of Nucleic Acids (DNA/RNA) 93
TABLE 4.2 Major marker methods used for bacterial detection (modified from Errampalli et al., 1999).
Substrate Detection Quantification Marker required principle method(s) Other features
gfp no fluorescence epifluorescence single-cell microscopy; detection;fluorimetry; real-time in situ flow cytometry; detectionplate count
luxAB/luc n-decanal/ luminescence luminometry; CCD single-cell luciferin digitized camera; detection;
flow cytometry; real-time in situ plate count detection
lac ZY x-gal colony color plate count change (colorless → blue)
xyl B catechol colony color plate count change (colorless → yellow)
heavy metal heavy metals heavy metal plate countresistance genes resistance
antibiotic antibiotics antibiotic plate countresistance genes resistance
Ch04-P546807.qxd 11/20/06 3:04 PM Page 93
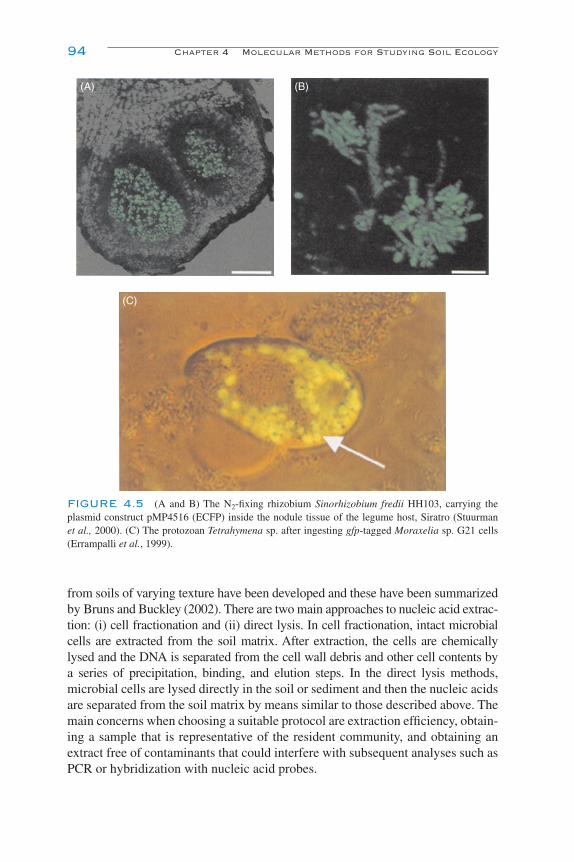
from soils of varying texture have been developed and these have been summarizedby Bruns and Buckley (2002). There are two main approaches to nucleic acid extrac-tion: (i) cell fractionation and (ii) direct lysis. In cell fractionation, intact microbialcells are extracted from the soil matrix. After extraction, the cells are chemicallylysed and the DNA is separated from the cell wall debris and other cell contents by a series of precipitation, binding, and elution steps. In the direct lysis methods,microbial cells are lysed directly in the soil or sediment and then the nucleic acidsare separated from the soil matrix by means similar to those described above. Themain concerns when choosing a suitable protocol are extraction efficiency, obtain-ing a sample that is representative of the resident community, and obtaining anextract free of contaminants that could interfere with subsequent analyses such asPCR or hybridization with nucleic acid probes.
94 Chapter 4 Molecular Methods for Studying Soil Ecology
(A) (B)
(C)
FIGURE 4.5 (A and B) The N2-fixing rhizobium Sinorhizobium fredii HH103, carrying theplasmid construct pMP4516 (ECFP) inside the nodule tissue of the legume host, Siratro (Stuurmanet al., 2000). (C) The protozoan Tetrahymena sp. after ingesting gfp-tagged Moraxelia sp. G21 cells(Errampalli et al., 1999).
Ch04-P546807.qxd 11/20/06 3:04 PM Page 94
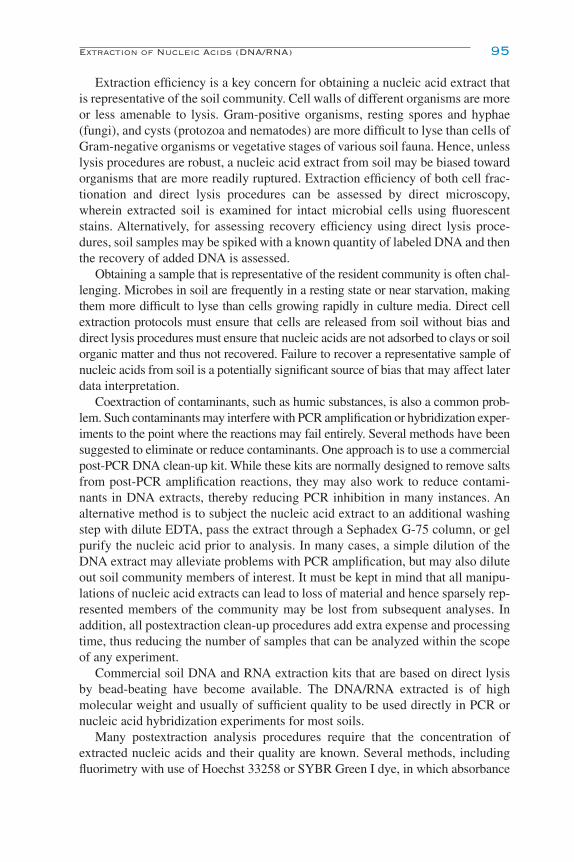
Extraction efficiency is a key concern for obtaining a nucleic acid extract thatis representative of the soil community. Cell walls of different organisms are moreor less amenable to lysis. Gram-positive organisms, resting spores and hyphae(fungi), and cysts (protozoa and nematodes) are more difficult to lyse than cells ofGram-negative organisms or vegetative stages of various soil fauna. Hence, unlesslysis procedures are robust, a nucleic acid extract from soil may be biased towardorganisms that are more readily ruptured. Extraction efficiency of both cell frac-tionation and direct lysis procedures can be assessed by direct microscopy,wherein extracted soil is examined for intact microbial cells using fluorescentstains. Alternatively, for assessing recovery efficiency using direct lysis proce-dures, soil samples may be spiked with a known quantity of labeled DNA and thenthe recovery of added DNA is assessed.
Obtaining a sample that is representative of the resident community is often chal-lenging. Microbes in soil are frequently in a resting state or near starvation, makingthem more difficult to lyse than cells growing rapidly in culture media. Direct cellextraction protocols must ensure that cells are released from soil without bias anddirect lysis procedures must ensure that nucleic acids are not adsorbed to clays or soilorganic matter and thus not recovered. Failure to recover a representative sample ofnucleic acids from soil is a potentially significant source of bias that may affect laterdata interpretation.
Coextraction of contaminants, such as humic substances, is also a common prob-lem. Such contaminants may interfere with PCR amplification or hybridization exper-iments to the point where the reactions may fail entirely. Several methods have beensuggested to eliminate or reduce contaminants. One approach is to use a commercialpost-PCR DNA clean-up kit. While these kits are normally designed to remove saltsfrom post-PCR amplification reactions, they may also work to reduce contami-nants in DNA extracts, thereby reducing PCR inhibition in many instances. Analternative method is to subject the nucleic acid extract to an additional washingstep with dilute EDTA, pass the extract through a Sephadex G-75 column, or gelpurify the nucleic acid prior to analysis. In many cases, a simple dilution of theDNA extract may alleviate problems with PCR amplification, but may also diluteout soil community members of interest. It must be kept in mind that all manipu-lations of nucleic acid extracts can lead to loss of material and hence sparsely rep-resented members of the community may be lost from subsequent analyses. Inaddition, all postextraction clean-up procedures add extra expense and processingtime, thus reducing the number of samples that can be analyzed within the scopeof any experiment.
Commercial soil DNA and RNA extraction kits that are based on direct lysis by bead-beating have become available. The DNA/RNA extracted is of highmolecular weight and usually of sufficient quality to be used directly in PCR ornucleic acid hybridization experiments for most soils.
Many postextraction analysis procedures require that the concentration ofextracted nucleic acids and their quality are known. Several methods, includingfluorimetry with use of Hoechst 33258 or SYBR Green I dye, in which absorbance
Extraction of Nucleic Acids (DNA/RNA) 95
Ch04-P546807.qxd 11/20/06 3:04 PM Page 95
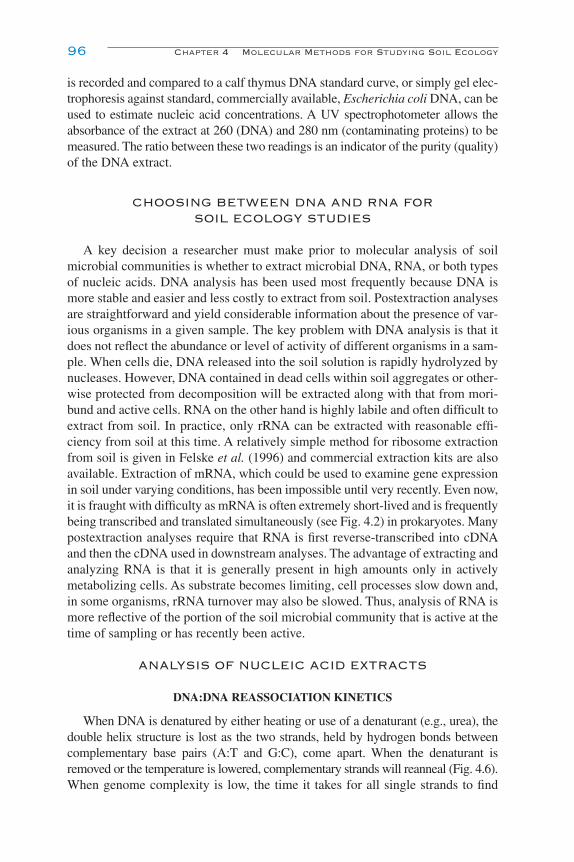
is recorded and compared to a calf thymus DNA standard curve, or simply gel elec-trophoresis against standard, commercially available, Escherichia coli DNA, can beused to estimate nucleic acid concentrations. A UV spectrophotometer allows theabsorbance of the extract at 260 (DNA) and 280 nm (contaminating proteins) to bemeasured. The ratio between these two readings is an indicator of the purity (quality)of the DNA extract.
CHOOSING BETWEEN DNA AND RNA FORSOIL ECOLOGY STUDIES
A key decision a researcher must make prior to molecular analysis of soilmicrobial communities is whether to extract microbial DNA, RNA, or both typesof nucleic acids. DNA analysis has been used most frequently because DNA ismore stable and easier and less costly to extract from soil. Postextraction analysesare straightforward and yield considerable information about the presence of var-ious organisms in a given sample. The key problem with DNA analysis is that itdoes not reflect the abundance or level of activity of different organisms in a sam-ple. When cells die, DNA released into the soil solution is rapidly hydrolyzed bynucleases. However, DNA contained in dead cells within soil aggregates or other-wise protected from decomposition will be extracted along with that from mori-bund and active cells. RNA on the other hand is highly labile and often difficult toextract from soil. In practice, only rRNA can be extracted with reasonable effi-ciency from soil at this time. A relatively simple method for ribosome extractionfrom soil is given in Felske et al. (1996) and commercial extraction kits are alsoavailable. Extraction of mRNA, which could be used to examine gene expressionin soil under varying conditions, has been impossible until very recently. Even now,it is fraught with difficulty as mRNA is often extremely short-lived and is frequentlybeing transcribed and translated simultaneously (see Fig. 4.2) in prokaryotes. Manypostextraction analyses require that RNA is first reverse-transcribed into cDNAand then the cDNA used in downstream analyses. The advantage of extracting andanalyzing RNA is that it is generally present in high amounts only in activelymetabolizing cells. As substrate becomes limiting, cell processes slow down and,in some organisms, rRNA turnover may also be slowed. Thus, analysis of RNA ismore reflective of the portion of the soil microbial community that is active at thetime of sampling or has recently been active.
ANALYSIS OF NUCLEIC ACID EXTRACTS
DNA:DNA REASSOCIATION KINETICS
When DNA is denatured by either heating or use of a denaturant (e.g., urea), thedouble helix structure is lost as the two strands, held by hydrogen bonds betweencomplementary base pairs (A:T and G:C), come apart. When the denaturant isremoved or the temperature is lowered, complementary strands will reanneal (Fig. 4.6).When genome complexity is low, the time it takes for all single strands to find
96 Chapter 4 Molecular Methods for Studying Soil Ecology
Ch04-P546807.qxd 11/20/06 3:04 PM Page 96

FIGURE 4.6 DNA:DNA hybridization. Native double-stranded DNA is denatured using heat or alkali into single strands.Under proper conditions, single strands will reanneal with strands having the complementary sequence, creating hybridized double-stranded DNA.
T A TATA
T A Heat, OH–
T A
TA
T
Native state Single-strandeddenatured state
Renatured state
A
CC
G
CG
TT A T
T
AA A T
A G C
C
C C G
C T A
C
GG T A
G G CG
C
3� 5�
3� 5� 3� 5� 5� 3� 5� 3� 3� 5� 3� 5�
3� 5� 3� 5� 3� 5� 3� 5� 3� 5�
GC G
Renaturation(specialconditionsrequired)
T ATA
TA
CC G
G
C G
A TTA
GC
AT A
T
G C
Ch04-P546807.qxd 11/20/06 3:04 PM Page 97

their complement is brief. As complexity increases, the time it takes for comple-mentary strands to reanneal increases. Experimentally, this is referred to as a Cotcurve, where Co is the initial molar concentration of nucleotides in single-strandedDNA and t is time. This measure reflects both the total amount of information inthe system (richness or number of unique genomes) and the distribution of thatinformation (evenness or the relative abundance of each unique genome) (Liu andStahl, 2002), thus making it among the more robust methods for estimating extantdiversity in a given sample. Yet, it provides no information on identity or functionof any member of the microbial community.
The genetic complexity or genome size of several soil microbial communities wasassessed using reassociation kinetics by Torsvik et al. (1990; 1998). Using this pro-cedure, they estimated that the community genome size in undisturbed organic soilswas equivalent to 6000–10,000 E. coli genomes. In comparison, a heavy-metal-polluted soil contained 350–1500 genome equivalents. Culturing produced fewerthan 40 genome equivalents. Such experiments, and those employing direct countsusing epifluorescence microscopy, are what substantiate the lack of abundanceand diversity commonly observed using culturing methods. The data from the abovestudy were reanalyzed using improved analytical methods, which yielded anestimate of the extant diversity contained in the undisturbed soil sample of 8.3million distinct genomes in 30 g of soil, two orders of magnitude greater thanoriginally derived (Gans et al., 2005). In contrast, the heavy-metal-polluted soilwas estimated to contain only 7900 genome equivalents, 99.9% fewer than in theundisturbed soil.
MICROARRAYS
Microarrays represent an exciting new development in microbial communityanalysis. Nucleic acid hybridization is the principle on which the technique is based.The main difference between past protocols and microarrays is that the oligonu-cleotide probes, rather than the extracted DNA or RNA targets, are immobilized on a solid surface in a miniaturized matrix. Thus, thousands of probes can be testedfor hybridization with sample DNA or RNA simultaneously. In contrast to otherhybridization techniques, the sample nucleic acids to be probed are fluorescentlylabeled, rather than the probes themselves. After the labeled sample nucleic acidsare hybridized to the probes contained on the microarray, positive signals aredetected by use of CSLM or other laser microarray scanning device (Fig. 4.7). Afully developed DNA microarray could include a set of probes encompassing vir-tually all known natural microbial groupings and thereby serve to monitor thepopulation structure simultaneously at multiple levels of resolution (see Table 4.1;Guschin et al., 1997; Ekins and Chu, 1999; Wu et al., 2001). Such an array wouldpotentially allow for an enormous increase in sample throughput. A major drawbackof microarrays for use in soil ecology studies currently is their need for a highcopy number of target DNA/RNA to obtain a signal that is detectable with currenttechnologies. Targets in concentrations of less than 103–104 are difficult to detect
98 Chapter 4 Molecular Methods for Studying Soil Ecology
Ch04-P546807.qxd 11/20/06 3:04 PM Page 98

1 111
2
Detection
Em
issi
on
Mix andhybridize
Spot(gene)
1 2 3 1 2 3
Excitation
222
3
333
Sample 1 Sample 2
Relative Abundancedetection
Soil sample orbacterial isolate
Isolate mRNA.1
2
3
4
Make cDNA by reversetranscription, using fluor-escently labeled nucleotides.
Rinse off excess cDNA; scanmicroarray for fluorescence.Each fluorescent spot (yellow)represents a gene expressed.
Apply the cDNA mixture to amicroarray, a microscope slideon which copies of single-strandedDNA fragments from the organism’sgenes are fixed, a different genein each spot. The cDNA hybridizeswith any complementary DNA onthe microarray.
mRNA molecules
DNAmicroarray
Size of an actualDNA microarray
Labeled cDNA molecules(single strands)
(A)
(B)
(C)
FIGURE 4.7 Steps in developing and using a microarray. (A) Flow chart depicting the steps from extracting mRNA from asample to reading the microarray with a laser scanner (Campbell and Reece, 2005). (B) Detail of how the labeled cDNA interactswith the probes bound to the microarray and how a positive signal from one or the other sample is detected. (C) An image of amicroarray reading (http://www.bsi.vt.edu/ralscher/gridit/).
Ch04-P546807.qxd 11/20/06 3:04 PM Page 99

using this approach. Techniques to improve the sensitivity have been reported byDenef et al. (2003). Nonspecific binding of target nucleic acids to the probes isalso a serious issue that needs to be overcome (Zhou and Thompson, 2002). Thedetails of microarray construction and types of arrays can be found in Ekins andChu (1999) and ecological applications are reviewed in Zhou (2003).
There are three basic types of arrays used in soil ecology: (i) communitygenome arrays (CGA), used to compare the genomes of specific groups of organ-isms; (ii) functional gene arrays (FGA), used to detect the presence of genes ofknown function in microbial populations in prepared soil samples and morerecently used to detect gene expression; and (iii) phylogenetic oligonucleotidearrays (POA), used to characterize the relative diversity of organisms in a samplethrough the use of rRNA sequence-based probes. Whole genomic DNA, requiringculturing of target organisms, is used to develop the probes used in CGA. Botholigonucleotides and DNA fragments derived from functional genes, such asthose involved in C, N, S, and metal cycling, can be used to prepare FGAs andquery the status of these functional genes within a soil community. In POA, bothconserved- and variable-region rRNA gene sequences are used to determine thepresence of particular phylogenetic groups in a given sample.
RESTRICTION FRAGMENT LENGTH POLYMORPHISM(RFLP) ANALYSIS
In RFLP analysis, total DNA purified from soil is hydrolyzed with a restrictionendonuclease (often EcoRI or HindIII). Restriction enzymes, produced by and orig-inally isolated from various bacteria, cut double-stranded DNA at palindromicsequences (those that read in the same order both backward and forward). Restrictionenzymes can be selected that cut either frequently or infrequently along the isolatedDNA strands. The variation (polymorphisms) in the length of resulting DNA frag-ments is visualized by running the DNA fragments on an electrophoretic gel andstaining the gel with ethidium bromide or SYBR Green I, which fluoresce underUV light. These variations in fragment lengths are then used as a “fingerprint,” todifferentiate between soil communities. Discrimination between communities isoften difficult because of the large number of fragments generated and the difficultyin resolving closely spaced bands in a gel. RFLP is rarely used on its own for diver-sity studies. It is used most commonly in conjunction with the Southern method oftransferring (blotting) the DNA fragments from the gel onto a nitrocellulose or othermembrane and then probing the blot with appropriately labeled oligonucleotide geneprobes to test for the presence of specific sequences or used in conjunction with PCRof amplified ribosomal genes in a technique called ARDRA (amplified ribosomalDNA restriction analysis). The ultimate aim of RFLP-based methods is to be able tocompare differences between DNA fingerprints obtained from different communi-ties. Observed differences can then be characterized more fully using other methods,largely involving cloning and sequencing of DNA fragments of interest.
100 Chapter 4 Molecular Methods for Studying Soil Ecology
Ch04-P546807.qxd 11/20/06 3:04 PM Page 100
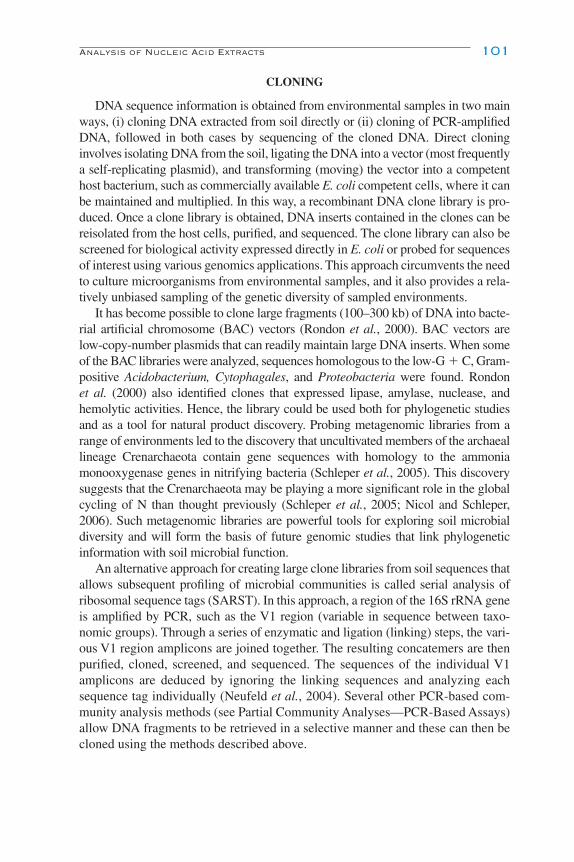
CLONING
DNA sequence information is obtained from environmental samples in two mainways, (i) cloning DNA extracted from soil directly or (ii) cloning of PCR-amplifiedDNA, followed in both cases by sequencing of the cloned DNA. Direct cloninginvolves isolating DNA from the soil, ligating the DNA into a vector (most frequentlya self-replicating plasmid), and transforming (moving) the vector into a competenthost bacterium, such as commercially available E. coli competent cells, where it canbe maintained and multiplied. In this way, a recombinant DNA clone library is pro-duced. Once a clone library is obtained, DNA inserts contained in the clones can bereisolated from the host cells, purified, and sequenced. The clone library can also bescreened for biological activity expressed directly in E. coli or probed for sequencesof interest using various genomics applications. This approach circumvents the needto culture microorganisms from environmental samples, and it also provides a rela-tively unbiased sampling of the genetic diversity of sampled environments.
It has become possible to clone large fragments (100–300 kb) of DNA into bacte-rial artificial chromosome (BAC) vectors (Rondon et al., 2000). BAC vectors arelow-copy-number plasmids that can readily maintain large DNA inserts. When someof the BAC libraries were analyzed, sequences homologous to the low-G � C, Gram-positive Acidobacterium, Cytophagales, and Proteobacteria were found. Rondon et al. (2000) also identified clones that expressed lipase, amylase, nuclease, andhemolytic activities. Hence, the library could be used both for phylogenetic studiesand as a tool for natural product discovery. Probing metagenomic libraries from arange of environments led to the discovery that uncultivated members of the archaeallineage Crenarchaeota contain gene sequences with homology to the ammoniamonooxygenase genes in nitrifying bacteria (Schleper et al., 2005). This discoverysuggests that the Crenarchaeota may be playing a more significant role in the globalcycling of N than thought previously (Schleper et al., 2005; Nicol and Schleper,2006). Such metagenomic libraries are powerful tools for exploring soil microbialdiversity and will form the basis of future genomic studies that link phylogeneticinformation with soil microbial function.
An alternative approach for creating large clone libraries from soil sequences thatallows subsequent profiling of microbial communities is called serial analysis ofribosomal sequence tags (SARST). In this approach, a region of the 16S rRNA geneis amplified by PCR, such as the V1 region (variable in sequence between taxo-nomic groups). Through a series of enzymatic and ligation (linking) steps, the vari-ous V1 region amplicons are joined together. The resulting concatemers are thenpurified, cloned, screened, and sequenced. The sequences of the individual V1amplicons are deduced by ignoring the linking sequences and analyzing eachsequence tag individually (Neufeld et al., 2004). Several other PCR-based com-munity analysis methods (see Partial Community Analyses—PCR-Based Assays)allow DNA fragments to be retrieved in a selective manner and these can then becloned using the methods described above.
Analysis of Nucleic Acid Extracts 101
Ch04-P546807.qxd 11/20/06 3:04 PM Page 101

DNA SEQUENCING
Significant progress, particularly in working with environmental samples, hasbeen made since the dideoxy chain termination method for DNA sequencing wasfirst described by Sanger et al. (1977). The advent of fluorescent dyes, improve-ments in gel matrix technology, cycle sequencing using a thermal cycler, capillarysystems, use of lasers, and automated gel analysis now allows up to 1100 bases ofsequence to be generated or deduced in a single reaction. Manual sequencing isextremely time-consuming and is very rarely performed in individual laboratoriesany more. It is more cost effective to send sample DNA to a commercial sequenc-ing facility for analysis.
Part of the usefulness of DNA sequencing lies in determining gene sequences ofunique or important members of a soil community for use in developing more spe-cific primers and gene probes to address specific ecological questions. Genesequences, once obtained, are submitted to and maintained within various databasessuch as GenBank (http://www.ncbi.nlm.nih.gov/) or the Ribosomal Database ProjectII (http://rdp.cme.msu.edu/html/). GenBank and its collaborating databases, theEuropean Molecular Biology Laboratory (EMBL; http://www.ebi.ac.uk/embl/)and the DNA Databank of Japan (DDBJ) reached a milestone recently of contain-ing 100 billion bases (100 gigabases) of sequence information from over 165,000organisms, including bacteria, fungi, protozoa, nematodes, and other fauna. TheRibosomal Database Project II, Release 9.35 (Cole et al., 2005), contains nearly198,000 aligned and annotated bacterial small subunit (16S) rRNA gene sequenceswith updated online analyses. Continued development of databases through DNA sequencing is essential and is a prerequisite to good primer and probedesign.
STABLE ISOTOPE PROBING
Among the more exciting advances in molecular ecology is the use of stable iso-tope probing (SIP). This approach allows microbial identity to be linked to functionalactivity through the use of substrates labeled with stable isotopes. It has been used toits best advantage by labeling substrates that are used almost exclusively by the pop-ulation of interest (Radajewski et al., 2000; Wellington et al., 2003; Dumont andMurrell, 2005). In this method, a selected substrate is first highly enriched with a sta-ble isotope, frequently 13C or 15N, and then incorporated into the soil. After a briefincubation, cellular components of interest are recovered from the soil sample andanalyzed for the incorporated stable isotope label. In this way, microbes that areactively using the added substrate can be identified. DNA and rRNA are the bio-markers used most frequently (Radajewski et al., 2003), although PLFAs havealso been used successfully (Treonis et al., 2004). The isotopically labeled nucleicacids are purified from unlabeled nucleic acids by density-gradient centrifugation.Once separated, labeled nucleic acids can be amplified using PCR and universalprimers to Bacteria, Archaea, or Eucarya. Analysis of the PCR products, through
102 Chapter 4 Molecular Methods for Studying Soil Ecology
Ch04-P546807.qxd 11/20/06 3:04 PM Page 102
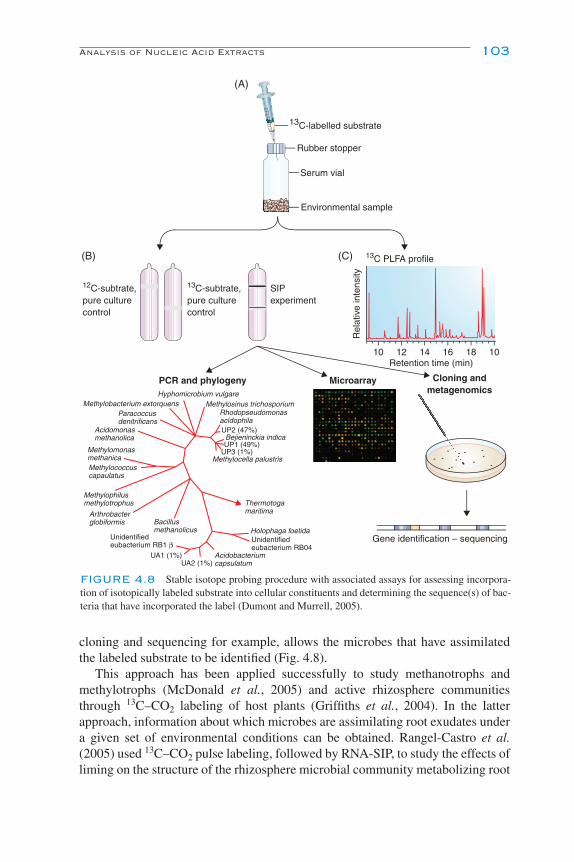
cloning and sequencing for example, allows the microbes that have assimilatedthe labeled substrate to be identified (Fig. 4.8).
This approach has been applied successfully to study methanotrophs andmethylotrophs (McDonald et al., 2005) and active rhizosphere communitiesthrough 13C–CO2 labeling of host plants (Griffiths et al., 2004). In the latterapproach, information about which microbes are assimilating root exudates undera given set of environmental conditions can be obtained. Rangel-Castro et al.(2005) used 13C–CO2 pulse labeling, followed by RNA-SIP, to study the effects ofliming on the structure of the rhizosphere microbial community metabolizing root
Analysis of Nucleic Acid Extracts 103
12C-subtrate,pure culturecontrol
13C-subtrate,pure culturecontrol
SIPexperiment
Rel
ativ
e in
tens
ityRetention time (min)
Cloning andmetagenomics
Gene identification – sequencing
MicroarrayHyphomicrobium vulgare
Methylosinus trichosporiumRhodopseudomonasacidophilaUP2 (47%)
UP1 (49%)UP3 (1%)
UA2 (1%)UA1 (1%)
Unidentifiedeubacterium RB1 β
Bacillusmethanolicus
Arthrobacterglobiformis
Methylophilusmethylotrophus
Methylococcuscapaulatus
Methylomonasmethanica
Acidomonasmethanolica
Paracoccusdenitrificans
Methylobacterium extorquens
Methylocella palustris
Thermotogamaritima
Holophaga foetidaUnidentifiedeubacterium RB04
Acidobacteriumcapsulatum
Bejieninckia indica
PCR and phylogeny
10 12 14 16 18 10
13C-labelled substrate
13C PLFA profile
Rubber stopper
Serum vial
Environmental sample
(A)
(C)(B)
FIGURE 4.8 Stable isotope probing procedure with associated assays for assessing incorpora-tion of isotopically labeled substrate into cellular constituents and determining the sequence(s) of bac-teria that have incorporated the label (Dumont and Murrell, 2005).
Ch04-P546807.qxd 11/20/06 3:04 PM Page 103
104 Chapter 4 Molecular Methods for Studying Soil Ecology
exudates in a grassland. Their results indicated that limed soils contained a micro-bial community that was more complex and more active in using 13C-labeledcompounds in root exudates than were those in unlimed soils. SIP-basedapproaches hold great potential for linking microbial identity with function(Dumont and Murrell, 2005), but at present a high degree of labeling is necessaryto be able to separate labeled from unlabeled marker molecules. This need forhigh substrate concentrations may bias community responses. Alternatively, useof long incubation times to ensure that sufficient label is incorporated increasesthe risk of having cross-feeding of 13C from the primary consumers to the rest ofthe community, complicating data interpretation. Another complicating factor isidentifying enriched nucleic acids within the density gradient. The point at whicha given nucleic acid molecule is retrieved from the CsCl gradient is a function ofboth the incorporation of the heavy isotope and the overall G � C content of thenucleic acids. Thus, a means to attribute band position in the gradient to eitherlabel incorporation or high G � C content must be devised.
PARTIAL COMMUNITY ANALYSES—PCR-BASED ASSAYS
PCR involves the separation of a double-stranded DNA template into two strands(denaturation), the hybridization (annealing) of oligonucleotide primers (shortstrands of nucleotides of a known sequence) to the template DNA, and then the elon-gation of the primer–template hybrid by a DNA polymerase enzyme. During PCR,each of these steps is accomplished by regulating the heat of the reaction. Thetemperature is raised to 92–96°C to denature the template DNA and then loweredto 42–65°C to allow the primers to anneal to the template. The temperature is thenraised to 72°C or the ideal temperature for the activity of the DNA polymeraseused in the reaction. This cycle is repeated from 25 to 30 times, each cycle dou-bling the number of products (amplicons) in the reaction (Fig. 4.9). The discoveryof thermal-stable DNA polymerases from organisms such as Thermus aquaticus(Taq polymerase) has made PCR possible as a standard protocol in laboratoriesaround the world (Mullis and Faloona, 1987; Saiki et al., 1988) and led to the awardof a Nobel Prize to Kary Mullis in 1993.
The temperatures chosen at each step in the thermal cycling are specific to eachprotocol. The annealing step is a critical choice. Lower temperatures are less strin-gent and may allow base “mismatch” to occur when the primer binds to the tem-plate. Higher annealing temperatures are more stringent and therefore primersbind with higher fidelity to their target sequences. The potential target genes forPCR are many and varied, limited only by available sequence information. Theprimers used for soil ecological studies may target specific DNA sequences, suchas those coding for the small subunit (SSU) rRNA genes; sequences of genes of known function; or sequences that are repeated within microbial genomes (rep-PCR); or arbitrary primers may be used to generate a PCR “fingerprint.”
Ch04-P546807.qxd 11/20/06 3:04 PM Page 104

Primers can be selected to target different levels of taxonomic resolution.Ribosomal RNA genes are highly conserved and therefore discriminate betweensequences at the genus level or above. Repeat-sequence and arbitrary primers areused to discriminate at a finer scale, separating isolates at the strain level. Severaloligonucleotides used commonly in PCR fingerprinting and their level of resolu-tion are listed in Table 4.3. While small subunit rRNA genes are used successfullyin community analysis, they are able to resolve bacterial and archaeal groups onlyat higher levels of taxonomic classification.
By far the more common targets for characterizing microbial communitiesare the rRNA genes because of their importance in establishing phylogenetic andtaxonomic relationships (Woese et al., 1990). These are the SSU rRNA genes, 16S
Partial Community Analyses—PCR-Based Assays 105
Target DNA Temperature (°C)
Denaturation
Denaturation
Denaturation
Primerannealing
Primerextension
Primer annealing
Cyc
le o
neC
ycle
two
Repetitive PCR cycles
Extension
Denaturation
3�30 60 72 955�
5�
3�
5�
3�
5�
3�
3�
5�
5�
3�
5�
3�
3�
5�
3�
5�
5�
5�
3�
3�
3�
3�
5�
5�
3�
5�
FIGURE 4.9 Mechanics of the polymerase chain reaction. The right depicts the temperaturevariation occurring in a thermal cycler during the reaction. The left illustrates how the DNA templateand primers interact to copy the target DNA during the changes in temperature as cycling proceeds.
Ch04-P546807.qxd 11/20/06 3:04 PM Page 105

in Bacteria and Archaea or 18S in Eucarya; the large subunit (LSU) rRNA genes,23S in Bacteria and Archaea or 28S in Eucarya; or the internal transcribed spacer(ITS) regions, sequences that lie between the SSU and the LSU genes. Otherdefined targets are genes that code for ecologically significant functions, such asgenes that code for proteins involved in nitrogen fixation, e.g., nif H, whichencodes the iron protein of nitrogenase reductase; amoA, which codes for ammoniummonooxygenase, a key enzyme in nitrification reactions; and nirS, which codesfor nitrite reductase, a key enzyme in denitrification reactions.
In any study in which PCR is used, sources of bias must be considered (v.Wintzingerode et al., 1997). The main sources of bias in amplifying soil communityDNA are: (i) the use of very small sample sizes (typically only 500 mg of soil), whichmay represent only a small fraction of the whole soil community; (ii) preferentialamplification of some DNA templates over others due to the greater ease of bindingof DNA polymerase to some sequences over others; and (iii) for amplification of therRNA genes, the fact that many bacteria contain multiple copies of these operons(e.g., Bacillus and Clostridium species contain 15 copies), hence sequences fromsuch species will be overrepresented among the amplification products. In addition,chimeras, composed of double-stranded DNA in which each strand was derived froma different organism rather than a single organism, may be generated. This latterproblem is sometimes a consequence of using too many cycles in the PCR.Acknowledged biases associated with PCR are generally why diversity indicescalculated from the results of PCR-based experiments may not be very robust andtheir use is not encouraged.
An advance in PCR analysis that allows specific gene targets to be quantified is quantitative PCR (qPCR), also called real-time PCR. qPCR is a method thatemploys fluorogenic probes or dyes to quantify the number of copies of a targetDNA sequence in a sample. This approach has been used successfully to quantify
106 Chapter 4 Molecular Methods for Studying Soil Ecology
TABLE 4.3 Examples of Primers Used Commonly for Amplifying DNA Extracted from Soilor to Characterize Soil Bacterial Isolates
Name Target gene Target Reference
27F- 16S rRNA Small subunit ribosomal Lane, 19911392R RNA gene1490F- ITS between 16S Internal transcribed spacer Navarro et al., 1992; 132R and 23S rRNA Ponsonnet and Nesme, 1994amoA-1F- amoA Ammonia monooxygenase Rotthauwe et al., 1997amoA-2RPolF- nifH Dinitrogenase reductase Poly et al., 2001PolRA189- pmoA Particulate methane Horz et al., 2001A682 monooxygenaseERIC 1R- Repeated Enterobacterial repetitive Versalovic et al., 1991ERIC 2 elements intergenic consensus sequencesREP1R- Repeated Repetitive extragenic Versalovic et al., 1994REP 2 elements palindromic sequences
Ch04-P546807.qxd 11/20/06 3:04 PM Page 106

target genes that reflect the capacity of soil bacteria to perform given functions.Examples include the use of ammonia monooxygenase (amoA), nitrite reductase(nirS or nirK), and particulate methane monooxygenase (pmoA) genes to quan-tify ammonia-oxidizing (Hermansson and Lindgren, 2001), denitrifying (Henryet al., 2004), and methanotrophic (Kolb et al., 2003) bacteria, respectively, in soilsamples. qPCR coupled with primers to specific ITS or rRNA gene sequences hasalso been used to quantify ectomycorrhizal (Landeweert et al., 2003) andendomycorrhizal fungi (Filion et al., 2003) as well as cyst nematodes (Madani et al., 2005) in soil.
ELECTROPHORESIS OF NUCLEIC ACIDS
Amplified PCR products are visualized most often by running samples in anelectrophoretic gel; staining the DNA within the gel with ethidium bromide, SYBRGreen I, or another fluorescent dye with a high-affinity binding to DNA; and view-ing the stained, separated PCR products under UV light. Nucleic acids are nega-tively charged and will run to the positive pole in an electric field. The gel matrixprovides resistance to the movement of nucleic acids through it by virtue of thepore sizes within the gel, such that DNA fragments of smaller size will movethrough the matrix faster than those of a larger size. A standard molecular weightmarker is typically run along with samples to enable the size of PCR products to beassigned during gel analysis. The analysis of the amplified products is based on thepresence and pattern of DNA bands of various sizes contained in the gel matrix.
Agarose is the most popular medium for electrophoretic separation of medium-and large-sized nucleic acids. Agarose has a large working range, but poor resolu-tion compared with polyacrylamide. Depending upon the agarose concentrationused, nucleic acids between 0.1 and 70 kb in size can be separated. Polyacrylamideis the preferred matrix for separating proteins, single-stranded DNA fragmentsup to 2000 bases in length, or double-stranded DNA fragments of less than 1 kb.Polyacrylamide gels have excellent resolving power as they separate macromole-cules on the basis of configuration in addition to the more commonly exploitedcharacteristics of size, charge, and G � C content. This shape-dependent mobilityforms the basis of a suite of techniques that exploit inter- and intrastrand nucleotideinteractions and can be used to screen amplified DNA rapidly for very fine-scalesequence differences. These techniques include single-strand conformation poly-morphism (Dewit and Klatser, 1994), denaturing (or temperature) gradient gel elec-trophoresis (DGGE or TGGE) (Muyzer and Smalla, 1998), and heteroduplexmobility assays (Espejo and Romero, 1998). Because the electrophoretic mobility ofnucleic acids using these techniques is highly sequence dependent, these tech-niques are often used in studies of genetic diversity.
PCR FINGERPRINTING
PCR fingerprinting can be accomplished by several different methods, all ofwhich are aimed at distinguishing differences in the genetic makeup of microbial
Partial Community Analyses—PCR-Based Assays 107
Ch04-P546807.qxd 11/20/06 3:04 PM Page 107

populations from different samples. The advantage of these techniques is that theyare rapid in comparison with sequencing methods, thus enabling high samplethroughput, and can be used to target sequences that are phylogenetically or func-tionally significant. Depending on the primers chosen, PCR fingerprints can beused to distinguish between isolates at the strain level or to characterize targetmicrobes at the community level. The more common PCR fingerprinting tech-niques in use today for characterizing soil microbial community composition areDGGE or TGGE (Muyzer and Smalla, 1998) and terminal restriction fragmentlength polymorphism (T-RFLP) analysis (Liu et al., 1997; Clement et al., 1998).Both techniques can be used to separate PCR products that are initially of a similarlength by employing additional methods to separate the amplicons into a greaternumber of bands that are then used for community comparisons.
DGGE and TGGE are identical in principle (Fig. 4.10). Both techniques imposea parallel gradient of denaturing conditions along a polyacrylamide gel. Double-stranded DNA (dsDNA) PCR amplicons are loaded in wells at the top of the gel and,as the DNA migrates, the denaturing conditions of the gel gradually increase. InDGGE, the denaturant is typically urea; in TGGE it is temperature. Because nativedsDNA is a compact structure, it migrates faster than partially denatured DNA. Thesequence of a fragment determines the point in the gradient gel at which denaturationwill start to retard mobility. Sequence affects duplex stability by both percentageG � C content and neighboring nucleotide interactions (e.g., GGA is more stablethan GAG). The resulting gel yields a ladder of bands in each lane characteristic ofthe DNA extracted and amplified from the original sample. There is not a directcorrespondence between bands in the DGGE gel and organism diversity, however.Sequences amplified from the DNA of different organisms may have similar melt-ing properties in the presence of the denaturant and thus occupy the same band inthe denaturing gel. DNA fragments cloned from different bands may yield as manydifferent sequences as clones analyzed. Since there is not a one-to-one correspondencebetween bands and taxa, the bands are referred to as operational taxonomic units(OTUs). The OTUs form the basis of similarity and multivariate analyses of dataderived from various soil communities.
While the power of DGGE and TGGE to detect PCR amplicon diversity withina single gel is high, the sensitivity of the technique to variations in experimentalconditions makes comparisons between gels very difficult. These techniques aretherefore of greatest use in a preliminary screening to aid recognition of samplediversity. The resolving power of these and other gel-based analyses is limited bythe number of bands capable of “fitting” and being counted as individual bands on asingle gel. In practice, no more than 100 distinct sequence types may be resolveddespite the potential for single base-pair sensitivity. An important advantage thatDGGE analysis has over T-RFLP (see below) is that PCR amplicons of interest thatare resolved on a DGGE gel can be excised from the gel, reamplified, cloned, andsequenced, thereby obtaining taxonomic and/or phylogenetic information aboutamplifiable members of the soil community. For phylogenetic assignment of clonedsequences, variable regions within the SSU rRNA genes are amplified. An important
108 Chapter 4 Molecular Methods for Studying Soil Ecology
Ch04-P546807.qxd 11/20/06 3:04 PM Page 108

disadvantage of the gradient gel approach is that the amplicon size must be restrictedto under 600 bp in length to optimize separation within the gel matrix. Therefore,full-length rRNA gene sequences cannot be recovered using these methods. DGGEand TGGE are now being applied frequently in soil microbial ecology to comparethe structures of complex microbial communities and to study their dynamics.
T-RFLP analysis, as in DGGE analysis, begins with amplifying soil commu-nity DNA using targeted primers, but with the key differences that one or bothprimers are labeled with a fluorochrome(s) and that resulting amplicons are cutwith restriction enzymes to create DNA fragments of varying size, fluor-labeled ateither the 5� or the 3� end (Fig. 4.11). These terminal fragments are then sized against
Partial Community Analyses—PCR-Based Assays 109
V1
1
V2
338
Promoter
GC clamp
tRNA gene
16S 23S 5S
Terminator
Forward primer
518
Reverse primer
V3 V4 V5 V7 V8 V9
1542 bp
(A)
Sta
ckin
gge
lD
enat
urin
g gr
adie
nt g
el
Incr
easi
ng d
enat
uran
tco
ncen
trat
ion
Higher Tm
LowTm
(B)
FIGURE 4.10 (A) Schematic representation of the denaturing gradient gel electrophoresis(DGGE) technique. In DGGE, the forward primer (f318) is tagged with a GC clamp to prevent thedouble strands from completely separating. Along with the reverse primer (r518), it amplifies the V3region of the 16S rRNA gene in target DNA. (B) When amplified DNA products are loaded on a dena-turing gradient gel and run in an electric field, the products separate according to their total ratio of A:Tvs G:C base pairs and the locations of these base pairs relative to each other (with permission from R. Kantety, Alabama A&M).
Ch04-P546807.qxd 11/20/06 3:04 PM Page 109
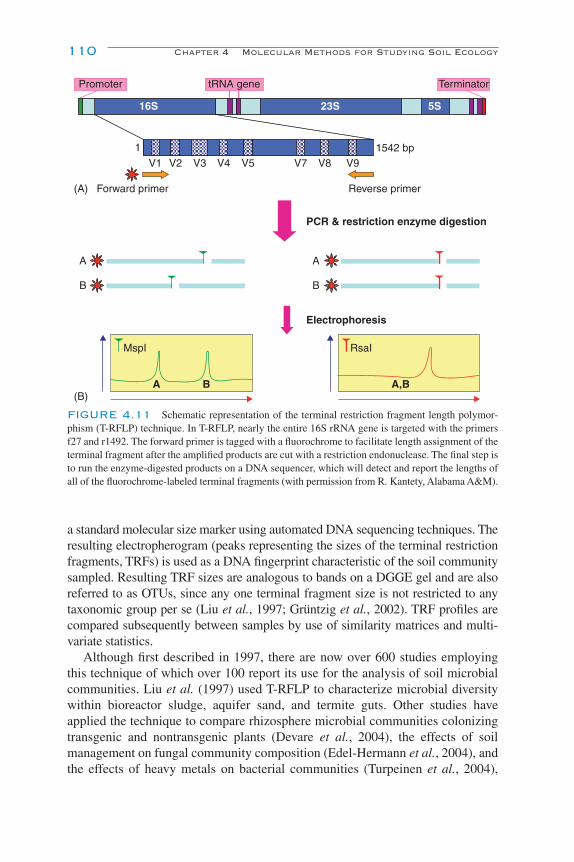
110 Chapter 4 Molecular Methods for Studying Soil Ecology
V1
1
V2
Promoter tRNA gene
16S 23S 5S
Terminator
V3 V4 V5 V7 V8 V91542 bp
Reverse primer
PCR & restriction enzyme digestion
Electrophoresis
Forward primer
A
B
A
B
MspI RsaI
A B A,B
(A)
(B)
FIGURE 4.11 Schematic representation of the terminal restriction fragment length polymor-phism (T-RFLP) technique. In T-RFLP, nearly the entire 16S rRNA gene is targeted with the primersf27 and r1492. The forward primer is tagged with a fluorochrome to facilitate length assignment of theterminal fragment after the amplified products are cut with a restriction endonuclease. The final step isto run the enzyme-digested products on a DNA sequencer, which will detect and report the lengths ofall of the fluorochrome-labeled terminal fragments (with permission from R. Kantety, Alabama A&M).
a standard molecular size marker using automated DNA sequencing techniques. Theresulting electropherogram (peaks representing the sizes of the terminal restrictionfragments, TRFs) is used as a DNA fingerprint characteristic of the soil communitysampled. Resulting TRF sizes are analogous to bands on a DGGE gel and are alsoreferred to as OTUs, since any one terminal fragment size is not restricted to anytaxonomic group per se (Liu et al., 1997; Grüntzig et al., 2002). TRF profiles arecompared subsequently between samples by use of similarity matrices and multi-variate statistics.
Although first described in 1997, there are now over 600 studies employingthis technique of which over 100 report its use for the analysis of soil microbialcommunities. Liu et al. (1997) used T-RFLP to characterize microbial diversitywithin bioreactor sludge, aquifer sand, and termite guts. Other studies haveapplied the technique to compare rhizosphere microbial communities colonizingtransgenic and nontransgenic plants (Devare et al., 2004), the effects of soil management on fungal community composition (Edel-Hermann et al., 2004), andthe effects of heavy metals on bacterial communities (Turpeinen et al., 2004),
Ch04-P546807.qxd 11/20/06 3:04 PM Page 110
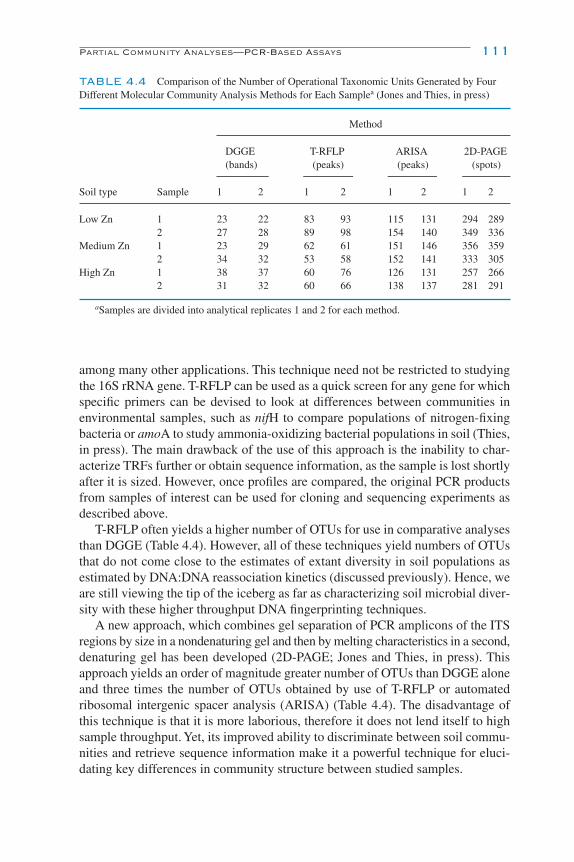
among many other applications. This technique need not be restricted to studyingthe 16S rRNA gene. T-RFLP can be used as a quick screen for any gene for whichspecific primers can be devised to look at differences between communities inenvironmental samples, such as nifH to compare populations of nitrogen-fixingbacteria or amoA to study ammonia-oxidizing bacterial populations in soil (Thies,in press). The main drawback of the use of this approach is the inability to char-acterize TRFs further or obtain sequence information, as the sample is lost shortlyafter it is sized. However, once profiles are compared, the original PCR productsfrom samples of interest can be used for cloning and sequencing experiments asdescribed above.
T-RFLP often yields a higher number of OTUs for use in comparative analysesthan DGGE (Table 4.4). However, all of these techniques yield numbers of OTUsthat do not come close to the estimates of extant diversity in soil populations asestimated by DNA:DNA reassociation kinetics (discussed previously). Hence, weare still viewing the tip of the iceberg as far as characterizing soil microbial diver-sity with these higher throughput DNA fingerprinting techniques.
A new approach, which combines gel separation of PCR amplicons of the ITSregions by size in a nondenaturing gel and then by melting characteristics in a second,denaturing gel has been developed (2D-PAGE; Jones and Thies, in press). Thisapproach yields an order of magnitude greater number of OTUs than DGGE aloneand three times the number of OTUs obtained by use of T-RFLP or automatedribosomal intergenic spacer analysis (ARISA) (Table 4.4). The disadvantage ofthis technique is that it is more laborious, therefore it does not lend itself to highsample throughput. Yet, its improved ability to discriminate between soil commu-nities and retrieve sequence information make it a powerful technique for eluci-dating key differences in community structure between studied samples.
Partial Community Analyses—PCR-Based Assays 111
TABLE 4.4 Comparison of the Number of Operational Taxonomic Units Generated by FourDifferent Molecular Community Analysis Methods for Each Samplea (Jones and Thies, in press)
Method
DGGE T-RFLP ARISA 2D-PAGE(bands) (peaks) (peaks) (spots)
Soil type Sample 1 2 1 2 1 2 1 2
Low Zn 1 23 22 83 93 115 131 294 2892 27 28 89 98 154 140 349 336
Medium Zn 1 23 29 62 61 151 146 356 3592 34 32 53 58 152 141 333 305
High Zn 1 38 37 60 76 126 131 257 2662 31 32 60 66 138 137 281 291
aSamples are divided into analytical replicates 1 and 2 for each method.
Ch04-P546807.qxd 11/20/06 3:04 PM Page 111

Several additional PCR fingerprinting techniques target the ribosomal genesequences. Ribotyping makes use of differences in the chromosomal positionsor structure of rRNA genes to identify or group isolates of a particular genus orspecies. Ribotyping has been shown to be reproducible and hence has gained pop-ularity for isolate fingerprinting and has found use in bacterial source tracking andother studies in which the similarity of isolates obtained from different samplesneeds to be compared. The most frequently used ribotyping method is to identifyRFLPs of rRNA genes by probing a Southern transfer of genomic DNA that hasbeen hydrolyzed with an endonuclease. In ARDRA, rRNA gene sequences areamplified. In ARISA, the ITS region is amplified. PCR amplicons resulting fromuse of both methods are hydrolyzed subsequently with restriction enzymes andthe resulting variations in restriction fragment sizes are analyzed on a gel. Bandsin the gel are again termed OTUs and similarities and differences between the fin-gerprints from different samples are analyzed using multivariate techniques. Useof ARISA may yield more OTUs from a given sample, but as the number of bandson the gel increases, so does the difficulty one has in resolving individual bands inthe analysis.
SIMILARITY ANALYSES
The successful application of molecular techniques to population studies, par-ticularly those based on the analysis of DNA or RNA in a gel matrix, relies heavilyon the correct interpretation of the banding or spot patterns observed on elec-trophoretic gels. Gel images are typically digitized and band detection software isused to mark the band locations in the gel. The resulting band pattern is then exportedto a statistical software package for analysis. Some analyses require that the fin-gerprint patterns obtained are first converted to presence/absence matrices; althoughaverage band density data are also used. The matrices generated are then comparedusing cluster analysis, multidimensional scaling, principal component analysis,redundancy analysis, canonical correspondence analysis, or additive main effectsmultiplicative interaction model, among others. Each analysis will allow communitycomparisons, yet each has associated strengths and weaknesses. There are a num-ber of software packages available that will enable one to compare and score PCRfingerprints and produce similarity values for a given set of samples. Software pack-ages, such as BioNumerics and GelCompar (Applied Maths, Kortrijk, Belgium),Canoco (Microcomputing, Ithaca, NY, USA), and PHYLIP (freeware via GenBankand the RDPII), among others, are used commonly.
LEVEL OF RESOLUTION
Genes change as they acquire fixed mutations over time. The number of differ-ences between two homologous sequences reflects both the evolutionary rate ofthe sequences and the time separating them, in other words—how long it has been
112 Chapter 4 Molecular Methods for Studying Soil Ecology
Ch04-P546807.qxd 11/20/06 3:04 PM Page 112

since they had a common ancestor. Consequently, different sequences need to beselected to resolve variation at different taxonomic levels. In general, noncodingDNA evolves faster than transcribed DNA, since it is under no selection pressureto remain unchanged; therefore, intergenic spacer regions evolve more rapidlythan other sequences. Next is the “wobble” position of protein-coding genes, andslowest to change are the structural rRNA genes. The information that can beobtained from the use of molecular approaches depends on the analysis techniquechosen. The level of resolution required, coupled with study aims, will largelyguide the choice of technique used for a given study (Fig. 4.3).
OTHER FACTORS THAT MAY AFFECTMOLECULAR ANALYSES
SAMPLE HANDLING
Any study of soil microbial ecology requires that we consider the spatial and tem-poral interactions of potential reactants such as soil type and moisture content.Hence, the time, location, season of sampling, sample volume, mixing, compositing,and replication are all important for deriving meaningful data (see Chap. 3). Sinceall samples are by their nature small volumes on which measurements are taken torepresent the whole soil, scaling errors can occur frequently. For molecular analy-ses, it is critical that representative samples are taken, that samples are protectedfrom change between the field and the time they are analyzed in the laboratory,and that samples are not contaminated either by inadvertent mixing with eachother or by coming in contact with other samples during handling, transport, andanalysis. To avoid altering the composition of the microflora prior to analysis, soilsamples should be stabilized as soon as practicable. For molecular measures, soilshould be frozen immediately at –20°C and processed within several weeks ofsampling. If analyses will be significantly delayed, soil should be stored at –80°C.Unlike sampling for soil chemical and physical parameters, soil drying should beavoided entirely when intended for analyzing microbial populations.
SOIL CHEMICAL FACTORS
Among the key chemical factors that may interfere with molecular analysis ofsoil communities are soil constituents with cation and anion exchange capacity, suchas humic acids, clays, and soil organic matter (SOM). Clay minerals and SOMpossess a net negative charge. Individual, negatively charged clay particles in amoist soil will be surrounded by hydrated cations, which create a localized zoneof positive charge. This will attract microorganisms, which possess a net negativecharge at the pH of most soil habitats. Binding of bacteria to solid surfaces throughsuch ionic interactions makes it difficult to separate both cells and DNA/RNAreleased from cells from the soil matrix. Soil type has a significant influence on
Other Factors that may Affect Molecular Analyses 113
Ch04-P546807.qxd 11/20/06 3:04 PM Page 113

DNA/RNA extraction efficiency. Nucleic acid extraction may be particularly prob-lematic from soils with high clay, organic matter, and/or humic contents. Effectiveremoval of humic acids is often required prior to quantifying or amplifying DNA.
Humic substances inhibit Taq DNA polymerase in the PCR, interfere withrestriction enzyme digestion, and reduce transformation efficiency during cloningand DNA hybridization specificity. Humic substances are difficult to remove as theyremain soluble under conditions similar to those of DNA; hence, direct extractionof DNA may require an additional purification step to obtain DNA of sufficientpurity for downstream assays. Use of polyvinylpyrrolidone may help to removeSOM from the cell preparations. Subsequent cesium chloride density gradient cen-trifugation yields DNA of high quality. Despite their effectiveness, these proceduresare too labor intensive for use in large experiments. DNA extraction kits are availablethat include improved DNA clean-up steps and yield higher quality DNA extractswith fewer impurities that affect downstream DNA analyses.
The presence of humic acids and SOM also interferes with fluorescencemicroscopy. Nonspecific background fluorescence caused by binding of dyes tocharged particles makes it difficult to resolve and quantify soil microorganisms. Ifmicroscopic images will be subject to image analysis, it also becomes difficult to“train” the software to separate cells from inorganic particles and produce anaccurate count.
SAMPLING SCALE
High spatial heterogeneity of soil influences the diversity of microbes and theirfunction. Spatial heterogeneity in soil microbial communities occurs at manyscales, from soil particles (e.g., soil microaggregates) to the plant rhizosphere, tofield plots, and to the ecosystem and global levels. In order to improve our knowl-edge of how microbial community structure influences ecosystem function, wemust obtain more quantitative knowledge of the interaction between microbes,plant residues, and soil management at a variety of spatial scales.
SUMMARY
We have come a long way in developing our understanding of microbial ecology,but have many milestones yet to meet. Molecular tools offer unparalleled oppor-tunities to characterize microbes in culture and directly from field soils. Thesetools are allowing us to ask questions at much larger geographic scales than hasbeen possible previously. We are now able to examine such issues as how micro-bial populations vary across soil types and climatic zones, in association withplant roots and between various plant species, and in response to soil managementor soil pollution. We are now just seeing the tip of the iceberg in terms of soilmicrobial diversity with the use of molecular approaches. The amount of workthat remains is daunting, yet exciting as so much remains to be discovered. Recenttechniques developed for the study of microbial populations, such as T-RFLP and
114 Chapter 4 Molecular Methods for Studying Soil Ecology
Ch04-P546807.qxd 11/20/06 3:04 PM Page 114
DGGE, allow access to the very large proportion of organisms that are present inthe soil and which remain unculturable under laboratory conditions. Other tech-niques, such as RFLP analysis of isotopically labeled, amplified nifH, amoA,nirS, and pmoA sequences or SIP will allow us to target, with high specificity,organisms or groups of organisms responsible for specific functions in soil, par-ticularly those involved in key transformations in the C, N, and S nutrient cycles.These types of technical developments open new horizons of research and appli-cations that will allow a far more complete and less biased view of microbialdiversity and function in soils.
REFERENCES
Amann, R. I., and Ludwig, W. (2000). Ribosomal RNA-targeted nucleic acid probes for studies inmicrobial ecology. FEMS Microbiol. Rev. 24, 555–565.
Amann, R. I., Ludwig, W., and Schleifer, K. H. (1995). Phylogenetic identification and in situ detec-tion of individual microbial cells without cultivation. Microbiol. Rev. 59, 143–169.
Amann, R. I., Krumholz, L., and Stahl, D. A. (1990). Fluorescent oligonucleotide probing of wholecells for determinative, phylogenetic, and environmental studies in microbiology. J. Bacteriol.172, 762–770.
Binnerup, S. J., Bloem, J., Hansen, B. M., Wolters, W., Veninga, M., and Hansen, M. (2001).Ribosomal RNA content in microcolony forming soil bacteria measured by quantitative 16S rRNAhybridization and image analysis. FEMS Microbiol. Ecol. 37, 231–237.
Bringhurst, R. M., Cardon, Z. G., and Gage, D. J. (2002). Galactosides in the rhizosphere: Utilizationby Sinorhizobium meliloti and development of a biosensor. Proc. Natl. Acad. Sci. 98, 4540–4545.
Bruns, M. A., and Buckley, D. H. (2002). Isolation and purification of microbial community nucleicacids from environmental samples. In “Manual of Environmental Microbiology.” 2nd ed.(C. J. Hurst, ed.). ASM Press, Washington, DC.
Campbell, N. A., and Reece, J. B. (2005). “Biology.” 7th ed. Pearson, Benjamin–Cummings, San Francisco.Chalfie, M., Tu, Y., Euskirchen, G., Ward, W. W., and Prasher, D. C. (1994). Green fluorescent protein
as a marker for gene expression. Science 263, 802–895.Clement, B. G., Kehl, L. E., DeBord, L., and Kitts, C. L. (1998). Terminal restriction fragment patterns
(TRFPs), a rapid, PCR-based method for the comparison of complex bacterial communities.J. Microbiol. Methods 31, 135–142.
Cole, J. R., Chai, B., Farris, R. J., Wang, Q., Kulam, S. A., McGarrell, D. M., Garrity, G. M., andTiedje, J. M. (2005). The Ribosomal Database Project (RDP-II): sequences and tools for high-throughput rRNA analysis. Nucleic Acids Res. 33(database issue), D294–D296. doi:10.1093/nar/gki038.
Denef, V. J., Park, J., Rodriques, J. L. M., Tsoi, T. V., Hashsham, S. A., and Tiedje, J. M. (2003).Validation of a more sensitive method for using spotted oligonucleotide DNA microarrays forfunctional genomics studies on bacterial communities. Environ. Microbiol. 5, 933–943.
Devare, M., Jones, C. M., and Thies, J. E. (2004). Effects of CRW transgenic corn and tefluthrin on thesoil microbial community: biomass, activity, and diversity. J. Environ. Qual. 33, 837–843.
Dewit, M. Y. L., and Klatser, P. R. (1994). Mycobacterium leprae isolates from different sources haveidentical sequences of the spacer regions between the 16S and 23S ribosomal RNA genes.Microbiology 140, 1983–1987.
Dumont, M. G., and Murrell, J. C. (2005). Stable isotope probing—linking microbial identity to func-tion. Nat. Rev. 3, 499–504.
Edel-Hermann, W., Dreumont, C., Perez-Piqueres, A., and Steinberg, C. (2004). Terminal restrictionfragment length polymorphism analysis of ribosomal RNA genes to assess changes in fungal com-munity structure in soils. FEMS Microbiol. Ecol. 47, 397–404.
References 115
Ch04-P546807.qxd 11/20/06 3:04 PM Page 115
Ekins, R., and Chu, F. W. (1999). Microarrays: their origins and applications. Trends Biotechnol. 17,217–218.
Errampalli, D., Leung, K., Cassidy, M. B., Kostrzynska, M., Blears, M., Lee, H., and Trevors, J. T.(1999). Applications of the green fluorescent protein as a molecular marker in environmentalmicroorganisms. J. Microbiol. Methods 35, 187–199.
Espejo, R. T., and Romero, J. (1998). PAGE analysis of the heteroduplexes formed between PCR-amplified 16S rRNA genes: estimation of sequence similarity and rDNA complexity. Microbiology144, 1611–1617.
Felske, A., Engelen, B., Nübel, U., and Backhaus, H. (1996). Direct ribosome isolation from soil toextract bacterial rRNA for community analysis. Appl. Environ. Microbiol. 62, 4162–4167.
Filion, M., St-Arnaud, M., and Jabaji-Hare, S. H. (2003). Direct quantification of fungal DNA fromsoil substrate using real-time PCR. J. Microbiol. Methods 53, 67–76.
Gans, J., Wolinsky, M., and Dunbar, J. (2005). Computational improvements reveal great bacterialdiversity and high metal toxicity in soil. Science 309, 1387–1390.
Griffiths, R. I., Manefield, M., Ostle, N., McNamara, N., O’Donnell, A. G., Bailey, M. J., and Whiteley, A. S. (2004). 13CO2 pulse labelling of plants in tandem with stable isotope probing: methodological considerations for examining microbial function in the rhizosphere.J. Microbiol. Methods 58, 119–129.
Grüntzig, V., Stres, B., Ayala del Río, H. L., and Tiedje, J. M. (2002). Improved protocol for T-RFLPanalysis by capillary electrophoresis. Center for Microbial Ecology, Michigan State Univ., EastLansing (http://rdp8.cme.msu.edu/html/t-rflp_jul02.html).
Guschin, D. Y., Mobarry, B. K., Proudnikow, D., Stahl, D. A., Rittmann, B. E., and Mirzabekov, A. D.(1997). Oligonucleotide microchips and genosensors for determinative and environmental studiesin microbiology. Appl. Environ. Microbiol. 63, 2397–2402.
Henry, S., Baudoin, E., Lopez-Gutierrez, J. C., Martin-Laurent, F., Baumann, A., and Philippot, L.(2004). Quantification of denitrifying bacteria in soils by nirK gene targeted real-time PCR. J.Microbiol. Methods 59, 327–335.
Hermansson, A., and Lindgren, P. E. 2001. Quantification of ammonia-oxidizing bacteria in arable soilby real-time PCR. Appl. Environ. Microbiol. 67, 972–976.
Heuer, H., Hartung, K., Wieland, G., Kramer, I., and Smalla, K. (1999). Polynucleotide probes that tar-get a hypervariable region of 16S rRNA genes to identify bacterial isolates corresponding to bandsof community fingerprints. Appl. Environ. Microbiol. 65, 1045–1049.
Horz, H. P., Yimga, M. T., and Liesack, W. (2001). Detection of methanotroph diversity on roots ofsubmerged rice plants by molecular retrieval of pmoA, mmoX, mxaF, and 16S rRNA and riboso-mal DNA, including pmoA-based terminal restriction fragment length polymorphism profiling.Appl. Environ. Microbiol. 67, 4177–4185.
Jones, C. M., and Thies, J. E. (2006). Soil microbial community analysis using two-dimensional polyacrylamide gel electrophoresis of the bacterial ribosomal internal transcribed spacer region. J. Microbiol. Methods. In press.
Kolb, S., Knief, C., Stubner, S., and Conrad, R. (2003). Quantitative detection of methanotrophs in soilby novel pmoA-targeted real-time PCR assays. Appl. Environ. Microbiol. 69, 2423–2429.
Kowalchuk, G.A., de Bruijn, F. J., Head, I. M., Akkermans, A. D. L., and van Elsas, J. D. (2003).“Molecular Microbial Ecology Manual” 2nd ed. Kluwer Academic Publishers, The Netherlands.
Landeweert, R., Veenman, C., Kuyper, T. W., Fritze, H., Wernars, K., and Smit, E. (2003).Quantification of ectomycorrhizal mycelium in soil by real-time PCR compared to conventionalquantification techniques. FEMS Microbiol. Ecol. 45, 283–292.
Lane, D. J. (1991). 16S/23S rRNA sequencing. In “Nucleic Acid Techniques in Bacterial Systematics”(E. Stackebrandt and M. Goodfellow, eds.), pp. 115–175. Wiley, Chichester.
Lee, N., Nielsen, P. H., Andreasen, K. H., Juretschko, S., Nielsen, J. L., Schleifer, K.-H., and Wagner, M.(1999). Combination of fluorescent in situ hybridization and microautoradiography—a new toolfor structure–function analyses in microbial ecology. Appl. Environ. Microbiol. 65, 1289–1297.
Li, Y., Dick, W. A., and Tuovinen, O. H. (2004). Fluorescence microscopy for visualization of soilmicroorganisms—a review. Biol. Fertil. Soils 39, 301–311.
116 Chapter 4 Molecular Methods for Studying Soil Ecology
Ch04-P546807.qxd 11/20/06 3:04 PM Page 116
Liu, W. T., Marsh, T. L., Cheng, H., and Forney, L. (1997). Characterization of microbial diversity bydetermining terminal restriction fragment length polymorphisms of genes encoding 16S rRNA.Appl. Environ. Microbiol. 63, 4516–4522.
Liu, W.-T., and Stahl, D. A. (2002). Molecular approaches for the measurement of density, diversityand phylogeny. In “Manual of Environmental Microbiology.” 2nd ed. (C. J. Hurst ed.). ASM Press,Washington, DC.
Loy, A., Horn, M., and Wagner, M. (2003). ProbeBase: an online resource for rRNA-targeted oligonu-cleotide probes. Nucleic Acids Res. 31, 514–516.
Madani, M., Subbotin, S. A., and Moens, M. (2005). Quantitative detection of the potato cyst nema-tode, Globodera pallida, and the beet cyst nematode, Heterodera schachtii, using real-time PCRwith SYBR green I dye. Mol. Cell. Probes 19, 81–86.
Manz, W., Amann, R., Ludwig, W., Wagner, M., Schleifer, K.H. (1992). Phylogenetic oligodeoxy-nucleotide probes for the major subclasses of proteobacteria – Problems and solutions. Syst. Appl.Microbiol. 15, 593–600.
McDonald, I. R., Radajewski, S., and Murrell, J. C. (2005). Stable isotope probing of nucleic acids inmethanotrophs and methylotrophs: a review. Org. Geochem. 36, 779–787.
Moter, A., and Gobel, U. B. (2000). Fluorescence in situ hybridization (FISH) for direct visualizationof microorganisms. J. Microbiol. Methods 41, 85–112.
Mullis, K. B., and Faloona, F. A. (1987). Specific synthesis of DNA in vitro via a polymerase catalysedchain reaction. Methods Enzymol. 155, 335–350.
Muyzer, G., and Smalla, K. (1998). Application of denaturing gradient gel electrophoresis (DGGE)and temperature gradient gel electrophoresis (TGGE) in microbial ecology. Antonie vanLeeuwenhoek Int. J. Gen. Mol. Microbiol. 73, 127–141.
Navarro, E., Simonet, P., Normand, P., and Bardin, R. (1992). Characterisation of natural populationsof Nitrobacter spp. using PCR/RFLP analysis of the ribosomal intergenic spacer. Arch. Microbiol.157, 107–115.
Neufeld, J. D., Yu, Z., Lam, W., and Mohn, W. W. (2004). Serial analysis of ribosomal sequence tags(SARST): a high-throughput method for profiling complex microbial communities. Environ.Microbiol. 6, 131–144.
Nicol, G. W., and Schleper, C. (2006). Ammonia-oxidising Chrenarchaeota: important players in thenitrogen cycle? Trends Microbiol. 14, 207–212.
Ouverney, C. C., and Fuhrman, J. A. (1999). Combined microautoradiography–16S rRNA probe tech-nique for determination of radioisotope uptake by specific microbial cell types in situ. Appl.Environ. Microbiol. 65, 1746–1752.
Poly, F., Ranjard, L., Nazaret, S., Gourbiere, F., and Monrozier, L. J. (2001). Comparison of nifH genepools in soils and soil microenvironments with contrasting properties. Appl. Environ. Microbiol.67, 2255–2262.
Ponsonnet, C., and Nesme, X. (1994). Identification of Agrobacterium strains by PCR-RFLP analysisof pTi and chromosomal regions. Arch. Microbiol. 161, 300–309.
Prasher, D. C., Eckenrode, V. K., Ward, W. W., Prendergast, F. G., and Cormier, M. J. (1992). Primarystructure of the Aequorea victoria green fluorescent protein. Gene 111, 229–233.
Radajewski, S., Ineson, P., Parekh, N. R., and Murrell, J. C. (2000). Stable-isotope probing as a tool inmicrobial ecology. Nature 403, 646–649.
Radajewski, S., McDonald, I. R., and Murrell, J. C. (2003). Stable-isotope probing of nucleic acids: awindow to the function of uncultured microorganisms. Curr. Opin. Biotech. 14, 296–302.
Rangel-Castro, J. I., Killham, K., Ostle, N., Nicol, G. W., Anderson, I. C., Scrimgeour, C. M., Ineson, P.,Meharg, A., and Prosser J. I. (2005). Stable isotope probing analysis of the influence of liming onroot exudate utilization by soil microorganisms. Environ. Microbiol. 7, 828–838.
Rondon, M. R., August, P. R., Betterman, A. D., Brady, S. F., Grossman, T. H., Liles, M. R., Loiacono, K. A.,Lynch, B. A., MacNiel, I. A., Minor, C., Tiong, C. L., Gilman, M., Osburne, M. S., Clardy, J.,Handelsman, J., and Goodman, R. M. (2000). Cloning the soil metagenome: a strategy for access-ing the genetic and functional diversity of uncultured microorganisms. Appl. Environ. Microbiol.66, 2541–2547.
References 117
Ch04-P546807.qxd 11/20/06 3:04 PM Page 117
Roslev, P., Iversen, N., and Henriksen, K. (1998). Direct fingerprinting of metabolically active bacte-ria in environmental samples by substrate specific radiolabelling and lipid analysis. J. Microbiol.Methods 31, 99–111.
Rotthauwe, J.-H., Witzel, K.-P., and Liesack, W. (1997). The ammonia monooxygenase structural geneamoA as a functional marker: molecular fine-scale analysis of natural ammonia-oxidizing popula-tions. Appl. Environ. Microbiol. 63, 4704–4712.
Saiki, R. K., Gelfand, D. H., Stoffel, S., Scharf, S. J., Higuchi, R., Horn, G. T., Mullis, K. B., andErlich, H. A. (1988). Primer-directed enzymatic amplification of DNA with a thermostable DNA-polymerase. Science 239, 487–491.
Sambrook, J., Fritsch, E. F., and Maniatis, T. A. (1989). “Molecular Cloning: A Laboratory Manual.”2nd ed. Cold Spring Harbor Laboratory Press, Cold Spring Harbor, NY.
Sanger, F., Nicklen, S., and Coulson, A. R. (1977). DNA sequencing with chain-terminating inhibitors.Proc. Natl. Acad. Sci. USA 74, 5463–5467.
Schleper, C., Jurgens, G., and Jonuscheit, M. (2005). Genomic studies of uncultivated archaea. Nat.Rev. Microbiol. 3, 479–488.
Stephen, J. R., Kowalchuk, G. A., Bruns, M. A. V., McCaig, A. E., Phillips, C.J., Embley, T.M., andProsser, J. I. (1998). Analysis of beta-subgroup proteobacterial ammonia oxidizer populations insoil by denaturing gradient gel electrophoresis analysis and hierarchical phylogenic probing. Appl.Environ. Microbiol. 64, 2958–2965.
Stuurman, N., Bras, C. P., Schlaman, H. R. M., Wijfjes, A. H. M., Bloemberg, G., and Spaink, H. P.(2000). Use of green fluorescent protein color variants expressed on stable broad-host-range vec-tors to visualize rhizobia interacting with plants. Mol. Plant–Microbe Interact. 13, 1163–1169.
Thies, J. E. (2006). Soil microbial community analysis using T-RFLP: Separating signals from the noise.Soil Sci. Soc. Amer. J. In press.
Torsvik, V., Daae, F.L., Sandaa, R.-A., Øvreas, L. (1998). Novel techniques for analysing microbialdiversity in natural and perturbed environments. J. Bacteriol. 64, 53–62.
Torsvik, V., Goksoyr, J., and Daae, F. L. (1990). High diversity in DNA of soil bacteria. Appl. Environ.Microbiol. 56, 782–787.
Treonis, A. M., Ostle, N. J., Stott, A. W., Primrose, R., Grayston, S. J., and Ineson, P. (2004).Identification of groups of metabolically-active rhizosphere microorganisms by stable isotopeprobing of PLFAs. Soil Biol. Biochem. 36, 533–537.
Turpeinen, R., Kairesalo, T., and Haggblom, M. M. (2004). Microbial community structure and activ-ity in arsenic-, chromium- and copper-contaminated soils. FEMS Microbiol. Ecol. 47, 39–50.
Versalovic, J., Koeuth, T., and Lupski, J. R. (1991). Distribution of repetitive DNA sequences ineubacteria and application to fingerprinting of bacterial genomes. Nucleic Acid. Res. 19, 6823–6831.
Versalovic, J., Schneider, M., de Bruijn, F. J., and Lupski, J. R. (1994). Genomic fingerprinting of bacteriausing repetitive sequence-based polymerase chain reaction. Methods Mol. Cell. Biol. 5, 25–40.
Wellington, E. M. H., Berry, A., and Krsek, M. (2003). Resolving functional diversity in relation tomicrobial community structure in soil: exploiting genomics and stable isotope probing. Curr.Opin. Microbiol. 6, 295–301.
Wintzingerode, F. V., Gobel, U. V., and Stackebrandt, E. (1997). Determination of microbial diversity inenvironmental samples: pitfalls of PCR-based rRNA analysis. FEMS Microbiol. Rev. 21, 213–229.
Woese, C. R., Kandler, O., and Wheelis, M. L. (1990). Towards a natural system of organisms: pro-posal for the domains Archaea, Bacteria and Eucarya. Proc. Natl. Acad. Sci. USA 87, 4576–4579.
Wu, L. Y., Thompson, D. K., Li, G. S., Hurt, R. A., Tiedje, J. M., and Zhou, J. Z. (2001). Developmentand evaluation of functional gene arrays for detection of selected genes in the environment. Appl.Environ. Microbiol. 67, 5780–5790.
Zheng, D., Alm, E. W., Stahl, D. A. and Raskin, L. (1996). Characterization of universal small-subunitrRNA hybridization probes for quantitative molecular microbial ecology studies. Appl. Environ.Microbiol. 62, 4504–4513.
Zhou, J. Z. (2003). Microarrays for bacterial detection and microbial community analysis. Curr. Opin.Microbiol. 6, 288–294.
Zhou, J., and Thompson, D. K. (2002). Challenges in applying microarrays to environmental studies.Curr. Opin. Biotechnol. 13, 204–207.
118 Chapter 4 Molecular Methods for Studying Soil Ecology
Ch04-P546807.qxd 11/20/06 3:04 PM Page 118

5THE PROKARYOTES
Ken Killham
Jim I. Prosser
Introduction
Phylogeny
General Features of Prokaryotes
Cell Structure
Metabolism and Physiology
Biodegradation Capacity
Differentiation, Secondary Metabolism, and AntibioticProduction
Conclusion
References and General Reading
119
INTRODUCTION
Living organisms form three major domains: Bacteria and Archaea, collec-tively termed prokaryotes, and the Eucarya or eukaryotes. Eukaryotic soil organ-isms, including microorganisms, are discussed in Chaps. 6 and 7. Prokaryotes aredistinguished from eukaryotes by the absence of a unit membrane-bound nucleusand, usually, the lack of other cell organelles. Ribosomes in prokaryotes are smaller(70S) than in eukaryotes (80S) and no eukaryote is able to fix atmospheric N2. Theendosymbiotic theory (Margulis, 1993) proposes that the mitochondria and chloro-plasts of eukaryotic cells originated as symbiotic prokaryotic cells. The presenceof bacterial, circular, covalently closed DNA and 70S ribosomes in mitochondriasupports this theory. Despite the apparent, relative simplicity of prokaryotic cells,as a group they have the greater taxonomic and functional diversity. Globally,organic C in prokaryotes is equivalent to that in plants and they contain 10-fold
Ch05-P546807.qxd 11/18/06 6:35 PM Page 119
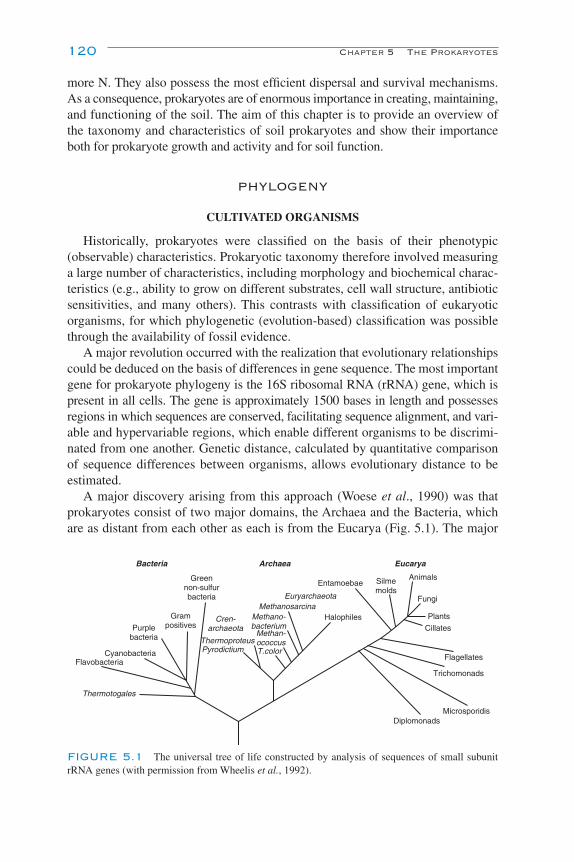
120 Chapter 5 The Prokaryotes
more N. They also possess the most efficient dispersal and survival mechanisms.As a consequence, prokaryotes are of enormous importance in creating, maintaining,and functioning of the soil. The aim of this chapter is to provide an overview ofthe taxonomy and characteristics of soil prokaryotes and show their importanceboth for prokaryote growth and activity and for soil function.
PHYLOGENY
CULTIVATED ORGANISMS
Historically, prokaryotes were classified on the basis of their phenotypic(observable) characteristics. Prokaryotic taxonomy therefore involved measuringa large number of characteristics, including morphology and biochemical charac-teristics (e.g., ability to grow on different substrates, cell wall structure, antibioticsensitivities, and many others). This contrasts with classification of eukaryoticorganisms, for which phylogenetic (evolution-based) classification was possiblethrough the availability of fossil evidence.
A major revolution occurred with the realization that evolutionary relationshipscould be deduced on the basis of differences in gene sequence. The most importantgene for prokaryote phylogeny is the 16S ribosomal RNA (rRNA) gene, which ispresent in all cells. The gene is approximately 1500 bases in length and possessesregions in which sequences are conserved, facilitating sequence alignment, and vari-able and hypervariable regions, which enable different organisms to be discrimi-nated from one another. Genetic distance, calculated by quantitative comparisonof sequence differences between organisms, allows evolutionary distance to beestimated.
A major discovery arising from this approach (Woese et al., 1990) was thatprokaryotes consist of two major domains, the Archaea and the Bacteria, whichare as distant from each other as each is from the Eucarya (Fig. 5.1). The major
Bacteria Archaea Eucarya
Greennon-sulfurbacteria
GrampositivesPurple
bacteria
CyanobacteriaFlavobacteria
Thermotogales
Cren-archaeota
PyrodictiumThermoproteus
Euryarchaeota
T.color
MethanosarcinaMethano-bacterium
Methan-ococcus
Halophiles
Entamoebae Silmemolds
Animals
Fungi
Plants
Cillates
Flagellates
Trichomonads
MicrosporidisDiplomonads
FIGURE 5.1 The universal tree of life constructed by analysis of sequences of small subunitrRNA genes (with permission from Wheelis et al., 1992).
Ch05-P546807.qxd 11/18/06 6:35 PM Page 120

bacterial groups are shown in Figs. 5.1 and 5.2; the major archaeal groups areshown in Fig. 5.1. Each group in these domains is discussed in more detail below.This approach also led to a reanalysis and reappraisal of classification within theArchaea and Bacteria, and major divisions are presented in Tables 5.1 and 5.2.The 16S rRNA gene, while useful in defining high-level taxonomic groups, is lessuseful for fine-scale resolution. This requires analysis of other genes or alternativemethods, e.g., DNA–DNA hybridization, comparison of sequences of severalgenes or of whole genomes, and comparison of proteins (see Chap. 4).
UNCULTIVATED ORGANISMS
Molecular phylogeny was initially based on prokaryotes that could be cultivatedin the laboratory, making 16S rRNA gene sequencing relatively easy. However,
Phylogeny 121
Archaea 0.10
Proteobacteria
Fusobacteria OP11
TM7
TM6
Spirochetes
WS6
Thermus/Deinococcus
Cytophagales
Green sulfurMarine group AFibrobacter
Low G�C gram positive
Cyanobacte
ria
Flex
istipe
s
Syner
gistes
OP
8Te
rmite
gro
up I
Aci
doba
cter
ium
Nito
rspi
raO
S-K
Verrucom
icrobia
Chlam
ydia
OP10
OP5
OP9Dictyoglomus
Coprothermobacter
OP
3
WS1
Planctom
ycetes
Actinobacteria
Green non-sulfur
Thermotogales
Thermodesulfobacterium
Aquificales
FIGURE 5.2 The major phylogenetic divisions within the Bacteria determined by analysis of16S rRNA gene sequences. Unshaded segments represent groups with cultivated representatives, althoughmany of these have very few such representatives. Shaded segments represent sequences obtained bydirect amplification of 16S rRNA genes from environmental DNA, without a cultivation step (withpermission from Hugenholtz et al., 1998).
Ch05-P546807.qxd 11/18/06 6:35 PM Page 121
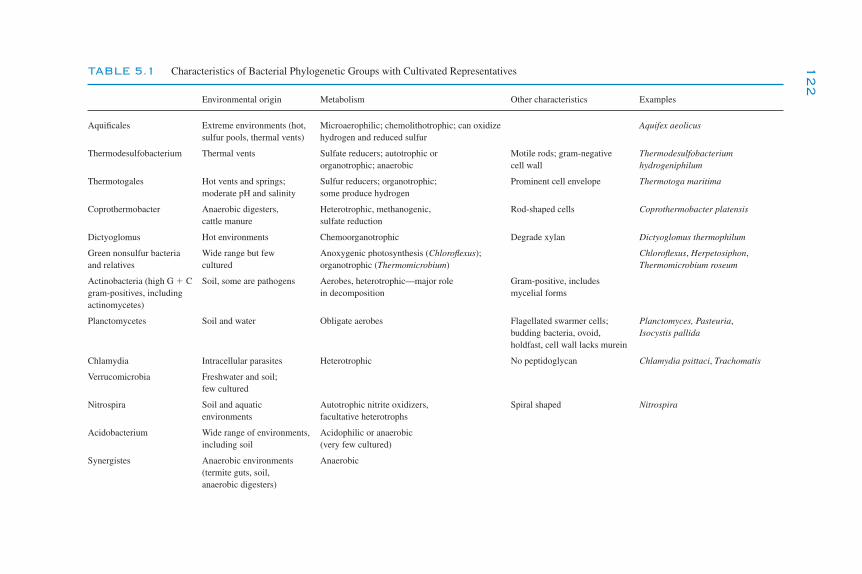
122TABLE 5.1 Characteristics of Bacterial Phylogenetic Groups with Cultivated Representatives
Environmental origin Metabolism Other characteristics Examples
Aquificales Extreme environments (hot, Microaerophilic; chemolithotrophic; can oxidize Aquifex aeolicussulfur pools, thermal vents) hydrogen and reduced sulfur
Thermodesulfobacterium Thermal vents Sulfate reducers; autotrophic or Motile rods; gram-negative Thermodesulfobacterium organotrophic; anaerobic cell wall hydrogeniphilum
Thermotogales Hot vents and springs; Sulfur reducers; organotrophic; Prominent cell envelope Thermotoga maritimamoderate pH and salinity some produce hydrogen
Coprothermobacter Anaerobic digesters, Heterotrophic, methanogenic, Rod-shaped cells Coprothermobacter platensiscattle manure sulfate reduction
Dictyoglomus Hot environments Chemoorganotrophic Degrade xylan Dictyoglomus thermophilum
Green nonsulfur bacteria Wide range but few Anoxygenic photosynthesis (Chloroflexus); Chloroflexus, Herpetosiphon,and relatives cultured organotrophic (Thermomicrobium) Thermomicrobium roseum
Actinobacteria (high G � C Soil, some are pathogens Aerobes, heterotrophic—major role Gram-positive, includesgram-positives, including in decomposition mycelial formsactinomycetes)
Planctomycetes Soil and water Obligate aerobes Flagellated swarmer cells; Planctomyces, Pasteuria, budding bacteria, ovoid, Isocystis pallidaholdfast, cell wall lacks murein
Chlamydia Intracellular parasites Heterotrophic No peptidoglycan Chlamydia psittaci, Trachomatis
Verrucomicrobia Freshwater and soil;few cultured
Nitrospira Soil and aquatic Autotrophic nitrite oxidizers, Spiral shaped Nitrospiraenvironments facultative heterotrophs
Acidobacterium Wide range of environments, Acidophilic or anaerobicincluding soil (very few cultured)
Synergistes Anaerobic environments Anaerobic(termite guts, soil,anaerobic digesters)
Ch05-P546807.qxd 11/18/06 6:35 PM Page 122
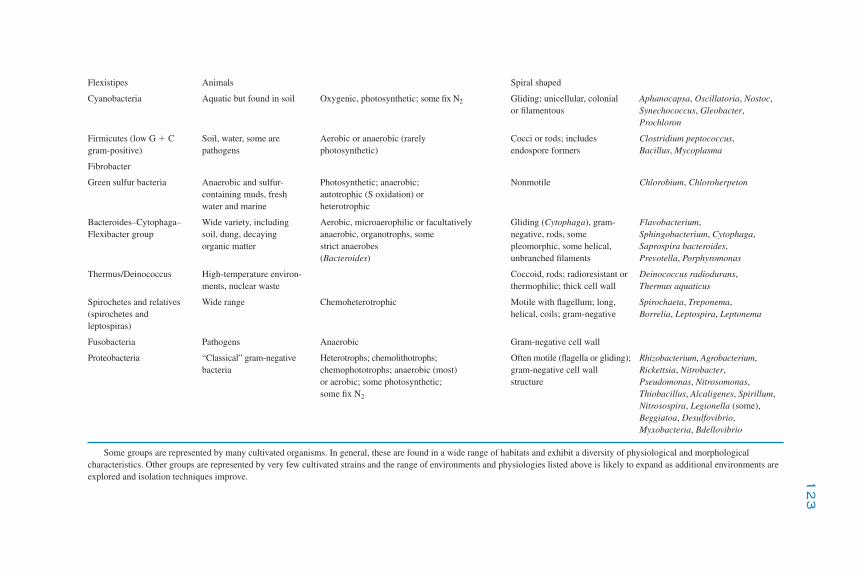
123
Flexistipes Animals Spiral shaped
Cyanobacteria Aquatic but found in soil Oxygenic, photosynthetic; some fix N2 Gliding; unicellular, colonial Aphanocapsa, Oscillatoria, Nostoc,or filamentous Synechococcus, Gleobacter,
Prochloron
Firmicutes (low G � C Soil, water, some are Aerobic or anaerobic (rarely Cocci or rods; includes Clostridium peptococcus,gram-positive) pathogens photosynthetic) endospore formers Bacillus, Mycoplasma
Fibrobacter
Green sulfur bacteria Anaerobic and sulfur- Photosynthetic; anaerobic; Nonmotile Chlorobium, Chloroherpetoncontaining muds, fresh autotrophic (S oxidation) orwater and marine heterotrophic
Bacteroides–Cytophaga– Wide variety, including Aerobic, microaerophilic or facultatively Gliding (Cytophaga), gram- Flavobacterium,Flexibacter group soil, dung, decaying anaerobic, organotrophs, some negative, rods, some Sphingobacterium, Cytophaga,
organic matter strict anaerobes pleomorphic, some helical, Saprospira bacteroides,(Bacteroides) unbranched filaments Prevotella, Porphyromonas
Thermus/Deinococcus High-temperature environ- Coccoid, rods; radioresistant or Deinococcus radiodurans,ments, nuclear waste thermophilic; thick cell wall Thermus aquaticus
Spirochetes and relatives Wide range Chemoheterotrophic Motile with flagellum; long, Spirochaeta, Treponema,(spirochetes and helical, coils; gram-negative Borrelia, Leptospira, Leptonemaleptospiras)
Fusobacteria Pathogens Anaerobic Gram-negative cell wall
Proteobacteria “Classical” gram-negative Heterotrophs; chemolithotrophs; Often motile (flagella or gliding); Rhizobacterium, Agrobacterium,bacteria chemophototrophs; anaerobic (most) gram-negative cell wall Rickettsia, Nitrobacter,
or aerobic; some photosynthetic; structure Pseudomonas, Nitrosomonas,some fix N2 Thiobacillus, Alcaligenes, Spirillum,
Nitrosospira, Legionella (some),Beggiatoa, Desulfovibrio,Myxobacteria, Bdellovibrio
Some groups are represented by many cultivated organisms. In general, these are found in a wide range of habitats and exhibit a diversity of physiological and morphologicalcharacteristics. Other groups are represented by very few cultivated strains and the range of environments and physiologies listed above is likely to expand as additional environments areexplored and isolation techniques improve.
Ch05-P546807.qxd 11/18/06 6:35 PM Page 123
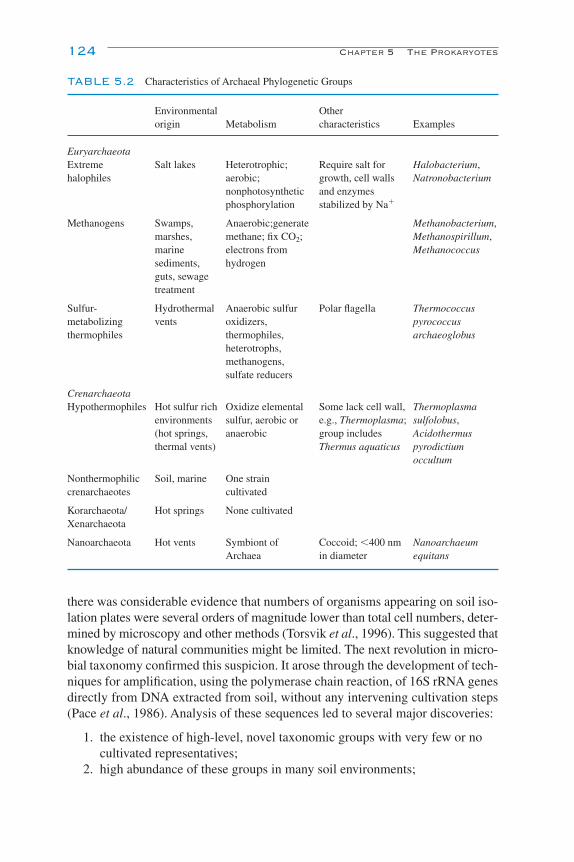
there was considerable evidence that numbers of organisms appearing on soil iso-lation plates were several orders of magnitude lower than total cell numbers, deter-mined by microscopy and other methods (Torsvik et al., 1996). This suggested thatknowledge of natural communities might be limited. The next revolution in micro-bial taxonomy confirmed this suspicion. It arose through the development of tech-niques for amplification, using the polymerase chain reaction, of 16S rRNA genesdirectly from DNA extracted from soil, without any intervening cultivation steps(Pace et al., 1986). Analysis of these sequences led to several major discoveries:
1. the existence of high-level, novel taxonomic groups with very few or nocultivated representatives;
2. high abundance of these groups in many soil environments;
124 Chapter 5 The Prokaryotes
TABLE 5.2 Characteristics of Archaeal Phylogenetic Groups
Environmental Otherorigin Metabolism characteristics Examples
EuryarchaeotaExtreme Salt lakes Heterotrophic; Require salt for Halobacterium,halophiles aerobic; growth, cell walls Natronobacterium
nonphotosynthetic and enzymesphosphorylation stabilized by Na�
Methanogens Swamps, Anaerobic;generate Methanobacterium,marshes, methane; fix CO2; Methanospirillum, marine electrons from Methanococcussediments, hydrogenguts, sewagetreatment
Sulfur- Hydrothermal Anaerobic sulfur Polar flagella Thermococcusmetabolizing vents oxidizers, pyrococcusthermophiles thermophiles, archaeoglobus
heterotrophs,methanogens,sulfate reducers
CrenarchaeotaHypothermophiles Hot sulfur rich Oxidize elemental Some lack cell wall, Thermoplasma
environments sulfur, aerobic or e.g., Thermoplasma; sulfolobus, (hot springs, anaerobic group includes Acidothermusthermal vents) Thermus aquaticus pyrodictium
occultum
Nonthermophilic Soil, marine One straincrenarchaeotes cultivated
Korarchaeota/ Hot springs None cultivatedXenarchaeota
Nanoarchaeota Hot vents Symbiont of Coccoid; �400 nm Nanoarchaeum Archaea in diameter equitans
Ch05-P546807.qxd 11/18/06 6:35 PM Page 124
3. tremendous diversity within taxonomic groups established on the basis ofcultivated organisms;
4. the existence of novel subgroups within these established groups.
The outcome of molecular studies is illustrated in Fig. 5.2, which shows 40 high-level groups within the bacterial domain. Only ca. 50% of these groups haverepresentatives in laboratory culture and representation is often low. Although notwithout disadvantages, molecular approaches have now replaced cultivation-basedtechniques for characterizing soil microbial communities (see Chap. 4). Their valuehas increased as sequence databases have expanded, which has enabled organismsto be putatively identified and compared between environments. Their use has alsointroduced new questions and challenges and has influenced our view of the ecologyand role of soil microorganisms. For example, organisms that were previouslyconsidered to be “typical” soil organisms (bacilli, pseudomonads, actinobacteria)are often found at relatively low abundance, while some of the novel, “yet-to-be-cultured” organisms are ubiquitous and present at high relative abundance (e.g.,planctomycetes; Rappe and Giovannoni, 2003). Similarly, Archaea were consideredto be extremophiles, adapted to conditions atypical of most soils (high temperature,high salt concentration, acid, or anaerobic). It is now known that members of theCrenarchaeota typically represent 1–2% of temperate soil prokaryote communities,but have not yet been cultivated (Buckley and Schmidt, 2003). The lack of avail-ability of cultivated representatives of these organisms denies us knowledge of theirphysiological characteristics and potential, and we can therefore only speculate ontheir role in soil. This has two implications for future studies—the need to developmethods for cultivating these organisms and/or the need to develop additionalmolecular approaches, or at least cultivation-independent approaches, to establishtheir ecosystem function in situ.
PHYLOGENY AND FUNCTION
Molecular characterization of microbial communities would be of enormous valueif the presence of a particular sequence or organism could be related unambiguouslyto its function in the soil. In some cases, phylogenetic groupings are informative.For example, all bacilli form resistant spores and the majority of rhizobia fix N2.However, individual taxonomic groups can display considerable physiologicalversatility, and many functional characteristics are distributed among varied andevolutionarily distant groups. In addition, we know little of the physiologicalcharacteristics of novel groups and subgroups.
Even if cultivated representatives of all phylogenetic groups were available, anumber of other issues must be considered for prokaryotes. The ordering and namingof hierarchical groups largely follow those for higher organisms, with the speciesas the basic unit of classification. For higher organisms, the species is defined throughthe Biological Species Concept and the ability of members within a species to inter-breed and inability to breed with members of other species (Cohan, 2002). Thelack of sexual reproduction mechanisms in prokaryotes prevents application of
Phylogeny 125
Ch05-P546807.qxd 11/18/06 6:35 PM Page 125

this concept, with methodological and conceptual implications for our under-standing of the development of distinct phylogenetic groups, evolution, and diversity.Prokaryotes can transfer genes by “lateral (or horizontal) gene transfer” (see CellStructure), which bypasses standard evolutionary processes (mutation and selection),which can have an enormous influence on microbial community structure and activ-ity. The most obvious example of this is the spread of plasmid-borne antibioticresistance under selective pressure. Lateral gene transfer is not uncommon, par-ticularly in highly active regions of the soil such as the rhizosphere. Nevertheless, allmembers of a particular (cultured) taxonomic unit (e.g., species) have many phe-notypic characteristics in common and this can help in relating their presence totheir ecosystem function.
In describing the characteristics of prokaryotes, we will necessarily focus onestablished, cultivated groups, highlighting the ecological relevance of these char-acteristics and demonstrating importance through species diversity and functionaldiversity and assessing the extent to which these can be related. Understanding thecharacteristics of the “significant majority” of other prokaryotes awaits new tech-niques for their isolation and/or cultivation-independent analysis.
GENERAL FEATURES OF PROKARYOTES
The majority of prokaryotes are smaller than eukaryotes and cell size per se hassignificant influence on their ecology, methods of their study, and perceptions oftheir importance. Prokaryotic cells are in the order of several micrometers in lengthor diameter, although there are notable exceptions (Schulz and Jorgensen, 2001).The fact that bacteria cannot be seen with the naked eye fools many into believingthat they are not important in soil processes and leads to approaches in whichprokaryotes are treated as a “black box,” with little consideration of their enor-mous species richness and diversity. Microscopic size also makes observationalstudies difficult and leads to study of populations or communities, rather thanindividuals, and to estimating characteristics (e.g., cell concentrations) on thebasis of properties of samples.
Small size is associated with high surface area:volume ratio, which explains, inpart, the ability of prokaryotes to sequester nutrients at extremely low concentra-tions. Cells are in intimate contact with their physical and chemical environment.Although homeostatic mechanisms exist for maintaining internal solute concen-trations and pH, prokaryotes respond much more rapidly to, and are influenced moreby, changes in environmental conditions than the more complex cells of eukaryotes.This, in turn, necessitates greater consideration of microenvironments or micro-habitats and the physicochemical characteristics of the environment immediatelysurrounding the cell. The 1–10 µm scale will be of greater significance for growthand activity of unicellular organisms than for bulk soil properties. Again, this hasmethodological implications. Small size also influences the distribution and move-ment of organisms. For example, prokaryotes are able to penetrate and colonizesmall soil pores, potentially protecting them from predation.
126 Chapter 5 The Prokaryotes
Ch05-P546807.qxd 11/18/06 6:35 PM Page 126
CELL STRUCTURE
UNICELLULAR GROWTH FORMS
Cell shape depends on internal turgor pressure acting against cell wall compo-nents, whose elasticity varies during cell growth. These interactions can be used toexplain the differences between rod-shaped and coccoid cells and some of the moredetailed aspects of cell shape and morphology. In addition, there is increasing evi-dence for the involvement of an actin-like skeleton controlling cell growth andshape in bacterial cells. In fact, unicellular bacteria exhibit a wide range of cell forms,including spiral cells, vibrios, pleomorphic cells, stalked cells, “bacteroids,” and evensquare bacteria. Archaea also exhibit a range of unusual growth forms, althoughthe mechanisms generating and ecological significance of these forms are unclear.
The shape, form, and size of prokaryotic cells are important characteristics whenconsidering the ecology of bacteria in the soil. Nutrient uptake will be determined,to some extent, by the surface area:volume ratio for a cell. This factor has been shownto contribute to the ability of spiral-shaped bacteria (e.g., Spirillum) to outcompeterod-shaped pseudomonads under conditions of substrate limitation. Shape and sizemay also be important in susceptibility to predation, with evidence that protozoaand flagellates choose prey partly on the basis of these factors.
Bacterial shape and size are not fixed and, for Escherichia coli, cell volume canvary 27-fold depending on growth rate. In addition, many bacteria take on differ-ent forms depending on environmental conditions. A striking example is the N2-fixing rhizobia, which form nodules on the roots of leguminous crops (Chap. 14).Initial contact with the plant root is through attraction to the root of flagellated,motile, rod-shaped bacteria. After infection, flagella are shed and bacteria formswarmer cells. Rapid division of these cells leads to formation of infection threadsand then nodules that contain masses of Rhizobium cells, the majority of which aremisshapen bacteroids, with bulging cell walls and unusual morphologies. Anotherexample is Arthrobacter, commonly isolated from the soil, which grows as rod-shaped blue cells at high growth rates and as coccoid purple cells under nutrient-limiting conditions.
These effects are accentuated in starving cells and the transition from growth tostarvation is frequently associated with a significant decrease in cell size, changes incell characteristics (Fig. 5.3), rapid turnover of cell material, a decrease in ribosomenumber, and expression of a suite of starvation genes (Kjelleberg, 1993). Many ofthese genes encode high-affinity nutrient uptake systems with broad substrate speci-ficity. These enable cells to sequester a wider range of substrates at low concentra-tions, giving them an advantage over organisms that, under conditions of nutrientexcess, have much greater maximum specific growth rates. Starved forms are resistantto environmental stress and, although not as resistant as bacterial endospores, starvedvegetative cells can survive better than growing cells. Direct observation of prokary-otic cells in soil indicates that many are much smaller than typical laboratory-grownorganisms, with significant proportions of cells passing through 0.4 µm pore size filters. There is evidence that these cells are less able to grow in laboratory culture.
Cell Structure 127
Ch05-P546807.qxd 11/18/06 6:35 PM Page 127

A limited number of microbial groups, notably bacilli and clostridia, produceinternal spores, termed endospores (Fig. 5.4). These structures are highly resistantto extremes of temperature, radiation, pressure, and other forms of environmentalstress. They are the most resistant biological structures known and, although theenvironmental extremes to which they are resistant are rarely encountered in soil,they are responsible for the persistence and survival of these organisms over manyyears and even centuries.
128 Chapter 5 The Prokaryotes
�CNP �C �N �P
(A) Morphology
(B) Viability 0�96 h
(C) RNA
0�1 h rel r
ate
synthesis
log
cfu log O
D
cfu cfu
cfucfu
OD OD
OD
OD
RNA � Cm RNA � Cm
RNA � CmRNA � Cm
RNA � Cm RNA � Cm
RNA � Cm
0�96 h
FIGURE 5.3 Changes in (A) morphology, (B) viability, and (C) RNA synthesis (in the presenceand absence of chloramphenicol) in Vibrio during starvation for combined and individual C, N, and S.The different forms of starvation lead to significant changes in cell size and/or cell morphology andhave different effects on changes in RNA content and in biomass and cell concentrations. Chloramphenicolwas added to inhibit protein synthesis. Redrawn from Östling et al. (1993).
Ribosomes
DNAPlasma membrane
Core wall
Exosporium
Outer spore coat
Inner spore coat
Cortex
Mother cell cytoplasm
FIGURE 5.4 Major characteristics of a bacterial spore.
Ch05-P546807.qxd 11/18/06 6:35 PM Page 128

FILAMENTOUS AND MYCELIAL GROWTH
Although prokaryotes are typically considered unicellular, a number of groupsexhibit filamentous growth. Some bacteria (streptococci) and cyanobacteria (e.g.,Nostoc) grow filamentously, not as continuous hyphae, but as chains of cells. Insome cases, this is because dividing cells do not separate completely but in othersit provides some of the advantages of true mycelial organisms in allowing myceliato compartmentalize and differentiate. For example, in N2-fixing cyanobacteria,anaerobic conditions required for N2 fixation can be localized in some cells, calledheterocysts, while others carry out oxygenic photosynthesis. Chemical communi-cation between cells allows two-way flow of nutrients and also signaling processesleading to regular distribution of N2-fixing cells along filaments.
The actinobacteria (previously termed the actinomycetes) exhibit the greatestvariety of growth forms, ranging from single-celled rods and cocci to mycelial struc-tures (Prosser and Tough, 1991). For example, arthrobacters and some rhodococcigrow as single cells that do not completely separate and thus do not form true mycelia,but which may subsequently fragment. Others, such as Nocardia, are dimorphicand form true, branching hyphal structures during early growth, which then frag-ment as conditions become less favorable. The hyphal form facilitates coloniza-tion of soil particles and, potentially, movement across barren regions to newnutrient sources. Fragments may subsequently develop centers of mycelial growthand their major function may be in dispersal.
The most highly developed mycelial structures are formed by streptomycetes,which grow as branched hyphae forming a true mycelium, similar to those of fil-amentous fungi (Chap. 6). Hyphal fragmentation may occur under certain condi-tions, but the major means of dispersal is through exospores borne on aerial hyphae.Exospores do not exhibit the high levels of resistance to environmental extremesof endospores, but are very resistant to desiccation. This enables their survival inthe soil, but is also an important factor in their very effective dispersal through theatmosphere. On solid medium, spores develop at the center of actinobacterialcolonies fueled by lytic products of substrate mycelium, which stop growing asnutrients become limited. These organisms therefore achieve growth over shortdistances by extension and branching of hyphae and dispersal by producing highnumbers of single-celled spores.
CELL WALLS
Prokaryotic cells are surrounded by a generally rigid cell wall, protecting thecell from osmotic lysis (Figs. 5.5 and 5.6). The cell wall has also been importantin identification and classification of bacteria, providing a major division betweengram-positive and gram-negative bacteria, defined on the basis of the Gram stain.The cell wall of gram-positive cells consists of a single thick layer of peptidoglycan, surrounding the cytoplasmic membrane. Peptidoglycan is a polymer consisting of abackbone of alternating N-acetylglucosamine and N-acetylmuramic acid residuesconnected to cross-linked peptide chains of four amino acids. Gram-positive cellwalls also usually contain teichoic acids, polymers of glycerol or ribitol, linked by
Cell Structure 129
Ch05-P546807.qxd 11/18/06 6:35 PM Page 129
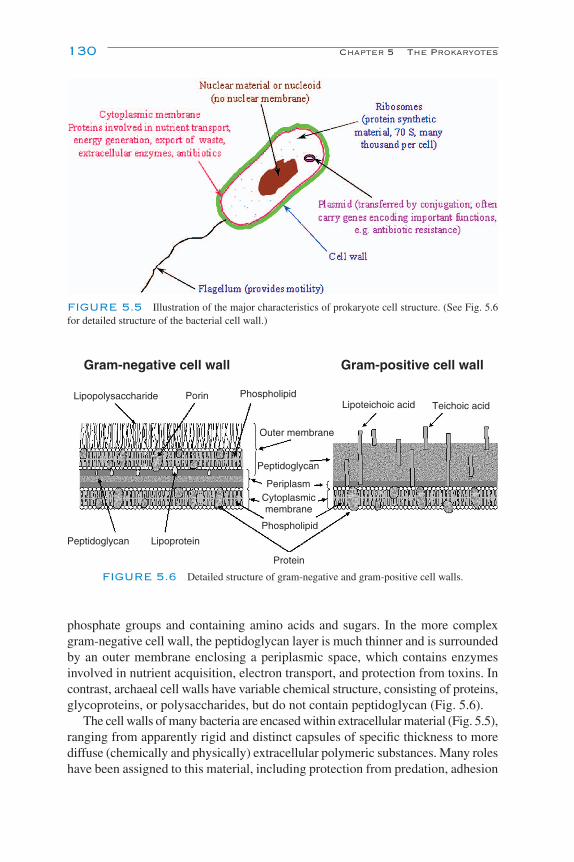
130 Chapter 5 The Prokaryotes
phosphate groups and containing amino acids and sugars. In the more complexgram-negative cell wall, the peptidoglycan layer is much thinner and is surroundedby an outer membrane enclosing a periplasmic space, which contains enzymesinvolved in nutrient acquisition, electron transport, and protection from toxins. Incontrast, archaeal cell walls have variable chemical structure, consisting of proteins,glycoproteins, or polysaccharides, but do not contain peptidoglycan (Fig. 5.6).
The cell walls of many bacteria are encased within extracellular material (Fig. 5.5),ranging from apparently rigid and distinct capsules of specific thickness to morediffuse (chemically and physically) extracellular polymeric substances. Many roleshave been assigned to this material, including protection from predation, adhesion
FIGURE 5.5 Illustration of the major characteristics of prokaryote cell structure. (See Fig. 5.6for detailed structure of the bacterial cell wall.)
Gram-negative cell wall Gram-positive cell wall
Lipopolysaccharide Porin Phospholipid
Peptidoglycan Lipoprotein
Protein
Phospholipid
Cytoplasmicmembrane
Outer membrane
Peptidoglycan
Periplasm
Lipoteichoic acid Teichoic acid
FIGURE 5.6 Detailed structure of gram-negative and gram-positive cell walls.
Ch05-P546807.qxd 11/18/06 6:36 PM Page 130

to solid surfaces, and biofilm formation. In the free-living N2-fixing bacterium Azoto-bacter, extracellular material is important in creating anaerobic regions requiredfor N2 fixation. Biofilm formation is particularly important, with suggestions thatthe majority of the soil microbial community is attached to particulate matter (clayminerals, soil organic matter, plant roots, and animals). Particulate material pro-vides a concentration of nutrients necessary for microbial growth, and surfaceattachment has been shown to increase survival of bacteria and to protect themfrom environmental stress, including low pH, starvation, and inhibition by antibi-otics and heavy metals. An example is the production by nitrifying bacteria, inmodel soil systems, of copious amounts of extracellular material that effectivelyforms a blanket over colonies, such that individual cells are not visible. This occursdespite the fact that these autotrophic organisms gain barely sufficient energyfrom oxidation of ammonium or nitrite, use much of this energy to generate reduc-ing equivalents, and require more reducing equivalents because of the requirementto fix CO2. However, once formed, biofilms of these organisms are protected froma wide range of factors to which suspended cells are susceptible. Attachment of cellsto surfaces is also facilitated by short, hair-like fimbriae, while similar structures,sex pili, are involved in cell–cell contact associated with plasmid transfer.
INTERNAL STRUCTURE
Prokaryotes lack internal, membrane-bound organelles but exhibit diverseinternal structures and some differentiation (Fig. 5.5). In bacteria, the cytoplasmis enclosed by a cytoplasmic membrane consisting of ester-linked, straight-chained fatty acids. The lipids comprising the membrane form a bilayer, with non-polar hydrophobic ends associating with each other and polar, hydrophilic endsexternalized. Cytoplasmic membranes in Archaea contain only a single lipid layerconsisting of ether-linked, branched aliphatic acids. For all prokaryotes, the cyto-plasmic membrane provides an important link between the cell and its environ-ment and contains many proteins required for import of nutrients, export of wasteproducts, and production of extracellular enzymes for breakdown of high-molec-ular-weight compounds. It is also involved in generating energy in respiring cellsthrough oxidative phosphorylation and can provide protection through toxin orantibiotic degrading enzymes.
The bacterial chromosome is present as a single, double-stranded, covalentlyclosed, circular DNA molecule forming a nucleoid. Additional genetic materialmay be present as one or many small DNA molecules, termed plasmids, having asimilar structure. These can be transmitted vertically (from generation to generation)and horizontally or laterally, between different bacterial strains. Other mechanismsof genetic exchange in prokaryotes are transformation, which involves direct uptakeof DNA and incorporation of genes into the host chromosome, and transduction,in which gene transfer is mediated by a bacteriophage.
Proteins are synthesized within the cytoplasm by thousands of ribosomes, oftenforming structures termed polysomes and attached to mRNA. Storage products
Cell Structure 131
Ch05-P546807.qxd 11/18/06 6:36 PM Page 131
can also accumulate in cells. Examples include poly-β-hydroxybutyrate (a glucosepolymer), polyphosphate, and glycogen, while the sulfur oxidizer Beggiatoastores elemental sulfur, which can be seen as yellow granules within the cell.
Some intracellular structures are associated with specific metabolic processes.Autotrophic bacteria possess carboxysomes, which are particulate bodies involvedin fixing carbon dioxide. Photosynthetic bacteria possess complex intracellularmembrane structures, which are the site of the energy-trapping, photosyntheticprocesses. Photosynthetic bacteria show relatively close evolutionary relationshipsto other functional groups with similar complex membrane structures involved inother reactions, including ammonia, methane, and iron oxidation. Membranes canoccur in distinctive patterns, for example, forming a layer within the cytoplasmicmembrane or in an equatorial plane, and are diagnostic for some groups.
MOTILITY
Many prokaryotes are motile, the most obvious mechanism being “swimming”by rotating one (polar), two, or many (peritrichous) flagella. The flagellum con-sists of a long, helically shaped protein (flagellin) anchored in the cytoplasmicmembrane and extending through the cell wall. Rotation of the flagellum leads tomovement of the cell. Movement in the soil environment is important for unicellu-lar organisms searching for new sources of nutrients. Flagellar motility is, how-ever, unlikely to be useful for transport between pore size classes in soil as ratesof movement are not great. Nevertheless, flagellar motility can be linked tochemotaxis (movement toward a chemical attractant), which appears to be impor-tant for communicating between bacterial cells and plant roots in the soil environ-ment, e.g., in movement of rhizobia toward roots prior to nodule formation.Movement over long distances is, however, more likely to be achieved through bulkflow of water containing suspended cells or carriage on roots or soil animals. Indeed,lack of motility is probably important in the formation of microniches occupied bymicrocolonies of organisms, reducing competitive interactions, reducing selectivesweeps, and increasing soil bacterial diversity (see Chap. 11). Other mechanismsexist for bacterial motility. For example, spirochetes possess an axial filament thatenables the cell to move by flexing and spinning. Other organisms, including cyano-bacteria, Cytophaga, and mycobacteria, can move by gliding over surfaces.
METABOLISM AND PHYSIOLOGY
CARBON AND ENERGY SOURCES
The phylogenetic classification of prokaryotes described earlier in this chapterprovides an indication of evolutionary relationships, which will have arisen, in part,through differences in physiological characteristics. As a consequence, molecularphylogeny often agrees with traditional classification based on combinations of
132 Chapter 5 The Prokaryotes
Ch05-P546807.qxd 11/18/06 6:36 PM Page 132
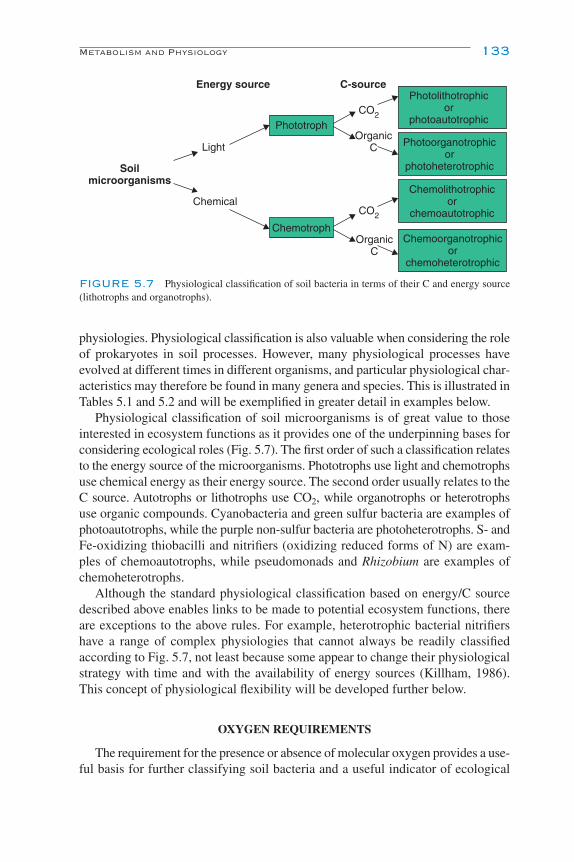
physiologies. Physiological classification is also valuable when considering the roleof prokaryotes in soil processes. However, many physiological processes haveevolved at different times in different organisms, and particular physiological char-acteristics may therefore be found in many genera and species. This is illustrated inTables 5.1 and 5.2 and will be exemplified in greater detail in examples below.
Physiological classification of soil microorganisms is of great value to thoseinterested in ecosystem functions as it provides one of the underpinning bases forconsidering ecological roles (Fig. 5.7). The first order of such a classification relatesto the energy source of the microorganisms. Phototrophs use light and chemotrophsuse chemical energy as their energy source. The second order usually relates to theC source. Autotrophs or lithotrophs use CO2, while organotrophs or heterotrophsuse organic compounds. Cyanobacteria and green sulfur bacteria are examples ofphotoautotrophs, while the purple non-sulfur bacteria are photoheterotrophs. S- andFe-oxidizing thiobacilli and nitrifiers (oxidizing reduced forms of N) are exam-ples of chemoautotrophs, while pseudomonads and Rhizobium are examples ofchemoheterotrophs.
Although the standard physiological classification based on energy/C sourcedescribed above enables links to be made to potential ecosystem functions, thereare exceptions to the above rules. For example, heterotrophic bacterial nitrifiershave a range of complex physiologies that cannot always be readily classifiedaccording to Fig. 5.7, not least because some appear to change their physiologicalstrategy with time and with the availability of energy sources (Killham, 1986).This concept of physiological flexibility will be developed further below.
OXYGEN REQUIREMENTS
The requirement for the presence or absence of molecular oxygen provides a use-ful basis for further classifying soil bacteria and a useful indicator of ecological
Metabolism and Physiology 133
Photolithotrophicor
photoautotrophic
Photoorganotrophicor
photoheterotrophic
Chemolithotrophicor
chemoautotrophic
Chemoorganotrophicor
chemoheterotrophic
Soilmicroorganisms
Light
Chemical
Phototroph
Chemotroph
Energy source C-source
CO2
CO2
OrganicC
OrganicC
FIGURE 5.7 Physiological classification of soil bacteria in terms of their C and energy source(lithotrophs and organotrophs).
Ch05-P546807.qxd 11/18/06 6:36 PM Page 133
niche. Obligate aerobes such as Rhizobium (a chemoheterotroph), Thiobacillus(a chemoautotroph), and many other soil bacteria require oxygen, which acts as aterminal electron acceptor during aerobic respiration. Obligate anaerobes such asClostridium pasteurianum require the absence of molecular oxygen and, insteadof using inorganic electron acceptors, remove hydrogen atoms from organic compounds and dissipate them through reaction with products of carbohydratebreakdown. Facultative anaerobes, such as the denitrifying chemoheterotrophPseudomonas aeruginosa or, less commonly, the chemoautotroph Thiobacillusdenitrificans, can grow in the presence or absence of oxygen. For these denitri-fiers, nitrate substitutes for oxygen as an alternative terminal electron acceptorduring anaerobic respiration and is reduced to either nitrous oxide or free N2. Theswitch from aerobic to anaerobic metabolism is quite rapid (occurring within afew hours in most cases) and is controlled by oxygen availability:
The stepwise reduction of nitrate to N2 by facultatively anaerobic denitrifyingbacteria occurs as follows:
(1) NO3� � H2 → NO2
� � H2O; (1) nitrate → nitrite;(2) 2NO2
� � 3H2 → N2O � 3H2O; (2) nitrite → nitrous oxide; (3) N2O � H2 → N2 � H2O (3) nitrous oxide → free N2.
Because of the accumulation of incompletely oxidized products during growth,the energy yields from anaerobic metabolism in soil are generally low (often onlya few percent) compared to aerobic metabolism.
It is becoming increasingly clear that while the classification in Fig. 5.7 holdstrue, many aerobic processes are carried out in soil using sparingly available sup-plies of oxygen by microaerophiles, obligate aerobes that grow best at low oxygentensions.
SUBSTRATE UTILIZATION
The degradative and overall enzyme profile of a soil bacterium determines therange of substrates it can use, although other factors (e.g., substrate availability,competition, environmental factors), considered in subsequent sections, also deter-mine which substrates are being used at any given time. This concept of enzymaticprofile applies to both chemoheterotrophs and chemoautotrophs. Table 5.3 highlightsjust some of the enzymes controlling both intracellular and extracellular use ofsubstrates. The size of many of the substrates (e.g., lignin, cellulose) ensures thatmost depolymerization is extracellular, with only the final use of the simple buildingblocks being intracellular. Table 5.3 is by necessity a simplification as, in a numberof cases, there is a suite of enzymes, rather than a single enzyme operating on thesubstrate in question. The enzymes listed in Table 5.3 can be classified as oxi-doreductases (e.g., glucose oxidase, ammonia monooxygenase, hydroxylamineoxidoreductase, nitrite oxidoreductase, methane monooxygenase), transferases(e.g., amino transferases), hydrolases (e.g., protease, urease, amylase, ligninase,
134 Chapter 5 The Prokaryotes
Ch05-P546807.qxd 11/18/06 6:36 PM Page 134

pectinase, phosphatase, sulfatase, invertase, chitinase), and lyases (e.g., amino aciddecarboxylase).
Some of the enzymes highlighted in Table 5.4 are constitutive, while others areinducible. A more comprehensive yet highly accessible account of soil enzymescan be found in the review by Burns and Dick (2002).
Metabolism and Physiology 135
TABLE 5.3 Selected Examples of Enzymes and Associated Bacteria Involved in OrganicSubstrate Utilization
Distribution of enzymes/examples of soil bacteriaDegradative enzymes used for organic with ecologically significant activity of thesesubstrate utilization enzymes
Cellulase (cellulose → glucose subunits) Species of Bacillus, Cellulomonas, andPseudomonas
Glucose oxidase (glucose → CO2) Ubiquitous enzyme among soil bacteria
Protease (protein → amino acids) Widespread among soil prokaryotes but species ofPseudomonas and Flavobacterium are stronglyproteolytic
Deaminase/amino transferase; amino acid More common enzymes than proteases, although decarboxylase (removal of amino and major differences in rates between amino acidscarboxyl groups to liberate NH3 and CO2
from amino acids)
Urease (urea → ammonia � carbon dioxide) About 50% of heterotrophic soil bacteria areureolytic
Amylase and glucosidase (starch → glucose) Species of Bacillus, Pseudomonas, andChromobacterium
Ligninase (lignin → aromatic subunits) While lignin degradation is primarily the domainof the white rot fungi, species of Arthrobacter,Flavobacterium, and Pseudomonas are sometimesinvolved
Pectinase (pectin → galacturonic acid Species of Arthrobacter, Pseudomonas, andsubunits) Bacillus (some species possess all of the pectinase
enzymes—polygalacturonase, pectate lyase,pectin lyase, and pectin esterase); many plantpathogens possess pectinase to assist in plant hostpenetration
Phosphatase (phosphate esters → phosphate) About 30% of heterotrophic soil bacteria possessphosphatase enzymes
Sulfatase (sulfate esters → sulfate) Many fewer possess sulfatase
Invertase (sucrose → fructose � glucose) Particularly active in saprotrophic soil bacteria,such as species of Acinetobacter, and Bacillus
Chitinase (chitin → amino sugar subunits) The actinobacteria Streptomyces and Nocardia
Amino acid decarboxylase Both aromatic and nonaromatic amino aciddecarboxylases are found in a wide range of soilbacteria synthesizing amino acids
Ch05-P546807.qxd 11/18/06 6:36 PM Page 135

AUTOCHTHONY AND ZYMOGENY
Identifying a soil bacterium as a chemoheterotroph, according to the classifi-cation scheme for metabolism outlined above, provides little information on howcompetitive that particular bacterium will be under particular conditions of sub-strate supply. The great 19th century soil microbiologist Winogradsky addressedthis issue through reference to the comparative kinetics of growth, which relatessubstrate concentration to specific growth rate. In Fig. 5.8, which illustrates somesimple and contrasting growth curves, population X (diamonds) will outcompetepopulations Y and Z at high substrate concentrations. At intermediate substrateconcentrations, population Y (circles) will outcompete populations X and Z. Atlow substrate concentrations, however, population Z (triangles) will outcompetethe other populations. Soil bacteria that exhibit the growth kinetics of populationX, with a relatively high maximum specific growth rate (µmax) and substrate affin-ity (Ks), will be more competitive at high substrate concentrations and are termed“zymogenous.” Not surprisingly, soil microenvironments such as the early rhizos-phere are dominated by zymogenous bacteria, such as fluorescent pseudomonads,which grow rapidly on the simple C substrates (primarily glucose). Soil bacteriathat exhibit the growth kinetics of population Z, with a low µmax but relatively lowKs (i.e., a high substrate affinity), are termed “autochthonous.” The bacterial pop-ulations found in some of the less accessible soil microenvironments (e.g., thesmaller pores inside soil aggregates), where substrate C flow is rarely more than atrickle, are generally dominated by autochthonous bacteria. The spatial variabilityof soil with regard to microbial populations highlights the importance of substrate(and nutrient) availability (sometimes referred to as bioaccessibility) as a driver ofboth the diversity and the function of the bacterial community. The latter can bedemonstrated by studying the mineralization of differentially located (in terms ofsoil pore size class), radiolabeled C substrates (Killham et al., 1993).
Of course, in reality, there are degrees of autochthony and zymogeny, as indi-cated by the growth kinetics of the populations in Fig. 5.8. There is a continuumof growth kinetics that ensures that the most competitive soil bacteria will changewith substrate concentration. Successions will therefore often occur in environments
136 Chapter 5 The Prokaryotes
TABLE 5.4 Selected Examples of Enzymes, Functional Genes, and Associated Soil BacteriaInvolved in Autotrophic Oxidation of Substrates
Ammonia monooxygenase, amoA Nitrosomonas, Nitrosospira, Nitrosococcus(ammonia → hydroxylamine)
Hydroxylamine oxidoreductase, norB Nitrosomonas, Nitrosospira, Nitrosococcus(hydroxylamine → nitrite)
Nitrite oxidoreductase (nitrite → nitrate) Nitrobacter, Nitrospira
Methane monooxygenase, pmoA Methanotrophs
Methylotrophs such as Methylomonasand Methylococcus
Ch05-P546807.qxd 11/18/06 6:36 PM Page 136
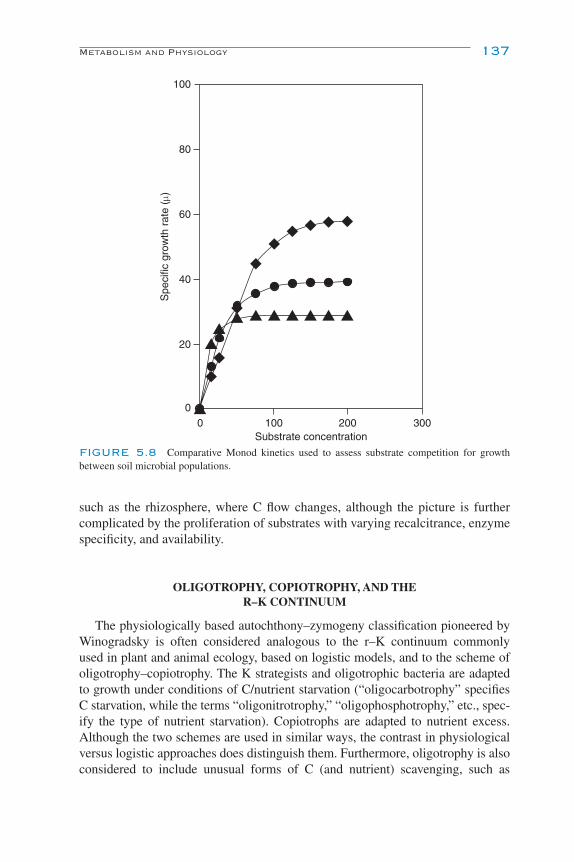
such as the rhizosphere, where C flow changes, although the picture is furthercomplicated by the proliferation of substrates with varying recalcitrance, enzymespecificity, and availability.
OLIGOTROPHY, COPIOTROPHY, AND THER–K CONTINUUM
The physiologically based autochthony–zymogeny classification pioneered byWinogradsky is often considered analogous to the r–K continuum commonlyused in plant and animal ecology, based on logistic models, and to the scheme ofoligotrophy–copiotrophy. The K strategists and oligotrophic bacteria are adaptedto growth under conditions of C/nutrient starvation (“oligocarbotrophy” specifiesC starvation, while the terms “oligonitrotrophy,” “oligophosphotrophy,” etc., spec-ify the type of nutrient starvation). Copiotrophs are adapted to nutrient excess.Although the two schemes are used in similar ways, the contrast in physiologicalversus logistic approaches does distinguish them. Furthermore, oligotrophy is alsoconsidered to include unusual forms of C (and nutrient) scavenging, such as
Metabolism and Physiology 137
100
80
60
40
20
00 100 200 300
Substrate concentration
Spe
cific
gro
wth
rat
e (µ
)
FIGURE 5.8 Comparative Monod kinetics used to assess substrate competition for growthbetween soil microbial populations.
Ch05-P546807.qxd 11/18/06 6:36 PM Page 137

exploiting gaseous C sources such as CO2 (e.g., through anapleurotic CO2 fixation)and volatile organic acids.
FACULTATIVENESS
While formal functional/physiological classification of bacteria is a usefulfoundation, it does not embrace the flexibility exhibited by many organisms. Forexample, we know that many soil bacteria that can grow readily on “standard”organic substrates can adapt and continue to metabolize under the harsh conditionsof C starvation often found in soil. The physiological strategies and mechanismsused by the “facultative oligotrophs” are only partially characterized and includescavenging of gaseous forms of C, which diffuse through the soil pore network.
Perhaps the best known example of facultativeness relates to oxygen require-ments. Facultative anaerobes metabolize most efficiently as aerobes. Indeed thedenitrifying pseudomonads, which often colonize the rhizosphere as aerobic chemo-heterotrophs, may seldom experience low oxygen concentrations that induce thenitrate reductase enzyme system associated with denitrification. Many micro-aerophiles also often operate under well-aerated conditions but, as facultative micro-aerophiles, are physiologically adapted to life at the low oxygen concentrationssometimes experienced in wet soils, particularly in microsites such as water-saturated aggregates beyond a critical radius that prevents adequate diffusiveresupply after removal by respiratory (roots, animals, and microorganisms)demand (Greenwood, 1975).
Another aspect of flexibility is the capacity to metabolize more than one sub-strate, often simultaneously (for example, through cometabolism, see Chaps. 9and 17), which may be the norm rather than the exception. This is reflected in the diversity of catabolic enzymes, both intracellular and extracellular. Among themost versatile degraders in the soil are the pseudomonads. They can degrade themost complex aromatic structures through to the simplest sugars (Powlowsky andShingler, 1994). Pseudomonas cepacia, for example, can metabolize more than100 different C substrates (Palleroni, 1984).
Flexibility is also evident from the way soil microbial communities have adaptedrapidly to degrade new substrates that have been introduced as contaminants insoil, such as organoxenobiotics that have been synthesized de novo by industry.The development of populations with appropriate catabolic genes is one of thegreatest phenomena exhibited by the soil microbial community and is discussedfurther below.
BIODEGRADATION CAPACITY
CELLULOSE
Plant residues provide the major source of soil organic matter and their biodegra-dation is critical to ecosystem productivity. Because plants typically contain up to
138 Chapter 5 The Prokaryotes
Ch05-P546807.qxd 11/18/06 6:36 PM Page 138
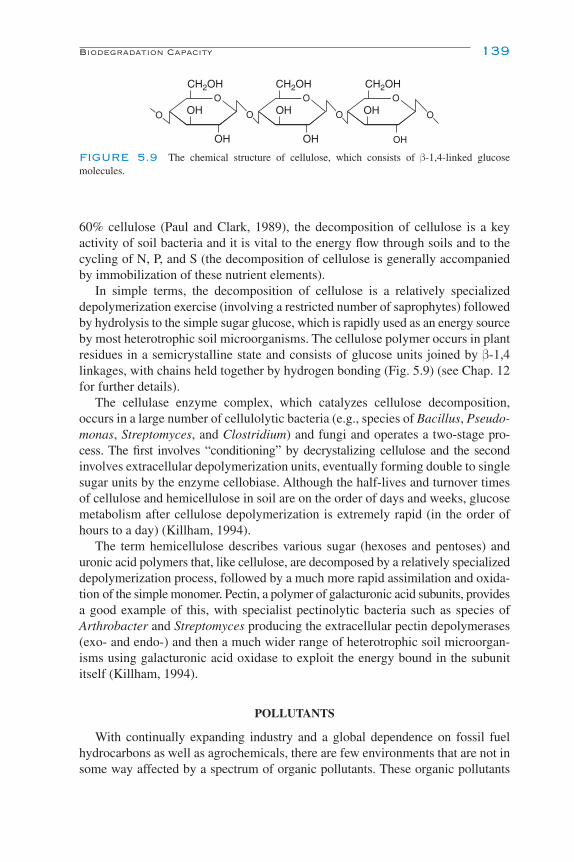
60% cellulose (Paul and Clark, 1989), the decomposition of cellulose is a keyactivity of soil bacteria and it is vital to the energy flow through soils and to thecycling of N, P, and S (the decomposition of cellulose is generally accompaniedby immobilization of these nutrient elements).
In simple terms, the decomposition of cellulose is a relatively specializeddepolymerization exercise (involving a restricted number of saprophytes) followedby hydrolysis to the simple sugar glucose, which is rapidly used as an energy sourceby most heterotrophic soil microorganisms. The cellulose polymer occurs in plantresidues in a semicrystalline state and consists of glucose units joined by β-1,4linkages, with chains held together by hydrogen bonding (Fig. 5.9) (see Chap. 12for further details).
The cellulase enzyme complex, which catalyzes cellulose decomposition,occurs in a large number of cellulolytic bacteria (e.g., species of Bacillus, Pseudo-monas, Streptomyces, and Clostridium) and fungi and operates a two-stage pro-cess. The first involves “conditioning” by decrystalizing cellulose and the secondinvolves extracellular depolymerization units, eventually forming double to singlesugar units by the enzyme cellobiase. Although the half-lives and turnover timesof cellulose and hemicellulose in soil are on the order of days and weeks, glucosemetabolism after cellulose depolymerization is extremely rapid (in the order ofhours to a day) (Killham, 1994).
The term hemicellulose describes various sugar (hexoses and pentoses) anduronic acid polymers that, like cellulose, are decomposed by a relatively specializeddepolymerization process, followed by a much more rapid assimilation and oxida-tion of the simple monomer. Pectin, a polymer of galacturonic acid subunits, providesa good example of this, with specialist pectinolytic bacteria such as species ofArthrobacter and Streptomyces producing the extracellular pectin depolymerases(exo- and endo-) and then a much wider range of heterotrophic soil microorgan-isms using galacturonic acid oxidase to exploit the energy bound in the subunititself (Killham, 1994).
POLLUTANTS
With continually expanding industry and a global dependence on fossil fuelhydrocarbons as well as agrochemicals, there are few environments that are not insome way affected by a spectrum of organic pollutants. These organic pollutants
Biodegradation Capacity 139
CH2OH CH2OH CH2OH
OHOH
OH OH OH
OH
O O O
OOOO
FIGURE 5.9 The chemical structure of cellulose, which consists of β-1,4-linked glucose molecules.
Ch05-P546807.qxd 11/18/06 6:36 PM Page 139

include the aliphatic hydrocarbons (e.g., alkanes from oil spills and petrochemicalindustry activities), alicyclic hydrocarbons (e.g., the terpenoid plant products),aromatic hydrocarbons (e.g., single aromatics, such as the petrochemical solventsbenzene and toluene, and polyaromatics, such as pyrene), the chlorinated hydro-carbons (e.g., chlorinated aliphatics such as chloroform), chlorinated aromatics(e.g., chlorobenzenes and chlorinated polyaromatics such as PCBs, DDT, anddioxins), and N-containing aromatics (e.g., TNT). Because of the increasingawareness of the adverse effects of these organoxenobiotic pollutants, the soilmicroorganisms and associated genes (largely carried on plasmids, which areextrachromosomal pieces of DNA) involved in their degradation are of great inter-est to soil microbiologists. This interest focuses on the pollutant biodegradationcapacity of microorganisms (which refers to both the breadth of the pollutants thatthey degrade and the degradation rates) and also on bioremediation of contami-nated environments (Crawford and Crawford, 1996).
Some of the organic pollutants entering the soil environment are toxic to bac-teria and are recalcitrant to mineralization. The reasons for the latter are numerousand include key physicochemical characteristics such as the way in which the pol-lutant partitions into the soil matrix—relevant only if related to metabolic processes.For example, the more hydrophobic polyaromatic hydrocarbons (PAHs) and poly-chlorinated biphenyls (PCBs) tend to bind strongly to the soil solid phase and limitmicrobial/enzyme access. Another reason for recalcitrance is the large number ofenzyme-regulated steps and the number of well-regulated genes required for min-eralization. Furthermore, since many of the organic pollutants under considerationare synthetic, there are often no corresponding genes coding for proteins existingin extant soil bacteria that can immediately catalyze the degradation process.
The highly chlorinated organic pollutants have been studied extensively in termsof their degradation and the evolution of their degradative genes. Although degra-dation is generally slow, particularly for the more chlorinated compounds, geneclusters have clearly evolved for their degradation. Structural and regulatory genes have high sequence homology, even though they have evolved as plasmid-borne genes in different soil bacterial genera from across the world (Daubaras andChakrabarty, 1992). This evolution of gene-regulated bacterial degradative path-ways (usually involving four to eight genes in each case) enables complete min-eralization of a range of chlorinated pollutants, including chlorobenzenes used ina number of industrial processes and the chlorophenoxyacetic acids associatedwith some of the hormonal herbicides used in agricultural weed control. The degra-dation of many of the chlorinated organic pollutants is somewhat complicated bythe fact that the bacterial removal of chlorine from the molecule (dehalogenation)occurs most readily under anaerobic conditions, and so bioremediation of con-taminated environments containing both chlorinated and nonchlorinated hydro-carbons can be a complicated process involving management of both anaerobicand aerobic conditions. Although the anaerobic dehalogenation of PCBs is relativelywell understood, obtaining reliable and useful bacterial isolates is fraught with dif-ficulties (May et al., 1992).
140 Chapter 5 The Prokaryotes
Ch05-P546807.qxd 11/18/06 6:36 PM Page 140
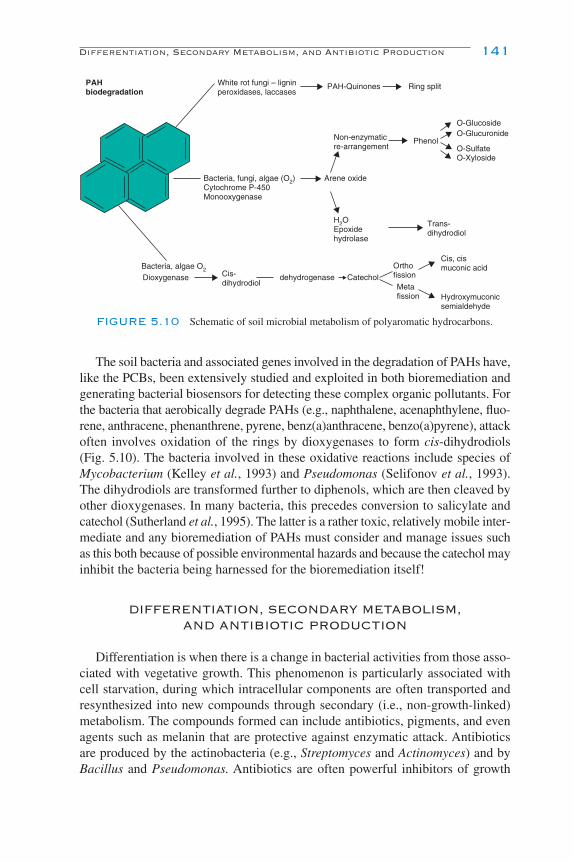
The soil bacteria and associated genes involved in the degradation of PAHs have,like the PCBs, been extensively studied and exploited in both bioremediation andgenerating bacterial biosensors for detecting these complex organic pollutants. Forthe bacteria that aerobically degrade PAHs (e.g., naphthalene, acenaphthylene, fluo-rene, anthracene, phenanthrene, pyrene, benz(a)anthracene, benzo(a)pyrene), attackoften involves oxidation of the rings by dioxygenases to form cis-dihydrodiols(Fig. 5.10). The bacteria involved in these oxidative reactions include species ofMycobacterium (Kelley et al., 1993) and Pseudomonas (Selifonov et al., 1993).The dihydrodiols are transformed further to diphenols, which are then cleaved byother dioxygenases. In many bacteria, this precedes conversion to salicylate andcatechol (Sutherland et al., 1995). The latter is a rather toxic, relatively mobile inter-mediate and any bioremediation of PAHs must consider and manage issues suchas this both because of possible environmental hazards and because the catechol mayinhibit the bacteria being harnessed for the bioremediation itself!
DIFFERENTIATION, SECONDARY METABOLISM,AND ANTIBIOTIC PRODUCTION
Differentiation is when there is a change in bacterial activities from those asso-ciated with vegetative growth. This phenomenon is particularly associated withcell starvation, during which intracellular components are often transported andresynthesized into new compounds through secondary (i.e., non-growth-linked)metabolism. The compounds formed can include antibiotics, pigments, and evenagents such as melanin that are protective against enzymatic attack. Antibioticsare produced by the actinobacteria (e.g., Streptomyces and Actinomyces) and byBacillus and Pseudomonas. Antibiotics are often powerful inhibitors of growth
Differentiation, Secondary Metabolism, and Antibiotic Production 141
PAHbiodegradation
White rot fungi – ligninperoxidases, laccases
PAH-Quinones Ring split
Bacteria, algae O2
Dioxygenase Cis-dihydrodiol
dehydrogenase Catechol
Orthofission
Metafission
Cis, cismuconic acid
Hydroxymuconicsemialdehyde
Bacteria, fungi, algae (O2)Cytochrome P-450Monooxygenase
Arene oxide
Non-enzymaticre-arrangement
Phenol
O-GlucosideO-Glucuronide
O-SulfateO-Xyloside
H2OEpoxidehydrolase
Trans-dihydrodiol
FIGURE 5.10 Schematic of soil microbial metabolism of polyaromatic hydrocarbons.
Ch05-P546807.qxd 11/18/06 6:36 PM Page 141
and metabolism of groups of other microorganisms, with varying degrees of speci-ficity. Streptomycin, for example, produced by certain species of Streptomyces,strongly inhibits a wide range of both gram-positive and gram-negative bacteria.Cycloheximide, on the other hand, inhibits only eukaryotes and is used as a fungalinhibitor in the bacterial plate count.
Antibiotic production by soil bacteria, involving secondary metabolism, hasbeen harnessed for decades for a wide range of medical applications. Althoughantibiotic production has long been linked with chemical defense, the factors deter-mining antibiotic production in soil suggest that antibiosis occurs only when thesupply of available carbon is high (Thomashow and Weller, 1991). These conditionsare likely to be met in the rhizosphere, the zone around seeds (the spermosphere)and relatively fresh plant or animal residues.
Although a considerable number of antibiotic-producing bacteria have beenidentified, evidence that antibiosis is a significant chemical defense strategy in therhizosphere tends to be indirect. For example, strains of fluorescent pseudomon-ads can demonstrate high specific rates of production of the antibiotic phenazine,which is strongly inhibitory against Gaeumannomyces graminis var tritici (Ggt),the causal agent of take-all in wheat (Brisbane and Rovira, 1988). When Tn5 mutantsof such pseudomonads are introduced into the wheat rhizosphere, the removal ofantibiotic production has been associated with reduced control of Ggt (Thomashowand Weller, 1991).
The key genes and associated enzymes involved in antibiotic synthesis havenow been characterized in some cases (e.g., for phenazine, see Blankenfeldt et al.(2004)) and hence offer new and more powerful approaches to investigate thesesecondary metabolic, chemical defense strategies of bacteria in soil; by probingfor RNA-based antibiotic biosynthesis genes and/or by use of stable isotope (13C)probing of the rhizobacterial nucleic acid pool, questions of both the activationand the significance of antibiotic-mediated chemical defense can now be resolved.
The final two sections of this chapter have considered xenobiotics in twoforms—antibiotics and persistent organic pollutants such as PCBs and PAHs.Nakatsu et al. (1991) pointed out that these two forms of organoxenobiotics havea key role in presenting soil bacteria with a major selection pressure. The molec-ular bases for organoxenobiotic resistance and catabolism are generally located insoil bacteria, on extrachromosomal plasmid DNA, the maintenance of whichrequires this selection pressure.
CONCLUSIONS
The structure and physiology of prokaryotes have been studied for more than acentury, and we know much about their taxonomic and metabolic diversity that isdirectly relevant to their central role and essential activities in soil ecosystems. Whilesummarizing what we know, we have also indicated the vast amount of importantinformation that remains to be discovered. Arguably the majority of phylogenetic
142 Chapter 5 The Prokaryotes
Ch05-P546807.qxd 11/18/06 6:36 PM Page 142
groups and strains that are abundant and important for soil processes have yet tobe isolated and characterized. The diversity of the prokaryotes is significantlygreater than that of higher organisms, but the lack of clear species definition limitsour ability to apply concepts linking, for example, diversity to important ecosystemproperties, such as stability and resilience. Elucidation of mechanisms generatingand controlling prokaryote diversity within the soil environment and understandingthe two-way relationships between prokaryotes and the soil, with its spatial and tem-poral heterogeneity, represent an enormous and exciting challenge. It is essentialthat this challenge is undertaken in order to provide a basis for understanding, andpotentially, predicting the impact of environmental change on prokaryote diver-sity. Increased understanding of the links between phylogenetic diversity and func-tional and physiological diversity is also essential to determine the consequencesof changes in prokaryote diversity and community structure on terrestrial biogeo-chemical cycling processes.
REFERENCES AND GENERAL READING
Bayer, E. A., Belaich, J., Shoham, Y., and Lamed, R. (2004). The cellulosomes: multienzyme machinesfor degradation of plant cell wall polysaccharides. Annu. Rev. Microbiol. 58, 521–554.
Blankenfeldt, W., Kuzin, A. P., Skarina, T., Korniyenko, Y., Tong, L., Bayer, P., Janning, P.,Thomashow, L. S., and Mavrod, D. V. (2004). Structure and function of the phenazine biosyntheticprotein PhzF from Pseudomonas fluorescens. Proc. Natl. Acad. Sci. USA 101, 16431–16436.
Brisbane, P. G., and Rovira, A. D. (1988). Mechanisms of inhibition of Gaeumannomyces graminis vartritici by fluorescent pseudomonads. Plant Pathol. 37, 104–111.
Buckley, D. H., and Schmidt, T. M. (2003). Diversity and dynamics of microbial communities in soilsfrom agro-ecosystems. Environ. Microbiol. 5, 441–452.
Burns, R. G., and Dick, R. P. (2002). “Enzymes in the Environment.” Dekker, New York.Carballido-Lopez, R., and Errington, J. (2003). A dynamic bacterial cytoskeleton. Trends Cell Biol. 13,
577–583.Cohan, F. M. (2002). What are bacterial species? Annu. Rev. Microbiol. 56, 457–487.Crawford, R. L., and Crawford, D. L. (1996). “Bioremediation—Principles and Applications.” Cambridge
Univ. Press, Cambridge, UK.Cronan, J. E. (2003). Bacterial membrane lipids: where do we stand? Annu. Rev. Microbiol. 57, 203–224.Daniel, R. A., and Errington, J. (2003). Control of cell morphogenesis in bacteria: two distinct ways to
make a rod-shaped cell. Cell 113, 767–776.Daubaras, D., and Chakrabarty, A. M. (1992). The environment, microbes and bioremediation: microbial
activities modulated by the environment. Biodegradation 3, 125–135.Dworkin, M., Falkow, S., Rosenberg, E., et al. (2001). “The Prokaryotes: An Evolving Electronic
Resource for the Microbiological Community. Springer-Verlag, New York.Errington, J. (1993). Bacillus subtilis sporulation—regulation of gene expression and control of mor-
phogenesis. Microbiol. Rev. 57, 1–33.Errington, J., Daniel, R. A., and Scheffers, D. J. (2003). Cytokinesis in bacteria. Microbiol. Mol. Biol.
Rev. 67, 1–52.Greenwood, D. J. (1975). Soil physical conditions and crop production. MAFF Bull. 29, 261–272.Harshey, R. M. (2003). Bacterial motility on a surface: many ways to a common goal. Annu. Rev.
Microbiol. 57, 249–273.Hugenholtz, P., Goebel, B. M., and Pace, N. R. (1998). Impact of culture-independent studies on the
emerging phylogenetic view of bacterial diversity. J. Bacteriol. 180, 4765–4774.
References and General Reading 143
Ch05-P546807.qxd 11/18/06 6:36 PM Page 143
Kelley, I., Freeman, J. P., Evans, F. E., and Cerniglia, C. E. (1993). Identification of metabolites fromthe degradation of fluoranthrene by Mycobacterium sp. strain Pyr-1. Appl. Environ. Microbiol. 59,800–806.
Killham, K. (1986). Heterotrophic nitrification. In “Nitrification” (J. I. Prosser, ed.), Vol. 20, pp. 117–126.IRL Press, Oxford.
Killham, K. (1994). “Soil Ecology.” Cambridge Univ. Press, Cambridge, UK.Killham, K., Amato, M., and Ladd, J. N. (1993). Effect of substrate location in soil and soil pore-water
regime on carbon turnover. Soil Biol. Biochem. 25, 57–62.Kjelleberg, S. (1993). “Starvation in Bacteria.” Plenum, New York.Koch, A. L. (1996). What size should a bacterium be? A question of scale. Annu. Rev. Microbiol. 50,
317–348.Koonin, E. V., Makarova, K. S., and Aravind, L. (2001). Horizontal gene transfer in prokaryotes: quan-
tification and classification. Annu. Rev. Microbiol. 55, 709–742.Margulis, L. (1993). “Symbiosis in cell evolution: microbial communities in the archean and protero-
zoic eons.” 2nd edition. W.M. Freeman and Co., New York.May, H. D., Boyle, A. W., Price, W. A., and Blake, C. K. (1992). Subculturing of a polychlorinated biphenyl-
dechlorinating anaerobic enrichment on solid media. Appl. Environ. Microbiol. 58, 4051–4054.McBride, M. J. (2001). Bacterial gliding motility: multiple mechanisms for cell movement over sur-
faces. Annu. Rev. Microbiol. 55, 49–75.Mohan, S., Dow, C., and Coles, J. A. (1992). “Prokaryotic Structure and Function.” Cambridge Univ.
Press, New York.Nakatsu, C., Ng, J., Singh, R., Straus, N., and Wyndham, C. (1991). Chlorobenzoate catabolic transposon
Tn5271 is a composite class-I element with flanking class-II insertion sequences. Proc. Natl. Acad.Sci. USA 88, 8312–8316.
Östling, J., Holmquist, L., Flärdh, K., Svenblad, B., Jouper-Jaan, Å., and Kjelleberg, S. (1993).Starvation and recovery of Vibrio. In “Starvation in Bacteria” (S. Kjelleberg, ed.), pp. 103–128.Plenum, New York.
Pace, N. R., Stahl, D. A., Lane, D. J., and Olsen, G. J. (1986). The analysis of microbial populationsby ribosomal RNA sequences. Adv. Microbial Ecol. 9, 1–55.
Palleroni, N. J. (1984). Genus I: Pseudomonas. In “Bergey’s Manual of Systematic Bacteriology”(N. R. Krieg and J. G. Holt, eds.), pp. 1441–1499. Williams & Wilkins, Baltimore.
Paul, E. A., and Clarke, F. E. (1989). “Soil Microbiology and Biochemistry.” Academic Press, London.Powlowsky, J., and Shingler, V. (1994). Genetics and biochemistry of phenol degradation by
Pseudomonas sp. CF600. Biodegradation 5, 219–236.Prosser, J. I., and Tough, A. J. (1991). Growth mechanisms and growth kinetics of filamentous
microorganisms. Crit. Rev. Biotechnol. 10, 253–274.Rappe, M. S., and Giovannoni, S. J. (2003). The uncultured microbial majority. Annu. Rev. Microbiol.
57, 369–394.Schulz, M. N., and Jørgensen, B. B. (2001). Big bacteria. Annu. Rev. Microbiol. 55, 105–137.Selifonov, S. A., Grifoll, M., Gurst, J. E., and Chapman, P. J. (1993). Isolation and characterization of
(�)-1,1a-dihydroxy-1-hydrofluoren-9-one formed by angular dioxygenation in the bacterial catab-olism of fluorene. Biochem. Biophys. Res. Commun. 193, 67–76.
Sutherland, J. B., Rafii, F., Kahn, A. A., and Cerniglia, C. E. (1995). Mechanisms of polycyclic aromatichydrocarbon degradation. In “Microbial Transformation and Degradation of Toxic OrganicChemicals” (L. L. Young and C. E. Cerniglia, eds.), pp. 269–306. Wiley–Liss, New York.
Thomashow, L. S., and Weller, D. M. (1991). Role of antibiotics and siderophores in biocontrol oftake-all disease. In “The Rhizosphere and Plant Growth” (D. L. Kleister and P. B. Cregan, eds.),pp. 245–251. Kluwer Academic, Dordrecht.
Torsvik, V., Sorheim, R., and Goksoyr, J. (1996). Total bacterial diversity in soil and sedimentcommunities—a review. J. Ind. Microbiol. 17, 170–178.
Wheelis, M. L., Kandler, O., and Woese, C. R. (1992). On the nature of global classification. Proc.Natl. Acad. Sci. USA 89, 2930–2934.
Woese, C. R., Kandler, O., and Wheelis, M. L. (1990). Towards a natural system of organisms—proposal for the domains Archaea, Bacteria, and Eucarya. Proc. Natl. Acad. Sci. USA 87, 4576–4579.
144 Chapter 5 The Prokaryotes
Ch05-P546807.qxd 11/18/06 6:36 PM Page 144

6FUNGI AND EUKARYOTIC
ALGAE
R. Greg ThornMichael D. J. Lynch
Introduction
Classification, Characteristics, and Ecological Roles in Soil
References and Suggested Reading
145
INTRODUCTION
Fungi bind soil together, both literally and figuratively, by their filamentous form,their exudates, and their trophic interactions with all other groups of soil organisms.Soil is fundamentally an aquatic habitat, since water films and water-filled soil poresoccur, at least ephemerally, even in dry deserts. For this reason, the eukaryoticalgae will be treated together with fungi and fungus-like organisms in this chapter(Fig. 6.1); in addition, both groups share a range of morphologies from filamentousto cellular. Colonial algae and seaweeds with differentiated multicellular organs donot occur in soil and are beyond the scope of this chapter. Cyanobacteria (formerlyknown as blue-green algae) are prokaryotic members of the Domain Bacteria(�Eubacteria). To treat cyanobacteria as “algae” is as inaccurate and misleadingas treating actinomycetes (prokaryotic, GC-rich members of the gram-positiveBacteria) as fungi. The distinction is of particular importance in soil ecology, sincemany cyanobacteria and some actinomycetes are important in fixation of nitrogen,a capacity not found in any eukaryotes. Both groups are discussed in Chap. 5. Thechloroplasts of plants and other photosynthetic eukaryotes have their origins inCyanobacteria, originally engulfed by an ancestor of the plant lineage (see Fig. 6.1),then transferred by secondary endosymbiosis of an ancestral red alga into the het-erokont and alveolate lineage (brown algae through dinoflagellates in Fig. 6.1) or bysecondary endosymbiosis of an ancestral green alga into the excavate (euglenoids)
Ch06-P546807.qxd 11/20/06 2:13 PM Page 145
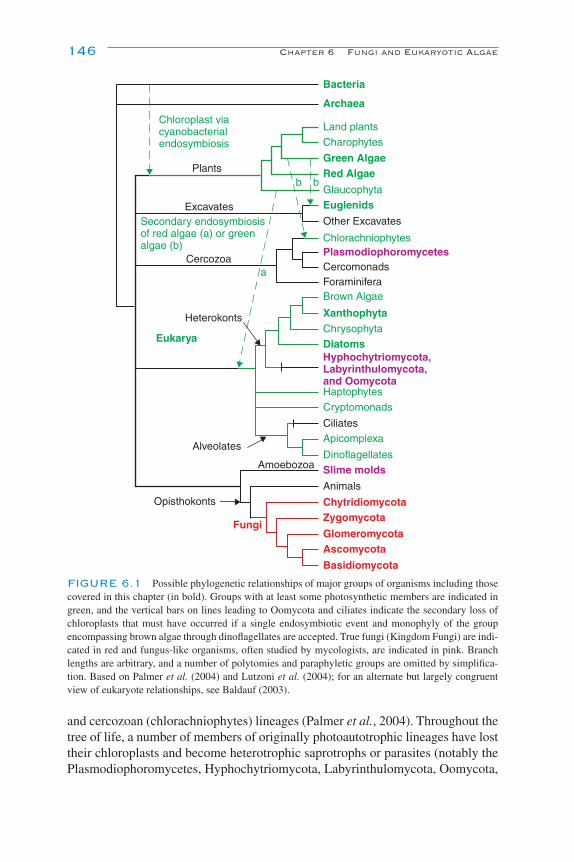
146 Chapter 6 Fungi and Eukaryotic Algae
and cercozoan (chlorachniophytes) lineages (Palmer et al., 2004). Throughout thetree of life, a number of members of originally photoautotrophic lineages have losttheir chloroplasts and become heterotrophic saprotrophs or parasites (notably thePlasmodiophoromycetes, Hyphochytriomycota, Labyrinthulomycota, Oomycota,
Bacteria
Archaea
Land plants
Charophytes
Green AlgaeRed Algae
Glaucophyta
Euglenids
Other Excavates
ChlorachniophytesPlasmodiophoromycetesCercomonadsForaminiferaBrown Algae
XanthophytaChrysophyta
DiatomsHyphochytriomycota,Labyrinthulomycota,and OomycotaHaptophytes
Cryptomonads
CiliatesApicomplexa
DinoflagellatesSlime molds
Animals
ChytridiomycotaZygomycota
GlomeromycotaAscomycota
Basidiomycota
Fungi
Opisthokonts
Alveolates
Amoebozoa
Eukarya
Heterokonts
Cercozoa
Secondary endosymbiosisof red algae (a) or greenalgae (b)
Excavates
Plants
Chloroplast viacyanobacterialendosymbiosis
a
b b
FIGURE 6.1 Possible phylogenetic relationships of major groups of organisms including thosecovered in this chapter (in bold). Groups with at least some photosynthetic members are indicated ingreen, and the vertical bars on lines leading to Oomycota and ciliates indicate the secondary loss ofchloroplasts that must have occurred if a single endosymbiotic event and monophyly of the groupencompassing brown algae through dinoflagellates are accepted. True fungi (Kingdom Fungi) are indi-cated in red and fungus-like organisms, often studied by mycologists, are indicated in pink. Branchlengths are arbitrary, and a number of polytomies and paraphyletic groups are omitted by simplifica-tion. Based on Palmer et al. (2004) and Lutzoni et al. (2004); for an alternate but largely congruentview of eukaryote relationships, see Baldauf (2003).
Ch06-P546807.qxd 11/20/06 2:13 PM Page 146
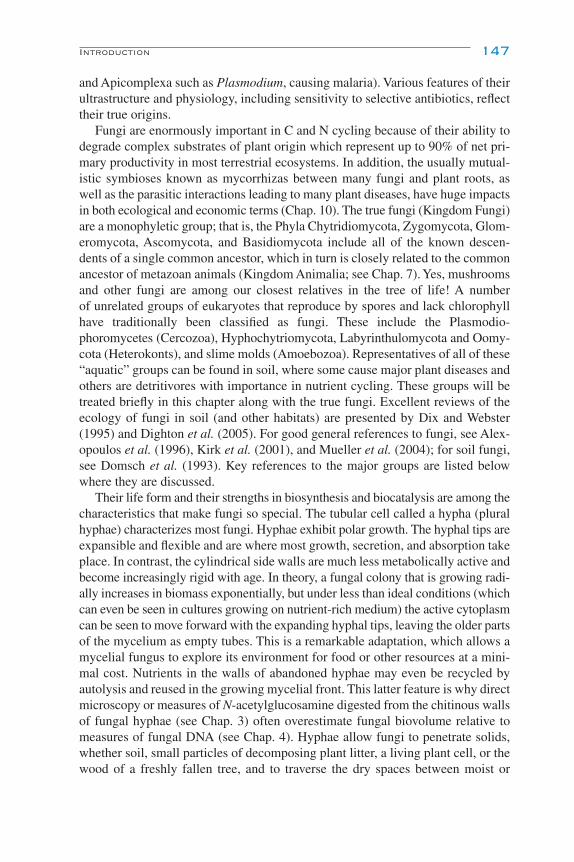
and Apicomplexa such as Plasmodium, causing malaria). Various features of theirultrastructure and physiology, including sensitivity to selective antibiotics, reflecttheir true origins.
Fungi are enormously important in C and N cycling because of their ability todegrade complex substrates of plant origin which represent up to 90% of net pri-mary productivity in most terrestrial ecosystems. In addition, the usually mutual-istic symbioses known as mycorrhizas between many fungi and plant roots, aswell as the parasitic interactions leading to many plant diseases, have huge impactsin both ecological and economic terms (Chap. 10). The true fungi (Kingdom Fungi)are a monophyletic group; that is, the Phyla Chytridiomycota, Zygomycota, Glom-eromycota, Ascomycota, and Basidiomycota include all of the known descen-dents of a single common ancestor, which in turn is closely related to the commonancestor of metazoan animals (Kingdom Animalia; see Chap. 7). Yes, mushroomsand other fungi are among our closest relatives in the tree of life! A numberof unrelated groups of eukaryotes that reproduce by spores and lack chlorophyllhave traditionally been classified as fungi. These include the Plasmodio-phoromycetes (Cercozoa), Hyphochytriomycota, Labyrinthulomycota and Oomy-cota (Heterokonts), and slime molds (Amoebozoa). Representatives of all of these“aquatic” groups can be found in soil, where some cause major plant diseases andothers are detritivores with importance in nutrient cycling. These groups will betreated briefly in this chapter along with the true fungi. Excellent reviews of theecology of fungi in soil (and other habitats) are presented by Dix and Webster(1995) and Dighton et al. (2005). For good general references to fungi, see Alex-opoulos et al. (1996), Kirk et al. (2001), and Mueller et al. (2004); for soil fungi,see Domsch et al. (1993). Key references to the major groups are listed belowwhere they are discussed.
Their life form and their strengths in biosynthesis and biocatalysis are among thecharacteristics that make fungi so special. The tubular cell called a hypha (pluralhyphae) characterizes most fungi. Hyphae exhibit polar growth. The hyphal tips areexpansible and flexible and are where most growth, secretion, and absorption takeplace. In contrast, the cylindrical side walls are much less metabolically active andbecome increasingly rigid with age. In theory, a fungal colony that is growing radi-ally increases in biomass exponentially, but under less than ideal conditions (whichcan even be seen in cultures growing on nutrient-rich medium) the active cytoplasmcan be seen to move forward with the expanding hyphal tips, leaving the older partsof the mycelium as empty tubes. This is a remarkable adaptation, which allows amycelial fungus to explore its environment for food or other resources at a mini-mal cost. Nutrients in the walls of abandoned hyphae may even be recycled byautolysis and reused in the growing mycelial front. This latter feature is why directmicroscopy or measures of N-acetylglucosamine digested from the chitinous wallsof fungal hyphae (see Chap. 3) often overestimate fungal biovolume relative tomeasures of fungal DNA (see Chap. 4). Hyphae allow fungi to penetrate solids,whether soil, small particles of decomposing plant litter, a living plant cell, or thewood of a freshly fallen tree, and to traverse the dry spaces between moist or
Introduction 147
Ch06-P546807.qxd 11/20/06 2:13 PM Page 147
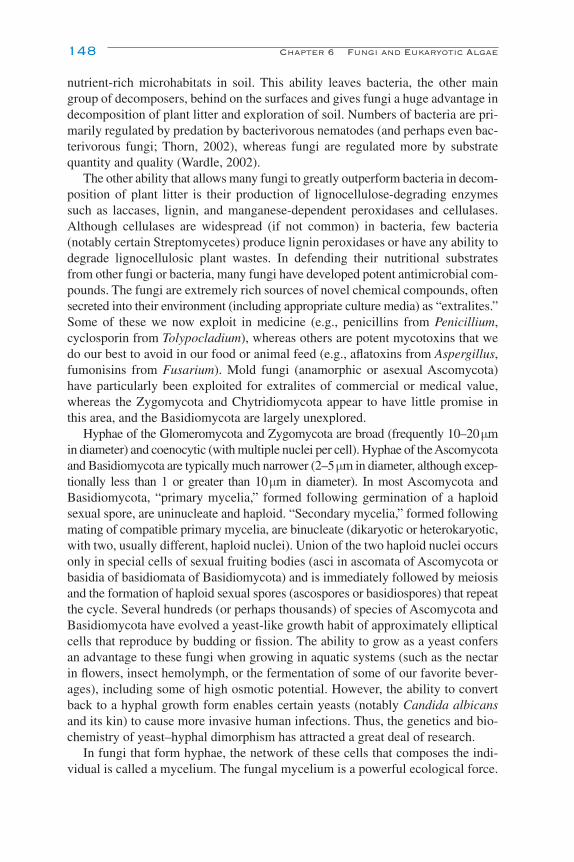
nutrient-rich microhabitats in soil. This ability leaves bacteria, the other maingroup of decomposers, behind on the surfaces and gives fungi a huge advantage indecomposition of plant litter and exploration of soil. Numbers of bacteria are pri-marily regulated by predation by bacterivorous nematodes (and perhaps even bac-terivorous fungi; Thorn, 2002), whereas fungi are regulated more by substratequantity and quality (Wardle, 2002).
The other ability that allows many fungi to greatly outperform bacteria in decom-position of plant litter is their production of lignocellulose-degrading enzymessuch as laccases, lignin, and manganese-dependent peroxidases and cellulases.Although cellulases are widespread (if not common) in bacteria, few bacteria(notably certain Streptomycetes) produce lignin peroxidases or have any ability todegrade lignocellulosic plant wastes. In defending their nutritional substratesfrom other fungi or bacteria, many fungi have developed potent antimicrobial com-pounds. The fungi are extremely rich sources of novel chemical compounds, oftensecreted into their environment (including appropriate culture media) as “extralites.”Some of these we now exploit in medicine (e.g., penicillins from Penicillium,cyclosporin from Tolypocladium), whereas others are potent mycotoxins that wedo our best to avoid in our food or animal feed (e.g., aflatoxins from Aspergillus,fumonisins from Fusarium). Mold fungi (anamorphic or asexual Ascomycota)have particularly been exploited for extralites of commercial or medical value,whereas the Zygomycota and Chytridiomycota appear to have little promise inthis area, and the Basidiomycota are largely unexplored.
Hyphae of the Glomeromycota and Zygomycota are broad (frequently 10–20 µmin diameter) and coenocytic (with multiple nuclei per cell). Hyphae of the Ascomycotaand Basidiomycota are typically much narrower (2–5 µm in diameter, although excep-tionally less than 1 or greater than 10 µm in diameter). In most Ascomycota andBasidiomycota, “primary mycelia,” formed following germination of a haploidsexual spore, are uninucleate and haploid. “Secondary mycelia,” formed followingmating of compatible primary mycelia, are binucleate (dikaryotic or heterokaryotic,with two, usually different, haploid nuclei). Union of the two haploid nuclei occursonly in special cells of sexual fruiting bodies (asci in ascomata of Ascomycota orbasidia of basidiomata of Basidiomycota) and is immediately followed by meiosisand the formation of haploid sexual spores (ascospores or basidiospores) that repeatthe cycle. Several hundreds (or perhaps thousands) of species of Ascomycota andBasidiomycota have evolved a yeast-like growth habit of approximately ellipticalcells that reproduce by budding or fission. The ability to grow as a yeast confersan advantage to these fungi when growing in aquatic systems (such as the nectarin flowers, insect hemolymph, or the fermentation of some of our favorite bever-ages), including some of high osmotic potential. However, the ability to convertback to a hyphal growth form enables certain yeasts (notably Candida albicansand its kin) to cause more invasive human infections. Thus, the genetics and bio-chemistry of yeast–hyphal dimorphism has attracted a great deal of research.
In fungi that form hyphae, the network of these cells that composes the indi-vidual is called a mycelium. The fungal mycelium is a powerful ecological force.
148 Chapter 6 Fungi and Eukaryotic Algae
Ch06-P546807.qxd 11/20/06 2:13 PM Page 148
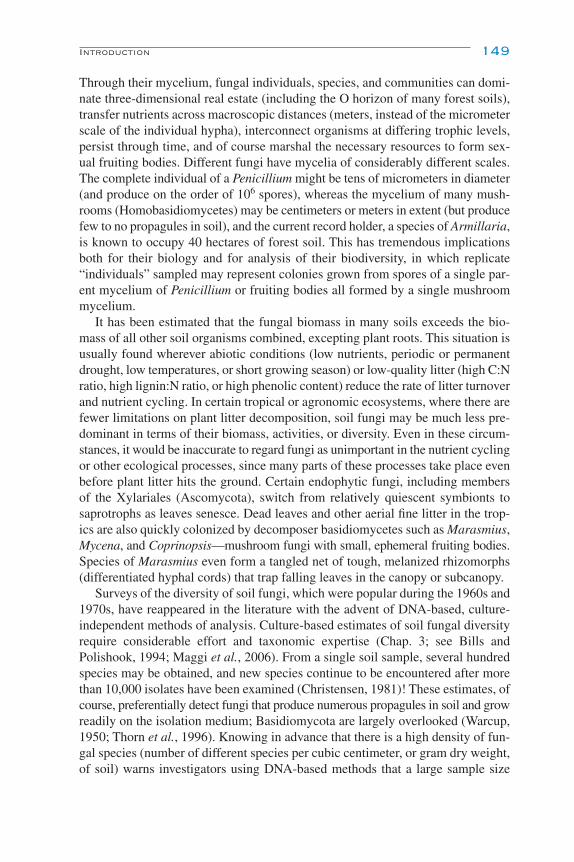
Through their mycelium, fungal individuals, species, and communities can domi-nate three-dimensional real estate (including the O horizon of many forest soils),transfer nutrients across macroscopic distances (meters, instead of the micrometerscale of the individual hypha), interconnect organisms at differing trophic levels,persist through time, and of course marshal the necessary resources to form sex-ual fruiting bodies. Different fungi have mycelia of considerably different scales.The complete individual of a Penicillium might be tens of micrometers in diameter(and produce on the order of 106 spores), whereas the mycelium of many mush-rooms (Homobasidiomycetes) may be centimeters or meters in extent (but producefew to no propagules in soil), and the current record holder, a species of Armillaria,is known to occupy 40 hectares of forest soil. This has tremendous implicationsboth for their biology and for analysis of their biodiversity, in which replicate“individuals” sampled may represent colonies grown from spores of a single par-ent mycelium of Penicillium or fruiting bodies all formed by a single mushroommycelium.
It has been estimated that the fungal biomass in many soils exceeds the bio-mass of all other soil organisms combined, excepting plant roots. This situation isusually found wherever abiotic conditions (low nutrients, periodic or permanentdrought, low temperatures, or short growing season) or low-quality litter (high C:Nratio, high lignin:N ratio, or high phenolic content) reduce the rate of litter turnoverand nutrient cycling. In certain tropical or agronomic ecosystems, where there arefewer limitations on plant litter decomposition, soil fungi may be much less pre-dominant in terms of their biomass, activities, or diversity. Even in these circum-stances, it would be inaccurate to regard fungi as unimportant in the nutrient cyclingor other ecological processes, since many parts of these processes take place evenbefore plant litter hits the ground. Certain endophytic fungi, including membersof the Xylariales (Ascomycota), switch from relatively quiescent symbionts tosaprotrophs as leaves senesce. Dead leaves and other aerial fine litter in the trop-ics are also quickly colonized by decomposer basidiomycetes such as Marasmius,Mycena, and Coprinopsis—mushroom fungi with small, ephemeral fruiting bodies.Species of Marasmius even form a tangled net of tough, melanized rhizomorphs(differentiated hyphal cords) that trap falling leaves in the canopy or subcanopy.
Surveys of the diversity of soil fungi, which were popular during the 1960s and1970s, have reappeared in the literature with the advent of DNA-based, culture-independent methods of analysis. Culture-based estimates of soil fungal diversityrequire considerable effort and taxonomic expertise (Chap. 3; see Bills andPolishook, 1994; Maggi et al., 2006). From a single soil sample, several hundredspecies may be obtained, and new species continue to be encountered after morethan 10,000 isolates have been examined (Christensen, 1981)! These estimates, ofcourse, preferentially detect fungi that produce numerous propagules in soil and growreadily on the isolation medium; Basidiomycota are largely overlooked (Warcup,1950; Thorn et al., 1996). Knowing in advance that there is a high density of fun-gal species (number of different species per cubic centimeter, or gram dry weight,of soil) warns investigators using DNA-based methods that a large sample size
Introduction 149
Ch06-P546807.qxd 11/20/06 2:13 PM Page 149
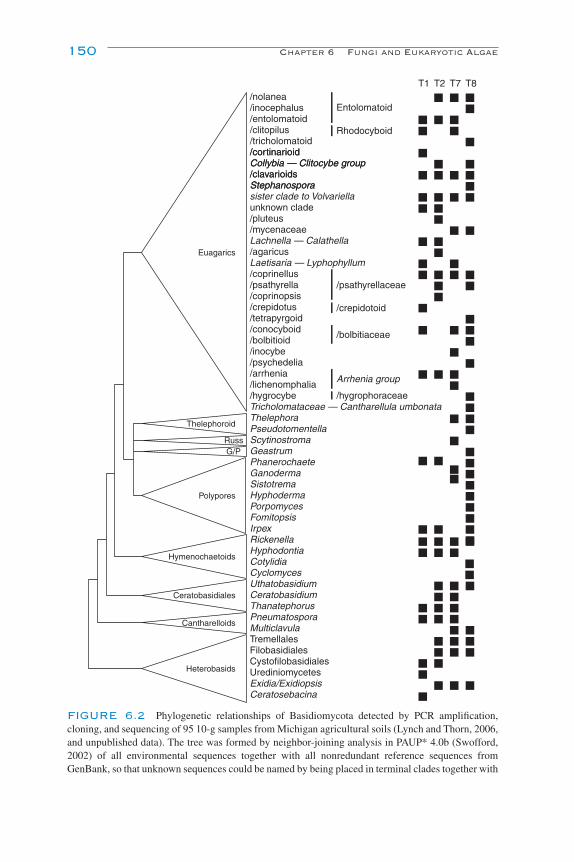
150 Chapter 6 Fungi and Eukaryotic Algae
/nolanea/inocephalus/entolomatoid/clitopilus/tricholomatoid/cortinarioid/cortinarioidCollybia — Clitocybe groupCollybia — Clitocybe group/clavarioids/clavarioidsStephanosporaStephanosporasister clade to Volvariellaunknown clade/pluteus/mycenaceaeLachnella — Calathella/agaricusLaetisaria — Lyphophyllum/coprinellus/psathyrella/coprinopsis/crepidotus/tetrapyrgoid/conocyboid/bolbitioid/inocybe/psychedelia/arrhenia/lichenomphalia/hygrocybeTricholomataceae — Cantharellula umbonataThelephoraPseudotomentellaScytinostromaGeastrumPhanerochaeteGanodermaSistotremaHyphodermaPorpomycesFomitopsisIrpexRickenellaHyphodontiaCotylidiaCyclomycesUthatobasidiumCeratobasidiumThanatephorusPneumatosporaMulticlavulaTremellalesFilobasidialesCystofilobasidialesUrediniomycetesExidia/ExidiopsisCeratosebacina
Heterobasids
Cantharelloids
Ceratobasidiales
Hymenochaetoids
Polypores
G/PRuss
Thelephoroid
Euagarics
Entolomatoid
Rhodocyboid
/psathyrellaceae
/crepidotoid
/bolbitiaceae
Arrhenia group
/hygrophoraceae
T1 T2 T7 T8
FIGURE 6.2 Phylogenetic relationships of Basidiomycota detected by PCR amplification,cloning, and sequencing of 95 10-g samples from Michigan agricultural soils (Lynch and Thorn, 2006,and unpublished data). The tree was formed by neighbor-joining analysis in PAUP* 4.0b (Swofford,2002) of all environmental sequences together with all nonredundant reference sequences from GenBank, so that unknown sequences could be named by being placed in terminal clades together with
Ch06-P546807.qxd 11/20/06 2:13 PM Page 150
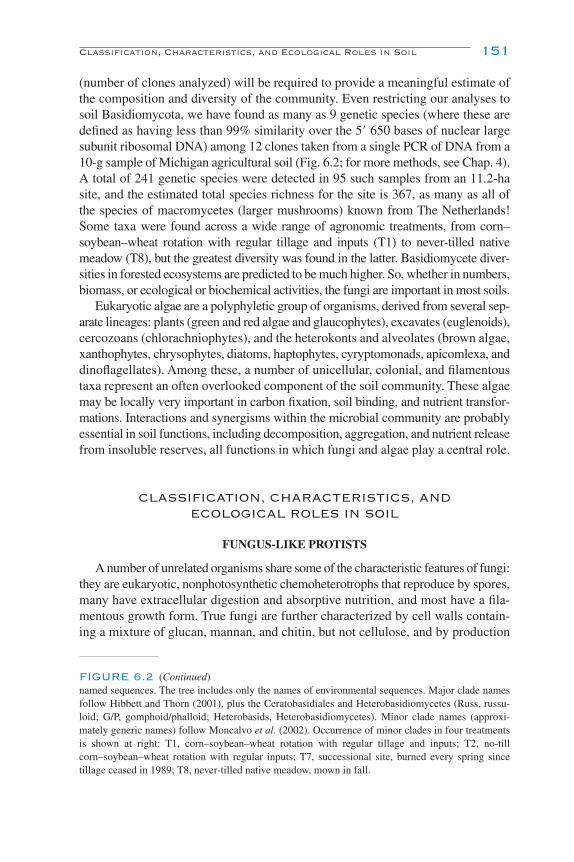
Classification, Characteristics, and Ecological Roles in Soil 151
(number of clones analyzed) will be required to provide a meaningful estimate ofthe composition and diversity of the community. Even restricting our analyses tosoil Basidiomycota, we have found as many as 9 genetic species (where these aredefined as having less than 99% similarity over the 5� 650 bases of nuclear largesubunit ribosomal DNA) among 12 clones taken from a single PCR of DNA from a10-g sample of Michigan agricultural soil (Fig. 6.2; for more methods, see Chap. 4).A total of 241 genetic species were detected in 95 such samples from an 11.2-hasite, and the estimated total species richness for the site is 367, as many as all of the species of macromycetes (larger mushrooms) known from The Netherlands!Some taxa were found across a wide range of agronomic treatments, from corn–soybean–wheat rotation with regular tillage and inputs (T1) to never-tilled nativemeadow (T8), but the greatest diversity was found in the latter. Basidiomycete diver-sities in forested ecosystems are predicted to be much higher. So, whether in numbers,biomass, or ecological or biochemical activities, the fungi are important in most soils.
Eukaryotic algae are a polyphyletic group of organisms, derived from several sep-arate lineages: plants (green and red algae and glaucophytes), excavates (euglenoids),cercozoans (chlorachniophytes), and the heterokonts and alveolates (brown algae,xanthophytes, chrysophytes, diatoms, haptophytes, cyryptomonads, apicomlexa, anddinoflagellates). Among these, a number of unicellular, colonial, and filamentoustaxa represent an often overlooked component of the soil community. These algaemay be locally very important in carbon fixation, soil binding, and nutrient transfor-mations. Interactions and synergisms within the microbial community are probablyessential in soil functions, including decomposition, aggregation, and nutrient releasefrom insoluble reserves, all functions in which fungi and algae play a central role.
CLASSIFICATION, CHARACTERISTICS, ANDECOLOGICAL ROLES IN SOIL
FUNGUS-LIKE PROTISTS
A number of unrelated organisms share some of the characteristic features of fungi:they are eukaryotic, nonphotosynthetic chemoheterotrophs that reproduce by spores,many have extracellular digestion and absorptive nutrition, and most have a fila-mentous growth form. True fungi are further characterized by cell walls contain-ing a mixture of glucan, mannan, and chitin, but not cellulose, and by production
FIGURE 6.2 (Continued)named sequences. The tree includes only the names of environmental sequences. Major clade namesfollow Hibbett and Thorn (2001), plus the Ceratobasidiales and Heterobasidiomycetes (Russ, russu-loid; G/P, gomphoid/phalloid; Heterobasids, Heterobasidiomycetes). Minor clade names (approxi-mately generic names) follow Moncalvo et al. (2002). Occurrence of minor clades in four treatmentsis shown at right: T1, corn–soybean–wheat rotation with regular tillage and inputs; T2, no-tillcorn–soybean–wheat rotation with regular inputs; T7, successional site, burned every spring sincetillage ceased in 1989; T8, never-tilled native meadow, mown in fall.
Ch06-P546807.qxd 11/20/06 2:13 PM Page 151

of the membrane sterol ergosterol (Alexopoulos et al., 1996). Molecular phyloge-netic studies are gradually piecing together the relationships of some of these groups,about which we know very little compared to vascular plants or metazoan ani-mals. Early studies were limited by the small number of representatives in culture,but the growing “Tree of Life” project (e.g., Lutzoni et al., 2004) and broad-scalesequencing of environmental DNA (e.g., Venter et al., 2004) are obtaining sequencesfor novel taxa and discovering many previous unknown lineages among fungi andbasal eukaryotes (e.g., Vandenkoornhuyse et al., 2002; Schadt et al., 2003). Fungus-like members of the “protist” Phylum Cercozoa are represented in soil by soil-borneplant pathogens Plasmodiophora and Spongospora (Plasmodiophoromycetes),which infect roots via biflagellate zoospores and then form a multinucleate plas-modium within their hosts (Braselton, 2001). Diverse unrecognized lineages ofthis phylum are apparently widespread (Bass and Cavalier-Smith, 2004). TheOomycota (Heterokonta) include Pythium and Phytophthora, two genera ofimportant soil-borne plant pathogens with broad host ranges (Erwin et al., 1983;Martin, 1992; Levesque and de Cock, 2004). Infection is via biflagellate zoosporesthat germinate to form broad, rapidly growing tubular hyphae. Oomycotans differsubstantially from true fungi in the chemistry of their cell walls and membranes,particularly the presence of cellulose in cell walls and the absence of ergosterol inmembranes and also in ploidy, being diploid rather than haploid or dikaryotic(Fuller and Jaworski, 1987; Dick, 2001). Their flagella include a posterior whiplashflagellum and an anterior tinsel flagellum. The Hyphochytriomycota are a smallgroup of little or no known economic importance; their zoospores have a singleanterior tinsel flagellum, but molecular and ultrastructural evidence places themtogether with the biflagellate heterokont organisms such as Oomycota andchromistan algae (Fuller, 2001). Hyphochytrium and Rhizidiomyces may be sapro-trophs or parasites of fungi or other soil organisms. Molecular evidence placesthe Labyrinthulomycota together with heterokont protists such as Oomycota(Cavalier-Smith, 2004). Labyrinthula have fusoid cells that glide in an extracellu-lar, netlike slime; they are pathogens of marine plants and algae and of vascularplants in saline soils (Bigelow et al., 2005). The Phylum Mycetozoa (�Myxomycota,or slime molds) includes organisms with a mixture of characters resembling fungiand animals: reproduction by spores and ingestion of food by phagocytosis(Baldauf and Doolittle, 1997). Spores of slime molds germinate to form amoebae,which aggregate to form a slime phase that eventually differentiates to form fruit-ing bodies with spores. In the Class Dictyosteliomycetes (Raper, 1984), the slimephase (pseudoplasmodium) consists of cells that maintain their separate mem-branes, whereas in the Myxomycetes, the plasmodium is a coenocytic mass ofnuclei in a slimy matrix. Both amoeboid and plasmodial phases are phagotrophic onbacteria, spores, and detritus and are probably very important in releasing nutrientsthat are immobilized in these cells and substrates. Approximately 1000 species in80 genera are known. Plasmodia and fruiting bodies of some Myxomycetes can bequite conspicuous in lawns and gardens during the summer months (Martin andAlexopoulos, 1969; Stephenson and Stempen, 1994).
152 Chapter 6 Fungi and Eukaryotic Algae
Ch06-P546807.qxd 11/20/06 2:13 PM Page 152
FUNGI (CHYTRIDIOMYCOTA, GLOMEROMYCOTA,ZYGOMYCOTA, ASCOMYCOTA, AND BASIDIOMYCOTA)
The chytrids are a relatively small group of approximately 1000 species in 120genera (Kirk et al., 2001). Soil chytrids include plant pathogens such as Synchytriumand Olpidium, nematode parasites such as Catenaria, parasites of algae such asChytridium, and saprobes such as Allomyces and Chytriomyces. The soil chytridspossess motile zoospores powered by a single, posterior flagellum and are thoughtto be close to the common ancestor of fungi and animals (Mendoza et al., 2002;James et al., 2006). Recognition of the Phylum Glomeromycota (Schuessler et al.,2001) resolves some of the problems seen in earlier phylogenetic analyses inwhich chytrids formed a monophyletic group that divided the zygomycetes or foundthat both groups were paraphyletic with respect to the other. Gomeromycota andchytrids share ancient sequences for tubulin genes, remarkably conserved despite the age of their divergence (Corradi et al., 2004). Together, the chytrids, Glomero-mycota, and Zygomycota differ from the Ascomycota and Basidiomycota in thatthey have broad, coenocytic hyphae, with multiple haploid nuclei per cell,whereas the Ascomycota and Basidiomycota typically have uninucleate haploidprimary mycelia and binucleate (di-haploid) secondary mycelia. The name Phyco-mycetes was formerly used to refer to the coenocytic fungi (sometimes togetherwith the unrelated Oomycota). Regrettably, the best general references to thesefungi are quite old (e.g., Sparrow, 1960; Karling, 1977), although there has been aresurgence in research on this group (Barr, 2001).
The Glomales (Phylum Glomeromycota) are the fungal symbionts of arbuscularmycorrhizas (also known as endomycorrhizas). They were recently transferred fromthe Zygomycota to a new phylum on the basis of molecular phylogenetic infor-mation, which is supported by their great age (at least 500 My) and unique biol-ogy (Schuessler et al., 2001). Broad, multinucleate hyphae extend from plant rootsinto soil and aid in uptake of water and nutrients, particularly phosphate (Smithand Read, 1997). Large, multinucleate asexual spores (sometimes referred to aschlamydospores or azygospores) are formed in soil or roots, and the morphologyof these spores forms almost the sole basis for their taxonomy. Glomalin, a glyco-protein excreted by glomalean fungi, is associated with aggregate stability in soils(Wright and Upadhyaya, 1998; Rillig, 2004). Approximately 150 species in six gen-era are known (Kirk et al., 2001), and these form symbioses with approximately70% of all land plants, particularly herbaceous plants and woody plants of thetropics (Brundrett, 2002). Taxonomic and ecological references to the group includeGerdemann and Trappe (1974) and Morton and Benny (1990).
Within the Zygomycota are two very different classes of fungi: the Trichomycetesand Zygomycetes. Trichomycetes (about 200 species) are obligate endosymbiontsof arthropods (Benny, 2001; Kirk et al., 2001). Approximately 800 species ineight orders of Zygomycetes are known (Benny et al., 2001; Kirk et al., 2001).Many are saprobes (Mucorales and relatives), and others are parasites of arthro-pods and other invertebrates or of other fungi (Zoopagales, Entomophthorales,
Classification, Characteristics, and Ecological Roles in Soil 153
Ch06-P546807.qxd 11/20/06 2:13 PM Page 153
and Kickxellales). Rhizopus and Mucor (both Mucorales) are weedy molds read-ily isolated from soil. In the earlier literature, the saprobic Mucorales were oftenreferred to as “sugar fungi.” The accompanying view held that these organisms arerapid colonists making use of the soluble sugars before secondary colonists becomeestablished during the succession of different fungi on rich and freshly depositedsubstrates such as dung and fallen fruits (Garrett, 1963). In reality, the earlyappearance of Mucorales on such substrates reflects their rapid rates of growth andsporulation; in many cases the “secondary colonists” are already there and digest-ing the more recalcitrant substrates, but are slower to sporulate and come to ournotice (Pugh, 1974; Cooke and Rayner, 1984). Still, the term “sugar fungi” accu-rately portrays the typical growth substrate of these fungi. They are not noted fortheir extracellular degradative enzymes and may frequently depend on solublebreakdown products provided by lignocellulose-degrading ascomycetes or basid-iomycetes (Cooke and Rayner, 1984). From here, it may have been a short step todirect, biotrophic parasitism of the decomposer fungi, a nutritional mode foundamong some Mucorales and related groups (O’Donnell, 1979; Benny et al., 2001).The references listed previously provide an entry point for the literature on taxo-nomy and ecology of soil Zygomycetes.
The Ascomycota are the largest group in number of species (approximately33,000, plus another 16,000 known only as asexual forms) and span a range ofnutritional modes from parasites and pathogens of plants, animals, and other fungithrough mutualists (forming both lichens and some ectomycorrhizas) and sapro-trophs (Kirk et al., 2001). Meiosis and production of sexual spores (ascospores)occurs within a sac-shaped cell, the ascus. It has often puzzled other biologiststhat mycologists may refer to the same fungus by two (or more) different namesdepending on whether it reproduces sexually (referred to as the teleomorph) orasexually (anamorph). A separate, artificial phylum (Deuteromycota, or “FungiImperfecti”) and a number of artificial class names (Agonomycetes, Coelomycetes,Deuteromycetes, Hyphomycetes) have been used for fungi that lack known sexualstructures, but the majority of these are asexual relatives of Ascomycota (Seifertand Gams, 2001). Most fungal systematists have abandoned the Deuteromycota,and many are now trying to unify the classification of these fungi as they arelinked by phylogenetic analyses of their DNA sequences. Among the filamentousAscomycota are many of the most important soil-borne pathogens of crop plants,including wilts caused by Fusarium and Verticillium and root and stem rots causedby Cochliobolus, Giberella, Gaeumannomyces, Phymatotrichopsis, and Sclerotinia(Farr et al., 1989; Holliday, 1989; Agrios, 1997). The most familiar and econom-ically important molds, including Aspergillus and Penicillium, are asexual formsof Ascomycota that are also abundant in soils: Aspergillus more commonly intropical soils and Penicillium more commonly in cool temperate and boreal soils(Christensen, 1981). Key literature to the identification of anamorphic and teleo-morphic Ascomycota includes Ellis (1971, 1976), Pitt (1979), von Arx (1981),Domsch et al. (1993), and Klich (2002), with additional references provided byKirk et al. (2001) and Mueller et al. (2004).
154 Chapter 6 Fungi and Eukaryotic Algae
Ch06-P546807.qxd 11/20/06 2:13 PM Page 154
Yeasts are fungi adapted to life in aqueous environments often of high osmoticpotential, through growth of separate, usually elliptical cells that divide by bud-ding or fission (Barnett et al., 1990; Kurtzman and Fell, 1998). Most yeasts,including the most economically important ones such as Saccharomyces cerevisiae,belong in the Ascomycota (Kurtzman and Sugiyama, 2001). Many yeasts arefound in association with fruits, flowers, and other rich sources of readily assimi-lated sugars and other carbohydrates, but others (particularly basidiomycetousyeasts in Cryptococcus, Rhodosporidium, Rhodotorula, and Sporobolomyces) arefound in soil, where they may be closely associated with plant roots or may beimportant members of the decomposer consortium breaking down plant and ani-mal wastes (Lachance and Starmer, 1998; Fell et al., 2001).
Lichens are symbiotic associations between fungi and green algae or cyanobac-teria, in which the fungal partner (mycobiont) forms a characteristic structurecalled a thallus (what we see as a lichen) that encloses and protects the alga orcyanobacterium (photobiont) (Hale, 1983; Nash, 1996). Just as with mycorrhizalsymbioses, lichens evolved independently in the Zygomycota, Ascomycota, andBasidiomycota (Gargas et al., 1995; Lutzoni et al., 2004), but by far the majorityof lichen species (over 20,000 described species) are in the Ascomycota (Kirket al., 2001). Lichens form the dominant ground cover over large areas of arctic andalpine environments. The cryptobiotic soil crusts that protect soils in arid envi-ronments may include lichens, together with consortia of fungi (States and Chris-tensen, 2001), algae, and cyanobacteria (West, 1990; Belnap and Lange, 2001).Brodo et al. (2001) provide a beautiful and highly useful introduction to lichenidentification and biology.
The Basidiomycota differ from Ascomycota primarily by production of sexualspores (basidiospores) outside the basidium, the cell in which meiosis takes place.Approximately 30,000 species are known. The Basidiomycota may be divided intothe subphyla Ustilaginomycotina (smuts), Urediniomycotina (rusts), and Hymeno-mycotina, the latter divided into the Classes Heterobasidiomycetes ( jelly fungi)and Homobasidiomycetes (mushrooms and relatives) (modified from Kirk et al.,2001, and McLaughlin and McLaughlin, 2001). Only the last group is importantin soil, although various stages of the life cycles of smuts and jelly fungi may occurin soil and be important to their survival. The Homobasidiomycetes, with approx-imately 13,000 described species, include gilled mushrooms, boletes, polypores,coral fungi, stinkhorns, and crust fungi, many with their mycelial phase occurringin soil (Hibbett and Thorn, 2001). This great diversity has mostly been overlookedin surveys of soil fungi. Within the Homobasidiomycetes are some very importantsoil-borne pathogens of crop plants, including Rhizoctonia (sexual states inThanatephorus and several other genera; Roberts, 1999), and of forest trees,including Armillaria, Phellinus, and Ganoderma (Tainter, 1996). The majority ofHomobasidiomycetes (perhaps 8500 described species) are saprotrophic leaf- andwood-decomposing fungi; their activities may extend well into the mineral hori-zons of soil wherever organic materials are present (Rayner and Boddy, 1988;Hibbett and Thorn, 2001).
Classification, Characteristics, and Ecological Roles in Soil 155
Ch06-P546807.qxd 11/20/06 2:13 PM Page 155
Approximately 4500 described species of Homobasidiomycetes form ectomy-corrhizal relations with woody vascular plants in 30 families. Forests of ectomyc-orrhizal trees are dominant over much of the temperate, boreal, and alpine regionsof the world, whereas tropical forests are mostly dominated by species with arbuscu-lar mycorrhizas, with ectomycorrhizal trees widely dispersed or locally dominant(Smith and Read, 1997; Brundrett, 2002). Boreal forests with very few species oftrees (perhaps 2 or 3 dominants) form ectomycorrhizas with hundreds or even thou-sands of species of fungi. By contrast, highly diverse tropical forests (with 80–100species per hectare) form arbuscular mycorrhizas with a handful of morphos-pecies of Glomales. Each of these represents an evolutionary conundrum.
Homobasidiomycetes also include nematode-destroying fungi, fungi cultivatedby leaf-cutting ants and their relatives, and “corpse-finder fungi” that fruit nearanimal corpses or accumulations of dung or urine (Thorn, 2002). Their tremendousrange of nutritional modes and their persistent, extensive mycelia make Homoba-sidiomycetes of great importance in spanning space, time, and trophic levels withinterrestrial ecosystems. There is a tremendous literature for identification of mush-rooms and other Homobasidiomycetes, among which Moser (1983), Gilbertson andRyvarden (1986–1987), Jülich and Stalpers (1980), and Stalpers (1993, 1996) aregood starting points for temperate taxa, with additional references provided inKirk et al. (2001) and Mueller et al. (2004). Unfortunately, there are few morpho-logical characters and no useful references for identifying cultures of these fungiisolated from soil; the best hope lies in the growing database of ribosomal DNAsequences.
EUKARYOTIC ALGAE
The temporarily or permanently wet margins of rivers, lakes, and ponds andthe peaty substrates of bogs and fens are home to many freshwater algae that donot thrive far from water. These may be referred to as the hydroterrestrial algae.However, the diverse soils of temperate and tropical agriculture, grasslands, forests,arctic and alpine tundra, and even deserts also harbor a surprisingly diverse andactive flora of both eukaryotic algae and cyanobacteria. These are referred to asterrestrial algae, or sometimes as “edaphic algae.” Cryptobiotic crusts (formed byeukaryotic algae together with filamentous fungi, yeasts, and cyanobacteria) aretermed “epedaphic.” General discussion or conclusions regarding the algal floraof soil and its functioning are hampered by historic taxonomic confusion and byliterature up to the present day in which the numbers and activities of cyanobac-teria are included together with those of eukaryotic algae. The roles of these twogroups in the soil nitrogen cycle are vastly different, since common soil cyanobac-teria such as Nostoc, Anabaena, Tolypothrix, Scytonema, and Cylindrospermumare highly active in nitrogen fixation, with rates often 20–30kg ha�1 year�1
(Zackrisson et al., 2004); rates in desert soil crusts are lower (1.4–9kg ha�1 year�1)and dependent upon taxonomic composition, moisture, and suitable temperatures(Belnap, 2002). There is room for a great deal of research to tease out the partic-ular roles and quantitative significance of the various eukaryotic algae in soil.
156 Chapter 6 Fungi and Eukaryotic Algae
Ch06-P546807.qxd 11/20/06 2:13 PM Page 156
However, in general, it can be said that they play an important role in net primaryproduction and the incorporation of organic carbon and nitrogen into soil, crucialduring primary succession on land created by volcanic activity or bared by theretreat of glaciers. Upon their death, much of this organic matter is generally read-ily accessible to microbial decomposition and enters the actively cycling nutrientpool. A small part, made up of cell wall materials and exudates, may become com-plexed with soil phenolics of plant origin and form more stable humic substancesthat help to provide soil structure. Together with soil fungi and some other microbes,terrestrial algae may also be responsible for liberation of nutrients from insolublesources in the mineral fraction or horizon of soil (Metting, 1981; Jongmans et al.,1997). Finally, in many dune or desert environments where vascular plant growthis restricted by permanent or seasonal drought, eukaryotic algae alone or in mixedcryptobiotic crusts play a vital role in stabilizing the “soil” surface, graduallyadding soil organic matter that holds soil moisture and provides nutrients for plantestablishment.
Soil is a common habitat for nonmotile green algae. Both filamentous and coccoidforms occur, the latter more common in desert soils. Green algae tend to dominatethe algal flora of acid soils, and some are observed only following enrichmentculturing. Frequent genera include Actinochloris, Ankistrodesmus, Bracteacoccus,Characium, Chlorella, Chlorococcum, Chlorosarcinopsis, Fernandinella, Hormotilla,Keratococcus, Muriella, Protosiphon, Stichococcus, Tetracystis, Apatococcus,Desmococcus, Klebsormidium, and Ulothrix. Most are limited to the surface ofwet soils, and some are epiphytic on algae or mosses. Trentepohlia forms long,brilliant orange filaments on soil-free rocks and bark, often not recognized as agreen alga even by those who notice it. In this and many other Chlorophyta, pho-toprotective carotenoids mask the “typical” grass green color.
Red algae are infrequent in typical soils. Species of Cyanidium are found inand around acidic hot springs and species of Porphyridium grow as reddish gelat-inous masses encrusting polluted, ammonium-rich soils in shaded areas and onwet, well-decayed logs. Both are spherical unicells with a mucilaginous matrix.
Species of Euglena (fusoid, uniflagellate cells with red eyespot and with orwithout chloroplasts) are abundant where moisture, organic matter, and often ammo-nium are high, such as wet footprints in paddocks, puddles, ditches, and farm ponds.Facultative photoautotrophs, they can subsist as achlorophyllous heterotrophs.The nonphotosynthetic, phagotrophic Peranema also frequents similar habitats.
Members of the golden-green algae (Xanthophyta) are usually found on thesurface of moist soils. Vegetative cells are nonmotile and exhibit a variety of growthforms, from unicellular and globose or cylindrical to colonial and coenocytic, orfilamentous. Genera reported from soil include Botrydiopsis, Botrydium, Bumilleria,Bumilleriopsis, Heterococcus, Vaucheria, and Xanthonema (�Heterothrix).
Diatoms form beautiful exoskeletons (frustules) of silica; deposits of millenniaform diatomaceous earth, which can be used as a natural insecticide. Marinediatoms are probably the single largest primary producers in the world, and diatomsare also abundant in freshwater ecosystems. In terrestrial ecosystems, diatoms
Classification, Characteristics, and Ecological Roles in Soil 157
Ch06-P546807.qxd 11/20/06 2:13 PM Page 157

occur primarily in neutral to slightly alkaline soils, where their populations mayreach 105 cells per gram dry weight of soil (Bérard et al., 2004). Members of thegenera Achnanthes, Cymbella, Fragilaria, Hantzschia, Navicula, Pinnularia,Stauroneis, and Surirella (many of which are admittedly artificial) are frequentlyreported. These are organisms of moist surfaces, including plants, other algae, lit-ter, and bare mineral or organic soil.
For reviews of terrestrial algae, see Metting (1981) and Hoffmann (1989); use-ful taxonomic references include Foged (1978), Dodd (1987), Entwisle et al.(1997), Ling and Tyler (2000), John et al. (2002), and Wehr and Sheath (2003). Aswith much of biology, much more is known about these organisms in temperate(especially north temperate) regions of the world, but the biological roles of ter-restrial algae everywhere deserve considerably more study.
REFERENCES AND SUGGESTED READING
Agrios, G. N. (1997). “Plant Pathology.” 4th ed. Academic Press, San Diego.Alexopoulos, C. J., Mims, C. W., and Blackwell, M. (1996). “Introductory Mycology.” 4th ed. Wiley,
New York.Baldauf, S. L. (2003). The deep roots of eukaryotes. Science 300, 1701–1703.Baldauf, S. L., and Doolittle, W. F. (1997). Origin and evolution of the slime molds (Mycetozoa). Proc.
Natl. Acad. Sci. USA 94, 12007–12012.Barnett, J. A., Payne, R. W., and Yarrow, D. (1990). “Yeasts: Characteristics and Identification.”
2nd ed. Cambridge Univ. Press, Cambridge, UK.Barr, D. J. S. (2001). Chytridiomycota. In “The Mycota,” Vol. VII, “Systematics and Evolution” (D. J.
McLaughlin, E. G. McLaughlin, and P. A. Lemke, eds.), Part A, pp. 93–112. Springer-Verlag,Berlin.
Bass, D., and Cavalier-Smith, T. (2004). Phylum-specific environmental DNA analysis revealsremarkably high global biodiversity of Cercozoa (Protozoa). Int. J. Syst. Evol. Microbiol. 54,2393–2404.
Belnap, J. (2002). Nitrogen fixation in biological soil crusts from southeast Utah, USA. Biol. Fertil.Soils 35, 128–135.
Belnap, J., and Lange, O. L. (2001). “Biological Soil Crusts: Structure, Function, and Management.”Ecological Studies 150. Springer-Verlag, Berlin.
Benny, G. L. (2001). Trichomycetes. In “The Mycota,” Vol. VII, “Systematics and Evolution” (D. J.McLaughlin, E. G. McLaughlin, and P. A. Lemke, eds.), Part A, pp. 147–160. Springer-Verlag, Berlin.
Benny, G. L., Humber, R. A., and Morton, J. B. (2001). Zygomycetes. In “The Mycota,” Vol. VII,“Systematics and Evolution” (D. J. McLaughlin, E. G. McLaughlin, and P. A. Lemke, eds.), Part A,pp. 113–146. Springer-Verlag, Berlin.
Bérard, A., Rimet, F., Capowiez, Y., and Lebulanger, C. (2004). Procedures for determining the pesti-cide sensitivity of indigenous soil algae: a possible bioindicator of soil contamination? Arch.Environ. Contam. Toxicol. 46, 24–31.
Bigelow, D. M., Olsen, M. W., and Gilbertson, R. L. (2005). Labyrinthula terrestris sp. nov., a newpathogen of turf grass. Mycologia 97, 185–190.
Bills, G. F., and Polishook, J. D. (1994). Abundance and diversity of microfungi in leaf litter of a low-land rain forest in Costa Rica. Mycologia 86, 187–198.
Braselton, J. P. (2001). Plasmodiophoromycota. In “The Mycota,” Vol. VII, “Systematics andEvolution” (D. J. McLaughlin, E. G. McLaughlin, and P. A. Lemke, eds.), Part A, pp. 81–91.Springer-Verlag, Berlin.
158 Chapter 6 Fungi and Eukaryotic Algae
Ch06-P546807.qxd 11/20/06 2:13 PM Page 158

Brodo, I. M., Sharnoff, S. D., and Sharnoff, S. (2001). “Lichens of North America.” Yale Univ. Press,New Haven, CT.
Brundrett, M. C. (2002). Coevolution of roots and mycorrhizas of land plants. New Phytol. 154,275–304.
Cavalier-Smith, T. (2004). Only six kingdoms of life. Proc. R. Soc. B–Biol. Sci. 271, 1251–1262.Christensen, M. (1981). Species diversity and dominance in fungal communities. In “The Fungal
Community” (D. T. Wicklow and G. C. Carroll, eds.), pp. 201–232. Dekker, New York.Cooke, R. C., and Rayner, A. D. M. (1984). “Ecology of Saprotrophic Fungi.” Longman,
London.Corradi, N., Hijri, M., Fumagalli, L., and Sanders, I. R. (2004). Arbuscular mycorrhizal fungi
(Glomeromycota) harbour ancient fungal tubulin genes that resemble those of the chytrids(Chytridiomycota). Fungal Genet. Biol. 41, 1037–1045.
Dick, M. W. (2001). “Stramenipilous Fungi.” Kluwer Academic, Dordrecht.Dighton, J. White, J. F., and Oudemans, P., eds. (2005). “The Fungal Community: Its Organization and
Role in the Ecosystem.” 3rd ed. Taylor & Francis, Boca Raton. [1st ed. (1981), D. T. Wicklow, andG. C. Carroll, eds., Dekker, New York, and 2nd ed. (1992), G. C. Carroll, and D. T. Wicklow, eds.,Dekker, New York, are both useful and independent volumes.]
Dix, N. J., and Webster, J. (1995). “Fungal Ecology.” Chapman & Hall, London.Dodd, J. J. (1987). “Diatoms: Illustrated Flora of Illinois” (R. H. Mohlenbrock, ed.). Southern Illinois
Univ. Press, Carbondale.Domsch, K. H., Gams, W., and Anderson, T.-H. (1993). “Compendium of Soil Fungi.” Academic
Press, New York.Ellis, M. B. (1971). “Dematiaceous Hyphomycetes.” Commonwealth Mycol. Inst., Kew, UK.Ellis, M. B. (1976). “More Dematiaceous Hyphomycetes.” Commonwealth Mycol. Inst., Kew, UK.Entwisle, T. J., Sonneman, J. A., and Lewis, S. H. (1997). “Freshwater Algae in Australia: a Guide to
Conspicuous Genera.” Sainty, Potts Point, NSW, Australia.Erwin, D. C., Bartnicki-Garcia, S., and Tsao, P. H., eds. (1983). “Phytophthora: Its Biology,
Taxonomy, Ecology, and Pathology.” Am. Phytopathol. Soc., St. Paul, MN.Farr, D. F., Bills, G. F., Chamuris, G. P., and Rossman, A. Y. (1989). “Fungi on Plants and Plant
Products in the United States.” Am. Phytopathol. Soc., St. Paul, MN.Fell, J. W., Boekhout, T., Fonseca, A., and Sampaio, J. P. (2001). Basidiomycetous yeasts. In “The
Mycota,” VII, “Systematics and Evolution” (D. J. Mclaughlin, E. G. McLaughlin, and P. A.Lemke, eds.), Part B, pp. 1–36. Springer-Verlag, Berlin.
Foged, N. (1978). Diatoms in eastern Australia. Bibl. Phycol. 41, 1–242.Fuller, M. S. (2001). Hyphochytriomycota. In “The Mycota,” Vol. VII, “Systematics and Evolution”
(D. J. McLaughlin, E. G. McLaughlin, and P. A. Lemke, eds.), Part A, pp. 73–80. Springer-Verlag,Berlin.
Fuller, M. S., and Jaworski, A. (1987). “Zoosporic Fungi in Teaching and Research.” SoutheasternPub., Athens, GA.
Gargas, A., Depriest, P. T., Grube, M., and Tehler, A. (1995). Multiple origins of lichen symbioses infungi suggested by SSU rDNA phylogeny. Science 268, 1492–1495.
Garrett, S. D. (1963). “Soil Fungi and Soil Fertility.” Pergamon, Oxford, UK.Gerdemann, J. W., and Trappe, J. M. (1974). The Endogonaceae in the Pacific Northwest. Mycol.
Mem. 5, 1–76.Gilbertson, R. L., and Ryvarden, L. (1986–1987). “North American Polypores,” Vols. 1 and 2.
Fungiflora, Oslo.Hale, M. E. (1983). “The Biology of Lichens.” 3rd ed. Arnold, London.Hibbett, D. S., and Thorn, R. G. (2001). Homobasidiomycetes. In “The Mycota,” Vol. VII,
“Systematics and Evolution” (D. J. McLaughlin, E. G. McLaughlin, and P. A. Lemke, eds.), Part B,pp. 121–168. Springer-Verlag, Berlin.
Hoffmann, L. (1989). Algae of terrestrial habitats. Bot. Rev. 55, 77–105.Holliday, P. (1989). “A Dictionary of Plant Pathology.” Cambridge Univ. Press, Cambridge, UK.
References and Suggested Reading 159
Ch06-P546807.qxd 11/20/06 2:13 PM Page 159
James, T. Y., Kauuf, F., Schoch, C. L., Matheny, P. B., Hofstetter, V., Cox, C. J., Celio, G., Gueidan, C.,Fraker, E., Miadlikowska, J., Lubsch, H. T., Rauhut, A., Reeb, V., Arnold, A. E., Amtoft, A.,Stajich, J. E., Hosaka, K., Sung, G. H., Johnson, D., O'Rourke, B., Crockett, M., Biner, M., Curtis, J. M., Slot, J. C., Wang, Z., Wilson, A. W., Schuessler, A., Longcore, E., O'Donnell, K.,Mozley-Standridge, S., Porter, D., Letcher, P. M., Powell, M. J., Taylor, J. W., White, M. M.,Griffith, G. W., Davies, D. R., Humber, R. A., Morton, J. B., Sugiyama, J., Rossman, A. Y., Rogers, J. D., Pfister, D. H., Hewitt, D., Hansen, K., Hambleton, S., Shoemaker, R. A., Kohlmeyer, J.,Volkmann-Kohlmeyer, B., Spotts, R. A., Serdani, M., Crous, P. W., Hughes, K. W., Matsuura, K.,Langer, E., Langer, G., Untereiner, W. A., Lucking, R., Budel, B., Geiser, D. M., Aptroot, A.,Diederich, P., Schmitt, I., Schulz, M., Yahr, R., Hibbett, D. S., Lutzoni, F., McLaughlin, D. J.,Spatafora, J. W., and Vilgalys, R. (2006). Reconstructing the early evolution of Fungi using a six-gene phylogeny. Nature 443, 818–822.
John, D. M., Whitton, B. A., and Brook, A. J. (2002). “The Freshwater Algal Flora of the British Isles:an Identification Guide to Freshwater and Terrestrial Algae.” Cambridge Univ. Press, Cambridge,UK.
Jongmans, A. G., van Breeman, N., Lundstrom, U., van Hees, P. A. W., Finlay, R. D., Srinivasan, M.,Unestam, T., Giesler, R., Melkerud, P. A., and Olsson, M. (1997). Rock-eating fungi. Nature 389,682–683.
Jülich, W., and Stalpers, J. A. (1980). “The Resupinate Non-poroid Aphyllophorales of the TemperateNorthern Hemisphere.” North-Holland, Amsterdam.
Karling, J. S. (1977). “Chytridiomycetarum Iconographia.” J. Cramer, Vaduz, Liechtenstein.Kirk, P. M., Cannon, P. F., David, J. C., and Stalpers, J. (2001). “Dictionary of the Fungi.” 9th ed. CAB
Int., Wallingford, UK.Klich, M. A. (2002). “Identification of Common Aspergillus Species.” Centraalbureau voor
Schimmelcultures, Utrecht.Kurtzman, C. P., and Fell, J. W., eds. (1998). “The Yeasts: a Taxonomic Study.” 4th ed., Elsevier,
Amsterdam.Kurtzman, C. P., and Sugiyama, J. (2001). Ascomycetous yeasts and yeastlike taxa. In “The Mycota,”
Vol. VII, “Systematics and Evolution” (D. J. McLaughlin, E. G. McLaughlin, and P. A. Lemke,eds.), Part A, pp. 179–200. Springer-Verlag, Berlin.
Lachance, M. A., and Starmer, W. T. (1998). Ecology and yeasts. In “The Yeasts, a Taxonomy Study.”4th ed. (C. P. Kurtzman and J. W. Fell, eds.), pp. 21–30. Elsevier, Amsterdam.
Levesque, C. A., and de Cock, A. W. (2004). Molecular phylogeny and taxonomy of the genus.Pythium. Mycol. Res. 108, 1363–1383.
Ling, H. U., and Tyler, P. A. (2000). Australian freshwater algae (exclusive of diatoms). Bibl. Phycol.105, 1–643.
Lutzoni, F., Kauff, F., Cox, C. J., McLaughlin, D. J., Celio, G., Dentinger, B., Padamsee, M., Hibbett,D. S., James, T. Y., Baloch, E., Grube, M., Reeb, V., Hofstetter, V., Schoch, C., Arnold, A. E.,Miadlikowska, J., Spatafora, J., Johnson, D., Hambleton, S., Crockett, M., Shoemaker, R., Sung, G.-H.,Luecking, R., Lumbsch, T., O’Donnell, K., Binder, M., Diederich, P., Ertz, D., Gueidan, C.,Hansen, K., Harris, R. C., Hosaka, K., Lim, Y.-W., Matheny, B., Nishida, H., Pfister, D., Rogers, J.,Rossman, A. Y., Schmitt, I., Sipman, H., Stone, J., Sugiyama, J., Yahr, R., Vilgalys, R. (2004).Assembling the fungal tree of life: progress, classification and evolution of subcellular traits. Am.J. Bot. 91, 1446–1480.
Lynch, M. D. J., and Thorn, R. G. (2006). Diversity of Basidiomycetes in Michigan agricultural soils.Appl. Environ. Microbiol. 72 (11) (in press).
Maggi, O., Persiani, A. M., Casado, M. A., and Pineda, F. D. (2006). Effects of elevation, slope posi-tion and livestock exclusion on microfungi isolated from soils of Mediterranean grasslands.Mycologia 97, 984–995.
Martin, F. N. (1992). Pythium. In “Methods for Research on Soilborne Phytopathogenic Fungi”(L. L. Singleton, J. D. Mihail, and C. M. Rush, eds.), pp. 39–49. APS Press, St. Paul.
Martin, G. W., and Alexopoulos, C. J. (1969). “The Myxomycetes.” Univ. of Iowa Press, Iowa City.
160 Chapter 6 Fungi and Eukaryotic Algae
Ch06-P546807.qxd 11/20/06 2:13 PM Page 160

McLaughlin, D. J., and McLaughlin, E. G. (2001). Preface. In “The Mycota,” Vol. VII, “Systematicsand Evolution” (D. J. McLaughlin, E. G. McLaughlin, and P. A. Lemke, eds.), Part A, pp. xi–xiv.Springer-Verlag, Berlin.
Mendoza, L., Taylor, J. W., and Ajello, L. (2002). The class Mesomycetozoea: a heterogeneous groupof microorganisms at the animal–fungal boundary. Annu. Rev. Microbiol. 56, 315–344.
Metting, B. (1981). The systematics and ecology of soil algae. Bot. Rev. 47, 195–312.Moncalvo, J. -M., Vilgalys, R., Redhead, S. A., Johnson, J. E., James, T. Y., Aime, M. C., Hofstetter, V.,
Verduin, S. J. W., Larsson, E., Baroni, T. J., Thorn, R. G., Jacobsson, S., Clemencon, H., andMiller, O. K. Jr. (2002). One hundred and seventeen clades of agarics. Mol. Phylogenet. Evol. 23,357–400.
Morton, J. B., and Benny, G. L. (1990). Revised classification of arbuscular mycorrhizal fungi(Zygomycetes): a new order, Glomales, two new suborders, Glomineae and Gigasporineae, andtwo new families, Acaulosporaceae and Gigasporaceae, with an emendation of Glomaceae.Mycotaxon 37, 471–491.
Moser, M. (1983). “Keys to Agarics and Boleti: Polyporales, Boletales, Agaricales, Russulales.” RogerPhillips, London.
Mueller, G. M., Bills, G. F., and M. S., Foster, eds. (2004). “Biodiversity of Fungi: Inventory andMonitoring Methods.” Elsevier, Amsterdam.
Nash, T. H., ed. (1996). “Lichen Biology.” Cambridge Univ. Press, New York.O’Donnell, K. L. (1979). “Zygomycetes in Culture.” Department of Botany, Univ. of Georgia,
Athens.Palmer, J. D., Soltis, D. E., and Chase, M. W. (2004). The plant tree of life: an overview and some
points of view. Am. J. Bot. 91, 1437–1445.Pitt, J. I. (1979). “The Genus Penicillium and Its Teleomorphic States Eupenicillium and
Talaromyces.” Academic Press, London.Pugh, G. J. F. (1974). Terrestrial fungi. In “Biology of Plant Litter Decomposition” (C. H. Dickinson,
and G. J. F. Pugh, eds.), Vol. 2, pp. 303–336. Academic Press, London.Raper, K. B. (1984). “The Dictyostelids.” Princeton Univ. Press, Princeton, NJ.Rayner, A. D. M., and Boddy, L. (1988). “Fungal Decomposition of Wood: Its Biology and Ecology.”
Wiley, Chichester.Rillig, M. C. (2004). Arbuscular mycorrhizae, glomalin, and soil aggregation. Can. J. Soil Sci. 84,
355–363.Roberts, P. (1999). “Rhizoctonia-Forming Fungi: a Taxonomic Guide.” Royal Botanic Gardens, Kew, UK.Schadt, C. W., Martin, A. P., Lipson, D. A., and Schmidt, S. K. (2003). Seasonal dynamics of previ-
ously unknown fungal lineages in tundra soils. Science 301, 1359–1361.Schuessler, A., Schwarzott, D., and Walker, C. (2001). A new fungal phylum, the Glomeromycota:
phylogeny and evolution. Mycol. Res. 105, 1413–1421.Seifert, K. A., and Gams, W. (2001). The taxonomy of anamorphic fungi. In “The Mycota,” Vol. VII,
“Systematics and Evolution” (D. J. McLaughlin, E. G. McLaughlin, and P. A. Lemke, eds.), Part A,pp. 307–348. Springer-Verlag, Berlin.
Smith, S. E., and Read, D. J. (1997). “Mycorrhizal Symbiosis.” 2nd ed. Academic Press, San Diego.Sparrow, F. K. (1960). “Aquatic Phycomycetes.” Univ. of Michigan Press, Ann Arbor.Stalpers, J. A. (1993). “The Aphyllophoraceous Fungi,” I, “Keys to the Species of the Thelephorales.”
Centraalbureau voor Schimmelcultures, Baarn, The Netherlands.Stalpers, J. A. (1996). “The Aphyllophoraceous Fungi,” II, “Keys to the Species of the Hericiales.”
Centraalbureau voor Schimmelcultures, Baarn, The Netherlands.States, J. S., and Christensen, M. (2001). Fungi associated with biological soil crusts in desert grass-
lands of Utah and Wyoming. Mycologia 93, 432–439.Stephenson, S. L., and Stempen, H. (1994). “Myxomycetes: a Handbook of Slime Molds.” Timber
Press, Portland, OR.Swofford, D. L. (2002). “PAUP*: Phylogenetic Analysis Using Parsimony (*and Other Methods).”
Version 4. Sinauer, Sunderland, MA.
References and suggested reading 161
Ch06-P546807.qxd 11/20/06 2:13 PM Page 161
Tainter, F. H. (1996). “Principles of Forest Pathology.” Wiley, New York.Thorn, R. G. (2002). Soil fungi: nature’s nutritional network. In “Encyclopedia of Environmental
Microbiology” (G. Bitton, ed.), pp. 2910–2918. Wiley, New York.Thorn, R. G., Reddy, C. A., Harris, D., and Paul, E. A. (1996). Isolation of saprophytic basidiomycetes
from soil. Appl. Environ. Microbiol. 62, 4288–4292.Vandenkoornhuyse, P., Baldauf, S. L., Leyval, C., Straczek, J., and Young, J. P. W. (2002). Extensive
fungal diversity in plant roots. Science 295, 2051.Venter, J. C., Remington, K., Heidelberg, J. F., Halpern, A. A., Rusch, D., Eisen, J. A., Wu, D., Paulsen, I.,
Nelson, K. E., Nelson, W., Fouts, D. E., Levy, S., Knap, A. H., Lomas, M. W., Nealson, K., White, O.,Peterson, J., Hoffman, J., Parsons, R., Baden-Tillson, H., Pfannkoch, C., Rogers, Y.-H., and Smith, H. O. (2004). Environmental genome shotgun sequencing of the Sargasso Sea. Science 304,66–74.
von Arx, J. A. (1981). “The Genera of Fungi Sporulating in Pure Culture.” J. Cramer, Lehre.Warcup, J. H. 1950. The soil plate method for isolation of fungi from soil. Nature 166,
117–118.Wardle, D. A. (2002). “Communities and Ecosystems: Linking the Aboveground and Belowground
Components.” Princeton Univ. Press, Princeton, NJ.Wehr, J. D., and Sheath, R. G. (2003). “Freshwater Algae of North America: Ecology and
Classification.” Academic Press, New York.West, N. E. (1990). Structure and function of microphytic soil crusts in wildland ecosystems of arid to
semi-arid regions. Adv. Ecol. Res. 20, 179–223.Wright, S. F., and Upadhyaya, A. (1998). A survey of soils for aggregate stability and glomalin, a
glycoprotein produced by hyphae of arbuscular mycorrhizal fungi. Plant Soil 198, 97–107.Zackrisson, O., DeLuca, T. H., Nilsson, M.-C., Sellstedt, A., and Berglund, L. M. (2004). Nitrogen fix-
ation increases with successional age in boreal forests. Ecology 85, 3327–3334.
162 Chapter 6 Fungi and Eukaryotic Algae
Ch06-P546807.qxd 11/20/06 2:13 PM Page 162
7FAUNA: THE ENGINE FOR
MICROBIAL ACTIVITY
AND TRANSPORT
David C. Coleman
Diana H. Wall
Introduction
The Microfauna
Rotifera
Nematoda
Microarthropods
Enchytraeids
Macrofauna
Summary
References
INTRODUCTION
Animals, another group of major heterotrophs in soil systems, can be viewedas facilitators of bacterial and fungal activity and diversity in soils. They exist infood webs containing several trophic levels. Some are herbivores, since they feeddirectly on roots of living plants, but most subsist upon dead plant matter (sapro-phytes), or living microbes associated with it, or a combination of the two. Stillothers are carnivores, parasites, or top predators. Analyses of food webs in the soilhave emphasized numbers of the various organisms and their trophic resources.The structure of these food webs is complex, with many “missing links” poorlydescribed or as yet unknown (Walter et al., 1991; Scheu and Setälä, 2002).
163
Ch07-P546807.qxd 11/18/06 6:40 PM Page 163

164 Chapter 7 Fauna: the Engine for Microbial Activity and Transport
Animal members of the soil biota are numerous and diverse and include repre-sentatives of all terrestrial phyla. Many groups of species are not described taxonomically, and details of their natural history and biology are unknown. Forthe microarthropods only about 10% of populations have been explored and per-haps 10% of species described (André et al., 2002). We feel protection of biodi-versity in ecosystems clearly must include the rich pool of soil species. This isbecause data for some of these species individually and collectively indicate tightconnections to biodiversity aboveground, major roles in ecosystem processes, andprovision of ecosystem benefits for human well-being (Wardle et al., 2004; Wallet al., 2005; Wall, 2004).
When research focuses at the level of the soil ecosystem two things arerequired: the cooperation of multiple disciplines (soil scientists, zoologists, andmicrobiologists) and the lumping of animals into functional groups. These groupsare often taxonomic, but species with similar biologies and morphologies aregrouped together for purposes of integration (Coleman et al., 1993; Hendrix et al.,1986; Hunt et al., 1987).
The soil fauna also may be characterized by the degree of presence in the soil ormicrohabitat utilization by different life forms. There are transient species, exem-plified by the ladybird beetle, which hibernates in the soil but otherwise lives in theplant stratum. Gnats (Diptera) are temporary residents of the soil, since the adultstages live aboveground. Their eggs are laid in the soil and their larvae feed ondecomposing organic debris. In some soil situations dipteran larvae are importantscavengers. Cutworms are temporary soil residents, whose larvae feed on seedlingsby night. Nematodes that parasitize insects and beetles spend part of their lifecycle in soil. Periodic residents spend their life histories belowground, with adults,such as the velvet mites, emerging to reproduce. The soil food webs are linked toaboveground systems, making trophic analyses much more complicated than ineither subsystem alone (Wardle et al., 2004). Even permanent residents of the soilmay be adapted to life at various depths in the soil.
Among the microarthropods, collembolans are examples of permanent soil res-idents. The morphology of collembolans reveals their adaptations for life in dif-ferent soil strata. Species that dwell on the soil surface or in the litter layer may belarge, pigmented, and equipped with long antennae and a well-developed jumpingapparatus (furcula). Collembolans living within mineral soil tend to be smaller,with unpigmented, elongate bodies, and possess a much reduced furcula.
A generalized classification by length illustrates a commonly used device forseparating the soil fauna into size classes: microfauna, mesofauna, macrofauna,and megafauna. This classification encompasses the range from smallest to largest,i.e., from ca. 1–2 µm for the microflagellates to �2 m for giant Australian earth-worms. Body width of the fauna is related to their microhabitats (Fig. 7.1). Themicrofauna (protozoa, rotifers, tardigrades, small nematodes) inhabit water films.The mesofauna inhabit existing air-filled pore spaces and are largely restricted toexisting spaces. The macrofauna have the ability to create their own spaces,through their burrowing activities, and like the megafauna, can have large influences
Ch07-P546807.qxd 11/18/06 6:40 PM Page 164

on gross soil structure (Lavelle and Spain, 2001; van Vliet and Hendrix, 2003).Methods for studying these faunal groups are mostly size-dependent. The macro-fauna may be sampled as field collections, often by hand sorting, and populationsof individuals are usually measured.
There is considerable gradation in the classification based on body width. Thesmaller mesofauna exhibit characteristics of the microfauna, and so forth. The vastrange of body sizes among the soil fauna emphasizes their effects on soil processesat a range of spatial scales. Three levels of participation have been suggested(Lavelle et al., 1995; Wardle, 2002). “Ecosystem engineers,” such as earthworms,termites, or ants, alter the physical structure of the soil itself, influencing rates ofnutrient and energy flow. “Litter transformers,” the microarthropods, fragmentdecomposing litter and improve its availability to microbes. “Micro-food webs”include the microbial groups and their direct microfaunal predators (nematodes
Introduction 165
Bacteria
MESOFAUNA MACRO- AND MEGAFAUNAMICROFLORA AND MICROFAUNA
FungiNematoda
ProtozoaRotifera
AcariCollembola
ProturaDiplura
SymphylaEnchytraeidlae
ChelonethiIsoptera
OpilionesIsopoda
AmphipodaChilopodaDiplopoda
Megadrili (earthworms)
AraneidaColeoptera
Mollusca
2 mm 20 mm
mmµm
Body width
100 µm
1 2 4 8 64 128 256 512 1024 2 4 8 16 32 6416 32
FIGURE 7.1 Size classification of organisms in decomposer food webs by body width (Swift et al., 1979).
Ch07-P546807.qxd 11/18/06 6:40 PM Page 165
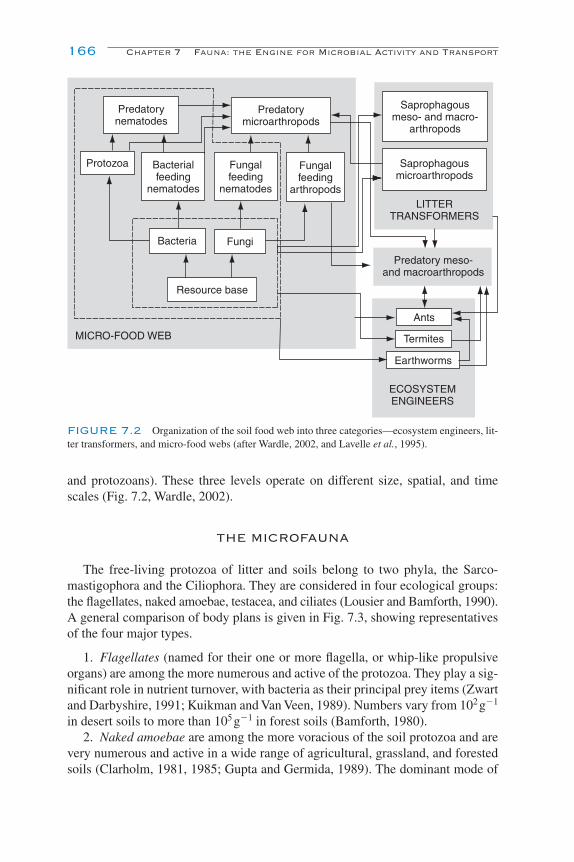
and protozoans). These three levels operate on different size, spatial, and timescales (Fig. 7.2, Wardle, 2002).
THE MICROFAUNA
The free-living protozoa of litter and soils belong to two phyla, the Sarco-mastigophora and the Ciliophora. They are considered in four ecological groups:the flagellates, naked amoebae, testacea, and ciliates (Lousier and Bamforth, 1990).A general comparison of body plans is given in Fig. 7.3, showing representativesof the four major types.
1. Flagellates (named for their one or more flagella, or whip-like propulsiveorgans) are among the more numerous and active of the protozoa. They play a sig-nificant role in nutrient turnover, with bacteria as their principal prey items (Zwartand Darbyshire, 1991; Kuikman and Van Veen, 1989). Numbers vary from 102g�1
in desert soils to more than 105g�1 in forest soils (Bamforth, 1980).2. Naked amoebae are among the more voracious of the soil protozoa and are
very numerous and active in a wide range of agricultural, grassland, and forestedsoils (Clarholm, 1981, 1985; Gupta and Germida, 1989). The dominant mode of
166 Chapter 7 Fauna: the Engine for Microbial Activity and Transport
Predatorynematodes
Predatorymicroarthropods
Protozoa Bacterialfeeding
nematodes
Fungalfeeding
nematodes
Fungalfeeding
arthropods
Saprophagous meso- and macro-
arthropods
Saprophagousmicroarthropods
LITTERTRANSFORMERS
Predatory meso-and macroarthropods
Ants
Termites
Earthworms
ECOSYSTEMENGINEERS
Bacteria Fungi
Resource base
MICRO-FOOD WEB
FIGURE 7.2 Organization of the soil food web into three categories—ecosystem engineers, lit-ter transformers, and micro-food webs (after Wardle, 2002, and Lavelle et al., 1995).
Ch07-P546807.qxd 11/18/06 6:40 PM Page 166

feeding for the amoebae, as for the larger forms such as Ciliates, is phagotrophic(engulfing), with bacteria, fungi, algae, and other fine particulate organic matterbeing the majority of the ingested material. They are highly plastic, in terms oftheir ability to explore very small cavities or pores in soil aggregates and to feed uponbacteria that would otherwise be considered inaccessible to predators (Foster andDormaar, 1991).
3. Testate amoebae: Compared with the naked amoebae, testate amoebae are often less numerous, except in moist, forested systems. They are more easilyenumerated by a range of direct filtration and staining procedures. Lousier andParkinson (1984) noted a mean annual biomass of 0.07 g dry wt m�2 of aspen
The Microfauna 167
Cirri
FrontalAdoral zone ofmembranelles
Undulating membrane
Contractile vacuole
MacronucleusVentral
Anal ortransverse
Caudal
Marginal
Contractile vacuole
Nucleus
TestEpipod
Test pore
Contractile vacuole
Food vacuole
Pseudopod
Pseudostome
Nucleus
(a)
(b)(c)
(d)
FIGURE 7.3 Morphology of four types of soil Protozoa: (a) flagellate (Bodo); (b) naked amoeba(Naegleria); (c) testacean (Hyalosphenia); (d) ciliate (Oxytricha) (from Lousier and Bamforth, 1990).
Ch07-P546807.qxd 11/18/06 6:40 PM Page 167
woodland soil, much smaller than the average annual mass for bacteria or fungi,23 and 40 g dry wt m�2, respectively. However, the testacean annual secondaryproduction (new tissue per year) was 21 g dry wt m�2, which they calculated to beessentially the entire average standing crop of the bacteria in that site.
4. Ciliates have unusual life cycles and complex reproductive patterns andtend to be restricted to very moist or seasonally moist habitats. Their numbers arelower than those of other groups, with a general range of 10 to 500 g�1 of litter/soil.Ciliates can be very active in entering soil cavities and pores and exploiting bac-terial food sources (Foissner, 1987). Ciliates, like other protozoa, have resistant orencysted forms and emerge when conditions, such as food availability, are favorablefor growth and reproduction. Ciliates, flagellates, and naked and testate amoebaereproduce asexually by fission. The flagellates, naked amoebae, and testacea repro-duce by syngamy, or fusion of two cells. For the ciliates, sexual reproduction occursby conjugation, with the micronucleus undergoing meiosis in two individuals and thetwo cells joining at the region of the cytostome and exchanging haploid “gametic”nuclei. Each ciliate cell then undergoes fission to produce individuals, which aregenetically different from the preconjugant parents (Lousier and Bamforth, 1990).
METHODS FOR EXTRACTING ANDCOUNTING PROTOZOA
Researchers have favored the culture technique (Singh, 1946), in which smallquantities of soil or soil suspensions from dilution series are incubated in smallwells, inoculated with a single species of bacteria as a food source. Based on thepresence or absence in each well, one can calculate the overall population density(“most probable number”). Adl (2003), Couteaux (1972), and Foissner (1987) favorthe direct count approach, in which one examines soil samples, in water, to see theorganisms present in the subsample. The advantage of direct counting is that it ispossible to observe the organisms immediately present and not rely on the palata-bility of the bacterium as substrate in the series of wells in the culture technique. Thedisadvantage of the direct count method is that one usually employs only 5–30 mgof soil, so as not to be overwhelmed with total numbers (Foissner, 1987). This dis-criminates against some of the more rare forms of testaceans or ciliates that mayhave a significant impact on an ecosystem process, if they happen to be very large.
The culture technique attempts to differentiate between active (trophozoiteforms) and inactive (cystic) forms by treatment of replicate samples with 2%hydrochloric acid overnight. The acid kills off the trophozoite forms. After a washin dilute NaCl, the counting continues. This assumes that all cysts will excyst afterthis drastic process, an assumption not always met.
IMPACTS OF PROTOZOA ON ECOSYSTEM FUNCTION
Several investigators have noted the obvious parallel between the protozoan–microbe interaction in water films in soil and on root surfaces and in open-wateraquatic systems (Stout, 1963; Clarholm, 1994; Coleman, 1994). The “microbial
168 Chapter 7 Fauna: the Engine for Microbial Activity and Transport
Ch07-P546807.qxd 11/18/06 6:40 PM Page 168
loop,” defined by Pomeroy (1974) as the rapid recycling of nutrients by protozoangrazers, is a powerful conceptual tool. In a fashion similar to that occurring inaquatic systems, rapidly feeding protozoa may consume one or more standingcrops of bacteria in soil every year (Clarholm, 1985; Coleman, 1994). This ten-dency is particularly marked in the rhizosphere, which provides a ready foodsource for microbial prey.
The population dynamics of bacteria, naked amoebae, and flagellates were fol-lowed in the humus layer of a pine forest in Sweden (Clarholm, 1994). Bacteriaand flagellates began increasing in number immediately after a rainfall event androse to a peak after 2–3 days. Naked amoebae rose more slowly, peaked after 4–5days, and then tracked the bacterial decrease downward. The flagellates followeda pattern similar to that of the naked amoebae. Further information on protozoanfeeding activities and their impacts on other organisms and ecosystem function isgiven in Darbyshire (1994). Bonkowski et al. (2000) suggest that protozoa, andthe bacteria they feed upon in the rhizosphere, produce plant growth-promotingcompounds that stimulate plant growth above and beyond the amounts of N min-eralized in the rhizosphere. Protozoa and other microfauna are quite sensitive toenvironmental insults, and changes in the distribution and activities are diagnosticof changes in soil health (Gupta and Yeates, 1997).
DISTRIBUTION OF PROTOZOA IN SOIL PROFILES
Although protozoa are distributed principally in the upper few centimeters of asoil profile, they are also found at depth, over 200 m deep in groundwater envi-ronments (Sinclair and Ghiorse, 1989). Small (2–3 µm cell size) microflagellatesdecreased 10-fold in numbers during movement through 1 m in a sandy matrixunder a trickling-filter facility (in dilute sewage), compared to a 10-fold reductionin bacterial transport over a 10-m distance (Harvey et al., 1995).
ROTIFERA
These small fauna are often found only when a significant proportion of waterfilms exist in soils. While they may not be listed in major compendia of soil biota(Dindal, 1990), they are a genuine, albeit secondary, component of the soil fauna(Wallwork, 1976). Rotifers exist in bagged leaf litter and in even more extremeenvironments, such as the soils of the Antarctic Dry Valleys (Treonis et al., 1999).
More than 90% of soil rotifers are in the Order Bdelloidea, or worm-likerotifers. In these creeping forms, the suctorial rostral cilia and the adhesive discare employed for locomotion (Donner, 1966). Rotifers, like tardigrades and nema-todes, can enter a desiccated resistant state (anhyrobiosis) at any stage in their lifecycle, in response to environmental stress. When the stress is removed, they rehy-drate and become active. Additional life history features of interest include theconstruction of shells from a body secretion, which may have particles of debris
Rotifera 169
Ch07-P546807.qxd 11/18/06 6:40 PM Page 169

and/or fecal material adhering to it. Some rotifers will use the empty shells ofTestacea, the thecate amoebae, to survive. The Bdelloidea are vortex feeders, cre-ating currents of water that conduct food particles, such as unicellular algae orbacteria, to the mouth for ingestion. The importance of these organisms is largelyunknown, although they may reach numbers exceeding 105 m�2 in moist, organicsoils (Wallwork, 1970). Rotifers are extracted from soil samples and enumeratedusing methods similar to those used for nematodes (see the following).
NEMATODA
The Phylum Nematoda contains nematodes or roundworms, which are amongthe most numerous and diverse of the multicellular organisms found in anyecosystem. It has been estimated that four of every five animals on earth are nema-todes (Bongers and Ferris, 1999). As with the protozoa, rotifers, and tardigrades,nematodes live in water films or water-filled pore spaces in soils. Nematodes havea very early phylogenetic origin among the Eukarya (Blaxter et al., 1998), but aswith other invertebrate groups, the fossil record is fragmentary. Nematodes aremost closely related to the Rotifers, Gastrotrichs, and Nematophora. They areconsidered to be triploblastic pseudocoelomates (three body layers: ectoderm,mesoderm, and endoderm).
The overall body shape is cylindrical, tapering at the ends (Fig. 7.4). Nematodebody plans are characterized by a “tube within a tube” (alimentary tract/the bodywall). They have a complete digestive system or an alimentary tract, consisting ofa stoma or stylet, pharynx (or esophagus), and intestine and rectum, which opensexternally at the anus. The reproductive structures are complex, and sexes are gen-erally dimorphic. Some species are parthenogenetic, producing only females.Nematodes are highly diverse but can be identified to order or family by examin-ing specific morphological characteristics under high magnification (�100�)using compound microscopes.
NEMATODE FEEDING HABITS
Nematodes feed on a wide range of foods. A general trophic grouping is: bacter-ial feeders, fungal feeders, plant feeders, and predators and omnivores. For the pur-poses of our overview, one can use anterior (stomal or mouth) structures todifferentiate feeding, or trophic, groups (Fig. 7.5) (Yeates and Coleman, 1982;Yeates et al., 1993). Plant-feeding nematodes have a hollow stylet that pierces cellwalls of higher plants. Some species are facultative, feeding occasionally on plantroots or root hairs. Others, more recognized for their damage to agricultural cropsand forest plantations, are obligate parasites of plants and feed internally or exter-nally on plant roots. The effect nematodes have on plants is generally species-specific and can include alterations in root architecture, water transport, and plantmetabolism, or all of these. Recently, the sedentary obligate parasites were found to
170 Chapter 7 Fauna: the Engine for Microbial Activity and Transport
Ch07-P546807.qxd 11/18/06 6:40 PM Page 170

have multiple parasitic genes. Some of the genes for secretion of endogluconases(cellulases) appear to play direct roles in the nematode parasitic process. Theirenzyme products modify plant cell walls and cell metabolism (Davis et al., 2000,2004). These genes have greatest similarity to microbial genes for cellulases, but
Nematoda 171
St
C
NE.p
B.bI
T
V
Va
Sp
Sp
R.g
RA
SCI
B
G.P.
G
O
P
V.d
U
130.u
E
FIGURE 7.4 Structures of a Rhabditis sp., a secernentean microbotrophic nematode of theorder Rhabditida. (Left) Female. (Right) Male. St, stoma; C, corpus area of the pharynx; N, nerve ring;E.p, excretory pore; B.b, basal bulb of the pharynx; I, intestine; T, testis; E, eggs; V, vulva; Va, vagina;U, uterus; O, ovary; Sp, sperm; V.d, vas deferens; R.g, rectal glands; R, rectum; A, anus; S, spicules;G, gubernaculum; B, bursa; P, phasmids; G.P., genital papillae; Cl, cloaca (courtesy of Proceedings ofthe Helminthological Society of Washington) (from Poinar, 1983).
Ch07-P546807.qxd 11/18/06 6:40 PM Page 171
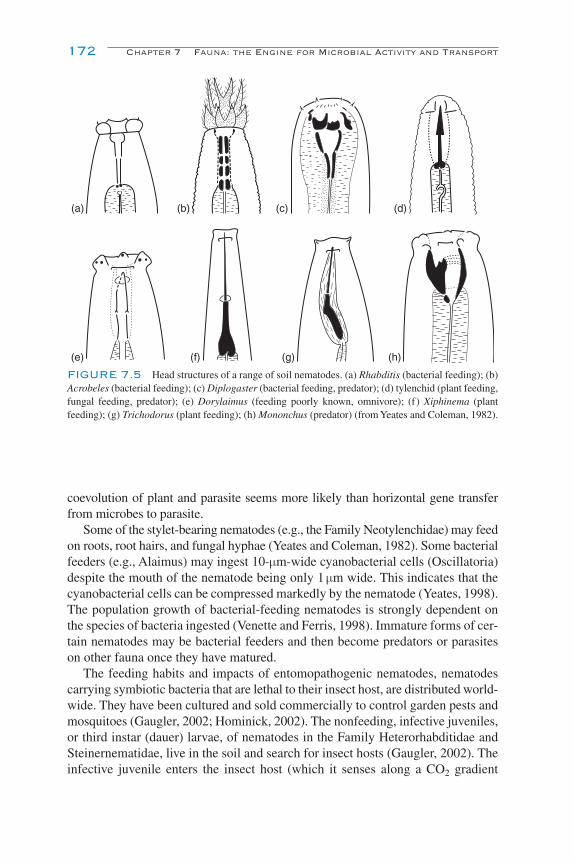
coevolution of plant and parasite seems more likely than horizontal gene transferfrom microbes to parasite.
Some of the stylet-bearing nematodes (e.g., the Family Neotylenchidae) may feedon roots, root hairs, and fungal hyphae (Yeates and Coleman, 1982). Some bacterialfeeders (e.g., Alaimus) may ingest 10-µm-wide cyanobacterial cells (Oscillatoria)despite the mouth of the nematode being only 1 µm wide. This indicates that thecyanobacterial cells can be compressed markedly by the nematode (Yeates, 1998).The population growth of bacterial-feeding nematodes is strongly dependent onthe species of bacteria ingested (Venette and Ferris, 1998). Immature forms of cer-tain nematodes may be bacterial feeders and then become predators or parasiteson other fauna once they have matured.
The feeding habits and impacts of entomopathogenic nematodes, nematodescarrying symbiotic bacteria that are lethal to their insect host, are distributed world-wide. They have been cultured and sold commercially to control garden pests andmosquitoes (Gaugler, 2002; Hominick, 2002). The nonfeeding, infective juveniles,or third instar (dauer) larvae, of nematodes in the Family Heterorhabditidae andSteinernematidae, live in the soil and search for insect hosts (Gaugler, 2002). Theinfective juvenile enters the insect host (which it senses along a CO2 gradient
172 Chapter 7 Fauna: the Engine for Microbial Activity and Transport
(a)
(e) (f) (g) (h)
(b) (c) (d)
FIGURE 7.5 Head structures of a range of soil nematodes. (a) Rhabditis (bacterial feeding); (b)Acrobeles (bacterial feeding); (c) Diplogaster (bacterial feeding, predator); (d) tylenchid (plant feeding,fungal feeding, predator); (e) Dorylaimus (feeding poorly known, omnivore); (f) Xiphinema (plantfeeding); (g) Trichodorus (plant feeding); (h) Mononchus (predator) (from Yeates and Coleman, 1982).
Ch07-P546807.qxd 11/18/06 6:40 PM Page 172

(Strong et al., 1996)) through a body opening, punctures a membrane, and releasesits symbiotic bacteria, which kill the host within 24–48 h. A rapidly growing bac-terial population then digests the insect cadaver and provides food for the expo-nentially growing adult nematode population. The symbiotic bacteria produceantibiotics and other antimicrobial substances that protect the host cadaver andadult nematodes inside from invasion by alien bacteria and fungi from the soil(Strong et al., 1999). When the cadaver is exhausted of resources, reproductionshunts to infective juveniles, which break through the host integument and dis-perse into the soil. As many as 410,000 Heterorhabditis hepialus infective juve-niles are produced in a large ghost moth caterpillar.
Ruess et al. (2002) have traced the fatty acids specific to fungi to the body tis-sues of fungal-feeding nematodes. This technique shows considerable promise formore detailed biochemical delineation of food sources of specific feeding groupsof nematodes. Fungal-feeding nematodes are known to feed preferentially on dif-ferent fungal species (Mankau and Mankau, 1963), including mycorrhizas andyeasts. Because of the wide range of feeding types and the fact that they seem toreflect ages of the systems in which they occur, i.e., annual vs perennial crops, oldfields and pastures, and more mature forests, nematodes have been used as indi-cators of overall ecological condition (Bongers, 1990; Freckman and Ettema,1993; Ferris et al., 2001). This is a growing area of research in soil ecology, onein which the intersection between community analysis and ecosystem functioncould prove to be quite fruitful.
ZONES OF NEMATODE ACTIVITY IN SOIL
The soil fauna may be concentrated in the rhizosphere. Ingham et al. (1985) foundup to 70% of the bacterial- and fungal-feeding nematodes in the 4–5% of the total soilthat was rhizosphere, namely the amount of soil 1–2 mm from the root surface (therhizoplane). Griffiths and Caul (1993) found that nematodes migrated to packets ofdecomposing grass residues, where there were considerable amounts of labile sub-strates and microbial food sources. They concluded that nematodes seek out these“hot spots” of concentrated organic matter and that protozoa do not. Nematodes alsomove and occur vertically in soils. In deserts, nematodes are associated with plantroots to depths of 15 m as are mites and other biota (Freckman and Virginia, 1989).
Wallace (1959) noted that movement of nematodes was optimum when soilpores were half drained of free water. Using pressure plates, Demeure et al. (1979)showed that nematode movement was found to cease and anhydrobiosis to beginwhen the water film thickness surrounding a soil particle is between 6 and 9monomolecular layers of water. This is equivalent to soil pores being completelydrained of free water. However, a nematode species from desert habitats tolerateddrier soils with less pore water than a species from a tropical habitat. Elliott et al.(1980) noted that the limiting factor for nematode survival often hinges on the avail-ability and size of soil pore necks, which enable passage between soil pores. Yeateset al. (2002) measured the movements, growth, and survival of three genera of
Nematoda 173
Ch07-P546807.qxd 11/18/06 6:40 PM Page 173

bacterial-feeding soil nematodes in undisturbed soil cores maintained on soilpressure plates. Interestingly, the nematodes showed significant reproductioneven when diameters of water-filled pores were approximately 1 µm.
NEMATODE EXTRACTION TECHNIQUES
Nematodes may be extracted by a variety of techniques, either active or passive innature. The principal advantage of the oldest, active method, namely the Baermannfunnel method, is that it is simple, requiring no sophisticated equipment or electric-ity. It is based on the animal’s movement and gravity. Samples are placed on coarsetissue paper, on a coarse mesh screen, and then placed in the cone of a funnel andimmersed in water. After crawling through the moist soil and filter paper, the nema-todes fall down into the neck of the funnel and fall to the bottom of the funnel stem,which is closed off with a screw clamp on a rubber hose. At the conclusion of theextraction (typically 48 h), the nematodes in solution are drawn off into a vial andkept preserved for examination later. Drawbacks to the technique are that only activenematodes are extracted. It also allows dormant nematodes to become active andeggs to hatch into juveniles and be extracted, yielding a slightly inflated estimate ofthe true, “active” population at a given time. For more accuracy in determination ofpopulations, the passive, or flotation, techniques are generally preferred. Passivemethods include filtration, or decanting and sieving, and flotation/centrifugation(Coleman et al., 1999) to remove the nematodes from the soil suspension. Elutriationmethods can be employed for handling larger quantities of soil, usually greater than500 g, or to recover large amounts and a greater diversity of nematodes. Elutriationmethods rely on fast mixing of soil and water in funnels. Semiautomatic elutriators,which enhance the number of soil samples to be extracted, are available (Byrd et al.,1976). There are many references comparing methods, including McSorley andFrederick (2004), Schouten and Arp (1991), and Whitehead and Hemming (1965).Anhydrobiotic nematodes can be extracted in a high-molarity solution such assucrose, which prevents the nematodes from rehydrating (Freckman et al., 1977).
MICROARTHROPODS
Large numbers of the microarthropod group (mainly mites and collembolans) arefound in most types of soils. A square meter of forest floor may contain hundreds ofthousands of individuals representing thousands of species. Microarthropods have asignificant impact on the decomposition processes in the forest floor and are impor-tant reservoirs of biodiversity in forest ecosystems. Many microarthropods feed onfungi and nematodes, thereby linking the microfauna and microbes with the meso-fauna. Microarthropods in turn are prey for macroarthropods, such as spiders, bee-tles, ants, and centipedes, thus bridging a connection to the macrofauna.
In the size spectrum of soil fauna, the mites and collembolans are mesofauna.Members of the microarthropod group are unique, not so much because of their
174 Chapter 7 Fauna: the Engine for Microbial Activity and Transport
Ch07-P546807.qxd 11/18/06 6:40 PM Page 174
body size as because of the methods used for sampling them. Small pieces of habi-tat (soil, leaf litter, or similar materials) are collected and the microarthropodsextracted from them in the laboratory. Most of the methods used for microarthropodextraction are either variations of the Tullgren funnel, which uses heat to desiccatethe sample and force the arthropods into a collection fluid, or flotation in solventsor saturated sugar solutions followed by filtration (Edwards, 1991). Generally, flota-tion methods work well in low organic, sandy soils, while Tullgren funnels per-form best in soils with high organic matter content. Flotation procedures are morelaborious than the Tullgren extraction. Better estimates of species number may beachieved using fewer, larger samples. However, valid comparisons of microarthro-pod abundance in different habitats may be obtained even if extraction efficiencies,though unknown, are similar.
Microarthropod densities vary during seasons within and between differentecosystems. Generally, temperate forest floors with large organic matter content sup-port high numbers (33–88 � 103 m�2) and coniferous forests may have in excess of 130 � 103 m�2. Tropical forests, where the organic layer is thin, contain fewer microarthropods (Seastedt, 1984; Coleman et al., 2004). Tillage, fire, and pesticide applications typically reduce populations, but recovery may be rapid andmicroarthropod groups respond differently. Soil mites usually outnumber collem-bolans but the latter become more abundant in some situations. In the springtime, for-est leaf litter may develop large populations of “snow fleas” (Hypogastrura nivicolaand related species). Among the mites themselves, the oribatids usually dominatebut the delicate Prostigmata may develop large populations in cultivated soils witha surface crust of algae. Estimation of species richness is a difficult problem formost soil fauna, including ants.
ENCHYTRAEIDS
In addition to earthworms (discussed under Macrofauna), another importantfamily of terrestrial Oligochaeta is the Enchytraeidae. This group of small, unpig-mented worms, also known as “potworms,” is classified within the “microdrile”oligochaetes and consists of some 600 species in 28 genera. Species from 19 ofthese genera are found in soil, the remainder occur primarily in marine and fresh-water habitats (Dash, 1990; van Vliet, 2000). The Enchytraeidae are thought to havearisen in cool temperate climates where they are commonly found in moist forestsoils rich in organic matter. Various species of enchytraeids are now distributedglobally from subarctic to tropical regions.
Keys to the common genera were presented by Dash (1990). Identification ofenchytraeid species is difficult, but genera may be identified by observing internalstructures through the transparent body wall of specimens mounted on slides.
The Enchytraeidae are typically 10–20 mm in length and are anatomically similarto the earthworms, except for the miniaturization and rearrangement of featuresoverall. They possess setae (with the exception of one genus), and a clitellum in
Enchytraeids 175
Ch07-P546807.qxd 11/18/06 6:40 PM Page 175

segments XII and XIII, which contains both male and female pores. Sexual repro-duction in enchytraeids is hermaphroditic and functions similarly to that in earth-worms. Cocoons may contain one or more eggs, and maturation of newly hatchedindividuals ranges from 65 to 120 days depending on species and environmentaltemperature (van Vliet, 2000). Enchytraeids also display asexual strategies ofparthenogenesis and fragmentation, which enhance their probability of coloniza-tion of new habitats (Dosza-Farkas, 1996).
Enchytraeids ingest both mineral and organic particles in the soil, althoughtypically of smaller size ranges than those of earthworms. Numerous investigatorshave noted that finely divided plant materials, often enriched with fungal hyphaeand bacteria, are a principal portion of the diet of enchytraeids. Microbial tissuesare probably the fraction most readily assimilated because enchytraeids lack thegut enzymes to digest more recalcitrant soil organic matter (van Vliet, 2000).Didden (1990, 1993) suggested that enchytraeids feed predominantly upon fungi,at least in arable soils, and classified a community as 80% microbivorous and 20%saprovorous. As with several other members of the soil mesofauna, the mixedmicrobiota that occur on decaying organic matter, either litter or roots, are proba-bly an important part of the diet of these creatures. The remaining portions oforganic matter, after the processes of ingestion, digestion, and assimilation, becomepart of the slow-turnover pool of soil organic matter. Zachariae (1964) suggested thatso-called “collembolan soil,” said to be dominated by collembolan feces (particularlylow-pH mor soils), were actually formed by Enchytraeidae. Mycorrhizal hyphaehave been found in the fecal pellets of enchytraeids from pine litter (Fig. 7.6,
176 Chapter 7 Fauna: the Engine for Microbial Activity and Transport
1 mm
FIGURE 7.6 Two enchytraeid worms tunneling through a pine needle, indicated by arrows(fecal pellets have been deposited on the outside). F1 layer (modified from Ponge, 1991).
Ch07-P546807.qxd 11/18/06 6:40 PM Page 176
Ponge, 1991). Enchytraeids probably consume and further process larger fecalpellets and castings of soil macrofauna, such as collembolans and earthworms(Zachariae, 1964; Rusek, 1985). Thus it is clear that fecal contributions to soil bysoil-dwelling invertebrates provide feedback mechanisms affecting the abundanceand diversity of other soil-dwelling animals.
Enchytraeid densities range from �1000 individuals m�2, in intensively culti-vated agricultural soil in Japan, to �140,000 individuals m�2 in a peat moor in theUnited Kingdom. In a subtropical climate, enchytraeid densities of 4000 to 14,000individuals m�2 occur in agricultural plots in the Piedmont of Georgia, USA,whereas higher densities (20,000 to 30,000 individuals m�2) are found in surfacelayers of deciduous forest soils in the southern Appalachian mountains of NorthCarolina (van Vliet et al., 1995). Although enchytraeid densities are typicallyhighest in acid soils with high organic content, Didden (1995) found no statisticalrelationship over a broad range of data between average enchytraeid density andseveral environmental variables such as annual precipitation, annual temperature,or soil pH. It appears that local variability may be at least as great as variation ona wider scale, as enchytraeid densities show both spatial and seasonal variations.Vertical distributions of enchytraeids in soil are related to organic matter horizons.Up to 90% of populations may occur in the upper layers in forest and no-tillageagricultural soils, but densities may be higher in the Ah horizon of grasslands(Davidson et al., 2002). Seasonal trends in enchytraeid population densitiesappear to be associated with moisture and temperature regimes (van Vliet, 2000).
Enchytraeids have been shown to have significant effects on soil organic matterdynamics and on soil physical structure. Litter decomposition and nutrient mineral-ization are influenced primarily by interactions with soil microbial communities.Enchytraeid feeding on fungi and bacteria can increase microbial metabolic activityand turnover, accelerate the release of nutrients from microbial biomass, and changespecies composition of the microbial community through selective grazing. However,Wolters (1988) found that enchytraeids decreased mineralization rates by reducingmicrobial populations and possibly by occluding organic substrates in their feces.The influence of enchytraeids on soil organic matter dynamics is therefore the netresult of both enhancement and inhibition of microbial activity depending on soiltexture and population densities of the animals (Wolters, 1988; van Vliet, 2000).
Enchytraeids affect soil structure by producing fecal pellets, which, depending onthe animal size distribution, may enhance aggregate stability in the 600- to 1000-µmaggregate size fraction. In forest floors, these pellets are composed mainly of finehumus particles, but in mineral soils, organic matter and mineral particles may bemixed into fecal pellets with a loamy texture. Davidson et al. (2002) estimated thatenchytraeid fecal pellets constituted nearly 30% of the volume of the Ah horizon ina Scottish grassland soil (Fig. 7.7). Encapsulation or occlusion of organic matterinto these structures may reduce decomposition rates. Burrowing activities ofenchytraeids have not been well studied, but there is evidence that soil porosity andpore continuity can increase in proportion to enchytraeid body size (Rusek, 1985;Didden, 1990).
Enchytraeids 177
Ch07-P546807.qxd 11/18/06 6:40 PM Page 177

Enchytraeids are typically sampled in the field using cylindrical soil cores of5- to 7.5-cm diameter. Large numbers of replicates may be needed for a sufficientsampling due to the clustered distribution of enchytraeid populations (van Vliet,2000). Extractions are often done with a wet-funnel technique, similar to theBaermann funnel extraction used for nematodes. In this case, soil cores are sub-merged in water on the funnel and exposed for several hours to a heat and lightsource from above; enchytraeids move downward and are collected in the waterbelow. Van Vliet (2000) provides a comparison of modifications of this technique.
MACROFAUNA
MACROARTHROPODS
Larger insects, spiders, myriapods, and others are considered together underthe appellation “macroarthropods.” Typical body lengths range from about 10 mmto as much as 15 cm for centipedes (Shelley, 2002). The group includes a mixtureof various arthropod classes, orders, and families. Like the microarthropods, themacroarthropods are defined more by the methods used to sample them ratherthan by measurements of body size. Large soil cores (10-cm diameter or greater)may be appropriate for euedaphic (dwelling within the soil) species. Arthropodscan be recovered from them using flotation techniques (Edwards, 1991). Handsorting of soils and litter is more time consuming, but yields better estimates ofpopulation size. In rare instances, capture–mark–recapture methods have beenused to estimate population sizes of selected macroarthropod species, but theassumptions for this procedure are violated more often than not (Southwood,1978). Pitfall traps have been widely used to sample litter- and surface-dwellingmacroarthropods. This method collects arthropods that fall into cups filled with
178 Chapter 7 Fauna: the Engine for Microbial Activity and Transport
(a) (b)
FIGURE 7.7 Thin-section micrographs of fecal pellets in a grassland soil. (a) Derived fromenchytraeids (scale bar, 0.5 mm). (b) Derived from earthworms (scale bar, 1.0 mm) (from Davidson et al.,2002).
Ch07-P546807.qxd 11/18/06 6:40 PM Page 178

preservative. Absolute population estimates are difficult to obtain with pitfall trapsbut the method yields comparative estimates when used with caution.
Many of the macroarthropods are members of the group termed “cryptozoa,” agroup consisting of animals that dwell beneath stones or logs, under bark, or incracks and crevices. Cryptozoans typically emerge at night to forage, and some areattracted to artificial lights. The cryptozoa fauna is poorly defined but remainsuseful for identifying a group of invertebrate species with similar patterns of habi-tat utilization.
IMPORTANCE OF THE MACROARTHROPODS
The macroarthropods are a significant component of soil ecosystems and their food webs. Macroarthropods differ from their smaller relatives in that theymay have direct effects on soil structure. Termites and ants in particular are impor-tant movers of soil, depositing parts of lower strata on top of the litter layer (Fig. 7.8). Emerging nymphal stages of cicadas may be numerous enough to dis-turb soil structure. Larval stages of soil-dwelling scarabaeid beetles sometimeschurn the soil in grasslands. These and other macroarthropods are part of thegroup that has been termed ecological engineers (Jones et al., 1994). Somemacroarthropods participate in both above- and belowground parts of terrestrialecosystems. Many macroarthropods are transient or temporary soil residents andthus form a connection between food chains in the “green world” of foliage andthe “brown world” of the soil. Caterpillars descending to the soil to pupate ormigrating armyworm caterpillars are prey to ground-dwelling spiders and beetles.Macroarthropods may have a major influence on the microarthropod portion ofbelowground food webs. Collembola, among other microarthropods, are impor-tant food items for spiders, especially immature stadia, thus providing a macro- tomicroconnection. Other macroarthropods, such as cicadas, emerging from soilmay serve as prey for some vertebrate animals (Lloyd and Dybas, 1966), thus pro-viding a link to the larger megafauna. Among the macroarthropods, there aremany litter-feeding species, such as the millipedes, that are important consumersof leaf, grass, and wood litter. These arthropods have major influences on thedecomposition process, thereby impacting rates of nutrient cycling in soil sys-tems. The decomposition of vertebrate carrion is largely accomplished throughthe actions of soil-dwelling insects (Payne, 1965).
OLIGOCHAETA (EARTHWORMS)
Earthworms are the most familiar and, with respect to soil processes, often themost important of the soil fauna. The importance of earthworms arises from theirinfluence on soil structure (e.g., aggregate or crumb formation, soil pore forma-tion) and on the breakdown of organic matter applied to soil (e.g., fragmentation,burial and mixing of plant residues). The modern era of earthworm research beganwith Darwin’s (1881) book, “The Formation of Vegetable Mould through the
Macrofauna 179
Ch07-P546807.qxd 11/18/06 6:40 PM Page 179
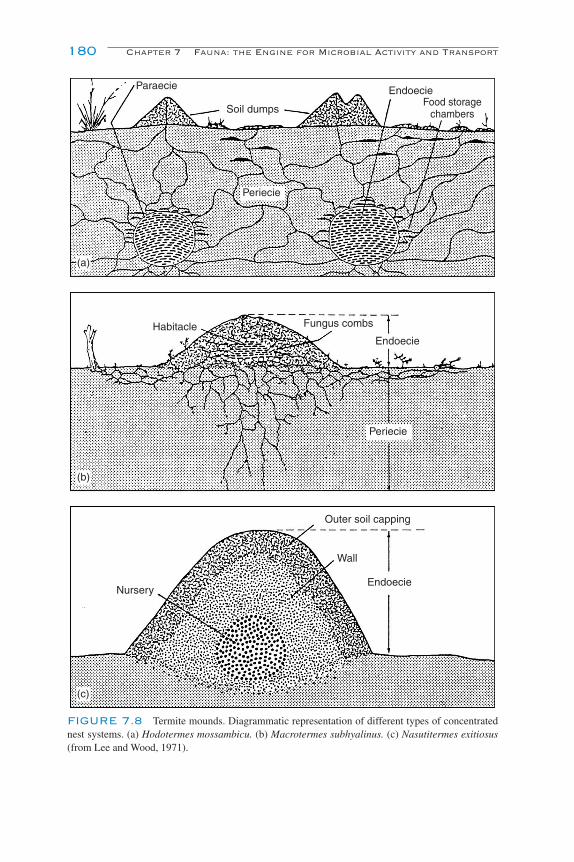
180 Chapter 7 Fauna: the Engine for Microbial Activity and Transport
Paraecie
Habitacle Fungus combs
Endoecie
Periecie
Outer soil capping
Wall
EndoecieNursery
Periecie
Soil dumps
EndoecieFood storage
chambers
(a)
(b)
(c)
FIGURE 7.8 Termite mounds. Diagrammatic representation of different types of concentratednest systems. (a) Hodotermes mossambicu. (b) Macrotermes subhyalinus. (c) Nasutitermes exitiosus(from Lee and Wood, 1971).
Ch07-P546807.qxd 11/18/06 6:40 PM Page 180
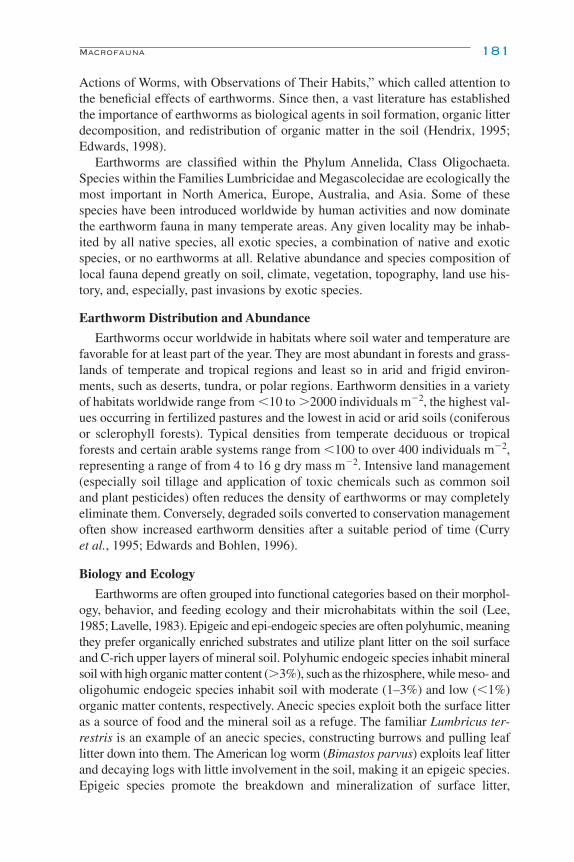
Actions of Worms, with Observations of Their Habits,” which called attention tothe beneficial effects of earthworms. Since then, a vast literature has establishedthe importance of earthworms as biological agents in soil formation, organic litterdecomposition, and redistribution of organic matter in the soil (Hendrix, 1995;Edwards, 1998).
Earthworms are classified within the Phylum Annelida, Class Oligochaeta.Species within the Families Lumbricidae and Megascolecidae are ecologically themost important in North America, Europe, Australia, and Asia. Some of thesespecies have been introduced worldwide by human activities and now dominatethe earthworm fauna in many temperate areas. Any given locality may be inhab-ited by all native species, all exotic species, a combination of native and exoticspecies, or no earthworms at all. Relative abundance and species composition oflocal fauna depend greatly on soil, climate, vegetation, topography, land use his-tory, and, especially, past invasions by exotic species.
Earthworm Distribution and Abundance
Earthworms occur worldwide in habitats where soil water and temperature arefavorable for at least part of the year. They are most abundant in forests and grass-lands of temperate and tropical regions and least so in arid and frigid environ-ments, such as deserts, tundra, or polar regions. Earthworm densities in a varietyof habitats worldwide range from �10 to �2000 individuals m�2, the highest val-ues occurring in fertilized pastures and the lowest in acid or arid soils (coniferousor sclerophyll forests). Typical densities from temperate deciduous or tropicalforests and certain arable systems range from �100 to over 400 individuals m�2,representing a range of from 4 to 16 g dry mass m�2. Intensive land management(especially soil tillage and application of toxic chemicals such as common soiland plant pesticides) often reduces the density of earthworms or may completelyeliminate them. Conversely, degraded soils converted to conservation managementoften show increased earthworm densities after a suitable period of time (Curry et al., 1995; Edwards and Bohlen, 1996).
Biology and Ecology
Earthworms are often grouped into functional categories based on their morphol-ogy, behavior, and feeding ecology and their microhabitats within the soil (Lee,1985; Lavelle, 1983). Epigeic and epi-endogeic species are often polyhumic, meaningthey prefer organically enriched substrates and utilize plant litter on the soil surfaceand C-rich upper layers of mineral soil. Polyhumic endogeic species inhabit mineralsoil with high organic matter content (�3%), such as the rhizosphere, while meso- andoligohumic endogeic species inhabit soil with moderate (1–3%) and low (�1%)organic matter contents, respectively. Anecic species exploit both the surface litteras a source of food and the mineral soil as a refuge. The familiar Lumbricus ter-restris is an example of an anecic species, constructing burrows and pulling leaflitter down into them. The American log worm (Bimastos parvus) exploits leaf litterand decaying logs with little involvement in the soil, making it an epigeic species.Epigeic species promote the breakdown and mineralization of surface litter,
Macrofauna 181
Ch07-P546807.qxd 11/18/06 6:40 PM Page 181

whereas anecic species incorporate organic matter deeper into the soil profile andfacilitate aeration and water infiltration through their formation of burrows.
Influence on Soil Processes
Earthworms, as ecosystem engineers (Lavelle et al., 1998), have pronouncedeffects on soil structure as a consequence of their burrowing activities as well astheir ingestion of soil and production of castings (Lavelle and Spain, 2001; vanVliet and Hendrix, 2003). Casts are produced after earthworms ingest mineral soilor particulate organic matter, mix and enrich them with organic secretions in thegut, and then deposit the material as a slurry lining their burrows or as discretefecal pellets. Excretion of fecal pellets can occur within or upon the soil, depend-ing on earthworm species. Turnover rates of soil through earthworm casting rangefrom 40–70 t ha�1 y�1 in temperate grasslands (Bouché, 1983) to 500–1000t ha�1 y�1 in tropical savannas (Lavelle et al., 1992).
While in the earthworm gut, casts are colonized by microbes that begin tobreak down soil organic matter. As casts are deposited in the soil, microbial colo-nization and activity continue until readily decomposable compounds are depleted.Mechanisms of cast stabilization include organic bonding of particles by polymerssecreted by earthworms and microbes, mechanical stabilization by plant fibersand fungal hyphae, and stabilization due to wetting and drying cycles and age-hardening effects (Tomlin et al., 1995). Mineralization of organic matter in earth-worm casts and burrow linings produces zones of nutrient enrichment comparedto bulk soil. These zones are referred to as the “drilosphere” and are often sites ofenhanced activity of plant roots and other soil biota (Lavelle et al., 1998). Plantgrowth-promoting substances have also been suggested as constituents of earthwormcasts. Many earthworm castings from commercial vermicomposting operationsare sold commercially as soil amendments to improve soil physical properties andenhance plant growth (Edwards, 1998).
Earthworm burrowing in soil creates macropores of various sizes, depths, andorientations, depending on species and soil type. Burrows range from about 1to �10 mm in diameter and constitute among the largest of soil pores. Continuousmacropores resulting from earthworm burrowing may enhance water infiltrationby functioning as by-pass flow pathways through soils. These pores may or maynot be important in solute transport, depending on soil water content, the nature ofthe solute, and chemical exchange properties of the burrow linings (Edwards andShipitalo, 1998).
Earthworm Effects on Ecosystems
Despite the many beneficial effects of earthworms on soil processes, someaspects of earthworm activities may be undesirable (Lavelle et al., 1998, Parmeleeet al., 1998). Detrimental effects include: (1) removing and burying of surfaceresidues that would otherwise protect soil surfaces from erosion; (2) producingfresh casts that increase erosion and surface sealing; (3) increasing compactionof surface soils by decreasing soil organic matter, particularly for some tropical
182 Chapter 7 Fauna: the Engine for Microbial Activity and Transport
Ch07-P546807.qxd 11/18/06 6:40 PM Page 182
species; (4) riddling irrigation ditches, making them leaky; (5) increasing lossesof soil N through leaching and denitrification; and (6) increasing soil C loss throughenhanced microbial respiration. Earthworms may transmit pathogens, either aspassive carriers or as intermediate hosts, raising concerns that some earthwormspecies could be a vector for the spread of certain plant and animal diseases. Thenet result of positive and negative effects of earthworms, or any other soil biota,determines whether they have detrimental impacts on ecosystems (Lavelle et al.,1998). An effect, such as mixing of O and A horizons, may be considered benefi-cial in one setting (e.g., urban gardens) and detrimental in another (e.g., nativeforests). Edwards (1998) provides a review of the potential benefits of earthwormsin agriculture, waste management, and land remediation.
FORMICIDAE (ANTS)
Formicidae, the ants, are probably the most significant family of soil insects,due to the very large influence they have on soil structure. Ants are numerous,diverse, and widely distributed from arctic to tropical ecosystems. Ant communi-ties contain many species, even in desert areas (Whitford, 2000), and local speciesdiversity is especially large in tropical areas. Populations of ants are equallynumerous. About one-third of the animal biomass of the Amazonian rain forest iscomposed entirely of ants and termites, with each hectare containing in excess of8 million ants and 1 million termites (Hölldobler and Wilson, 1990). Furthermore,ants are social insects, living in colonies with several castes.
Ants have a large impact on their ecosystems. They are major predators ofsmall invertebrates. Their activities reduce the abundance of other predators suchas spiders and carabid beetles (Wilson, 1987). Ants are ecosystem engineers,moving large volumes of soil, as much as earthworms do (Hölldobler and Wilson,1990). Ant influences on soil structure are particularly important in deserts, whereearthworm densities are low. Given the large diversity of ants, identification tospecies is problematic for any but the taxonomist skilled in ants. Wheeler andWheeler (1990) offer keys to subfamilies and genera of the Nearctic ant fauna.
TERMITIDAE (TERMITES)
Along with earthworms and ants, termites are the third major earth-movinggroup of invertebrates. Termites are social insects with a well-developed castesystem. Through their ability to digest wood they have become economic pests ofmajor importance in some regions of the world (Lee and Wood, 1971; Bignell andEggleton, 2000). Termites are highly successful, constituting up to 75% of theinsect biomass and 10% of all terrestrial animal biomass in the tropics (Wilson,1992; Bignell, 2000). While termites are mainly tropical in distribution, theyoccur in temperate zones as well. Termites have been called the tropical analogsof earthworms, since they reach a large abundance in the tropics and process largeamounts of litter. Termites in the primitive families, such as Kalotermitidae, possess
Macrofauna 183
Ch07-P546807.qxd 11/18/06 6:40 PM Page 183
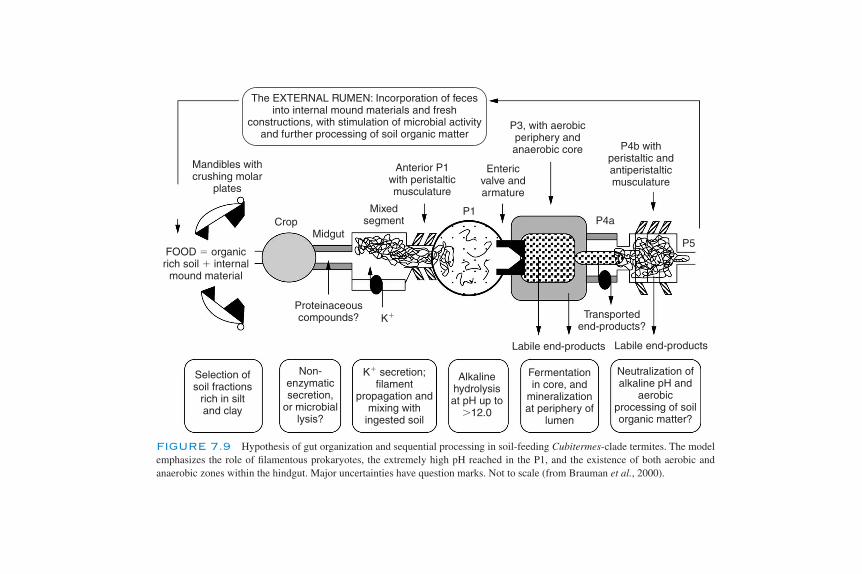
The EXTERNAL RUMEN: Incorporation of fecesinto internal mound materials and fresh
constructions, with stimulation of microbial activityand further processing of soil organic matter
Selection ofsoil fractions
rich in siltand clay
Non-enzymaticsecretion,
or microbiallysis?
K� secretion;filament
propagation andmixing with
ingested soil
Alkalinehydrolysisat pH up to
�12.0
Fermentationin core, and
mineralizationat periphery of
lumen
Neutralization ofalkaline pH and
aerobicprocessing of soilorganic matter?
Mandibles withcrushing molar
plates
FOOD � organicrich soil � internal
mound material
Crop
Proteinaceouscompounds?
Labile end-products Labile end-products
Transportedend-products?
Midgut
Mixedsegment
Anterior P1with peristalticmusculature
Entericvalve andarmature
P3, with aerobicperiphery andanaerobic core P4b with
peristaltic andantiperistalticmusculature
P1
P5
P4a
K�
FIGURE 7.9 Hypothesis of gut organization and sequential processing in soil-feeding Cubitermes-clade termites. The modelemphasizes the role of filamentous prokaryotes, the extremely high pH reached in the P1, and the existence of both aerobic andanaerobic zones within the hindgut. Major uncertainties have question marks. Not to scale (from Brauman et al., 2000).
Ch07-P546807.qxd 11/18/06 6:40 PM Page 184

a gut flora of protozoans, which enables them to digest cellulose. Their normalfood is wood that has come into contact with soil. Most species of termites constructrunways of soil and some are builders of spectacular mounds. Members of thephylogenetically advanced family Termitidae do not have protozoan symbionts, butpossess a formidable array of microbial symbionts (bacteria and fungi) that enablethem to process and digest the humified organic matter in tropical soils (Breznak,1984; Bignell, 1984; Pearce, 1997). A generalized sequence of events in a typicalTermitinae soil-feeder gut is illustrated in Fig. 7.9 (Brauman et al., 2000).
Three nutritional categories include wood-feeding species, plant- and humus-feeding species, and fungus growers. The last group lacks intestinal symbiontsand depends upon cultured fungus for nutrition. Termites have an abundance ofunique microbes living in their guts. One recent study of bacterial microbiota inthe gut of the wood-feeding termite Reticulitermes speratus found 268 phylotypesof bacteria (16S rRNA genes, amplified by PCR), including 100 clostridial, 61spirochaetal, and 31 Bacteroides-related phylotypes (Hongoh et al., 2003). Morethan 90% of the phylotypes were found for the first time, but we do not know ifthey are active and participating in wood decay. Other phylotypes were mono-phyletic clusters with sequences recovered from the gut of other termite species.Cellulose digestion in termites, which was once considered to be solely due to theactivities of fungi and protists and occasionally bacteria, has now been demon-strated to be endogenous to termites. Endogenous cellulose-degrading enzymesoccur in the midguts of two species of higher termites in the genus Nasutitermesand in the Macrotermitinae (which cultivate basidiomycete fungi in elaboratelyconstructed gardens) as well (Bignell, 2000).
In contrast to the C-degradation situation, only prokaryotes are capable of pro-ducing nitrogenase to fix N2. This process occurs in the organic-matter rich,microaerophilic milieu of termite guts. Some termite genera have bacteria that fix relatively small amounts of N, but others, including Mastotermes andNasutitermes, fix from 0.7 to �21 �g N g�1 fresh wt day�1. This equals 20–61 µg Nper colony per day, which would double the N content if N2 fixation was the solesource of N and the rate per termite remained constant (N content of termitesassumed to be 11% on a dry weight basis) (Breznak, 2000). For an extensiveexposition of the role of termites in the dynamics of soil organic matter and nutri-ent cycling in ecosystems worldwide, refer to Bignell and Eggleton (2000).
SUMMARY
Soil fauna may be considered as very efficient means to assist microbes in col-onizing and extending their reach into the horizons of soils worldwide. Their rolesas colonizers, comminutors, and engineers within soils have been emphasized, butnew technologies and global environmental issues are yielding new questionsabout how soil fauna contribute to the long-term sustainability of soils. Thedemand for taxonomic specialists for all groups of soil biota is increasing as we
Summary 185
Ch07-P546807.qxd 11/18/06 6:40 PM Page 185

currently recognize that molecular information alone is insufficient for many stud-ies. Stable isotope technologies are revealing that some soil faunal species hith-erto thought to be within one trophic group are not, thus leading to research aboutthe structure and resilience of soil food webs. Information on the biogeography ofsoil fauna, their latitudinal gradient patterns, their relationship to aboveground hotspots and to land management strategies, as well as their taxonomic status andnatural history, will be critical for understanding how microbes and soil fauna willinteract and respond to multiple global changes (Wall et al., 2001). For example,soil invertebrates can be invasive species, which, depending on the species, canaffect soil carbon sequestration, soil fertility, and plant and animal health andresult in economic and ecosystem change. For further reading on the roles offauna in soil processes, see Coleman et al. (2004) and Wall (2004).
REFERENCES
Adl, S. M. (2003). “The Ecology of Soil Decomposition.” CAB International, Wallingford, UK.André, H. M., Ducarme, X., and Lebrun, P. (2002). Soil biodiversity: myth, reality or conning? Oikos 96,
3–24.Bamforth, S. S. (1980). Terrestrial protozoa. J. Protozool. 27, 33–36.Bignell, D. E. (1984). The arthropod gut as an environment for microorganisms. In
“Invertebrate–Microbial Interactions” (J. M. Anderson, A. D. M. Rayner, and D. W. H. Walton,eds.), pp. 205–227. Cambridge Univ. Press, Cambridge, UK.
Bignell, D. E. (2000). Introduction to symbiosis. In “Termites: Evolution, Sociality, Symbioses, Ecology”(T. Abe, D. E. Bignell, and M. Higashi, eds.), pp. 189–208. Kluwer Academic, Dordrecht.
Bignell, D. E., and Eggleton, P. (2000). Termites in ecosystems. In “Termites: Evolution, Sociality,Symbioses, Ecology” (T. Abe, D. E. Bignell, and M. Higashi, eds.), pp. 363–387. Kluwer Academic,Dordrecht.
Blaxter, M. L., De Ley, P., Garey, J. R., Liu, L. X., Scheldeman, P., Vierstraete, A., Vanfleteren, J. R.,Mackey, L. Y., Dorris, M., Frisse, L. M., Vida, J. T., and Thomas, W. K. (1998). A molecular evo-lutionary framework for the phylum Nematoda. Nature 392, 71–75.
Bongers, T. (1990). The maturity index: an ecological measure of environmental disturbance based onnematode species composition. Oecologia 83, 14–19.
Bongers, T., and Ferris, H. (1999). Nematode community structure as a bioindicator in environmentalmonitoring. Trends Ecol. Evol. 14, 224–228.
Bonkowski, M., Griffiths, B., and Scrimgeour, C. (2000). Substrate heterogeneity and microfauna in soilorganic “hotspots” as determinants of nitrogen capture and growth of ryegrass. Appl. Soil Ecol. 14,37–53.
Bouché, M. B. (1983). The establishment of earthworm communities. In “Earthworm Ecology fromDarwin to Vermiculture” (J. E. Satchell, ed.), pp. 431–448. Chapman & Hall, London.
Brauman, A., Bignell, D. E., and Tayasu, I. (2000). Soil-feeding termites: biology, microbial associa-tions and digestive mechanisms. In “Termites: Evolution, Sociality, Symbioses, Ecology” (T. Abe,D. E. Bignell, and M. Higashi, eds.), pp. 233–259. Kluwer Academic, Dordrecht.
Breznak, J. A. (1984). Biochemical aspects of symbiosis between termites and their intestinal micro-biota. In “Invertebrate–Microbial Interactions” (J. M. Anderson, A. D. M. Rayner, and D. W. H.Walton, eds.), pp. 173–203. Cambridge Univ. Press, Cambridge, UK.
Breznak, J. (2000). Ecology of prokaryotic microbes in the guts of wood- and litter-feeding termites.In “Termites: Evolution, Sociality, Symbioses, Ecology” (T. Abe, D. E. Bignell, and M. Higashi,eds.), pp. 209–231. Kluwer Academic, Dordrecht.
186 Chapter 7 Fauna: the Engine for Microbial Activity and Transport
Ch07-P546807.qxd 11/18/06 6:40 PM Page 186
Byrd, D. W. J., Barker, K. R., Ferris, H., Nusbaum, C. J., Griffin, W. E., Small, R. H., and Stone, C. A.(1976). Two semi-automatic elutriators for extracting nematodes and certain fungi from soil. J. Nematol. 8, 206–212.
Clarholm, M. (1981). Protozoan grazing of bacteria in soil—impact and importance. Microb. Ecol. 7,343–350.
Clarholm, M. (1985). Possible roles for roots, bacteria, protozoa and fungi in supplying nitrogen toplants. In “Ecological Interactions in Soil: Plants, Microbes and Animals” (A. H. Fitter, D. Atkinson, D. J. Read, and M. B. Usher, eds.), pp. 355–365. Blackwell, Oxford.
Clarholm, M. (1994). The microbial loop in soil. In “Beyond the Biomass” (K. Ritz, J. Dighton, andK. E. Giller, eds.), pp. 221–230. Wiley/Sayce, Chichester.
Coleman, D. C. (1994). The microbial loop concept as used in terrestrial soil ecology studies. Microb.Ecol. 28, 245–250.
Coleman, D. C., Hendrix, P. F., Beare, M. H., Cheng, W., and Crossley, D. A., Jr. (1993). Microbial andfaunal dynamics as they affect soil organic matter dynamics in subtropical Agroecosystems.In “Soil Biota and Nutrient Cycling Farming Systems” (M. G. Paoletti, W. Foissner, and D. C. Coleman, eds.), pp. 1–14. CRC Press, Boca Raton, FL.
Coleman, D. C., Blair, J. M., Elliott, E. T., and Wall, D. H. (1999). Soil invertebrates. In “Standard SoilMethods for Long-Term Ecological Research” (G. P. Robertson, D. C. Coleman, C. S. Bledsoe,and P. Sollins, eds.). Oxford Univ. Press, New York.
Coleman, D. C., Crossley, D. A., Jr., and Hendrix, P. F. (2004). “Fundamentals of Soil Ecology.” 2nded. Elsevier, San Diego.
Couteaux, M.-M. (1972). Distribution des thécamoebiens de la litiére et de l’humus de deux solsforestier d’humus brut. Pedobiologia 12, 237–243.
Curry, J. P., Byrne, D., and Boyle, K. E. (1995). The earthworm population of a winter cereal field andits effects on soil and nitrogen turnover. Biol. Fertil. Soils 19, 166–172.
Darbyshire, J. F., ed. (1994). “Soil Protozoa.” CAB International, Wallingford, UK.Darwin, C. (1881). “The Formation of Vegetable Mould, through the Action of Worms, with
Observations on Their Habits.” John Murray, London.Dash, M. C. (1990). Oligochaeta: Enchytraeidae. In “Soil Biology Guide” (D. L. Dindal, ed.), pp.
311–340. Wiley, New York.Davidson, D. A., Bruneau, P. M. C., Grieve, I. C., and Young, I. M. (2002). Impacts of fauna on an
upland grassland soil as determined by micromorphological analysis. Appl. Soil Ecol. 20, 133–143.Davis, E. L., Hussey, R. S., and Baum, T. J. (2004). Getting to the roots of parasitism. Trends Parasitol.
20, 134–141.Davis, E. L., Hussey, R. S., Baum, T. J., Bakker, J., Schots, A., Rosso, M., and Abad, P. (2000).
Nematode parasitism genes. Annu. Rev. Phytopathol. 38, 365–396.Demeure, Y., Freckman, D. W., and Van Gundy, S. D. (1979). Anhydrobiotic coiling of nematodes in
soil. Nematology 11, 189–195.Didden, W. A. M. (1990). Involvement of Enchytraeidae (Oligochaeta) in soil structure evolution in
agricultural fields. Biol. Fertil. Soils 9, 152–158.Didden, W. A. M. (1993). Ecology of Enchytraeidae. Pedobiologia 37, 2–29.Didden, W. A. M. (1995). The effect of nitrogen deposition on enchytraeid-mediated decomposition
and mobilization—a laboratory experiment. Acta Zool. Fennica 196, 60–64.Dindal, D. L. (ed.) (1990). “Soil Biology Guide.” Wiley, New York.Donner, J. (1966). “Rotifers.” Warne, London.Dósza-Farkas, K. (1996). Reproduction strategies in some enchytraeid species. In “Newsletter on
Enchytraeidae No. 5” (K. Dósza-Farkas, ed.), pp. 25–33. Eötvös Loránd Univ., Budapest.Edwards, C. A. (1991). The assessment of populations of soil-inhabiting invertebrates. Agric. Ecosyst.
Environ. 34, 145–176.Edwards, C. A. (1998). “Earthworm Ecology.” St. Lucie Press, Boca Raton, FL.Edwards, C. A., and Bohlen, P. J. (1996). “Earthworm Biology and Ecology.” 3rd ed. Chapman & Hall,
London.
References 187
Ch07-P546807.qxd 11/18/06 6:40 PM Page 187

Edwards, W. M., and Shipitalo, M. J. (1998). Consequences of earthworms in agricultural soils: aggre-gation and porosity. In “Earthworm Ecology” (C. A. Edwards, ed.), pp. 147–161. CRC Press, BocaRaton, FL.
Elliott, E. T., Anderson, R. V., Coleman, D. C., and Cole, C. V. (1980). Habitable pore space and micro-bial trophic interactions. Oikos 35, 327–335.
Ferris, H., Bongers, T., and de Goede, R. G. M. (2001). A framework for soil foodweb diagnostics:extension of the nematode faunal analysis concept. Appl. Soil Ecol. 18, 13–29.
Foissner, W. (1987). Soil protozoa: fundamental problems, ecological significance, adaptations in cil-iates and testaceans, bioindicators, and guide to the literature. Prog. Protistol. 2, 69–212.
Foster, R. C., and Dormaar, J. F. (1991). Bacteria-grazing amoebae in situ in the rhizosphere. Biol.Fertil. Soils 11, 83–87.
Freckman, D. W., and Ettema, C. H. (1993). Assessing nematode communities in agroecosystems ofvarying human intervention. Agric. Ecosyst. Environ. 45, 239–261.
Freckman, D. W., Kaplan, D. T., and van Gundy, S. D. (1977). A comparison of techniques for extrac-tion and study of anhydrobiotic nematodes from dry soils. J. Nematol. 9, 176–181.
Freckman, D. W., and Virginia, R. A. (1989). Plant-feeding nematodes in deep-rooting desert ecosys-tems. Ecology 70, 1665–1678.
Gaugler, R. ed. (2002). “Entomopathogenic Nematology.” CAB International, Wallingford, UK.Griffiths, B. S., and Caul, S. (1993). Migration of bacterial-feeding nematodes, but not protozoa, to
decomposing grass residues. Biol. Fertil. Soils 15, 201–207.Gupta, V. V. S. R., and Germida, J. J. (1989). Influence of bacterial–amoebal interactions on sulfur
transformations in soil. Soil Biol. Biochem. 21, 921–930.Gupta, V. V. S. R., and Yeates, G. W. (1997). Soil microfauna as bioindicators of soil health. In
“Biological Indicators of Soil Health” (C. Pankhurst, B. M. Doube, and V. V. S. R. Gupta, eds.), pp.201–233. CAB International, Wallingford, UK.
Harvey, R. W., Kinner, N. E., Bunn, A., MacDonald, D., and Metge, D. (1995). Transport behavior ofgroundwater protozoa and protozoan-sized micro-spheres in sandy aquifer sediments. Appl.Environ. Microbiol. 61, 209–271.
Hendrix, P. F., ed. (1995). “Earthworm Ecology and Biogeography in North America.” CRC Press,Boca Raton, FL.
Hendrix, P. F., Parmelee, R. W., Crossley, D. A., Jr., Coleman, D. C., Odum, E. P., and Groffman, P.(1986). Detritus food webs in conventional and no-tillage agroecosystems. Bioscience 36, 374–380.
Hölldobler, B., and Wilson, E. O. (1990). “The Ants.” Belknap Press, Harvard Univ., Cambridge, MA.Hominick, W. M. (2002). Biogeography. In “Entomopathogenic Nematology” (R. Gaugler, ed.), pp.
115–143. CAB International, Wallingford, UK.Hongoh, Y., Ohkuma, M., and Kudo, T. (2003). Molecular analysis of bacterial microbiota in the gut
of the termite Reticulitermes speratus (Isoptera; Rhinotermitidae). FEMS Microbiol. Ecol. 44,231–242.
Hunt, H. W., Coleman, D. C., Ingham, E. R., Ingham, R. E., Elliott, E. T., Moore, J. C., Rose, S. L.,Reid, C. P. P., and Morley, C. R. (1987). The detrital food web in a shortgrass prairie. Biol. Fertil.Soils 3, 57–68.
Ingham, R. E., Trofymow, J. A., Ingham, E. R., and Coleman, D. C. (1985). Interactions of bacteria,fungi, and their nematode grazers: effects on nutrient cycling and plant growth. Ecol. Monogr. 55,119–140.
Jones, C. G., Lawton, J. H., and Shachak, M. (1994). Organisms as ecosystem engineers. Oikos 69,373–386.
Kuikman, P., and van Veen, J. A. (1989). The impact of protozoa on the availability of bacterial nitro-gen to plants. Biol. Fertil. Soils 8, 13–18.
Lavelle, P. (1983). The structure of earthworm communities. In “Earthworm Ecology: from Darwin toVermiculture” (J. E. Satchell, ed.), pp. 449–466. Chapman & Hall, London.
Lavelle, P., Blanchart, E., and Martin, A. (1992). Impact of soil fauna on the properties of soils in thehumid tropics. In “Myths and Science of Soils of the Tropics” (R. Lal and P. Sanchez, eds.),pp. 157–185. Soil Sci. Soc. Am., Madison, WI.
188 Chapter 7 Fauna: the Engine for Microbial Activity and Transport
Ch07-P546807.qxd 11/18/06 6:40 PM Page 188

Lavelle, P., Lattaud, D. T., and Barois, I. (1995). Mutualism and biodiversity in soils. Plant Soil 170,23–33.
Lavelle, P., Pashanasi, B., Charpentier, F., Gilot, C., Rossi, J., Derouard, L., Andre, J., Ponge, J., andBernier, N. (1998). Influence of earthworms on soil organic matter dynamics, nutrient dynamicsand microbiological ecology. In “Earthworm Ecology” (C. A. Edwards, ed.), pp. 103–122. CRCPress, Boca Raton, FL.
Lavelle, P., and Spain, A. V. (2001). “Soil Ecology.” Kluwer Academic, Dordrecht.Lee, K. E. (1985). “Earthworms: Their Ecology and Relationships with Soils and Land Use.”
Academic Press, Sydney.Lee, K. E., and Wood, T. G. (1971). “Termites and Soils.” Academic Press, London/New York.Lloyd, M., and Dybas, H. S. (1966). The periodical cicada problem. I. Population ecology. Evolution
20, 133–149.Lousier, J. D., and Bamforth, S. S. (1990). Soil Protozoa. In “Soil Biology Guide” (D. L. Dindal, ed.),
pp. 97–136. Wiley, New York.Lousier, J. D., and Parkinson, J. (1984). Annual population dynamics and production ecology of
Testacea (Protozoa, Rhizopoda) in an aspen woodland soil. Soil Biol. Biochem. 16, 103–114.Mankau, R., and Mankau, S. K. (1963). The role of mycophagous nematodes in the soil. I. The rela-
tionships of Aphelenchus avenae to phytopathogenic soil fungi. In “Soil Organisms” (J. Doeksenand J. Vander Drift, eds.), pp. 271–280. North-Holland, Amsterdam.
McSorley, R., and Frederick, J. J. (2004). Effects of extraction method on perceived composition of thesoil nematode community. Appl. Soil Ecol. 27, 55–63.
Parmelee, R. W., Bohlen, P. J., and Blair, J. M. (1998). Earthworms and nutrient cycling processes:integrating across the ecological hierarchy. In “Earthworm Ecology” (C. Edwards, ed.), pp.123–143. St. Lucie Press, Boca Raton, FL.
Payne, J. A. (1965). A summer carrion study of the baby pig, Sus scrofa L. Ecology 46, 592–602.
Pearce, M. J. (1997). “Termites: Biology and Pest Management.” CAB International, Wallingford,UK.
Poinar, G. O., Jr. (1983). “The Natural History of Nematodes.” Prentice Hall International, EnglewoodCliffs, NJ.
Pomeroy, L. R. (1974). The ocean’s food web, a changing paradigm. Bioscience 24, 499–504.Ponge, J.-F. (1991). Food resources and diets of soil animals in a small area of Scots pine litter.
Geoderma 49, 33–62.Ruess, L., Häggblom, M. M., Zapata, E. J. G., and Dighton, J. (2002). Fatty acids of fungi and nema-
todes—possible biomarkers in the soil food chain? Soil Biol. Biochem. 34, 745–756.Rusek, J. (1985). Soil microstructures—contributions on specific soil organisms. Quaest. Entomol. 21,
497–514.Scheu, S., and Setälä, H. (2002). Multitrophic interactions in decomposer food-webs. In “Multitrophic
Level Interactions” (B. Tscharntke and B. A. Hawkins, eds.), pp. 223–264. Cambridge Univ. Press,Cambridge, UK.
Schouten, A. J., and Arp, K. K. M. (1991). A comparative study on the efficiency of extraction meth-ods for nematodes from different forest litters. Pedobiologia 35, 393–400.
Seastedt, T. R. (1984). The role of microarthropods in decomposition and mineralization processes.Annu. Rev. Entomol. 29, 25–46.
Shelley, R. M. (2002). “A Synopsis of the North American Centipedes of the Order Scolopendromorpha(Chilopoda).” Memoir 5, Virginia Museum of Natural History, Martinsville.
Sinclair, J. L., and Ghiorse, W. C. (1989). Distribution of aerobic bacteria, protozoa, algae, and fungiin deep subsurface sediments. Geomicrobiol. J. 7, 15–31.
Singh, B. N. (1946). A method of estimating the numbers of soil protozoa, especially amoebae, basedon their differential feeding on bacteria. Ann. Appl. Biol. 33, 112–119.
Southwood, T. R. E. (1978). “Ecological Methods with Particular Reference to the Study of InsectPopulations.” 2nd ed. Chapman * Hall, London.
Stout, J. D. (1963). The terrestrial plankton. Tuatara 11, 57–65.
References 189
Ch07-P546807.qxd 11/18/06 6:40 PM Page 189

Strong, D. R., Kaya, H. K., Whipple, A. V., Child, A. L., Kraig, S., Bondonno, M., Dyer, K., andMaron, L. L. (1996). Entomopathogenic nematodes: natural enemies of root-feeding caterpillarson bush lupine. Oecologia 108, 167–173.
Strong, D. R., Whipple, A. V., Child, A. L., and Dennis, B. (1999). Model selection for a subterraneantrophic cascade: root-feeding caterpillars and entomopathogenic nematodes. Ecology 80,2750–2761.
Swift, M. J., Heal, O. W., and Anderson, J. M. (1979). “Decomposition and Terrestrial Ecosystems.”Univ. of California Press, Berkeley.
Tomlin, A. D., Shipitalo, M. J., Edwards, W. M., and Protz, R. (1995). Earthworms and their influenceon soil structure and infiltration. In “Earthworm Ecology and Biogeography in North America” (P. F. Hendrix, ed.), pp. 159–183. CRC Press, Boca Raton, FL.
Treonis, A. M., Wall, D. H., and Virginia, R. A. (1999). Invertebrate biodiversity in Antarctic DryValley soils and sediments. Ecosystems 2, 483–492.
van Vliet, P. C. J. (2000). Enchytraeids. In “Handbook of Soil Science” (M. Sumner, ed.), pp.C70–C77. CRC Press, Boca Raton, FL.
van Vliet, P. C. J., Beare, M. H., and Coleman, D. C. (1995). Population dynamics and functional rolesof Enchytraeidae (Oligochaeta) in hardwood forest and agricultural systems. Plant Soil 170,199–207.
van Vliet, P. C. J., and Hendrix, P. F. (2003). Role of fauna in soil physical processes. In “SoilBiological Fertility—a Key to Sustainable Land Use in Agriculture” (L. K. Abbott and D. V. Murphy, eds.). Kluwer Academic, Dordrecht.
Venette, R. C., and Ferris, H. (1998). Influence of bacterial type and density on population growth ofbacterial-feeding nematodes. Soil Biol. Biochem. 30, 949–960.
Wall, D. H., ed. (2004). “Sustaining Biodiversity and Ecosystem Services in Soil and Sediments.”Island Press, Washington, DC.
Wall, D. H., Snelgrove, V. R., and Covich, A. P. (2001). Conservation priorities for soil and sedimentinvertebrates. In “Conservation Biology: Research Priorities for the Next Decade” (M. E. Souleand G. H. Orians, eds.), pp. 99–123. Island Press, Washington, DC.
Wall, D. H., Fitter, A., and Paul, E. (2005). Developing new perspectives from advances in soil biodi-versity research. In “Biological Diversity and Function in Soils” (R. D. Bardgett, M. B. Usher, andD. W. Hopkins, eds.), pp. 3–30. Cambridge Univ. Press, Cambridge, UK.
Wallace, H. R. (1959). The movement of eelworms in water films. Ann. Appl. Biol. 47, 366–370.Wallwork, J. A. (1970). “Ecology of Soil Animals.” McGraw–Hill, London.Wallwork, J. A. (1976). “The Distribution and Diversity of Soil Fauna.” Academic Press,
London.Walter, D. E., Kaplan, D. T., and Permar, T. A. (1991). Missing links: a review of methods used to esti-
mate trophic links in soil food webs. Agric. Ecosyst. Environ. 34, 399–405.Wardle, D. A. (2002). “Communities and Ecosystems: Linking the Aboveground and Belowground
Components.” Princeton Univ. Press, Princeton, NJ.Wardle, D. A., Bardgett, R. D., Klironomos, J. N., Setälä, H., van der Putten, W. H., and Wall, D. H.
(2004). Ecological linkages between aboveground and belowground biota. Science 304, 1629–1633.Wheeler, G. C., and Wheeler, J. (1990). Insecta: Hymenoptera Formicidae. In “Soil Biology Guide”
(D. L. Dindal, ed.), pp. 1277–1294. Wiley, New York.Whitehead, A. G., and Hemming, J. R. (1965). A comparison of some quantitative methods of extract-
ing small vermiform nematodes from soil. Ann. Appl. Biol. 55, 25–38.Whitford, W. G. (2000). Keystone arthropods as webmasters in desert ecosystems. In “Invertebrates as
Webmasters in Ecosystems” (D. C. Coleman and P. F. Hendrix, eds.), pp. 25–41. CABInternational, Wallingford, UK.
Wilson, E. O. (1987). Causes of ecological success: the case of the ants. J. Anim. Ecol. 56, 1–9.Wilson, E. O. (1992). “The Diversity of Life.” Norton, New York.Wolters, V. (1988). Effects of Mesenchytraeus glandulosus (Oligochaeta, Enchytraeidae) on decom-
position processes. Pedobiologia 32, 387–398.
190 Chapter 7 Fauna: the Engine for Microbial Activity and Transport
Ch07-P546807.qxd 11/18/06 6:40 PM Page 190

Yeates, G. W. (1998). Feeding in free-living soil nematodes: a functional approach. In “ThePhysiology and Biochemistry of Free-Living and Plant-Parasitic Nematodes” (R. N. Perry and D. J. Wright, eds.), pp. 245–269. CAB International, Wallingford, UK.
Yeates, G. W., Bongers, T., de Goede, R. G. M., Freckman, D. W., and Georgieva, S. S. (1993).Feeding habits in soil nematode families and genera—an outline for soil ecologists. J. Nematol. 25,101–313.
Yeates, G. W., and Coleman, D. C. (1982). Role of nematodes in decomposition. In “Nematodes inSoil Ecosystems” (D. W. Freckman, ed.), pp. 55–80. Univ. of Texas Press, Austin.
Yeates, G. W., Dando, J. L., and Shepherd, T. G. (2002). Pressure plate studies to determine how mois-ture affects access of bacterial-feeding nematodes to food in soil. Eur. J. Soil Sci. 53, 355–365.
Zachariae, G. (1964). Welche Bedeutung haben Enchyträus in Waldboden? In “SoilMicromorphology” (A. Jongerius, ed.), pp. 57–68. Elsevier, Amsterdam.
Zwart, K. B., and Darbyshire, J. F. (1991). Growth and nitrogenous excretion of a common soil flag-ellate, Spumella sp. J. Soil Sci. 43, 145–157.
References 191
Ch07-P546807.qxd 11/18/06 6:40 PM Page 191

Ch07-P546807.qxd 11/18/06 6:40 PM Page 192

PART
III
ConCEPTS AND
INTERACTIONS
Ch08-P546807.qxd 11/18/06 6:41 PM Page 193

Ch08-P546807.qxd 11/18/06 6:41 PM Page 194

8THE ECOLOGY OF SOIL
ORGANISMS
Sherri J. Morris
Christopher B. Blackwood
Introduction
Mechanisms That Drive Community Structure
Ecosystem Dynamics
Conclusion
References and Suggested Reading
195
INTRODUCTION
Ecology is the study of the interactions of organisms with one another and theirenvironment. The name, Oecologie, provided by Haeckel in 1866, is based on theGreek term “oikos,” the family household, which embodied the view of the envi-ronment and organisms as a household (Kingsland, 1991). Ecology was devel-oped to provide a mechanistic backbone to the science of natural history that waspopular but becoming somewhat passé in the late 1800s. There was great interest inproviding a scientific basis for examining the mechanisms behind Darwin’s con-cept of “survival of the fittest” and the process of natural selection. Because of thisorigin, the field of ecology is entwined with evolution and it is often presupposedthat the basis of ecological relationships is one of long evolutionary history. Humandisturbances to ecosystems can result in interactions among organisms that are notbased on evolutionary history and provide opportunities to test this presupposition.
Ecology has recently moved from intellectual obscurity to prominence as a sci-ence that could provide tools for approaching environmental problems. Odum(1997) suggested that ecology has matured to “a basic science of the total envi-ronment.” Contributions that ecology has made and will continue to make to sci-ence and society are a result of its interdisciplinary nature. Its roots are in geology,
Ch08-P546807.qxd 11/18/06 6:41 PM Page 195

196 Chapter 8 The Ecology of Soil Organisms
chemistry, mathematics, and physics, as well as botany, zoology, microbiology,genetics, and molecular biology. The need to provide answers to ecological ques-tions has driven methodological developments in multiple fields. Development oftechniques for examining population and community structure at the molecularlevel has and will continue to provide answers to hypotheses that were initiallyproposed by Darwin.
As a field, ecology developed from research on plant and animal systems; micro-bial systems differ in significant ways. The “species concept” adopted by many plantand animal biologists defines a species as an interbreeding group of organisms thatis reproductively (and genetically) isolated from other organisms. Most microbialspecies reproduce asexually. They do not interbreed and this part of the biologicalspecies concept does not apply. Genetic exchange is not a fundamental part of thebacterial life cycle and, for many species and environments, it is rare (Young, 1998).Yet, there are mechanisms that can cause genetic transfer between species, some-times disparately related. This implies that bacterial species are not geneticallyisolated, so the second part of the biological species concept may also not apply.
Classification of organisms into species has two goals: (1) the classificationshould reflect the evolutionary history of the organisms and (2) it should be usefulfor dividing organisms into groups with different physiological and ecologicalcharacteristics. The biological species concept seems to satisfy both goals forplants and animals reasonably well (although it is now widely criticized). BeforeDNA could be manipulated in research, the species definition used by microbiol-ogists differentiated individual species based on morphology or physiology, essen-tially adopting the second goal of taxonomy mentioned above as a species concept.Microbial taxonomy based on these definitions led to frustration. For much of thelatter half of the 20th century, microbiologists abandoned the goal of having tax-onomy reflect evolutionary history (Woese, 1994). Bacterial species are currentlydefined as a collection of strains with DNA–DNA reassociation similarity of�70%. This creates groups that satisfy the goals of taxonomy, but in many cases itprovides no evolutionary or phenotypic information about the groups created. It isno more universal than the biological species concept since it would not seem toapply to many well-recognized species of eukaryotes (for example, the humanand chimpanzee DNA reassociation similarity is 98.4%) (Staley, 1997). With thesequencing of DNA in the past 20 years, the evolutionary basis for microbial tax-onomy has returned. An individual gene sequence may provide narrow informationabout a potential phenotype or may provide a view of evolutionary relationshipsthat is limited by the rate of mutation in the gene and the amount of horizontal trans-fer it has experienced. Taxonomy is currently moving toward genomic approaches(i.e., genome-wide sequencing efforts) that may allow species to be defined byinferring evolutionary relationships from large sets of gene sequences, while atthe same time obtaining information about the presence of many genes withimportant phenotypic consequences.
The organization of the field of ecology reflects a hierarchical approach thatincludes studies of individuals, populations, communities, and ecosystems. Studies
Ch08-P546807.qxd 11/18/06 6:41 PM Page 196
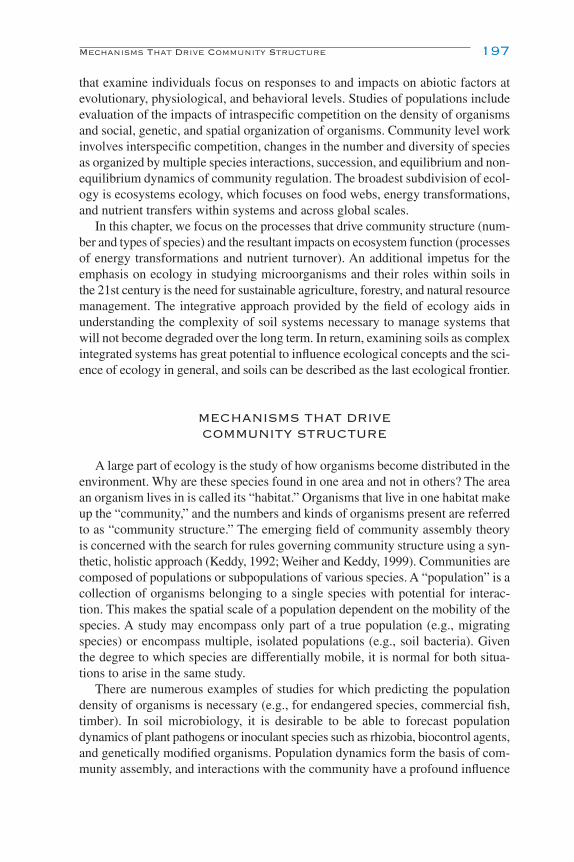
that examine individuals focus on responses to and impacts on abiotic factors atevolutionary, physiological, and behavioral levels. Studies of populations includeevaluation of the impacts of intraspecific competition on the density of organismsand social, genetic, and spatial organization of organisms. Community level workinvolves interspecific competition, changes in the number and diversity of speciesas organized by multiple species interactions, succession, and equilibrium and non-equilibrium dynamics of community regulation. The broadest subdivision of ecol-ogy is ecosystems ecology, which focuses on food webs, energy transformations,and nutrient transfers within systems and across global scales.
In this chapter, we focus on the processes that drive community structure (num-ber and types of species) and the resultant impacts on ecosystem function (processesof energy transformations and nutrient turnover). An additional impetus for theemphasis on ecology in studying microorganisms and their roles within soils inthe 21st century is the need for sustainable agriculture, forestry, and natural resourcemanagement. The integrative approach provided by the field of ecology aids inunderstanding the complexity of soil systems necessary to manage systems thatwill not become degraded over the long term. In return, examining soils as complexintegrated systems has great potential to influence ecological concepts and the sci-ence of ecology in general, and soils can be described as the last ecological frontier.
MECHANISMS THAT DRIVE COMMUNITY STRUCTURE
A large part of ecology is the study of how organisms become distributed in theenvironment. Why are these species found in one area and not in others? The areaan organism lives in is called its “habitat.” Organisms that live in one habitat makeup the “community,” and the numbers and kinds of organisms present are referredto as “community structure.” The emerging field of community assembly theoryis concerned with the search for rules governing community structure using a syn-thetic, holistic approach (Keddy, 1992; Weiher and Keddy, 1999). Communities arecomposed of populations or subpopulations of various species. A “population” is acollection of organisms belonging to a single species with potential for interac-tion. This makes the spatial scale of a population dependent on the mobility of thespecies. A study may encompass only part of a true population (e.g., migratingspecies) or encompass multiple, isolated populations (e.g., soil bacteria). Giventhe degree to which species are differentially mobile, it is normal for both situa-tions to arise in the same study.
There are numerous examples of studies for which predicting the populationdensity of organisms is necessary (e.g., for endangered species, commercial fish,timber). In soil microbiology, it is desirable to be able to forecast populationdynamics of plant pathogens or inoculant species such as rhizobia, biocontrol agents,and genetically modified organisms. Population dynamics form the basis of com-munity assembly, and interactions with the community have a profound influence
Mechanisms That Drive Community Structure 197
Ch08-P546807.qxd 11/18/06 6:41 PM Page 197

on populations. Identifying populations and studying them in situ are difficult andhave to date limited true understanding of the complexity of community assemblyin soil systems.
PHYSIOLOGICAL LIMITS
Each species has a unique set of limitations on the conditions under whichindividuals, and therefore populations, can grow and reproduce. Shelford’s Lawof Tolerance states that there is a maximum and minimum value for each environ-mental factor, beyond which a given species cannot survive. This is usually dis-cussed with respect to environmental characteristics known as “modulators,” suchas temperature, pH, or salinity. Modulators impact the physiology of organisms byaltering the conformation of proteins and cell membranes and the thermodynamicand kinetic favorability of biochemical reactions (see Chap. 2). For each environ-mental modulator, species also have an optimal range, within which maximumpopulation growth occurs. Tolerance to modulators can be interactive; for example,tolerance to temperature extremes may be broader at one pH than another. Normallythe geographical range of a species coincides with areas where environmental con-ditions are within the optimal ranges for the species, with the most optimal condi-tions at the center of the geographical range. The effects of species being in habitatswith modulators outside their tolerance levels are listed in Table 8.1, along withbiochemical strategies used by microorganisms that exist under these “extreme”conditions.
Resources are physical components of the environment that are captured byorganisms for their use, such as N, energy, territories, or nesting sites. Shelford’slaw can be applied to most resources, but the responses to different resources arehighly interactive. This is partially captured in Liebig’s Law of the Minimum,which states that the resource in lowest supply relative to organismal needs willlimit growth. At very low levels of a resource, the organism is unable to accumulatethe resource in adequate quantities for metabolism. At very high levels, resourcescan also be toxic or inhibit growth.
The response of a species to environmental conditions or resources depends onthe genetic makeup of the species. The limits and optima are determined throughnatural selection and other mechanisms that affect the genome. All organismshave some degree of “phenotypic plasticity,” or the ability to adapt to the environ-ment. In microorganisms, a change in an environmental condition can induce expres-sion of alternative phenotypes (e.g., proteins, phospholipids) that are adapted tothe new conditions, broadening the range of conditions acceptable for the species.The cost associated with this ability is extra genetic material that must be dupli-cated with each cell division, resulting in lower efficiency of resource use. Thisstrategy can be efficient in fluctuating environments such as the soil surface. Atthe other extreme, endosymbionts that live continuously within the host anddepend on the homeostasis of their host can have reduced genomes (Silva et al.,2001; Gil et al., 2003).
198 Chapter 8 The Ecology of Soil Organisms
Ch08-P546807.qxd 11/18/06 6:41 PM Page 198
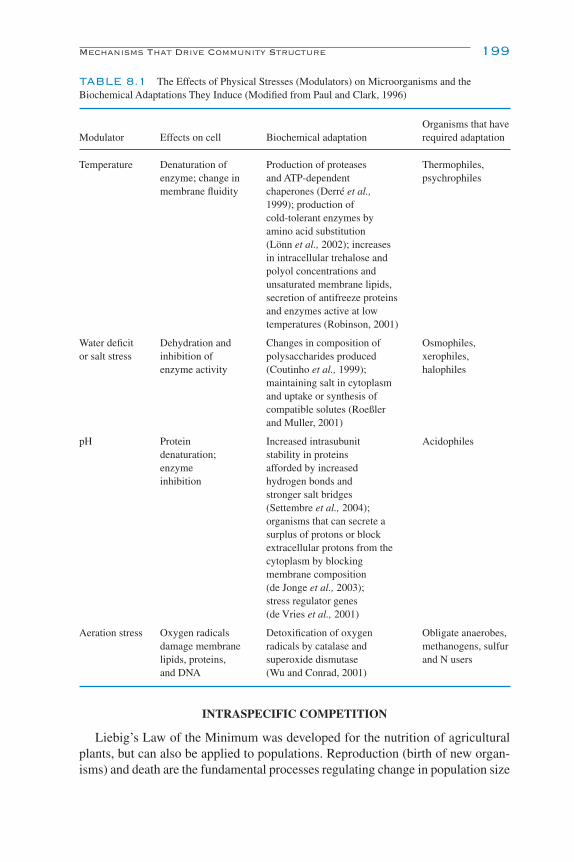
Mechanisms That Drive Community Structure 199
TABLE 8.1 The Effects of Physical Stresses (Modulators) on Microorganisms and theBiochemical Adaptations They Induce (Modified from Paul and Clark, 1996)
Organisms that haveModulator Effects on cell Biochemical adaptation required adaptation
Temperature Denaturation of Production of proteases Thermophiles, enzyme; change in and ATP-dependent psychrophilesmembrane fluidity chaperones (Derré et al.,
1999); production ofcold-tolerant enzymes byamino acid substitution(Lönn et al., 2002); increasesin intracellular trehalose andpolyol concentrations andunsaturated membrane lipids,secretion of antifreeze proteinsand enzymes active at lowtemperatures (Robinson, 2001)
Water deficit Dehydration and Changes in composition of Osmophiles,or salt stress inhibition of polysaccharides produced xerophiles,
enzyme activity (Coutinho et al., 1999); halophilesmaintaining salt in cytoplasmand uptake or synthesis ofcompatible solutes (Roeßlerand Muller, 2001)
pH Protein Increased intrasubunit Acidophilesdenaturation; stability in proteins enzyme afforded by increased inhibition hydrogen bonds and
stronger salt bridges(Settembre et al., 2004);organisms that can secrete asurplus of protons or blockextracellular protons from thecytoplasm by blockingmembrane composition(de Jonge et al., 2003);stress regulator genes(de Vries et al., 2001)
Aeration stress Oxygen radicals Detoxification of oxygen Obligate anaerobes,damage membrane radicals by catalase and methanogens, sulfurlipids, proteins, superoxide dismutase and N usersand DNA (Wu and Conrad, 2001)
INTRASPECIFIC COMPETITION
Liebig’s Law of the Minimum was developed for the nutrition of agriculturalplants, but can also be applied to populations. Reproduction (birth of new organ-isms) and death are the fundamental processes regulating change in population size
Ch08-P546807.qxd 11/18/06 6:41 PM Page 199
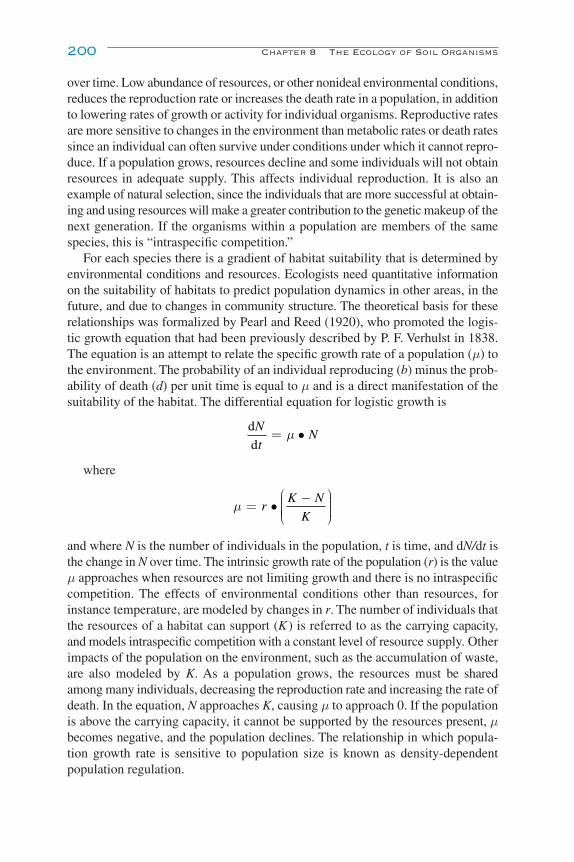
over time. Low abundance of resources, or other nonideal environmental conditions,reduces the reproduction rate or increases the death rate in a population, in additionto lowering rates of growth or activity for individual organisms. Reproductive ratesare more sensitive to changes in the environment than metabolic rates or death ratessince an individual can often survive under conditions under which it cannot repro-duce. If a population grows, resources decline and some individuals will not obtainresources in adequate supply. This affects individual reproduction. It is also anexample of natural selection, since the individuals that are more successful at obtain-ing and using resources will make a greater contribution to the genetic makeup of thenext generation. If the organisms within a population are members of the samespecies, this is “intraspecific competition.”
For each species there is a gradient of habitat suitability that is determined byenvironmental conditions and resources. Ecologists need quantitative informationon the suitability of habitats to predict population dynamics in other areas, in thefuture, and due to changes in community structure. The theoretical basis for theserelationships was formalized by Pearl and Reed (1920), who promoted the logis-tic growth equation that had been previously described by P. F. Verhulst in 1838.The equation is an attempt to relate the specific growth rate of a population (µ) tothe environment. The probability of an individual reproducing (b) minus the prob-ability of death (d) per unit time is equal to µ and is a direct manifestation of thesuitability of the habitat. The differential equation for logistic growth is
where
and where N is the number of individuals in the population, t is time, and dN/dt isthe change in N over time. The intrinsic growth rate of the population (r) is the valueµ approaches when resources are not limiting growth and there is no intraspecificcompetition. The effects of environmental conditions other than resources, forinstance temperature, are modeled by changes in r. The number of individuals thatthe resources of a habitat can support (K ) is referred to as the carrying capacity,and models intraspecific competition with a constant level of resource supply. Otherimpacts of the population on the environment, such as the accumulation of waste,are also modeled by K. As a population grows, the resources must be sharedamong many individuals, decreasing the reproduction rate and increasing the rate ofdeath. In the equation, N approaches K, causing µ to approach 0. If the populationis above the carrying capacity, it cannot be supported by the resources present, µbecomes negative, and the population declines. The relationship in which popula-tion growth rate is sensitive to population size is known as density-dependent population regulation.
µ = •−⎛
⎝⎜⎜⎜⎜
⎞
⎠⎟⎟⎟⎟
rK N
K
d
d
N
tN= •µ
200 Chapter 8 The Ecology of Soil Organisms
Ch08-P546807.qxd 11/18/06 6:41 PM Page 200

The logistic growth equation is used by population ecologists mainly as a con-ceptual tool, rather than to forecast changes in population size, because the mech-anisms of population regulation are not explicitly modeled in terms of reproductionand death rates. It is also rare in plant and animal populations for individuals ofdifferent ages to have the same rate of death or equal probabilities of reproduction.Intraspecific competition often affects certain classes of individuals more thanothers. The common method of forecasting population sizes is currently the use ofstructured demographic models that consider the effects of age, size, or develop-mental stage on probabilities of reproduction and death. Populations of each classof organism and the transition of individuals between classes are tracked sepa-rately in empirical models, using matrix algebraic methods. While the assumptionsof the logistic growth equation are thought to be more appropriate for micro-organisms such as bacteria and yeasts, structured demographic models have alsobeen used for these organisms to take into account a dormant stage or vegetative(nonreproductive) stage.
Lifetime patterns of growth and reproduction, including timing of reproductiveand dormant stages are known as a species’ “life history.” Life history strategieshave important consequences for population dynamics. The logistic growth equa-tion led to MacArthur and Wilson’s (1967) model of r and K selection, which,although controversial, is still used as a method of generalizing about species lifehistories. K-selected species (with high K values and low r values) are selected fortraits that favor the persistence of individuals under conditions of scarce resourcesand high intraspecific competition. These conditions occur when populations remainnear their carrying capacity (K ). In contrast, r-selected species have the oppositecharacteristics, with relatively high efficiency in converting resources to offspring.The K-selected strategy is an adaptation to environments in which conditions arerelatively stable, resulting in density-dependent mechanisms of population regu-lation, while the r-selected strategy is an adaptation to a variable environment withhigh levels of resources. Hence, environments can be classified as r- or K-selecting.
Pianka (1970) made several other predictions about the correlates of r/K selec-tion. An r-selected species was predicted to have more variable population size(typically below carrying capacity), weak intra- and interspecific competitive inter-actions, rapid maturation, early reproduction, small body size, semelparity (onereproductive event per lifetime), short life span, and high productivity. Ecologistssoon realized that selection pressure and reproductive value at different ages canlead to traits opposite to those predicted by the correlates of the r/K-selection model(Reznick et al., 2002). Like the logistic growth equation, the r/K-selection modelis now used mainly as a conceptual tool to explain life history and has been sup-planted by structured demographic models that can be used to test specific hypothe-ses about life history evolution.
The classification of organisms as r- or K-selected is common in soil microbi-ology. Typically, colonies are classified based on the amount of time it takes forthe colony to appear in laboratory isolation medium. These designations must bemade with reference to a particular environment. Laboratory isolation conditions
Mechanisms That Drive Community Structure 201
Ch08-P546807.qxd 11/18/06 6:41 PM Page 201

represent a small range of the conditions encountered in the environment. The envi-ronment of a batch culture changes continuously as nutrients are not replenishedand wastes are not removed. Hence r-selected species can be positively identified(with respect to the isolation conditions), but K-selected species cannot. Soil micro-biologists have created other classifications similar to the r/K-selection dichotomy,but are focused more on the species’ preferred resources than on intraspecificcompetition. In 1925, S. Winogradsky used the term autochthonous to describeorganisms that grow steadily on organic matter with a constant presence in the envi-ronment and zymogenous for organisms that proliferate on fresh organic matter(Panikov, 1995). In another scheme, oligotrophs grow only at low nutrient levels,while copiotrophs grow quickly at high nutrient levels.
An early model that linked population growth and environmental resources wasproposed by Jacques Monod in 1957 (Panikov, 1995). The Monod model was devel-oped for microbial growth in chemostats, but is now used in a wide array of situ-ations for macro- as well as microorganisms. It has been modified to account fora variety of situations, such as colimitation by multiple resources, growth inhibition,and migration. Maintaining the same notation as above, one version is
where
and
The maximum reproduction rate under nonlimiting resources in this equation isµ0. The concentration of resources in the environment is given by R, and thechange in R over time is dR/dt. The half-saturation constant, or resource concen-tration at which the reproduction rate is at half its maximum, is Ks. Maintenanceutilization of resources, m, is the amount of resources used by organisms to stayalive (not reproduce). The growth yield, Y, is the amount of biomass produced perunit of resource consumed and accounts for extra utilization of resources duringreproduction that are not retained in biomass. Intraspecific competition is explic-itly modeled through the impacts of population size and growth rate on R, whichthen influences future population growth. The number of variables required forthis model is double that of the logistic equation, but the simultaneous modelingof population growth and environmental resources extends the utility of themodel. Additional terms added to the third equation can describe inputs ofresources such as through diffusion, physical movement, or primary production,as well as losses such as leaching.
d
d
R
t
N
Ym N= −
•− •
µ.
µ µ= •+
⎛
⎝⎜⎜⎜⎜
⎞
⎠
⎟⎟⎟⎟⎟−0
R
K Rd
s
d
d
N
tN= •µ
202 Chapter 8 The Ecology of Soil Organisms
Ch08-P546807.qxd 11/18/06 6:41 PM Page 202

DISPERSAL IN SPACE AND TIME
Another layer of realism is added to models of population dynamics by consid-ering the spatial processes of organismal movement (immigration, emigration).Species are often distributed in space in multiple populations that are linked bymigration. The first attempt to deal with this situation by Levins (1969) ignoredpopulation dynamics within each habitat patch, assuming that each patch was of thesame quality and had the same probabilities of local population extinction and emi-gration. The scenario described is the definition of a “metapopulation.” Migrationcreates significant feedback between populations, resulting in persistence of aspecies whenever migration rate is greater than population extinction rate.
Populations of species that are not in decline often correspond with a differentspatial distribution called a source-sink metapopulation (Harrison, 1991). In thisdistribution, there is a large habitat with a thriving population in no danger of localextinction and other smaller populations in less suitable habitats. Since emigrationis often density-dependent, the thriving population regularly produces emigrantswhile the other populations do not. Hence, the less suitable habitats are kept pop-ulated, over the long term, by emigration from the large “source” population(s).These spatially distributed patterns for species populations have been shown to playan important role in the global population dynamics of species and are now a fun-damental part of population viability analysis in conservation ecology.
Active dispersal involves the expenditure of energy by the organism. Passive dis-persal occurs due to the movement of material the organism is attached to or caughtin (e.g., wind or water). Passive dispersal can be truly passive with no energyexpended, or an organism may prepare morphologically and physiologically for pas-sive dispersal by entering a new life stage. Stages for dispersal are typically moreresistant, dormant, or mobile than growth stages. The fruiting bodies and spores offungi and myxococci are examples of elaborate life stages for passive dispersal.Passive dispersal of bacteria with water flow can occur if the bacteria are notadsorbed onto immobile soil particles or protected by soil structure. Fecal coliformsapplied to the soil surface with manure can move several meters and contaminateground or surface waters in some situations, particularly when preferential flow pathslimit interaction of the water and cells with the soil. Cell size limits the passive move-ment of organisms with water in soil due to the sieving effect of soil particles. Larger-celled microbes such as yeasts and protozoans do not experience passive dispersal toas great a degree as bacteria and viruses; however, nondormant protozoans are typ-ically engaged in active dispersal to obtain food. Plant roots, seeds, fungal spores,and chemical substrates found within several centimeters of particular soil bacte-ria have been shown to induce chemotactic responses (active dispersal) althoughthe extent to which this occurs naturally is unclear (Murphy and Tate, 1996).
Passive dispersal of hyphal fungi is normally restricted to spores. Spores maybe produced in the soil, such as by arbuscular mycorrhizal fungi, or in sporocarps(fruiting bodies) above the soil surface. Sporulation is often induced by environ-mental cues such as moisture. Spores are also dispersed by animal activity bothabove and below ground. Vegetative growth of fungal hyphae can also be considered
Mechanisms That Drive Community Structure 203
Ch08-P546807.qxd 11/18/06 6:41 PM Page 203

a form of active dispersal since new areas are being explored. Fungi often havedistinct forms of hyphal growth for nutrient acquisition versus dispersal. Hyphaefor dispersal, such as rhizomorphs, grow more rapidly, are thicker and tougher, andmay be formed by anastomosis (cellular fusion) of multiple smaller hyphae (Rayneret al., 1999). The strategy is to invest little and maintain impermeable surfacesduring exploration of a resource-poor environment until a resource-rich patch isencountered. Upon encountering such a patch, there is a proliferation of thinner,more permeable hyphae with a higher surface-to-volume ratio.
The ability of an organism to enter a dormant phase can also be seen as a dis-persal mechanism, but through time rather than space. This form of dispersal isone version of the “storage effect,” by which reproductive potential is storedacross time, resulting in higher reproduction rates under favorable environmentalconditions. Entrance of individuals into a dormant life stage may be a develop-mentally programmed event for some species or may be induced to avoid density-dependent competition. For many organisms, life stages that facilitate passivedispersal in space are also optimal for dispersal in time. This is true of plant seedsand fungal spores. A general state of dormancy for soil microorganisms is indi-cated by the increase in numbers and metabolic activity when soil is amendedwith water or nutrients. Bacterial cells entering a dormant stage are known toundergo a suite of biochemical and morphological changes, including reduction insize. “Dwarf” cells (�0.07 µm3 biovolume or �0.3 µm diameter) make up themajority of bacterial cells in soil (Kieft, 2000).
PREDICTING POPULATION GROWTH
The ideas presented in the previous sections have depicted population growth interms of deterministic models because these are the most convenient tools we havefor conceptualizing and exploring biological mechanisms. Population growth innature is not so neatly defined. Even deterministic models can have unpredictablebehavior and extreme sensitivity to initial conditions, leading to “chaotic dynam-ics” (Hastings et al., 1993). Stochastic processes and other processes that are notdensity-dependent can have profound impacts on populations. Examples of density-independent factors include weather, physical disturbance (e.g., avalanche,tillage), or the application of broad-spectrum toxins (e.g., antibiotics, insecticides).
The term “population regulation” has been equated to “a long-term stationaryprobability distribution of population density,” and it is now recognized that suchpopulation regulation is necessarily density-dependent (Turchin, 1995). Over thelong term, the absence of population regulation leads to either extinction or infinitepopulation growth. Hence, the majority of populations display density-dependentpatterns when tested by experimental manipulations or time-series analysis.
INTERSPECIFIC COMPETITION
We have seen in the previous sections how a species’geographic range and occu-pation of particular habitats is limited by the species’ adaptations to environmental
204 Chapter 8 The Ecology of Soil Organisms
Ch08-P546807.qxd 11/18/06 6:41 PM Page 204
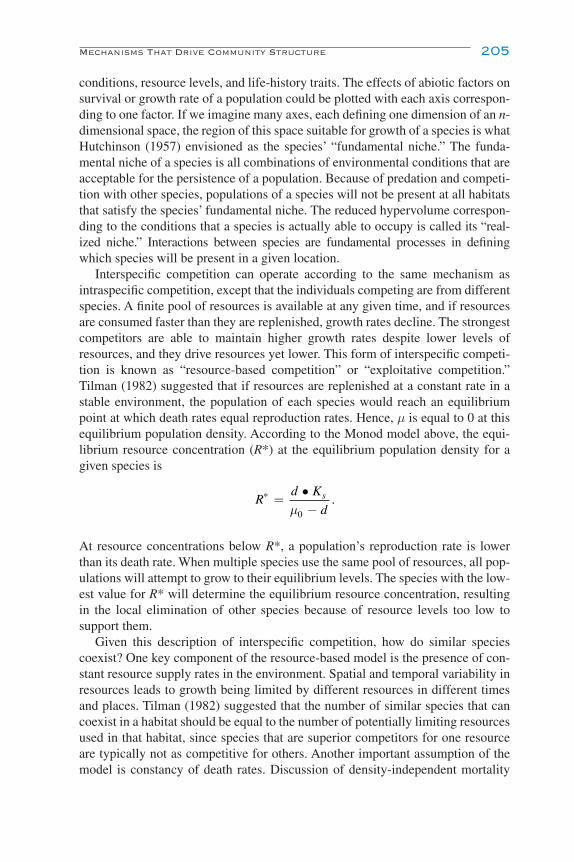
conditions, resource levels, and life-history traits. The effects of abiotic factors onsurvival or growth rate of a population could be plotted with each axis correspon-ding to one factor. If we imagine many axes, each defining one dimension of an n-dimensional space, the region of this space suitable for growth of a species is whatHutchinson (1957) envisioned as the species’ “fundamental niche.” The funda-mental niche of a species is all combinations of environmental conditions that areacceptable for the persistence of a population. Because of predation and competi-tion with other species, populations of a species will not be present at all habitatsthat satisfy the species’ fundamental niche. The reduced hypervolume correspon-ding to the conditions that a species is actually able to occupy is called its “real-ized niche.” Interactions between species are fundamental processes in definingwhich species will be present in a given location.
Interspecific competition can operate according to the same mechanism asintraspecific competition, except that the individuals competing are from differentspecies. A finite pool of resources is available at any given time, and if resourcesare consumed faster than they are replenished, growth rates decline. The strongestcompetitors are able to maintain higher growth rates despite lower levels ofresources, and they drive resources yet lower. This form of interspecific competi-tion is known as “resource-based competition” or “exploitative competition.”Tilman (1982) suggested that if resources are replenished at a constant rate in astable environment, the population of each species would reach an equilibriumpoint at which death rates equal reproduction rates. Hence, µ is equal to 0 at thisequilibrium population density. According to the Monod model above, the equi-librium resource concentration (R*) at the equilibrium population density for agiven species is
At resource concentrations below R*, a population’s reproduction rate is lowerthan its death rate. When multiple species use the same pool of resources, all pop-ulations will attempt to grow to their equilibrium levels. The species with the low-est value for R* will determine the equilibrium resource concentration, resultingin the local elimination of other species because of resource levels too low tosupport them.
Given this description of interspecific competition, how do similar speciescoexist? One key component of the resource-based model is the presence of con-stant resource supply rates in the environment. Spatial and temporal variability inresources leads to growth being limited by different resources in different timesand places. Tilman (1982) suggested that the number of similar species that cancoexist in a habitat should be equal to the number of potentially limiting resourcesused in that habitat, since species that are superior competitors for one resourceare typically not as competitive for others. Another important assumption of themodel is constancy of death rates. Discussion of density-independent mortality
Rd K
ds* .=
•−µ0
Mechanisms That Drive Community Structure 205
Ch08-P546807.qxd 11/18/06 6:41 PM Page 205
206 Chapter 8 The Ecology of Soil Organisms
factors has suggested that this is a departure from reality. Species that are r-selected may be outcompeted under normal conditions, but flourish when mor-tality spikes for the dominant species. “Fugitive species” avoid competition bydispersing into habitat patches where the dominant species has become locallyextinct. Mortality rates can also be altered through “interference competition,” inwhich one competing species impacts another through direct aggressive actionrather than resource use. Examples include human efforts to control agriculturalpests and physical attacks between animals. In soil, the degree of competition thatis mediated by interference mechanisms is unknown, but there is the potential forinterference competition to play an important role. This type of competitionwould be likely in systems containing antibiotic-producing organisms. Davelos et al. (2004) confirmed Waksman’s much earlier observations when they found awide variety of antibiotic production and resistant phenotypes present in soilstreptomycetes at one location, suggesting many organisms capable of competi-tive interference. It also suggests that organisms have developed mechanisms toavoid this type of interference.
Similar species evolve to use different subtypes of the same resource, or theirniches can shift in other ways. This is known as resource partitioning and was takenas some of the first evidence of competition and natural selection. Considering themechanisms of species coexistence to be components of the niche, we arrive at theconclusion of Hanski et al. (1995) that the niche is equivalent to an ecologicalspecies concept. The concept that no two species having identical niches can coex-ist is the “competitive exclusion principle.” So, how similar can two species beand still coexist? This has been explored theoretically to a limited extent (begin-ning with MacArthur and Levins, 1967). In reality, extinctions due to competitionhave been documented, but evolution can allow an environment to be partitionedinto an astonishing array of niches. For example, Rozen and Lenski (2000) showedthat a pure culture of Escherichia coli developed spontaneously into distinct sub-types that coexisted because of physiological (niche) differences. Niches can shiftin terms of environmental tolerances as well, resulting essentially in species livingin different habitats.
In soil, competition has been exploited as a mechanism for biocontrol, but it hasalso been blamed for the failure of many soil inoculation programs. Fluorescentpseudomonads have been shown to suppress a variety of plant pathogens by secre-tion of antibiotics (interference competition) and siderophores, which sequester iron(resource competition). Strains of Fusarium oxysporum that are nonpathogeniccan be superior competitors for carbon and root colonization sites (Alabouvette et al., 1996). Organisms introduced into sterilized soil often survive, while popu-lations decline rapidly in nonsterile soil. The relatively short half-life of introducedpopulations has been observed for a variety of groups, including some biocontrolagents, rhizobia, fecal organisms, and genetically modified microbes. This hasbeen attributed to competition, but could also be a result of trophic interactions,the type of biological interaction described next. In rare cases, inoculated popula-tions have survived (in reduced numbers compared to the inoculum size) if the
Ch08-P546807.qxd 11/18/06 6:41 PM Page 206
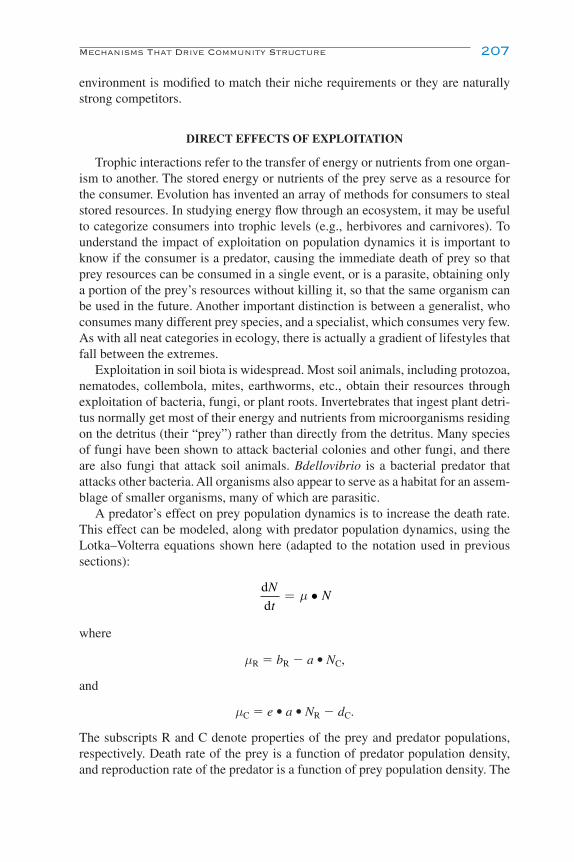
environment is modified to match their niche requirements or they are naturallystrong competitors.
DIRECT EFFECTS OF EXPLOITATION
Trophic interactions refer to the transfer of energy or nutrients from one organ-ism to another. The stored energy or nutrients of the prey serve as a resource forthe consumer. Evolution has invented an array of methods for consumers to stealstored resources. In studying energy flow through an ecosystem, it may be usefulto categorize consumers into trophic levels (e.g., herbivores and carnivores). Tounderstand the impact of exploitation on population dynamics it is important toknow if the consumer is a predator, causing the immediate death of prey so thatprey resources can be consumed in a single event, or is a parasite, obtaining onlya portion of the prey’s resources without killing it, so that the same organism canbe used in the future. Another important distinction is between a generalist, whoconsumes many different prey species, and a specialist, which consumes very few.As with all neat categories in ecology, there is actually a gradient of lifestyles thatfall between the extremes.
Exploitation in soil biota is widespread. Most soil animals, including protozoa,nematodes, collembola, mites, earthworms, etc., obtain their resources throughexploitation of bacteria, fungi, or plant roots. Invertebrates that ingest plant detri-tus normally get most of their energy and nutrients from microorganisms residingon the detritus (their “prey”) rather than directly from the detritus. Many speciesof fungi have been shown to attack bacterial colonies and other fungi, and thereare also fungi that attack soil animals. Bdellovibrio is a bacterial predator thatattacks other bacteria. All organisms also appear to serve as a habitat for an assem-blage of smaller organisms, many of which are parasitic.
A predator’s effect on prey population dynamics is to increase the death rate.This effect can be modeled, along with predator population dynamics, using theLotka–Volterra equations shown here (adapted to the notation used in previoussections):
where
µR � bR � a • NC,
and
µC � e • a • NR � dC.
The subscripts R and C denote properties of the prey and predator populations,respectively. Death rate of the prey is a function of predator population density,and reproduction rate of the predator is a function of prey population density. The
d
d
N
tN= •µ
Mechanisms That Drive Community Structure 207
Ch08-P546807.qxd 11/18/06 6:41 PM Page 207
number of attacks per unit time per predator, a, is assumed to be constant, but thetotal number of prey killed per unit time (calculated aNCNR) increases due to eitherincreased prey or predator abundance. Predator reproduction rate is proportional tothe number of prey killed, but also depends on e, the efficiency with which the pred-ator can use prey to reproduce. Values of e less than 1 imply that a single predatormust kill multiple prey organisms to reproduce, while values greater than 1 implythat the predator can reproduce using the resources from a single prey organism.
The attack rate of predators on prey is normally constant over only a limitedrange of prey and predator population densities. The total number of attacks perunit time per predator (aNR) will reach an asymptote as prey population continuesto rise, because of predator satiation, the minimum handling time required foreach kill, and time spent performing other activities. Attack rates may also declinewhen population density of a particular prey species is below a threshold level, ifthe predator does not invest energy in pursuing prey that is too scarce. These phe-nomena can be incorporated into the Lotka–Volterra model using a nonlinear“functional response” in place of a.
Predators will aggregate in patches of high prey density. At very high predatorpopulation densities, attack rates may decline because other resources becomelimiting. Predators will then disperse into less resource-rich, but also less competi-tive, habitats. This is a consequence of intraspecific competition. Predatory pres-sure is also a factor in habitat quality for the prey. Predator-free patches serve asrefuges for the prey population and can significantly impact metapopulationdynamics. Elliott et al. (1980) found that a finer-textured soil contained more bac-teria protected from predation by nematodes. The finer-textured soil contained alarger proportion of pores too small for the nematodes to utilize. Amoebae wereable to use these pores, and there was a greater increase in growth of nematodesthat preyed on both bacteria and nematodes when amoebae were added to the fine-compared to a coarse-textured soil.
Parasitism is a considerably more complicated phenomenon to model than pre-dation because prey are weakened by parasites, which impacts reproduction anddeath rates. Parasitism can decrease the accumulation of biomass or rate of devel-opment. In terms of the Monod model discussed above, parasitism may cause theinfected subpopulation to have a decreased maximum growth rate (µ0) or to wasteresources through increased maintenance utilization (m). Parasitism also typicallyincreases the death rate, either through prolonged exposure to the parasite or bymaking the prey more sensitive to other causes of mortality.
The details of the route of transmission of a parasite between hosts are criticalto understanding how the parasite is spread. Some parasites are able to colonizenew hosts from dead tissue. For example, the plant root pathogens in the generaGaeumannomyces, Rhizoctonia, and Pythium are able to live saprophyticallywithin plant residue and colonize new roots from these habitats. Higher qualityhabitat patches allow pathogenic hyphae to grow farther through the soil (to atleast 15 cm) to colonize new roots. The probability distribution of colonization ofa root from a particular inoculum source would also depend on a variety of other
208 Chapter 8 The Ecology of Soil Organisms
Ch08-P546807.qxd 11/18/06 6:42 PM Page 208

factors such as the species involved, temperature, moisture, and soil texture.Planting crops at wider distances apart (i.e., reducing host density) is known toreduce the spread of root diseases because the practice limits dispersal. Some par-asites are transferred by other species or other components of the environment(vectors), and their spread is tightly linked to dynamics of these factors. In soil,fungal spores, bacteria, and viruses are transported passively in water and can betransferred by invertebrate vectors such as plant-parasitic nematodes and mites.
INDIRECT EFFECTS OF EXPLOITATION
Unlike a nonliving resource, the genetic makeup of prey species will respond toexploitation through evolution, resulting in defensive adaptations. Defenses fromexploitation can take a variety of forms, including behavioral, morphological, orbiochemical defenses. Evolution can also result in the development of new attackstrategies in consumers, resulting in a continual coevolutionary arms race betweenconsumers and their prey. Exploitation pressure can be regulated by exploitationat higher trophic levels in a process called a trophic cascade. For example, if car-nivores limit the population size of herbivores through heavy predation, then thepressure on plants from herbivory will be low. Consider in the equation above howan increase in death rate (d ) for herbivores would affect the equilibrium concen-tration of the herbivore’s resource (R*). The herbivore’s resource is of course theplant population density. In this case, competitive interactions will be strong forplants and carnivores, but relatively weak for herbivores where response to preda-tion will be important. A trophic cascade is often the basis of strategies in biocontrol.For example, Trichoderma herzianum, a mycoparasitic fungus that attacks the rootpathogen Rhizoctonia solani, has been introduced to control Rhizoctonia density.
Exploitation can have a large influence on the outcome of competitive interac-tions between prey species. Exploitation can contribute to the coexistence ofcompeting prey species by reducing the population size of the superior competitor.This results in increased resource abundance and ameliorates competition. Paine(1969) called predators that perform this function “keystone species.” The termhas since been used to describe any species whose effects on an ecosystem are morethan would be expected based on their biomass in a given system. There is a trade-off between competitive ability and anti-predator adaptations that allows keystonepredation to take place. Ability to avoid exploitation is an alternative niche dimen-sion that species can evolve to utilize.
When representative species are tested, most predatory soil fungi, protozoa,nematodes, and collembola will utilize multiple prey species. However, all alsoshow feeding preferences for, or enhanced benefits from, particular prey species.It is therefore likely that predation regulates community composition (at thespecies level) by mediating competition between microbes or plant species. Theformer has been difficult to test because examining microbial community dynamicsin situ is complicated; results from laboratory studies do not always provide ade-quate information about how natural systems operate. Klironomos and Kendrick
Mechanisms That Drive Community Structure 209
Ch08-P546807.qxd 11/18/06 6:42 PM Page 209

(1995) found that saprophytic fungi are often the preferred food source for arthro-pods, but arthropods will consume mycorrhizal fungi where saprophytic fungi arenot available. These relationships can impact competition among plant species byaltering the nutrients available from mycorrhizas to plants. Bever (2003) providesa comprehensive review of the mechanisms by which microbes mediate competi-tion in plant communities.
In ecosystems, trophic relationships between organisms result in a complexweb of interactions (a food web). A large number of organisms involved havemultiple prey or multiple predators. Omnivorous predators utilize multiple preyfrom different trophic levels and may at times be in competition with potentialprey. The study of how food web structure interacts with community compositionand ecosystem processes is a field still in development. Experimental work hasbeen performed largely with simple communities of protists and bacteria inmicrocosms. One preliminary conclusion from this work is that a greater numberof trophic levels, or greater overall complexity, decreases the stability of con-stituent populations (Morin, 1999). However, this conclusion is in contrast to pre-dictions of the constant connectance hypothesis, which is based on theobservation that each species is less dependent on a single resource in more com-plex systems, providing more of a buffer to environmental fluctuations (Martinezand Dunne, 1998).
When microorganisms are included in soil food webs, the increase in com-plexity on the species level has been viewed as overwhelming. Microorganismsare normally represented by undifferentiated pools of biomass or are divided intovery broad groups (e.g., fungi and bacteria). This is understandable because of theenormous diversity of soil microorganisms, the often unknown role of each taxonin a food web, and the fact that the focus of soil food web studies has typicallybeen biogeochemical processes, not community structure. However, it also masksunique features of food webs arising when microbial species are included explicitly.There are no “top predators” in food webs containing microorganisms, becauseall organisms are exploited by parasites of varying lethality. Also, the presence of“three-species loops” has been the subject of controversy in food webs of macro-scopic organisms and may be possible only when there is differential predation onspecies due to developmental stage. In microbial systems this food web structurehas not been explicitly investigated, but, since many predators within the systemare generalists, it seems likely that such loops can frequently occur due to randomencounters.
Food webs including microorganisms must also account for the presence ofdecomposer organisms. These organisms are not predators because they do notdirectly impact population dynamics of a prey while obtaining their resources.Decomposer organisms obtain energy or nutrients from previously dead organ-isms or their by-products. This decomposition is critical to the recycling of nutrientsthat can be used in primary production. Decomposer organisms affect populationdynamics of primary producers by supplying nutrients and often by competingwith primary producers for the same resources (“immobilization”).
210 Chapter 8 The Ecology of Soil Organisms
Ch08-P546807.qxd 11/18/06 6:42 PM Page 210
MUTUALISMS
Mutualisms are interspecific relationships beneficial to both organismsinvolved. While these relationships have been described as mathematically unsta-ble, a diverse array of cross-kingdom partnerships has existed throughout evolu-tionary history. Soil mutualists have great impact on above- and belowgroundcommunity dynamics across a wide range of ecosystems. Organisms in soil col-laborate with a wide variety of plants to perform nutrient acquisition services inexchange for plant-derived carbohydrates. While the relationships were originallyperceived as bacteria in symbiotic relationships for N acquisition and fungiinvolved with P acquisition, more recent studies have indicated that fungi areactually involved in the acquisition of almost any limiting nutrient in soil, depend-ing on partnering species (Allen, 1991; Smith and Read, 1997).
Mycorrhiza, the relationship between a plant root and fungus, is one of themost important soil mutualisms. It may be one of the oldest relationships partici-pated in by plants (Brundrett, 2002; Stubblefield and Taylor, 1988). There is evi-dence that this relationship evolved and was lost multiple times in different divisionsin the Kingdom Fungi and in different groups of plants. Mycorrhizal fungi havethe ability to acquire nutrients directly from decomposing litter (Leake and Read,1997) and from live animals such as springtails (Klironomos and Hart, 2001). Theycan also influence plant–water relations (Allen, 1991) and reduce attack on rootsby pathogenic fungi (Gange et al., 1994; Azcon-Aguilar and Barea, 1992). Eachof these relationships alters the aboveground community directly by changingrates of reproduction and death of participant species and indirectly by alteringcompetition among plant species.
ABIOTIC FACTORS
Interactions between organisms have been discussed in terms of resource use.However, environmental modulators (as shown in Table 8.1) can also be affectedby organisms. The activities of both nitrifying bacteria and plant roots decreasesoil pH, and soil temperature is affected by plant and litter cover. This can havepositive or negative impacts on the growth of another species, depending on thespecies’ niche requirements.
Some organisms alter the spatial arrangement of components of the environ-ment or serve as new habitat themselves. These organisms are called “ecosystemengineers” and have widespread effects on an ecosystem beyond their own resourceuse (Jones et al., 1994). Large, competitively dominant organisms such as treesare obvious examples of ecosystem engineers. Earthworms are ecosystem engineersbecause they bury plant litter and create macropores in soil.
Many species are commonly found together because they have similar modu-lator niche requirements or they are adapted to rely on the presence of a commonecosystem engineer. One use of the term “guild” in ecology is to describe such agroup of species. Unfortunately, another use of “guild” is to describe species withsimilar resource requirements, resulting in competition and potentially separated
Mechanisms That Drive Community Structure 211
Ch08-P546807.qxd 11/18/06 6:42 PM Page 211
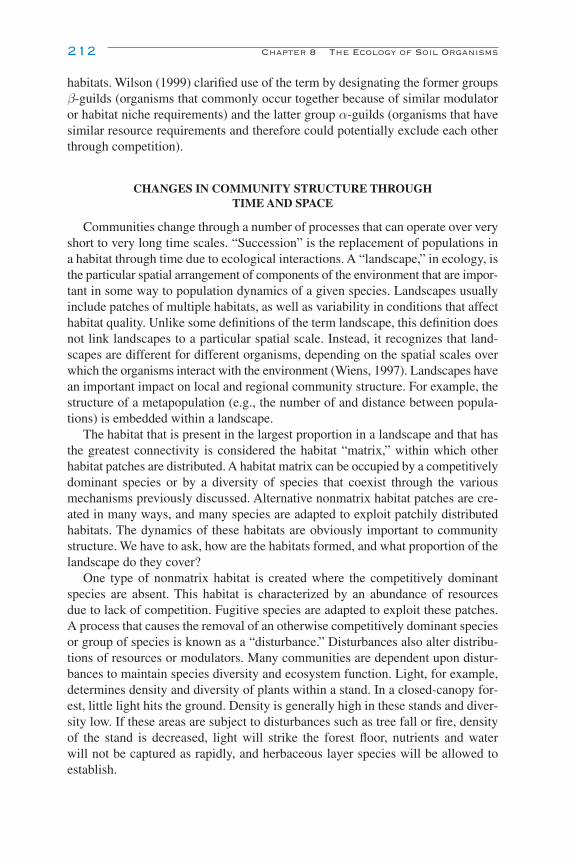
habitats. Wilson (1999) clarified use of the term by designating the former groupsβ-guilds (organisms that commonly occur together because of similar modulatoror habitat niche requirements) and the latter group α-guilds (organisms that havesimilar resource requirements and therefore could potentially exclude each otherthrough competition).
CHANGES IN COMMUNITY STRUCTURE THROUGH TIME AND SPACE
Communities change through a number of processes that can operate over veryshort to very long time scales. “Succession” is the replacement of populations ina habitat through time due to ecological interactions. A “landscape,” in ecology, isthe particular spatial arrangement of components of the environment that are impor-tant in some way to population dynamics of a given species. Landscapes usuallyinclude patches of multiple habitats, as well as variability in conditions that affecthabitat quality. Unlike some definitions of the term landscape, this definition doesnot link landscapes to a particular spatial scale. Instead, it recognizes that land-scapes are different for different organisms, depending on the spatial scales overwhich the organisms interact with the environment (Wiens, 1997). Landscapes havean important impact on local and regional community structure. For example, thestructure of a metapopulation (e.g., the number of and distance between popula-tions) is embedded within a landscape.
The habitat that is present in the largest proportion in a landscape and that hasthe greatest connectivity is considered the habitat “matrix,” within which otherhabitat patches are distributed. A habitat matrix can be occupied by a competitivelydominant species or by a diversity of species that coexist through the variousmechanisms previously discussed. Alternative nonmatrix habitat patches are cre-ated in many ways, and many species are adapted to exploit patchily distributedhabitats. The dynamics of these habitats are obviously important to communitystructure. We have to ask, how are the habitats formed, and what proportion of thelandscape do they cover?
One type of nonmatrix habitat is created where the competitively dominantspecies are absent. This habitat is characterized by an abundance of resources due to lack of competition. Fugitive species are adapted to exploit these patches.A process that causes the removal of an otherwise competitively dominant speciesor group of species is known as a “disturbance.” Disturbances also alter distribu-tions of resources or modulators. Many communities are dependent upon distur-bances to maintain species diversity and ecosystem function. Light, for example,determines density and diversity of plants within a stand. In a closed-canopy for-est, little light hits the ground. Density is generally high in these stands and diver-sity low. If these areas are subject to disturbances such as tree fall or fire, densityof the stand is decreased, light will strike the forest floor, nutrients and water will not be captured as rapidly, and herbaceous layer species will be allowed toestablish.
212 Chapter 8 The Ecology of Soil Organisms
Ch08-P546807.qxd 11/18/06 6:42 PM Page 212
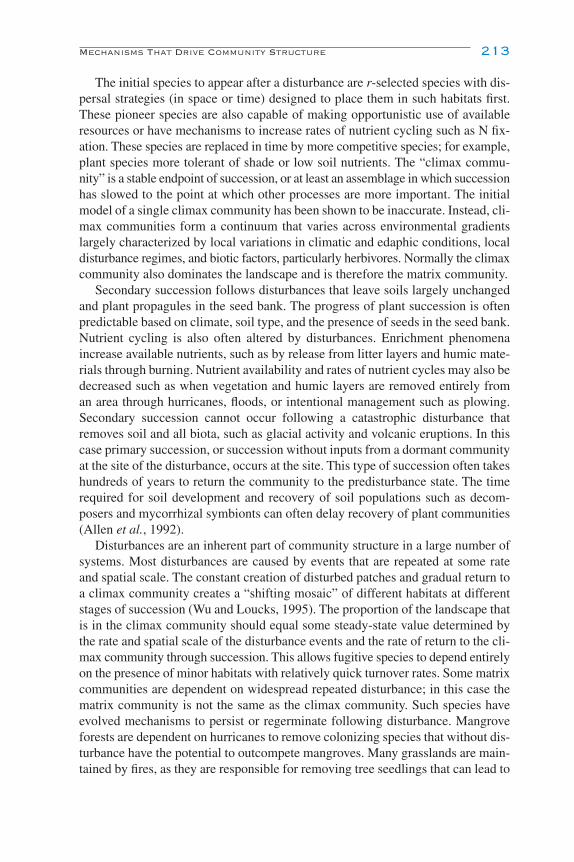
The initial species to appear after a disturbance are r-selected species with dis-persal strategies (in space or time) designed to place them in such habitats first.These pioneer species are also capable of making opportunistic use of availableresources or have mechanisms to increase rates of nutrient cycling such as N fix-ation. These species are replaced in time by more competitive species; for example,plant species more tolerant of shade or low soil nutrients. The “climax commu-nity” is a stable endpoint of succession, or at least an assemblage in which successionhas slowed to the point at which other processes are more important. The initialmodel of a single climax community has been shown to be inaccurate. Instead, cli-max communities form a continuum that varies across environmental gradientslargely characterized by local variations in climatic and edaphic conditions, localdisturbance regimes, and biotic factors, particularly herbivores. Normally the climaxcommunity also dominates the landscape and is therefore the matrix community.
Secondary succession follows disturbances that leave soils largely unchangedand plant propagules in the seed bank. The progress of plant succession is oftenpredictable based on climate, soil type, and the presence of seeds in the seed bank.Nutrient cycling is also often altered by disturbances. Enrichment phenomenaincrease available nutrients, such as by release from litter layers and humic mate-rials through burning. Nutrient availability and rates of nutrient cycles may also bedecreased such as when vegetation and humic layers are removed entirely from an area through hurricanes, floods, or intentional management such as plowing.Secondary succession cannot occur following a catastrophic disturbance thatremoves soil and all biota, such as glacial activity and volcanic eruptions. In thiscase primary succession, or succession without inputs from a dormant communityat the site of the disturbance, occurs at the site. This type of succession often takeshundreds of years to return the community to the predisturbance state. The timerequired for soil development and recovery of soil populations such as decom-posers and mycorrhizal symbionts can often delay recovery of plant communities(Allen et al., 1992).
Disturbances are an inherent part of community structure in a large number ofsystems. Most disturbances are caused by events that are repeated at some rateand spatial scale. The constant creation of disturbed patches and gradual return toa climax community creates a “shifting mosaic” of different habitats at differentstages of succession (Wu and Loucks, 1995). The proportion of the landscape thatis in the climax community should equal some steady-state value determined bythe rate and spatial scale of the disturbance events and the rate of return to the cli-max community through succession. This allows fugitive species to depend entirelyon the presence of minor habitats with relatively quick turnover rates. Some matrixcommunities are dependent on widespread repeated disturbance; in this case thematrix community is not the same as the climax community. Such species haveevolved mechanisms to persist or regerminate following disturbance. Mangroveforests are dependent on hurricanes to remove colonizing species that without dis-turbance have the potential to outcompete mangroves. Many grasslands are main-tained by fires, as they are responsible for removing tree seedlings that can lead to
Mechanisms That Drive Community Structure 213
Ch08-P546807.qxd 11/18/06 6:42 PM Page 213
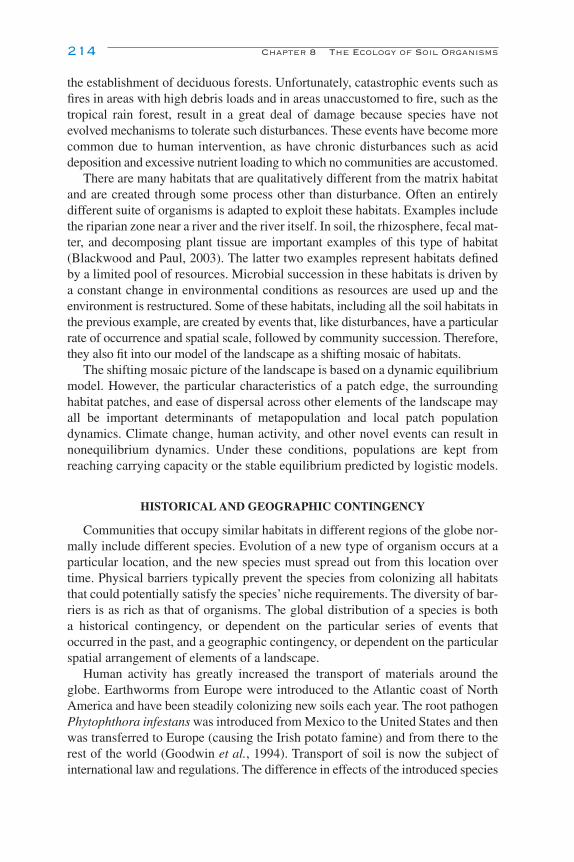
the establishment of deciduous forests. Unfortunately, catastrophic events such asfires in areas with high debris loads and in areas unaccustomed to fire, such as thetropical rain forest, result in a great deal of damage because species have notevolved mechanisms to tolerate such disturbances. These events have become morecommon due to human intervention, as have chronic disturbances such as aciddeposition and excessive nutrient loading to which no communities are accustomed.
There are many habitats that are qualitatively different from the matrix habitatand are created through some process other than disturbance. Often an entirelydifferent suite of organisms is adapted to exploit these habitats. Examples includethe riparian zone near a river and the river itself. In soil, the rhizosphere, fecal mat-ter, and decomposing plant tissue are important examples of this type of habitat(Blackwood and Paul, 2003). The latter two examples represent habitats definedby a limited pool of resources. Microbial succession in these habitats is driven bya constant change in environmental conditions as resources are used up and theenvironment is restructured. Some of these habitats, including all the soil habitats inthe previous example, are created by events that, like disturbances, have a particularrate of occurrence and spatial scale, followed by community succession. Therefore,they also fit into our model of the landscape as a shifting mosaic of habitats.
The shifting mosaic picture of the landscape is based on a dynamic equilibriummodel. However, the particular characteristics of a patch edge, the surroundinghabitat patches, and ease of dispersal across other elements of the landscape mayall be important determinants of metapopulation and local patch populationdynamics. Climate change, human activity, and other novel events can result innonequilibrium dynamics. Under these conditions, populations are kept fromreaching carrying capacity or the stable equilibrium predicted by logistic models.
HISTORICAL AND GEOGRAPHIC CONTINGENCY
Communities that occupy similar habitats in different regions of the globe nor-mally include different species. Evolution of a new type of organism occurs at aparticular location, and the new species must spread out from this location overtime. Physical barriers typically prevent the species from colonizing all habitatsthat could potentially satisfy the species’ niche requirements. The diversity of bar-riers is as rich as that of organisms. The global distribution of a species is both a historical contingency, or dependent on the particular series of events thatoccurred in the past, and a geographic contingency, or dependent on the particularspatial arrangement of elements of a landscape.
Human activity has greatly increased the transport of materials around theglobe. Earthworms from Europe were introduced to the Atlantic coast of NorthAmerica and have been steadily colonizing new soils each year. The root pathogenPhytophthora infestans was introduced from Mexico to the United States and thenwas transferred to Europe (causing the Irish potato famine) and from there to therest of the world (Goodwin et al., 1994). Transport of soil is now the subject ofinternational law and regulations. The difference in effects of the introduced species
214 Chapter 8 The Ecology of Soil Organisms
Ch08-P546807.qxd 11/18/06 6:42 PM Page 214
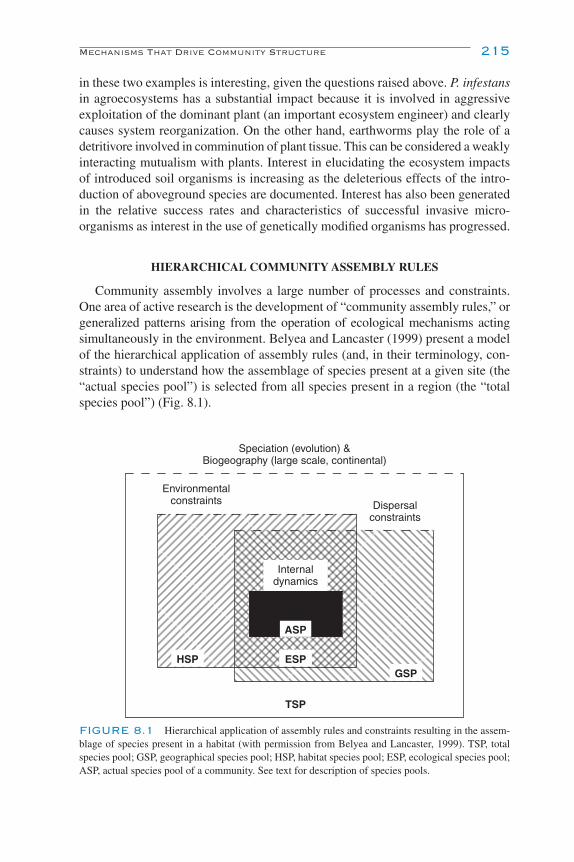
in these two examples is interesting, given the questions raised above. P. infestansin agroecosystems has a substantial impact because it is involved in aggressiveexploitation of the dominant plant (an important ecosystem engineer) and clearlycauses system reorganization. On the other hand, earthworms play the role of adetritivore involved in comminution of plant tissue. This can be considered a weaklyinteracting mutualism with plants. Interest in elucidating the ecosystem impactsof introduced soil organisms is increasing as the deleterious effects of the intro-duction of aboveground species are documented. Interest has also been generatedin the relative success rates and characteristics of successful invasive micro-organisms as interest in the use of genetically modified organisms has progressed.
HIERARCHICAL COMMUNITY ASSEMBLY RULES
Community assembly involves a large number of processes and constraints.One area of active research is the development of “community assembly rules,” orgeneralized patterns arising from the operation of ecological mechanisms actingsimultaneously in the environment. Belyea and Lancaster (1999) present a modelof the hierarchical application of assembly rules (and, in their terminology, con-straints) to understand how the assemblage of species present at a given site (the“actual species pool”) is selected from all species present in a region (the “totalspecies pool”) (Fig. 8.1).
Mechanisms That Drive Community Structure 215
Speciation (evolution) &Biogeography (large scale, continental)
Dispersalconstraints
Environmentalconstraints
Internaldynamics
TSP
ASP
ESPGSP
HSP
FIGURE 8.1 Hierarchical application of assembly rules and constraints resulting in the assem-blage of species present in a habitat (with permission from Belyea and Lancaster, 1999). TSP, totalspecies pool; GSP, geographical species pool; HSP, habitat species pool; ESP, ecological species pool;ASP, actual species pool of a community. See text for description of species pools.
Ch08-P546807.qxd 11/18/06 6:42 PM Page 215
Only a subset of species from the total species pool will be able to disperse tothe site in question; this is the “geographical species pool.” Composition of thetotal and geographical species pools is determined by evolutionary history and theparticular location relative to distributions of the species; in other words, geo-graphic and historical contingencies. The “habitat species pool” is a subset of thetotal species pool that could survive at the site based on its environmental charac-teristics and the species’ physiological limits. The overlap between the habitat andthe geographical species pools is a set of species called the “ecological speciespool.” Given enough time, we might expect most species in the ecological speciespool to be able to complete their life cycles at a site if they are adapted to thedynamic equilibrium system in place. However, at any given time, the ecologicalspecies pool is constrained to the actual species pool by “internal dynamics,”which are species interactions such as competition and exploitation.
The hierarchical application of community assembly rules is nicely illustratedby the theory of island biogeography. MacArthur and Wilson’s (1967) originaltheory tried to explain island species richness. Species richness is assumed to begoverned by equilibrium between colonization rate of new species and extinctionrate of resident species. The habitat species pool can be thought of as the numberof appropriate species present on a nearby mainland. The theory is based on thefollowing four assumptions: (1) The immigration rate of nonresident speciesdeclines with increasing species richness of the island (the overall immigrationrate of species is constant, but the proportion of immigrants that are not alreadyrepresented on the island changes with species richness of the island). (2) Theextinction rate of species on an island increases with increasing species richness(due to increased competition). (3) At a given species richness, the extinction rateof species is lower on larger islands; in other words, a larger island can supportgreater species richness (due to greater habitat diversity on larger islands andlarger populations less prone to stochastic extinction). This is a commonly observedempirical relationship called the “species–area relationship.” (4) Immigration rateof new species to an island declines as the island is more distant from the mainland.The first three assumptions are community assembly rules constraining the actualspecies pool, while the fourth is a rule constraining the geographical species pool.Equilibrium species richness for any island could be predicted by finding the pointof intersection between the colonization and the extinction curves given for thatisland’s distance from the mainland and its size (Fig. 8.2).
These rules, and predictions from the theory, have been found valid for manytaxa on islands (including some “islands” of terrestrial habitat patches distributedin a substantially different habitat matrix), but not in all cases. Some islands mayhave not yet achieved equilibrium because of lack of enough time for coloniza-tion. Lomolino (1999) presents an alternative theory based on individual speciesarea requirements and dispersal abilities to solve some of these anomalies andpredict community composition as well as species richness.
While movement of species to and from islands is an important considerationfor determining species composition and density, other considerations such as
216 Chapter 8 The Ecology of Soil Organisms
Ch08-P546807.qxd 11/18/06 6:42 PM Page 216

disturbances are also important. Wardle et al. (1997) examined 50 islands of varyingarea in the northern Swedish boreal forest zone. On these islands, area significantlyimpacted the frequency of fire as larger islands were more often hit by lightningstrikes than smaller islands. The result was a difference in plant species composi-tion as a consequence of fire return rate. Smaller islands were more diverse floris-tically and had more late successional species with poor litter quality compared tolarger islands. The differences in fire return rates and aboveground species composi-tion among islands translated into differences in belowground community dynam-ics on islands of different sizes. Smaller islands had greater humus accumulation,lower microbial activity, and reduced decomposition and N mineralization rates
Mechanisms That Drive Community Structure 217
Extinction onsmall islands
Extinction onlarge islands
Immigrationto near islands
Immigrationto far islands
Rat
e of
imm
igra
tion
or e
xtin
ctio
n
S small, farS small, nearS large, far
S large, near
Number of species present
The model explains thelow number of specieson small, isolated islands.
The model also accountsfor high number of specieson large, near islands.
The model predicted higherrates of immigration to islandsnearer a source of colonists.
The model predicted high rates of extinctionon small islands
The equilibrium model of island biogeography explained variation innumber of species on islands by the influences of isolation and areaon rates of immigration and extinction.
FIGURE 8.2 Island distance and area and rates of immigration and extinction based on the equi-librium model of island biogeography developed by MacArthur and Wilson. Reproduced from Molles(2002) with permission of The McGraw–Hill Companies.
Ch08-P546807.qxd 11/18/06 6:42 PM Page 217
compared to larger islands. The results suggest that while specific relationships(area, distance from source) govern the number of species in an area, attributes ofspecific plant species have a great impact on the overall ecosystem function.These results should be considered by conservation ecologists and other resourcemanagers as park systems and reserves operate as islands in a sea of other land usetypes, and the impact of aboveground management schemes on belowgroundcommunities must be considered for maximizing success of the desired outcome.
ECOSYSTEM DYNAMICS
Ecosystems are systems defined by organisms and the environment withinwhich these organisms interact. They are spatially defined by the interactions of theorganisms and their relationship to physical space as an integrated system. The scopeof a single ecosystem may extend into the atmosphere or deep into the earth’scrust. Ecosystem dynamics are dependent on defined temporal scales. Ecosystemsare impacted by long-term and short-term events. Trees are still migrating follow-ing the last glacial retreat, altering the components of ecosystems. Humans, whichhave been on the planet for a very short time, have altered ecosystem dynamicsthrough cultivation and burning and, more recently, globally by increasing soilchemical loads and introducing pesticides and other man-made chemicals. Theyhave also altered the global C cycle by releasing stored C from storage pools. Theconsequence is an altered planetary climate that will impact most species thoughaltered temperature and moisture regimes.
The specific components of an ecosystem and the controls over those charac-teristics are largely determined by the “state factors” described originally byDokuchaev (Jenny, 1961). The state factors include climate, time, parent material,potential biota, and topography. These factors set bounds on the types and rates ofprocessing and the raw materials available for processing within the ecosystem.Climate determines rates of processing by controlling moisture availability andtemperature. Time is an important factor for evaluating the degree of weatheringof soils or vegetative development since a disturbance. Parent material determinesthe types of micro- and macroorganisms that can exist and the nutrient and waterholding capacity of the medium in which plants must grow. Potential biota includesall organisms that can exist or have existed in an area. For example, deep rootinggrasses will differ from other types of plants in their impact on soil developmentby contributing materials at depth that will be converted into organic matter andturnover slowly. Rooting depth, C:N ratio of materials added to soils, density anddiversity of plants, animals, microbes, etc., will all contribute differentially to thesoil produced. Finally, topography determines access to water, movement of mate-rials, soil depth, and degree of weathering and can alter plant community structurebased on placement along a topographic gradient. Anthropogenic influences havebeen added to this list of state factors as human impacts on soils can alter the his-torical development of soils, resulting in soils with novel characteristics.
218 Chapter 8 The Ecology of Soil Organisms
Ch08-P546807.qxd 11/18/06 6:42 PM Page 218
Discussions of ecosystems within an ecological context focus on energy flows,elemental cycles, and emergent properties. Soil organisms and processes are inte-gral to the development and functioning of all terrestrial ecosystems and, as such,an understanding of soil biology and biochemistry is essential for characterizingecosystem dynamics. Soil dynamics drive elemental cycles, have controlling rolesin ecosystem functions, and are largely determinants of emergent properties (prop-erties not obvious from study of processes at finer levels of organization) such asdecomposition rates, nutrient flows, and productivity.
ENERGY FLOW
The flow of energy in ecosystems is from energy source to autotroph to het-erotroph. For most systems, the energy source is the sun and the autotrophs aregreen plants. The use of energy sources such as inorganic C, N, and S occursunder limited, but not unrealistic, circumstances and is currently of great interestbecause of the roles of these processes in the production of greenhouse gases suchas nitrous oxides and methane. The use of molecules that do not contain C as asource of energy is largely carried out by bacteria and is of great importance fordiscussing nutrient cycles, but is of lesser importance when discussing energyflow pathways because the contribution to biomass production is a fraction of thatproduced from solar energy. The solar energy that is captured within an ecosystemis based on the amount of photosynthesis that occurs there. The most commonlyused term to begin describing this flow is net primary productivity (NPP), whichis the total energy uptake by plants in an ecosystem that is available for use byother trophic levels. NPP is calculated as
NPP � GPP � Rp,
where gross primary productivity (GPP) is all of the energy assimilated throughphotosynthesis, and respiration (Rp) is the sum of energy loss through oxidation oforganic compounds. The amount of NPP in an ecosystem can be predicted mosteasily at the largest scale by state factors, but even more simply, patterns of NPPcan be described by climate or moisture and temperature alone (Fig. 8.3).
Biomes, the major ecosystem types based on dominant vegetation, are easilyplotted along moisture and temperature gradients showing corresponding increasesin NPP. At shorter time scales, such as across seasons, NPP is controlled by leafarea, N content, season length, temperature, light, and CO2.
Secondary production, the amount of biomass produced by consumers, isdependent on the amount of energy made available by primary producers. Thishas consequences for the complexity of trophic dynamics of an ecosystem. Thecomplexity of a food web is likely dictated by the amount of energy that is con-tained in the producers. The most complex food webs are in the tropical systemswhere production is not limited by moisture or temperature. Biological systemsare inefficient in the transfer of energy. Plants transform only 1 to 5% of the sun-light that is available to them for photosynthesis into biomass. The transformation
Ecosystem Dynamics 219
Ch08-P546807.qxd 11/18/06 6:42 PM Page 219

of plant materials by herbivores into biomass that is available to carnivores is alsoa relatively inefficient process, with only 10 to 30% of the energy that is availablein the plant materials becoming biomass of the herbivores. The energy that is notconverted to animal biomass is lost to the environment as a waste product, whichis most often heat, satisfying the second law of thermodynamics. The amount ofbiomass at each level in the food web can be calculated and produces a biomasspyramid characteristic of the ecosystems studied. Biomass pyramids often showthe decomposer populations in a separate pyramid or not at all. Little is knownabout the efficiency with which decomposers recycle detritus. Decomposition ofother trophic levels by detritivores significantly impacts the rate at which nutrients
220 Chapter 8 The Ecology of Soil Organisms
Tundra
Histosol
Low
Soi
lho
riz.
Hei
ght
(m)
Soi
lho
riz.
Hei
ght (
m)
Soi
lho
riz.
Hei
ght (
m)
Soi
lho
riz.
Hei
ght (
m)
Soi
lho
riz.
Hei
ght (
m)
Soi
lho
riz.
Hei
ght (
m)
Soi
lho
riz.
Hei
ght (
m)
Soi
lho
riz.
Hei
ght (
m)
Soi
lho
riz.
Hei
ght (
m)
Soi
lho
riz.
Hei
ght (
m)
Soi
lho
riz.
Hei
ght (
m)
Low
Tem
pera
ture
Temperaturegrassland
Temperatureshrublands
DE
SE
RT
S
Hig
h
B � 9 P � 1 N � 10 AET � 150 PET � 300
B � 120 P � 2N � 22AET � 300 PET � 450
B � 3P � 3N � 24AET � 300 PET � 420
B � 15P � 2N � 18AET � 300 PET � 400
B � 4P � 4N � 50AET � 400 PET � 800
B � 20P � 3N � 25AET � 400 PET � 800
B � 200 P � 11N � 100AET � 690 PET � 700
B � 200 P � 10N � 40AET � 550 PET � 600
B � 250P � 13N � 90AET � 1000PET � 1400
B � 500P � 15N � 90AET � 700PET � 700
B � 400P � 20N � 160AET � 1600PET � 1600
1
O
OEB
AB
P
15
10
5
4
2
A
4
2
A1
2
A
2
Boreal forest
Spodoso/Entisol
Mollisol
Mollisol
Aridisol
Aridisol
Tropicalgrassland
Tropicalshrubland
Temp. decid .forest
Temp. conif. forestAlifisol
Spodosol
Tropical seasonalforest
Ultisol
Temperaterain forest
Tropical rain forest
Spodosol
Oxisol
20
10
BA
20
10
B
O
E
20
10
C
E
40
20
OE
40
20
E
B
Precipitation High
FIGURE 8.3 Modified diagram of the distribution of major ecosystem and soil types in relationto precipitation and temperature. Values for elements of structure and function that are used to charac-terize ecosystems are given for each type. B, total plant biomass in Mg ha�1 y�1; P, total plant pro-duction above ground in Mg ha�1 y�1; N, nitrogen uptake by plants in kg ha�1 y�1; AET, actualevapotranspiration in millimeters of water per year; PET, potential evapotranspiration in millimeters ofwater per year. Reprinted from Aber and Melillo (2001) with permission from Elsevier.
Ch08-P546807.qxd 11/18/06 6:42 PM Page 220

become available for primary producers. While decomposers control the rate atwhich detrital components such as N and P become available to plants, below-ground food webs are responsible for liberating immobilized nutrients. Microbesuse energy gained for metabolism, biomass synthesis, and reproduction. Theamount of CO2 lost per unit energy gained differs based on the C-use efficiency ofthe organism. Environmental conditions can impact C-use efficiency (Six et al.,2006). Lack of nutrients, or more importantly, nutrients in specific ratios can alterthe amount of energy expended to utilize materials. Some computer models, suchas the Century model, assume that of the C assimilated by microbes 55% is lost asCO2, although when nonlignin surface litter is considered, a value of 45% is used(Parton et al., 1987). Substrate quality, nutrient availability, temperature (del Giorgioand Cole, 1998), and protozoan grazing (Frey et al., 2001) impact the C-utilizationefficiency of soil organisms. Part of the difficulty in evaluating efficiency is lack ofgood techniques for assaying efficiency without adding materials to a natural system.
CARBON, NUTRIENT, AND WATER CYCLES
The term “biogeochemical cycles” emphasizes the intertwined roles of bioticand abiotic components for providing necessary molecules for the growth andreproduction of living organisms. It also emphasizes the importance of soils andsoil organisms for driving nutrient availability. The long evolutionary history ofmicrobes has allowed them to develop the machinery necessary to recycle nearlyall naturally constructed, complex molecules to the building blocks necessary forthe nutrition of higher organisms. The major cycles essential to organisms, andtherefore ecosystems, will be described briefly here and are described in moredetail elsewhere in this text.
The macronutrients (C, O, H, N, Ca, P, Mg, K, S, Na, Cl) are needed in muchgreater amounts than the elements considered to be micronutrients (Fe, Mn, B, Co,Cu, Mo, Zn, I, Se). Each element has its own pattern of cycling from the initialstages of solubilization from rock or fixation from the atmosphere ultimatelyresulting in forms that are available for plant uptake and, finally, recycling bymicroorganisms. The focus on C, N, and P captures all phases important for bio-logical uptake and represents some of the most biologically important elements.
Flux in the C cycle is largely determined by relative rates of photosynthesisversus respiration and decomposition. Soil organisms and the interactions of soilorganisms with each other and plants significantly impact these processes. Forexample, increases in photosynthesis occur in mycorrhizal plants in nutrient- orwater-limited areas. These relationships also alter photosynthetic rates by mediat-ing competition for resources. Soil organisms can impact rates of plant respirationthrough root predation or other tissue damage. Increased need for tissue repair willresult in increased plant respiration as will association with mutualists. Decomposi-tion of plant and animal materials and return of CO2 to the atmosphere are nearlyentirely mediated by microbial decomposer communities. The rate at which mate-rial is decomposed is impacted, for example, by competition among decomposers
Ecosystem Dynamics 221
Ch08-P546807.qxd 11/18/06 6:42 PM Page 221

for food resources, predation on decomposers by soil animals or other nonsapro-phytes, and alterations to abiotic conditions under which the organisms live.
Human-induced alteration to global fluxes in the C cycle is probably the mostimportant ecological experiment of all time. Responses to human alterations willbe determined by the biological responses to elevated CO2, as well as responses toindirect effects such as temperature change and climate instability. The global Ccycle (Fig. 8.4) has been greatly altered by the large flux of CO2 into the atmos-phere created by fossil fuel use and land use change. The current rate of increasein atmospheric CO2 concentration (�3.2 Pg per year) is a consequence of imbal-ance between these anthropogenic sources and increased rates of CO2 capture byvegetation, soils, and the ocean (�2 Pg-C per year, not shown). The amount of Cmoving into soils is mediated by soil organisms. Their contributions to C evolu-tion relative to C storage below ground are of great interest. There are currently anumber of studies examining the relative contributions of each belowground par-ticipant group to flux (illustrated in Fig. 8.4), C-use efficiency, and the impacts ofelevated CO2 and climate change on these fluxes.
222 Chapter 8 The Ecology of Soil Organisms
FIGURE 8.4 The global carbon cycle modified from Paul and Clark (1996). Pool and flux val-ues modified from Gruber et al. (2004), which included preindustrial values for ecosystem Cexchange, are in Pg-C for pools and Pg-C/y for fluxes. Flux values for the global C cycle whensummed have failed to account adequately for an increase in atmospheric C of only 3.2 Pg-C/y due inpart to high error associated with measured values and poor understanding of all C source/sink mech-anisms. The soil fluxes are driven largely by microbial participants, which researchers are currentlyworking to quantify.
Ch08-P546807.qxd 11/18/06 6:42 PM Page 222
Ecosystem Dynamics 223
Historically, the amount of N that occurred naturally in ecosystems was a con-sequence of either N fixation by symbiotic or free-living microbes or recycling oforganic materials by microbes. This is not now the case. Anthropogenic generationand application of fertilizer N and pollutant dispersal has resulted in a doubling ofthe amount of N that is currently available for plants in ecosystems. This has changedand will continue to change N availability for plant uptake, the rate at whichdecomposition occurs, plant species germination and competition, and the degreeto which microbes control the amount of N available in terrestrial ecosystems.
The fluxes in the N cycle are primarily driven by N fixation and mineralization(ammonification � nitrification). As such, the microbial community drives keyprocesses in this cycle. Mutualisms with soil organisms such as Rhizobium andFrankia are important for crops but are also important in providing nutrients toplants in early successional communities where N may not be available. The rateat which N is returned to the system following plant uptake is largely determinedby plant form, nutrient-use efficiency, and, ultimately, the rate of mineralization oncethe organic material is made available to the decomposers. Nitrogen that becomesavailable for uptake following release from soil organic matter can be taken upeither by plants or by soil microorganisms through immobilization, by which avail-able N becomes part of microbial tissues rather than plant tissues.
A great deal of the early literature on the plant–fungal mutualisms focusedexclusively on P because mycorrhizas are a key mechanism for movement of Pfrom soil to plants. The need for P in plants is so great and competition so intensethat plants with mutualistic relationships can often grow larger than plants withoutfungi, even though the plants must provide C for fungal growth. As was describedfor C and N, relationships between soil organisms such as competition, predation,and exploitation determine the rate at which P becomes available for plants anddetermines relationships within plant communities. The availability of P can alsodetermine the rate of succession so the formation of mutualisms and arrival ofdecomposer bacteria and fungi has great potential to alter plant community dynam-ics. Disturbances such as fires that release nutrients to soil can circumvent theneed for soil organisms by hastening nutrient availability. According to Liebig’sLaw of the Minimum, low quantities of any essential nutrient can cause stress anddecrease productivity, so the cycling of all nutrients is important in understandingecosystem dynamics. In most ecosystems, the nutrients that plants depend uponfor growth are those that are returned through recycling as a result of microbialaction, also called internal cycling or the intrasystem cycle, rather than fresh inputsof nutrients as a result of biotic or abiotic weathering processes.
The water cycle is the only cycle that does not fit the generalized schemesdescribed above for element cycling. It is more of a physical process than a chem-ical cycle. Solar energy is largely responsible for the evaporation of water from theocean. Only about 10% of this water then precipitates onto land, with the remainderreturning to the ocean. Water is transported in clouds over the land where it is joinedby water released from terrestrial surfaces through evapotranspiration by plants.This water can then be returned to the earth’s surface through precipitation events.
Ch08-P546807.qxd 11/18/06 6:42 PM Page 223
The timing of precipitation events is determined by topography, temperature, andrelative humidity. Water that strikes the earth’s surface can infiltrate and percolatein soil, which can allow groundwater recharge. Alternatively, water can runoff andcontribute to water bodies such as rivers and streams. Runoff can have negativeimpacts on soil quality as increased runoff rates due to poor management or alter-ations to vegetation can result in loss of soil and soil nutrients. The water cycle isparticularly important in terms of ecosystem dynamics because this cycle purifieswater. Water that evaporates from plant surfaces and streams does not contain con-taminants so the rainwater that returns to the surface of the planet is of muchhigher quality than the water found on the surface. Unfortunately anthropogenicsources of pollution now contaminate the precipitation as it returns to the surface.
EMERGENT PROPERTIES
Emergent properties of ecosystems are a consequence of the synergistic effects ofcommunity composition on “ecosystem function” (flux of energy and materialsthrough the ecosystem). The idea that the forest is more than the trees conveys theimportance of the concept, but it can be applied broadly to every ecosystem. Species’impacts on turnover rates and productivity have profound effects. As a very simpleexample, Blair et al. (1990) found that while decomposition rates for mixed litterwere similar to the decomposition rates for the litter of tree species incubated indi-vidually, there were significant alterations to N flux and abundance of decomposerorganisms that could not be predicted based on the patterns detected in incubationsof individual litter types. Indeed, one of the most hotly debated and difficult rela-tionships to define is that of the importance of biodiversity to ecosystem function.
There have been a number of hypotheses developed to explain the inherentimportance of biodiversity, but few studies have provided convincing support forthese hypotheses. Questions such as whether biodiversity impacts characteristicsincluding ecosystem productivity, nutrient retention, and stability have permeatedthe literature over the past several decades. In an era of decreasing global biodiver-sity and decreasing genetic diversity, these questions require immediate attention.Intellectually there is no denying that maintaining biodiversity is essential to main-taining the integrity of systems. There are two main problems with this challenge.The first is that measuring the complete biodiversity of a system and determining thedegree to which it is in an “undisturbed state” is difficult. Second, biodiversity is nota term that is indicative of quality but quantity. Increasing diversity by increasingundesirable species such as nonnative invasive species will not maintain the integrityof a system, so biodiversity for biodiversity’s sake is not the answer. So, whatspecies or how many species should an ecosystem contain? The example above ofBlair et al. (1990) suggests that species interactions impact ecosystem function, inthis case N flux within a system, which will feed back to impact energy allocationto nutrient acquisition by the plant. Tilman (1996) demonstrated that ecosystem sta-bility increased with aboveground species diversity. However, Klironomos et al.(2000) found that the presence or absence of arbuscular mycorrhizal (AM) fungi
224 Chapter 8 The Ecology of Soil Organisms
Ch08-P546807.qxd 11/18/06 6:42 PM Page 224

significantly changed the relationship of plant diversity to aboveground produc-tivity. Without the fungi, productivity increased as plant species were added to atotal of 15 species in a linear fashion. Productivity was maximized at 10 plantspecies in an asymptotic fashion with AM fungi present. The results suggest thatconsiderations of the importance of diversity in ecosystem function must includean understanding of diversity of all participants, otherwise the importance ofdiversity among different components may be overlooked. In contrast, the islandbiogeography study by Wardle et al. (1997) described above found the islandswith the greatest aboveground diversity had lower ecosystem process rates.Whether lower rates of nutrient cycling and decomposition are tied to lowerbelowground diversity remains to be seen.
One of the biodiversity hypotheses examines the degree to which there is func-tional redundancy in microbial communities. This hypothesis suggests that thereare so many species that have the same function that loss of one will not alter theway that the system operates. There are no studies that can provide adequate supportfor or can eliminate this hypothesis. The amount of stress placed on ecosystemsacross the globe by anthropogenic influences has changed the way ecosystemsoperate. Whereas there may have been no impact of the loss of one species from asystem before anthropogenic N deposition, this chronic disturbance may havechanged the response of the system to the loss of one species. There are two mainterms used to characterize the way that an ecosystem responds to a disturbance.While a system that does not change appreciably following a disturbance is saidto be resistant, a system that changes but returns to its predisturbance state withina reasonable time frame is said to be resilient. The degree to which ecosystems areresistant or resilient may depend entirely on biodiversity and on the amount ofstress currently on the system. Unfortunately, as much as this information is neededto protect ecosystems from degradation and protect species against loss, the sta-bility of ecosystems is an emergent property that cannot easily be measured quan-titatively as a parameter or by quantifying one or more of its component parts.
CONCLUSION
Integrating across scales is a challenge that ecologists have faced for the pasthundred years. Scientists that examine microorganisms or soil communities havealways dealt with this particular issue. For example, how does one acquire soilsamples, in a forest, that are representative of the organisms that live there, in amanner that will allow one to evaluate treatment differences or small-scale ratesof change? Conversely, present interpretation of global-scale processes such asnet primary productivity and C cycling require very little understanding of micro-bial community dynamics. Processes such as nutrient cycling impact site produc-tivity, but productivity at a global scale can be predicted based on temperature andmoisture patterns alone. In models, the microbially mediated steps of nutrientcycling are also predicted by patterns of temperature and moisture. The dilemma
Conclusion 225
Ch08-P546807.qxd 11/18/06 6:42 PM Page 225
facing scientists is that if one considers the component parts of any elementalcycle, the rate that a nutrient becomes available for uptake is dependent on the lifecycle of a soil bacteria or the reach of a mycorrhizal companion. In other cases,such as where there is a unique biological interaction (e.g., pathogenesis, mutual-ism, ecosystem engineering), prediction of population and community dynamicsis critical. Failure to investigate the causes and impacts of microbial communitystructure over the long term will retard our ability to manage ecosystems for thegreatest benefit to society and reduce our understanding of the impacts of speciesloss and global climate change. The role that each organism plays must be exam-ined across spatial scales from molecules to ecosystems, and temporal scales fromseconds to centuries, or our ability to predict problems or mitigate damage will beimpaired. Integration across scales is a challenge that those that study below-ground systems can begin to facilitate.
The field of science known as ecology is more integrative than most otherfields. Ecologists are dependent on specialists that reach across the breadth of thephysical sciences. Scientists that study soil microbiology and biochemistry cancontribute to and benefit from approaching the medium and organisms they examineas ecologists. Society has placed a great burden on scientists by damaging systemsbefore understanding how they operate. Science is now charged with developingan understanding of these systems and finding ways to mitigate the damage. Thiscan be accomplished only by integrating across scientific fields. As such, this briefintroduction to ecology was prepared to stimulate an awareness of the contribu-tions that studies of soils have already made to our understanding of the operationof the natural world and the need to continue to integrate scientific endeavors frommolecules to the biosphere.
REFERENCES AND SUGGESTED READING
Aber, J. D., and Melillo, J. M. (2001). “Terrestrial Ecosystems.” 2nd ed. Academic Press, San Diego.Alabouvette, C., Lemanceau, P., and Steinberg, C. (1996). Biological control of Fusarium wilts:
opportunities for developing a commercial product. In “Principles and Practice of ManagingSoilborne Plant Pathogens” (R. Hall, ed.), pp. 192–212. Am. Phytopathol. Soc. Press, St. Paul, MN.
Allen, M. F. (1991). “Ecology of Mycorrhizae.” Cambridge Univ. Press, Cambridge, UK.Allen, M. F., Crisafulli, C., Friese, C. F., and Jeakins, S. L. (1992). Reformation of mycorrhizal sym-
bioses on Mount St. Helens, 1980–1990: interactions of rodents and mycorrhizal fungi. Mycol.Res. 69, 447–453.
Azcon-Aguilar, C., and Barea, J. M. (1992). Interactions between mycorrhizal fungi and other rhizos-phere microorganisms. In “Mycorrhizal Functioning” (M. F. Allen, ed.), pp. 163–198. Chapman &Hall, New York.
Belyea, L. R., and Lancaster, J. (1999). Assembly rules within a contingent ecology. Oikos 86,402–416.
Bever, J. D. (2003). Soil community feedback and the coexistence of competitors: conceptual frame-works and empirical tests. New Phytol. 157, 465–473.
Blackwood, C. B., and Paul, E. A. (2003). Eubacterial community structure and population size withinthe soil light fraction, rhizosphere, and heavy fraction of several agricultural systems. Soil Biol.Biochem. 35, 1245–1255.
226 Chapter 8 The Ecology of Soil Organisms
Ch08-P546807.qxd 11/18/06 6:42 PM Page 226

Blair, J. M., Parmelee, R. W., and Beare, M. H. (1990). Decay rates, nitrogen fluxes and decomposercommunities of single and mixed-species foliar litter. Ecology 7, 1976–1985.
Brown, J. H., Stevens, G. C., and Kaufman, D. M. (1996). Geographic range: size, shape, boundaries,and internal structure. Annu. Rev. Ecol. Syst. 27, 597–623.
Brundrett, M. C. (2002). Coevolution of roots and mycorrhizas of land plants. New Phytol. 154, 275–304.Coleman, D. C., and Crossley, D. A., Jr. (2004). “Fundamentals of Soil Ecology.” 2nd ed. Academic
Press, San Diego.Coutinho, H. L. C., Kay, H. E., Manfio, G. P., Neves, M. C. P., Ribeiro, J. R. A., Rumjanek, N. G., and
Beringer, J. E. (1999). Molecular evidence for shifts in polysaccharide composition associatedwith adaptation of soybean Bradyrhizobium strains to the Brazilian Cerrado soils. Environ.Microbiol. 1, 401–408.
Davelos, A. L., Kinkel, L. L., and Samac, D. A. (2004). Spatial variation in frequency and intensity of antibiotic interactions among streptomycetes from prairie soil. Appl. Environ. Microbiol. 70,1051–1058.
de Jonge, R., Takumi, K., Ritmeester, W. S. and van Leusden, F. M. (2003). The adaptive response ofEscherichia coli O157 in an environment with changing pH. J. Appl. Microbiol. 94, 555–560.
del Giorgio, P. A., and Cole, J. J. (1998). Bacterial growth efficiency in natural aquatic systems. Annu.Rev. Ecol. Syst. 29, 503–541.
de Vries, N., Kuipers, E. J., Kramer, N. E., van Vliet, A. H. M., Bijlsma, J. J. E., Kist, M., Bereswill, S.,Vandenbroucke-Grauls, C. M. J. E., and Kusters, J. G. (2001). Identification of environmentalstress-regulated genes in Helicobacter pylori by a lacZ reporter gene fusion system. Helicobacter6, 300–309.
Derré, I., Rapoport, G., and Msadek, T. (1999). CtsR, a novel regulator of stress and heat shockresponse, controls clp and molecular chaperone gene expression in gram-positive bacteria. Mol.Microbiol. 31, 117–131.
Elliott, E. T., Anderson, R. V., Coleman, D. C., and Cole, C. V. (1980). Habitable pore space and micro-bial trophic interactions. Oikos 35, 327–335.
Frey, S. D., Gupta, V. V. S. R., Elliott, E. T., and Paustian, K. (2001). Protozoan grazing affects esti-mates of carbon utilization efficiency of the soil microbial community. Soil Biol. Biochem. 33,1759–1768.
Gange, A. C., Brown, V. K., and Sinclair, G. S. (1994). Reduction of lack vine weevil larval growth byvesicular-arbuscular mycorrhizal infection. Entomol. Exp. Appl. 70, 115–119.
Gil, R., Silva, F. J., Zientz, E., Delmotte, F., Gonzalez-Candelas, F., Latorre, A., Rausell, C.,Kamerbeek, J., Gadau, J., Hölldobler, B., van Ham, R. C. H. J., Gross, R., and Moya, A. (2003).The genome sequence of Blochmannia floridanus: comparative analysis of reduced genomes.Proc. Natl. Acad. Sci. USA 100, 9388–9393.
Goodwin, S. B., Cohen, B. A., and Fry, W. E. (1994). Panglobal distribution of a single clonal lineageof the Irish potato famine fungus Proc. Natl. Acad. Sci. USA 91, 11591–11595.
Gruber, N., Friedlingstein, P., Field, C. B., Valentini, R., Heimann, M., Richey, J. E., Lankao, P. R.,Schulze, E. D., and Chen, C. T. A. (2004). The vulnerability of the carbon cycle in the 21st cen-tury: an assessment of carbon–climate–human interactions. In “The Global Carbon Cycle” (C. B. Field and M. R. Raupach, eds.), Vol. 62, pp. 45–76. Island Press, Washington, DC.
Hanski, I., Clobert, J., and Reid, W. (1995). Effect of landscape pattern on competitive interactions. In“Mosaic Landscapes and Ecological Processes” (L. Hansson, L. Fahrig, and G. Merriam, eds.), pp. 203–224. Chapman & Hall, London.
Harrison, S. (1991). Local extinction in a metapopulation context: an empirical evaluation. In“Metapopulation Dynamics: Empirical and Theoretical Investigations” (M. Gilpin and I. Hanski,eds.), pp. 73–88. Academic Press, London.
Hastings, A., Hom, C. L., Ellner, S., Turchin, P., and Godfray, H. C. J. (1993). Chaos in ecology: isMother Nature a strange attractor? Annu. Rev. Ecol. Syst. 24, 1–33.
Hutchinson, G. E. (1957). Concluding remarks. Cold Spring Harbor Symp. 22, 415–427.Jenny, H. (1961). Derivation of state factor equations of soils and ecosystems. Soil Sci. Soc. Am. Proc.
25, 385–388.
References and Suggested Reading 227
Ch08-P546807.qxd 11/18/06 6:42 PM Page 227

Jones, C. G., Lawton, J. H., and Shachak, M. (1994). Organisms as ecosystem engineers. Oikos 69,373–386.
Keddy, P. A. (1992). Assembly and response rules: two goals for predictive community ecology. J. Veg. Sci. 3, 157–164.
Kieft, T. L. (2000). Size matters: dwarf cells in soil and subsurface terrestrial environments. In“Nonculturable Microorganisms in the Environment” (R. R. Colwell and D. J. Grimes, eds.), pp. 19–46. ASM Press, Washington, DC.
Kingsland, S. E. (1991). Defining ecology as a science. In “Foundations of Ecology: Classic Paperswith Commentaries” (L. A. Real and J. H. Brown, eds.). Univ. of Chicago Press, Chicago.
Klironomos, J. N., and Hart, M. M. (2001). Food-web dynamics—animal nitrogen swap for plant car-bon. Nature 410, 651–652.
Klironomos, J. N., and Kendrick, W. B. (1995). Stimulative effects of arthropods on endomycorrhizasof sugar maple in the presence of decaying litter. Funct. Ecol. 9, 528–536.
Klironomos, J. N., McCune, J., Hart, M., and Neville, J. (2000). The influence of arbuscular mycor-rhizae on the relationship between plant diversity and productivity. Ecol. Lett. 3, 137–141.
Leake, J. R., and Read, D. J. (1997). Mycorrhizal fungi in terrestrial habitats. In “The Mycota,” IV,“Environmental and Microbial Relationships” (D. T. Wicklow and B. Söderström, eds.), pp. 281–301. Springer-Verlag, Berlin.
Levins, R. (1969). Some demographic and genetic consequences of environmental heterogeneity forbiological control. Bull. Entomol. Soc. Am. 15, 237–240.
Lomolino, M. V. (1999). A species-based, hierarchical model of island biogeography. In “EcologicalAssembly Rules: Perspectives, Advances, Retreats” (E. Weiher and P. Keddy, eds.), pp. 272–310.Cambridge Univ. Press, Cambridge, UK.
Lönn, A., Gárdonyi, M., van Zyl, W., Hahn-Hägerdal, B., and Otero, R. C. (2002). Cold adaptation ofxylose isomerase from Thermus thermophilus through random PCR mutagenesis gene cloning andprotein characterization. Eur. J. Biochem. 269, 157–163.
MacArthur, R. H., and Levins, R. (1967). The limiting similarity, convergence, and divergence ofcoexisting species. Am. Nat. 101, 377–385.
MacArthur, R. H., and Wilson, E. O. (1967). “The Theory of Island Biogeography.” Princeton Univ.Press, Princeton, NJ.
Martinez, N. D., and Dunne, J. A. (1998). Time, space, and beyond: scale issues in food-web research.In “Ecological Scale: Theory and Applications” (D. L. Peterson and V. T. Parker, eds.), pp. 207–226. Columbia Univ. Press, New York.
Molles, M. C. (2002). “Ecology: Concepts and Applications.” McGraw–Hill, Boston.Morin, P. (1999). “Community Ecology.” Blackwell Sci., Malden, MA.Murphy, S. L., and Tate, R. L., III (1996). Bacterial movement through soil. In “Soil Biochemistry”
(G. Stotzky and J.-M. Bollag, eds.), Vol. 9, pp. 253–286. Dekker, New York.Odum, E. (1997). “Ecology: a Bridge between Science and Society.” 3rd ed. Sinauer, Sunderland, MA.Paine, R. T. (1969). A note on trophic complexity and species diversity. Am. Nat. 103, 91–93.Panikov, N. S. (1995). “Microbial Growth Kinetics.” Chapman & Hall, London.Parker, V. T., and Pickett, S. T. A. (1998). Historical contingency and multiple scales of dynamics
within plant communities. In “Ecological Scale: Theory and Applications” (D. I. Peterson and V. T. Parker, eds.), pp. 171–191. Columbia Univ. Press, New York.
Parton, W. J., Schimel, D. S., Cole, C. V., and Ojima, D. S. (1987). Analysis of factors controlling soilorganic matter levels in Great Plains grasslands. Soil Sci. Soc. Am. J. 51, 1173–1179.
Paul, E. A., and Clark, F. E. (1996). “Soil Microbiology and Biochemistry.” 2nd ed. Academic Press,New York.
Pearl, R., and Reed, L. J. (1920). On the rate of growth of the population of the United States since1790 and its mathematical representation. Proc. Natl. Acad. Sci. USA 6, 275–288.
Pianka, E. R. (1970). On r- and K-selection. Am. Nat. 104, 592–597.Rayner, A. D. M., Beeching, J. R., Crowe, J. D., and Watkins, Z. R. (1999). Defining individual fungal
boundaries. In “Structure and Dynamics of Fungal Populations” (J. J. Worrall, ed.), pp. 19–41.Kluwer Academic, Dordrecht.
228 Chapter 8 The Ecology of Soil Organisms
Ch08-P546807.qxd 11/18/06 6:42 PM Page 228

Real, L. A., and Brown, J. H., eds. (1991). “Foundations of Ecology: Classic Papers withCommentaries.” Univ. of Chicago Press, Chicago.
Reznick, D., Bryant, M. J., and Bashey, F. (2002). r- and K-selection revisited: the role of populationregulation in life-history evolution. Ecology 83, 1509–1520.
Robinson, C. H. (2001). Cold adaptation in Arctic and Antarctic fungi. New Phytol. 151, 341–353.Roeßler, M., and Müller, V. (2001). Osmoadaptation in bacteria and archaea: common principles and
differences. Environ. Microb. 3, 743–754.Rozen, D. E., and Lenski, R. E. (2000). Long-term experimental evolution in Escherichia coli. VIII.
Dynamics of a balanced polymorphism. Am. Nat. 155, 24–35.Schimel, D. S., Enting, I. G., Heimann, M., Wigley, T. M. L., Raynaud, D., Alves, D., and Siegenthaler,
U. (1995). CO2 and the carbon cycle. In “Climate Change 1994” (J. T. Houghton, L. G. Meira Filho, J. P. Bruce, H. Lee, B. A. Callander, E. F. Haites, N. Harris, and K. Maskell,eds.), pp. 35–71. Cambridge Univ. Press, Cambridge, UK.
Settembre, E. C., Chittuluru, J. R., Mill, C. P., Kappock, T. J., and Ealick, S. E. (2004). Acidophilicadaptations in the structure of Acetobacter aceti N5-carboxyaminoimidazole ribonucleotidemutase (PurE). Acta Crystallogr. D 60, 1753–1760.
Silva, F. J., Latorre, A., and Moya, A. (2001). Genome size reduction through multiple events of genedisintegration in Buchnera APS. Trends Genet. 17, 615–618.
Six, J., Frey, S. D., Thiet, R. K., and Batten, K. M. (2006). Bacterial and fungal contributions to car-bon sequestration in agroecosystems. Soil Sci. Soc. Am. J. 70, 555–569.
Smith, S. E., and Read, D. (1997). “Mycorrhizal Symbiosis.” 2nd ed. Academic Press, London.Staley, J. T. (1997). Biodiversity: are microbial species threatened? Curr. Opin. Biotech. 8, 340–345.Stubblefield, S. P., and Taylor, T. N. (1988). Recent advances in palaeomycology. New Phytol. 108,
3–25.Tilman, D. (1982). “Resource Competition and Community Structure.” Princeton Univ. Press,
Princeton, NJ.Tilman, D. (1996). Biodiversity: population versus ecosystem stability. Ecology 77, 350–363.Turchin, P. (1995). Population regulation: old arguments and a new synthesis. In “Population
Dynamics: New Approaches and Synthesis” (N. Cappuccino and P. W. Price, eds.), pp. 19–40.Academic Press, San Diego.
Vandermeer, J. H., and Goldberg, D. E. (2003). “Population Ecology: First Principles.” PrincetonUniv. Press, Princeton, NJ.
Wardle, D. A., Zackrisson, O., Hornberg, G., and Gallet, C. (1997). The influence of island area onecosystem properties. Science 277, 1296–1299.
Weiher, E., and Keddy, P., eds. (1999). “Ecological Assembly Rules: Perspectives, Advances, Retreats.”Cambridge Univ. Press, Cambridge, UK.
Wiens, J. A. (1997). Metapopulation dynamics and landscape ecology. In “Metapopulation Biology:Ecology, Genetics, and Evolution” (I. Hanski and M. E. Gilpin, eds.), pp. 43–61. Academic Press,San Diego.
Wilson, J. B. (1999). Guilds, functional types, and ecological groups. Oikos 86, 507–522.Woese, C. R. (1994). There must be a prokaryote somewhere: microbiology’s search for itself.
Microbiol. Rev. 58, 1–9.Wu, J., and Loucks, O. L. (1995). From balance of nature to hierarchical patch dynamics: a paradigm
shift in ecology. Q. Rev. Biol. 70, 439–466.Wu, X. L., and Conrad, R. (2001). Functional and structural response of a cellulose-degrading
methanogenic microbial community to multiple aeration stress at two different temperatures.Environ. Microbiol. 3, 355–362.
Young, J. P. W. (1998). Bacterial evolution and the nature of species. In “Advances in MolecularEcology” (G. R. Carvalho, ed.). IOS Press, Amsterdam.
References and Suggested Readings 229
Ch08-P546807.qxd 11/18/06 6:42 PM Page 229

Ch08-P546807.qxd 11/18/06 6:42 PM Page 230
9THE Physiology AND
BIOCHEMISTRY OF
SOIL ORGANISMS
W. B. McGill
Introduction
Metabolic Classifications of Soil Organisms
Examples of Soil Microbial Transformations
How Can the Microbial Contributions be Viewed in aSimplified and Unified Concept?
References
231
INTRODUCTION
Green plants release O2 during photosynthesis. Decomposition consumes O2 andthe cycle is complete. This is good. Why then has O2 accumulated in the earth’satmosphere? If O2 can accumulate, why is there not more of it? With an atmos-phere having nearly 21% by volume of O2 in the atmosphere, why does all S notaccumulate as SO4
2�, or N as NO3�, which are the thermodynamically stable
species of these elements? How is it that S2� can be oxidized to S0 or SO42� under
anaerobic (i.e., reducing) conditions? How can highly aromatic compounds such asaniline be metabolized under anaerobic conditions, and why would such a capa-bility develop in soils? Is it that many of the earth’s functions do not make sensefrom a thermodynamic or mass balance perspective? Or do they? The answersarise from three things: first, the unique attributes of soils as habitats in which aer-obic and anaerobic microsites coexist due to spatial heterogeneity over distancesof millimeters or less (see Chaps. 2 and 8) and where aerobic and anaerobic con-ditions alternate over time. So both spatial and temporal changes in soil habitatsare involved. Second, the unique range of physiological capabilities of soil organisms
Ch09-P546807.qxd 11/18/06 6:55 PM Page 231
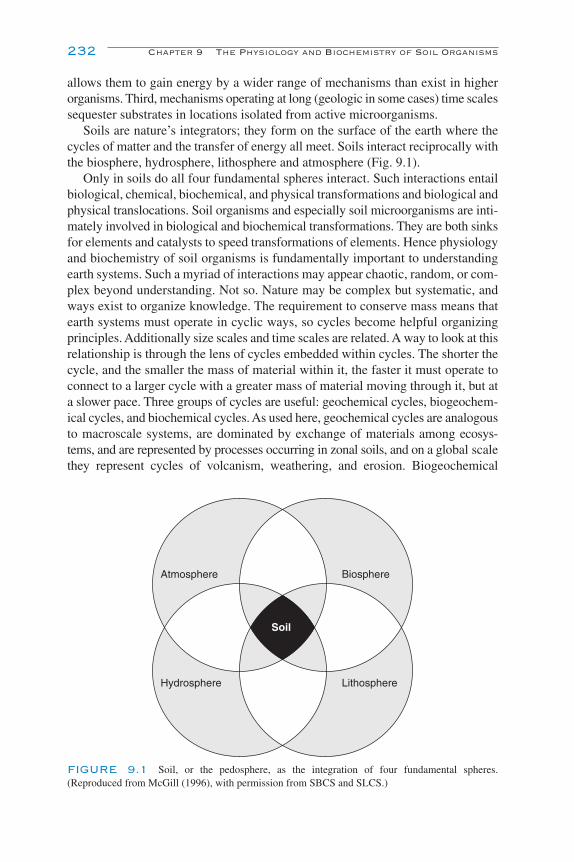
232 Chapter 9 The Physiology and Biochemistry of Soil Organisms
allows them to gain energy by a wider range of mechanisms than exist in higherorganisms. Third, mechanisms operating at long (geologic in some cases) time scalessequester substrates in locations isolated from active microorganisms.
Soils are nature’s integrators; they form on the surface of the earth where thecycles of matter and the transfer of energy all meet. Soils interact reciprocally withthe biosphere, hydrosphere, lithosphere and atmosphere (Fig. 9.1).
Only in soils do all four fundamental spheres interact. Such interactions entailbiological, chemical, biochemical, and physical transformations and biological andphysical translocations. Soil organisms and especially soil microorganisms are inti-mately involved in biological and biochemical transformations. They are both sinksfor elements and catalysts to speed transformations of elements. Hence physiologyand biochemistry of soil organisms is fundamentally important to understandingearth systems. Such a myriad of interactions may appear chaotic, random, or com-plex beyond understanding. Not so. Nature may be complex but systematic, andways exist to organize knowledge. The requirement to conserve mass means thatearth systems must operate in cyclic ways, so cycles become helpful organizingprinciples. Additionally size scales and time scales are related. A way to look at thisrelationship is through the lens of cycles embedded within cycles. The shorter thecycle, and the smaller the mass of material within it, the faster it must operate toconnect to a larger cycle with a greater mass of material moving through it, but ata slower pace. Three groups of cycles are useful: geochemical cycles, biogeochem-ical cycles, and biochemical cycles. As used here, geochemical cycles are analogousto macroscale systems, are dominated by exchange of materials among ecosys-tems, and are represented by processes occurring in zonal soils, and on a global scalethey represent cycles of volcanism, weathering, and erosion. Biogeochemical
Soil
Atmosphere
Hydrosphere Lithosphere
Biosphere
FIGURE 9.1 Soil, or the pedosphere, as the integration of four fundamental spheres.(Reproduced from McGill (1996), with permission from SBCS and SLCS.)
Ch09-P546807.qxd 11/18/06 6:55 PM Page 232
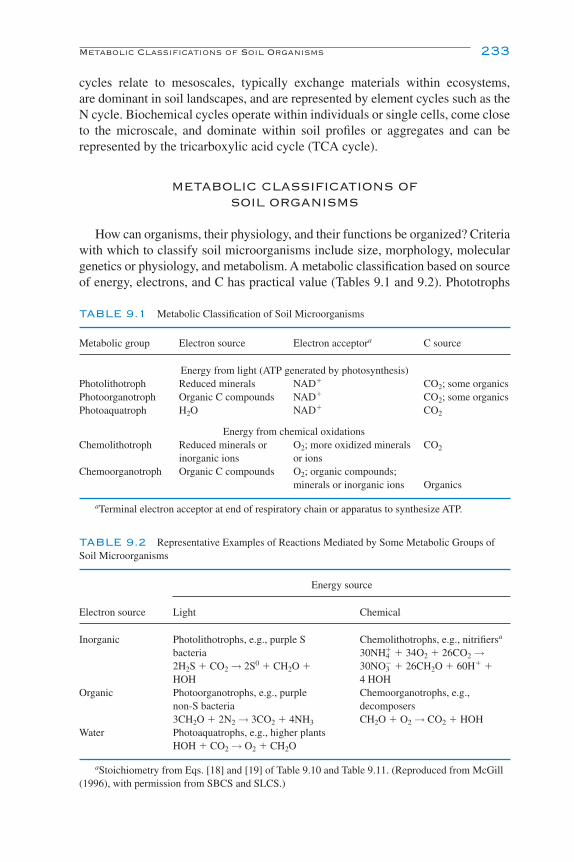
cycles relate to mesoscales, typically exchange materials within ecosystems, are dominant in soil landscapes, and are represented by element cycles such as theN cycle. Biochemical cycles operate within individuals or single cells, come closeto the microscale, and dominate within soil profiles or aggregates and can be represented by the tricarboxylic acid cycle (TCA cycle).
METABOLIC CLASSIFICATIONS OFSOIL ORGANISMS
How can organisms, their physiology, and their functions be organized? Criteriawith which to classify soil microorganisms include size, morphology, moleculargenetics or physiology, and metabolism. A metabolic classification based on sourceof energy, electrons, and C has practical value (Tables 9.1 and 9.2). Phototrophs
Metabolic Classifications of Soil Organisms 233
TABLE 9.1 Metabolic Classification of Soil Microorganisms
Metabolic group Electron source Electron acceptora C source
Energy from light (ATP generated by photosynthesis)Photolithotroph Reduced minerals NAD� CO2; some organicsPhotoorganotroph Organic C compounds NAD� CO2; some organicsPhotoaquatroph H2O NAD� CO2
Energy from chemical oxidationsChemolithotroph Reduced minerals or O2; more oxidized minerals CO2
inorganic ions or ionsChemoorganotroph Organic C compounds O2; organic compounds;
minerals or inorganic ions Organics
aTerminal electron acceptor at end of respiratory chain or apparatus to synthesize ATP.
TABLE 9.2 Representative Examples of Reactions Mediated by Some Metabolic Groups ofSoil Microorganisms
Energy source
Electron source Light Chemical
Inorganic Photolithotrophs, e.g., purple S Chemolithotrophs, e.g., nitrifiersa
bacteria 30NH4� � 34O2 � 26CO2 →
2H2S � CO2 → 2S0 � CH2O � 30NO3� � 26CH2O � 60H� �
HOH 4 HOHOrganic Photoorganotrophs, e.g., purple Chemoorganotrophs, e.g.,
non-S bacteria decomposers3CH2O � 2N2 → 3CO2 � 4NH3 CH2O � O2 → CO2 � HOH
Water Photoaquatrophs, e.g., higher plantsHOH � CO2 → O2 � CH2O
aStoichiometry from Eqs. [18] and [19] of Table 9.10 and Table 9.11. (Reproduced from McGill(1996), with permission from SBCS and SLCS.)
Ch09-P546807.qxd 11/18/06 6:55 PM Page 233

use light as an energy source; in contrast, chemotrophs use chemical forms of energy.These fundamental groups may be subdivided into organotrophs, for which theelectron source is organic; lithotrophs, for which the electron source is inorganic;or aquatrophs, for which it is water. Organisms that use an organic form of C arereferred to as heterotrophs; those that use CO2 as C source are called autotrophs.Most heterotrophs are chemoorganotrophs (e.g., Pseudomonas spp., but some suchas Rhodospirillaceae are chemophototrophs). Most autotrophs are chemolithotrophsor photolithotrophs. Some, such as the H2-oxidizing bacteria (6H2 � CO2 � 2O2 →CH2O � 5H2O), are facultative chemolithotrophs capable of growing on carbo-hydrates under aerobic conditions (see Gottschalk, 1986).
ELECTRONS AND ATP
All organisms use the energy associated with the reaction ATP → ADP � Pi toactivate reactions needed for growth and reproduction. What is the source of theATP? Formation of ATP occurs by two routes: (a) substrate-level phosphorylationor (b) electron transport phosphorylation.
SUBSTRATE-LEVEL PHOSPHORYLATION
Substrate-level phosphorylation is most significant in anaerobes, and yields ofATP are low. Consequently production of biomass is low and the production of fer-mentation intermediates for downstream metabolism by other microbes is high.Oxidation of organic molecules (removal of e� and H�) allows incorporation ofinorganic phosphate and formation of a phosphorylated intermediate. Examplesof such intermediates include 1,3-bisphosphoglycerate and phosphoenolpyruvate,both in the Embden–Myerhof–Parnas pathway, plus acetyl phosphate, in anaerobesthat form acetate (Fig. 9.2). Hydrolysis of the phosphoryl group of these interme-diates releases enough energy to form ATP when they are coupled with ADP andPi. For example, see Fig. 9.3, in which acetate kinase catalyzes the transfer of aphosphoryl group from acetyl phosphate to ADP → ATP.
234 Chapter 9 The Physiology and Biochemistry of Soil Organisms
O
P
OC
HO OH
O
CH3
O
PHO OH
OC
H2C
COHO
OH
CHCH2
OP
HO
HO
O CH2
OP
OH
O
OH
Acetyl-Phosphate Phosphoenolpyruvate 1,3 bisphosphoglycerate
FIGURE 9.2 Phosphorylated compounds involved in substrate-level phosphorylation.
Ch09-P546807.qxd 11/18/06 6:55 PM Page 234

ELECTRON TRANSPORT PHOSPHORYLATION
Electron transport phosphorylation is more important than substrate level phos-phorylation in phototrophs and aerobic and facultatively anaerobic chemotrophs.It occurs during respiration and photosynthesis. During C metabolism bychemoorganotrophs, NADH and FADH are produced from oxidation of organicsubstrates, for example in the TCA cycle. Electron transport phosphorylation entailstransfer of electrons from donors such as NADH (or FADH) with a negative redoxpotential to acceptors such as O2 with a less negative or positive redox potential.The associated energy change is coupled to the phosphorylation of ADP � Pi →ATP. Electron transport phosphorylation is associated with membranes.
Given that ATP is used to energize soil microbial biomass formation, how muchATP is produced during oxidation of a fixed amount of substrate? Understandingthe relationship between substrate oxidized, O2 consumed or electrons (e�) trans-ferred, and ATP formed helps us understand carbon utilization efficiency (CUE;ratio of C consumed/C converted to biomass) on one hand or quantities of alter-nate electron acceptors needed on the other. The CUE in turn helps regulate ele-mental dynamics; for example, N mineralization increases and N immobilizationdecreases as CUE decreases. Similarly, as the amount of ATP produced per moleof e� decreases, there is an associated increase in the number of moles of O2 neededto generate a fixed amount of ATP, or alternate electron acceptor (e.g., NO3
�),needed in the absence of O2.
Under aerobic conditions, each mole of NADH or FADH carries 2e� and each2e� reduce one atom of O. Therefore under aerobic conditions ATP productionfrom electron transport phosphorylation with O2 as the electron acceptor can beequated to electrons released or atoms of O consumed. If O is not the terminal elec-tron acceptor, then ATP production from electron transport phosphorylation canbe equated only to electrons released. The ratio of ATP production to e� releasedor atoms of O consumed may be designated the P/O or P/2e� ratio, under aerobicconditions, or P/2e� ratio when O2 is not the terminal electron acceptor.
Metabolic Classifications of Soil Organisms 235
O
POHHO
OOC
CH3
P
O
O�O�O
P
N
NN
N
NH2O�
O
O
CH2 O
HHOHOH
H
P
O
�O
OO
P
N
NN
N
NH2O�
O
O
P
O�
O�O
H
CH2 O
HHOHOH
H H
Acetyl-Phosphate Adenosine-51-diphosphate Adenosine-51-triphosphate
�
�
OC
CH3
O�
Acetate
FIGURE 9.3 Example of substrate-level phosphorylation using acetyl phosphate.
Ch09-P546807.qxd 11/18/06 6:55 PM Page 235

The P/O or P/2e� ratio may be estimated using either a general rule or slightlymore detailed calculations. We will consider the general rule first, followed by amore detailed example. Generally the oxidation of 1 mol of NADH is consideredto generate 3 mol of ATP, and oxidation of 1 mol of FADH generates 2 mol of ATP.Expressed as a ratio of ATP/NADH or ATP/FADH one gets:
.
Expressed as P/O ratio the above ratios become:
for NADH � H� oxidized by O2 and
for FADH � H� oxidized by O2.
Consider the TCA cycle, which generates 3 NADH � H�, 1 FADH � H�, and1 ATP. According to the general rule the expected ATP production in the TCA cyclebecomes:
From NADH � H�: 3 � 3 � 9 mol ATP
From FADH � H�: 1 � 2 � 2 mol ATP
Substrate-level phosphorylation: 1 � 1 mol ATP
Total: 12 mol ATP per turn of the cycle
Each turn of the cycle releases 2 mol of CO2, consumes 2 mol of O2 or 4 atomsof O, and releases 8 electrons. Given the classical concept that each turn of the cycleproduces 12 mol of ATP as above, the classical P/O ratio for the entire TCA cyclebecomes:
The above general simplification, however, does not accommodate the varietyof arrangements that may exist in membranes for electron transport phosphoryla-tion. Therefore a more detailed or mechanistic calculation can be based on thechemiosmotic theory (Fig. 9.4).
According to this theory electrons are passed from donors such as NADH toredox receptors in respiratory complexes within the inner membrane of mito-chondria or the plasma membrane of bacterial cells. The redox receptors are con-nected in a series of couples within up to four of these complexes. Reduction ofsome redox receptors draws an H� ion from the cytoplasm (n phase of the mem-brane). As it flips to the reduced state, the H� is extruded to the periplasmic space(p phase), thereby increasing the H� concentration in the periplasm. As thisprocess continues a gradient of H� develops across the membrane with a high
P
O
ATP
O� �
12
43.
P
O� 2
P
O� 3
3 2ATP
NADH
ATP
FADHand
236 Chapter 9 The Physiology and Biochemistry of Soil Organisms
Ch09-P546807.qxd 11/18/06 6:55 PM Page 236

concentration in the p phase compared to the n phase. Consequently an electricalpotential, or proton motive force (∆P), is developed to drive H� from the p to then phase through the ATP synthase complex. (Think of all those lonely expelledH� ions anxious to get back to their mates.) The energy released in this process is
Metabolic Classifications of Soil Organisms 237
Red
Red
Red
Red
Red
Red
Red
Ox
Ox
Ox
Ox
Ox
Ox
Ox
Membrane
HFlav-Prot
HFlav-Prot
e�
Fe-S-Prot
e�
Cyt b556
e�
Cyt o
e�
Fe-S-Prot
HCo-Enz Q
2H�� 2e�
(NADH + H�)
2H�
2H�
2H�
2H�
2H�
2e�
4H�
4H�
Protonpump
Q cycle
Loop
1/202 + 2H�
2�4H�
H2O
ADP�Pi
ATP Synthase
ATP
FIGURE 9.4 Schematic outline of the functional arrangement of components of the electrontransport chain in the inner membrane according to the chemiosmotic theory. The “loop,” “Q-cycle,”and “proton pump” mechanisms for H� exclusion are represented. Not all parts are always present.This would be typical of many aerobic chemoorganotrophic soil microorganisms. For further detailssee Gottschalk (1986) and Nicholls and Ferguson (1992).
Ch09-P546807.qxd 11/18/06 6:55 PM Page 237

used to form ATP from ADP. Consequently the production of ATP per mole of O2
consumed or per 2e� released is determined first by the number of redox couplesin the membrane, which determines the moles of H� extruded to the p phase, andsecond by the number of moles of H� that must be driven from the p to the nphase through the ATP synthase complex to produce a mole of ATP. The productof these two ratios determines the actual P/O ratio:
. (1)
The electron transport chain contains up to four complexes involved in H�
extrusion and electron transport. The number of such complexes through whichthe electrons flow for a particular electron source determines the value of theH�/2e� ratio as schematically represented in Fig. 9.4. The H�/2e� ratio appears tovary from 10 for NADH oxidized by O2 to 6 for FADH oxidized by O2 (Nichollsand Ferguson, 1992). Considering that the ATP/H� ratio appears often to be closeto 4 (Nicholls and Ferguson, 1992) we can calculate the P/O ratio using Eq. (1).Consequently the P/O ratio may be:
for NADH � H� oxidized by O2 and
for FADH � H� oxidized by O2.
The ATP produced per turn of the TCA cycle can now be calculated using thesevalues derived from the more mechanistic chemiosmotic theory. Specifically wenow get 3 � 2.5 � 7.5 mol of ATP from NADH � H�, 1 � 1.5 � 1.5 mol ATPfrom FADH � H�, and 1 mol of ATP from substrate-level phosphorylation. Giventhe values above from the chemiosmotic theory each turn of the cycle produces7.5 � 1.5 � 1 � 10 mol of ATP per turn of the TCA cycle. The more detailed P/Oratio for the entire TCA cycle now becomes:
.
OVERVIEW OF MECHANISMS TO GENERATE ATP ANDREDUCING EQUIVALENTS
Four variations on the theme in Fig. 9.4 are used to generate ATP and reducingequivalents in phototrophic and aerobic chemotrophic organisms (Fig. 9.5).
In Fig. 9.5A, electron transport through the respiratory chain to Box generates the∆P (proton motive force) needed to synthesize ATP (e.g., chemoorganotrophs such
P
O
H
e
ATP
H� � � � �
�
�26
1
41.5
P
O
H
e
ATP
H� � � � �
�
�26
1
41.5
P
O
H
e
ATP
H� � � � �
�
�210
1
42.5
P
O
H
e
ATP
H� �
�
�2
238 Chapter 9 The Physiology and Biochemistry of Soil Organisms
Ch09-P546807.qxd 11/18/06 6:55 PM Page 238
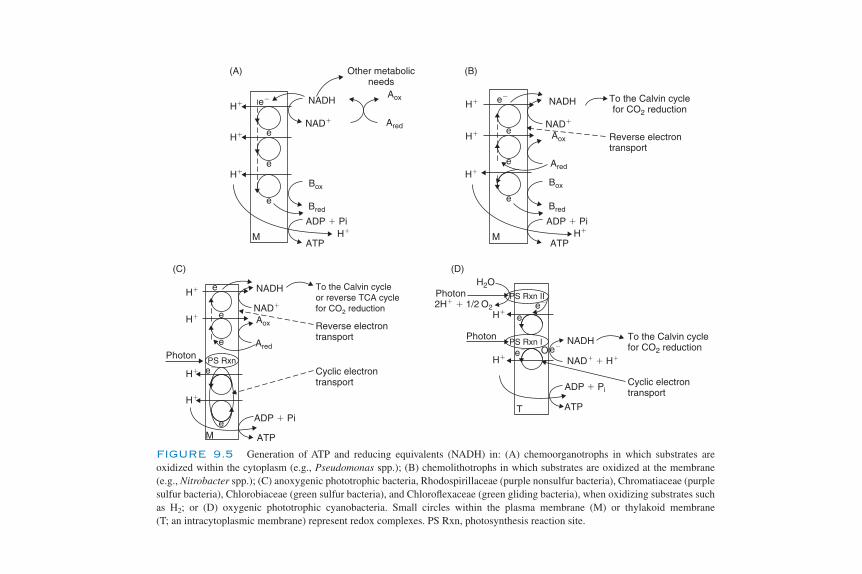
(A) (B)
H� NADH
H�
H�
H�
NAD�
Other metabolicneeds
Aox
Ared
Box
Bred
ADP � Pi
ATPM
e�
e
e
e
H�
H�
H�
H�
NADH
NAD�
Aox
Ared
Box
Bred
ADP � Pi
ATPM
To the Calvin cyclefor CO2 reduction
Reverse electrontransport
e�
e
e
e
(C)
H�
H�
H�
H�
NADH
NAD�
Aox
Ared
ADP � Pi
ATPM
To the Calvin cycle or reverse TCA cyclefor CO2 reduction
Reverse electrontransport
Cyclic electrontransport
Photon
e-
e
e
e�
e
PS Rxn
(D)H2O
NADH
NAD� � H�
ADP � Pi
ATPT
To the Calvin cyclefor CO2 reduction
Cyclic electrontransport
Photon
Photone�
e� Oe�
e
PS Rxn I
PS Rxn II
H�
H�
2H� � 1/2 O2
FIGURE 9.5 Generation of ATP and reducing equivalents (NADH) in: (A) chemoorganotrophs in which substrates are oxidized within the cytoplasm (e.g., Pseudomonas spp.); (B) chemolithotrophs in which substrates are oxidized at the membrane(e.g., Nitrobacter spp.); (C) anoxygenic phototrophic bacteria, Rhodospirillaceae (purple nonsulfur bacteria), Chromatiaceae (purplesulfur bacteria), Chlorobiaceae (green sulfur bacteria), and Chloroflexaceae (green gliding bacteria), when oxidizing substrates suchas H2; or (D) oxygenic phototrophic cyanobacteria. Small circles within the plasma membrane (M) or thylakoid membrane(T; an intracytoplasmic membrane) represent redox complexes. PS Rxn, photosynthesis reaction site.
Ch09-P546807.qxd 11/18/06 6:55 PM Page 239

as Pseudomonas spp.). Reducing equivalents (NADH) are produced by oxidationof substrates within the cytoplasm. In Fig. 9.5B, reverse electron transport is usedto generate NADH, which is used to reduce CO2 in the Calvin cycle. Electrontransport through the respiratory chain to Box generates the ∆P needed both tosynthesize ATP and to drive reverse electron transport (e.g., chemolithotrophssuch as Nitrobacter).
Photosynthesis is the ultimate source of energy to allow soil organisms towork. Photosynthesis requires no oxygen (although it may partially cycle O2) andmay or may not generate O2. If photosynthesis uses HOH as an electron donor, as itdoes for photoaquatrophs, then it generates O2 and is called oxygenic photosynthe-sis (Table 9.3; Eq. [1]).1 Photosynthesis that uses a reduced mineral such as H2S aselectron donor, as is the case with photolithotrophs, produces S0 (Eq. [2]) (or SO4
2�;Eq. [3]), which is called anoxygenic photosynthesis (Staley and Orians, 1992).
All anoxygenic photosynthetic organisms represented in Fig. 9.5C can use H2 asH donor; in addition the purple nonsulfur bacteria (Rhodospirillaceae) and the greengliding bacteria (Chloroflexaceae) can use organic substrates, the purple sulfurbacteria (Chromatiaceae) can use H2S and organic substrates, and the green sulfurbacteria (Chlorobiaceae) can use H2S, but not organic substrates. Photon activa-tion of electrons in the photosynthesis reaction site (PS Rxn) generates cyclictransfer of electrons through a series of redox couples, resulting in formation ofATP, and eventually the electron returns to its ground state and to the PS Rxn site.NAD� is reduced using reverse electron transfer driven by ∆P generated fromphotosynthesis. Subsequent transhydrogenation allows NADH to reduce
240 Chapter 9 The Physiology and Biochemistry of Soil Organisms
TABLE 9.3 Anoxygenic and Oxygenic Photosynthesis
Oxygenic photosynthesis, e.g., Panicum, Nostoc
hυ � 2HOH � 3(ADP � Pi) → 4e� � 4H� � O2 � 3ATP3ATP � CO2 � 4e� � 4H� → CH2O � HOH � 3(ADP � Pi)
Overall: hυ � CO2 � HOH → CH2O � O2 [1]
Anoxygenic photosynthesis, e.g., Chromatium (purple S bacteria)
2H2S → 2S0 � 4e� � 4H�
hυ � pigment → [pigment� � e�]a
3(ADP � Pi) � [pigment� � e�]a → 3ATP � pigment3ATP � CO2 � 4e� � 4H� → CH2O � HOH � 3(ADP � Pi)
Overall: hυ � CO2 � 2H2S → CH2O � 2S0 � HOH [2]
Or overall: hυ � 3CO2 � 2S0 � 5HOH → 2SO42� � 3CH2O � 4H� [3]
aComplex including several components of the photosynthetic system and the respiratory chain.(Reproduced from McGill (1996), with permission from SBCS and SLCS.)
1Numbers in square brackets refer to equation numbers in the tables.
Ch09-P546807.qxd 11/18/06 6:55 PM Page 240
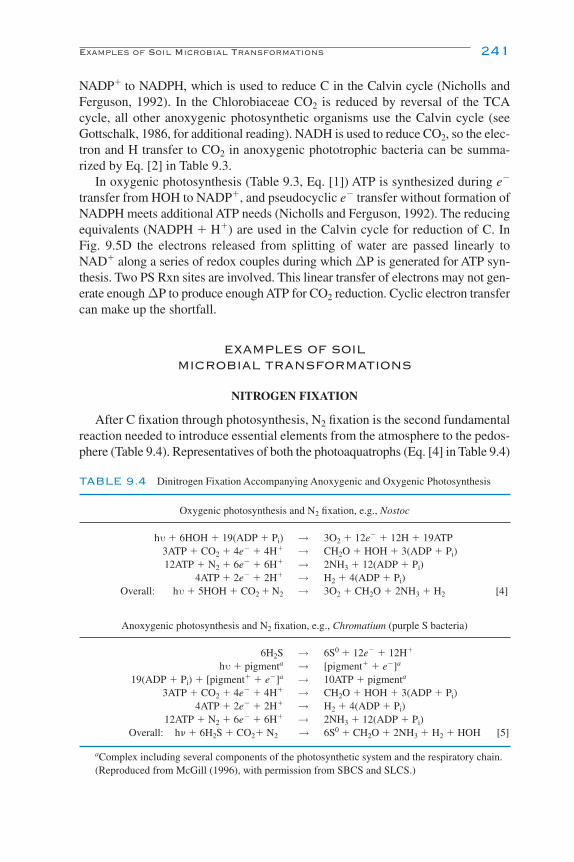
NADP� to NADPH, which is used to reduce C in the Calvin cycle (Nicholls andFerguson, 1992). In the Chlorobiaceae CO2 is reduced by reversal of the TCAcycle, all other anoxygenic photosynthetic organisms use the Calvin cycle (seeGottschalk, 1986, for additional reading). NADH is used to reduce CO2, so the elec-tron and H transfer to CO2 in anoxygenic phototrophic bacteria can be summa-rized by Eq. [2] in Table 9.3.
In oxygenic photosynthesis (Table 9.3, Eq. [1]) ATP is synthesized during e�
transfer from HOH to NADP�, and pseudocyclic e� transfer without formation ofNADPH meets additional ATP needs (Nicholls and Ferguson, 1992). The reducingequivalents (NADPH � H�) are used in the Calvin cycle for reduction of C. InFig. 9.5D the electrons released from splitting of water are passed linearly toNAD� along a series of redox couples during which ∆P is generated for ATP syn-thesis. Two PS Rxn sites are involved. This linear transfer of electrons may not gen-erate enough ∆P to produce enough ATP for CO2 reduction. Cyclic electron transfercan make up the shortfall.
EXAMPLES OF SOIL MICROBIAL TRANSFORMATIONS
NITROGEN FIXATION
After C fixation through photosynthesis, N2 fixation is the second fundamentalreaction needed to introduce essential elements from the atmosphere to the pedos-phere (Table 9.4). Representatives of both the photoaquatrophs (Eq. [4] in Table 9.4)
Examples of Soil Microbial Transformations 241
TABLE 9.4 Dinitrogen Fixation Accompanying Anoxygenic and Oxygenic Photosynthesis
Oxygenic photosynthesis and N2 fixation, e.g., Nostoc
hυ � 6HOH � 19(ADP � Pi) → 3O2 � 12e� � 12H � 19ATP3ATP � CO2 � 4e� � 4H� → CH2O � HOH � 3(ADP � Pi)12ATP � N2 � 6e� � 6H� → 2NH3 � 12(ADP � Pi)
4ATP � 2e� � 2H� → H2 � 4(ADP � Pi)Overall: hυ � 5HOH � CO2 � N2 → 3O2 � CH2O � 2NH3 � H2 [4]
Anoxygenic photosynthesis and N2 fixation, e.g., Chromatium (purple S bacteria)
6H2S → 6S0 � 12e� � 12H�
hυ � pigmenta → [pigment� � e�]a
19(ADP � Pi) � [pigment� � e�]a → 10ATP � pigmenta
3ATP � CO2 � 4e� � 4H� → CH2O � HOH � 3(ADP � Pi)4ATP � 2e� � 2H� → H2 � 4(ADP � Pi)
12ATP � N2 � 6e� � 6H� → 2NH3 � 12(ADP � Pi)Overall: h� � 6H2S � CO2� N2 → 6S0 � CH2O � 2NH3 � H2 � HOH [5]
aComplex including several components of the photosynthetic system and the respiratory chain.(Reproduced from McGill (1996), with permission from SBCS and SLCS.)
Ch09-P546807.qxd 11/18/06 6:55 PM Page 241
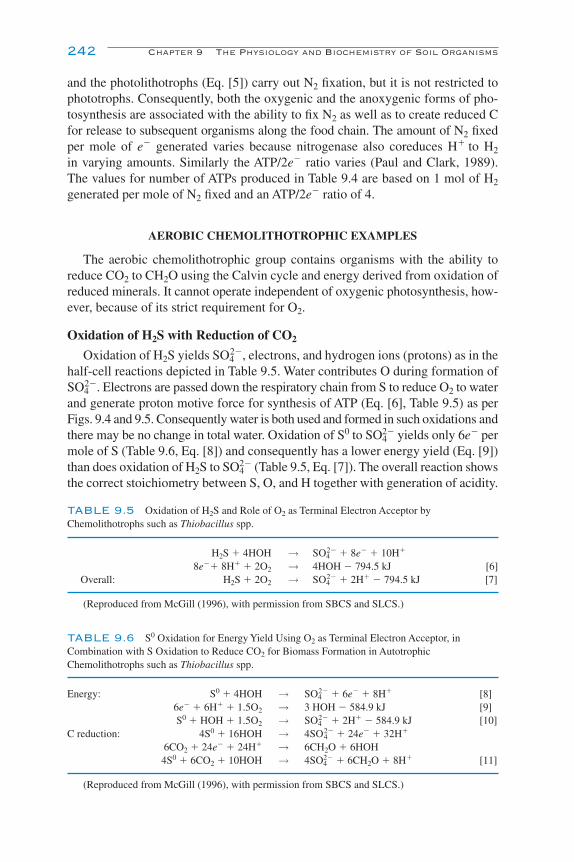
and the photolithotrophs (Eq. [5]) carry out N2 fixation, but it is not restricted tophototrophs. Consequently, both the oxygenic and the anoxygenic forms of pho-tosynthesis are associated with the ability to fix N2 as well as to create reduced Cfor release to subsequent organisms along the food chain. The amount of N2 fixedper mole of e� generated varies because nitrogenase also coreduces H� to H2
in varying amounts. Similarly the ATP/2e� ratio varies (Paul and Clark, 1989).The values for number of ATPs produced in Table 9.4 are based on 1 mol of H2
generated per mole of N2 fixed and an ATP/2e� ratio of 4.
AEROBIC CHEMOLITHOTROPHIC EXAMPLES
The aerobic chemolithotrophic group contains organisms with the ability toreduce CO2 to CH2O using the Calvin cycle and energy derived from oxidation ofreduced minerals. It cannot operate independent of oxygenic photosynthesis, how-ever, because of its strict requirement for O2.
Oxidation of H2S with Reduction of CO2
Oxidation of H2S yields SO42�, electrons, and hydrogen ions (protons) as in the
half-cell reactions depicted in Table 9.5. Water contributes O during formation ofSO4
2�. Electrons are passed down the respiratory chain from S to reduce O2 to waterand generate proton motive force for synthesis of ATP (Eq. [6], Table 9.5) as perFigs. 9.4 and 9.5. Consequently water is both used and formed in such oxidations andthere may be no change in total water. Oxidation of S0 to SO4
2� yields only 6e� permole of S (Table 9.6, Eq. [8]) and consequently has a lower energy yield (Eq. [9])than does oxidation of H2S to SO4
2� (Table 9.5, Eq. [7]). The overall reaction showsthe correct stoichiometry between S, O, and H together with generation of acidity.
242 Chapter 9 The Physiology and Biochemistry of Soil Organisms
TABLE 9.5 Oxidation of H2S and Role of O2 as Terminal Electron Acceptor byChemolithotrophs such as Thiobacillus spp.
H2S � 4HOH → SO42� � 8e� � 10H�
8e�� 8H� � 2O2 → 4HOH � 794.5 kJ [6]Overall: H2S � 2O2 → SO4
2� � 2H� � 794.5 kJ [7]
(Reproduced from McGill (1996), with permission from SBCS and SLCS.)
TABLE 9.6 S0 Oxidation for Energy Yield Using O2 as Terminal Electron Acceptor, inCombination with S Oxidation to Reduce CO2 for Biomass Formation in AutotrophicChemolithotrophs such as Thiobacillus spp.
Energy: S0 � 4HOH → SO42� � 6e� � 8H� [8]
6e� � 6H� � 1.5O2 → 3 HOH � 584.9 kJ [9]S0 � HOH � 1.5O2 → SO4
2� � 2H� � 584.9 kJ [10]C reduction: 4S0 � 16HOH → 4SO4
2� � 24e� � 32H�
6CO2 � 24e� � 24H� → 6CH2O � 6HOH4S0 � 6CO2 � 10HOH → 4SO4
2� � 6CH2O � 8H� [11]
(Reproduced from McGill (1996), with permission from SBCS and SLCS.)
Ch09-P546807.qxd 11/18/06 6:55 PM Page 242
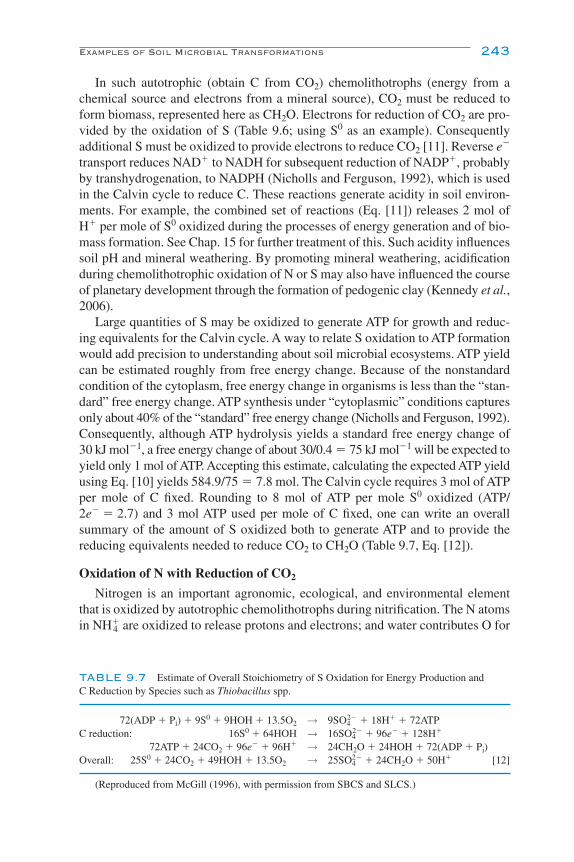
In such autotrophic (obtain C from CO2) chemolithotrophs (energy from achemical source and electrons from a mineral source), CO2 must be reduced toform biomass, represented here as CH2O. Electrons for reduction of CO2 are pro-vided by the oxidation of S (Table 9.6; using S0 as an example). Consequentlyadditional S must be oxidized to provide electrons to reduce CO2 [11]. Reverse e�
transport reduces NAD� to NADH for subsequent reduction of NADP�, probablyby transhydrogenation, to NADPH (Nicholls and Ferguson, 1992), which is usedin the Calvin cycle to reduce C. These reactions generate acidity in soil environ-ments. For example, the combined set of reactions (Eq. [11]) releases 2 mol ofH� per mole of S0 oxidized during the processes of energy generation and of bio-mass formation. See Chap. 15 for further treatment of this. Such acidity influencessoil pH and mineral weathering. By promoting mineral weathering, acidificationduring chemolithotrophic oxidation of N or S may also have influenced the courseof planetary development through the formation of pedogenic clay (Kennedy et al.,2006).
Large quantities of S may be oxidized to generate ATP for growth and reduc-ing equivalents for the Calvin cycle. A way to relate S oxidation to ATP formationwould add precision to understanding about soil microbial ecosystems. ATP yieldcan be estimated roughly from free energy change. Because of the nonstandardcondition of the cytoplasm, free energy change in organisms is less than the “stan-dard” free energy change. ATP synthesis under “cytoplasmic” conditions capturesonly about 40% of the “standard” free energy change (Nicholls and Ferguson, 1992).Consequently, although ATP hydrolysis yields a standard free energy change of30 kJ mol�1, a free energy change of about 30/0.4 � 75 kJ mol�1 will be expected toyield only 1 mol of ATP. Accepting this estimate, calculating the expected ATP yieldusing Eq. [10] yields 584.9/75 � 7.8 mol. The Calvin cycle requires 3 mol of ATPper mole of C fixed. Rounding to 8 mol of ATP per mole S0 oxidized (ATP/2e� � 2.7) and 3 mol ATP used per mole of C fixed, one can write an overall summary of the amount of S oxidized both to generate ATP and to provide thereducing equivalents needed to reduce CO2 to CH2O (Table 9.7, Eq. [12]).
Oxidation of N with Reduction of CO2
Nitrogen is an important agronomic, ecological, and environmental elementthat is oxidized by autotrophic chemolithotrophs during nitrification. The N atomsin NH4
� are oxidized to release protons and electrons; and water contributes O for
Examples of Soil Microbial Transformations 243
TABLE 9.7 Estimate of Overall Stoichiometry of S Oxidation for Energy Production andC Reduction by Species such as Thiobacillus spp.
72(ADP � Pi) � 9S0 � 9HOH � 13.5O2 → 9SO42� � 18H� � 72ATP
C reduction: 16S0 � 64HOH → 16SO42� � 96e� � 128H�
72ATP � 24CO2 � 96e� � 96H� → 24CH2O � 24HOH � 72(ADP � Pi)Overall: 25S0 � 24CO2 � 49HOH � 13.5O2 → 25SO4
2� � 24CH2O � 50H� [12]
(Reproduced from McGill (1996), with permission from SBCS and SLCS.)
Ch09-P546807.qxd 11/18/06 6:55 PM Page 243

formation of NO2� (Table 9.8). The O2 is the terminal electron acceptor and reacts
with electrons and H� to form water [13]. Transport of the electrons and H� downthe respiratory chain for final reaction with O2 to form water generates the protonmotive force used to synthesize ATP. The H� in excess of that used in reactingwith O2 and electrons to form water is released to the environment, causing acid-ification [14]. Reverse e� transport is used to transfer e� from NH 4
� to NADH asin S0 oxidation. Large amounts of NH4
� must be oxidized, and large amounts ofH� are released into the environment during N oxidation from NH4
� to NO3�
(nitrification) to reduce CO2 for CH2O production [15]. In contrast, H� is notreleased during oxidation of NO2
� to NO3� (Table 9.9, Eq. [16]). Consequently one
should not conclude that all chemolithotrophic oxidation reactions releaseH� into the soil environment.
As with S oxidation, it is instructive to estimate how much N must be oxidizedto provide energy to synthesize microbial biomass of nitrifiers. To this end thequantities of N that would be oxidized for combined energy and C reduction byNitrosomonas spp. are estimated in Table 9.10 and for Nitrobacter spp. in Table9.11. From Eq. [14] there could be 270.7/75 � 3.6 mol ATP mol�1 of NH 4
� oxi-dized (ATP/2e� � 1.2). The net estimate is that 12 mol of H� are released, and4 mol of C are reduced for every 6 mol of NH4
� oxidized to NO2� (Eq. [18]). This
NO2� rarely accumulates in soil; it is further oxidized to NO3
� (Eq. [19]). Lessenergy is obtained by oxidizing a mole of NO2
� (Eq. [16]) than is obtained by oxidizing a mole of NH4
� (Eq. [14]). This partly reflects the smaller number of
244 Chapter 9 The Physiology and Biochemistry of Soil Organisms
TABLE 9.9 Oxidation of NO2� (Nitrite) for Energy Yield Using O2 as Terminal Electron
Acceptor, in Combination with NO2��N Oxidation to Reduce CO2 for Biomass Formation in
Autotrophic Chemolithotrophs such as Nitrobacter spp.
Energy: NO2� � HOH → NO3
� � 2e� � 2H�
2e� � 2H� �0.5O2 → HOH � 77.4 kJNO2
� � 0.5O2 → NO3� � 77.4 kJ [16]
C reduction: 2NO2� � 2HOH → 2NO3
� � 4e� � 4H�
ATP � CO2 � 4e� � 4H� → CH2O � HOHATP � 2NO2
� � CO2 � HOH → 2NO3� � CH2O
3NO2� � CO2 � 0.5O2 � HOH → 3NO3
� � CH2O [17]
(Reproduced from McGill (1996), with permission from SBCS and SLCS.)
TABLE 9.8 NH4� Oxidation both for Energy and for Reduction of CO2 in Autotrophic
Chemolithotrophs such as Nitrosomonas spp.
Energy: NH4� � 2HOH → NO2
� � 6e� � 8H�
6e� � 6H� �1.5O2 → 3HOH � 270.7 kJ [13]NH4
� � 1.5O2 → NO2� � HOH � 2H� � 270.7 kJ [14]
C reduction: 4NH4� � 8HOH → 4NO2
� � 24e� � 32H�
6CO2 � 24e� � 24H� → 6CH2O � 6HOH4NH4
�� 6CO2 � 2HOH → 4NO2� � 6CH2O � 8H� [15]
(Reproduced from McGill (1996), with permission from SBCS and SLCS.)
Ch09-P546807.qxd 11/18/06 6:55 PM Page 244
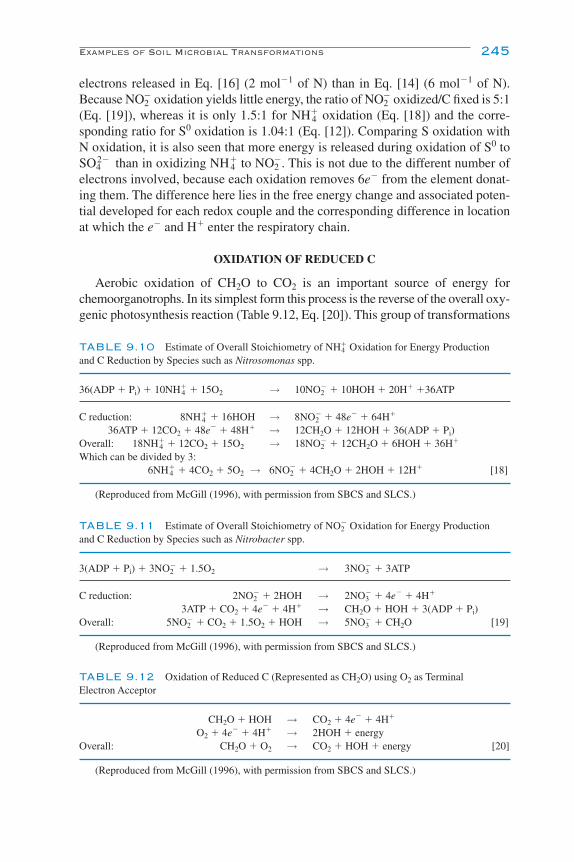
electrons released in Eq. [16] (2 mol�1 of N) than in Eq. [14] (6 mol�1 of N).Because NO2
� oxidation yields little energy, the ratio of NO2� oxidized/C fixed is 5:1
(Eq. [19]), whereas it is only 1.5:1 for NH4� oxidation (Eq. [18]) and the corre-
sponding ratio for S0 oxidation is 1.04:1 (Eq. [12]). Comparing S oxidation withN oxidation, it is also seen that more energy is released during oxidation of S0 toSO4
2� than in oxidizing NH4� to NO2
�. This is not due to the different number ofelectrons involved, because each oxidation removes 6e� from the element donat-ing them. The difference here lies in the free energy change and associated poten-tial developed for each redox couple and the corresponding difference in locationat which the e� and H� enter the respiratory chain.
OXIDATION OF REDUCED C
Aerobic oxidation of CH2O to CO2 is an important source of energy forchemoorganotrophs. In its simplest form this process is the reverse of the overall oxy-genic photosynthesis reaction (Table 9.12, Eq. [20]). This group of transformations
Examples of Soil Microbial Transformations 245
TABLE 9.10 Estimate of Overall Stoichiometry of NH4� Oxidation for Energy Production
and C Reduction by Species such as Nitrosomonas spp.
36(ADP � Pi) � 10NH4� � 15O2 → 10NO2
� � 10HOH � 20H� �36ATP
C reduction: 8NH4� � 16HOH → 8NO2
� � 48e� � 64H�
36ATP � 12CO2 � 48e� � 48H� → 12CH2O � 12HOH � 36(ADP � Pi)Overall: 18NH4
� � 12CO2 � 15O2 → 18NO2� � 12CH2O � 6HOH � 36H�
Which can be divided by 3:6NH4
� � 4CO2 � 5O2 → 6NO2� � 4CH2O � 2HOH � 12H� [18]
(Reproduced from McGill (1996), with permission from SBCS and SLCS.)
TABLE 9.11 Estimate of Overall Stoichiometry of NO2� Oxidation for Energy Production
and C Reduction by Species such as Nitrobacter spp.
3(ADP � Pi) � 3NO2� � 1.5O2 → 3NO3
� � 3ATP
C reduction: 2NO2� � 2HOH → 2NO3
� � 4e� � 4H�
3ATP � CO2 � 4e� � 4H� → CH2O � HOH � 3(ADP � Pi)Overall: 5NO2
� � CO2 � 1.5O2 � HOH → 5NO3� � CH2O [19]
(Reproduced from McGill (1996), with permission from SBCS and SLCS.)
TABLE 9.12 Oxidation of Reduced C (Represented as CH2O) using O2 as Terminal Electron Acceptor
CH2O � HOH → CO2 � 4e� � 4H�
O2 � 4e� � 4H� → 2HOH � energyOverall: CH2O � O2 → CO2 � HOH � energy [20]
(Reproduced from McGill (1996), with permission from SBCS and SLCS.)
Ch09-P546807.qxd 11/18/06 6:56 PM Page 245

also includes oxidation of N- or S-containing organic molecules as a source ofenergy. Oxidation of L-glutamic acid is one example. Such oxidations to yieldenergy are responsible for mineralization reactions that release plant nutrientssuch as NH4
� (Table 9.13). In Table 9.12, oxidation of 1 mol of C as CH2O gener-ates 4e�, whereas in Table 9.13, oxidation of 1 mol of C as L-glutamic acid gen-erates only 3.4e�. Consequently the amount of ATP synthesized from theoxidation of 1 mol of C from L-glutamate would be expected to be less than dur-ing the oxidation of 1 mol of C from glucose. Such N-containing energy sourcesare less energetically favorable than pure carbohydrates or lipids. In turn aminoacids are best reserved for protein biosynthesis. The search for energy at theexpense of N-containing organic molecules (Eq. [21]) in the absence of moreenergetically favorable alternatives is the basis for much of the N supply to cropsfrom decomposition of humus, plant residues, and manures.
A wide array of substrates is metabolized under anaerobic conditions: sugars;organic, fatty, and amino acids; purine and pyrimidine bases; heterocyclic com-pounds; and polymers such as polysaccharides, proteins, and lipids. Lignin and sat-urated hydrocarbons are more recalcitrant under anaerobic conditions but ringoxygenation can be achieved by some anaerobes using O from HOH. Under anaer-obic conditions, mechanisms to generate energy vary from use of external electronacceptors other than O2 to using no external electron acceptors.
Use of oxidized minerals as alternate external electron acceptors leads toreduction of oxidized elements. O2 prevents reduction of NO3
�, SO42�, and N2;
however, it is a major product from oxygenic photosynthesis. Hence environ-ments must exist from which O2 is excluded or in which it is consumed faster thanit can diffuse into them. Soils are uniquely suited to provide such micrositeswithin aggregates even under well-aerated conditions (see Chaps. 2 and 8).Consequently, anaerobic–aerobic environments must function in sequence form-ing a syntrophic system. A syntrophic system may be defined as one in which twoor more species of organisms with contrasting characteristics require each other inorder to function or survive. For example, one species may produce a product orenvironmental condition that is essential for a second species, which in turn pro-duces a product or condition essential for the first. In the case of the above soil sit-uation, the anaerobic portion of the environment and the organisms in it generatesreduced minerals from oxidized forms; the aerobic portion generates O2 and
246 Chapter 9 The Physiology and Biochemistry of Soil Organisms
TABLE 9.13 Oxidation of N-Containing Organic Molecules to CO2 as a Way to ObtainEnergy
2(C5NH8O4) � 2HOH → 2NH3 � 2(C5H4O5) � 6H� � 6e�
2(C5H4O5) � 10HOH → 10CO2 � 28H� � 28e�
34H� �34 e� � 8.5O2 → 17HOH � energyOverall: 2(C5NH8O4) � 8.5O2 → 2NH3 � 10CO2 � 5HOH � energy [21]
L-Glutamic acid oxidation via α-ketoglutaric acid is used as an example.(Reproduced from McGill (1996), with permission from SBCS and SLCS.)
Ch09-P546807.qxd 11/18/06 6:56 PM Page 246

oxidized minerals from reduced forms. The sequence of aerobic–anaerobic envi-ronments may be organized either temporally or spatially. Oxidized products aretypical of the oxygenic cycle. Without a way to reduce such materials, the systemwould stop. The anaerobic phase, which shares elements with the anoxygeniccycle, reduces oxidized minerals to allow completion of the cycle (Table 9.14).A vast array of elements is reduced this way (Ehrlich, 1993) with N as NO3
�, S asSO4
2�, and C as CO2 as frequent examples.Reduction of oxidized forms of elements serves diverse purposes designated
by specific terms. For example NO3� may be reduced for two distinctly different
reasons. The first is for incorporation into monomers such as amino acids andassimilation into polymers such as protein, which is called assimilatory NO3
�
reduction. The second is to use NO3� as a terminal electron acceptor in electron
transport phosphorylation, which is termed dissimilatory NO3� reduction because
the N is not assimilated. Alternatively it is called nitrate respiration because of itsparallel to oxygen respiration. When dissimilatory NO3
� reduction leads to N2 pro-duction it is called denitrification (see Chap. 13 for further coverage of denitrifi-cation). When it leads to NH3, it is called dissimilatory NO3
� reduction to NH3.Similar distinctions apply to reduction of oxidized forms of S, such that assimila-tory S reduction leads to incorporation of S into amino acids or other monomericbuilding blocks and eventually into biomass. On the other hand, S may be reducedas a terminal electron acceptor during oxidation of C, in which case it is calleddissimilatory S reduction.
Two important distinctions exist between organisms responsible for oxidizingreduced C using NO3
� as a terminal electron acceptor (Table 9.14, Eq. [22]) and thosethat oxidize C using SO4
2� as an electron acceptor (termed dissimilatory SO42�
reduction or sometimes SO42� respiration; Eq. [23]). First, NO3
� respiration ismediated by facultative anaerobes (e.g., Pseudomonas denitrificans), whereasSO4
2� respiration is mediated by strict anaerobes (e.g., Desulfovibrio desulfuricans).Second, the free energy change and ATP/2e� ratio is greater for NO3
� respiration thanfor SO4
2� respiration (Gottschalk, 1986). Because of these differences some peopleprefer to restrict the term anaerobic respiration to denitrification. This metabolicdistinction and the associated greater energy yield from NO3
� respiration (Eq. [22])
Examples of Soil Microbial Transformations 247
TABLE 9.14 C Oxidation Using NO3� or SO4
2� as Terminal Electron Acceptor
NO3� accepts e�
5CH2O � 5HOH → 5CO2 � 20H� � 20e�
4NO3� � 20H� �20e� � 4H� → 2N2 � 12HOH � energy
Overall: 5CH2O � 4NO3� � 4H� → 5CO2 � 2N2 � 7HOH � energy [22]
SO42� accepts e�
2CH2O � 2HOH → 2CO2 � 8H� �8e�
SO42� � 8H� � 8e� � 2H� → H2S � 4HOH � energy
Overall: 2CH2O � SO42� � 2H� → 2CO2 � H2S � 2HOH � energy [23]
(Reproduced from McGill (1996), with permission from SBCS and SLCS.)
Ch09-P546807.qxd 11/18/06 6:56 PM Page 247

compared to dissimilatory SO42� reduction (Eq. [23]) suggest that one would not
expect to find dissimilatory SO42� reduction in a soil well supplied with NO3
�.The elemental cycling implications should be noted. For example, production of
1 mol of NO3� from NH4
� consumes 2 mol of O2. Subsequent reduction of that moleof NO3
� back to NH4� will support as much oxidation of C as would the original
2 mol of O2. This is because O accepts 8 mol of electrons from a mole of N and inturn a mole of N gains 8 mol of electrons from C. Similarly using O2 to oxidize S2�
to SO42� and then using SO4
2� to oxidize C yields the same amount of CO2 as if theC had been oxidized directly with O2. So where is the distinction between anaer-obic oxidation by anaerobic chemoorganotrophs using NO3
� or SO42� and aerobic
chemoorganotrophs using O2? The difference is in the yield of ATP and hence poten-tial for growth of biomass, which subsequently controls the rate of the process. TheATP yield is much lower under NO3
� respiration or SO42� respiration (for those
who accept that term for S reduction during C oxidation) than when using O2.What about the NO3
� or SO42� generated during reduction of CO2 to CH2O for
growth? The treatment above considers only the production of NO3� or SO4
2� asso-ciated with O2 reduction. But more biogenic NO3
� and SO42� are present in ecosys-
tems than are generated by O2 reduction. For example, from Eq. [12] about 1.8 timesas much SO4
2� is generated in reducing C with S0 as is used to generate energy byreducing O2. Similarly, from Tables 9.10 and 9.11, about 42% of the NO3
� generatedfrom NH4
� originates through production of reducing equivalents to reduce CO2 toCH2O. Consequently the potential for oxidation of C using NO3
� or SO42� in ecosys-
tems is greater than the consumption of O2 for their production would indicate.From a practical environmental perspective, dissimilatory NO3
� reduction, or theorganisms involved in it, may be helpful in facilitating oxidation of persistentorganic pollutants under anaerobic conditions. For example, Fig. 9.6 shows theoxidation of aniline by mixed cultures including denitrifiers and/or methanogensunder anaerobic conditions. The initial attack is by CO2, followed by investmentof ATP for attachment of coenzyme A (HSCoA) and a series of reduction stepsprior to oxidations and actual ring opening by insertion of water.
Is it possible to generate ATP in the absence of external electron acceptors? Todo so would require an internal electron acceptor and a net H balance of 0.Further, without an external electron acceptor, there would be no need to transportelectrons through a respiratory chain and hence no opportunity for electron trans-port phosphorylation. Consequently ATP generation would be by substrate-levelphosphorylation. Fermentation is the mechanism by which ATP is generated inorganisms without access to external electron acceptors. A wide range of sub-strates is fermented, including carbohydrates, organic acids, amino acids, andpurine and pyrimidine bases. Chemically fermentation can be treated as a dispro-portionation reaction (sometimes called dismutation; an oxidation–reductionreaction in which a reactant or element is both oxidized and reduced leading totwo different products) in which both the source of e� and the e� acceptor is anorganic molecule. A divergence is seen: one product of such reactions is more oxi-dized than the parent molecule, and one is more reduced (Ehrlich, 1993). Ethanol
248 Chapter 9 The Physiology and Biochemistry of Soil Organisms
Ch09-P546807.qxd 11/18/06 6:56 PM Page 248
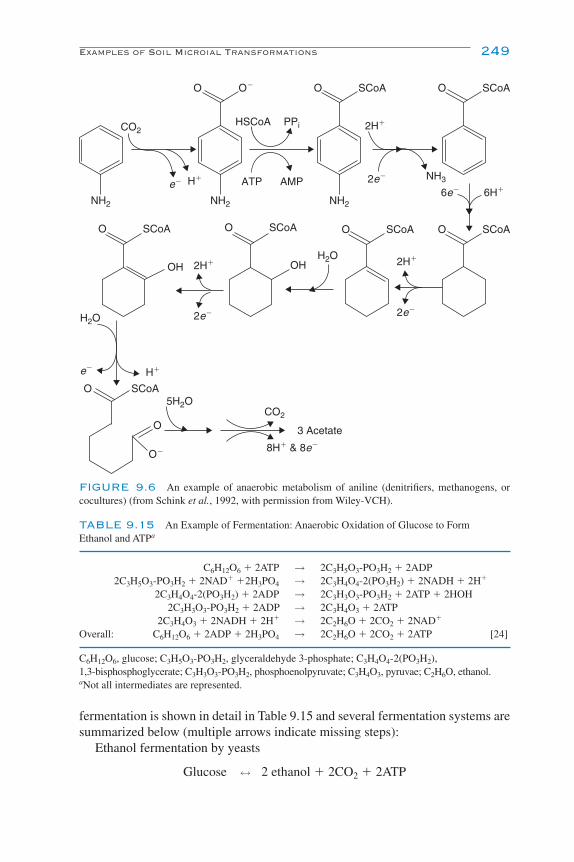
fermentation is shown in detail in Table 9.15 and several fermentation systems aresummarized below (multiple arrows indicate missing steps):
Ethanol fermentation by yeasts
Glucose ↔ 2 ethanol � 2CO2 � 2ATP
Examples of Soil Microial Transformations 249
CO2
NH2 NH2 NH2
H2O
5H2OCO2
H2O
NH3ATP AMP
PPiHSCoA
SCoAO
OH
O SCoAO
SCoAOSCoAO
OH
SCoAOSCoAO
SCoAO
O
O�
O�
e� 2e�
2e�2e�
e�
6e� 6H�H�
2H�
2H�2H�
H�
8H� & 8e�
3 Acetate
FIGURE 9.6 An example of anaerobic metabolism of aniline (denitrifiers, methanogens, orcocultures) (from Schink et al., 1992, with permission from Wiley-VCH).
TABLE 9.15 An Example of Fermentation: Anaerobic Oxidation of Glucose to Form Ethanol and ATPa
C6H12O6 � 2ATP → 2C3H5O3-PO3H2 � 2ADP2C3H5O3-PO3H2 � 2NAD� �2H3PO4 → 2C3H4O4-2(PO3H2) � 2NADH � 2H�
2C3H4O4-2(PO3H2) � 2ADP → 2C3H3O3-PO3H2 � 2ATP � 2HOH2C3H3O3-PO3H2 � 2ADP → 2C3H4O3 � 2ATP
2C3H4O3 � 2NADH � 2H� → 2C2H6O � 2CO2 � 2NAD�
Overall: C6H12O6 � 2ADP � 2H3PO4 → 2C2H6O � 2CO2 � 2ATP [24]
C6H12O6, glucose; C3H5O3-PO3H2, glyceraldehyde 3-phosphate; C3H4O4-2(PO3H2), 1,3-bisphosphoglycerate; C3H3O3-PO3H2, phosphoenolpyruvate; C3H4O3, pyruvae; C2H6O, ethanol.aNot all intermediates are represented.
Ch09-P546807.qxd 11/18/06 6:56 PM Page 249

Lactic acid homofermentation by bacteria
Glucose ↔ 2 lactate � 2ATP
Lactic acid heterofermentation by bacteria
Glucose ↔ ethanol � lactate � CO2 � 1ATP
H2 production, e.g., butyrate fermentation by bacteria
Glucose ↔ butyrate � 2CO2 � 2H2 � 3ATP
Taking ethanol fermentation as an example, the average oxidation state of the C atoms in glucose is 0 (C6H12O6). Four electrons are removed from each of 2 Catoms to generate 2CO2 (oxidation state of C � 4), which are distributed by transferring 2 electrons to each of 4 atoms of C to form 2 ethanol molecules (2C2H6O; oxidation state of C � 2). The more reduced and the more oxidized moi-eties can be seen in each of the above examples except for lactic acid fermentation,in which subsequent reduction of one product may yield two identical molecules. Inother cases, electrons may combine with H� to form H2 using a pyruvate–ferredoxinoxidoreductase (Gottschalk, 1986) as in butyrate fermentation above.
Why bother with all this if energy as ATP is the goal? The reason is that for-mation of phosphorylated intermediates needed for substrate level phosphoryla-tion requires oxidation of the organic substrate. Such oxidation removes e� � H�,which must go somewhere. With no external electron acceptor, a vast array ofinternal mechanisms is used to relocate the e� � H�, hence the great diversity offermentation systems and of fermentation intermediates within anaerobic ecosys-tems. Extent of oxidation, energy yield, and, hence, growth under such conditionsis several fold lower than under aerobic conditions.
Methanogens are the strictest anaerobes normally found in nature and use alimited array of substrates: H2 � CO2, formate, methanol, methylamines, andacetate. These substrates are formed during fermentation or converted from fer-mentation products in anaerobic systems. Two groups of organisms producemethane. The first is strictly chemolithotrophic organisms that grow on H2 andCO2. They are fascinating in their ability to produce all their needs for energy andC from H2 and CO2 alone. Clearly some of the reducing equivalents from the H2
are used for CO2 reduction as well as for energy generation. The reaction isCO2 � H2 → CH4 � HOH. The free energy change is �136 kJ per reaction(Gottschalk, 1986). H2 can be produced by reactions such as fermentation ofbutyric acid to produce acetate according to C4H8O2 � 2HOH → 2C2H4O2 � 2H2.This is an endothermic reaction, but with a free energy change of �48.1 kJ perreaction under standard conditions (Gottschalk, 1986). Such a thermodynamicallyunfavorable free energy change would suggest that H2 could not be released.Ecosystems have adapted, however. Thermodynamically the actual free energychange is related to the difference between equilibrium concentration and the
250 Chapter 9 The Physiology and Biochemistry of Soil Organisms
Ch09-P546807.qxd 11/18/06 6:56 PM Page 250
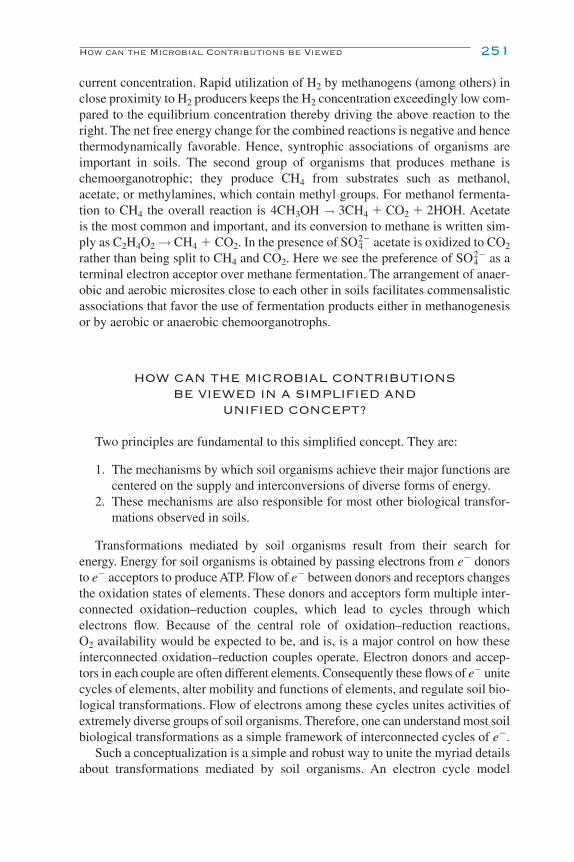
current concentration. Rapid utilization of H2 by methanogens (among others) inclose proximity to H2 producers keeps the H2 concentration exceedingly low com-pared to the equilibrium concentration thereby driving the above reaction to theright. The net free energy change for the combined reactions is negative and hencethermodynamically favorable. Hence, syntrophic associations of organisms areimportant in soils. The second group of organisms that produces methane ischemoorganotrophic; they produce CH4 from substrates such as methanol,acetate, or methylamines, which contain methyl groups. For methanol fermenta-tion to CH4 the overall reaction is 4CH3OH → 3CH4 � CO2 � 2HOH. Acetate is the most common and important, and its conversion to methane is written sim-ply as C2H4O2 → CH4 � CO2. In the presence of SO4
2� acetate is oxidized to CO2
rather than being split to CH4 and CO2. Here we see the preference of SO42� as a
terminal electron acceptor over methane fermentation. The arrangement of anaer-obic and aerobic microsites close to each other in soils facilitates commensalisticassociations that favor the use of fermentation products either in methanogenesisor by aerobic or anaerobic chemoorganotrophs.
HOW CAN THE MICROBIAL CONTRIBUTIONSBE VIEWED IN A SIMPLIFIED AND
UNIFIED CONCEPT?
Two principles are fundamental to this simplified concept. They are:
1. The mechanisms by which soil organisms achieve their major functions arecentered on the supply and interconversions of diverse forms of energy.
2. These mechanisms are also responsible for most other biological transfor-mations observed in soils.
Transformations mediated by soil organisms result from their search forenergy. Energy for soil organisms is obtained by passing electrons from e� donorsto e� acceptors to produce ATP. Flow of e� between donors and receptors changesthe oxidation states of elements. These donors and acceptors form multiple inter-connected oxidation–reduction couples, which lead to cycles through whichelectrons flow. Because of the central role of oxidation–reduction reactions,O2 availability would be expected to be, and is, is a major control on how theseinterconnected oxidation–reduction couples operate. Electron donors and accep-tors in each couple are often different elements. Consequently these flows of e� unitecycles of elements, alter mobility and functions of elements, and regulate soil bio-logical transformations. Flow of electrons among these cycles unites activities ofextremely diverse groups of soil organisms. Therefore, one can understand most soilbiological transformations as a simple framework of interconnected cycles of e�.
Such a conceptualization is a simple and robust way to unite the myriad detailsabout transformations mediated by soil organisms. An electron cycle model
How can the Microbial Contributions be Viewed 251
Ch09-P546807.qxd 11/18/06 6:56 PM Page 251
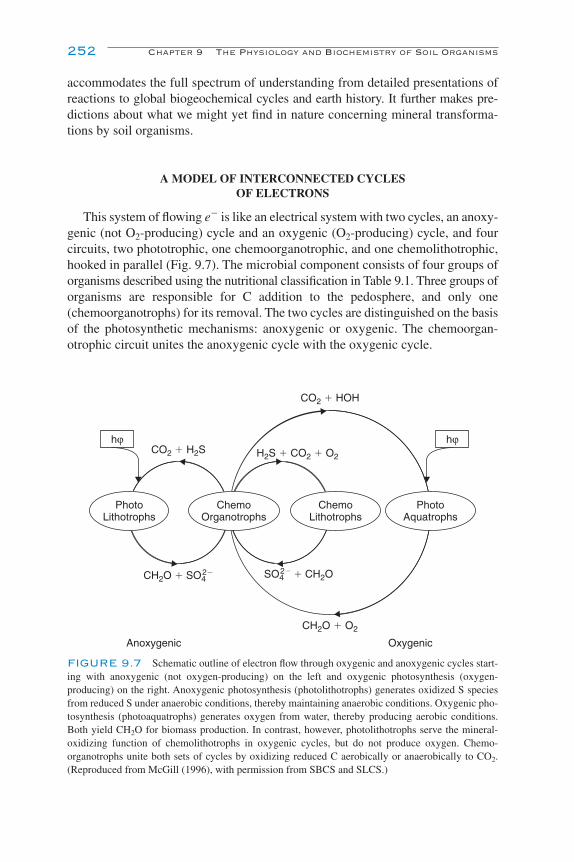
accommodates the full spectrum of understanding from detailed presentations ofreactions to global biogeochemical cycles and earth history. It further makes pre-dictions about what we might yet find in nature concerning mineral transforma-tions by soil organisms.
A MODEL OF INTERCONNECTED CYCLES OF ELECTRONS
This system of flowing e� is like an electrical system with two cycles, an anoxy-genic (not O2-producing) cycle and an oxygenic (O2-producing) cycle, and fourcircuits, two phototrophic, one chemoorganotrophic, and one chemolithotrophic,hooked in parallel (Fig. 9.7). The microbial component consists of four groups oforganisms described using the nutritional classification in Table 9.1. Three groups oforganisms are responsible for C addition to the pedosphere, and only one(chemoorganotrophs) for its removal. The two cycles are distinguished on the basisof the photosynthetic mechanisms: anoxygenic or oxygenic. The chemoorgan-otrophic circuit unites the anoxygenic cycle with the oxygenic cycle.
252 Chapter 9 The Physiology and Biochemistry of Soil Organisms
hϕ hϕCO2 � H2S H2S � CO2 � O2
CO2 � HOH
SO42� � CH2O
CH2O � O2
CH2O � SO42�
PhotoLithotrophs
ChemoOrganotrophs
ChemoLithotrophs
PhotoAquatrophs
Anoxygenic Oxygenic
FIGURE 9.7 Schematic outline of electron flow through oxygenic and anoxygenic cycles start-ing with anoxygenic (not oxygen-producing) on the left and oxygenic photosynthesis (oxygen-producing) on the right. Anoxygenic photosynthesis (photolithotrophs) generates oxidized S speciesfrom reduced S under anaerobic conditions, thereby maintaining anaerobic conditions. Oxygenic pho-tosynthesis (photoaquatrophs) generates oxygen from water, thereby producing aerobic conditions.Both yield CH2O for biomass production. In contrast, however, photolithotrophs serve the mineral-oxidizing function of chemolithotrophs in oxygenic cycles, but do not produce oxygen. Chemo-organotrophs unite both sets of cycles by oxidizing reduced C aerobically or anaerobically to CO2.(Reproduced from McGill (1996), with permission from SBCS and SLCS.)
Ch09-P546807.qxd 11/18/06 6:56 PM Page 252
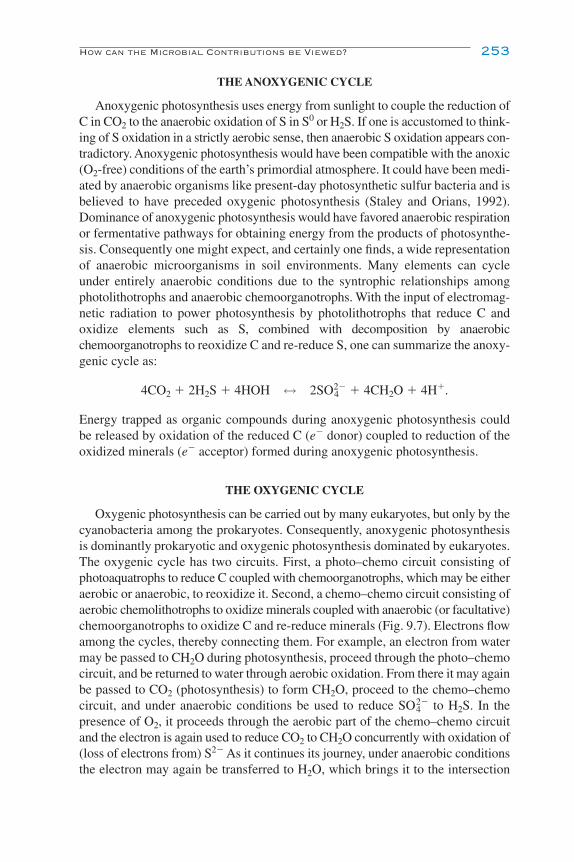
THE ANOXYGENIC CYCLE
Anoxygenic photosynthesis uses energy from sunlight to couple the reduction ofC in CO2 to the anaerobic oxidation of S in S0 or H2S. If one is accustomed to think-ing of S oxidation in a strictly aerobic sense, then anaerobic S oxidation appears con-tradictory. Anoxygenic photosynthesis would have been compatible with the anoxic(O2-free) conditions of the earth’s primordial atmosphere. It could have been medi-ated by anaerobic organisms like present-day photosynthetic sulfur bacteria and isbelieved to have preceded oxygenic photosynthesis (Staley and Orians, 1992).Dominance of anoxygenic photosynthesis would have favored anaerobic respirationor fermentative pathways for obtaining energy from the products of photosynthe-sis. Consequently one might expect, and certainly one finds, a wide representationof anaerobic microorganisms in soil environments. Many elements can cycleunder entirely anaerobic conditions due to the syntrophic relationships amongphotolithotrophs and anaerobic chemoorganotrophs. With the input of electromag-netic radiation to power photosynthesis by photolithotrophs that reduce C andoxidize elements such as S, combined with decomposition by anaerobicchemoorganotrophs to reoxidize C and re-reduce S, one can summarize the anoxy-genic cycle as:
4CO2 � 2H2S � 4HOH ↔ 2SO42� � 4CH2O � 4H�.
Energy trapped as organic compounds during anoxygenic photosynthesis couldbe released by oxidation of the reduced C (e� donor) coupled to reduction of theoxidized minerals (e� acceptor) formed during anoxygenic photosynthesis.
THE OXYGENIC CYCLE
Oxygenic photosynthesis can be carried out by many eukaryotes, but only by thecyanobacteria among the prokaryotes. Consequently, anoxygenic photosynthesisis dominantly prokaryotic and oxygenic photosynthesis dominated by eukaryotes.The oxygenic cycle has two circuits. First, a photo–chemo circuit consisting ofphotoaquatrophs to reduce C coupled with chemoorganotrophs, which may be eitheraerobic or anaerobic, to reoxidize it. Second, a chemo–chemo circuit consisting ofaerobic chemolithotrophs to oxidize minerals coupled with anaerobic (or facultative)chemoorganotrophs to oxidize C and re-reduce minerals (Fig. 9.7). Electrons flowamong the cycles, thereby connecting them. For example, an electron from watermay be passed to CH2O during photosynthesis, proceed through the photo–chemocircuit, and be returned to water through aerobic oxidation. From there it may againbe passed to CO2 (photosynthesis) to form CH2O, proceed to the chemo–chemocircuit, and under anaerobic conditions be used to reduce SO4
2� to H2S. In thepresence of O2, it proceeds through the aerobic part of the chemo–chemo circuitand the electron is again used to reduce CO2 to CH2O concurrently with oxidation of(loss of electrons from) S2� As it continues its journey, under anaerobic conditionsthe electron may again be transferred to H2O, which brings it to the intersection
How can the Microbial Contributions be Viewed? 253
Ch09-P546807.qxd 11/18/06 6:56 PM Page 253
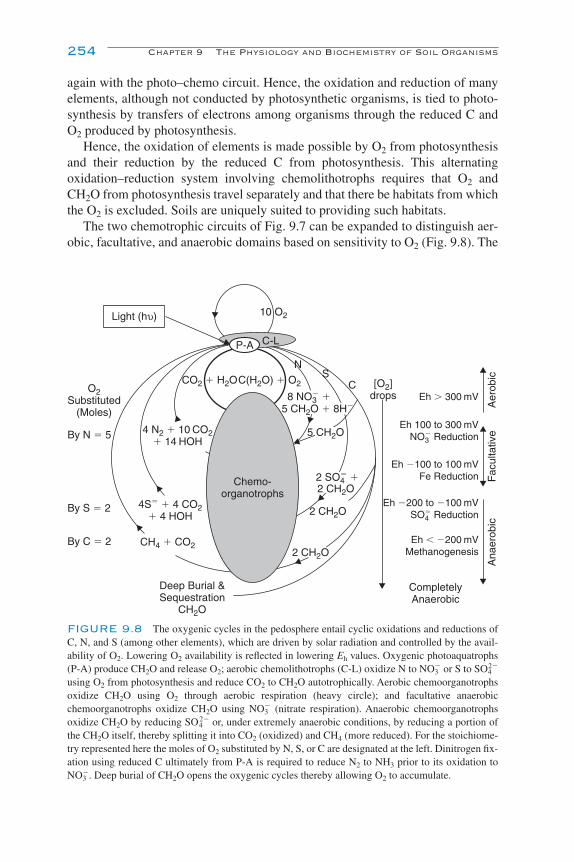
again with the photo–chemo circuit. Hence, the oxidation and reduction of manyelements, although not conducted by photosynthetic organisms, is tied to photo-synthesis by transfers of electrons among organisms through the reduced C andO2 produced by photosynthesis.
Hence, the oxidation of elements is made possible by O2 from photosynthesisand their reduction by the reduced C from photosynthesis. This alternatingoxidation–reduction system involving chemolithotrophs requires that O2 andCH2O from photosynthesis travel separately and that there be habitats from whichthe O2 is excluded. Soils are uniquely suited to providing such habitats.
The two chemotrophic circuits of Fig. 9.7 can be expanded to distinguish aer-obic, facultative, and anaerobic domains based on sensitivity to O2 (Fig. 9.8). The
254 Chapter 9 The Physiology and Biochemistry of Soil Organisms
Light (hυ)
O2Substituted
(Moles)
By N � 5 4 N2 � 10 CO2� 14 HOH
By S � 2
By C � 2 CH4 � CO2
4S� � 4 CO2� 4 HOH
Deep Burial &Sequestration
CH2O
2 CH2O
CO2 � H2OC(H2O) � O2
NS
C [O2]drops Eh � 300 mV
Eh 100 to 300 mVNO3
� Reduction
Eh �100 to 100 mVFe Reduction
Eh �200 to �100 mVSO4
� Reduction
Eh � �200 mVMethanogenesis
C-L
10 O2
CompletelyAnaerobic
Chemo-organotrophs
Ana
erob
icF
acul
tativ
eA
erob
ic
P-A
8 NO3� �
5 CH2O � 8H�
5 CH2O
2 CH2O2 SO4
� �
2 CH2O
FIGURE 9.8 The oxygenic cycles in the pedosphere entail cyclic oxidations and reductions ofC, N, and S (among other elements), which are driven by solar radiation and controlled by the avail-ability of O2. Lowering O2 availability is reflected in lowering Eh values. Oxygenic photoaquatrophs(P-A) produce CH2O and release O2; aerobic chemolithotrophs (C-L) oxidize N to NO3
� or S to SO42�
using O2 from photosynthesis and reduce CO2 to CH2O autotrophically. Aerobic chemoorganotrophsoxidize CH2O using O2 through aerobic respiration (heavy circle); and facultative anaerobicchemoorganotrophs oxidize CH2O using NO3
� (nitrate respiration). Anaerobic chemoorganotrophsoxidize CH2O by reducing SO4
2� or, under extremely anaerobic conditions, by reducing a portion ofthe CH2O itself, thereby splitting it into CO2 (oxidized) and CH4 (more reduced). For the stoichiome-try represented here the moles of O2 substituted by N, S, or C are designated at the left. Dinitrogen fix-ation using reduced C ultimately from P-A is required to reduce N2 to NH3 prior to its oxidation toNO3
�. Deep burial of CH2O opens the oxygenic cycles thereby allowing O2 to accumulate.
Ch09-P546807.qxd 11/18/06 6:56 PM Page 254
aerobic domain is set at Eh (oxidation–reduction potential) �300 mV (seeFig. 15.2), comprising aerobic chemoorganotrophs and photoaquatrophs as a syn-trophic system. The facultative domain, between Eh 100 and 300 mV, compriseschemoorganotrophs, which may be either aerobic or anaerobic in syntrophic asso-ciations with chemolithotrophs, which are aerobic. The anaerobic domain consistsof strictly anaerobic chemoorganotrophs in association with photoaquatrophs.Anaerobic chemoorganotrophs in the anaerobic domain re-reduce oxidized mineralsgenerated by aerobic chemolithotrophs in the aerobic domain. Some energy is dissi-pated through heat loss, etc., and must be made up by subsequent photosynthesis.
Overall control is provided by O2 because it inhibits anaerobic processes.Consequently the balance among the three domains in Fig. 9.8 is a function of O2
availability in local environments or microsites. N2 fixation is interesting in that it isinhibited by O2 and mediated by three of the four groups of organisms, with onlychemolithotrophs excluded. In addition, the chemoorganotrophs are responsibleboth for removing N from the pedosphere, by reducing NO3
� to N2, and for return-ing it by further reducing N2 to NH3.
As the Eh becomes increasingly negative oxidants become decreasingly effec-tive (Fig. 9.8). Given that the energy available through a redox reaction is directlyproportional to the change in oxidation potential between the two couples, lessand less energy is released as one moves from aerobic to strictly anaerobic metab-olism. Soil organisms have evolved in an energy-limited environment so commu-nities of soil organisms use the most energetically favorable energy sources availableto them. Such a strategy favors use of O2 as an electron acceptor followed by NO3
�,
then SO42�; after depletion of NO3
� and SO42� a portion of the C in CH2O is eventu-
ally used during methanogenesis. In other words, CH2O is allocated first to reduc-tion of O2, then NO3
� followed by SO42�, and finally methanogenesis. From a
practical perspective, then NO3� might be a useful electron acceptor for metabo-
lism of organic contaminants under anaerobic conditions. Indeed NO3� and denitri-
fying populations have been proposed for removal of organic contaminants underanaerobic conditions.
The O2 produced during photosynthesis is consumed stoichiometrically duringcomplete decomposition of photosynthate (compare Eqs. [1] and [20]). It is notpossible for O2 to accumulate in the atmosphere from photosynthesis unless largequantities of CH2O are not decomposed. We are not awash in nondecomposedplant litter, so how can residual O2 have accumulated in the atmosphere? Disruptingthe cycle of photosynthesis and decomposition would retain O2 in the atmosphererather than consuming it in oxidation of photosynthate. Disruption occurs by deepburial and sequestration of CH2O as represented in Fig. 9.8. Processes yielding soilhumus, peat, shale, coal, or petroleum and deep ocean organic sediments amongothers over geologic time all remove CH2O from the attention of microbes thatwould use it to reduce O2 to water (see Logan et al., 1995). See Chap. 12 for furtherdiscussion on humus formation. Soil microbes may play an interesting role inpreservation of reduced C over geologic time scales. For example, Kennedy et al.(2006) showed a strong relation between the increase of pedogenic clay and the
How can the Microbial Contributions be Viewed? 255
Ch09-P546807.qxd 11/18/06 6:56 PM Page 255

increases in atmospheric oxygen in the later Precambrian. They postulated that soilbiological activity, including that of plant roots, weathered soil minerals, resulting information of pedogenic clay, which in turn was instrumental in adsorbing andsequestering C. In turn, higher O2 concentrations appear to be related to developmentof higher animals (Kennedy et al., 2006) and development of large placental mam-mals (Falkowski et al., 2005). Might we imagine that “soil microbes rule the world”?
Given that C storage could allow O2 accumulation, what might be the control onmaximum O2 accumulation? Mineral weathering is a sink for O2 and participatesin regulating atmospheric O2 concentration. In addition, oxidation–reductionreactions over geological time control Fe solubility and, because of its reactivitywith P, Fe controls P concentration. Fe and P concentrations in solution, espe-cially in marine environments, often limit photosynthesis and N2 fixation.Regulation of Fe and P solubility by the oxidation state of Fe provides a feedbackto atmospheric O2 concentration (Van Cappellen and Ingall, 1996).
REFERENCES
Ehrlich, H. L. (1993). Bacterial mineralization of organic carbon under anaerobic conditions. In “SoilBiochemistry” (J.-M. Bollag and G. Stotzky, eds.), Vol. 8, pp. 219–247. Dekker, New York.
Falkowski, P. G., Katz, M. E., Milligan, A. J., Fennel, K., Cramer, B. S., Aubrey, M. P., Barner, R. A.,Novacek, M. J., and Zapot, W. M. (2005). The rise of oxygen over the past 205 million years andthe evolution of large placental mammals. Science 309, 2202–2204.
Gottschalk, G. (1986). “Bacterial Metabolism.” 2nd ed. Springer-Verlag, New York.Kennedy, M., Droser, M., Lawrence, M. M., Prevear, D., and Mrofka, D. (2006). Late Precambrian
oxygenation: inception of the clay mineral factory. Science 311, 1446–1449.Logan, G. A., Hayes, J. M., Hieshima, G. B., and Simmons R. E. (1995). Terminal proterozoic reor-
ganization of biogeochemical cycles. Nature 376, 53–56.McGill, W. B. (1996). Soil sustainability: Microorganisms, and electrons. In Solo Suelo 96 Conference
2, CD version, Sociedade Brasileira de Ciência do Solo (SBCS) and Sociedade Latino-Americanade Ciência do Solo (SLCS), Viçosa/MG.
Nicholls, D. G., and Ferguson, S. J. (1992). “Bioenergetics 2.” Academic Press, Toronto.Paul, E. A., and Clark, F. E. (1989). “Soil Microbiology and Biochemistry.” Academic Press, New York.Paul, E. A., and Clark, F. E. (1996). “Soil Microbiology and Biochemistry.” 2nd ed. Academic Press,
New York.Schink, B., Brune, A., and Schnell, S. (1992). Anaerobic degradation of aromatic compounds. In
“Microbial Degradation of Natural Products” (G. Winkelmann, ed.), pp. 219–242. VCH, New York.Staley, J. T., and Orians, G. H. (1992). Evolution and the biosphere. In “Global Biogeochemical Cycles
(S. M. Butcher, R. J. Charlson, G. H. Orians, and G. V. Wolfe, eds.), pp. 21–54. Academic Press,Toronto.
Van Cappellen, P., and Ingall, E. D. (1996). Redox stabilization of the atmosphere and oceans by phos-phorus-limited marine productivity. Science 271, 493–496.
256 Chapter 9 The Physiology and Biochemistry of Soil Organisms
Ch09-P546807.qxd 11/18/06 6:56 PM Page 256

10The Ecology of
Plant–MicrobialMutualisms
Jeff Powell
John Klironomos
Introduction
Roots as an Interface for Plant–Microbial Mutualisms
Mycorrhizal Symbioses
Symbioses Involving N-Fixing Organisms
Interactions among Mutualists
Interactions with Pathogens
Implications for Plant Populations and Communities
Challenges in the Study of Interactions
Conclusions
References and Suggested Reading
257
INTRODUCTION
Plants interact with a multitude of soil microorganisms in many different ways thathave important consequences for plant growth and fitness. When microorganismscolonize and live within a host plant, these interactions are called “symbioses.” Inmutualistic symbioses, in which all partners benefit, the plant generally suppliesits symbiont with photosynthetic C in exchange for a limiting resource (such as anutrient or water) or protection from antagonists. Mycorrhizal fungi, the mostubiquitous of root-associated plant symbioses, attain photosynthetic C from theplant partner in return for enhanced nutrient and water uptake, resulting from anincreased effective root surface area or increased uptake efficiency of certainnutrients. Mycorrhizal plants can have enhanced growth compared to uncolonized
Ch10-P546807.qxd 11/18/06 6:56 PM Page 257
258 Chapter 10 The Ecology of Plant–Microbial Mutualisms
plants under low nutrient concentrations and under conditions where movementof nutrients in soil is reduced (e.g., drought). Leguminous plants form rhizobialsymbioses with N2-fixing bacteria. Rhizobia infect the roots of the host plant, whichthen initiate the development of root nodules where rhizobia fix atmospheric Nin exchange for photosynthetic C. Other N2-fixing bacteria, such as Frankia spp.,enter into the same type of symbiosis as rhizobia, but only with a small group ofnonleguminous plant species.
In practice, however, it is not always easy to observe benefit for all partners.The outcome of the symbiosis can range from mutualism to parasitism, and thiscan depend on interactions with the environment along spatial and temporal scales.One reason for this apparent contradiction is that we are not fully aware of thecomplete spectrum of ecological and evolutionary consequences of these so-calledmutualistic relationships. Plants could derive indirect benefits from their microbialpartners via effects on physical and biotic soil components, interactions with path-ogenic microorganisms, or mediation of competition or herbivory. The long-termbenefits of the symbiosis, derived at times of stress or disturbance, may outweighnegative consequences that are transient in nature.
In this chapter, we will continue to refer to symbioses, in general, that have poten-tial to be mutualistic (mycorrhizal, rhizobial, and actinorrhizal symbioses) as “mutu-alistic,” to distinguish them from symbioses that are obviously parasitic (involvingplant pathogens). However, when describing specific types of mutualistic symbioses,they will be referred to as “symbioses.”
ROOTS AS AN INTERFACE FORPLANT–MICROBIAL MUTUALISMS
Mutualisms among plants and microorganisms are much more common belowground than above ground, even though diverse interactions between plants andmicroorganisms occur in both realms. Saprotrophs and plant–pathogenic microbesdominate in the phyllosphere and their community composition differs considerablyfrom that of the rhizosphere (Lindow and Brandl, 2003). Mutualisms among plantsand microorganisms are not entirely absent in the phylloplane but appear to be lim-ited to a few that influence plant–herbivore interactions (e.g., Clay, 1990). Functionalaspects might explain the apparent difference in the prevalence of mutualisms inthe two environments. Soil is a heterogeneous environment in which mutualistsaid plants in exploiting ephemeral resource patches by converting organic nutrientsinto usable inorganic forms and through the production of structures that extendthe effective zone of water and nutrient uptake by roots. Above ground, the primaryresources for which plants compete are light, pollinators, and seed dispersal agents.Some fungi manipulate plant morphology and, indirectly, pollinator behavior inorder to facilitate dispersal of fungal gametes, but this interaction is detrimental toplant fitness (Roy, 1993). We are not aware of any evidence that the ability of plantsto capture light is enhanced through the production of specialized structures by
Ch10-P546807.qxd 11/18/06 6:56 PM Page 258

phyllosphere microorganisms. Plants that form mutualistic symbioses with soilmicroorganisms, however, can grow larger as a result of enhanced nutrient uptake,allowing these plants to compete more vigorously for light and, possibly, achievegreater fitness.
MYCORRHIZAL SYMBIOSES
Mycorrhizas are symbioses between nonpathogenic fungi and the roots of the hostplant. The mycorrhizal symbiosis is ubiquitous, is present in nearly all plant species,and can provide mutual benefits to the participants. Mycorrhizal classification isbased on anatomical features of the root–fungus interface and the taxonomic clas-sification of the fungus and host plant (Table 10.1). Peterson et al. (2004) presenteda detailed overview of the different mycorrhizal types and many spectacular imagesof plant, fungal, and mycorrhizal structures. Arbuscular mycorrhizal (AM) fungioccur in symbioses with plant taxa belonging to �90% of vascular and nonvascu-lar plant families. The taxonomic diversity of AM fungal species is relativelylow (estimates range from �150 to 200 spp.) and confined to the Phylum Glom-eromycota (formerly the Order Glomales within the Zygomycota) based on 18SrRNA sequence data. Ectomycorrhizal (EM) fungi form symbioses with severalgymnosperm and angiosperm species and are taxonomically diverse, with approx-imately 6000 species; Kendrick (2001) notes 74 genera in the Basidiomycota and16 genera in the Ascomycota. Other types of mycorrhizas are more restricted withregard to the phylogenetic diversity of the plant species in which associations areformed. Ectendomycorrhizas can be found in roots of the conifer genera Larix andPinus. Arbutoid and ericoid mycorrhizas occur for ericaceous plants, although theformer can be found in some of the Pyrolaceae (wintergreen family) and the lattercan also occur in some bryophytes (nonvascular plants such as mosses, liverworts,and hornworts). Monotropoid and orchid mycorrhizas form only in roots of the plantfamilies Monotropaceae (e.g., Indian pipe, pinedrops) and Orchidaceae, respec-tively; the fungal partner, however, may be able to form other types of mycorrhizalassociations with other plants. Plants that associate in monotropoid mycorrhizasare achlorophyllous and nonphotosynthetic (termed mycoheterotrophic) and rely onthe fungus to form additional mycorrhizal associations, often of different types,with other plants in order to attain photosynthate. Orchid mycorrhizas function ina similar way and the presence of the fungal symbiont is required prior to seedgermination and seedling establishment.
The formation of mycorrhizal symbioses is complex and involves recognition,infection, and then internal colonization of roots. The process differs dependingon the type of mycorrhiza (Figs. 10.1 and 10.2). AM fungi can colonize host plantsvia intact mycelial networks, hyphal fragments, or individual spores. Root exudatesstimulate hyphal branching and directed growth. Once a hypha contacts a root, thefungus forms an appressorium from which it attempts infection. If successful, hyphaepenetrate epidermal cells, enter the cortex, and grow intercellularly (or intracellularly
Mycorrhizal Symbioses 259
Ch10-P546807.qxd 11/18/06 6:56 PM Page 259
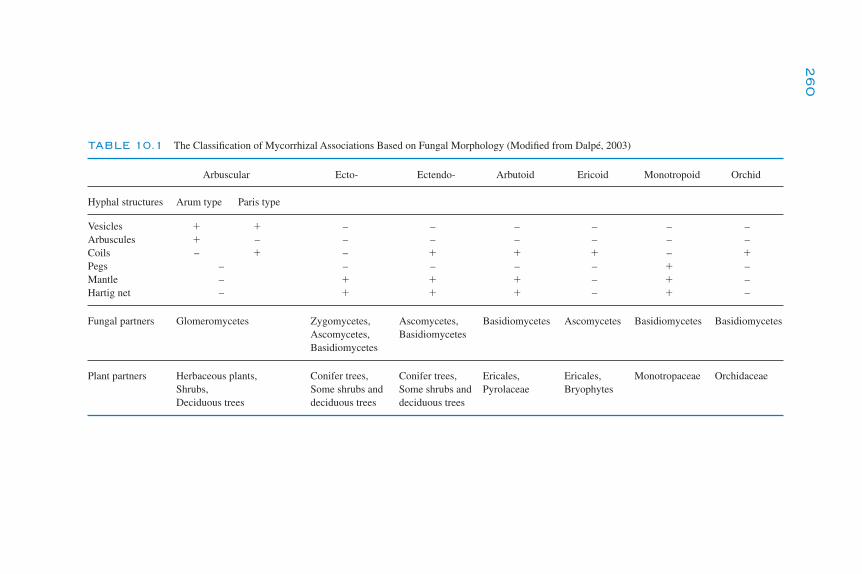
TABLE 10.1 The Classification of Mycorrhizal Associations Based on Fungal Morphology (Modified from Dalpé, 2003)
Arbuscular Ecto- Ectendo- Arbutoid Ericoid Monotropoid Orchid
Hyphal structures Arum type Paris type
Vesicles � � – – – – – –Arbuscules � – – – – – – –Coils – � – � � � – �
Pegs – – – – – � –Mantle – � � � – � –Hartig net – � � � – � –
Fungal partners Glomeromycetes Zygomycetes, Ascomycetes, Basidiomycetes Ascomycetes Basidiomycetes BasidiomycetesAscomycetes, BasidiomycetesBasidiomycetes
Plant partners Herbaceous plants, Conifer trees, Conifer trees, Ericales, Ericales, Monotropaceae OrchidaceaeShrubs, Some shrubs and Some shrubs and Pyrolaceae BryophytesDeciduous trees deciduous trees deciduous trees
260
Ch10-P546807.qxd 11/18/06 6:56 PM Page 260
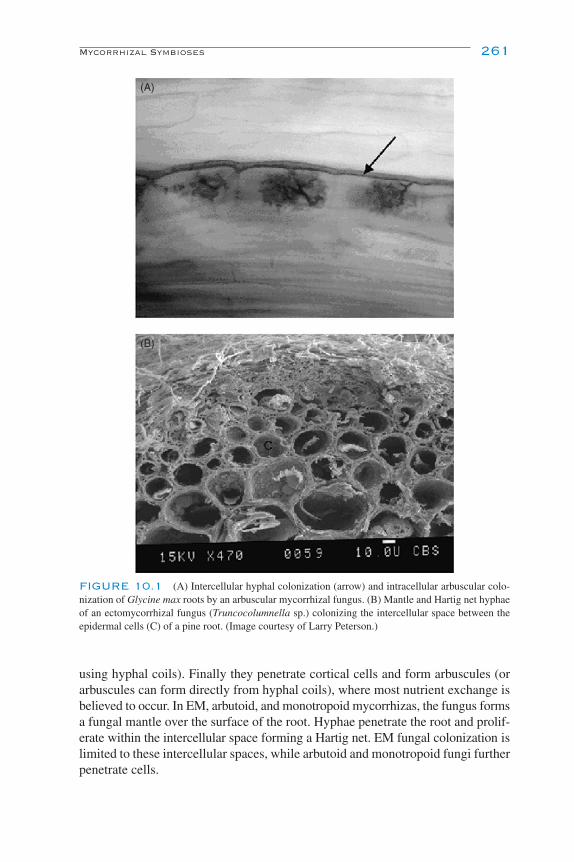
using hyphal coils). Finally they penetrate cortical cells and form arbuscules (orarbuscules can form directly from hyphal coils), where most nutrient exchange isbelieved to occur. In EM, arbutoid, and monotropoid mycorrhizas, the fungus formsa fungal mantle over the surface of the root. Hyphae penetrate the root and prolif-erate within the intercellular space forming a Hartig net. EM fungal colonization islimited to these intercellular spaces, while arbutoid and monotropoid fungi furtherpenetrate cells.
Mycorrhizal Symbioses 261
(A)
(B)
FIGURE 10.1 (A) Intercellular hyphal colonization (arrow) and intracellular arbuscular colo-nization of Glycine max roots by an arbuscular mycorrhizal fungus. (B) Mantle and Hartig net hyphaeof an ectomycorrhizal fungus (Truncocolumnella sp.) colonizing the intercellular space between theepidermal cells (C) of a pine root. (Image courtesy of Larry Peterson.)
Ch10-P546807.qxd 11/18/06 6:56 PM Page 261
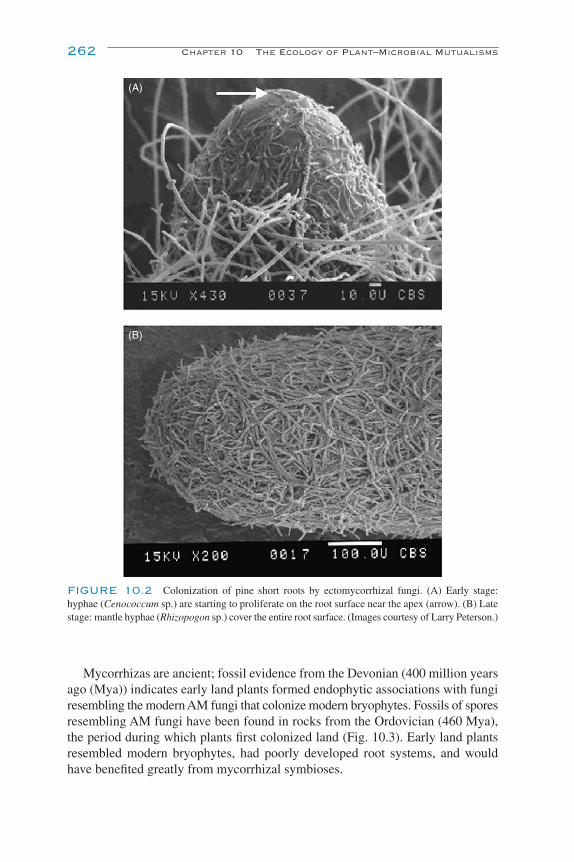
Mycorrhizas are ancient; fossil evidence from the Devonian (400 million yearsago (Mya)) indicates early land plants formed endophytic associations with fungiresembling the modern AM fungi that colonize modern bryophytes. Fossils of sporesresembling AM fungi have been found in rocks from the Ordovician (460 Mya),the period during which plants first colonized land (Fig. 10.3). Early land plantsresembled modern bryophytes, had poorly developed root systems, and wouldhave benefited greatly from mycorrhizal symbioses.
262 Chapter 10 The Ecology of Plant–Microbial Mutualisms
(A)
(B)
FIGURE 10.2 Colonization of pine short roots by ectomycorrhizal fungi. (A) Early stage:hyphae (Cenococcum sp.) are starting to proliferate on the root surface near the apex (arrow). (B) Latestage: mantle hyphae (Rhizopogon sp.) cover the entire root surface. (Images courtesy of Larry Peterson.)
Ch10-P546807.qxd 11/18/06 6:56 PM Page 262

The primary benefit derived by plants involved in mycorrhizal symbioses isgenerally perceived to be enhanced nutrient uptake, achieved by the fungus expand-ing the zone of nutrient uptake farther away from the rhizosphere and/or more effi-ciently taking up and transporting nutrients. The nutrients that are taken up by thefungus depend on the type of mycorrhiza. Generally, all types of mycorrhizal fungiare able to transport N and P. Ericoid mycorrhizal fungi primarily increase the plant’saccess to N, but also to P, Ca, and Fe. AM fungi have been studied mostly for theirability to enhance P nutrition, but also play a role in the uptake of N, K, and Zn.EM fungi have saprotrophic abilities and are able to access organic forms of N and P.As described above, monotropoid and orchid mycorrhizal fungi transport C, inaddition to N and P, to their mycoheterotrophic hosts.
However, the symbiotic role of mycorrhizal fungi is not limited to enhancingthe plant’s nutritional status (Fig. 10.4). Mycorrhizal fungi play an important rolein the formation of soil macroaggregates, which help maintain soil stability duringalternating periods of wetting and drying. Other benefits accrued by the plant mayresult from altered biotic interactions and take the form of defense, with mycorrhizalroots being colonized by fewer disease-causing organisms or suffering less grazingby root herbivores than nonmycorrhizal roots. The consequences of these interac-tions are not confined to the soil: plant fitness may be altered by mycorrhizal colo-nization as a result of altered interactions with insects, including herbivores, naturalenemies of herbivores, and pollinators. Performance of plants and herbivores inresponse to mycorrhizal colonization varies depending on the feeding strategy of theherbivore and differs among fungal species (Gehring and Whitham, 2002). Parasitismof a leaf-mining insect, Chromatomyia syngenesiae, by a generalist parasitoidDiglyphus isaea was reduced on Glomus mosseae-colonized plants but increasedon Glomus caledonium- and Glomus fasciculatum-colonized plants, possibly due
Mycorrhizal Symbioses 263
(A) (B) (C) (D)
(E) (F) (G) (H)
FIGURE 10.3 (A–C, E–G) Fossil spores from the Ordovician and (D, H) spores from extantarbuscular mycorrhizal fungi. Scale bars, 50 µm. (Reprinted with permission from Redecker, Kodner,and Graham, 2000; copyright 2000, AAAS.)
Ch10-P546807.qxd 11/18/06 6:56 PM Page 263

to altered host searching efficiency by the parasitoid on larger and smaller plants(Gange et al., 2003). Plant–pollinator interactions may be affected by AM fungivia changes in floral morphology (Philip et al., 2001) and enhanced pollen quality(Poulton et al., 2001) such that pollinator visitation rates are enhanced (Wolfe et al.,2005). Mycorrhizal fungi, particularly EM and/or AM fungi, also show promise forthe breakdown of organic pollutants, protection of plants from metal phytotoxicity,and sequestration of toxic elements in contaminated soils.
Recently, as mycorrhizal researchers have learned more about the ecologicaloutcomes of mycorrhizal symbioses, the concept of “mycorrhiza � mutualism” hasbeen challenged. In orchid mycorrhizas, for example, the plant partner is achloro-phyllous for an extended period following seedling emergence, thus the fungalpartner receives no known benefit from the association. Achlorophyllous plantswithin the Monotropaceae obtain photosynthate by establishing monotropoid myc-orrhizas with EM fungi already associated with a gymnosperm host; as a result,
264 Chapter 10 The Ecology of Plant–Microbial Mutualisms
Bindingroot to
soilTransfer
ofnutrients
Protectionfrom
pathogens
Long distancetransport of P
FIGURE 10.4 The multifunctional nature of AM fungi. Morphological requirements fordifferent mycorrhizal functions include diffuse extraradical mycelium far from the root (P uptake) andin the rhizosphere (plant–soil water relations) and extensive intraradical colonization by hyphae (pathogenprotection) and arbuscules (P transfer). (Reprinted from Fitter, 2005, with permission; copyright 2005,Blackwell Publishing.)
Ch10-P546807.qxd 11/18/06 6:56 PM Page 264

the achlorophyllous plant effectively parasitizes the gymnosperm via the fungus,although the consequence for fungal fitness is not known. The degree to which theassociates derive benefits may differ depending on environmental conditions. AMsymbioses are expensive for plants to maintain, with AM fungi requiring up to 20%of host photosynthate during colonization and while functioning (Graham, 2000).Under conditions of high nutrient availability, if C costs exceed the benefits accruedby mycorrhizal uptake of nutrients, the association may actually be detrimental to theplant host. AM fungal colonization of plants is reduced under conditions of high Pavailability, probably due to reduced exudation of compounds stimulatory to sporegermination and hyphal growth, but possibly even due to presence of plant-derivedinhibitory compounds in root exudates, suggesting plant control over colonizationevents (Vierheilig, 2004). In addition, the species composition of an AM fungalcommunity differs depending on soil fertility; fertilization can select for AM fungalspecies that promote growth to a lesser extent than those found in unfertilized soil(Johnson, 1993). The outcome of the symbiosis is also dependent on the plant andfungal species involved in the association, with effects on plant growth rangingfrom positive to negative across a variety of plant–fungal species combinations(Klironomos, 2003; Fig. 10.5).
Mycorrhizal symbioses are also important for shaping the environment in whichplants and fungi grow. The microbial composition of mycorrhizal root systemsis very different from that of nonmycorrhizal roots, a phenomenon known as the“mycorrhizosphere effect” (Linderman, 1988; Vierheilig, 2004), due to chemical andphysical effects on the soil environment. Roots colonized by mycorrhizal fungiare hypothesized to have altered root membrane permeability, which may affectthe abundance and composition of root exudates; few studies have measured thesechanges in root exudate composition, and in those studies only certain groups ofidentifiable compounds (e.g., phenolics) were considered. Reduced mineral andnutrient concentrations in soil, as a result of increased uptake by mycorrhizal fungi,as well as higher C inputs due to high turnover of the fungal mycelium may alsocontribute to changes in microbial community composition. Some mycorrhizal fungican secrete compounds into the rhizosphere that are antagonistic to soil micro-organisms; for example, Paxillus involutus, an EM fungus, produces ethanol-solublesubstances that suppress sporulation in a pathogenic fungus, Fusarium oxysporum(Duchesne et al., 1988).
While mycorrhizal fungi influence the composition and activity of soil microbialcommunities, soil microbes also reciprocate by influencing fungal activity andfunctioning. Microscopic examination of the surfaces of AM fungal spores andhyphae reveals colonization of surfaces by bacteria. Xavier and Germida (2003)isolated several bacterial species associated with Glomus luteum (formerly Glomusclarum) spores reared from greenhouse cultures, some of which had stimulatoryor inhibitory effects on spore germination and/or hyphal growth. Both diffusibleand nonvolatile substances produced by bacteria are thought to be involved inthese effects on AM fungal activity. Bacillus chitinosporus, which inhibited sporegermination in the in vitro bioassay, reduced G. luteum colonization of pea roots
Mycorrhizal Symbioses 265
Ch10-P546807.qxd 11/18/06 6:56 PM Page 265
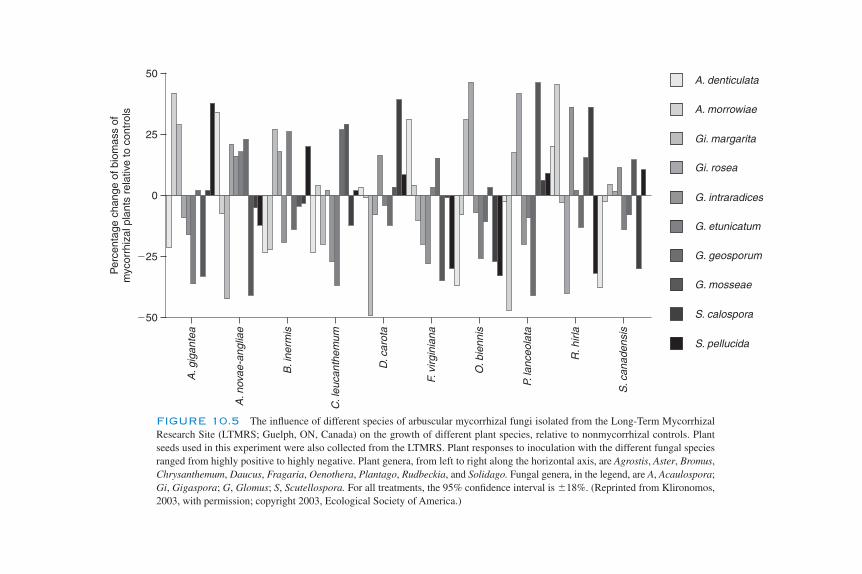
A. denticulata
A. morrowiae
Gi. margarita
Gi. rosea
G. intraradices
G. etunicatum
G. geosporum
G. mosseae
S. calospora
S. pellucida
50
25
0
�25
�50
Per
cent
age
chan
ge o
f bio
mas
s of
myc
orrh
izal
pla
nts
rela
tive
to c
ontr
ols
A. g
igan
tea
A. n
ovae
-ang
liae
B. i
nerm
is
C. l
euca
nthe
mum
D. c
arot
a
F. v
irgin
iana
O. b
ienn
is
P. la
nceo
lata
R. h
irla
S. c
anad
ensi
s
FIGURE 10.5 The influence of different species of arbuscular mycorrhizal fungi isolated from the Long-Term MycorrhizalResearch Site (LTMRS; Guelph, ON, Canada) on the growth of different plant species, relative to nonmycorrhizal controls. Plantseeds used in this experiment were also collected from the LTMRS. Plant responses to inoculation with the different fungal speciesranged from highly positive to highly negative. Plant genera, from left to right along the horizontal axis, are Agrostis, Aster, Bromus,Chrysanthemum, Daucus, Fragaria, Oenothera, Plantago, Rudbeckia, and Solidago. Fungal genera, in the legend, are A, Acaulospora;Gi, Gigaspora; G, Glomus; S, Scutellospora. For all treatments, the 95% confidence interval is �18%. (Reprinted from Klironomos,2003, with permission; copyright 2003, Ecological Society of America.)
Ch10-P546807.qxd 11/18/06 6:56 PM Page 266

by 64% relative to that in the absence of B. chitinosporus. However, Bacillus pabuli,which enhanced spore germination and hyphal growth in the in vitro assay, had noeffect on G. luteum colonization of pea roots. “Helper” bacteria that have stimulatoryeffects on hyphal growth and EM formation have been isolated from mantle hyphae,while a range of stimulatory, neutral, and beneficial effects of soil bacteria onEM colonization of plant roots has also been observed (Azcon-Aguilar and Barea,1992).
SYMBIOSES INVOLVING N-FIXING ORGANISMS
Leguminous plants have evolved morphologically and functionally specializedsymbioses with a group of bacteria (rhizobia) in which the bacteria are rewardedwith photosynthetic C in exchange for fixed N from atmospheric N2. The processoccurs in root nodules that form when rhizobia infect the host via root hairs andtrigger changes to root morphology (Fig. 10.6). Three new genera (Allorhizobium,Mesorhizobium, and Sinorhizobium) have been proposed, in addition to the genera(Azorhizobium, Bradyrhizobium, and Rhizobium) that existed when the previousedition of this book was published, in 1996. As a result of this symbiosis, leguminousplants tend to be early successional species and good colonizers of N-poor environ-ments. They also facilitate the establishment and growth of non-N2-fixing plantspecies through the accumulation of fixed N in the soil environment. Several legumespecies are among the most widespread and abundant agricultural crops, includingalfalfa, clover, beans, and soybeans. These agricultural legumes are responsible fora large portion of global biological N2 fixation.
The actinorhizal symbiosis between primarily woody plants and an actinomycete,Frankia, is less common than the rhizobium–legume association but is important forplant species that typically colonize stressed, N-poor sites in temperate regions. Fam-iliar host species include alder (Alnus), bayberry (Myrica), sea buckthorn (Hippophae),and autumn olive (Elaeagnus) in temperate regions and beefwoods (Casuarina) inthe tropics. The Frankia–actinorhizal symbiosis differs from the legume–rhizobiumsymbiosis in a number of ways. For example, Frankia exist within nodules in avegetative, filamentous form, while rhizobia occur as bacteroids, resembling bacteria(Fig. 10.6). Also, while the genes involved in nitrogen fixation show some sequencehomology, little similarity has been found among genes involved in nodule formation(Verghese and Misra, 2002).
Like in mycorrhizal symbioses, nodulation involves the recognition and responseof both partners (Chap. 14). Briefly, bacteria adhere to the surface of root hairs,which then curl around the bacteria. Bacteria then initiate an infection thread thatpenetrates into the cortical region of the root, stimulating meristematic growth andnodule formation. Symbioses between plants and N2-fixing organisms, while mor-phologically and functionally less diverse than mycorrhizal associations, can becategorized by the types of nodules that are formed: determinate and indeterminate(Fig. 10.7). Rhizobia are found associated with both nodule types, but Frankia
Symbioses Involving N-Fixing Organisms 267
Ch10-P546807.qxd 11/18/06 6:56 PM Page 267

infections mainly result in determinate nodules. Determinate nodules are sphericalin shape and ephemeral, lasting only a few days or weeks. Found, for instance, onsoybean roots, these nodules contain vascular bundles that aid in the transport ofC into the nodule and N out of the nodule. Indeterminate nodules are elongate andlong-lived, possessing an apical meristem that continuously produces new cells.Indeterminate nodules have been studied on clover and have a more extensive vascular system than determinate nodules.
As with mycorrhizal symbioses, rhizobial associations are not always beneficialfor the plant. Non-N2-fixing strains of rhizobia are commonly found associated
268 Chapter 10 The Ecology of Plant–Microbial Mutualisms
(B)
(A)
FIGURE 10.6 (A) Soybean root system with nodules of Bradyrhizobium japonicum. (Imagecourtesy of Pedro Antunes.) (B, C) Electron micrographs of alfalfa nodule interior, showing rhizobialbacteroids. (Images courtesy of Joe Muldoon.)
Ch10-P546807.qxd 11/18/06 6:57 PM Page 268

with legumes and may be at a selective advantage over other strains infecting thesame host because they avoid the energetically costly process of N2 fixation. Thisis important from an agronomic standpoint: non-N2-fixing strains may outcompetemutualistic strains for plant resources, resulting in reduced N2 fixation at the whole
Symbioses Involving N-Fixing Organisms 269
Soybean: determinate nodule, root hair infection thread, non-persistent meristem.
Peanut: determinate, crack entry infection thread.
Sesbania: stem nodule, fissure infection thread, meristematic.
Clover: indeterminate, meristematic nodule, hair infection thread.
Parasponia: crack entry, infection focus, meristematic modified root, plus fixation threads.
Andira sp.: indeterminate, infection threads, plus fixation threads.
Casuarina: hair infection thread, meristematic modified root.
RhLR
Rh
NM
NM
IA
IARhC
VB
LR
Rh
Rh
Rh
Rh
LR
IA
AcLR
Precise stepsunknown
P
P
P
FIGURE 10.7 Schematic representations of different nodulation ontogenies. VB, vascular bundle;Rh, Rhizobium or Bradyrhizobium inoculant; Ac, actinomycete (i.e., Frankia) inoculant; C, cortex;P, pericycle-associated cell divisions; IA, infected area and region of nitrogen fixation; LR, lateral root(emerging or dormant) with associated root meristem; NM, nodule meristem. (Rolfe and Gresshoff,1988. Reprinted with permission of Annual Reviews, www.annualreviews.org.)
Ch10-P546807.qxd 11/18/06 6:57 PM Page 269
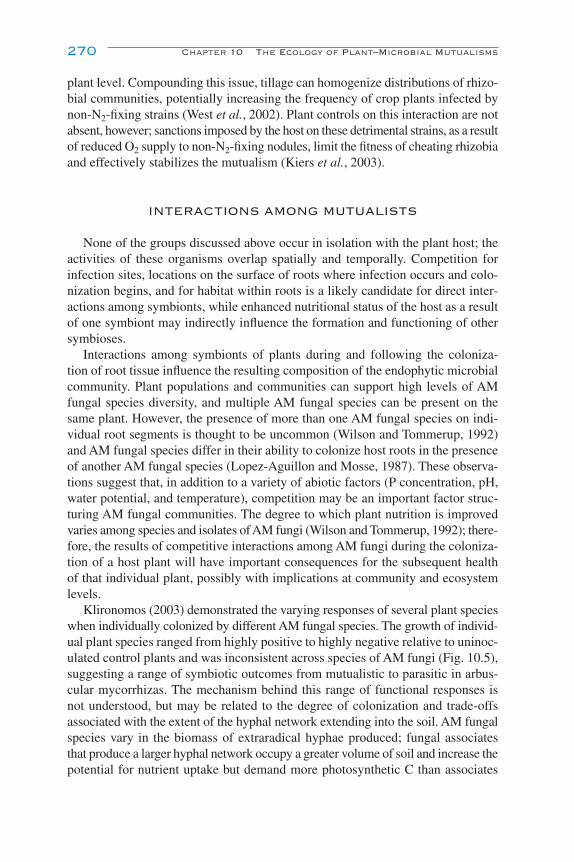
plant level. Compounding this issue, tillage can homogenize distributions of rhizo-bial communities, potentially increasing the frequency of crop plants infected bynon-N2-fixing strains (West et al., 2002). Plant controls on this interaction are notabsent, however; sanctions imposed by the host on these detrimental strains, as a resultof reduced O2 supply to non-N2-fixing nodules, limit the fitness of cheating rhizobiaand effectively stabilizes the mutualism (Kiers et al., 2003).
INTERACTIONS AMONG MUTUALISTS
None of the groups discussed above occur in isolation with the plant host; theactivities of these organisms overlap spatially and temporally. Competition forinfection sites, locations on the surface of roots where infection occurs and colo-nization begins, and for habitat within roots is a likely candidate for direct inter-actions among symbionts, while enhanced nutritional status of the host as a resultof one symbiont may indirectly influence the formation and functioning of othersymbioses.
Interactions among symbionts of plants during and following the coloniza-tion of root tissue influence the resulting composition of the endophytic microbialcommunity. Plant populations and communities can support high levels of AMfungal species diversity, and multiple AM fungal species can be present on thesame plant. However, the presence of more than one AM fungal species on indi-vidual root segments is thought to be uncommon (Wilson and Tommerup, 1992)and AM fungal species differ in their ability to colonize host roots in the presenceof another AM fungal species (Lopez-Aguillon and Mosse, 1987). These observa-tions suggest that, in addition to a variety of abiotic factors (P concentration, pH,water potential, and temperature), competition may be an important factor struc-turing AM fungal communities. The degree to which plant nutrition is improvedvaries among species and isolates of AM fungi (Wilson and Tommerup, 1992); there-fore, the results of competitive interactions among AM fungi during the coloniza-tion of a host plant will have important consequences for the subsequent healthof that individual plant, possibly with implications at community and ecosystemlevels.
Klironomos (2003) demonstrated the varying responses of several plant specieswhen individually colonized by different AM fungal species. The growth of individ-ual plant species ranged from highly positive to highly negative relative to uninoc-ulated control plants and was inconsistent across species of AM fungi (Fig. 10.5),suggesting a range of symbiotic outcomes from mutualistic to parasitic in arbus-cular mycorrhizas. The mechanism behind this range of functional responses isnot understood, but may be related to the degree of colonization and trade-offsassociated with the extent of the hyphal network extending into the soil. AM fungalspecies vary in the biomass of extraradical hyphae produced; fungal associatesthat produce a larger hyphal network occupy a greater volume of soil and increase thepotential for nutrient uptake but demand more photosynthetic C than associates
270 Chapter 10 The Ecology of Plant–Microbial Mutualisms
Ch10-P546807.qxd 11/18/06 6:57 PM Page 270

that produce a smaller extraradical hyphal network. Therefore, plant growthresponses will depend on the overall benefits of expanding access to nutrients rel-ative to the costs of maintaining the hyphal network. Differences in nutrientrequirements and uptake ability among plant species likely contribute to the idio-syncratic nature of this interaction. As a result, stoichiometric responses in plantcommunities may be indirectly influenced by competitive interactions among AMfungal species during root colonization.
The spatial and temporal succession of EM fungi in a transplanted birch(Betula spp.) forest in Scotland has been well studied and suggests that interac-tions among EM fungi may influence the structure of EM communities (Deaconand Fleming, 1992). Diversity of fruit bodies increased progressively for up to atleast 14 years. Fruiting bodies of EM species, observed near the base of the treesin previous years, appeared farther away from the tree base in successive years, beingreplaced in their previous distributions by fruiting bodies of previously unobservedspecies. Lactarius pubescens and Hebeloma velutipes were associated with youngerroots and were thus found farther away from the tree base, while a Cortinarius sp.and Russula spp. were found associated with older roots near the tree base. A similarsuccession may occur within AM fungal communities. Johnson et al. (1991)observed that, along a field-to-forest chronosequence, Acaulospora laevis,Acaulospora scrobiculata, Acaulospora spinosa, Glomus aggregatum, Scutellosporacalospora, Scutellospora erythropa, and Scutellospora persica spores were asso-ciated with early successional sites, while Acaulospora elegans, Gigaspora gigantea,Glomus ambisporum, Glomus fasciculatum, and Glomus microcarpum sporeswere associated with late successional sites; however, more study is required todetermine if these apparent successional patterns are due to AM fungal interspecificinteractions or just a shift of the AM fungal community in response to the changingplant community and/or abiotic characteristics of the chronosequence.
Competition among rhizobia has been studied with the goal of determining thenecessary conditions for inoculant strains to nodulate hosts in the presence ofindigenous strains, which may be inferior N2 fixers. Several factors affect the out-come of competition for nodulation, including abundance; soil fertility, pH, temper-ature, and moisture; presence of predators, parasites, and antagonists; and pesticideuse (Dowling and Broughton, 1986). The relative attractiveness of specific sugars,amino acids, and other components of the root exudates from host and nonhostplants differs among species of rhizobia. Strains also differ in motility, affectingthe speed at which individual rhizobia encounter and nodulate the host. The pres-ence of blocking strains, those that initiate infection thread formation and roothair curling but do not complete nodulation, can prevent competent rhizobia fromnodulating the host plant.
Dual colonization of plants by AM fungi and rhizobia, in legumes, or Frankia,in nonlegumes, is common and has additive effects on nodulation, AM fungal col-onization, and plant nutrition (Azcon-Aguilar and Barea, 1992; Dar et al., 1997;Jha et al., 1993; Siddiqui and Mahmood, 1995). The high P requirements in nod-ules during N2 fixation (due to the upward of 25 to 30 mol of ATP required
Interactions among Mutualists 271
Ch10-P546807.qxd 11/18/06 6:57 PM Page 271

per mole of N2 fixed) and the N demanded by AM fungi during chitin synthesissuggest a physiological basis for this correlation between the presence of nodulesand arbuscular mycorrhizas in root systems. Kucey and Paul (1982) observed thatAM beans supported greater nodule biomass and greater rates of N2 and CO2 fix-ation than nonmycorrhizal beans. The greater rate of C utilization by nodules in AMbeans (12% of total fixed C vs 6% in nonmycorrhizal beans) was offset byenhanced CO2 fixation. Therefore, requirements for potentially limiting nutrients(C, N, P) in each individual symbiosis may be overcome by the presence of addi-tional symbioses on the same host, enhancing the levels at which all processesoccur and increasing the benefits to all participants in the tripartite symbiosis. The con-sequence of this tripartite symbiosis for the outcome of competitive interactionswith plant species that participate in only one symbiosis is currently not known.
Molecular and biochemical investigations of tripartite symbioses have revealeda great deal of similarity between mycorrhizal and rhizobial symbioses, despite dif-ferences in morphological characteristics. Prior to colonization, signaling moleculesderived from the AM fungal mycelium (putative “Myc factors”) trigger similarresponses in plants as to analogous molecules of rhizobial origin (“Nod factors”), asindicated by patterns of flavonoid accumulation (Vierheilig, 2004). In legumes,several of the same genes are induced during interactions with either rhizobia orAMF, and most nonnodulating mutants are also unable to form symbioses with AMfungi (Albrecht et al., 1999). Recent research has uncovered divergence betweenAM fungi and rhizobia in terms of plant gene regulation, but also common patternsof gene induction between an AM fungus, G. mosseae, and an endophytic, plant-growth-promoting bacterium, Pseudomonas fluorescens (Sanchez et al., 2004). Theauthors suggested that the observed patterns of divergence and similarity may bedue to anatomical aspects of the symbioses, with nodule formation initiated bySinorhizobium melloti requiring much more reorganization of root structures thanduring colonization by G. mosseae and P. fluorescens.
INTERACTIONS WITH PATHOGENS
A disease is a deviation from the normal physiological status of an organism orits parts, resulting from the activity of biotic and abiotic factors, such that its vitalfunctions are impaired. A variety of pathogenic soil microorganisms can causediseases in plants, including viruses, bacteria, fungi, oomycetes, and nematodes.The interactions between several pathogens and plants are similar to the mutualismsdiscussed above in that they represent intimate relationships between organismsin which one colonizes the intra- or intercellular space within the roots, they caninvolve significant structural reorganization of root anatomy, and they require molec-ular signaling by both of the participants during the processes of recognition, infec-tion, and colonization of roots. However, interactions resulting in disease are gearedtoward maximizing the fitness of one group while negatively affecting the host.Given the diversity of plant pathogens, no attempt will be made here to discuss
272 Chapter 10 The Ecology of Plant–Microbial Mutualisms
Ch10-P546807.qxd 11/18/06 6:57 PM Page 272

their individual life history characteristics, except in the context of their interactionswith mutualistic plant associates and the resultant effects on plant population andcommunity dynamics. For an introduction to these pathogens and their importancein plant pathology see Bruehl (1987).
Biological control of disease-causing organisms using plant mutualists hasbeen, and continues to be, a goal of some researchers studying these mutualisms.As with most biological control agents, field trials frequently provide inconsistentand/or inconclusive results, although there have been several observations of reduc-tions in disease-causing organisms and disease levels in crop plants following inoc-ulation with plant mutualists. Laboratory studies suggest several mechanisms bywhich mutualists of plants reduce disease in plant hosts: directly, via antagonism orantibiosis, or indirectly, via enhanced nutritional status of the host, competition forinfection sites or limiting nutrients in the rhizosphere, alteration of root morphology,and induction of host defenses. Most studies investigating interactions betweendisease-causing organisms and plant associates and their consequences for hosthealth have focused on plant-pathogenic (PP) fungi and nematodes. Few studieshave focused on interactions with bacterial and viral pathogens or root herbivores.Some AM fungi have been observed to reduce infection of soybean, eggplant, cucum-ber, mulberry, and grape by Pseudomonas spp. AM hosts tend to exhibit elevatedviral loads and greater levels of viral diseases, hypothesized to be due to higher P levels in AM plant tissue improving host quality and facilitating viral growth(Xavier and Boyetchko, 2002). In addition, a few studies have shown reduced survivorship of larval insects feeding on AM roots relative to those feeding onnonmycorrhizal roots (see Gange and Bower, 1996, for a brief review).
There are several papers that chronicle the effects of EM and AM fungi on pop-ulations of PP fungi and disease severity. Dehne (1982) summarized the literaturepertaining to the impact of mycorrhizal fungi on PP fungi and found that there wasevidence for both increased and decreased levels of PP fungi and plant disease inthe presence of mycorrhizal fungi. Increased disease levels were suggested to bedue to enhanced nutritional status of the host, making it a higher quality resourcefor the pathogenic fungus. Reduced disease levels might be explained by enhancedhost vigor, interference with pathogen infection, or competition for habitat withinroots. For EM fungi, there is also the possibility of direct chemical antagonism ofpathogenic fungi (Duchesne et al., 1988).
Interactions between AM fungi and PP nematodes appear to be symmetrical,with the outcome dependent on the order of infection. The two groups appear tobe incompatible, competing for habitat within the roots or indirectly altering thequality and/or quantity of habitat available for the other group. AM fungi are unableto colonize root segments parasitized by endoparasitic nematodes. AM structuresare usually not found in galled tissues inhabited by galling nematodes, whether live,inactive, or dead, suggesting that physiological changes involved in the formationof root galls make these roots inhospitable to AM fungi. Ectoparasitic nematodesinflict damage to root tissue such that AM fungal colonization of these damagedroots is reduced.
Interactions with Pathogens 273
Ch10-P546807.qxd 11/18/06 6:57 PM Page 273
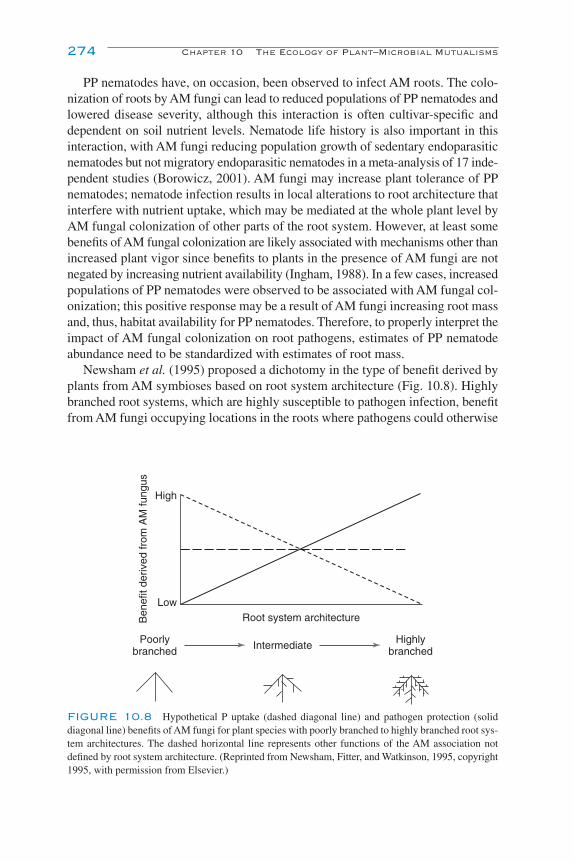
PP nematodes have, on occasion, been observed to infect AM roots. The colo-nization of roots by AM fungi can lead to reduced populations of PP nematodes andlowered disease severity, although this interaction is often cultivar-specific anddependent on soil nutrient levels. Nematode life history is also important in thisinteraction, with AM fungi reducing population growth of sedentary endoparasiticnematodes but not migratory endoparasitic nematodes in a meta-analysis of 17 inde-pendent studies (Borowicz, 2001). AM fungi may increase plant tolerance of PPnematodes; nematode infection results in local alterations to root architecture thatinterfere with nutrient uptake, which may be mediated at the whole plant level byAM fungal colonization of other parts of the root system. However, at least somebenefits of AM fungal colonization are likely associated with mechanisms other thanincreased plant vigor since benefits to plants in the presence of AM fungi are notnegated by increasing nutrient availability (Ingham, 1988). In a few cases, increasedpopulations of PP nematodes were observed to be associated with AM fungal col-onization; this positive response may be a result of AM fungi increasing root massand, thus, habitat availability for PP nematodes. Therefore, to properly interpret theimpact of AM fungal colonization on root pathogens, estimates of PP nematodeabundance need to be standardized with estimates of root mass.
Newsham et al. (1995) proposed a dichotomy in the type of benefit derived byplants from AM symbioses based on root system architecture (Fig. 10.8). Highlybranched root systems, which are highly susceptible to pathogen infection, benefitfrom AM fungi occupying locations in the roots where pathogens could otherwise
274 Chapter 10 The Ecology of Plant–Microbial Mutualisms
High
Low
Poorlybranched
HighlybranchedIntermediate
Root system architectureBen
efit
deriv
ed fr
om A
M fu
ngus
FIGURE 10.8 Hypothetical P uptake (dashed diagonal line) and pathogen protection (soliddiagonal line) benefits of AM fungi for plant species with poorly branched to highly branched root sys-tem architectures. The dashed horizontal line represents other functions of the AM association notdefined by root system architecture. (Reprinted from Newsham, Fitter, and Watkinson, 1995, copyright1995, with permission from Elsevier.)
Ch10-P546807.qxd 11/18/06 6:57 PM Page 274

colonize. Poorly branched root systems, which are less susceptible to pathogeninfection, but occupy a relatively low volume of soil, benefit primarily as a resultof P uptake by AM fungi. The authors use three pieces of evidence to support theirmodel: (1) a positive correlation between P inflow and specific root tip number (a measure of root system branching) for seven forb and grass species; (2) a positivecorrelation between P uptake and percentage root length colonized by AM fungiin two plant species with poorly branched root systems, Hyacinthoides non-scriptaand Ranunculus adoneus; and (3) the observation that a Glomus sp. provides pathogenprotection to Vulpia ciliata, an annual grass with a highly branched root system,yet does not enhance P uptake. However, further tests of this model have not beenconducted.
Although less studied than mycorrhizal fungi for their potential to reduce patho-gen loads on host plants, rhizobia can reduce infection rates by, and enhance hosttolerance to, pathogenic fungi. This enhanced tolerance is probably due to greaterplant health and the stimulation of defense compounds, but possibly also to pro-duction of antifungal compounds. For instance, rhizobitoxine plays a role in nod-ule development, but has also been observed to inhibit growth of Macrophominaphaseolina in culture plates (Chakraborty and Purkayastha, 1984). Field trials usingselected species of Rhizobium and Bradyrhizobium resulted in reduced infectionrates of host and nonhost crops (including nonleguminous crops) by M. phaseolina,Rhizoctonia solani, and Fusarium spp. (Ehteshamul-Haque and Ghaffar, 1993).Fungal growth was reduced in culture, suggesting that competitive or antagonisticinteractions between rhizobia and fungi may have played an important role in reduc-ing infection rates. Rhizobia have been observed to be stimulated by and migratetoward roots of nonlegumes, perhaps explaining the reduced infection rates of non-leguminous crops.
IMPLICATIONS FOR PLANT POPULATIONSAND COMMUNITIES
Much of the study of plant–microbial mutualisms has focused on interactions atthe level of individual plants, yet the effects of these mutualisms are also observedin plant populations and communities. Plant population dynamics are driven by anumber of factors (e.g., competition with other plants, herbivory, resource availabil-ity) that are mediated or strengthened by mycorrhizal fungi and rhizobia. Plantsthat engage in symbioses with N-fixing bacteria are able to thrive under conditionsof low N availability but also foster conditions, through the process of N2 fixation,that eventually allow for the growth of other plant species and facilitate succession.Complex interactions among plants and AM fungi influence the structure of plantcommunities; increasing AM fungal species diversity enhanced plant species diver-sity in abandoned agricultural fields, likely due to interactions between individualplant and fungal species modifying competitive interactions among plants (van derHeijden et al., 1998).
Implications for Plant Populations and Communities 275
Ch10-P546807.qxd 11/18/06 6:57 PM Page 275

Recent research has been focused on elucidating the roles of plant–microbialmutualisms in invasion by nonnative species. Nonnative plant species can use myc-orrhizal fungi to facilitate invasion of plant communities. For example, AM fungiimprove the competitive ability of invasive spotted knapweed (Centaurea maculosa)against some native grass and forb species (Callaway et al., 2004). Other nonnativeplants disrupt mycorrhizal mutualisms to prevent recruitment of native plants. Forexample, garlic mustard (Alliaria petiolata) produces allelochemicals that havenegative effects on AM fungal communities, reducing growth of native seedlings(Stinson et al., 2006). In some cases, the establishment of nonnative plants is lim-ited by the absence of mutualists in the nonnative range. Establishment in NewZealand and South Africa of nonnative Pinus spp. is limited to areas where suit-able EM fungi have either invaded or been introduced, and invasiveness of actin-orrhizal plants is linked to their ability to form symbioses with native Frankia spp.(Richardson et al., 2000).
In some cases, our basic understanding of plant-microbial mutualisms has alreadybeen applied for practical purposes. There has been some success in the use ofthese organisms, either inundatively in small-scale plantings or as inoculants priorto the distribution of seedlings or rootstock to growers. Strains of Bradyrhizobiumjaponicum are commercially available as an inoculant to promote nodulation oflegume field and greenhouse crops. Inoculation of plant seedlings with mycor-rhizal fungi prior to transplantation can be a useful technique to enhance produc-tivity of orchard crops and to promote reforestation and revegetation efforts, suchas those for mine spoils. Also, with a greater understanding of how symbiontsof plants respond to disturbances of anthropogenic origin (e.g., climate change,N deposition, introduction of invasive plant species), it may be possible to predicthow the structure and functioning of natural and agricultural ecosystems will beinfluenced by these disturbances and to take the appropriate steps to prevent ormediate their effects.
CHALLENGES IN THE STUDY OF INTERACTIONS
A major problem associated with studying interactions involving plant–microbialmutualisms is our inability to monitor accurately and precisely the populationdynamics of soil and root-associated microorganisms (see Chaps. 3 and 4). Indirectmeasures of interaction strength focus on functional responses, such as diseaseseverity or growth response of the plant following inoculation with different com-binations of microbes. Direct measures, such as counting bacteria or measuringfungal biomass, are problematic because they tend to overestimate viable populationsize. Culture-dependent methods work only for the small fraction of soil microor-ganisms that can be cultured on artificial media. AM fungi are obligate symbiontsand can be cultured only on living roots, so abundance is estimated by the extentto which fungi colonize roots, which provides no means of determining the actual
276 Chapter 10 The Ecology of Plant–Microbial Mutualisms
Ch10-P546807.qxd 11/18/06 6:57 PM Page 276

abundance of AM fungi in soil, or by spore counts, which may overestimate theabundance of viable propagules.
Technological advances are aiding our understanding of plant–microbial mutu-alisms. Physiological and molecular markers (e.g., phospholipid fatty acids, proteins)allow for some resolution of microbial identity and abundance in soil and roots.Recent advances in the isolation and quantification of DNA from soil and plant tissuewill be extremely valuable for studying the population and community dynamicsof soil and root-associated microorganisms in real time. For example, Filion et al.(2003) developed a protocol using quantitative polymerase chain reaction (PCR) tostudy interactions between G. intraradices and F. solani. Using this protocol, plantsinoculated with G. intraradices supported measurably reduced population levelsof F. solani, corresponding to reductions in disease severity, that were not detectedusing culture-dependent techniques (Table 10.2). Soil community fingerprintingusing PCR-based techniques (e.g., degrading-gradient gel electrophoresis, terminalrestriction fragment length polymorphism) and comparing cloned gene sequencesto existing sequence databases are other ways of characterizing microbial commu-nities and determining how components of the soil community differ in responseto different biotic and abiotic factors (Fig. 10.9).
CONCLUSIONS
A diverse assemblage of plant–microbial mutualisms exists in the rhizosphere andrhizoplane. A primary focus of ecological research into plant–microbial mutualismshas been to understand the role that mutualistic symbioses play in promoting plantproductivity. Recent research, however, has illuminated the fact that these sym-bioses likely function along a continuum, from mutualism to parasitism; this newview has enhanced our understanding of how plant communities are structured
Conclusions 277
TABLE 10.2 Comparison of Culture-Based and Molecular Techniques for Estimating theEffect of Glomus intraradices on the Abundance of Fusarium solani f. sp. phaseoli
F. solani abundance F. solani abundance Soil compartment Treatment (CFU � 1000/g soil) (µg DNA/g soil)
Rhizosphere Glomus present 2.52a 7.89a
Glomus absent 1.95a 33.03b
Mycosphere Glomus present 3.12a 12.40a
Glomus absent 4.39a 93.69b
Bulk soil Glomus present 2.79a 17.65a
Glomus absent 2.34a 46.83b
Number of colony-forming units (CFU) was estimated on Nash–Snyder medium supplementedwith benomyl, while quantitative PCR was used to quantify F. solani DNA. Different letters indicatethat F. solani abundance, in the sampled soil compartment, differed significantly between the twoGlomus treatments (data from Filion et al., 2003).
Ch10-P546807.qxd 11/18/06 6:57 PM Page 277
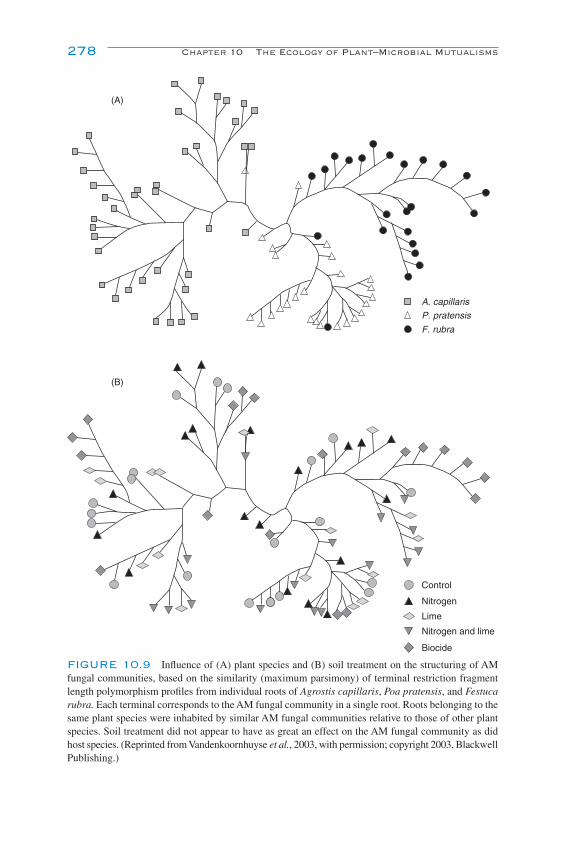
278 Chapter 10 The Ecology of Plant–Microbial Mutualisms
A. capillaris
F. rubra
P. pratensis
Control
Nitrogen and lime
Nitrogen
Lime
Biocide
(A)
(B)
FIGURE 10.9 Influence of (A) plant species and (B) soil treatment on the structuring of AMfungal communities, based on the similarity (maximum parsimony) of terminal restriction fragmentlength polymorphism profiles from individual roots of Agrostis capillaris, Poa pratensis, and Festucarubra. Each terminal corresponds to the AM fungal community in a single root. Roots belonging to thesame plant species were inhabited by similar AM fungal communities relative to those of other plantspecies. Soil treatment did not appear to have as great an effect on the AM fungal community as didhost species. (Reprinted from Vandenkoornhuyse et al., 2003, with permission; copyright 2003, BlackwellPublishing.)
Ch10-P546807.qxd 11/18/06 6:57 PM Page 278

and may affect how mutualistic symbioses are exploited in agriculture and forestry.The ubiquity of mutualistic symbioses in the rhizosphere and rhizoplane, as wellas the high levels of microbial diversity and activity in general, guarantees that theseregions are rich in interactions, many of which influence plant growth and fitness,community dynamics, and ecosystem functioning. A greater understanding of theseinteractions could allow us to better predict the effects of anthropogenic distur-bances on the functioning of ecosystems and may lead to more effective microbialinoculants for use in agriculture and restoration. However, our ability to fullyunderstand these interactions has been hampered by the opaque nature of the soilenvironment, the heterogeneity of soil, and the sheer number of linkages in theseinteractions. Also confounding matters is our inability to culture the majority oforganisms present within the soil. New technologies show great promise for char-acterizing the composition of microbial communities associated with roots and soiland should allow us to resolve some of the interactions among mutualists, othersoil organisms, and plants that are occurring in the soil environment.
REFERENCES AND SUGGESTED READING
Albrecht, C., Geurts, R., and Bisseling, T. (1999). Legume nodulation and mycorrhizae formation: twoextremes in host specificity meet. EMBO J. 18, 281–288.
Azcon-Aguilar, C., and Barea, J. M. (1992). Interactions between mycorrhizal fungi and other rhizos-phere microorganisms. In “Mycorrhizal Functioning” (M. F. Allen, ed.), pp. 163–198. Chapman &Hall, New York.
Borowicz, V. A. (2001). Do arbuscular mycorrhizal fungi alter plant–pathogen relations? Ecology 82,3057–3068.
Bruehl, G. W. (1987). “Soilborne Plant Pathogens.” Macmillan, New York.Callaway, R. A., Thelen, G. C., Barth, S., Ramsey, P. W., and Gannon, J. E. (2004). Soil fungi alter inter-
actions between the invader Centaurea maculosa and North American natives. Ecology 85, 1062–1071.Chakraborty, U., and Purkayastha, R. P. (1984). Role of rhizobitoxine in protecting soybean roots
from Macrophomina phaseolina infection. Can. J. Microbiol. 30, 285–289.Clay, K. (1990). Fungal endophytes of grasses. Annu. Rev. Ecol. Syst. 21, 275–297.Dalpé, Y. (2003). Mycorrhizal fungi biodiversity in Canadian soils. Can. J. Soil Sci. 83, 321–330.Dar, G. H., Zargar, M. Y., and Beigh, G. M. (1997). Biocontrol of Fusarium root rot in the common
bean (Phaseolus vulgaris L.) by using symbiotic Glomus mosseae and Rhizobium leguminosarum.Microbial. Ecol. 34, 74–80.
Deacon, J. W., and Fleming, L. V. (1992). Interactions of ectomycorrhizal fungi. In “MycorrhizalFunctioning” (M. F. Allen, ed.), pp. 249–300. Chapman & Hall, New York.
Dehne, H. W. (1982). Interaction between vesicular–arbuscular mycorrhizal fungi and plant pathogens.Phytopathology 72, 1115–1119.
Dowling, D. N., and Broughton, W. J. (1986). Competition for nodulation of legumes. Annu. Rev.Microbiol. 40, 131–157.
Duchesne, L. C., Peterson, R. L., and Ellis, B. E. (1988). Pine root exudates stimulate the synthesis ofantifungal compounds by the ectomycorrhizal fungus Paxillus involutus. New Phytol. 111, 693–698.
Ehteshamul-Haque, E., and Ghaffar, A. (1993). Use of rhizobia in the control of root rot diseases ofsunflower, okra, soybean, and mungbean. J. Phytopathol. 138, 157–163.
Filion, M., St-Arnaud, M., and Jabaji-Hare, S. H. (2003). Quantification of Fusarium solani f. sp.phaseoli in mycorrhizal bean plants and surrounding mycorrhizosphere soil using real-time poly-merase chain reaction and direct isolations on selective medium. Phytopathology 93, 229–235.
References and Suggested Reading 279
Ch10-P546807.qxd 11/18/06 6:57 PM Page 279
Fitter, A. H. (2005). Darkness visible: reflections on underground ecology. J. Ecol. 93, 231–243.Gange, A. C., and Bower, E. (1996). Interactions between insects and mycorrhizal fungi. In “Multitrophic
Interactions in Terrestrial Systems” (A. C. Gange and V. K. Brown, eds.), pp. 115–132. BlackwellSci., Oxford.
Gange, A. C., Brown, V. K., and Aplin, D. M. (2003). Multitrophic links between arbuscular mycor-rhizal fungi and insect parasitoids. Ecol. Lett. 6, 1051–1055.
Gehring, C. A., and Whitham, T. G. (2002). Mycorrhizae–herbivore interactions: population and com-munity consequences. Ecol. Stud. 157, 295–320.
Graham, J. H. (1988). Interactions of mycorrhizal fungi with soilborne plant pathogens and otherorganisms: an introduction. Phytopathology 78, 365–366.
Graham, J. H. (2000). Assessing costs of arbuscular mycorrhizal symbiosis in agroecosystems. In“Current Advances in Mycorrhizae Research” (G. K. Podila and D. D. Douds, eds.), pp. 127–140.Am. Phytopathol. Soc. Press, St. Paul, MN.
Graham, J. H., Leonard, R. T., and Menge, J. A. (1981). Membrane-mediated decrease in root exuda-tion responsible for phosphorus inhibition of vesicular–arbuscular mycorrhiza formation. PlantPhysiol. 68, 584–552.
Ingham, R. E. (1988). Interactions between nematodes and vesicular–arbuscular mycorrhizae. Agric.Ecosyst. Environ. 24, 169–182.
Jha, D. K., Sharma, G. D., and Mishra, R. R. (1993). Mineral nutrition in the tripartite interaction betweenFrankia, Glomus, and Alnus at different soil phosphorus regimes. New Phytol. 123, 307–311.
Johnson, N. C. (1993). Can fertilization of soil select less mutualistic mycorrhizae. Ecol. Appl. 3, 749–757.Johnson, N. C., Zak, D. R., Tilman, D., and Pfleger, F. L. (1991). Dynamics of vesicular–arbuscular
mycorrhizae during old field succession. Oecologia 86, 349–358.Kendrick, B. (2001). “The Fifth Kingdom.” 3rd ed. Mycologue, Sidney.Kiers, E. T., Rousseau, R. A., West, S. A., and Denison, R. F. (2003). Host sanctions and the legume–
rhizobium mutualism. Nature 425, 78–81.Klironomos, J. N. (2003). Variation in plant response to native and exotic arbuscular mycorrhizal
fungi. Ecology 84, 2292–2301.Kucey, R. M. N., and Paul, E. A. (1982). Carbon flow, photosynthesis, and N2 fixation in mycorrhizal
and nodulated faba beans (Vicia faba L.). Soil Biol. Biochem. 14, 407–412.Linderman, R. G. (1988). Mycorrhizal interactions with the rhizosphere microflora: the mycorrhizo-
sphere effect. Phytopathology 78, 366–371.Lindow, S. E., and Brandl, M. T. (2003). Microbiology of the phyllosphere. Appl. Environ. Microbiol.
69, 1875–1883.Lopez-Aguillon, R., and Mosse, B. (1987). Experiments on the competitiveness of three endomycor-
rhizal fungi. Plant Soil 97, 155–170.Newsham, K. K., Fitter, A. H., and Watkinson, A. R. (1995). Multi-functionality and biodiversity in
arbuscular mycorrhizas. Trends Ecol. Evol. 10, 407–411.Peterson, R. L., Massicotte, H. B., and Melville, L. H. (2004). “Mycorrhizas: Anatomy and Cell
Biology.” Natl. Rsch. Council, Ottawa.Philip, L. J., Posluszny, U., and Klironomos, J. N. (2001). The influence of mycorrhizal colonization
on the vegetative growth and sexual reproductive potential of Lythrum salicaria L. Can. J. Bot. 79,381–388.
Poulton, J. L., Koide, R. T., and Stephenson, A. G. (2001). Effects of mycorrhizal infection, soil phos-phorus availability and fruit production on the male function in two cultivars of Lycopersicon escu-lentum. Plant Cell Environ. 24, 841–849.
Read, D. J. (2002). Towards ecological relevance—progress and pitfalls in the path towards an under-standing of mycorrhizal functions in nature. Ecol. Stud. 157, 3–29.
Redecker, D., Kodner, R., and Graham, L. E. (2000). Glomalean fungi from the Ordovician. Science14, 1920–1921.
Richardson, D. M., Allsopp, N., D’Antonio, C. M., Milton, S. J., and Rejmanek, M. (2000).Plant invasions—the role of mutualisms. Biol. Rev. 75, 65–93.
280 Chapter 10 The Ecology of Plant–Microbial Mutualisms
Ch10-P546807.qxd 11/18/06 6:57 PM Page 280
Rolfe, B. G., and Gresshoff, P. M. (1988). Genetic analysis of legume nodule initiation. Annu. Rev.Plant Physiol. 39, 297–319.
Roy, B. A. (1993). Floral mimicry by a plant pathogen. Nature 362, 56–58.Sanchez, L., Weidmann, S., Brechenmacher, L., et al. (2004). Common gene expression in Medicago
truncatula roots in response to Pseudomonas fluorescens colonization, mycorrhiza developmentand nodulation. New Phytol. 161, 855–863.
Sargent, L., Huang, S. Z., Rolfe, B. G., and Djordjevic, M. A. (1987). Split-root assays using Trifoliumsubterraneum show that Rhizobium infection induces a systemic response that can inhibit nodula-tion of another invasive Rhizobium strain. Appl. Environ. Microbiol. 53, 1611–1619.
Siddiqui, Z. A., and Mahmood, I. (1995). Biological control of Heterodera cajani and Fusarium udumby Bacillus subtilis, Bradyrhizobium japonicum, and Glomus fasciculatum on pigeonpea. Fundam.Appl. Nematol. 18, 559–566.
Smith, S. E., and Read, D. J. (1997). “Mycorrhizal Symbiosis.” 2nd ed. Academic Press, London.Stinson, K. A., Campbell, S. A., Powell, J. R., et al. (2006). Invasive plant suppresses the growth of
native tree seedlings by disrupting belowground mutualisms. PLoS Biol. 4, 727–731.van der Heijden, M. G. A., Klironomos, J. N., Ursic, M., et al. (1998). Mycorrhizal fungal diversity
determines plant biodiversity, ecosystem variability and productivity. Nature 396, 69–72.Vandenkoornhuyse, P., Ridgway, K. P., Watson, I. J., Fitter, A. H., and Young, J. P. W. (2003). Mol. Ecol.
12, 3085–3095.Verghese, S., and Misra, A. K. (2002). Frankia–actinorhizal symbiosis with special reference to
host–microsymbiont relationship. Curr. Sci. 83, 404–408.Vierheilig, H. (2004). Regulatory mechanisms during the plant–arbuscular mycorrhizal fungus inter-
action. Can. J. Bot. 82, 1166–1176.West, S. A., Kiers, E. T., Simms, E. L., and Denison, R. F. (2002). Sanctions and mutualism stability:
why do rhizobia fix nitrogen? Proc. R. Soc. London B Biol. 269, 685–694.Wilson, J. M., and Tommerup, I. C. (1992). Interactions between fungal symbionts: VA mycorrhizae.
In “Mycorrhizal Functioning” (M. F. Allen, ed.), pp. 199–248. Chapman & Hall, New York.Wolfe, B. E., Husband, B. C., and Klironomos, J. N. (2005). Effects of a belowground mutualism on
an aboveground mutualism. Ecol. Lett. 8, 218–223.Xavier, L. J. C., and Germida, J. J. (2003). Bacteria associated with Glomus clarum spores influence
mycorrhizal activity. Soil Biol. Biochem. 35, 471–478.Xavier, L. J. C., and Boyetchko, S. M. (2002) Mycorrhizae as biocontrol agents. In “Techniques in
Mycorrhizal Studies” (K. G. Mukerji, C. Manoharachary, and B. P. Chamola, eds.), pp. 493–536.Kluwer Academic, Dordrecht.
References and Suggested Reading 281
Ch10-P546807.qxd 11/18/06 6:57 PM Page 281

Ch10-P546807.qxd 11/18/06 6:57 PM Page 282

11SPATIAL DISTRIBUTION OF
SOIL ORGANISMS
Serita D. Frey
Introduction
Geographical Differences in Soil Biota
Association of Soil Organisms with Plants
Spatial Heterogeneity of Soil Organisms
Vertical Distribution within the Soil Profile
Microscale Heterogeneity in Microbial Populations
References and Suggested Reading
283
INTRODUCTION
Soil biota, which represent a large proportion of Earth’s biodiversity, have aworldwide distribution. Once thought to be restricted to the top few meters ofterrestrial ecosystems, soil organisms are now known to survive and grow in someseemingly unlikely and often inhospitable places, including in the canopies oftropical forest trees, in deep subsurface environments, in recently deposited vol-canic materials, under deep snow in alpine systems, in Antarctic Dry Valley soils,and in cryoconite holes, pockets of meltwater containing windblown soil on thesurface of glaciers (Fig. 11.1). While there are still large gaps in our understand-ing of how soil organisms are distributed, there has been a dramatic increase ininformation obtained in this area over the past decade. This chapter summarizeswhat is known about the distribution of soil biota, from geographic differences atthe regional and global scale down to variability in microbial populations at themicroscale.
Ch11-P546807.qxd 11/18/06 7:03 PM Page 283
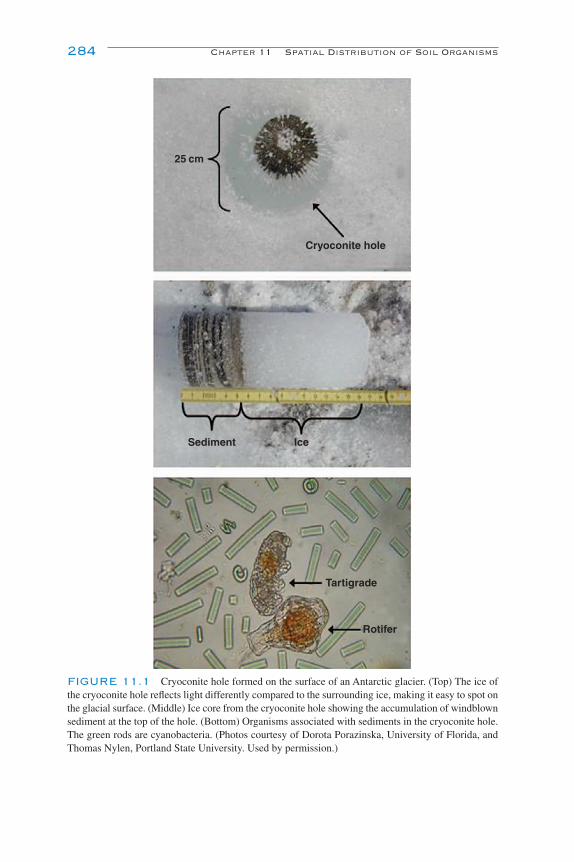
284 Chapter 11 Spatial Distribution of Soil Organisms
25 cm
Cryoconite hole
Sediment Ice
Tartigrade
Rotifer
FIGURE 11.1 Cryoconite hole formed on the surface of an Antarctic glacier. (Top) The ice ofthe cryoconite hole reflects light differently compared to the surrounding ice, making it easy to spot onthe glacial surface. (Middle) Ice core from the cryoconite hole showing the accumulation of windblownsediment at the top of the hole. (Bottom) Organisms associated with sediments in the cryoconite hole.The green rods are cyanobacteria. (Photos courtesy of Dorota Porazinska, University of Florida, andThomas Nylen, Portland State University. Used by permission.)
Ch11-P546807.qxd 11/18/06 7:03 PM Page 284
GEOGRAPHICAL DIFFERENCESIN SOIL BIOTA
Most macroscopic plant and animal species have a restricted geographic distri-bution because of natural barriers to migration (e.g., mountain ranges) and climatesensitivity. This isolation has, over geological time, led to the evolution of newspecies and the development of geographically distinct plant and animal commu-nities. Global distributions of most of the world’s flora and fauna are generallyknown. There has been much less emphasis on understanding and mapping thebiogeography of microscopic organisms. Although molecular analysis has revealedthat microbial diversity in soils far exceeds that of macroscopic organisms, thegeographical patterns of this diversity and the factors controlling these patternsare only beginning to be examined. Most studies that have been done have focusedon human and animal pathogens (e.g., Escherichia coli, Haemophilus influenzae).A common perception is that microorganisms are cosmopolitan in their distribu-tion, being capable of growth in many different places worldwide. This idea goesback more than a century to Martinus Beijerinck, a Dutch soil microbiologist,who suggested that “everything is everywhere, the environment selects,” meaningthat microbial species can be found wherever their environmental requirementsare met. However, the concept of a common occurrence of soil microorganismsmay be more apparent than real due to a lack of information on microbial distri-butions. As more details of microbial populations are delineated with biochemicaland molecular techniques, it may be found that at least some soil organisms arerestricted to specific geographical areas (i.e., they are endemic).
Certainly microorganisms have had the opportunity over time to become dis-tributed worldwide. Due to their small size and large numbers, they are continu-ously being moved around, often across continental-scale distances. Dispersalmechanisms include water transport via rivers, groundwater, and ocean currents;airborne transport in association with dust particles and aerosols, especially dur-ing extreme weather events such as hurricanes and dust storms; transport on or inthe intestinal tract of migratory birds, insects, and aquatic organisms; and humantransport through air travel and shipping. Even isolated environments, like thosefound in the Antarctic, show a wide range of microbial species that appear to havebeen introduced from other places. Of 22 fungal genera identified in Antarctic soilsamples, 12 taxa were found exclusively in the area surrounding the AustralianCaseyu Research Station (Azmi and Seppelt, 1998). These fungi, dominated byPenicillium species, were presumably introduced into this environment by humanvisitors to the station. Thus almost any microbial species has the means to achievewidespread dispersal.
Further support for the idea that microorganisms have global distributionscomes from a study of protozoa living in the sediments of a crater lake in Australia(Finlay et al., 1999). This system is geographically isolated from northern Europe,where most known protozoan taxa have been isolated and identified. Of 85 speciescollected from the Australian system, all had been previously described and are
Geographical Differences in Soil Biota 285
Ch11-P546807.qxd 11/18/06 7:03 PM Page 285

known from northern Europe. They apparently reached the isolated crater by dis-persal from other freshwater, soil, and marine environments. Another argument forthe cosmopolitan distribution of protozoa is the relatively low number of speciesfound globally. For example, there are about 3000 known species of free-livingsoil ciliates. This is in comparison to 5 million insect species, many of which havegeographically restricted ranges. The implication here is that lower endemicity inprotozoa results in low global species richness since geographic isolation leadingto speciation will be rare (Finlay, 2002).
While it is generally agreed that many protozoan species are cosmopolitanin their distribution, this may not be the case for other microbial groups. Hetero-trophic soil bacteria, for example, have been shown to exhibit strict site endemism.Fluorescent Pseudomonas strains isolated from soil samples collected at 10 sites onfour continents showed no overlap between sites. The same genotype was foundonly in other soil samples from the same site and not at other sites in a region or onother continents (Cho and Tiedje, 2000). Intraspecific differences in the optimumgrowth temperature, pH, and substrate (NH4
�) concentration for the nitrifiers arealso known to exist. Penicillium is abundant in temperate and cold climates.Aspergillus predominates in warm areas. Fusarium wilt of bananas is inhibited inareas where the clay mineral smectite predominates. Cyanobacteria are commonlyfound in neutral to alkaline soils, but rarely under acidic conditions. The fungalcomponent of the microbial community appears to be particularly susceptible tochanges in soil conditions. For example, fungal biomass and fungal-derived organicmatter have been shown to be positively related to soil moisture as influenced bygradients in mean annual temperature and precipitation (Figs. 11.2 and 11.3). Thusregional differences do reflect the ability of soil organisms to respond to specificenvironmental controls.
In addition to species distributions, it is useful to consider regional and globalpatterns in soil microbial biomass, which represents between 2 and 5% of totalterrestrial soil C. Climate, vegetation, soil characteristics, and land-use patternsall interact to influence microbial abundance and biomass at a given location.Microbial biomass is generally positively related to soil organic matter contents inmost ecosystems, peat and organic soils being an exception. Levels of microbialbiomass are also typically correlated with soil clay content. Clay minerals pro-mote microbial growth by maintaining the pH in an optimal range, buffering thenutrient supply, adsorbing metabolites that are inhibitory to microbial growth, andproviding protection from desiccation and grazing through increased aggregation.Total amounts of microbial biomass are also impacted by land use, with lower lev-els typically observed in arable compared to undisturbed forest and grassland soilsdue to cultivation-induced losses of organic matter. Microbial biomass is also cor-related with latitude, with microbial biomass tending to be lower but more highlyvariable at high latitudes. This increased variability in microbial biomass withincreasing latitude is attributed to higher interseasonal variation in temperature(Wardle, 1998).
286 Chapter 11 Spatial Distribution of Soil Organisms
Ch11-P546807.qxd 11/18/06 7:03 PM Page 286
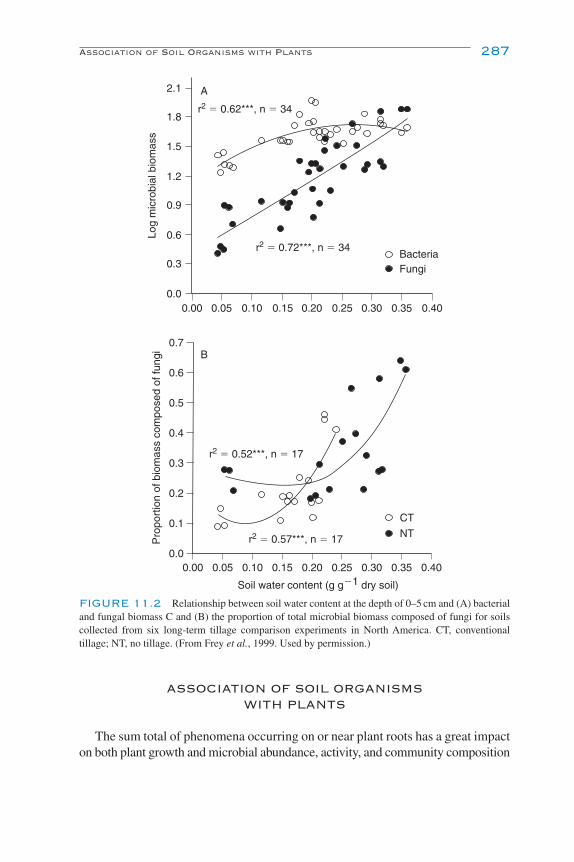
ASSOCIATION OF SOIL ORGANISMS WITH PLANTS
The sum total of phenomena occurring on or near plant roots has a great impacton both plant growth and microbial abundance, activity, and community composition
Association of Soil Organisms with Plants 287
2.1
1.8
1.5
1.2
0.9
0.6
0.3
0.0
0.7
0.6
0.5
0.4
0.3
0.2
0.1
0.0
0.00 0.05 0.10 0.15 0.20 0.25 0.30 0.35 0.40
0.00 0.05 0.10 0.15 0.20 0.25 0.30 0.35 0.40
r2 � 0.52***, n � 17
r2 � 0.72***, n � 34
r2 � 0.62***, n � 34
r2 � 0.57***, n � 17
BacteriaFungi
CT
NT
Soil water content (g g�1 dry soil)
Pro
port
ion
of b
iom
ass
com
pose
d of
fung
iLo
g m
icro
bial
bio
mas
s
A
B
FIGURE 11.2 Relationship between soil water content at the depth of 0–5 cm and (A) bacterialand fungal biomass C and (B) the proportion of total microbial biomass composed of fungi for soilscollected from six long-term tillage comparison experiments in North America. CT, conventionaltillage; NT, no tillage. (From Frey et al., 1999. Used by permission.)
Ch11-P546807.qxd 11/18/06 7:03 PM Page 287

(Fig. 11.4). Hiltner, in 1904, used the term rhizosphere for the area of bacterialgrowth around legume roots. Later the rhizosphere became generally known asthe soil region under the immediate influence of plant roots and in which there isa proliferation of microorganisms due to the influx of plant-derived labile organicmatter into the soil. Pathways for release of plant assimilates from roots includeturnover of fine roots, leakage or diffusion of molecules across cell membranes(exudation), and sloughing off of cells and tissue fragments during root growth.Root caps and tips are sites of active exudation, releasing mucilaginous materialas well as root caps and cells. Analyses of the organic materials found in the rhi-zosphere reveal a wide assortment of compounds, including aliphatic, amino, andaromatic acids and amides, sugars, amino sugars, cellulose, lignin, and protein.
Complex interactions and feedbacks occur at the plant–soil interface, representingpotentially important factors regulating ecosystem structure and functioning. Theseinteractions range from mutualistic to pathogenic and have long been recognizedfor their role in plant nutrition and nutrient cycling. More recently, plant–microbeinteractions have been found to influence the composition and diversity of bothplant and soil microbial communities. Microbial abundance, activity, and communitycomposition and diversity often reflect the plant species present in a given soil.For example, bacteria isolated from the rhizospheres of different grass species
288 Chapter 11 Spatial Distribution of Soil Organisms
2.5 3.0 3.5 4.0 4.5 5.0 5.5 6.045
4035
3025
20Clay%
In(MAP/MAT)
Glu
cosa
min
e (g
kg�
1 so
il)
1
2
3
r2 � 0.83; P � 0.0001
FIGURE 11.3 Glucosamine concentrations (g kg�1 soil) in soil of grassland ecosystems (�),no-tillage agroecosystems (▼), and conventional tillage agroecosystems (■) and their relationship withclay content, mean annual precipitation (MAP), and mean annual temperature (MAT). The grasslanddata were obtained from Amelung et al. (1999). (Figure from Six et al., 2006. Used by permission.)
Ch11-P546807.qxd 11/18/06 7:03 PM Page 288
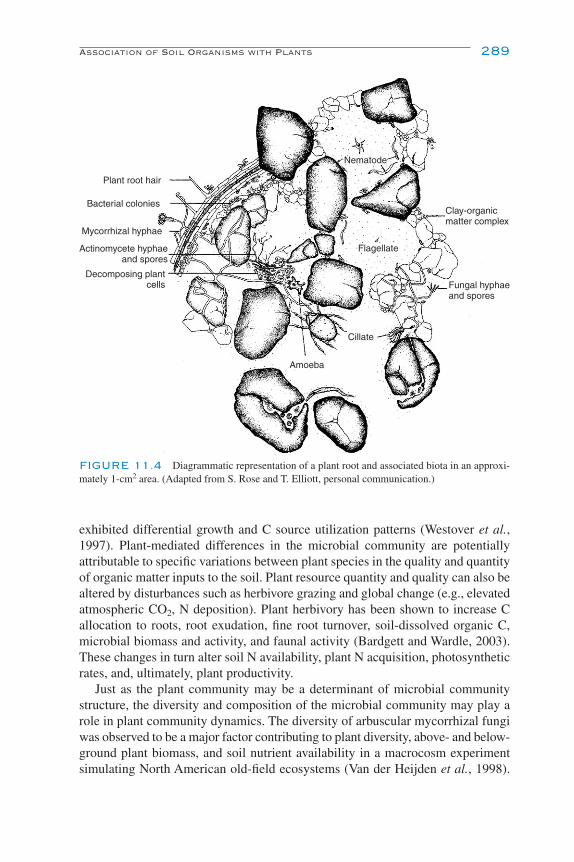
exhibited differential growth and C source utilization patterns (Westover et al.,1997). Plant-mediated differences in the microbial community are potentiallyattributable to specific variations between plant species in the quality and quantityof organic matter inputs to the soil. Plant resource quantity and quality can also bealtered by disturbances such as herbivore grazing and global change (e.g., elevatedatmospheric CO2, N deposition). Plant herbivory has been shown to increase Callocation to roots, root exudation, fine root turnover, soil-dissolved organic C,microbial biomass and activity, and faunal activity (Bardgett and Wardle, 2003).These changes in turn alter soil N availability, plant N acquisition, photosyntheticrates, and, ultimately, plant productivity.
Just as the plant community may be a determinant of microbial communitystructure, the diversity and composition of the microbial community may play arole in plant community dynamics. The diversity of arbuscular mycorrhizal fungiwas observed to be a major factor contributing to plant diversity, above- and below-ground plant biomass, and soil nutrient availability in a macrocosm experimentsimulating North American old-field ecosystems (Van der Heijden et al., 1998).
Association of Soil Organisms with Plants 289
Plant root hair
Bacterial colonies
Mycorrhizal hyphae
Actinomycete hyphaeand spores
Decomposing plant cells
Amoeba
Cillate
Fungal hyphaeand spores
Clay-organicmatter complex
Flagellate
Nematode
FIGURE 11.4 Diagrammatic representation of a plant root and associated biota in an approxi-mately 1-cm2 area. (Adapted from S. Rose and T. Elliott, personal communication.)
Ch11-P546807.qxd 11/18/06 7:03 PM Page 289
An increase in arbuscular mycorrhizal fungal diversity was accompanied by asignificant increase in the length of mycorrhizal hyphae in the soil leading togreater soil resource acquisition. As the number of mycorrhizal fungal speciesincreased, plant diversity, biomass, and plant tissue phosphorus content increased,while the phosphorus concentration in the soil decreased.
There is accumulating evidence that plants “culture” a soil community thatthen controls their long-term survival and growth, sometimes negatively. Survivaland growth of several grass species were significantly reduced when grown withtheir own soil community rather than that of another plant species (Bever, 1994).This result was attributed to an accumulation of specific plant pathogens or a changein microbial community composition. Such a negative feedback may provide a mech-anism for maintenance of plant communities in natural ecosystems, whereby anindividual plant cannot dominate a community because of the accumulated detri-mental effect of the soil community on plant growth. It has been hypothesized thatexotic plants that become invasive have escaped control by local soil organisms at invaded sites and may even alter the microbial community to their benefit.Callaway et al. (2004) reported that spotted knapweed (Centaurea maculosa), aninvasive weed in North America, cultivates a soil community in its nativeEuropean soil that negatively affects its own growth, possibly controlling itsspread in its home range. However, the plant cultivates a different soil communityat invaded sites in the western United States, positively enhancing its own growthand contributing to its success as an invasive species.
SPATIAL HETEROGENEITY OF SOIL ORGANISMS
Organism abundance and activity are not randomly distributed in soil, but varyboth horizontally and vertically through the soil profile (Fig. 11.5). Differentgroups of organisms exhibit different spatial patterns, because they each react tosoil conditions in different ways (Klironomos et al., 1999). This spatial heterogene-ity, which has been observed at the scale of millimeters to hundreds of meters, hasbeen shown in some studies to correlate with gradients in site and soil properties,including bulk density, aggregation, texture, oxygen concentration, pH, moisture,soil organic matter content, inorganic N availability, precipitation levels, and veg-etation dynamics. Some of these properties are important at the microscopic scale,whereas others act over larger distances. For example, microbial biomass andcollembolan abundance in an agroecosystem reflected large-scale gradients in soilC content and cultivation practices (Fromm et al., 1993). In other cases, soil char-acteristics have been found to explain a relatively minor amount (�30%) of thespatial variation in organism abundance (Robertson and Freckman, 1995). Spatialheterogeneity can be high even in soils that appear relatively homogeneous at theplot or field scale (Franklin and Mills, 2003). Nematode populations were strongly
290 Chapter 11 Spatial Distribution of Soil Organisms
Ch11-P546807.qxd 11/18/06 7:03 PM Page 290

patterned in an agroecosystem despite many years of soil tillage and monoculturecropping, suggesting that spatial heterogeneity may be even higher in less disturbedsystems (Robertson and Freckman, 1995).
There is little detailed information available on the spatial distribution of soilbiota, and spatial variability has historically been regarded as random noise in thesystem. Geostatistics provide a method for quantifying spatial heterogeneity andproviding information on the underlying causes of observed spatial patterns.Information on spatial patterns can be used to design more statistically powerfulexperiments, to improve our understanding of how soil communities develop, andto determine what factors are important for regulating and maintaining soil function.It has been hypothesized that high levels of soil biodiversity are attributable tospatial heterogeneity in resource availability as influenced by land-use patterns andplant community dynamics (Ettema and Wardle, 2002). In particular, spatial isola-tion may be an important determinant of microbial community structure by facili-tating species coexistence. In a simulated soil environment, one bacterial speciesdominated the community under saturated conditions where the pore network washighly connected (Treves et al., 2003). However, under low moisture conditions(i.e., discontinuous water films) spatial isolation of microbial populations alloweda less competitive species to become established in the community. These resultsconcur with the observation that saturated subsurface soils have lower microbialdiversity compared to unsaturated surface soils (Zhou et al., 2004).
Spatial Heterogeneity of Soil Organisms 291
Openbarren
0
1
2
3
�0.5
0.2�0.3
0.1�0.2
0.3�0.4
0.4�0.5
0.0
Pine-dominatedforest
1.25 3.5 5.25 7 m
FIGURE 11.5 Spatial distribution of ectomycorrhizal fungi in a 7 � 3-m transect from the edgeof a pine-dominated forest across an open serpentine barren at Soldiers Delight Natural EnvironmentArea, a serpentine complex in Owings Mills, Maryland, USA. Units are percentage colonization ofpine seedling root tips. Circles represent pine trees. (Courtesy of Rachel Thiet, Antioch New EnglandGraduate School, Keene, NH, USA. Used by permission.)
Ch11-P546807.qxd 11/18/06 7:03 PM Page 291

VERTICAL DISTRIBUTION WITHIN THE SOIL PROFILE
The abundance and biomass of most soil organisms are highest in the top 0–10 cmof soil and decline with depth in parallel with organic matter contents and preyavailability. Approximately 65% of total microbial biomass is found in the top 25 cmof the soil profile. Below that depth, microbial densities typically decline by 1–3 orders of magnitude (Fig. 11.6). Hyphal density of and root colonization bymycorrhizal fungi decrease substantially below 20 cm. Mycorrhizal fungal sporesare typically not found below the plant rooting zone. Numbers of microbial grazers(e.g., protozoa, collembola) also decrease with depth, often more rapidly thaneither their bacterial or their fungal prey. For example, collembolan numbers peakat 1–5 cm below the soil surface and drop to almost none below 10 cm. Whilegenerally low, the numbers and activities of soil organisms at depth vary spatiallydepending on gradients in texture, pH, temperature, water availability, and organicmatter content. Interfaces between layers often generate localized regions of greatersaturation, where microorganisms may exhibit increased numbers or activity dueto improved access to nutrients.
In addition to abundance and activity, microbial community composition anddiversity also change across the soil profile. Abundances of gram-negative bacteria,fungi, and protozoa are highest at the soil surface, while gram-positive bacteria andactinomycetes tend to increase in proportional abundance with increasing depth(Fierer et al., 2003). Microbes in deeper soil horizons tend to be more C limitedthan surface microorganisms. Mycorrhizal species change along a vertical gradient,differing in their preference for the organic or mineral soil layers. Only 4 of 22
292 Chapter 11 Spatial Distribution of Soil Organisms
200
150
100
50
0
0 200 400 600 800
Soi
l dep
th (
cm)
µg C g soil�1
0 20 40 60
µg CO2-C g soil�1 h�1
0 4 8 12 16
nmol PLFA g soil�1
FIGURE 11.6 Microbial biomass with depth for a valley (open circles) and terrace (closedcircles) soil profile as determined by three methods. (Left) Chloroform fumigation extraction.(Middle) Substrate-induced respiration. (Right) Phospholipid fatty acid (PLFA) analysis. (Adaptedfrom Fierer et al., 2003.)
Ch11-P546807.qxd 11/18/06 7:03 PM Page 292
ectomycorrhizal fungal taxa identified in a coniferous forest soil profile werefound on root tips collected to a depth of 53 cm (Rosling et al., 2003). Two taxawere restricted to the organic horizon, while 11 were found only in the mineralsoil. Soil invertebrate communities also vary with depth, particularly in theorganic and upper mineral soil horizons. For example, there is a succession fromlitter-dwelling to soil-dwelling species of collembola at the interface betweenorganic and mineral soil layers. Gut content analysis has shown that collembolanear the top of the O horizon feed preferentially on pollen grains, while those atthe bottom of this layer feed mainly on fungal material and highly decomposedorganic matter (Ponge, 2000).
In arid and semiarid regions, soil biota are widely distributed as biological soilcrusts (also called cryptogamic, microbiotic, microphytic crusts), which form aprotective soil covering (see Fig. 11.7). Soil crusts consist of a specialized com-munity of cyanobacteria, green and brown algae, mosses, and lichens. Sticky sub-stances produced by crust organisms bind surface soil particles together forminga continuous layer that can reach 10 cm in thickness. Cyanobacteria in arid surfacesoil from the badlands in Spain were recently shown to migrate vertically to andfrom the soil surface in response to changing moisture conditions (Garcia-Picheland Pringault, 2001). This ability to follow water is likely an important mechanismfor long-term survival of desert soil microbial communities. Soil crusts are damagedby trampling disturbances caused by livestock grazing, tourist activities (e.g., hiking,biking), and off-road vehicle traffic. Such disturbances lead to reduced diversity ofcrust organisms and increased soil erosion. Seedling germination and establishmentare also impacted. Crust recovery can take decades.
Most information on microbial biomass, community composition, and diversitycomes from studies of surface soil. The deep subsurface environment, that regionbelow the top few meters of soil that includes deep aquifers, caves, bedrock, andunconsolidated sediments, was once considered hostile to and devoid of livingorganisms. However, research over the past decade has shown that large numbersof microorganisms reside in the subsurface, often to depths of tens to hundreds ofmeters. Subsurface microbiology emerged as a discipline largely in response togroundwater quality issues and because recent technological and methodologicaladvances have made possible the characterization of samples collected from deepenvironments. The field is becoming increasingly interdisciplinary as scientists fromother disciplines (e.g., geology, hydrology, geochemistry, and environmental engi-neering) are becoming interested in understanding the role of microorganisms insoil genesis, contaminant degradation, maintenance of groundwater quality, andthe evolution of geological formations (e.g., caves). Additionally, many novelmicroorganisms with unique biochemical and genetic traits have been isolated fromsubsurface environments, and these organisms may have important industrial andpharmaceutical uses.
Deep subsurface microbial populations are dominated by bacteria, and nearlyall of the major taxonomic and physiological prokaryotic groups have been found.Bacterial densities range from less than 101 to 108 cells per gram of material,
Vertical Distribution within the Soil Profile 293
Ch11-P546807.qxd 11/18/06 7:03 PM Page 293

294 Chapter 11 Spatial Distribution of Soil Organisms
FIGURE 11.7 Biological soil crusts. (Top) Landscape with healthy soil crusts. (Middle) Close-up of mature crusts on the Colorado Plateau, USA. (Bottom) Cyanobacteria adhered to sand grains.(Courtesy of Jayne Belnap, USGS Canyonlands Field Station, Moab, UT, USA. Used by permission.)
Ch11-P546807.qxd 11/18/06 7:04 PM Page 294

depending on the method of enumeration and the depth of sample collection(Table 11.1). Groundwaters sampled from aquifers or unconsolidated sedimentshave bacterial concentrations ranging from 103 to 106 cells ml�1. Microbial biomassin the deep subsurface is typically several to many orders of magnitude lower thanthat observed for surface soils. The level of microbial diversity is also much lowerin the subsurface compared to surface soils (Zhou et al., 2004). For example, recentanalysis of saturated and unsaturated subsurface soils from Virginia and Delawareindicated that molecular sequences of the bacterial community fell into 6 phylo-genetic divisions compared to 13 divisions for surface soils (Zhou et al., 2004).Subsurface bacterial communities have a high proportion of nonculturable cells,and metabolic rates are very slow compared to terrestrial surface environments(Fredrickson and Fletcher, 2001). Microbial activity at these depths is limited bywater availability, temperature, and availability of energy sources. Energy sourcesinclude low-concentration organic substrates or reduced inorganic substrates suchas H2, CH4, or S2
�. As in surface soils, the size and interconnectivity of pores is animportant factor regulating microbial growth. In the subsurface environment, poresexist in unconsolidated materials or as fractures or fissures in consolidated rock.Significant microbial activity occurs in pores 0.2 to 15 µm in size, whereas little tono activity has been observed in pores with openings of less than 0.2 µm.
While bacteria dominate most subsurface microbial communities, protozoa andfungi have been observed at depth under certain conditions. Protozoan numbersare typically at or below the level of detection at unpolluted sites; however, largeprotozoan populations have been observed in the subsurface of contaminated sites(Sinclair et al., 1993). Protozoan presence may thus represent a useful indicator ofenvironmental contamination. Protozoa have been shown to stimulate subsurfacenitrification (Strauss and Dodds, 1997) and bacterial degradation of dissolvedorganic C (Kinner et al., 1998). Mycorrhizal hyphae (both ectomycorrhizal andarbuscular mycorrhizal taxa) associated with chaparral plants growing in southernCalifornia were recovered in fractured, granitic bedrock at depths greater than 2 m(Egerton-Warburton et al., 2003). The ability of mycorrhiza to grow and functionin subsurface environments may enable plants living in dry climates to survivedrought conditions by enhancing water and nutrient uptake from bedrock sources.
The study of subsurface microorganisms is transforming our ideas regardingthe extent of the biosphere and the role that microorganisms have and continue toplay in the evolution of the subsurface environment. As one example, scientistshave recently found evidence suggesting that Lower Kane Cave in Wyoming was
Vertical Distribution within the Soil Profile 295
TABLE 11.1 Subsurface Bacterial Abundance in Shallow (�10 m) and Deep (�10 m) Vadose Zone Geologic Materials (Adapted from Kieft and Brockman, 2001)
Depth (m) Plate counts (cfu g–1) Microscopic counts (cells g–1)
�10 �1 � 101–8 � 106 7 � 106–1 � 108
�10 �1 � 101–3 � 107 3 � 104–5 � 107
Ch11-P546807.qxd 11/18/06 7:04 PM Page 295
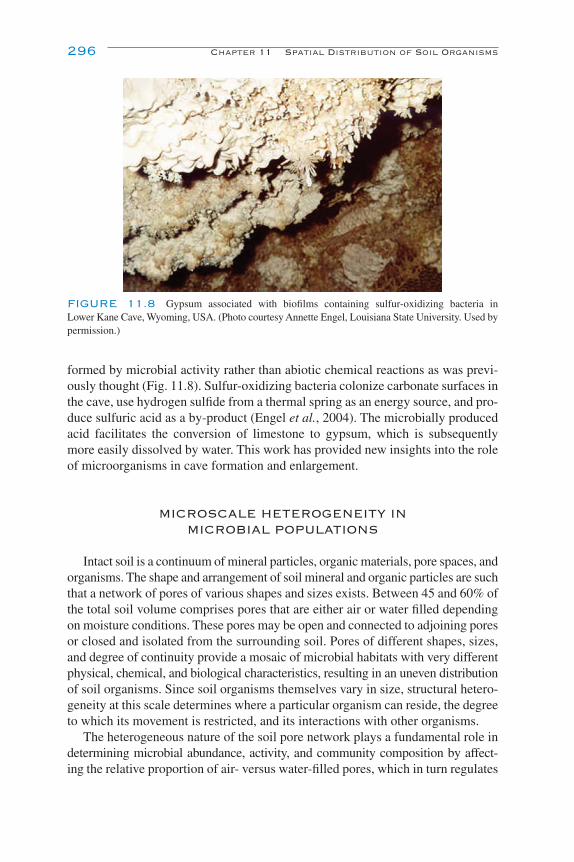
formed by microbial activity rather than abiotic chemical reactions as was previ-ously thought (Fig. 11.8). Sulfur-oxidizing bacteria colonize carbonate surfaces inthe cave, use hydrogen sulfide from a thermal spring as an energy source, and pro-duce sulfuric acid as a by-product (Engel et al., 2004). The microbially producedacid facilitates the conversion of limestone to gypsum, which is subsequentlymore easily dissolved by water. This work has provided new insights into the roleof microorganisms in cave formation and enlargement.
MICROSCALE HETEROGENEITY INMICROBIAL POPULATIONS
Intact soil is a continuum of mineral particles, organic materials, pore spaces, andorganisms. The shape and arrangement of soil mineral and organic particles are suchthat a network of pores of various shapes and sizes exists. Between 45 and 60% ofthe total soil volume comprises pores that are either air or water filled dependingon moisture conditions. These pores may be open and connected to adjoining poresor closed and isolated from the surrounding soil. Pores of different shapes, sizes,and degree of continuity provide a mosaic of microbial habitats with very differentphysical, chemical, and biological characteristics, resulting in an uneven distributionof soil organisms. Since soil organisms themselves vary in size, structural hetero-geneity at this scale determines where a particular organism can reside, the degreeto which its movement is restricted, and its interactions with other organisms.
The heterogeneous nature of the soil pore network plays a fundamental role indetermining microbial abundance, activity, and community composition by affect-ing the relative proportion of air- versus water-filled pores, which in turn regulates
296 Chapter 11 Spatial Distribution of Soil Organisms
FIGURE 11.8 Gypsum associated with biofilms containing sulfur-oxidizing bacteria in Lower Kane Cave, Wyoming, USA. (Photo courtesy Annette Engel, Louisiana State University. Used bypermission.)
Ch11-P546807.qxd 11/18/06 7:04 PM Page 296
water and nutrient availability, gas diffusion, and biotic interactions such as com-petition and predation. Microbial activity, measured as respiratory output (i.e., CO2
evolution), is maximized when about 60% of the total soil pore space is waterfilled. As soil moisture declines below this level, pores become poorly intercon-nected, water circulation becomes restricted, and dissolved nutrients, which arecarried by the soil solution, become less available for microbial utilization. Soildrying leads to a reduction of microbial biomass, particularly in the larger poreswhere organisms are subjected to more frequent alterations between desiccationand wetting.
At the other extreme, when most or all of the pores are filled with water, oxygenbecomes limiting since diffusion rates are significantly greater in air than throughwater. Gas diffusion into micropores is particularly slow since small pores oftenretain water even under dry conditions. Restricted oxygen diffusion into microporescombined with biological oxygen consumption during the decomposition of organicmatter can lead to the rapid development and persistence of anaerobic conditions.Thus survival of soil biota residing in small pores depends on their ability to carryout anaerobic respiration (e.g., denitrification), replacing oxygen with an alternativeelectron acceptor (e.g., NO3
�).Soil bacteria range in size from small “dwarf” cells (�0.1 µm3) to large cells
greater than 0.2 µm3. Small cells make up the vast majority of cell numbers (�80%);however, large cells account for most (85–90%) of the soil bacterial biomass(Blackwood and Paul, 2003). Bacteria can occupy both large and small soil pores;however, more than 80% of bacteria are thought to reside preferentially in smallpores. The maximum diameter of pores most frequently colonized by bacteria isestimated to range from 2.5 to 9 µm for fine- and coarse-textured soils, respec-tively. Few bacteria have been observed to reside in pores �0.8 µm in diameter,which means that 20–50% of the total soil pore volume, depending on soil textureand the pore size distribution, cannot be accessed and utilized by the microbialcommunity.
Electron microscopy has revealed that bacteria often occur as isolated cells orsmall colonies (�10 cells) associated with decaying organic matter; however, largercolonies of several 100 cells have been observed on the surface of aggregates iso-lated from a clayey pasture soil and in soils under native vegetation (Fig. 11.9).Bacterial cells are often embedded in mucilage, a sticky substance of bacterial originto which clay particles attach. Clay encapsulation and residence in small pores mayprovide bacteria with protection against desiccation, predation, bacteriophageattack, digestion during travel through an earthworm gut, and the deleterious effectsof introduced gases such as ethylene bromide, a soil fumigant.
Fungi, protozoa, and algae are found mainly in pores larger than 5 µm. Fungalhyphae are commonly observed on aggregate surfaces and typically do not entersmall microaggregates (�30 µm). Like bacteria, fungal hyphae are often sheathedin extracellular mucilage, which not only serves as protection against predation anddesiccation, but also is a gluing agent in the soil aggregation process. Mycelialfungi develop extensive hyphal networks and as they grow through the soil and
Microscale Heterogeneity in Microbial Populations 297
Ch11-P546807.qxd 11/18/06 7:04 PM Page 297

over aggregate surfaces, they bind soil particles together, thereby playing animportant role in the formation and stabilization of aggregates.
Soil heterogeneity indirectly influences nutrient cycling dynamics by restrictingorganism movement and thereby modifying the interactions between organisms.For example, small pores influence trophic relationships and nutrient mineralizationby providing refuges and protection for smaller organisms, particularly bacteria,against attack from larger predators (e.g., protozoa) that are typically unable to entersmaller pores. The location of bacteria within the pore network is a key factor intheir growth and activity. Bacterial populations are consistently high in small pores,
298 Chapter 11 Spatial Distribution of Soil Organisms
10 µm
10 µm
FIGURE 11.9 (Top) Bacteria on the surface of an aggregate isolated from a grassland soil. (Bottom)An amoeba with its extended pseudopodia engulfing bacteria. (Photos courtesy of V. V. S. R. Gupta, CSIROLand and Water, Glen Osmond, South Australia, Australia. Used by permission.)
Ch11-P546807.qxd 11/18/06 7:04 PM Page 298

but highly variable in large pores where they are vulnerable to being consumed.This may explain, in part, why introduced bacteria (e.g., Rhizobium and biocontrolorganisms) often exhibit poor survival relative to indigenous bacteria. When theyare introduced in such a way as to be transported by water movement into small,protected pores, their ability to persist is enhanced. This example stresses theimportance of considering soil structure and microscale heterogeneity whenstudying the distribution of soil organisms.
REFERENCES AND SUGGESTED READING
Amelung, W., Zhang, S., Flach, K. W., and Zech, W. (1999). Amino sugars in native grassland soilsalong a chronosequence in North America. Soil Sci. Soc. Am. J. 63, 86–92.
Azmi, O. R., and Seppelt, R. D. (1998). The broad-scale distribution of microfungi in the WindmillIslands region, continental Antarctica. Polar Biology 19, 92–100.
Bardgett, R. D., and Wardle, D. A. (2003). Herbivore-mediated linkages between aboveground andbelowground communities. Ecology 84, 2258–2268.
Belnap, J., and Lange, O. L., eds. (2001). “Biological Soil Crusts: Structure, Function and Management.Ecological Studies.” Springer-Verlag, Berlin.
Bever, J. D. (1994). Feedback between plants and their soil communities in an old field community.Ecology 73, 1965–1977.
Blackwood, C. B., and Paul, E. A. (2003). Eubacterial community structure and population size withinthe soil light fraction, rhizosphere, and heavy fraction of several agricultural systems. Soil Biol.Biochem. 35, 1245–1255.
Bull, A. T., ed. (2004). “Microbial Diversity and Bioprospecting.” Am. Soc. Microbiol., Washington, DC.Callaway, R. M., Thelen, G. C., Rodriguez, A., and Holben, W. E. (2004). Soil biota and exotic plant
invasion. Nature 427, 731–733.Cho, J., and Tiedje, J. M. (2000). Biogeography and degree of endemicity of fluorescent Pseudomonas
strains in soil. Appl. Environ. Microbiol. 66, 5448–5456.Egerton-Warburton, L. M., Graham, R. C., and Hubbert, K. R. (2003). Spatial variability in mycorrhizal
hyphae and nutrient and water availability in a soil-weathered bedrock profile. Plant Soil 249,331–342.
Elliott, E. T., and Coleman, D. C. (1988). Let the soil work for us. Ecol. Bull. 39: 23–32.Engel, A. S., Stern, L. A., and Bennett, P. C. (2004). Microbial contributions to cave formation: new
insights into sulfuric acid speleogenesis. Geology 32, 369–372.Ettema, C. H., and Wardle, D. A. (2002). Spatial soil ecology. Trends Ecol. Evol. 17, 177–183.Fierer, N., Schimel, J. P., and Holden, P. A. (2003). Variations in microbial community composition
through two soil depth profiles. Soil Biol. Biochem. 35, 167–176.Finlay, B. J. (2002). Global dispersal of free-living microbial eukaryote species. Science 296, 1061–1063.Finlay, B. J., Esteban, G. F., Olmo, J. L., and Tyler, P. A. (1999). Global distribution of free-living
microbial species. Ecography 22, 138–144.Franklin, R. B., and Mills, A. L. (2003). Multi-scale variation in spatial heterogeneity for microbial
community structure in an eastern Virginia agricultural field. FEMS Microbiol. Ecol. 44(3), 335–46.Fredrickson, J. K., and Fletcher, M. (2001). “Subsurface Microbiology and Biogeochemistry.” Wiley,
New York.Frey, S. D., Elliott, E. T., and Paustian, K. (1999). Bacterial and fungal abundance and biomass in
conventional and no-tillage agroecosystems along two climatic gradients. Soil Biol. Biochem. 31,573–585.
Fromm, H., Winter, K., Filser, J., Hantschel, R., and Beese, F. (1993). The influence of soil type andcultivation system on the spatial distributions of the soil fauna and microorganisms and their inter-actions. Geoderma 60, 109–118.
References and Suggested Reading 299
Ch11-P546807.qxd 11/18/06 7:04 PM Page 299
Garcia-Pichel, F., and Pringault, O. (2001). Microbiology: Cyanobacteria track water in desert soils.Nature 413(6854), 380–381.
Gupta, V. V. S. R., and Germida, J. J. (1988). Distribution of microbial biomass and its activity indifferent soil aggregate size classes as affected by cultivation. Soil Biol. Biochem. 20, 777–786.
Horner-Devine, M., Carney, K. M., and Bohannan, B. J. M. (2003). An ecological perspective on bac-terial biodiversity. Proc. R. Soc. London B 271, 113–122.
Kieft, T. L., and Brockman, F. J. (2001). Vadose zone microbiology. In “Subsurface Microbiology andBiogeochemistry” (J. K. Fredrickson and M. Fletcher, eds.), pp. 141–169. Wiley, New York.
Kinner, N. E., Harvey, R. W., Blakeslee, K., Novarino, G., and Meeker, L. D. (1998). Size-selectivepredation on groundwater bacteria by nanoflagellates in an organic-contaminated aquifer. Appl.Environ. Microbiol. 64, 618–625.
Klironomos, J. N., Rillig, M. C., and Allen, M. F. (1999). Designing belowground field experimentswith the help of semi-variance and power analyses. Appl. Soil Ecol. 12, 227–238.
Lavelle, P., and Spain, A. V. (2001). “Soil Ecology.” Kluwer Academic, Dordrecht.Ponge, J. (2000). Vertical distribution of collembola (Hexapoda) and their food resources in organic
horizons of beech forests. Biol. Fertil. Soils 32, 508–522.Ranjard, L., and Richaume, A. (2001). Quantitative and qualitative microscale distribution of bacteria
in soil. Res. Microbiol. 152, 707–716.Robertson, G. P., and Freckman, D. W. (1995). The spatial distribution of nematode trophic groups
across a cultivated ecosystem. Ecology 76, 1425–1432.Rosling, A., Landeweert, R., Lindahl, B. D., Larsson, K.-H., Kuyper, T. W., Taylor, A. F. S., and Finlay,
R. D. (2003). Vertical distribution of ectomycorrhizal fungal taxa in a podzol soil profile. NewPhytol. 159, 775–783.
Sessitsch, A., Weilharter, A., Gerzabek, M. H., Kirchmann, H., and Kandeler, E. (2001). Microbialpopulation structures in soil particle size fractions of a long-term fertilizer field experiment. Appl.Environ. Microbiol. 67, 4215–4224.
Sinclair, J. L., Kampbell, D. H., Cook, M. L., and Willson, J. T. (1993). Protozoa in subsurface sedimentsfrom sites contaminated with aviation gasoline or jet fuel. Appl. Environ. Microbiol. 59, 467–472.
Six, J., Frey, S. D., Thiet, R. K., and Batten, K. M. (2006). Bacterial and fungal contributions to carbonsequestration in agroecosystems. Soil Sci. Soc. Am. J. 70, 555–569.
Strauss, E. A., and Dodds, W. K. (1997). Influence of protozoa and nutrient availability on nitrificationrates in subsurface sediments. Microb. Ecol. 34, 155–165.
Treves, D. S., Xia, B., Zhou, J., and Tiedje, J. M. (2003). A two-species test of the hypothesis that spatialisolation influences diversity in soil. Microb. Ecol. 45, 20–28.
Väisänen, R. K., Roberts, M. S., Garland, J. L., Frey, S. D., and Dawson, L. A. (2005). Physiologicaland molecular characterization of microbial communities associated with different water-stableaggregate size fractions. Soil Biol. Biochem. 37, 2007–2016.
Van der Heijden, M. G. A., Klironomos, J. N., Ursic, M., Moutoglis, P., Streitwolf-Engel, R., Boller, T.,Wiemken., and Sanders, I. R. (1998). Mycorrhizal fungal diversity determines plant biodiversity,ecosystem variability and productivity. Nature 396, 69–72.
Van Gestel, M., Merckx, R., and Vlassak, K. (1997). Spatial distribution of microbial biomass inmicroaggregates of a silty-loam soil and the relation with the resistance of microorganisms to soildrying. Soil Biol. Biochem. 28, 503–510.
Wardle, D. A. (1992). A comparative assessment of factors which influence microbial biomass C andN levels in soil. Biol. Rev. 67, 321–358.
Wardle, D. A. (1998). Controls of temporal variability of the soil microbial biomass: a global-scalesynthesis. Soil Biol. Biochem. 13, 1627–1637.
Westover, K. M., Kennedy, A. C., and Kelley, S. E. (1997). Patterns of rhizosphere microbial communitystructure associated with co-occurring plant species. J. Ecol. 85, 863–873.
Young, I. M., and Ritz, K. (1998). Can there be a contemporary ecological dimension to soil biologywithout a habitat? Soil Biol. Biochem. 30, 1229–1232.
Zhou, J., Xia, B., Huang, H., Palumbo, A. V., and Tiedje, J. M. (2004). Microbial diversity and hetero-geneity in sandy subsurface soils. Appl. Environ. Microbiol. 70, 1723–1734.
300 Chapter 11 Spatial Distribution of Soil Organisms
Ch11-P546807.qxd 11/18/06 7:04 PM Page 300

PART
IV
BIOCHEMISTRY ANDBIOGEOCHEMISTRY
Ch12-P546807.qxd 11/18/06 7:05 PM Page 301

Ch12-P546807.qxd 11/18/06 7:05 PM Page 302
12CARBON CYCLING AND
FORMATION OF SOIL ORGANIC
MATTER
William Horwath
Introduction
Long-Term Carbon Cycle
The Short-Term C Cycle
Ecosystem C Cycling
Composition and Turnover of C Inputs to Soil
Soil Organic Matter
Quantity and Distribution of Organic Matter in Soils
Role of Methane in the C Cycle
Future Considerations
References and Suggested Reading
303
INTRODUCTION
Carbon (C) was deposited on earth from carbonaceous comets and asteroids(Anders, 1989) in both organic and inorganic forms. The extraterrestrial C containedcomplex compounds including hydrocarbons, organic acids, and amino com-pounds essential to the evolution of cellular life forms. The “carbon cycle” is thetransfer of C among the atmosphere, oceans, land, and life. The C cycle is composedof both long-term and short-term cycles. The subject of this chapter is to under-stand the short-term C cycle, which includes the terrestrial components of plants,soil biota, and soil organic matter (SOM).
Ch12-P546807.qxd 11/18/06 7:05 PM Page 303

304 Chapter 12 Carbon Cycling and Formation of Soil Organic Matter
LONG-TERM CARBON CYCLE
The thermal degradation of comets and asteroids entering the earth’s atmos-phere was presumed to be the initial source of atmospheric carbon dioxide (CO2).The accumulation of CO2 in the atmosphere resulted in the first major active com-ponent of the global C cycle: dissolved carbonates (CO3
�). The weathering of cal-cium (Ca)–magnesium (Mg)- and silicate (Si)-containing rocks dissolved bycarbonic acid (HCO3
�) found in precipitation and other water sources consumedatmospheric CO2 (Fig. 12.1). The following describes this chemical reaction.
2CO2 � 2H2O � CaSiO3 → Ca2� � 2HCO3� � H4SiO4.
These chemical species, particularly Ca and carbonates, are transported in a dis-solved state by rivers to the ocean, where the following reaction occurs:
Ca2� � 2HCO3� → CaCO3 � CO2 � H2O.
The overall reaction consumes atmospheric CO2 and transfers it to the near-permanent geologic reservoirs through processes encompassing terrestrial weath-ering and marine carbonate sedimentation (Berner, 2004). Carbonates formedduring pedogenesis, termed caliche, are small in comparison to marine carbonatesedimentation.
The weathering of Ca–Mg Si rocks and sedimentation of marine carbonates isa large sink of atmospheric CO2 (Box 12.1). The uplift of the Himalaya mountainsis thought to have increased Ca–Mg Si rock weathering, consuming large amountsof atmospheric CO2. This resulted in the late Cenozoic cooling due to depletion ofatmospheric CO2 (Raymo, 1991). The steep oregenic uplift associated with conti-nental formation dynamics enhances primary mineral weathering by increasing
VolcanicCO2
CO2release
Sediment CO2release
Dissolution ofCa–Mg Si
CaCO3burial
Subduction ofCaCO3
andOrganic C
CO2 and CH4release
frommetamorphismand digenesis
Organic Cburial
HCO3
HCO3
FIGURE 12.1 The long-term C cycle (adapted from Berner, 2004).
Ch12-P546807.qxd 11/18/06 7:05 PM Page 304

erosive events, constantly exposing Ca–Mg Si rocks to further weathering. Followingthe subduction of sedimentary rock into the earth’s mantle, carbonates eventuallyundergo thermal weathering and are released as CO2 back to the atmosphere pri-marily through volcanic activity (Fig. 12.1). This process represented a criticalstep in controlling atmospheric CO2 content of the atmosphere early in the earth’shistory.
During the Devonian, the evolution of large vascular plants perturbed the long-term carbonate sedimentation cycle by accelerating the weathering of Si rocks andby removal of CO2 from the atmosphere through burial of organic matter in sedi-ments. Accelerated weathering of silicate rocks occurred as a result of the pro-duction of organic acids during growth and decomposition of plant debris. Theprolific growth of vascular plants led to the accumulation of large amounts oforganic matter, eventually leading to the formation of large fossil fuel deposits sovital to today’s society. This period also saw an increase in atmospheric oxygen(O2) from photosynthetic activity and absence of oxidation of buried C-richorganic matter. The evolution of microbial-resistant lignin, a component of thesecondary cell wall of vascular plants, is surmised to have contributed to the largequantities of plant debris being deposited. It has been hypothesized that the initialburial of large amounts of lignaceous plant material occurred as a result of theabsence of lignin-degrading organisms, which evolved later in the Paleozoic
Long-Term Carbon Cycle 305
BOX 12.1
Terrestrial photosynthesis and decomposition are closely balanced. On ageological time scale photosynthesis has been slightly larger than decom-position, leading to reserves of fossil fuels that are four times as great as theC stored in the soil. Oceanic photosynthesis and decay are approximatelyequal to that of terrestrial, but this is carried out by biota of only 45 petagrams(Pg), resulting in a much faster turnover rate than in the terrestrial environ-ment. A petagram is equivalent to 1015g or 109 metric tons. The oceans havelarge reserves of dissolved C, both inorganic and organic, especially in thethermocline and in the deep sea, representing a pool of 38,000 Pg C, sub-stantially larger than soil C. Woody components of the land biota accountfor 75% of stored terrestrial plant C. Subtracting the values for respirationfrom gross primary production gives net primary production values of50–60 Pg, indicating that it takes approximately 10 years for the terrestrialplants to recycle their C. This represents, on average, fast turnover rates forleachates and easily decomposable residues relative to the tens, hundreds,and even thousands of years necessary for the turnover of woody componentsand humified material and hundreds of thousands of years for deep ocean andfossil C (Houghton et al., 2001).
Ch12-P546807.qxd 11/18/06 7:05 PM Page 305
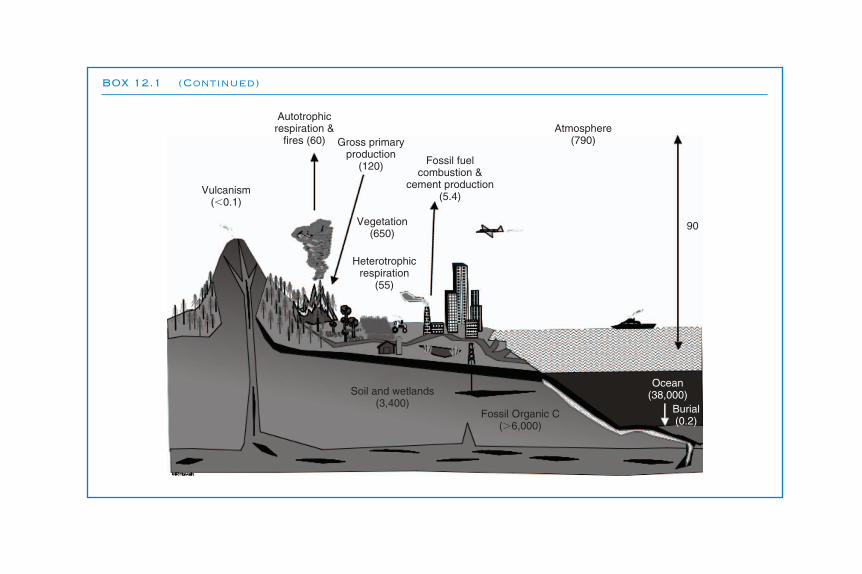
Gross primaryproduction
(120)
Autotrophicrespiration &
fires (60)
Vulcanism(�0.1)
Vegetation(650)
Heterotrophicrespiration
(55)
Fossil fuelcombustion &
cement production(5.4)
Atmosphere(790)
90
Soil and wetlands(3,400)
Fossil Organic C(�6,000)
Ocean(38,000)
Burial(0.2)
BOX 12.1 (Continued)
Ch12-P546807.qxd 11/18/06 7:05 PM Page 306

(Robinson, 1990). This may be why the Carboniferous and Permian coal reservesoutweigh those from any other period in the earth’s history.
Combined, the carbonate–Si and organic matter cycles dominate controls on thelong-term levels of CO2 and O2 over the millions of years of the Phanerozoic eon.These dominant C cycles were probably in play during the Precambrian, but thefossil record, geology, and climate data are not as abundant as for the Phanerozoic,making the interpretation of the Precambrian C cycle more difficult. Organic matterdeposition today occurs more slowly than during the Devonian, presumably becauseof less primary production and the evolution of plant-debris-degrading organisms.This, coupled with reduced volcanic activity, represents the new equilibriumof atmospheric CO2 controlled by these cycles. During the past 500,000 years(Box 12.2), the atmospheric CO2 level has been closely related to the advance andretreat of glaciers and was lower than the present-day level of 370 ppmV (Petit et al.,1999). In the past 30,000 to 40,000 years, CO2 levels of 200 ppmV or less werecommon. Carbon dioxide levels exceeding 1000 ppmV were common prior to thisperiod up to 4 million years before present (Retallack, 2001). Though these cyclesare robust, it is evident that the burning of fossils fuels can have an immediateimpact on the C cycle that has led to accelerated changes in the cycling of C at theglobal scale.
THE SHORT-TERM C CYCLE
The short-term C cycle is dominated by the interplay of terrestrial and marinephotosynthesis, respiration, and organic matter formation (Fig. 12.2). The short-term C cycle is dependent on two principle gases, CO2 and methane (CH4).Perturbations of the short-term C cycle causing changes in the concentration ofthese two gases in the atmosphere cause potential changes in climate because bothare greenhouse gases. These gases absorb outgoing infrared radiation from theearth’s surface, trapping heat. Over time, these gases have regulated the tempera-ture of the planet. Other greenhouse gases produced by microbes such as nitrousoxide also play an important role in climate change (see Chap. 13). Variations inthe sun’s energy output and changes in earth’s distance from the sun have alsocontributed to climate change over the Quaternary.
It has been estimated that in the year 1860 the atmosphere contained about260 ppm CO2; in 2006 it contained approximately 375 ppmV or 765 Pg C (Box 12.2).Since the late l800s, fossil fuel use, forest clearing, and the conversion of extensiveareas of virgin land to agriculture have led to a net transfer of terrestrial C to theatmosphere (Falkowski et al., 2000). This has been partially offset by the contin-uous net uptake of carbonates as sedimentary rocks in the oceans. Approximatelyup to 20% of the C evolved in the last 100 years cannot be accounted for in pres-ent estimates of the global C budget. Suggestions have been made that terrestrialC sequestration potential of terrestrial ecosystems has been underestimated. Thismay be a result of higher photosynthetic rates and plant water use efficiency under
The Short-Term C Cycle 307
Ch12-P546807.qxd 11/18/06 7:05 PM Page 307

308 Chapter 12 Carbon Cycling and Formation of Soil Organic Matter
Marine Photosynthesis
Atmosphere Biota
TerrestrialPhotosynthesis
Respiration
CarbonateInput
CO2Exchange
OceanRiver Transport
of Organic Matterand Carbonates
Soil
Litter andRoot Input
Calcification
Marine Respiration
FIGURE 12.2 The short-term C cycle (adapted from Berner, 2004).
BOX 12.2
The atmospheric CO2 level has fluctuated wildly over the past 400 millionyears. The variation can be attributed to changes in gross primary produc-tion caused by such events as volcanism and changes in the orientation ofthe earth’s axis that affected the climate. Over the past 200 years, as atmos-pheric CO2 has risen by over 100 ppmV, plants have responded by decreas-ing stomatal density. The inverse relationship between atmospheric CO2
concentration and stomatal density has been used as a paleobarometer toestimate past atmospheric CO2 concentration. The evolution of treesprovides an excellent fossil record of leaf structures, specifically stomataand epidermal cells. The environmental factors affecting the interpretationof stomatal density are minimized by including the relationship of stomatalindex (percentage stomates over stomates plus epidermal cells). Retallack(2001) used the genus Ginkgo, with a fossil record dating to the lateTriassic period (229 Mya), and extended the record to the Permian usingthe stomatal index of plant species with morphologies similar to that ofGinkgo.
Ch12-P546807.qxd 11/18/06 7:05 PM Page 308
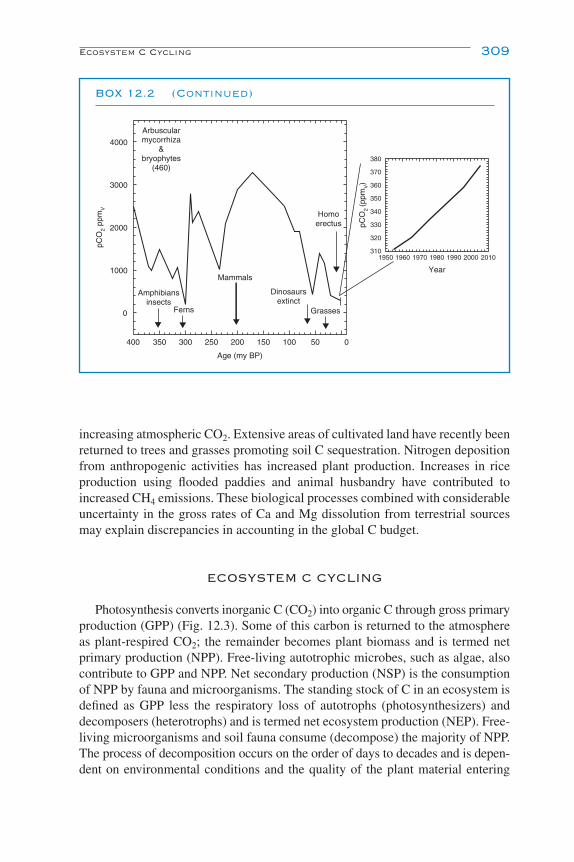
increasing atmospheric CO2. Extensive areas of cultivated land have recently beenreturned to trees and grasses promoting soil C sequestration. Nitrogen depositionfrom anthropogenic activities has increased plant production. Increases in riceproduction using flooded paddies and animal husbandry have contributed toincreased CH4 emissions. These biological processes combined with considerableuncertainty in the gross rates of Ca and Mg dissolution from terrestrial sourcesmay explain discrepancies in accounting in the global C budget.
ECOSYSTEM C CYCLING
Photosynthesis converts inorganic C (CO2) into organic C through gross primaryproduction (GPP) (Fig. 12.3). Some of this carbon is returned to the atmosphereas plant-respired CO2; the remainder becomes plant biomass and is termed netprimary production (NPP). Free-living autotrophic microbes, such as algae, alsocontribute to GPP and NPP. Net secondary production (NSP) is the consumptionof NPP by fauna and microorganisms. The standing stock of C in an ecosystem isdefined as GPP less the respiratory loss of autotrophs (photosynthesizers) anddecomposers (heterotrophs) and is termed net ecosystem production (NEP). Free-living microorganisms and soil fauna consume (decompose) the majority of NPP.The process of decomposition occurs on the order of days to decades and is depen-dent on environmental conditions and the quality of the plant material entering
Ecosystem C Cycling 309
Amphibiansinsects
Ferns
Mammals
Dinosaursextinct
Grasses
Homoerectus
Arbuscularmycorrhiza
&bryophytes
(460)
4000
3000
2000
1000
0
400 350 300 250 200 150 100 50 0
Age (my BP)
pCO
2 pp
mV
1950 1960 1970 1980 1990 2000 2010
Year
380
370
360
350
340
330
320
310
pCO
2 (p
pmV)
BOX 12.2 (Continued)
Ch12-P546807.qxd 11/18/06 7:05 PM Page 309

the soil. The selective preservation of some resistant plant constituents, such aslignin, and the activity of microorganisms produce precursors to humic substancesdescribed later in this chapter. Soil humic substances can persist for thousands ofyears and are important stable C pools making up two-thirds of terrestrial C stores.GPP, NPP, NSP, and NEP are processes usually measured in terms of g C m�2
year�1 or similar units.The NEP of different ecosystems varies considerably depending on plant species,
soil type, and climate. Gross primary production is often controlled by the abilityof soil biota to release through decomposition essential nutrients such as N and Pto sustain NPP. Figure 12.4 shows the size of various plant, microbial, and soil Cand N pools in a hybrid poplar system. The activity of decomposers is required torelease a small portion of the large soil N pool for NEP. Forests, including tropi-cal, temperate, and boreal forests, have the largest NEP due to the accumulationof wood. Humid tropical ecosystems in general have the highest GPP of all ter-restrial environments despite having a limited essential nutrient pool. They arecharacterized by high production and decomposition rates, where nutrients are
310 Chapter 12 Carbon Cycling and Formation of Soil Organic Matter
Gross Primary Production
Net Photosynthesis
Net PrimaryProduction
Microbial andFaunal
ProductionDark Respiration
Construction andMaintenanceRespiration
Live PlantBiomass
Accumulation
LitterProduction
andPlant Exudates
Net SecondaryProduction
PredationTurnover
Litter and SoilOrganic MatterAccumulation
Net Ecosystem Production
CO2
CO2
CO2CO2
CO2
HeterotrophicRespiration
HeterotrophicRespiration
(Decomposition)
FIGURE 12.3 Various components of gross primary production and net ecosystem production.
Ch12-P546807.qxd 11/18/06 7:05 PM Page 310

actively cycling through plant litter and soil biota, and less storage in soil as organicmatter. Optimal temperature and moisture conditions for decomposition prevail inhumid tropical environments, leading to relatively closed nutrient cycles in theabsence of disturbance. In northern latitude ecosystems, lower temperatures leadto slower decomposition of plant litter. The accumulation of plant matter in forestfloor litter layers can withhold from the soil solution essential nutrients, particu-larly N. Disturbance such as fire, a physical oxidative decomposition process, isoften required to release nutrients to increase NPP. Plant community successionalso leads to changes in nutrient cycling through changes in the quantity and qual-ity of litter inputs or the nutrient requirements of succeeding plant and microbialcommunities.
Ecosystem C Cycling 311
NitrogenCarbon
Leaves12.8
Leaves213
Branches25
(45)
Stem33
(6.0)
Stem336
(406)
Branches184
(208)
Total tree22.7
(18.8)
Litter(9.8)
Totalroots4.1
(8.4)
Fine roots<0.5 mm
1.3(0.8)
Microbialbiomass
19.4
Inorganic N33
Totalsoil N608
Totalsoil C6864
Soluble C76
Microbialbiomass C
103
Fine roots<0.5 mm
52(38)
Litter(235)
Total tree950
(973)
FIGURE 12.4 The distribution of C and N in a 2-year hybrid poplar stand during July.Microbial N is similar to poplar N, showing the importance of the microbial biomass in influencingnutrient availability. The values in parentheses represent C and N amounts for November.
Ch12-P546807.qxd 11/18/06 7:05 PM Page 311
COMPOSITION AND TURNOVER OFC INPUTS TO SOIL
The quantity and quality of plant litter and microbial turnover to soil greatly influ-ence the outcome of decomposition processes. The sizes of the standing leaf andmicrobial N pools are similar in most ecosystems, indicating the importance of soilorganisms for influencing available N for plant uptake. Various biological con-stituents such as cytoplasm and cell wall material of plant, microbial, and faunalinputs decompose at vastly different rates (see Chap. 16 for more details on turnover).Decomposition models often relate the decomposability of soil inputs to their C toN ratio, to their N content, and to the amount of resistant material such as ligninor chitin that they contain. Other factors such as their polyphenol (a secondaryplant metabolite) content may impact decomposition through phytotoxic interac-tions. The availability of nutrients in soil solution affects not only the qualityand quantity of inputs but also the ability of decomposers to consume the inputs.Higher decomposition rates result from increases in available N (NH4
� and NO3�),
which causes vegetative growth with low C:N ratio (high N content). ElevatedCO2 can produce plant litter with a higher C:N ratio, making it more difficult todecompose.
Net primary production adds to soil litter or detritus composed of leaves,branches, reproductive structures, leachates, and belowground products such asroots, exudates, and sloughed root cells. Plants contain an array of cytoplasm andcell wall components that require a complex scheme of enzymes to decompose.Unique plant components include cellulose, hemicelluloses, phenylpropanoids(lignin), and polyphenols (tannins). Microorganisms produce unique cell wallstructures (e.g., peptidoglycans) and pigments (e.g., melanin). Leachate C is gen-erally more important in forest systems in which significant leaching of dissolvedorganic C from the canopy and litter layer can occur. Root exudates are low-molecular-weight carbohydrates and amino-type compounds (amino acids, aminosugars, and small peptides) typically exuded from roots and mycorrhiza. Theturnover of the NPP and NSP is an important source of humic substances thatcontribute to SOM formation and maintenance.
The various components of plant inputs to soil vary greatly as a source ofenergy and nutrients for NSP. The majority of plant inputs are C polymers (e.g.,cellulose) and hydrocarbons (e.g., lignin) that contain few essential nutrientsto facilitate decomposition. Cytoplasmic constituents such as sugars, aminocompounds. and organic acids comprise up to 10% of plant residue dry weight(Table 12.1). Cytoplasm proteins contain the majority of N in plant tissue.Proteins and peptides are hydrolyzed by proteases and peptidases to individualamino acids during decomposition (Fig. 12.5). These labile N sources and otherC-containing compounds provide the initial energy source and nutrients to startthe decomposition process. Proteins also contain significant amounts of S in theform of the amino acids cystine and methionine. The protein content of plant tissuesranges from 1% in cell walls to 22% in meristematic regions and seeds. In leaves,
312 Chapter 12 Carbon Cycling and Formation of Soil Organic Matter
Ch12-P546807.qxd 11/18/06 7:05 PM Page 312
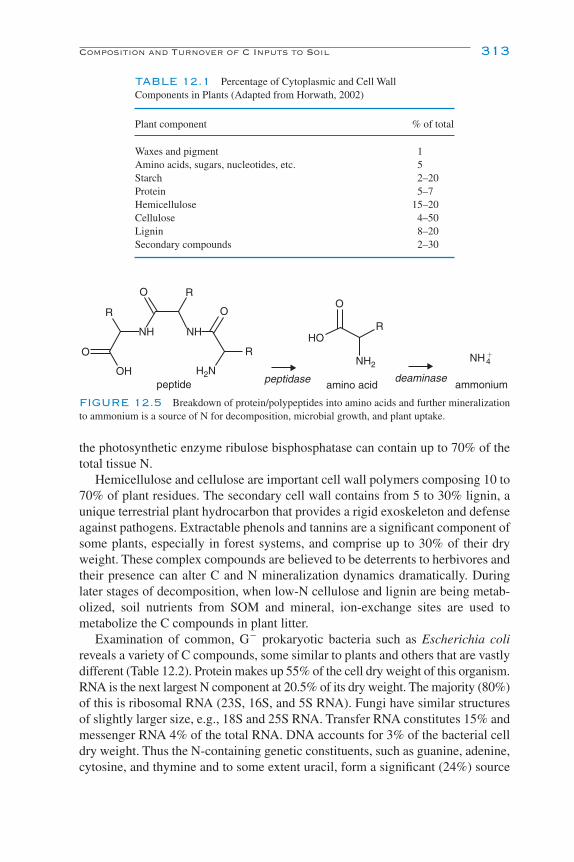
the photosynthetic enzyme ribulose bisphosphatase can contain up to 70% of thetotal tissue N.
Hemicellulose and cellulose are important cell wall polymers composing 10 to70% of plant residues. The secondary cell wall contains from 5 to 30% lignin, aunique terrestrial plant hydrocarbon that provides a rigid exoskeleton and defenseagainst pathogens. Extractable phenols and tannins are a significant component ofsome plants, especially in forest systems, and comprise up to 30% of their dryweight. These complex compounds are believed to be deterrents to herbivores andtheir presence can alter C and N mineralization dynamics dramatically. Duringlater stages of decomposition, when low-N cellulose and lignin are being metab-olized, soil nutrients from SOM and mineral, ion-exchange sites are used tometabolize the C compounds in plant litter.
Examination of common, G� prokaryotic bacteria such as Escherichia colireveals a variety of C compounds, some similar to plants and others that are vastlydifferent (Table 12.2). Protein makes up 55% of the cell dry weight of this organism.RNA is the next largest N component at 20.5% of its dry weight. The majority (80%)of this is ribosomal RNA (23S, 16S, and 5S RNA). Fungi have similar structuresof slightly larger size, e.g., 18S and 25S RNA. Transfer RNA constitutes 15% andmessenger RNA 4% of the total RNA. DNA accounts for 3% of the bacterial celldry weight. Thus the N-containing genetic constituents, such as guanine, adenine,cytosine, and thymine and to some extent uracil, form a significant (24%) source
Composition and Turnover of C Inputs to Soil 313
TABLE 12.1 Percentage of Cytoplasmic and Cell Wall Components in Plants (Adapted from Horwath, 2002)
Plant component % of total
Waxes and pigment 1Amino acids, sugars, nucleotides, etc. 5Starch 2–20Protein 5–7Hemicellulose 15–20Cellulose 4–50Lignin 8–20Secondary compounds 2–30
R
R
R
RO
OO
O
NH NH
OH
HO
peptideH2N
NH2NH4
�
peptidase amino aciddeaminase
ammonium
FIGURE 12.5 Breakdown of protein/polypeptides into amino acids and further mineralizationto ammonium is a source of N for decomposition, microbial growth, and plant uptake.
Ch12-P546807.qxd 11/18/06 7:05 PM Page 313

of potentially mineralizable N. Soil fungi often concentrate their cytoplasm andactive metabolic constituents at their growing tips. In soil, they have been shownto have only one-tenth as much DNA per unit weight as bacteria and generallyhave higher C:N ratios.
Bacteria have C:N ratios that range from 3.5:1 to 7:1, while fungi range from10:1 to 15:1. The average total microbial biomass has a C:N ratio of 4:1 to 8:1. TheC:N ratio depends on the broad groups of bacteria and fungi present. The microbialC:N ratio as determined by physiological methods can be a crude measure of micro-bial diversity. Bacteria often dominate highly disturbed systems such as agriculturalfields. Other ecosystems where bacteria flourish are wet meadows, marshes, andwet tropical forests. Fungi tend to dominate in soils that are well aerated and lessdisturbed, such as grasslands, forests, and reduced-tillage agricultural systems.
Microbial growth reflects the dominant groups of organisms present in a soil.The importance of microbial products for forming and maintaining SOM has beenshown through the addition of glucose to soil, which produces microbial productsthat are ultimately more stable than some plant-derived compounds. The biochem-ical composition of microbial cells varies significantly among groups of microbes(such as fungi, G� bacteria, G� bacteria, and actinomycetes). Microbial productssuch as phenols, amino sugars, and fungal melanins may contribute significantlyto maintaining SOM. Information on the composition of the microbial communitycan be used to improve the process-based C cycling models described in Chap. 16and provide more insight into humification processes.
314 Chapter 12 Carbon Cycling and Formation of Soil Organic Matter
TABLE 12.2 Biochemical and Molecular Composition of Prokaryotic Cellsa
Different kinds ofMolecule Dry weight(%)b Molecules per cell molecules
Total macromolecules 96 24,610,000 2500Protein 55 2,350,000 1850Polysaccharide 5 4,300 2Lipid 9.1 22,000,000 4Lipopolysaccharide 3.4 1,430,000 1DNA 3.1 2 1RNA 20.5 255,500 660Murein 2.5 1 1Glycogen 2.5 4,360 1
Total monomers 3.0 —c 350Amino acids 0.5 — 100Sugars 3.0 — 50Nucleotides 2.0 — 200
Inorganic 1.0 — 18Total 100%
aData from Neidhardt et al. (1996).bDry weight calculated on basis of 70% cell water content.cReliable estimates are lacking.
Ch12-P546807.qxd 11/18/06 7:05 PM Page 314
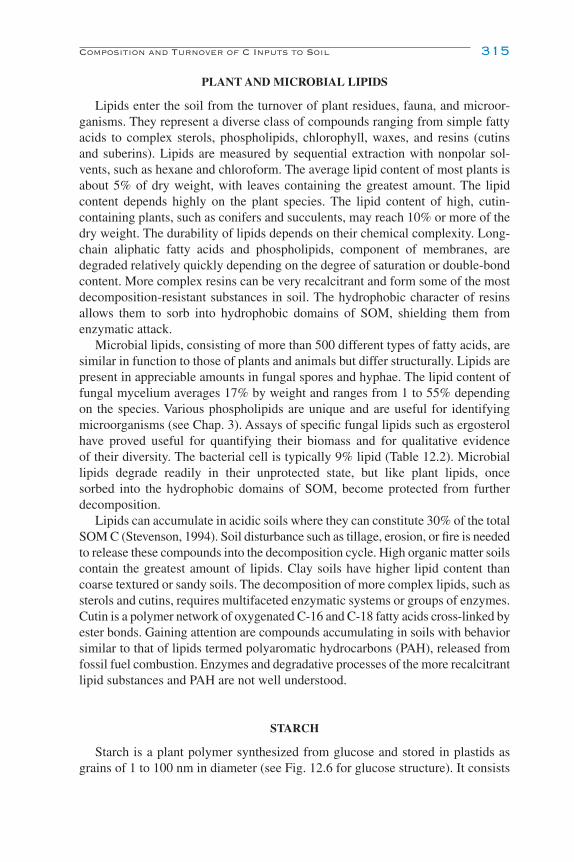
PLANT AND MICROBIAL LIPIDS
Lipids enter the soil from the turnover of plant residues, fauna, and microor-ganisms. They represent a diverse class of compounds ranging from simple fattyacids to complex sterols, phospholipids, chlorophyll, waxes, and resins (cutinsand suberins). Lipids are measured by sequential extraction with nonpolar sol-vents, such as hexane and chloroform. The average lipid content of most plants isabout 5% of dry weight, with leaves containing the greatest amount. The lipidcontent depends highly on the plant species. The lipid content of high, cutin-containing plants, such as conifers and succulents, may reach 10% or more of thedry weight. The durability of lipids depends on their chemical complexity. Long-chain aliphatic fatty acids and phospholipids, component of membranes, aredegraded relatively quickly depending on the degree of saturation or double-bondcontent. More complex resins can be very recalcitrant and form some of the mostdecomposition-resistant substances in soil. The hydrophobic character of resinsallows them to sorb into hydrophobic domains of SOM, shielding them fromenzymatic attack.
Microbial lipids, consisting of more than 500 different types of fatty acids, aresimilar in function to those of plants and animals but differ structurally. Lipids arepresent in appreciable amounts in fungal spores and hyphae. The lipid content offungal mycelium averages 17% by weight and ranges from 1 to 55% dependingon the species. Various phospholipids are unique and are useful for identifyingmicroorganisms (see Chap. 3). Assays of specific fungal lipids such as ergosterolhave proved useful for quantifying their biomass and for qualitative evidenceof their diversity. The bacterial cell is typically 9% lipid (Table 12.2). Microbiallipids degrade readily in their unprotected state, but like plant lipids, oncesorbed into the hydrophobic domains of SOM, become protected from furtherdecomposition.
Lipids can accumulate in acidic soils where they can constitute 30% of the totalSOM C (Stevenson, 1994). Soil disturbance such as tillage, erosion, or fire is neededto release these compounds into the decomposition cycle. High organic matter soilscontain the greatest amount of lipids. Clay soils have higher lipid content thancoarse textured or sandy soils. The decomposition of more complex lipids, such assterols and cutins, requires multifaceted enzymatic systems or groups of enzymes.Cutin is a polymer network of oxygenated C-16 and C-18 fatty acids cross-linked byester bonds. Gaining attention are compounds accumulating in soils with behaviorsimilar to that of lipids termed polyaromatic hydrocarbons (PAH), released fromfossil fuel combustion. Enzymes and degradative processes of the more recalcitrantlipid substances and PAH are not well understood.
STARCH
Starch is a plant polymer synthesized from glucose and stored in plastids asgrains of 1 to 100 nm in diameter (see Fig. 12.6 for glucose structure). It consists
Composition and Turnover of C Inputs to Soil 315
Ch12-P546807.qxd 11/18/06 7:05 PM Page 315
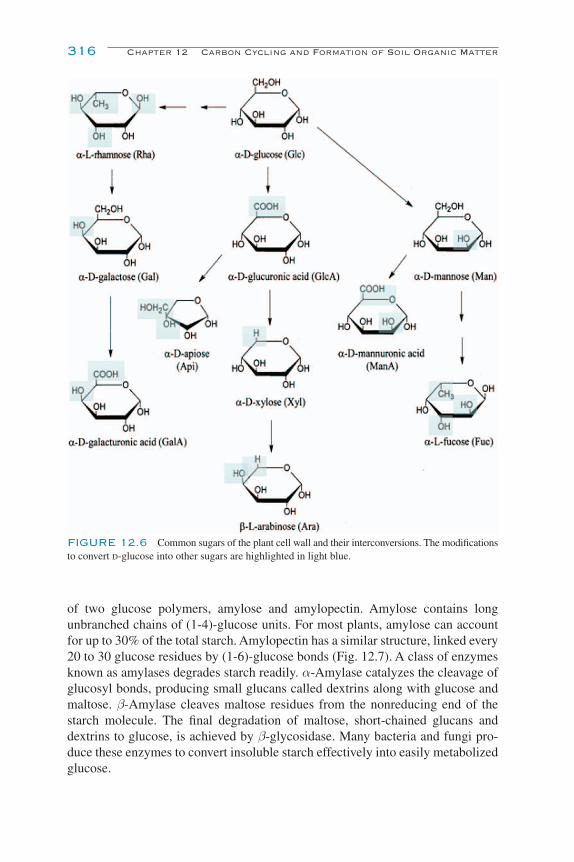
of two glucose polymers, amylose and amylopectin. Amylose contains longunbranched chains of (1-4)-glucose units. For most plants, amylose can accountfor up to 30% of the total starch. Amylopectin has a similar structure, linked every20 to 30 glucose residues by (1-6)-glucose bonds (Fig. 12.7). A class of enzymesknown as amylases degrades starch readily. α-Amylase catalyzes the cleavage ofglucosyl bonds, producing small glucans called dextrins along with glucose andmaltose. β-Amylase cleaves maltose residues from the nonreducing end of thestarch molecule. The final degradation of maltose, short-chained glucans anddextrins to glucose, is achieved by β-glycosidase. Many bacteria and fungi pro-duce these enzymes to convert insoluble starch effectively into easily metabolizedglucose.
316 Chapter 12 Carbon Cycling and Formation of Soil Organic Matter
FIGURE 12.6 Common sugars of the plant cell wall and their interconversions. The modificationsto convert D-glucose into other sugars are highlighted in light blue.
Ch12-P546807.qxd 11/18/06 7:05 PM Page 316
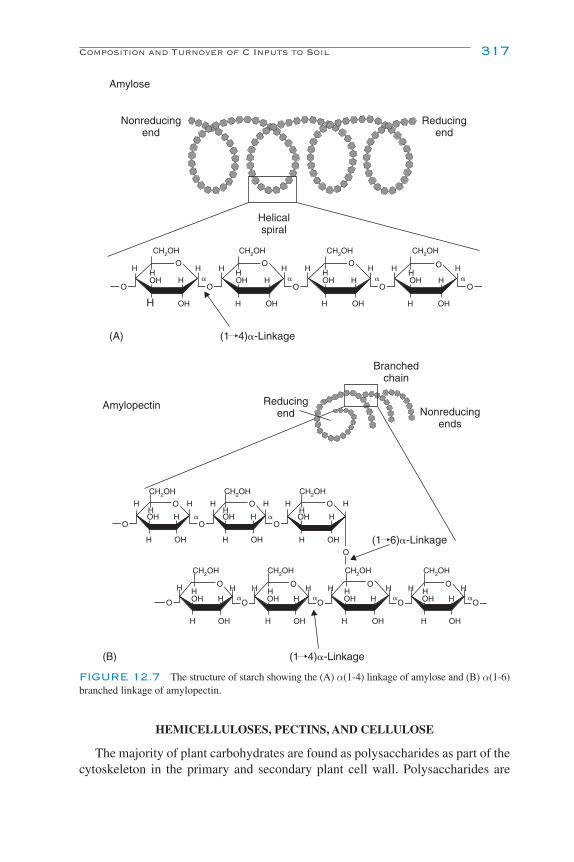
HEMICELLULOSES, PECTINS, AND CELLULOSE
The majority of plant carbohydrates are found as polysaccharides as part of thecytoskeleton in the primary and secondary plant cell wall. Polysaccharides are
Composition and Turnover of C Inputs to Soil 317
H
HH
OH
OH
H OH H OH H
H HHHHHH H
OOOO
OH
HOH
OH
HOH
OH
HOH
O
O
OH
CH2OH CH2OH CH2OH CH2OH
� � � �
(1 4)�-Linkage
Amylose
Nonreducingend
Reducingend
Helicalspiral
(A)
H H HH H H
OH
OH OH OH
H
H
H H H H H
H
OHH OHH OHH OHH
OHH OHH
O
H HHOH HOH
O OH
HOH
OH
HOH
O
O
O
O
O
H H H
O
O
CH2OH
CH2OH CH2OH CH2OH CH2OH
CH2OH CH2OH
�
�H
O�
HH
O�
H
O�
�
O
O
(1 4)�-Linkage
(1 6)�-Linkage
Reducingend Nonreducing
ends
Branchedchain
Amylopectin
(B)
FIGURE 12.7 The structure of starch showing the (A) α(1-4) linkage of amylose and (B) α(1-6)branched linkage of amylopectin.
Ch12-P546807.qxd 11/18/06 7:05 PM Page 317

long chains of sugars that are covalently linked through H bonds. The vast majorityare aldoses with the empirical formula (CH2O)n. All of the monosaccharides in theplant cell wall are derived from glucose and upon alteration form a variety of 5- and6-C sugars (Fig. 12.6). The sugars are locked into polymerized chains by pyranoseor furanose rings to form either hemicellulose/pectic or cellulose microfibrils.
Hemicelluloses and pectin are composed of 5-C sugars or glycans. The major-ity of glycans of flowering plants consist of D-xylose, D-glucuronic acid, andD-arabinose. A common cross-linked structure is (1-4)-D-glucan and (1-4)-D-xylosefound in all dicotyledons and about half of monocots. In many grasses, the majorcross-linked glycan is glucuronoarabinoxylan. Cereals and grasses also contain amixed linkage of 1-3(1-4)-D-glucans as a distinguishing component of the cross-linked glycan–cellulose microfibril network. A mixture of heterogeneous, branched,highly hydrated polysaccharides composed mainly of D-galacturonic acid is calledpectin. Pectins are thought to influence cell wall porosity, pH, and cell-to-celladhesion. Hemicelluloses are reduced to simple sugars by several enzymes knowncollectively as pectinases. For this reason, the degradation of pectin and hemicel-lulose is thought to occur together. The study of hemicellulose/pectin degradationhas received much attention because of its importance as a point of attack bypathogens and as a means for symbionts such as rhizobia and mycorrhiza to gainaccess to the middle lamella.
The pectinase enzyme system includes three stages of substrate degradation.The degradation of hemicellulose/pectin is similar to cellulose degradation exceptthat more enzymes are involved. The decoupling of the hemicellulose and pectincross-linked glycan structure is thought to provide access for other cell wall-degrading enzymes. The release of oligogalacturonides and simple sugars repressesthe enzyme system and is thought to control microbial succession during litterdecomposition. Pectinolytic soil bacteria include species of Erwinia, Arthobacter,Pseudomonas, and Bacillus. Common pectinolytic fungi are species of Aspergillus,Rhyzopus, Fusarium, Sclerotina, and Penicillium. Yeast such as Conida andKluyveromyces also exhibit pectinase activity.
Cellulose is the most abundant plant polysaccharide and accounts for 15 to30% of the primary cell wall dry mass and a greater percentage of the secondarycell wall, especially of woody species. It consists of glucose units linked by β(1-4)bonds to form D-glucan chains (Fig. 12.8). The chains are cross-linked by H bondsto form paracrystalline assemblages called microfibrils. The average microfibril iscomposed of 36 individual glucan chains and several thousand individual glucanmolecules to reach a length of 2 to 3 mm. Cellulose microfibrils are cross-linkedinto a network or scaffold with glycans or hemicellulose. In addition to cellulose,plants can synthesize callose by linking glucans in the β(1-3) configuration similarto that found in yeast and fungi. Callose found in phloem sieve plates, pollen tubes,cotton fibers, and other specialized cells is produced in response to wounding suchas fungal hypha penetration of the primary cell wall.
Cellulose microfibrils are decomposed by the enzyme system termed cellulase,composed of endoglucanase, exoglucanase, and β-glucosidase (also known
318 Chapter 12 Carbon Cycling and Formation of Soil Organic Matter
Ch12-P546807.qxd 11/18/06 7:05 PM Page 318

collectively as cellobiases). The cellulase enzymes have distinct roles in cleavingthe various bonds within the microfibril structure. This causes disruption of thecrystalline structure followed by depolymerization into short glucose chains.Endoglucanases act randomly on both soluble and insoluble glucose chains bycleaving the β(1-4) linkages, yielding glucose and cellooligosaccharides. Followingthis, exoglucanases, including glucanhydrolase, act on the nonreducing ends of thecellulose chains, yielding glucose and cellobiose (glucose dimers) and cellotriose(glucose trimers). In the final step of decomposition, β-glucosidase hydrolyzes theglucose chain fragments to glucose. Breakdown of the glucose subunits occursrapidly and the products can inhibit the activity of the cellulase system.
A wide range of organisms degrade cellulose, but only a few have demonstratedthe complete depolymerization and hydrolysis of the crystalline microfibril struc-ture in vitro. The cellulase system of the fungus genus Trichoderma has beenextensively studied and shows a large production of endo-β-glucanases and exo-β-glucanases but low levels of β-glucocidases. In contrast, Aspergillus produceslarge amounts of endo-β-glucanase and β-glucocidases but low levels of exo-β-glucanases. Chaetoium, an ascomycetous fungus, is found on a wide variety ofcellulose materials from paper to composts, especially in moist environments. Itproduces thermotolerant cellulases that may be commercially viable for convertingcellulose to simple sugars from a variety of sources suitable as sources of biofuels.Other fungi with extensively studied cellulase systems include Cremonium cellu-loyticus, Penicillium, Fusarium, and the edible mushroom Agaricus.
Bacteria have less extensive cellulase systems compared to fungi. Bacterialcellulases are organized into a globular scaffolding protein called cellusomes, boundto their cell walls. These structures coordinate the cellulase system for direct attackof crystalline microfibrils, increasing the activity or efficiency of the individual
Composition and Turnover of C Inputs to Soil 319
H
O
CH2OH
HO
OH
HHOH
OHH
4 1 β H OH
H
HHOH
CH2OH
OH
βO
CH2OH
HO
OH
HHOH
OHH
β HH
H
HOH
CH2OH
OH
βO
H
O
CH2OH
H
O O
H HHOH
OHH
4
1 βH
OH
H HH
OH
CH2OH
OH
β
O
CH2OH
H
O O
H HHOH
OHH
βH
OH
HH
OH
CH2OH
OH
β
O
H
O
CH2OH
H
O O
H HHOH
OHH
4
1 βH
OH
H HH
OH
CH2OH
OH
β
O
CH2OH
H
O O
H HHOH
OHH
βH
OH
HH
OH
CH2OH
OH
β
O
Cellulose
Cellulose microfibril
O
FIGURE 12.8 Cellulose structure showing β(1-4) linkages combining glucose residues into asingle chain polymer. Chains are cross-linked by hydrogen bonds to form cellulose microfibrils.
Ch12-P546807.qxd 11/18/06 7:05 PM Page 319

enzymes and allowing the bacteria a better chance to ingest the freed glucose.This is in contrast to fungi that secrete cellulases, resulting in the degradationof cellulytic substances away from the hyphae and thus not guaranteeing thatthe soluble glucose products are ingested. Common aerobic soil bacteria thatdepolymerize cellulose are Cellulomas, Cellovibrio, Pseudomonas, and Bacillus.Anaerobic bacteria include Acetobacter, Bacteriodes, Clostridium, Fibrobacter,and Rummococcus.
LIGNIN
After cellulose, lignin is the second most abundant organic substance producedduring NPP. Lignin is a complex and dense amorphous secondary cell wall poly-mer found in the trachea elements and sclerenchyma of terrestrial plants. Thebasic structure of lignin is based on the phenyl propanoid unit, consisting of anaromatic ring and a 3-C side chain (Fig. 12.9). The conversion of phenylalanineand tyrosine in the shikimic and phenylpropanoid pathways to p-coumaric acid byammonia lyase is the starting point of the phenylpropanoid metabolic pathwaythat forms the monolignol precursors synapyl, coniferyl, and coumaryl alcohols.Lignin synthesis begins with phenoxy radical coupling, a random self-replicating
320 Chapter 12 Carbon Cycling and Formation of Soil Organic Matter
P-hydroxyphenyl R1 � R2 � HGuaiacyl R1 � OCH3. R2 � HSyringyl R1 � R2 � OCH3
OCH3
OCH3
OCH3
OCH3
OCH3
OCH3
OCH3
OCH3
OCH3
OCH3
OCH3
OCH3
H3CO
H3CO
H3CO
H3CO
H3CO
H3CO H3CO
H3COH3CO
OCH3HO
HOHO
HO
HO
HO
HO
HO
OH
OH
OHOH
OH
OH
OH
OH
OH
OH
HO
OH
OH OH
OH
OH
OH
OH
OH
OH
OH OH
OH
OH
O
OOH
O
O
O
OO
O
O
OO
O
O O
O
O
O
OO
O
O
OR2 R1
O
O
O
O
FIGURE 12.9 Proposed structure of a softwood lignin showing the large hydrocarbon contentthat among other characteristics leads to the hydrophobic character of the plant secondary cell wall.
Ch12-P546807.qxd 11/18/06 7:05 PM Page 320
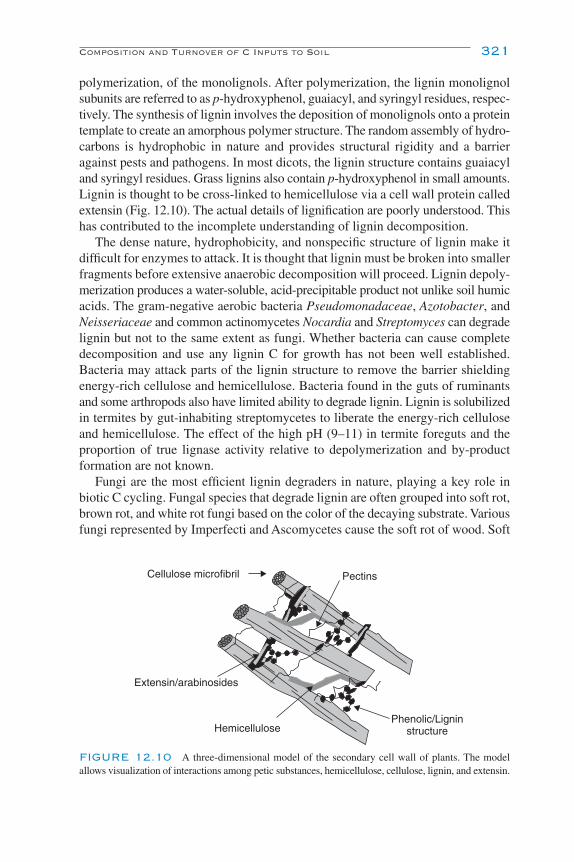
Composition and Turnover of C Inputs to Soil 321
polymerization, of the monolignols. After polymerization, the lignin monolignolsubunits are referred to as p-hydroxyphenol, guaiacyl, and syringyl residues, respec-tively. The synthesis of lignin involves the deposition of monolignols onto a proteintemplate to create an amorphous polymer structure. The random assembly of hydro-carbons is hydrophobic in nature and provides structural rigidity and a barrieragainst pests and pathogens. In most dicots, the lignin structure contains guaiacyland syringyl residues. Grass lignins also contain p-hydroxyphenol in small amounts.Lignin is thought to be cross-linked to hemicellulose via a cell wall protein calledextensin (Fig. 12.10). The actual details of lignification are poorly understood. Thishas contributed to the incomplete understanding of lignin decomposition.
The dense nature, hydrophobicity, and nonspecific structure of lignin make itdifficult for enzymes to attack. It is thought that lignin must be broken into smallerfragments before extensive anaerobic decomposition will proceed. Lignin depoly-merization produces a water-soluble, acid-precipitable product not unlike soil humicacids. The gram-negative aerobic bacteria Pseudomonadaceae, Azotobacter, andNeisseriaceae and common actinomycetes Nocardia and Streptomyces can degradelignin but not to the same extent as fungi. Whether bacteria can cause completedecomposition and use any lignin C for growth has not been well established.Bacteria may attack parts of the lignin structure to remove the barrier shieldingenergy-rich cellulose and hemicellulose. Bacteria found in the guts of ruminantsand some arthropods also have limited ability to degrade lignin. Lignin is solubilizedin termites by gut-inhabiting streptomycetes to liberate the energy-rich celluloseand hemicellulose. The effect of the high pH (9–11) in termite foreguts and theproportion of true lignase activity relative to depolymerization and by-productformation are not known.
Fungi are the most efficient lignin degraders in nature, playing a key role inbiotic C cycling. Fungal species that degrade lignin are often grouped into soft rot,brown rot, and white rot fungi based on the color of the decaying substrate. Variousfungi represented by Imperfecti and Ascomycetes cause the soft rot of wood. Soft
Hemicellulose
Pectins
Phenolic/Ligninstructure
Extensin/arabinosides
Cellulose microfibril
FIGURE 12.10 A three-dimensional model of the secondary cell wall of plants. The modelallows visualization of interactions among petic substances, hemicellulose, cellulose, lignin, and extensin.
Ch12-P546807.qxd 11/18/06 7:05 PM Page 321

rots prefer polysaccharides but have the ability to remove methylated side chains(R–O–CH3) and cleave aromatic rings, but cannot completely degrade the ligninstructure. The soft rot fungi are important in mesic environments and appear todegrade hardwood lignin more effectively than that of softwoods, with Chaetomiumand Preussia being representative organisms. Box 12.3 shows the vulnerability todegradation of C found in specific positions in the monolignol coniferyl alcoholover a 2-year period.
The majority of wood decay is performed by brown and white rot fungi fromthe basidiomycetes. Brown rots lack ring-cleaving enzymes but readily degradehemicellulose and cellulose of intact wood. They modify and degrade lignin throughdemethylation and removal of methylated side chains producing hydroxylatedphenols. The oxidation of the lignin aromatic structures causes a characteristicbrown color. The separation of polysaccharides from lignin is thought to occurthrough nonenzymatic oxidation via the production of low-molecular-weight
322 Chapter 12 Carbon Cycling and Formation of Soil Organic Matter
BOX 12.3
Radioactive or stable isotopes of C have been used extensively to study lig-nocellulose decomposition. Isotopically labeled lignocellulose preparationsare prepared either chemically or by feeding plants with 14C- or 13C-labeledphenylalanine, cinnamic acid, or glucose. In a classic study, Martin et al.(1980) followed the biodegradation and stabilization of specific C of modeland cornstalk lignins, lignin monomer alcohols, and wheat straw over a 2-yearincubation period using 14C-labeled substrates. The beta radiation emittedby 14C makes it possible to follow small changes in C metabolism. Theresearchers labeled coniferyl alcohol with 14C in specific C positions (A)and then fed it to corn plant cuttings to label the lignin fraction with 14C. (B)The corn and free coniferyl alcohol was then added to soil and incubated.In addition, 14C-labeled wheat straw labeled uniformly in a 14CO2 environ-ment was used for comparison. During the 2-year incubation under idealmoisture and temperature conditions, about 40% of the ring and two-side-chain C of coniferyl alcohol units were evolved as CO2. Loss of OCH3
carbons varied from 52 to 69%. The C mineralization rate was most rapidduring 3 to 6 months of incubation. In comparison, total C losses from intactwheat straw and cornstalks after 2 years were about 72%. Most of the labeledlignin C was recovered from the humic acid fraction compared to the intactwheat straw. The 14C of aromatics enters the microbial biomass to a very lim-ited extent. However, an extrapolation of the decomposition data using anexponential function indicated that the same amount of lignin and intact plantresidue C would remain in soil after 10 years of decomposition. Though itappears lignin is difficult to degrade, it does decompose at a rate fast enoughnot to accumulate in soil over short periods of time measured in decades.
Ch12-P546807.qxd 11/18/06 7:05 PM Page 322

hydroxyl radicals (�OH). This gives the brown rots the ability to degrade intactwood without completely disrupting the lignin structure. Representative organ-isms include Poria and Gloeophyllum.
White rot fungi are the most active lignin degraders. Several thousand speciesof white rots are known mainly from the basidiomycetes and ascomycetes. Thebasidiomycetes most studied are Phanerochataete chrysosprium and Coriolusversicolor. Pleurotus ostreatus, the oyster mushroom, and Lintinula edodes, theshiitake mushroom, are wood decay fungi that are grown commercially for food.Ascomycetes include Xylaria, Libertella, and Hypoxylon. They produce lignolytic
Composition and Turnover of C Inputs to Soil 323
O14
CH3
Wheat straw
1-14
C
Ring-14
C
2-14
C
1-14
C
O14
CH3
2-14
C
Ring-14
C
80
70
60
50
40
30
20
10
0
C. m
iner
aliz
ed (
%)
0 5 10 15 20 25Months
CH2
CH
CH14C (ring)
1-14C
2-14C
14C (methyl)
OCH3
OH
(A)
(B)
BOX 12.3 (Continued)
Ch12-P546807.qxd 11/18/06 7:05 PM Page 323
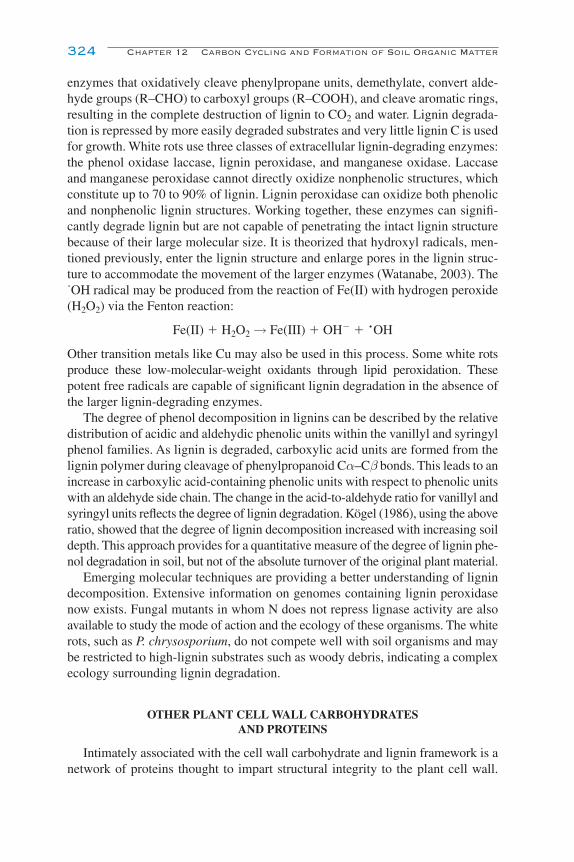
enzymes that oxidatively cleave phenylpropane units, demethylate, convert alde-hyde groups (R–CHO) to carboxyl groups (R–COOH), and cleave aromatic rings,resulting in the complete destruction of lignin to CO2 and water. Lignin degrada-tion is repressed by more easily degraded substrates and very little lignin C is usedfor growth. White rots use three classes of extracellular lignin-degrading enzymes:the phenol oxidase laccase, lignin peroxidase, and manganese oxidase. Laccaseand manganese peroxidase cannot directly oxidize nonphenolic structures, whichconstitute up to 70 to 90% of lignin. Lignin peroxidase can oxidize both phenolicand nonphenolic lignin structures. Working together, these enzymes can signifi-cantly degrade lignin but are not capable of penetrating the intact lignin structurebecause of their large molecular size. It is theorized that hydroxyl radicals, men-tioned previously, enter the lignin structure and enlarge pores in the lignin struc-ture to accommodate the movement of the larger enzymes (Watanabe, 2003). The�OH radical may be produced from the reaction of Fe(II) with hydrogen peroxide(H2O2) via the Fenton reaction:
Fe(II) � H2O2 → Fe(III) � OH� � �OH
Other transition metals like Cu may also be used in this process. Some white rotsproduce these low-molecular-weight oxidants through lipid peroxidation. Thesepotent free radicals are capable of significant lignin degradation in the absence ofthe larger lignin-degrading enzymes.
The degree of phenol decomposition in lignins can be described by the relativedistribution of acidic and aldehydic phenolic units within the vanillyl and syringylphenol families. As lignin is degraded, carboxylic acid units are formed from thelignin polymer during cleavage of phenylpropanoid Cα–Cβ bonds. This leads to anincrease in carboxylic acid-containing phenolic units with respect to phenolic unitswith an aldehyde side chain. The change in the acid-to-aldehyde ratio for vanillyl andsyringyl units reflects the degree of lignin degradation. Kögel (1986), using the aboveratio, showed that the degree of lignin decomposition increased with increasing soildepth. This approach provides for a quantitative measure of the degree of lignin phe-nol degradation in soil, but not of the absolute turnover of the original plant material.
Emerging molecular techniques are providing a better understanding of lignindecomposition. Extensive information on genomes containing lignin peroxidasenow exists. Fungal mutants in whom N does not repress lignase activity are alsoavailable to study the mode of action and the ecology of these organisms. The whiterots, such as P. chrysosporium, do not compete well with soil organisms and maybe restricted to high-lignin substrates such as woody debris, indicating a complexecology surrounding lignin degradation.
OTHER PLANT CELL WALL CARBOHYDRATES AND PROTEINS
Intimately associated with the cell wall carbohydrate and lignin framework is anetwork of proteins thought to impart structural integrity to the plant cell wall.
324 Chapter 12 Carbon Cycling and Formation of Soil Organic Matter
Ch12-P546807.qxd 11/18/06 7:05 PM Page 324

These structural proteins are enriched with glycoproteins containing hydroxypro-line, proline, and glycine. Another class of structural proteins called extensin, similarto collagen, consists of repeating serine–hydroxyproline and tyrosine–lysine–tyrosine sequences (Fig. 12.10). This structural protein plays an important archi-tectural role cross-linking lignin to the carbohydrate network and may compriseup to 15% of the primary cell wall (Lodish et al., 2000). Most of the hydroxypro-lines are glycosylated with chains of three or four arabinose residues, and the serinesare linked to galactose, making extensin about 65% carbohydrate. In addition toproviding structural integrity to the plant cell wall, the unique amino acid and gly-cosation sequence may prevent microbial attack by presenting unrecognizablecleavage sites to proteolytic enzymes. Pathogens may gain access to the middlelamella through their ability to degrade extensin. The degradation of extensin mayprovide access for enzymes to further the attack of the polysaccharide and ligninframework of plant cell walls. Extensin most likely provides a source of N duringdecomposition. Another group of soil glycoproteins is found in the product identifiedas glomalin in soil. This fairly stable fungal product is produced by arbuscularmycorrhiza and is said to be involved with aggregation (Rillig, 2004).
PLANT SECONDARY COMPOUNDS
Plants produce an array of organic compounds that are not associated with growthand development. These are often called secondary metabolites or plant second-ary compounds and are divided into three major groups: terpenoids, alkaloids, andphenylpropanoids. Many play a significant role against herbivory and microbialinfection, as attractants for pollinators and seed dispersers, and as allelopathic agents.These ecological functions affect primarily other organisms and have a profoundeffect on decomposition processes. The polyphenolic compounds range in molecularweight from 500 to 3000 daltons. They readily precipitate proteins through tanninreactions. Two major classes of tannins termed condensed and hydrolyzable tan-nins are found in higher plants (Fig. 12.11). Condensed tannins, also referred to asproanthocyanidins, are polymers of three-ring flavanols joined with C–C bonds.Hydrolyzable tannins are further grouped into gallotannins and ellagitannins thatare composed of gallic acid or hexahydroxydiphenic acid esters, respectively, linkedto a sugar moiety. The tanning of leather is an example in which a natural productis protected from microbial attack. The rate of decomposition can be directlyrelated to the content of plant secondary compounds (Fig. 12.12). The ability toprecipitate proteins has been hypothesized to be a competitive advantage for thoseorganisms that can utilize the tannin–protein complexes (Kraus et al., 2003).
ROOTS AND ROOT EXUDATES
The allocation of photosynthate below ground can vary from 10 to 70% of totalNPP (Finlay and Soderstrom, 1992). This represents a potentially significant Cinput to soils compared to aboveground plant litter inputs. Roots contain all the
Composition and Turnover of C Inputs to Soil 325
Ch12-P546807.qxd 11/18/06 7:05 PM Page 325

326 Chapter 12 Carbon Cycling and Formation of Soil Organic Matter
OH
OH
R
OH
OH
R
B
B
R
HO
HO
HO
HO
HO
HO
OHOH
OH
R
B
A
A
B
A
A
O
O
OHHO
OH
OH
OHOH
OH
(B)
(A)R � H; ProcyanidinR � OH; Prodelphinidin
O
O
FIGURE 12.11 Structures of tannins. (A) A condensed tannin trans monomer unit and (B) acondensed tannin trimer showing different intermonomer linkages (C4–C8 and C4–C6).
0.001 0.01 0.1 1
40
35
30
25
20
15
10
5
0
K (day�1)
Aci
d in
solu
ble
(%)
FIGURE 12.12 The influence of secondary compounds or acid-insoluble substances (%) onthe rate of decomposition.
Ch12-P546807.qxd 11/18/06 7:05 PM Page 326

major structural components described above. Root exudates are the more easilydecomposed simple carbohydrates (sugars) and amino compounds. Roots con-tribute mucilage from their growing tips, sloughed root cells, and exudates to soil.A significant portion of root exudates are nutrients, especially N (He et al., 2006).The amount of C entering soil as root exudates has been fiercely debated mainlydue to the complexity of studying roots in situ. Complicating this debate is therole of mycorrhizas in contributing C. The majority of C allocated below groundis respired within 2 weeks by the roots, mycorrhiza, and rhizosphere organisms.Root exudates are important substrates that contribute to rhizosphere processes,but their role in C cycling is not well understood. Natural grasslands labeled with14CO2 retained 52% of the assimilated C above ground and 36% in belowgroundstructures (Milchunas et al., 1985). In a field tree labeling experiment, only 20%of assimilated 14CO2 was found in Populus eugenii roots 2 weeks following labelingregardless of season (Horwath et al., 1994). The contribution of roots, althoughvarying widely among different species, is often underestimated, leaving uncertaintyin C budgets that aim to understand sources of C that maintain and sequester soil C.
CELL WALLS OF MICROORGANISMS
Microbial cell walls have been shown to both accumulate in soil and become by-products for microbial growth and synthesis of humic substances. Many differentbacteria such as Streptomyces, Pseudomonas, Bacillus, and Clostridium degradefungal cell walls. A major component of fungal cell walls is chitin, which contributessignificant quantities of amino sugars to soil. The acetylglucosamine structure ofchitin (Fig. 12.13) contains N, making its degradation unlikely to be limited by N.Recent studies have shown that available soil N is highly related to amino sugarcontent. Most amino sugars in soil are of microbial origin. The cell walls ofPhytophthera contain fibers of cellulose and β(1-4) glucans that may interact withother cell components to affect its decomposition. Polymers of β(1-3) and β(1-6)
Composition and Turnover of C Inputs to Soil 327
O
β(1,4)
H
CH2OH
HO
HOH
NH
CH3
H
O
β(1,4)
H
H
CH2OH
HO
HOH
NH
CH3
H
O
β(1,4)
H
H
CH2OH
HO
HOH
NH
C OC OC O
CH3
H
O
β(1,4)H
Acetylgroup
N replaces Oin glucose
(amino linkage)
FIGURE 12.13 The structure of chitin showing the β(1-4) linking acetylglucosamine residues.
Ch12-P546807.qxd 11/18/06 7:05 PM Page 327
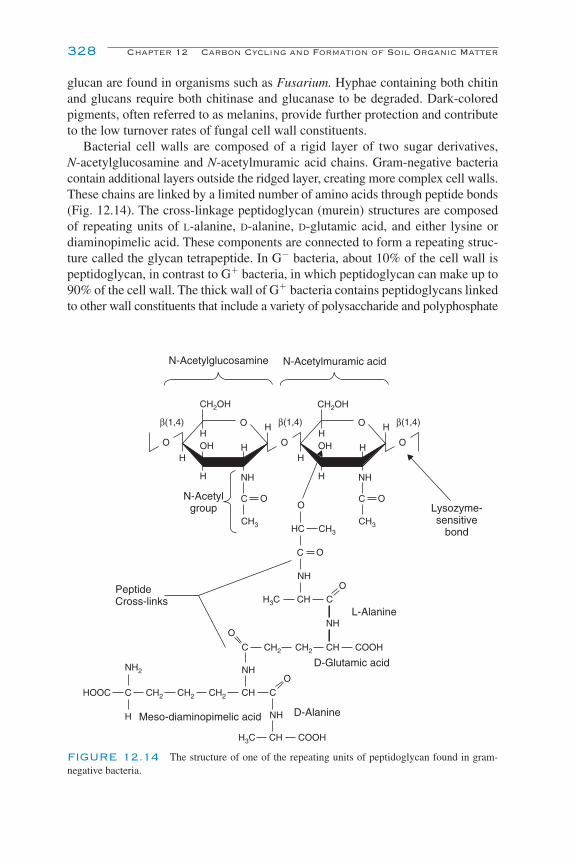
glucan are found in organisms such as Fusarium. Hyphae containing both chitinand glucans require both chitinase and glucanase to be degraded. Dark-coloredpigments, often referred to as melanins, provide further protection and contributeto the low turnover rates of fungal cell wall constituents.
Bacterial cell walls are composed of a rigid layer of two sugar derivatives,N-acetylglucosamine and N-acetylmuramic acid chains. Gram-negative bacteriacontain additional layers outside the ridged layer, creating more complex cell walls.These chains are linked by a limited number of amino acids through peptide bonds(Fig. 12.14). The cross-linkage peptidoglycan (murein) structures are composedof repeating units of L-alanine, D-alanine, D-glutamic acid, and either lysine ordiaminopimelic acid. These components are connected to form a repeating struc-ture called the glycan tetrapeptide. In G� bacteria, about 10% of the cell wall ispeptidoglycan, in contrast to G� bacteria, in which peptidoglycan can make up to90% of the cell wall. The thick wall of G� bacteria contains peptidoglycans linkedto other wall constituents that include a variety of polysaccharide and polyphosphate
328 Chapter 12 Carbon Cycling and Formation of Soil Organic Matter
O
β(1,4)
H
CH2OH
HO
N-Acetylglucosamine N-Acetylmuramic acid
HOH
NH
C O
CH3
H
O
O
O
O
β(1,4)
H
H
CH2OH
HO
HOH
NH
CH3
C O
C O
HC
NH
NH
NH
CH
H
CH
COOH
CH3C
CH2
CH COOHH3C
CH2C
H
O
β(1,4)H
Lysozyme-sensitive
bond
N-Acetylgroup
O
CH2CH2 CH
NH
CCH2CHOOC
NH2
L-Alanine
D-Alanine
D-Glutamic acid
Meso-diaminopimelic acid
PeptideCross-links
CH3
FIGURE 12.14 The structure of one of the repeating units of peptidoglycan found in gram-negative bacteria.
Ch12-P546807.qxd 11/18/06 7:05 PM Page 328
molecules joined through phosphoid–ester linkages. Most contain D-alanine. Morethan 100 different types of peptidoglycans have been identified.
SOIL ORGANIC MATTER
The study of SOM began two centuries ago because of the recognition that itinfluences soil quality and plant growth. SOM contributes directly to plant andmicrobial growth through its effects on the chemical, physical, and biologicalproperties of soil. Soil organic matter is the primary source of the essential nutri-ents N, P, and S. The association of SOM with secondary minerals such as clay andamorphous oxides to form organomineral complexes creates soil structure throughthe formation of aggregates. Aggregate formation enhances soil physical structureby organizing soil mineral grains and promoting aeration and water infiltrationand storage. Good soil structure promotes plant growth and creates a labyrinth ofhabitats for microbial activity. The formation and decay of SOM is an essentialprocess regulating atmospheric trace gases, particularly the production of CO2
and nitrous oxide and consumption of methane. Another important consequenceof the interactions of SOM with minerals is the creation of hydrophilic and hydro-phobic domains that affect the adsorption of pesticides and other toxic compounds.Environmental toxicologists often refer to these domains as rubbery and glassy C,respectively, to explain the degree of adsorption and sorption of various chemicalcompounds in soil.
SOIL ORGANIC MATTER FORMATION
The decomposition activities and life strategies of soil microorganisms and faunaact as the “waste management” crew of an ecosystem and play an important rolein maintaining the global C budget by balancing the CO2 fixed through photosyn-thesis and releasing CO2 back to the atmosphere by decomposition. In temperateecosystems, a small fraction of the C in NPP and NSP is preserved because it eitherbecomes metabolized to a recalcitrant state, such as humic substances, or is protectedphysically through association with secondary minerals and soil aggregates. In borealecosystems, cold temperatures and water logging (peat soils) impede decomposeractivity, leading to the accumulation of soil C as plant residues or particulate organicmatter (POM). Permafrost areas such as tundra accumulate significant soil C andPOM because low temperatures decrease microbial activity.
Soil organic matter consists of unrecognizable partially decayed plant residues,soil microorganisms, soil fauna, and the by-products of decomposition that lead tothe production of humic substances. This process is called humification. The for-mation of humic substances results from many events of oxidation and hydrolysisthat create materials with increased C and H and lower O content compared to theoriginal animal, microbial, and plant tissue (Fig. 12.15). During the repeateddegradation, N compounds react through free-radical coupling and increase the
Soil Organic Matter 329
Ch12-P546807.qxd 11/18/06 7:05 PM Page 329

N content of humic substances. Humic substances consist of approximately 50–55%C, 5% H, 33% O, 4.5% N, 1% S, and 1% P (Table 12.3). Other metals and micro-nutrients, such as Al, Ca, Zn, and Cu, are present in much smaller amounts.
The humification process is analogous to lignin formation in that precursors areenzymatically produced or altered and the synthesis is characterized by condensationinto larger molecules or structures. As with lignin, no two humic substances arealike in structure, but they behave similarly in function. The general chemical andstructural properties of SOM are similar in soils found around the earth and appearto be a universal outcome of microbial decomposition processes in association withhumification process and interactions with secondary minerals. As humans beginto explore the solar system the discovery of humic substances on distant planetsmay suggest past or present life. Since extraterrestrial simple organic compoundssuch as amino acids are found in meteorites it would be of interest to determine ifprebiotic humic compounds also occur on asteroids.
There has been considerable debate about whether plant materials are directlyincorporated into humic substances or are altered through microbial activity(Shevchenko and Bailey, 1996). Waksman (1936) theorized that lignin and proteinscondensed to form humic acids, with the latter being of microbial origin. This has
330 Chapter 12 Carbon Cycling and Formation of Soil Organic Matter
Nutrient availabilitysoil/plant source
Microbialproduction
Organic Namino acids
amino sugarsetc.
Plant labileproteins,lipids etc.
Cell wallcellulose &
lignin
condensation
Humic precursors
Humic substances
Soil solutionDissolved organic carbon
and nitrogen
Mineral associatedhumic substances
Soil aggregateformation
Physicallyprotectedparticulate
organicmatter
Lignin and microbialproductsphenolic,
quinoid, cell wall etc.
Decompositionintermediates
melins, sugars,cellular metabolites
etc.
CH3OH O2
FIGURE 12.15 Hypothesized mechanism for the formation and protection of humic sub-stances showing the importance of microbial products and altered lignin components in condensationreactions and formation of soil aggregates.
Ch12-P546807.qxd 11/18/06 7:05 PM Page 330
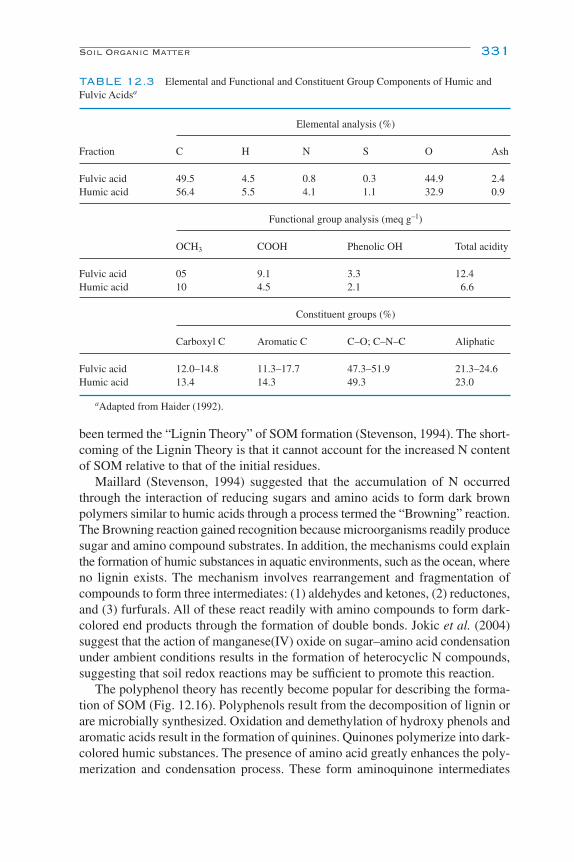
been termed the “Lignin Theory” of SOM formation (Stevenson, 1994). The short-coming of the Lignin Theory is that it cannot account for the increased N contentof SOM relative to that of the initial residues.
Maillard (Stevenson, 1994) suggested that the accumulation of N occurredthrough the interaction of reducing sugars and amino acids to form dark brownpolymers similar to humic acids through a process termed the “Browning” reaction.The Browning reaction gained recognition because microorganisms readily producesugar and amino compound substrates. In addition, the mechanisms could explainthe formation of humic substances in aquatic environments, such as the ocean, whereno lignin exists. The mechanism involves rearrangement and fragmentation ofcompounds to form three intermediates: (1) aldehydes and ketones, (2) reductones,and (3) furfurals. All of these react readily with amino compounds to form dark-colored end products through the formation of double bonds. Jokic et al. (2004)suggest that the action of manganese(IV) oxide on sugar–amino acid condensationunder ambient conditions results in the formation of heterocyclic N compounds,suggesting that soil redox reactions may be sufficient to promote this reaction.
The polyphenol theory has recently become popular for describing the forma-tion of SOM (Fig. 12.16). Polyphenols result from the decomposition of lignin orare microbially synthesized. Oxidation and demethylation of hydroxy phenols andaromatic acids result in the formation of quinines. Quinones polymerize into dark-colored humic substances. The presence of amino acid greatly enhances the poly-merization and condensation process. These form aminoquinone intermediates
Soil Organic Matter 331
TABLE 12.3 Elemental and Functional and Constituent Group Components of Humic andFulvic Acidsa
Elemental analysis (%)
Fraction C H N S O Ash
Fulvic acid 49.5 4.5 0.8 0.3 44.9 2.4Humic acid 56.4 5.5 4.1 1.1 32.9 0.9
Functional group analysis (meq g–1)
OCH3 COOH Phenolic OH Total acidity
Fulvic acid 05 9.1 3.3 12.4Humic acid 10 4.5 2.1 6.6
Constituent groups (%)
Carboxyl C Aromatic C C–O; C–N–C Aliphatic
Fulvic acid 12.0–14.8 11.3–17.7 47.3–51.9 21.3–24.6Humic acid 13.4 14.3 49.3 23.0
aAdapted from Haider (1992).
Ch12-P546807.qxd 11/18/06 7:05 PM Page 331

upon oxidation to quinones and can condense to form brown, high-molecular-weight nitrogenous humates. The polyphenol reaction is considered important forforming SOM from lignin or melanin-degradation products (Haider et al., 1975;Stevenson, 1994).
CLASSICAL FRACTIONS OF SOIL ORGANIC MATTER
Chemical analyses have been used to probe the structure of SOM and definefractions that stabilize C and N and are important for controlling nutrient cycling.The classical extraction technique involves dispersion of soil in a strong base such asNaOH or Na4P2O7 followed by acidification to fractionate different types of humicsubstances. The nonextractable fraction is termed humin. The dispersible fractionprecipitated at low pH (�2) is known as humic acid. The dissolved fraction notaffected by pH is termed fulvic acid. The extraction of humic substances depends onsoil type or parent material. Soils formed from volcanic parent material tend to havegreater humin fractions. Highly leached forested soils tend to have a higher propor-tion of fulvic acids. Grassland soils will usually have equal concentrations of all frac-tions. Much of the humin can be dispersed using a reductive agent such as sodiumthiosulfate (Na2S2O3) to counteract bridging cations such as Fe(III) to Fe(II) toremove mineral-associated humic substances. Pretreatment with HF to degrade theclay minerals will result in as much as 90–95% recovery, with the remaining C beingreferred to as black C (including charcoal) and acid-resistant waxy materials.
Fulvic acids are oxidized substances characterized by aromatic structures withextensive side chains and smaller N content compared to humic acids (Table 12.3).Fulvic acids of lower soil horizons, such as from a spodic B horizon, contain little N.
332 Chapter 12 Carbon Cycling and Formation of Soil Organic Matter
OHOH
OO
NH
CH2
H2N COO�
COOHCOOH
CH2
NH2
OH HN
NH
CH2
COOH
Further reactions andcondensation to larger
molecular structure
Condensation with amino acids andlong chain aliphatic compounds
Microbialproducts
Glycine
Lignindecomposition
FIGURE 12.16 Hypothesized formation of a humic substance by reaction of a phenol decom-position product between an amino acid and an aliphatic substance.
Ch12-P546807.qxd 11/18/06 7:05 PM Page 332
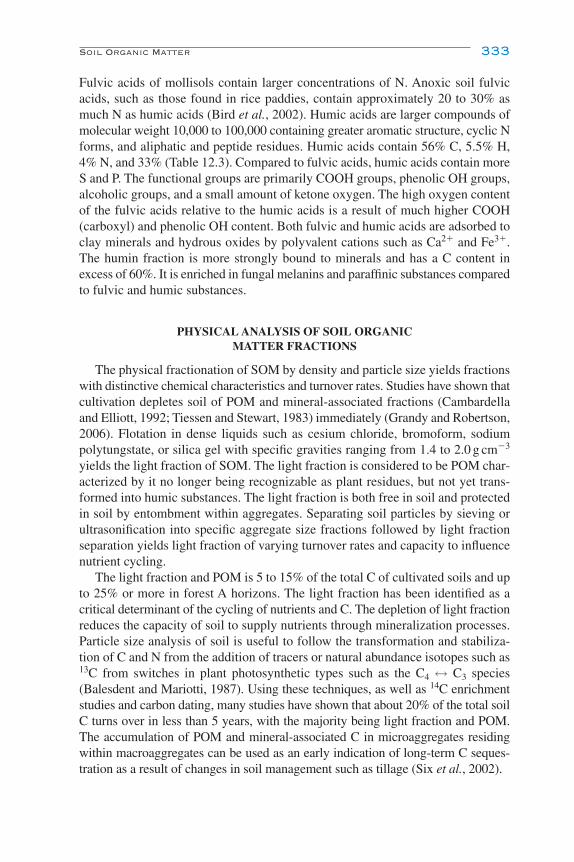
Fulvic acids of mollisols contain larger concentrations of N. Anoxic soil fulvicacids, such as those found in rice paddies, contain approximately 20 to 30% asmuch N as humic acids (Bird et al., 2002). Humic acids are larger compounds ofmolecular weight 10,000 to 100,000 containing greater aromatic structure, cyclic Nforms, and aliphatic and peptide residues. Humic acids contain 56% C, 5.5% H,4% N, and 33% (Table 12.3). Compared to fulvic acids, humic acids contain moreS and P. The functional groups are primarily COOH groups, phenolic OH groups,alcoholic groups, and a small amount of ketone oxygen. The high oxygen contentof the fulvic acids relative to the humic acids is a result of much higher COOH(carboxyl) and phenolic OH content. Both fulvic and humic acids are adsorbed toclay minerals and hydrous oxides by polyvalent cations such as Ca2� and Fe3�.The humin fraction is more strongly bound to minerals and has a C content inexcess of 60%. It is enriched in fungal melanins and paraffinic substances comparedto fulvic and humic substances.
PHYSICAL ANALYSIS OF SOIL ORGANIC MATTER FRACTIONS
The physical fractionation of SOM by density and particle size yields fractionswith distinctive chemical characteristics and turnover rates. Studies have shown thatcultivation depletes soil of POM and mineral-associated fractions (Cambardellaand Elliott, 1992; Tiessen and Stewart, 1983) immediately (Grandy and Robertson,2006). Flotation in dense liquids such as cesium chloride, bromoform, sodiumpolytungstate, or silica gel with specific gravities ranging from 1.4 to 2.0 g cm�3
yields the light fraction of SOM. The light fraction is considered to be POM char-acterized by it no longer being recognizable as plant residues, but not yet trans-formed into humic substances. The light fraction is both free in soil and protectedin soil by entombment within aggregates. Separating soil particles by sieving orultrasonification into specific aggregate size fractions followed by light fractionseparation yields light fraction of varying turnover rates and capacity to influencenutrient cycling.
The light fraction and POM is 5 to 15% of the total C of cultivated soils and upto 25% or more in forest A horizons. The light fraction has been identified as acritical determinant of the cycling of nutrients and C. The depletion of light fractionreduces the capacity of soil to supply nutrients through mineralization processes.Particle size analysis of soil is useful to follow the transformation and stabiliza-tion of C and N from the addition of tracers or natural abundance isotopes such as13C from switches in plant photosynthetic types such as the C4 ↔ C3 species(Balesdent and Mariotti, 1987). Using these techniques, as well as 14C enrichmentstudies and carbon dating, many studies have shown that about 20% of the total soilC turns over in less than 5 years, with the majority being light fraction and POM.The accumulation of POM and mineral-associated C in microaggregates residingwithin macroaggregates can be used as an early indication of long-term C seques-tration as a result of changes in soil management such as tillage (Six et al., 2002).
Soil Organic Matter 333
Ch12-P546807.qxd 11/18/06 7:05 PM Page 333
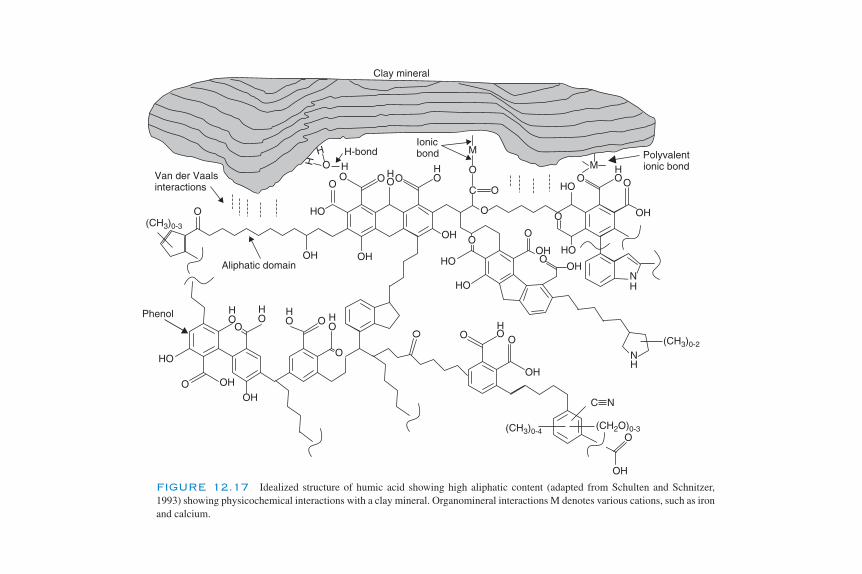
HO
OO
OO OO
OH
OH OH OOH
OH
OH
OH
HO
HOHO
HO
HO
C O
O
OM
OH
O
OH
O
M
HH
H
H
O
NH
O
O
OO
O
OH
O
O
NH
(CH3)0-2
(CH2O)0-3
C
(CH3)0-4
(CH3)0-3
O
OO HOH
OH
O
O
HO
OH
OH
HPhenol
Aliphatic domain
O
H-bondIonicbond
Clay mineral
Van der Vaalsinteractions
Polyvalentionic bond
N
FIGURE 12.17 Idealized structure of humic acid showing high aliphatic content (adapted from Schulten and Schnitzer,1993) showing physicochemical interactions with a clay mineral. Organomineral interactions M denotes various cations, such as ironand calcium.
Ch12-P546807.qxd 11/18/06 7:05 PM Page 334
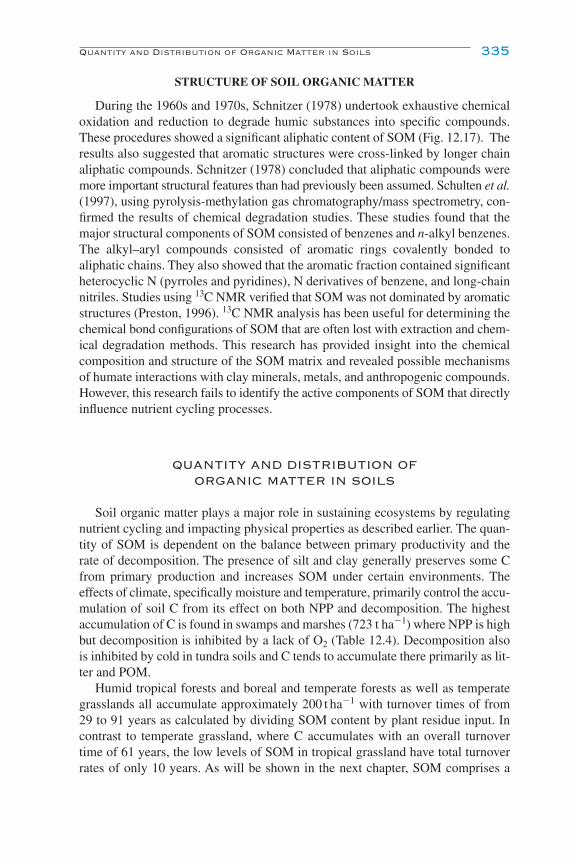
STRUCTURE OF SOIL ORGANIC MATTER
During the 1960s and 1970s, Schnitzer (1978) undertook exhaustive chemicaloxidation and reduction to degrade humic substances into specific compounds.These procedures showed a significant aliphatic content of SOM (Fig. 12.17). Theresults also suggested that aromatic structures were cross-linked by longer chainaliphatic compounds. Schnitzer (1978) concluded that aliphatic compounds weremore important structural features than had previously been assumed. Schulten et al.(1997), using pyrolysis-methylation gas chromatography/mass spectrometry, con-firmed the results of chemical degradation studies. These studies found that themajor structural components of SOM consisted of benzenes and n-alkyl benzenes.The alkyl–aryl compounds consisted of aromatic rings covalently bonded toaliphatic chains. They also showed that the aromatic fraction contained significantheterocyclic N (pyrroles and pyridines), N derivatives of benzene, and long-chainnitriles. Studies using 13C NMR verified that SOM was not dominated by aromaticstructures (Preston, 1996). 13C NMR analysis has been useful for determining thechemical bond configurations of SOM that are often lost with extraction and chem-ical degradation methods. This research has provided insight into the chemicalcomposition and structure of the SOM matrix and revealed possible mechanismsof humate interactions with clay minerals, metals, and anthropogenic compounds.However, this research fails to identify the active components of SOM that directlyinfluence nutrient cycling processes.
QUANTITY AND DISTRIBUTION OFORGANIC MATTER IN SOILS
Soil organic matter plays a major role in sustaining ecosystems by regulatingnutrient cycling and impacting physical properties as described earlier. The quan-tity of SOM is dependent on the balance between primary productivity and therate of decomposition. The presence of silt and clay generally preserves some Cfrom primary production and increases SOM under certain environments. Theeffects of climate, specifically moisture and temperature, primarily control the accu-mulation of soil C from its effect on both NPP and decomposition. The highestaccumulation of C is found in swamps and marshes (723 t ha�1) where NPP is highbut decomposition is inhibited by a lack of O2 (Table 12.4). Decomposition alsois inhibited by cold in tundra soils and C tends to accumulate there primarily as lit-ter and POM.
Humid tropical forests and boreal and temperate forests as well as temperategrasslands all accumulate approximately 200 t ha�1 with turnover times of from29 to 91 years as calculated by dividing SOM content by plant residue input. Incontrast to temperate grassland, where C accumulates with an overall turnovertime of 61 years, the low levels of SOM in tropical grassland have total turnoverrates of only 10 years. As will be shown in the next chapter, SOM comprises a
Quantity and Distribution of Organic Matter in Soils 335
Ch12-P546807.qxd 11/18/06 7:05 PM Page 335
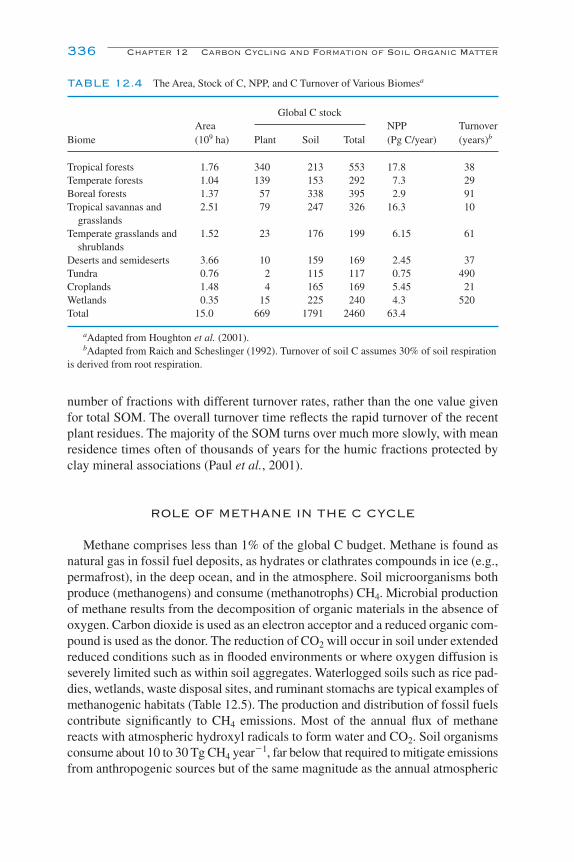
number of fractions with different turnover rates, rather than the one value givenfor total SOM. The overall turnover time reflects the rapid turnover of the recentplant residues. The majority of the SOM turns over much more slowly, with meanresidence times often of thousands of years for the humic fractions protected byclay mineral associations (Paul et al., 2001).
ROLE OF METHANE IN THE C CYCLE
Methane comprises less than 1% of the global C budget. Methane is found asnatural gas in fossil fuel deposits, as hydrates or clathrates compounds in ice (e.g.,permafrost), in the deep ocean, and in the atmosphere. Soil microorganisms bothproduce (methanogens) and consume (methanotrophs) CH4. Microbial productionof methane results from the decomposition of organic materials in the absence ofoxygen. Carbon dioxide is used as an electron acceptor and a reduced organic com-pound is used as the donor. The reduction of CO2 will occur in soil under extendedreduced conditions such as in flooded environments or where oxygen diffusion isseverely limited such as within soil aggregates. Waterlogged soils such as rice pad-dies, wetlands, waste disposal sites, and ruminant stomachs are typical examples ofmethanogenic habitats (Table 12.5). The production and distribution of fossil fuelscontribute significantly to CH4 emissions. Most of the annual flux of methanereacts with atmospheric hydroxyl radicals to form water and CO2. Soil organismsconsume about 10 to 30 Tg CH4 year�1, far below that required to mitigate emissionsfrom anthropogenic sources but of the same magnitude as the annual atmospheric
336 Chapter 12 Carbon Cycling and Formation of Soil Organic Matter
TABLE 12.4 The Area, Stock of C, NPP, and C Turnover of Various Biomesa
AreaGlobal C stock
NPP TurnoverBiome (109 ha) Plant Soil Total (Pg C/year) (years)b
Tropical forests 1.76 340 213 553 17.8 38Temperate forests 1.04 139 153 292 7.3 29Boreal forests 1.37 57 338 395 2.9 91Tropical savannas and 2.51 79 247 326 16.3 10
grasslandsTemperate grasslands and 1.52 23 176 199 6.15 61
shrublandsDeserts and semideserts 3.66 10 159 169 2.45 37Tundra 0.76 2 115 117 0.75 490Croplands 1.48 4 165 169 5.45 21Wetlands 0.35 15 225 240 4.3 520Total 15.0 669 1791 2460 63.4
aAdapted from Houghton et al. (2001).bAdapted from Raich and Scheslinger (1992). Turnover of soil C assumes 30% of soil respiration
is derived from root respiration.
Ch12-P546807.qxd 11/18/06 7:05 PM Page 336

loading rate. The loading rate is calculated as the difference between global pro-duction and consumption of CH4, which results in an increase in atmospheric CH4
of approximately 28 to 32 Tg CH4 year�1. Methane is a more potent greenhousegas compared to CO2 and its production and release has garnered much interestfrom the scientific community.
FUTURE CONSIDERATIONS
The close link between NPP, NSP, and SOM and their influence on the sourcesand sinks for greenhouse gases indicate the importance of the global C cycle inregulating ecosystem productivity and climate. The major production and turnoverof the components of the C cycle are fairly well characterized at the process leveland microscale, for example in a gram of soil. However, on a global scale theinteraction of organismal and metabolic diversity, sources and sinks for C, andanthropogenic influences have yet to be fully appreciated. These interactions mustbe better understood to adequately predict ecosystem response to perturbationssuch as climate change. Continued research on the biology and physical factorsaffecting the global C cycle is required to fully comprehend it.
REFERENCES AND SUGGESTED READING
Anders, E. (1989). Prebiotic organic matter from comets and asteroids. Nature 342, 255–257.Balesdent, J., and Mariotti, A. (1987). Natural 13C abundance as a tracer for studies of soil organic matter
dynamics. Soil Biol. Biochem. 19, 25–30.Berner, R. A. (2004). “The Phanerozoic Carbon Cycle: CO2 and O2.” Oxford Univ. Press, New York.
References and Suggested Reading 337
TABLE 12.5 Global Sources and Sinks for Methane
Tg CH4 year�1
SourcesWetlands 86–115Fossil fuel production/distribution 64–101Enteric fermentation/animal waste 64–94Rice production 44–60Biomass burning 30–40Landfills 30–49Termites 20–153Oceans 8–10
SinksAtmospheric removal 308–560Soil microbial oxidation 10–30
Atmospheric increase 28–32
With permission from Houghton et al. (2001).
Ch12-P546807.qxd 11/18/06 7:05 PM Page 337
Bird, J. A., van Kessel, C., and Horwath, W. R. (2002). Nitrogen dynamics in humic fractions underalternative straw management in temperate rice. Soil Sci. Soc. Am. J. 66, 478–488.
Cambardella, C. A., and Elliott, E. T. (1992). Particulate soil organic-matter changes across a grasslandcultivation sequence. Soil Sci. Soc. Am. J. 56, 777–783.
Falkowski, P. R., Scholes, J., Boyle, E., Canadell, J., Caneld, D., Elser, J., Gruber, N., Hibbard, K.,Högberg, P., Linder, S., Mackenzie, F. T., Moore, B., III, Pedersen, T., Rosenthal, Y., Seitzinger, S.,Smetacek, V., and Steffen, W. (2000). The global carbon cycle: a test of our knowledge of earth asa system. Science 290, 291–296.
Finlay, A. H., and Soderstrom, B. (1992). Mycorrhiza and carbon flow to the soil. In “MycorrhizaFunctioning” (M. Allen, ed.), pp. 134–160. Chapman & Hall, London.
Grandy, A. S., and Robertson, G. P. (2006). Aggregation and organic matter protection followingtillage of an undisturbed soil profile. Soil Sci. Soc. Am. J. 70, 1398–1406.
Haider, K. (1992). Problems related to the humification process in soils of temperate climates. In “SoilBiochemistry” (G. Stotsky and J.-M. Bollag, eds.), pp. 55–94. Dekker, New York.
Haider, K., Martin, J. P., and Filip, Z. (1975). Humus biochemistry. In “Soil Biochemistry” (E. A. Pauland A. D. McLaren, eds.), Vol. 4, pp. 195–244. Dekker, New York.
He X. H., Bledsoe C. S., Zasoski R. J., Southworth D., and Horwath, W. R. (2006). Rapid nitrogentransfer from ectomycorrhizal pines to adjacent ectomycorrhizal and arbuscular mycorrhizalplants in a California oak woodland. New Phytol. 17, 143–151.
Horwath, W. R. (2002). Soil microbial biomass. In “Encyclopedia of Environmental Microbiology,”pp. 663–670. Academic Press, New York.
Horwath, W. R., Pregitzer, K. S., and Paul, E. A. (1994). 14C allocation in tree–soil systems. TreePhysiol. 14, 1163–1176.
Houghton, J. T., Ding, Y., Griggs, D. J., Noguer, M., van der Linden, P. J., Dai, X., Maskell, K., andJohnson, C. A., eds. (2001). “Climate Change 2001: The Scientific Basis.” IntergovernmentalPanel on Climate Change. Cambridge Univ. Press, New York.
Hugouvieux-Cotte-Pattat, N., Reverchon, S., Nasser, W., Condemine, G., and Robert-Baudouy, J.(1996). Regulation of pectinase biosynthesis in Erwinia chysanthemi. In “Pectins and Pectinases”(J. Visser and A. G. J. Voragen, eds.), pp. 311–330. Elsevier, New York.
Jokic, A., Schulten, H. R., Cutler, J. N., Schnitzer, M., and Huang, P. M. (2004). A significant abioticpathway for the formation of unknown nitrogen in nature. Geophys. Res. Lett. 31, Article L05502.
Kögel, I. (1986). Estimation and decomposition pattern of the lignin component in forest humus layers.Soil Biol. Biochem. 18, 589–594.
Kraus, T. E. C., Dahlgren, R. A., and Zasoski, R. J. (2003). Tannins in nutrient dynamics of forestecosystems—a review. Plant Soil 25, 41–66.
Lodish, H., Berk, A. Zipursky, L. S. Matsudaira, P. Baltimore, D., and Darnell, J. (2000). “MolecularCell Biology.” 4th ed. Freeman, New York.
Martin, J. P., Haider, K., and Kassim, G. (1980). Biodegradation and stabilization after two years ofspecific corn lignin and polysaccharide carbons in soil. Soil Sci. Soc. Am. J. 44, 1250–1255.
Milchunas, D. G., Lauenroth, W. K., Singh, J. S., Cole, C. V., and Hunt, H. W. (1985). Root turnoverand production by C-14 dilution—implications for C partitioning in plants. Plant Soil 88, 353–365.
Neidhardt, F. C., et al., eds. (1996). “Escherichia coli and Salmonella typhimurium—Cellular andMolecular Biology.” 2nd ed. Am. Soc. Microbiol., Washington, DC.
Paul, E. A., Collins, H. P., and Leavitt, S. W. (2001). Dynamics of resistant soil carbon of Midwesternagricultural soils measured by naturally occurring C-14 abundance. Geoderma 104, 239–256.
Petit, J. R., Jouzel, J., Raynaud, D., Barkov, N. I., Barnola, J.-M., Basile, I., Bender, M., Chappellaz,J., Davisk, M., Delaygue, G., Delmotte, M., Kotlyakov, V. M., Legrand, M., Lipenkov, V. Y.,Lorius, C., Pépin, L., Ritz, C., Saltzmank, E., and Stievenard, M. (1999). Climate and atmospherichistory of the past 420,000 years from the Vostok ice core, Antarctica. Nature 399, 429–436.
Preston, C. M. (1996). Applications of NMR to soil organic matter analysis: history and prospects. SoilSci. 161, 144–166.
Raich, J. W., and Scheslinger, W. H. (1992). The global carbon dioxide in soil respiration and its rela-tionship to vegetation and climate. Tellus 44B, 81–99.
338 Chapter 12 Carbon Cycling and Formation of Soil Organic Matter
Ch12-P546807.qxd 11/18/06 7:05 PM Page 338

Raymo, D. N. (1991). Geochemical evidence supporting T. C. Chamberlin’s theory of glaciation.Geology 19, 344–347.
Retallack, G. J. (2001). A 300-million-year record of atmospheric carbon dioxide from fossil plantcuticles. Nature 411, 287–290.
Rillig, M. C. (2004). Arbuscular mycorrhizae, glomalin, and soil aggregation. Can. J. Soil Sci. 84,355–363.
Robinson, J. M. (1990). Lignin, land plants and fungi: biological evolution affecting Phanerozoic oxygenbalance. Geology 15, 607–610.
Sakakibara, A. (1991). Chemistry of lignin. In “Wood and Cellulose Chemistry” (D. S. Hon andN. Sakakibara, eds.), p. 113. Dekker, New York.
Schnitzer, M. (1978). Humic substances: chemistry and reactions. In “Soil Organic Matter” (M. Schnitzerand S. U. Khan, eds.), Vol. 8, pp. 1–64. Elsevier, New York.
Schulten, H.-R., Sorge-Lewin, C., and Schnitzer, M. (1997). Structure of “unknown” soil nitrogeninvestigated by analytical pyrolysis. Biol. Fertil. Soils 24, 249–254.
Schulten H. R., and Schnitzer M. (1993). A state of the art structural concept for humic substances.Naturwissenschaft 80, 29–30.
Shevchenko, S. M., and Bailey, G. W. (1996). Life after death: lignin–humic relationships reexamined.Crit. Rev. Environ. Sci. Technol. 26, 95–153.
Six, J., Conant, R. T., Paul, E. A., and Paustian, K. (2002). Stabilization mechanisms of soil organicmatter: implications for C-saturation of soils. Plant Soil 241, 155–176.
Stevenson, F. J. (1994). “Humus Chemistry: Genesis, Composition, Reactions.” Wiley, New York.Tiessen, H., and Stewart, W. B. (1983). Particle-size fractions and their use in studies of soil organic
matter. II. Cultivation effects on organic matter composition in size fractions. Soil Sci. Soc. Am. J.47, 509–514.
Waksman, S. A. (1936). “Humus, Origin, Chemical Composition, and Importance in Nature.” Balliere,Tindall & Cox, London.
Watanabe, T. (2003). Microbial degradation of lignin–carbohydrate complexes. In “Associationbetween Lignin and Carbohydrates in Wood and Other Plant Tissues” (T. Koshijima and T. Watanabe,eds.), pp. 237–287. Springer-Verlag, New York.
References and Suggested Reading 339
Ch12-P546807.qxd 11/18/06 7:05 PM Page 339

Ch12-P546807.qxd 11/18/06 7:05 PM Page 340

13NITROGEN TRANSFORMATIONS
G. P. RobertsonP. M. Groffman
Introduction
Nitrogen Mineralization and Immobilization
Nitrification
Inhibition of Nitrification
Denitrification
Other Nitrogen Transformations in Soil
Nitrogen Movement in the Landscape
References and Suggested Reading
INTRODUCTION
No other element essential for life takes as many forms in soil as nitrogen (N), andtransformations among these forms are mostly mediated by microbes. Soil micro-biology thus plays yet another crucial role in ecosystem function: in most terrestrialecosystems N limits plant growth, and thus net primary production—the produc-tive capacity of the ecosystem—can be regulated by the rates at which soil microbestransform N to plant-usable forms. However, several forms of N are also pollu-tants, so soil microbial transformations of N also affect human and environmentalhealth, sometimes far away from the microbes that performed the transformation.Understanding N transformations and the soil microbes that perform them is thusessential for understanding and managing ecosystem health and productivity.
Nitrogen takes nine different forms in soil corresponding to different oxidativestates (Table 13.1). Dinitrogen gas (N2) is by far the most abundant form of N inthe biosphere but is unusable by most organisms, including plants. Biological N2
fixation, whereby N2 is transformed to organic N (described in detail in Chap. 14),is the dominant process by which N first enters soil biological pools. All subse-quent transformations are covered in this chapter: N mineralization, which is theconversion of organic N to inorganic forms; N immobilization, which is the uptake
341
Ch13-P546807.qxd 11/18/06 7:06 PM Page 341
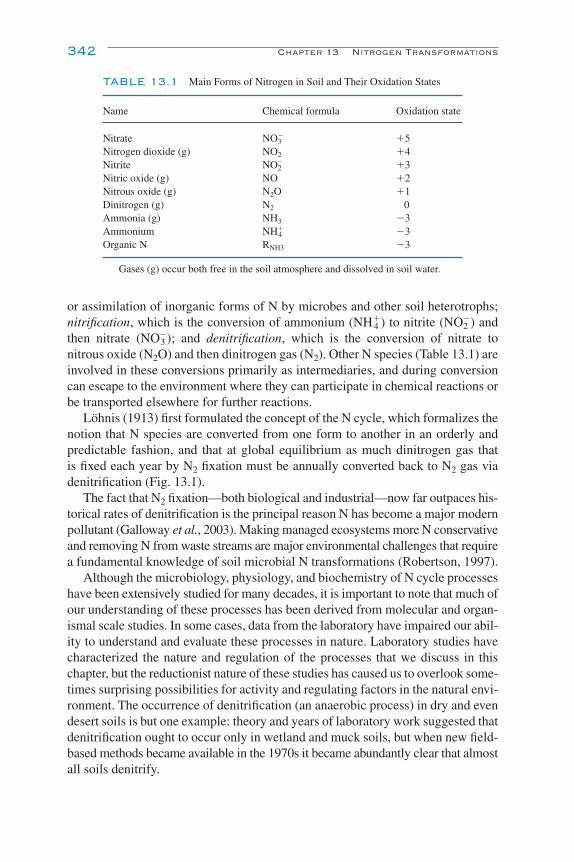
342 Chapter 13 Nitrogen Transformations
or assimilation of inorganic forms of N by microbes and other soil heterotrophs;nitrification, which is the conversion of ammonium (NH4
�) to nitrite (NO2�) and
then nitrate (NO3�); and denitrification, which is the conversion of nitrate to
nitrous oxide (N2O) and then dinitrogen gas (N2). Other N species (Table 13.1) areinvolved in these conversions primarily as intermediaries, and during conversioncan escape to the environment where they can participate in chemical reactions orbe transported elsewhere for further reactions.
Löhnis (1913) first formulated the concept of the N cycle, which formalizes thenotion that N species are converted from one form to another in an orderly andpredictable fashion, and that at global equilibrium as much dinitrogen gas that is fixed each year by N2 fixation must be annually converted back to N2 gas viadenitrification (Fig. 13.1).
The fact that N2 fixation—both biological and industrial—now far outpaces his-torical rates of denitrification is the principal reason N has become a major modernpollutant (Galloway et al., 2003). Making managed ecosystems more N conservativeand removing N from waste streams are major environmental challenges that requirea fundamental knowledge of soil microbial N transformations (Robertson, 1997).
Although the microbiology, physiology, and biochemistry of N cycle processeshave been extensively studied for many decades, it is important to note that much ofour understanding of these processes has been derived from molecular and organ-ismal scale studies. In some cases, data from the laboratory have impaired our abil-ity to understand and evaluate these processes in nature. Laboratory studies havecharacterized the nature and regulation of the processes that we discuss in thischapter, but the reductionist nature of these studies has caused us to overlook some-times surprising possibilities for activity and regulating factors in the natural envi-ronment. The occurrence of denitrification (an anaerobic process) in dry and evendesert soils is but one example: theory and years of laboratory work suggested thatdenitrification ought to occur only in wetland and muck soils, but when new field-based methods became available in the 1970s it became abundantly clear that almostall soils denitrify.
TABLE 13.1 Main Forms of Nitrogen in Soil and Their Oxidation States
Name Chemical formula Oxidation state
Nitrate NO3� �5
Nitrogen dioxide (g) NO2 �4Nitrite NO2
� �3Nitric oxide (g) NO �2Nitrous oxide (g) N2O �1Dinitrogen (g) N2 0Ammonia (g) NH3 �3Ammonium NH4
� �3Organic N RNH3 �3
Gases (g) occur both free in the soil atmosphere and dissolved in soil water.
Ch13-P546807.qxd 11/18/06 7:06 PM Page 342
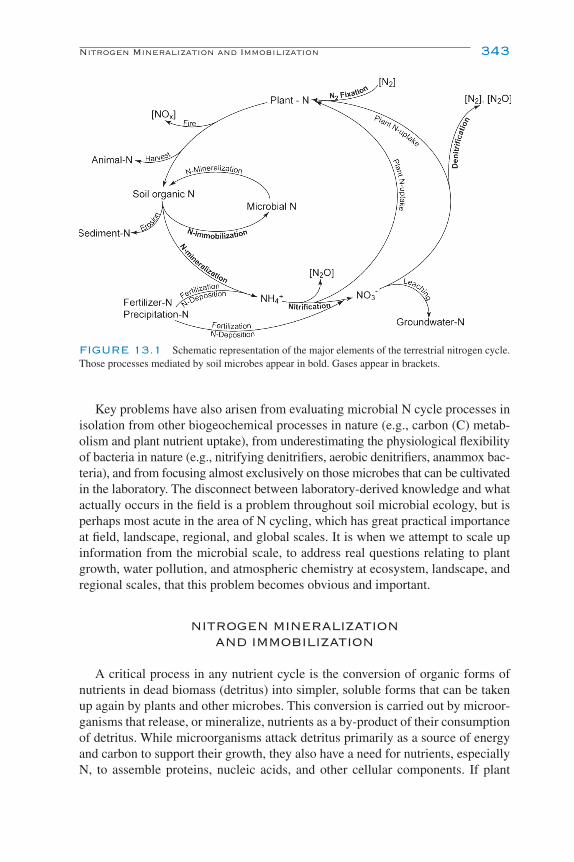
Key problems have also arisen from evaluating microbial N cycle processes inisolation from other biogeochemical processes in nature (e.g., carbon (C) metab-olism and plant nutrient uptake), from underestimating the physiological flexibilityof bacteria in nature (e.g., nitrifying denitrifiers, aerobic denitrifiers, anammox bac-teria), and from focusing almost exclusively on those microbes that can be cultivatedin the laboratory. The disconnect between laboratory-derived knowledge and whatactually occurs in the field is a problem throughout soil microbial ecology, but isperhaps most acute in the area of N cycling, which has great practical importanceat field, landscape, regional, and global scales. It is when we attempt to scale upinformation from the microbial scale, to address real questions relating to plantgrowth, water pollution, and atmospheric chemistry at ecosystem, landscape, andregional scales, that this problem becomes obvious and important.
NITROGEN MINERALIZATION AND IMMOBILIZATION
A critical process in any nutrient cycle is the conversion of organic forms ofnutrients in dead biomass (detritus) into simpler, soluble forms that can be takenup again by plants and other microbes. This conversion is carried out by microor-ganisms that release, or mineralize, nutrients as a by-product of their consumptionof detritus. While microorganisms attack detritus primarily as a source of energyand carbon to support their growth, they also have a need for nutrients, especiallyN, to assemble proteins, nucleic acids, and other cellular components. If plant
Nitrogen Mineralization and Immobilization 343
FIGURE 13.1 Schematic representation of the major elements of the terrestrial nitrogen cycle.Those processes mediated by soil microbes appear in bold. Gases appear in brackets.
Ch13-P546807.qxd 11/18/06 7:06 PM Page 343

detritus is rich in N, microbial needs are easily met and N release, or mineraliza-tion, proceeds. If plant detritus is low in N, microorganisms must scavenge addi-tional N from their surroundings, taking up or immobilizing N in their biomass.
The key to understanding mineralization–immobilization is to “think like amicrobe” that is attempting to make a living by obtaining energy and C from detri-tus. Sometimes the detritus has all the N that the microbe needs, so as C is con-sumed, any extra N is released (mineralized) to the soil solution. Sometimes thedetritus does not have enough N to meet microbial needs, so as C is consumed Nis retained by the microbes and even more N must be immobilized from the soilsolution. Indeed, it has been shown that microbes invest energy in the synthesis ofenzymes (e.g., amidases to acquire N and phosphatases to acquire P) to acquirenutrients that they need while decomposing substrates of low quality. Microbial Nuptake is also affected by organism growth efficiency. For example, fungi havewider C:N ratios in their tissues than bacteria and therefore—because of theirlower N needs—can grow more efficiently on low-N substrates.
Mineralization results in an increase, while immobilization results in a decrease,in simple, plant-available forms of N in the soil. Traditionally, ammonium has beenviewed as the immediate product of mineralization. In fact in the older literature min-eralization is often referred to as ammonification. More recently, recognition of thefact that plants can take up simple, soluble organic forms of nutrients leads us tobroaden our definition of mineralization products to include any simple, solubleforms of N that can be taken up by plants (see Schimel and Bennet, 2004). Plantsfrom a variety of habitats have been shown to take up amino acids and other organicN forms; mycorrhizas play a role in this uptake by absorbing amino acids, aminosugars, peptides, proteins, and chitin that are then used by their hosts as an N source.
It is important to recognize that mineralization and immobilization are occur-ring at the same time within relatively small volumes of soil. While one group ofmicrobes might be consuming a protein-rich and therefore nitrogen-rich piece oforganic matter (think seed or leguminous leaf tissue), another group, perhaps 100 µm away, might be consuming detritus rich in C but low in N (think leaf stalkor wood). The first group is mineralizing N while the second is immobilizing it,perhaps even immobilizing the same N that is being mineralized by the first.
As a result of the simultaneous nature and small scale of these processes, it isalso important to make a distinction between gross and net mineralization andimmobilization. Gross N mineralization is the total amount of soluble N producedby microorganisms, and gross N immobilization is the total amount of soluble Nconsumed. Net N mineralization is the balance between the two. When gross min-eralization exceeds gross immobilization, inorganic N in the soil is increasing,i.e., there is net mineralization. When gross immobilization exceeds gross miner-alization, inorganic N in the soil is decreasing, i.e., there is net immobilization.
Mineralization and immobilization are carried out by a wide array of micro-organisms—aerobes, anaerobes, fungi, and bacteria. Soil fauna also play an importantrole in mineralization and immobilization processes. They are responsible formuch of the preliminary decomposition of detritus, they feed on and can regulate
344 Chapter 13 Nitrogen Transformations
Ch13-P546807.qxd 11/18/06 7:06 PM Page 344
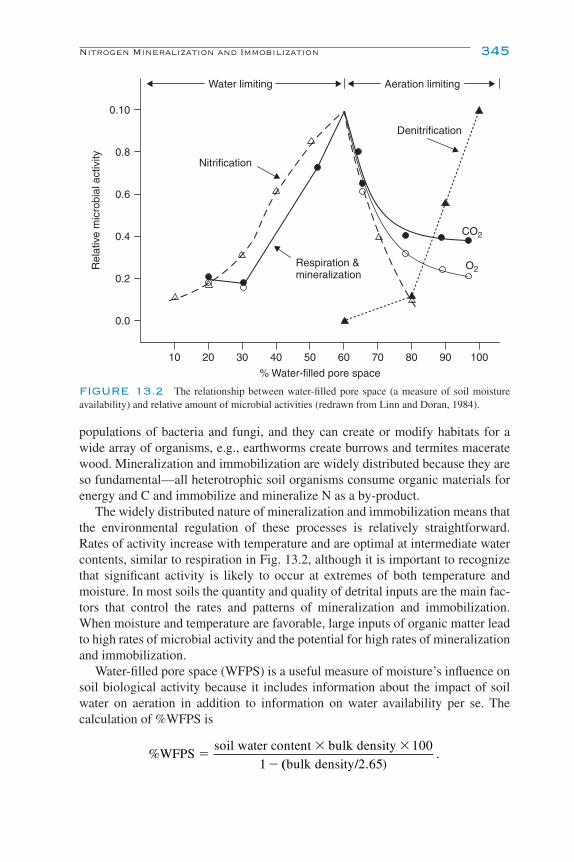
populations of bacteria and fungi, and they can create or modify habitats for awide array of organisms, e.g., earthworms create burrows and termites maceratewood. Mineralization and immobilization are widely distributed because they areso fundamental—all heterotrophic soil organisms consume organic materials forenergy and C and immobilize and mineralize N as a by-product.
The widely distributed nature of mineralization and immobilization means thatthe environmental regulation of these processes is relatively straightforward.Rates of activity increase with temperature and are optimal at intermediate watercontents, similar to respiration in Fig. 13.2, although it is important to recognizethat significant activity is likely to occur at extremes of both temperature andmoisture. In most soils the quantity and quality of detrital inputs are the main fac-tors that control the rates and patterns of mineralization and immobilization.When moisture and temperature are favorable, large inputs of organic matter leadto high rates of microbial activity and the potential for high rates of mineralizationand immobilization.
Water-filled pore space (WFPS) is a useful measure of moisture’s influence onsoil biological activity because it includes information about the impact of soilwater on aeration in addition to information on water availability per se. The calculation of %WFPS is
%WFPSsoil water content bulk density 100
1�
� �
� (( ).
bulk density/2.65
Nitrogen Mineralization and Immobilization 345
0.0
0.2
0.4
0.6
0.8
0.10
Rel
ativ
e m
icro
bial
act
ivity
10 20 30 40 50 60 70 80 90 100
% Water-filled pore space
Nitrification
Denitrification
Aeration limitingWater limiting
Respiration &mineralization
CO2
O2
FIGURE 13.2 The relationship between water-filled pore space (a measure of soil moistureavailability) and relative amount of microbial activities (redrawn from Linn and Doran, 1984).
Ch13-P546807.qxd 11/18/06 7:06 PM Page 345

Soil water content is determined gravimetrically (g H2O/g dry soil), bulk density(g cm�3) is the oven dry weight of a given soil volume, and the value 2.65 is thedensity (g cm�3) of rock—sand grains and other soil mineral particles.
What controls the balance between N mineralization and N immobilization? Theanswer is primarily organic matter quality—the availability of C in the materialrelative to its available N. Consider the effects of adding various materials withdifferent C:N ratios to soil (Table 13.2). When one adds manure, with a relatively lowC:N ratio (ca. 20:1), to soil, for example, the microbes have no trouble obtaining Nand as a result mineralization dominates over immobilization, and plant-available Nincreases in soil. This is why manure is frequently used as a fertilizer. On the otherhand, were one to add sawdust to soil, a material with a high C:N ratio (625:1), themicrobes are keen to obtain the energy and C in the sawdust but cannot degradethis material without additional N because the sawdust does not have sufficient Nto allow the microbes to build proteins. So the microbes must immobilize N fromtheir environment, resulting in a decrease in plant-available N in the soil.
The balance between mineralization and immobilization is also affected byorganism growth efficiency. For example, fungi have wider C:N ratios in their tis-sues than bacteria and, therefore, have a lower need for N and will thus mineralizeN more readily. As a general rule of thumb, materials with a C:N ratio �25:1 stim-ulate immobilization, while those with a C:N ratio �25:1 stimulate mineralization(Table 13.2). The exception to this rule is highly decomposed substances with alow C:N ratio, e.g., soil organic matter (humus or compost) in which labile C andN have been depleted and the remaining C is in complex forms inherently resist-ant to decomposition (see Chap. 12) and therefore resistant to mineralization.
There are a wide variety of methods for measuring mineralization and immobi-lization (see Hart et al., 1994; Robertson et al., 1999). Measurement of net min-eralization and immobilization rates is much easier and more common than ismeasurement of gross rates. Measurement of net rates usually involves quantifying
346 Chapter 13 Nitrogen Transformations
TABLE 13.2 C:N Ratios in Various Organic Materials(from Tisdale et al., 1993 and Hyvönen et al., 1996)
Organic material C:N ratio
Soil microorganisms 8:1Soil organic matter 10:1Sewage sludge 9:1Alfalfa residues 16:1Farmyard manure 20:1Corn stover 60:1Grain straw 80:1Oak litter 200:1Pine litter 300:1Crude oil 400:1Conifer wood 625:1
Ch13-P546807.qxd 11/18/06 7:06 PM Page 346

changes in inorganic N levels in some type of whole soil incubation. In most casesthese incubations are in containers, with no plant uptake or leaching losses, andchanges in inorganic N levels are measured by periodic extractions of the soil.Incubation methods vary widely, from short (10-day) incubations of intact soilcores buried in the field to long (�52-week) incubations of sieved soils in the lab-oratory. Gross rates are measured using isotope dilution methods whereby smallamounts of 15N-labeled ammonium are added to the soil and the subsequent dilution of the label is used as a basis for calculating the gross production and consumption of ammonium.
NITRIFICATION
Nitrification is the microbial oxidation of reduced forms of nitrogen to lessreduced forms, principally NO2
� and NO3�. Autotrophic bacteria, first isolated in the
late 1800s, gain as much as 440 kJ of energy per mole of NH3 oxidized when NO3�
is the end product. We know now that heterotrophic microbes can also nitrify,although autotrophic nitrification appears to be the dominant process in most soils.
The importance of nitrifiers to ecosystem function is substantial: althoughsome nitrate enters ecosystems in acid rain or as fertilizer, in most ecosystemsnitrate is formed in situ via nitrification. Because nitrate is an anion, it is moremobile than ammonium, the ionized source of NH3 in soil water:
NH4�(aq) 7 NH3(aq) � H�(aq).
As a positively charged ion, ammonium can be held on cation-exchange sitesassociated with soil organic matter, clay surfaces, and variable-charge minerals.Nitrate, on the other hand, can be easily transported out of the rooting zone bywater when precipitation exceeds evapotranspiration.
Nitrate is also subject to denitrification, in which denitrifying bacteria convertnitrate to N gas. Additionally, nitrification in many soils is a major source of soil acid-ity, which can have multiple effects on ecosystem health, including the hydrologicloss of base cations as hydrogen ions displace other cations from exchange sites. Andin soils dominated by variable charge minerals, which include most highly weatheredtropical soils, soil acidity largely controls cation-exchange capacity (CEC), andnitrifier-generated acidity can drive CEC to nil. Further, some plants and microbesappear better able to take up ammonium than nitrate, and vice versa, implying apotential effect of nitrifiers on plant and microbial community composition. Finally,nitrifiers can also be direct sources of the atmospheric gases NOx and N2O.
THE BIOCHEMISTRY OF AUTOTROPHIC NITRIFICATION
Autotrophic nitrification is a two-step process, carried out by separate groupsof bacteria: the ammonia and nitrite oxidizers, respectively. Autotrophic nitrifiers
Nitrification 347
Ch13-P546807.qxd 11/18/06 7:06 PM Page 347

348 Chapter 13 Nitrogen Transformations
derive their C from CO2 or carbonates, rather than from organic matter, and areobligate aerobes. NH3 oxidation is characterized as
NH3 � 11⁄2 O2 → NO2� � H� � H2O.
The first step in this oxidation is mediated by the membrane-bound enzymeammonia mono-oxygenase, which can also oxidize a wide variety of organic, non-polar low-molecular-weight compounds, including phenol, methanol, methane,and halogenated aliphatic compounds such as trichloroethylene:
NH3�
The reaction is irreversibly inhibited by small quantities of acetylene, whichinhibits ammonia mono-oxygenase and thereby provides a means for experimen-tally differentiating autotrophic from heterotrophic nitrification in soil.Hydroxylamine is further oxidized to nitrite by the reaction
NO2� � 4e� � 5H�.
Two of the four electrons released in this reaction are used in the prior NH3 oxi-dation step; the remaining two are used in electron transport, generating energyfor cell growth and metabolism:
2H� � 1⁄2O2 � 2e�
Intermediary compounds formed during the oxidation of hydroxylamine tonitrite can result in the formation of NO (Fig. 13.3), which can escape to theatmosphere and influence the photochemical production of ozone (O3) and theabundance of hydroxyl (OH) radicals in air, primary oxidants for a number of tro-pospheric trace gases including methane. Ammonia oxidizers also appear able toproduce NO via NO2
� reduction, which results in the production of N2O, animportant greenhouse gas that can also escape to the atmosphere. Nitrite reductionoccurs when ammonia oxidizers use NO2
� as an electron acceptor when O2 is lim-iting—effectively becoming denitrifying nitrifiers! Denitrification is describedlater in this chapter.
In most soils the nitrite produced by ammonia oxidizers does not accumulatebut is quickly oxidized to nitrate by the nitrite-oxidizing bacteria when they per-form nitrite oxidation:
NO�2 � H2 O NO3
� � 2H� � 2e�.
These reactions are membrane-associated and because nitrite oxidoreductase is areversible enzyme, the reaction can be reversed to result in nitrate reduction tonitrite. Up to 80% of the energy produced during nitrification is respired via theCalvin cycle; growth efficiencies of the nitrifiers are correspondingly low. This
nitrite oxidoreductase⎯ →⎯⎯⎯⎯⎯⎯⎯
terminal oxidase2H O.⎯ →⎯⎯⎯⎯⎯⎯
NH OH H2 2NH OH oxidoreductase2� � ⎯ →⎯⎯⎯⎯⎯⎯⎯⎯
� � �� �2H O 22ammonia mono-oxygenasee ⎯ →⎯⎯⎯⎯⎯⎯⎯⎯⎯⎯ NH OH H O.2 2�
Ch13-P546807.qxd 11/18/06 7:06 PM Page 348

explains in part their poor ability in many soils to compete with heterotrophs andplants for ammonium.
THE DIVERSITY OF AUTOTROPHIC NITRIFIERS
For a group of microbes with such functional importance at a variety of scales,the nitrifiers are a remarkably depauperate group from a taxonomic standpoint.Although slow growth rates hinder cultivation-based analyses of their diversity, asdo culture techniques that fail to reproduce the diversity of microhabitats in soil(see Chap. 3), even molecular methods fail to find much nitrifier diversity. Thereis, nevertheless, even in the single phylogenetic group to which most ammonia-oxidizing bacteria belong, significant sequence and physiological diversity.Moreover, the recent discovery of widespread ammonia-oxidizing Archaea bacte-ria in marine ecosystems (Francis et al., 2005) suggests the potential for similardiscoveries of new diversity in soil. Leininger et al. (2006) suggest that Archaeamay be more numerous than bacterial ammonia oxidizers in soil.
From a taxonomic standpoint, bacterial nitrifiers are viewed as the single FamilyNitrobacteraceae, defined by their characteristic ability to oxidize ammonia ornitrite, although biochemical and molecular evidence provides no justification forthis view. Early work beginning with Winogradsky (1892) classified the ammonium-oxidizing genera of Nitrobacteraceae on the basis of cell shape and the arrange-ment of intracytoplasmic membranes. This yielded five genera: Nitrosomonas,Nitrosococcus, Nitrosospira, Nitrosolobus, and Nitrosovibrio. More recent workbased principally on 16S rRNA oligonucleotide and gene sequence analysisplaces all of these groups in the beta subclass of the Proteobacteria but for a sin-gle species of Nitrosococcus, which is placed in the Gammaproteobacteria(Purkhold et al., 2000; Fig. 13.4). Today we have almost complete 16S rRNA genesequences for the 14 species of Betaproteobacteria ammonia oxidizers, which havea gene sequence similarity of 89% (Fig. 13.5; Koops et al., 2003).
Of the ammonia oxidizers thus far isolated from soil all are in the Betapro-teobacteria. In arable soils the Nitrosomonas communis lineage with strains ofNitrosolobus multiformis are numerically dominant. Unfertilized soils usually alsocontain strains of the Nitrosomonas oligotropha lineage and strains of Nitrosospira
Nitrification 349
NH3� NO2
� NO3�
N2O
NO2NHOH
NH2OH [HNO]
NO
NO
NO
FIGURE 13.3 Autotrophic nitrification pathways including pathways for gas loss. Broken linesindicate unconfirmed pathways (from Firestone and Davidson, 1989).
Ch13-P546807.qxd 11/18/06 7:06 PM Page 349

and Nitrosovibrio (Koops and Pommerening-Röser, 2001). The latter two tend tobe dominant in acid soils, which contain few if any Nitrosomonas.
Molecular techniques such as 16S rRNA sequences and the retrieval of amoAclones have also been used to examine the diversity of ammonia oxidizers in vivo,which avoids the need for pure-culture cultivation and its bias toward thosespecies that are cultivatable outside of their native habitat. Although moleculartechniques can themselves be biased because of their dependency on the extrac-tion of nucleic acid from soil, PCR amplification, primer bias, and cloning meth-ods, they mostly corroborate pure-culture findings: most amoA clones and 16SrRNA based surveys are similar to sequence clusters defined by cultured ammo-nia oxidizers. Nevertheless, few sequences are completely identical to those ofcultured organisms, and since it is not possible to obtain DNA–DNA hybridiza-tion data for noncultured organisms, there is no way currently to know if these differences are sufficient to define different species.
350 Chapter 13 Nitrogen Transformations
Gamma Beta
Nitrosomonas marina
Nitrosomonaseutropha
Nitrosomonaseuropae
NitrosococcusmobilisNitrosolobusmultiformisNitrosospirabriensisNitrosovibrio
tenuis
Rhodopseudomonas marina
Agrobacterium tumefaciens
Rhodopseudomonaspalustris
Nitrobacterhamburgensis
Nitrobacterwinogradskyi
RhodopseudomonasacidophilaMyxococcus
xanthusWolinellasuccinogenes
Nitrospinagracilis(atlantic)
Nitrospinagracilis(pacific)
Nitrospiramarina
Desulfovibriovulgaris
Bdellovibriostolpii
Escherichiacoli
Oceanospirillumlinum
Nitrosococcusoceanus
Nitrococcusmobilis
Arhodomonasaquaeolei
Ectothiorhodospirahalophila
Rhodocycluspurpureus
Gallionellaferruginea
Chromatiumvinosum
10%
Delta Epsilon Alpha
FIGURE 13.4 Distance tree for the Proteobacteria including nitrifiers (in bold). The scale barcorresponds to 0.1 estimated fixed mutation per sequence position (from Teske et al., 1994). Morerecent work places Nitrococcus mobilis in the Betaproteobacteria (see Fig. 13.5).
Ch13-P546807.qxd 11/18/06 7:06 PM Page 350

Worth noting too is the fact that these techniques do not normally provide quan-titative information about the abundance and activity of different species in situ.Quantitative PCR and newer techniques based on membrane or in situ hybridiza-tion in concert with rRNA-targeted probes (e.g., fluorescence in situ hybridizationor FISH, as used in aquatic and wastewater treatment studies; Juretschko et al., 1998)can directly relate community structure with activity and the spatial distribution of
Nitrification 351
Nitrosomonas europaea Nm50 (Nm103)Nitrosomonas eutropha Nm 57
Nitrosomonas halophila Nm1 (ANI-5)Nitrosococcus mobilis Nc2 (Nm104, Nm107)
Nitrosomonas sp. Nm33Nitrosomonas sp. Nm41 (Nm58)
Nitrosomonas communis Nm2
Nitrosomonas nitrosa Nm90 (Nm148)
Nitrosomonas sp. Nm51 (Nm63)
Nitrosomonas marina Nm22Nitrosomonas aestuarii Nm36
Nitrosomonas sp. Nm47Nitrosomonas oligotropha Nm45
Nitrosomonas ureae Nm10Nitrosomonas sp. Nm86Nitrosomonas sp. Nm84Nitrosomonas sp. Nm59
Nitrosomonas sp. Nm143
Nitrosomonas cryotolerans Nm55
Nitrosospira briensis Nsp10
Nitrosopira sp. Nsp1 (Nsp4, Nsp40, F3)Nitrosospira sp. Nsp41
Nitrosospira sp. Nsp62
Nitrosospira sp. Nv6 (Nv12)
Nitrosospira sp. L115 (A4, AF)Nitrosovibrio (Nitrosospira) tenuis Nv1Nitrosolobus (Nitrosospira) sp. NL5
Nitrosospira sp. Nsp2Nitrosospira sp. Nsp17
Nitrosolobus (Nitrosospira) multiformis NL13
Nitrosospira sp. Nsp57 (Nsp58)
Nitrosospira sp. Nsp65
Nitrosospira sp. Nsp12 (Nsp5, III2, 40KI)Nitrosospira sp. III7 (B6)
0.10
FIGURE 13.5 16S rRNA-based phylogenetic tree of the betaproteobacterial ammonia oxidiz-ers. The tree includes only those oxidizers that have been demonstrated to represent differentgenospecies (DNA–DNA similarity �60%) and for which 16S rRNA gene sequences longer than1000 nucleotides are available. Strains with DNA–DNA similarity �60% are in parentheses after therespective species name. Described species are depicted in bold. Scale bar represents 10% estimatedsequence divergence (from Koops et al., 2003).
Ch13-P546807.qxd 11/18/06 7:06 PM Page 351
targeted organisms. Recent work (e.g., Prosser and Embley, 2002) has shown howthese techniques can be used to discover nitrifier community change in responseto changes in ecosystem management and land use.
Nitrite-oxidizing bacteria appear in a broader array of phylogenetic groupingsthan do the ammonia oxidizers, but only the genera Nitrobacter and Nitrospira(Freitag et al., 2005) have been detected in soil; the distribution of the othernitrite-oxidizing genera (Nitrosococcus and Nitrospina) is not fully known. Membersof Nitrobacter form an exclusive and highly related cluster in the Alphaproteobac-teria (Fig. 13.4). Pairwise evolutionary distance estimates are less than 1%, indi-cating little genetic diversity within the group (Fig. 13.5), a finding supported by16S rRNA sequence comparisons (Teske et al., 1994). The other nitrite-oxidizinggenera are in the delta (Nitrospina and Nitrospira) and gamma (Nitrosococcus)subclasses of the Proteobacteria.
HETEROTROPHIC NITRIFICATION
A wide variety of heterotrophic bacteria and fungi have the capacity to oxidizeNH4
�. So-called heterotrophic nitrification is not linked to cellular growth, as it isfor autotrophic nitrification. There is evidence for two pathways for heterotrophicammonia oxidation. The first is similar to that of autotrophic oxidation, in that thenitrifying bacteria have similar ammonia- and hydroxylamine-oxidizing enzymes.In fact these enzymes can oxidize a number of different substrates, and it may bethat ammonia oxidation is only secondary to these enzymes’ main purpose of oxi-dizing propene, benzene, cyclohexane, phenol, methanol, or any of a number ofother nonpolar organic compounds.
The second heterotrophic pathway is organic and appears limited to fungi. Itinvolves the oxidation of amines or amides to a substituted hydroxylamine followed by oxidation to a nitroso and then a nitro compound with the followingoxidation states:
.
These reactions are not coupled to ATP and thus produce no energy. Alternatively, Ncompounds may react with hydroxyl radicals produced in the presence of hydro-gen peroxide and superoxide, which may happen when fungi release oxidases andperoxidases during cell lysis and lignin degradation.
Heterotrophic bacteria such as Arthrobacter globiformis, Aerobacter aerogenes,Thiosphaera pantotropha, Streptomyces grisens, and various Pseudomonas spp.have been found to nitrify. The fungi Aspergillus flavus was first isolated as a nitri-fier in 1954 and is the most widely studied of the nitrifying heterotrophs.
Interest in heterotrophic nitrification increased substantially in the late 1980swhen it became clear that accelerated inputs of atmospheric ammonium to acidforest soils were being nitrified to nitrate with alarming effects on soil acidity, for-est health, and downstream drinking water quality. It was assumed until recently
RNH RNHOH RNO RNO NO3 1 1 3
2 3 3→ → → → �
� � � � �5
352 Chapter 13 Nitrogen Transformations
Ch13-P546807.qxd 11/18/06 7:06 PM Page 352
that most of this nitrification was heterotrophic; we know now that most nitrifica-tion in acid soils is autotrophic (De Boer and Kowalchuk, 2001), although the exactmechanisms by which nitrification occurs at low pH are not well understood. Het-erotrophic nitrification thus appears important in some soils and microenvironments,perhaps particularly where autotrophic nitrifiers are chemically inhibited (seebelow), but are thought now to rarely dominate the soil nitrifier community.
ENVIRONMENTAL CONTROLS OF NITRIFICATION
The single most important factor regulating nitrification in the majority of soilsis ammonium supply (Fig. 13.6). Where decomposition and thus N mineralization islow or where NH4
� uptake and thus N-immobilization by heterotrophs or plants ishigh, nitrification rates will be low. Conversely, any ecosystem disturbance thatincreases soil NH4
� availability will usually accelerate nitrification unless someother factor is limiting. Tillage, fire, clear-cutting, waste disposal, fertilization,atmospheric N deposition—all have well-documented effects on nitrate produc-tion in soils, mostly due to their effects on soil NH4
� pools.That nitrification usually accelerates only when the NH4
� supply exceeds plantand heterotroph demand implies that nitrifiers are relatively poor competitors forNH4
� in the soil solution. In fact this is the case: nitrification rates are typically lowin midsuccessional communities and aggrading forests because of high plantdemand for N, and also following the addition of high C:N residues to agriculturalsoils because of high microbial (heterotroph) demand for N. In old-growth forestsand mature grasslands, plant N demand has diminished and consequently nitrifi-cation is usually higher than in midsuccessional communities in which plant biomassis still accumulating, but not usually as high as in early successional communities,in which N supply often greatly exceeds demand (Robertson and Vitousek, 1981).
Oxygen is another important regulator of nitrification in soil. All known nitri-fiers are obligate aerobes, and nitrification proceeds very slowly if at all in sub-merged soils. In flooded environments such as wetlands and lowland rice, nitrifiersare active only in the oxidized zone around plant roots and at the water–sedimentinterface, usually only a few millimeters thick. And although some nitrifiers havethe capacity to use nitrite rather than O2 as an electron acceptor during respiration,O2 is still required for ammonia oxidation.
Nitrifiers are little different from other aerobic microbes with respect to theirresponse to temperature, moisture, and other environmental variables (see Fig. 13.2).Nitrification occurs slowly but readily under snow and in refrigerated soils, andsoil transplant experiments (e.g., Mahendrappa et al., 1966) have demonstrated anapparent capacity for nitrifiers to adapt to different temperature and moistureregimes. For many decades nitrifiers were thought to be inhibited in acid soils,probably because in many cases and especially in soils from cultivated fields, rais-ing soil pH with calcium or magnesium carbonate stimulates nitrification, and cul-turable nitrifiers exhibit a pH optimum of 7.5–8 (Prosser, 1989). We nowrecognize that nitrification can be high even in very acid forest soils (pH � 4.5;
Nitrification 353
Ch13-P546807.qxd 11/18/06 7:06 PM Page 353
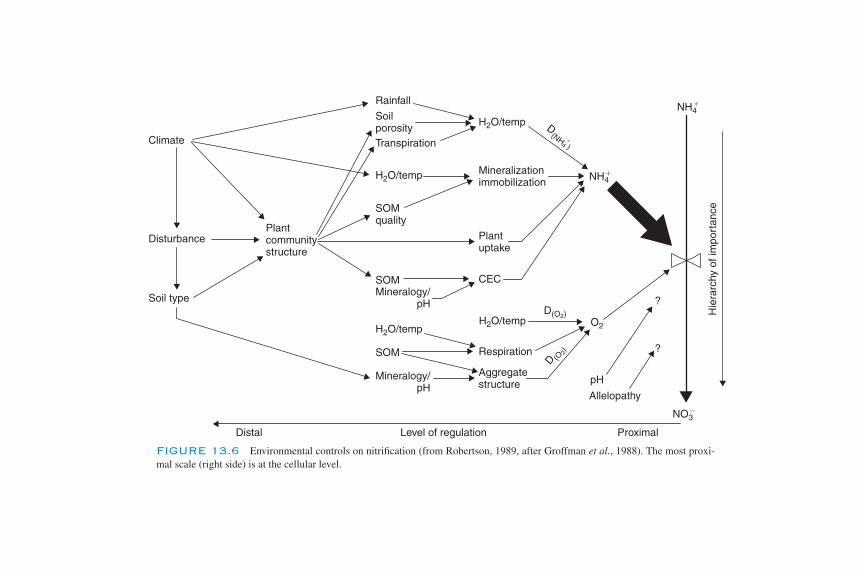
Climate
Disturbance
Soil type
Plantcommunitystructure
Rainfall
SoilporosityTranspiration
H2O/temp
Mineralizationimmobilization NH4
�
NH4�
Plantuptake
CECSOM
SOM
Mineralogy/ pH
Mineralogy/ pH
H2O/tempH2O/temp
H2O/temp
D(O2)
D (O2)
O2
Respiration
Aggregatestructure pH
Allelopathy
?
?
NO3�
ProximalLevel of regulation
Hie
rarc
hy o
f im
port
anceSOM
quality
D(NH
4�)
Distal
FIGURE 13.6 Environmental controls on nitrification (from Robertson, 1989, after Groffman et al., 1988). The most proxi-mal scale (right side) is at the cellular level.
Ch13-P546807.qxd 11/18/06 7:06 PM Page 354

Robertson, 1989), although the physiological basis for this is still not well under-stood (DeBoer and Kowalchuck, 2001).
INHIBITION OF NITRIFICATION
Nitrification is unaccountably slow in some soils, and in some circumstances itmay be inhibited by natural or manufactured compounds. A wide variety of plantextracts can inhibit culturable nitrifiers in vitro, for example, although their impor-tance in situ is questionable. Likewise, commercial products such as nitrapyrinand dicyandimide can be used to inhibit nitrification in soil with varying degrees ofsuccess. Most commercial compounds are pyridines, pyrimidines, amino triazoles,and sulfur compounds such as ammonium thiosulfate. One recent innovation isparaffin-coated calcium carbide (CaC2; Freney et al., 2000). Calcium carbide reactswith water to form acetylene (C2H2), which inhibits nitrifiers at very low partialpressures, ca. 10 Pa. As the paraffin wears off, CaC2 is exposed to soil moistureand the C2H2 formed inhibits nitrification. Likewise, neem oil, extracted from theIndian neem tree (Azadirachta indica), has been used commercially to coat ureafertilizer pellets to slow its nitrification to NO3
�.The potential value of managing nitrifiers in ecosystems can be easily seen
from the position of nitrification in the overall N cycle (Fig. 13.1). Nitrogen is lostfrom ecosystems mainly after its conversion to NO3
� and prior to plant uptake, sokeeping N in the NH4
� form keeps it from being lost by nitrate leaching and deni-trification, the two principal pathways of unintentional N loss in most ecosystems.Because many plants prefer to take up N as NO3
�, it is not desirable to inhibit nitri-fication completely even in intensively managed ecosystems such as fertilized rowcrops, but slowing nitrifiers or restricting their activity to periods of active plantgrowth is an attractive—if still elusive—management option.
DENITRIFICATION
Denitrification is the reduction of soil nitrate to the N gases NO, N2O, and N2. A wide variety of mostly heterotrophic bacteria can denitrify, whereby they useNO3
� rather than oxygen (O2) as a terminal electron acceptor during respiration.Because nitrate is a less efficient electron acceptor than O2, most denitrifiers under-take denitrification only when O2 is otherwise unavailable. In most soils this occursmainly following rainfall as soil pores become water-saturated and the diffusionof O2 to microsites is slowed drastically. Typically denitrification starts to occur atwater-filled pore space concentrations of 60% and higher (Fig. 13.2). In wetland andlowland rice soils diffusion may be restricted most of the time. Oxygen demandcan also exceed supply inside soil aggregates and in rapidly decomposing litter.
Denitrification is the only point in the N cycle at which fixed N reenters theatmosphere as N2; it thus serves to close the global N cycle. In the absence of den-itrification, N2 fixers (see Chap. 14) would eventually draw atmospheric N2 to nil,
Denitrification 355
Ch13-P546807.qxd 11/18/06 7:06 PM Page 355
and the biosphere would be awash in nitrate. Denitrification is also important asthe major source of atmospheric N2O, an important greenhouse gas that also consumes stratospheric ozone.
From a management perspective, denitrification is advantageous when it isdesirable to remove excess NO3
� from soil prior to its movement to ground or sur-face waters. Sewage treatment often aims to remove N from waste streams bymanaging nitrification and denitrification. Typically wastewater is directedthrough sedimentation tanks, filters, and sand beds designed to remove particu-lates and encourage decomposition and the mineralization of organic N to NH4
�,which is then nitrified under aerobic conditions to NO3
�. The stream is thendirected to anaerobic tanks where denitrifiers convert the NO3
� to N2O and N2,which is then released to the atmosphere. Part of the nitrification/denitrificationmanagement challenge is ensuring that the stream is exposed to aerobic condi-tions long enough to allow nitrifiers to convert most NH4
� to NO3� but not so long
as to remove all dissolved organic C (known as biological oxygen demand orBOD to wastewater engineers), which the denitrifiers need for substrate.
Denitrification can also remove nitrate from groundwater prior to its movementto streams and rivers. In most wetlands and riparian areas nitrate-rich groundwa-ter must move across a groundwater–sediment interface that is typically anaerobicand carbon-rich. As nitrate moves across this interface it can be denitrified to N2Oand N2, keeping it from polluting downstream surface waters.
In managed ecosystems it is usually desirable to minimize denitrification inorder to conserve N further for plant uptake; in regions with ample rainfall ecosys-tem N losses due to denitrification can rival or exceed losses by nitrate leaching.There are no technologies designed to inhibit denitrification per se; usually deni-trifiers are best managed indirectly by manipulating water levels (e.g., in rice cultivation) or nitrate supply (e.g., nitrification inhibitors).
DENITRIFIER DIVERSITY
Denitrification is carried out by a broad array of soil bacteria, including organ-otrophs, chemo- and photolithotrophs, N2 fixers, thermophiles, halophiles, andvarious pathogens. Over 50 genera with over 125 denitrifying species have beenidentified (Zumft, 1992). In soil, most culturable denitrifiers are facultative anaer-obes from only 3–6 genera, principally Pseudomonas and Alcaligenes and to alesser extent Bacillus, Agribacterium, and Flavibacterium. Typically denitrifiersconstitute 0.1 to 5% of the total culturable soil population and up to 20% of totalmicrobial biomass (Tiedje, 1988).
Organisms denitrify to generate energy (ATP) by electron transport phospho-rylation via the cytochrome system. The general pathway is
.2NO3� 2NO2NO2
� N2O N2nar nir nor nos
356 Chapter 13 Nitrogen Transformations
Ch13-P546807.qxd 11/18/06 7:06 PM Page 356
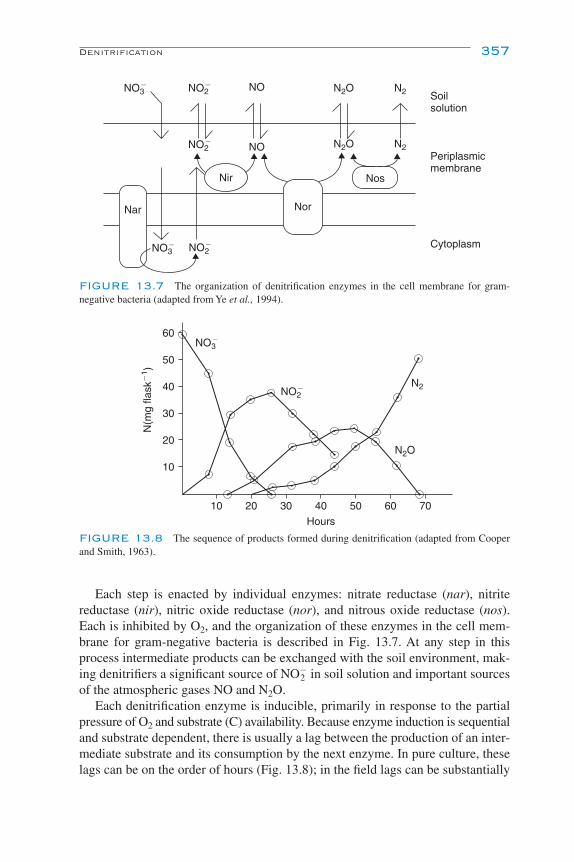
Each step is enacted by individual enzymes: nitrate reductase (nar), nitritereductase (nir), nitric oxide reductase (nor), and nitrous oxide reductase (nos).Each is inhibited by O2, and the organization of these enzymes in the cell mem-brane for gram-negative bacteria is described in Fig. 13.7. At any step in thisprocess intermediate products can be exchanged with the soil environment, mak-ing denitrifiers a significant source of NO2
� in soil solution and important sourcesof the atmospheric gases NO and N2O.
Each denitrification enzyme is inducible, primarily in response to the partialpressure of O2 and substrate (C) availability. Because enzyme induction is sequentialand substrate dependent, there is usually a lag between the production of an inter-mediate substrate and its consumption by the next enzyme. In pure culture, theselags can be on the order of hours (Fig. 13.8); in the field lags can be substantially
Denitrification 357
NO3�
NO3�
NO2�
NO2�
NO2�
NO
NO
N2O
N2O
N2
N2
Soilsolution
Periplasmicmembrane
Cytoplasm
Nir Nos
NorNar
FIGURE 13.7 The organization of denitrification enzymes in the cell membrane for gram-negative bacteria (adapted from Ye et al., 1994).
60
50
40
30
20
10
10 20 30 40 50 60 70
Hours
N(m
g fla
sk�
1 )
NO3�
NO2�
N2
N2O
FIGURE 13.8 The sequence of products formed during denitrification (adapted from Cooperand Smith, 1963).
Ch13-P546807.qxd 11/18/06 7:06 PM Page 357
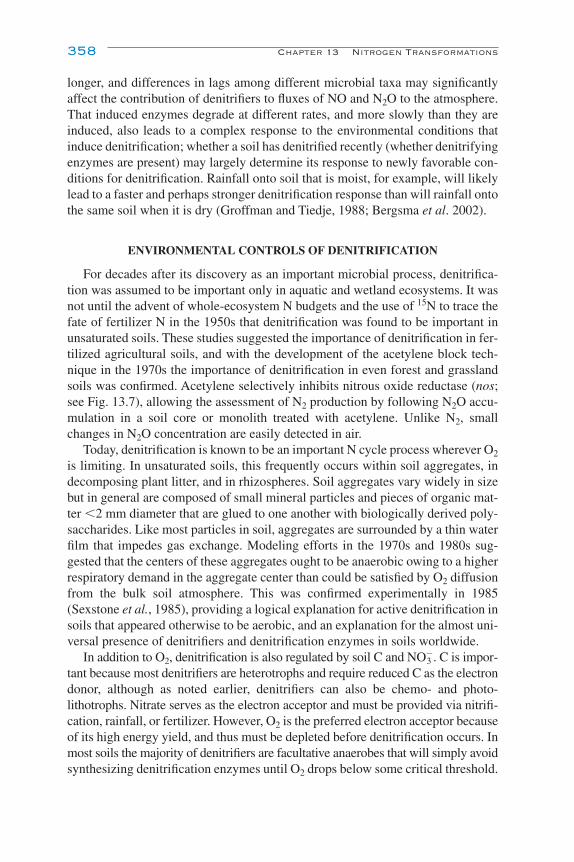
longer, and differences in lags among different microbial taxa may significantlyaffect the contribution of denitrifiers to fluxes of NO and N2O to the atmosphere.That induced enzymes degrade at different rates, and more slowly than they areinduced, also leads to a complex response to the environmental conditions thatinduce denitrification; whether a soil has denitrified recently (whether denitrifyingenzymes are present) may largely determine its response to newly favorable con-ditions for denitrification. Rainfall onto soil that is moist, for example, will likelylead to a faster and perhaps stronger denitrification response than will rainfall ontothe same soil when it is dry (Groffman and Tiedje, 1988; Bergsma et al. 2002).
ENVIRONMENTAL CONTROLS OF DENITRIFICATION
For decades after its discovery as an important microbial process, denitrifica-tion was assumed to be important only in aquatic and wetland ecosystems. It wasnot until the advent of whole-ecosystem N budgets and the use of 15N to trace thefate of fertilizer N in the 1950s that denitrification was found to be important inunsaturated soils. These studies suggested the importance of denitrification in fer-tilized agricultural soils, and with the development of the acetylene block tech-nique in the 1970s the importance of denitrification in even forest and grasslandsoils was confirmed. Acetylene selectively inhibits nitrous oxide reductase (nos;see Fig. 13.7), allowing the assessment of N2 production by following N2O accu-mulation in a soil core or monolith treated with acetylene. Unlike N2, smallchanges in N2O concentration are easily detected in air.
Today, denitrification is known to be an important N cycle process wherever O2
is limiting. In unsaturated soils, this frequently occurs within soil aggregates, indecomposing plant litter, and in rhizospheres. Soil aggregates vary widely in sizebut in general are composed of small mineral particles and pieces of organic mat-ter �2 mm diameter that are glued to one another with biologically derived poly-saccharides. Like most particles in soil, aggregates are surrounded by a thin waterfilm that impedes gas exchange. Modeling efforts in the 1970s and 1980s sug-gested that the centers of these aggregates ought to be anaerobic owing to a higherrespiratory demand in the aggregate center than could be satisfied by O2 diffusionfrom the bulk soil atmosphere. This was confirmed experimentally in 1985(Sexstone et al., 1985), providing a logical explanation for active denitrification insoils that appeared otherwise to be aerobic, and an explanation for the almost uni-versal presence of denitrifiers and denitrification enzymes in soils worldwide.
In addition to O2, denitrification is also regulated by soil C and NO3�. C is impor-
tant because most denitrifiers are heterotrophs and require reduced C as the electrondonor, although as noted earlier, denitrifiers can also be chemo- and photo-lithotrophs. Nitrate serves as the electron acceptor and must be provided via nitrifi-cation, rainfall, or fertilizer. However, O2 is the preferred electron acceptor becauseof its high energy yield, and thus must be depleted before denitrification occurs. Inmost soils the majority of denitrifiers are facultative anaerobes that will simply avoidsynthesizing denitrification enzymes until O2 drops below some critical threshold.
358 Chapter 13 Nitrogen Transformations
Ch13-P546807.qxd 11/18/06 7:06 PM Page 358
In the field O2 is by far the dominant control on denitrification rates.Denitrification can be easily stimulated in an otherwise aerobic soil by removing O2
and can be inhibited in saturated soil by drying or otherwise aerating it. The relativeimportance of C and NO3
�, the other major controls, will vary by ecosystem. Undersaturated conditions, such as those found in wetlands and lowland rice paddies,NO3
� limits denitrification because the nitrifiers that provide NO3� are inhibited at
low O2 concentrations. Consequently, denitrification occurs only in the slightly oxy-genated rhizosphere and at the sediment–water interface, places where there issufficient O2 for nitrifiers to oxidize NH4
� to NO3�, which can then diffuse to deni-
trifiers in the increasingly anaerobic zones away from the root surface or sedi-ment–water interface. It is often difficult to find NO3
� in persistently saturated soils,not only because of low nitrification, but also because of the tight coupling betweennitrifiers and denitrifiers. In wetlands with fluctuating water tables or with signif-icant inputs of NO3
� from groundwater, NO3� may be more available.
In unsaturated soils, on the other hand, the availability of soil C more often lim-its denitrification. In these soils C supports denitrification both directly by provid-ing donor electrons to denitrifiers and indirectly by stimulating O2 consumption byheterotrophs. It can be difficult to distinguish between these two effects experi-mentally; from a management perspective, there probably is no need to. It is wellrecognized that exogenous C stimulates denitrification, although the C addedmust be in an available form and must not lead to N immobilization sufficient todeplete NO3
� availability.
OTHER NITROGEN TRANSFORMATIONS IN SOIL
Several additional microbial processes transform N in soil, although none arethought to be as quantitatively important as mineralization, immobilization, nitri-fication, and denitrification. Dissimilatory nitrate reduction to ammonium (DNRA)refers to the anaerobic transformation of nitrate to nitrite and then to ammonium.Like denitrification, this process allows for respiration to go on in the absence ofO2, but the ecology of DNRA is much less well understood than that of denitrifi-cation. A capacity for DNRA has been found in facultative and obligately fer-mentative bacteria and has long been thought to be restricted to highly anaerobicenvironments such as anaerobic sewage sludge bioreactors, anoxic sediments, andthe bovine rumen. More recently, however, DNRA has been found to be commonand important in some tropical forest soils (Silver et al., 2001). In these soils theflow of inorganic N through DNRA is as large as or larger than the flow throughdenitrification and nitrification and may help to conserve N in these ecosystemsby shunting nitrate into ammonium rather than to N2O or N2. The importance ofDNRA in other soils is not clear because few measurements have been made due to the difficulty of measuring DNRA in the presence of other active N-cycletransformations.
Other Nitrogen Transformations in Soil 359
Ch13-P546807.qxd 11/18/06 7:06 PM Page 359

Nonrespiratory denitrification, like respiratory denitrification, also results inthe production of N gas (mainly N2O), but the reduction does not enhance growthand can occur in aerobic environments. A variety of nitrate-assimilating bacteria,fungi, and yeast can carry out nonrespiratory denitrification, which may be respon-sible for some of the N2O now attributed to nitrifiers in well-aerated soils (Robertsonand Tiedje, 1987).
Anaerobic ammonium oxidation (anammox), in which ammonium and nitriteare converted to N2, has been only recently discovered (Mulder et al., 1995; Jetten,2001) and thus its environmental significance is not fully known except in oceanicsystems (Kuypers et al., 2005). Anammox bacteria grow very slowly in enrichmentculture and only under strict anaerobic conditions; anammox thus is likely to be asignificant soil process only in periodically or permanently submerged soils. Onepathway, involving the combination of ammonia with nitrite, has been shown tooccur in three or four obligate anaerobes, including Brocadia anammoxidans andScalindua spp. A second pathway involves the nitrifier Nitrosomonas spp., in anitrogen tetraoxide (N2O4)-dependent reaction that also produces significantamounts of NO and N2O (Schmidt et al., 2002).
Chemodenitrification occurs when NO2� in soil reacts to form N2 or NOx. This
can occur by several aerobic pathways. In the Van Slyke reaction, amino groups inthe α position to carboxyls yield N2:
RNH2 � HNO2 → ROH � H2O � N2.
In a similar reaction, NO2� reacts with NH�
4, urea, methylamine, purines, andpyrimidines to yield N2:
HNO2 � NH4� → N2 � 2H2O.
Chemical decomposition of HNO2 may also occur spontaneously:
3HNO2 → HNO3 � H2O � 2NO.
In general chemodenitrification is thought to be a minor pathway for N loss inmost ecosystems. It is not easily evaluated in situ, however, and in the lab requiresa sterilization procedure that does not itself significantly disrupt soil nitrogenchemistry.
NITROGEN MOVEMENT IN THE LANDSCAPE
Microbial transformations of reactive N (Table 13.3) have great importance forsoil fertility, water quality, and atmospheric chemistry at ecosystem, landscape, andregional scales. It is at these scales that the disconnect between what we have learnedin the laboratory and what we observe in the environment (see Introduction)becomes most obvious.
One approach to thinking about microbial N cycle processes at large scales isto ask a series of questions that attempt to determine if a particular ecosystem is asource or a sink of particular N species of environmental concern (Table 13.4).
360 Chapter 13 Nitrogen Transformations
Ch13-P546807.qxd 11/18/06 7:06 PM Page 360
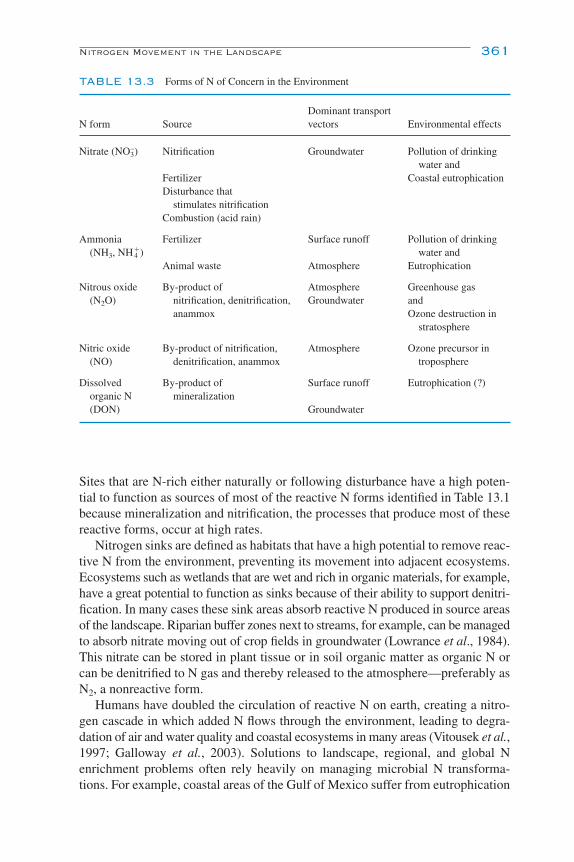
Sites that are N-rich either naturally or following disturbance have a high poten-tial to function as sources of most of the reactive N forms identified in Table 13.1because mineralization and nitrification, the processes that produce most of thesereactive forms, occur at high rates.
Nitrogen sinks are defined as habitats that have a high potential to remove reac-tive N from the environment, preventing its movement into adjacent ecosystems.Ecosystems such as wetlands that are wet and rich in organic materials, for example,have a great potential to function as sinks because of their ability to support denitri-fication. In many cases these sink areas absorb reactive N produced in source areasof the landscape. Riparian buffer zones next to streams, for example, can be managedto absorb nitrate moving out of crop fields in groundwater (Lowrance et al., 1984).This nitrate can be stored in plant tissue or in soil organic matter as organic N orcan be denitrified to N gas and thereby released to the atmosphere—preferably asN2, a nonreactive form.
Humans have doubled the circulation of reactive N on earth, creating a nitro-gen cascade in which added N flows through the environment, leading to degra-dation of air and water quality and coastal ecosystems in many areas (Vitousek et al.,1997; Galloway et al., 2003). Solutions to landscape, regional, and global Nenrichment problems often rely heavily on managing microbial N transforma-tions. For example, coastal areas of the Gulf of Mexico suffer from eutrophication
Nitrogen Movement in the Landscape 361
TABLE 13.3 Forms of N of Concern in the Environment
Dominant transportN form Source vectors Environmental effects
Nitrate (NO3–) Nitrification Groundwater Pollution of drinking
water andFertilizer Coastal eutrophicationDisturbance that
stimulates nitrificationCombustion (acid rain)
Ammonia Fertilizer Surface runoff Pollution of drinking (NH3, NH4
�) water andAnimal waste Atmosphere Eutrophication
Nitrous oxide By-product of Atmosphere Greenhouse gas(N2O) nitrification, denitrification, Groundwater and
anammox Ozone destruction in stratosphere
Nitric oxide By-product of nitrification, Atmosphere Ozone precursor in (NO) denitrification, anammox troposphere
Dissolved By-product of Surface runoff Eutrophication (?)organic N mineralization(DON) Groundwater
Ch13-P546807.qxd 11/18/06 7:06 PM Page 361

and hypoxia that have been linked to excess N from the Mississippi river basin(Turner and Rabalais, 1994). Proposed solutions to this problem include bettermanagement of microbial N- transformations in crop fields as well as the creationof denitrifying wetland sinks for excess N moving out of agricultural areas(Mitsch et al., 2001).
Source–sink dynamics of N ultimately depend on the juxtaposition of differentecosystems in the landscape and the hydrologic and atmospheric transport vectorsthat link them—a complex topic that requires knowledge of hydrology and atmos-pheric chemistry in addition to soil ecology and microbiology. Because soilmicrobes play a crucial role in forming and consuming reactive N in the environ-ment, however, their management can be an important and even crucial means forregulating N fluxes at local, regional, and global scales.
REFERENCES AND SUGGESTED READING
Bergsma, T. T., Robertson, G. P., and Ostrom, N. E. (2002). Influence of soil moisture and land use his-tory on denitrification end products. J. Environ. Qual. 31, 711–717.
Cooper, G. S., and Smith, R. (1963). Sequence of products formed during denitrification. Soil Sci. Soc.Am. Pro. 27, 659–662.
De Boer, W., and Kowalchuk, G. A. (2001). Nitrification in acid soils: micro-organisms and mecha-nisms. Soil Biol. Biochem. 33, 853–866.
Firestone, M. K., and Davidson, E. A. (1989). Microbiological basis of NO and N2O production andconsumption in soil. In “Trace Gas Exchange between Terrestrial Ecosystems and the Atmosphere”(M. D. Andreae and D. S. Schimel, eds.), pp. 7–22. Wiley, Berlin.
Francis, C. A., Roberts, K. J., Beman, J. M., Santoro, A. E., and Oakley, B. B. (2005). Ubiquity anddiversity of ammonia-oxidizing archaea in water columns and sediments of the ocean. Proc. Natl.Acad. Sci. USA 102, 14683–14688.
362 Chapter 13 Nitrogen Transformations
TABLE 13.4 Criteria for Determining if a Site Is a Source or a Sink of N in the Landscape(from Groffman, 2000)
Criteria Determinants
Is the site N rich? FertilizedFine texture (clay)LegumesWet tropics
Is the site highly disturbed? Disturbance of plant uptake (e.g., harvest)Stimulation of mineralization (e.g., tillage)Disturbance of links between plant and microbial
processes (e.g., tillage)
Does the site have a high potential for Wet soildenitrification? Well-aggregated
High available organic matter
Does the site have a high potential for NH3 High pH (�8.0)volatilization?
Ch13-P546807.qxd 11/18/06 7:06 PM Page 362
Freitag, T. E., Chang, L., Clegg, C. D., and Prosser, J. I. (2005). Influence of inorganic nitrogen-management regime on the diversity of nitrite oxidizing bacteria in agricultural grassland soils.Appl. Environ. Microbiol. 71, 8323–8334.
Freney, J. R., Randall, P. J., Smith, J. W. B., Hodgkin, J., Harrington, K. J., and Morton, T. C. (2000). Slowrelease sources of acetylene to inhibit nitrification in soil. Nutrient Cycling Agroecosyst. 56, 241–251.
Galloway, J. N., Aber, J. D., Erisman, J. W., Seitzinger, S. P., Howarth, R. W., Cowling, E. B., andCosby, B. J. (2003). The nitrogen cascade. BioScience 53, 341–356.
Groffman, P. M. (2000). Nitrogen in the environment. In “Handbook of Soil Science” (M. E. Sumner,ed.), pp. C190–200. CRC Press, Boca Raton, FL.
Groffman, P. M., and Tiedje, J. M. (1988). Denitrification hysteresis during wetting and drying cyclesin soil. Soil Sci. Soc. Am. J. 52, 1626–1629.
Groffman, P. M., Tiedje, J. M., Robertson, G. P., and Christensen, S. (1988). Denitrification at differenttemporal and geographical scales: proximal and distal controls. In “Advances in Nitrogen Cyclingin Agricultural Ecosystems” (J. R. Wilson, ed.), pp. 174–192. CAB International, Wallingford, UK.
Hart, S. C., Stark, J. M., Davidson, E. A., and Firestone, M. K. (1994). Nitrogen mineralization, immo-bilization, and nitrification. In “Methods of Soil Analysis,” Part 2, “Microbiological andBiochemical Properties” (R. W. Weaver, J. S. Angle, P. J. Bottomley, D. F. Bezdicek, M. S. Smith,M. A. Tabatabai, and A. G. Wollum, eds.), pp. 985–1018. Soil Sci. Soc. Am., Madison, WI.
Head, I. M., Hiorns, W. D., Embley, T. M., McCarthy, A. J., and Saunders, J. R. (1993). The phylogenyof autotrophic ammonia-oxidizing bacteria as determined by analysis of 16S ribosomal RNA genesequences. J. Gen. Microbiol. 139, 1147–1153.
Hyvönen, R., Agren, G. I., and Andren, O. (1996). Modeling long-term carbon and nitrogen dynamicsin an arable soil receiving organic matter. Ecol. Appl. 6, 1345–1354.
Jetten, M. S. M. (2001). New pathways for ammonia conversion in soil and aquatic systems. Plant Soil230, 9–19.
Juretschko, S., Timmermann, G., Schmid, M., Schleifer, K. H., Pommerening-Roser, A., Koops, H.-P.,and Wagner, M. (1998). Combined molecular and conventional analyses of nitrifying bacteriumdiversity in activated sludge: Nitrosococcus mobilis and Nitrospira-like bacteria as dominant pop-ulations. Appl. Environ. Microbiol. 64, 3042–3051.
Könneke, M., Bernhard, A. E., de la Torre, J. R., Walker, C. B., Waterbury, J. B., and Stahl, D. A.(2005). Isolation of an autotrophic ammonia-oxidizing marine archaeon. Nature 437, 543–546.
Koops, H.-P., and Pommerening-Röser, A. (2001). Distribution and ecophysiology of the nitrifyingbacteria emphasizing cultured species. FEMS Microbial. Ecol. 37, 1–9.
Koops, H.-P., Purkhold, U., Pommerening-Roser, A., Timmermann, G., and Wagner, M. (2003). Thelithoautotrophic ammonia-oxidizing bacteria. In “The Prokaryotes: an Evolving ElectronicResource for the Microbiological Community” (M. Dworkin et al., eds.). Springer-Verlag, New York, http://link.springer-ny.com/link/service/books/10125/.
Kuypers, M. M. M., Lavik, G., Woebken, D., Schmid, M., Fuchs, B. M., Amann, R., Jorgensen, B. B.,and Jetten, S. M. (2005). Massive nitrogen loss from the Benguela upwelling system throughanaerobic ammonium oxidation. Proc. Natl. Acad. Sci. USA 102, 6478–6483.
Leininger, S., Urich, T., Schloter, M., Schwark, L., Qi, J., Nicol, G. W., Prosser, J. I., Schuster, S. C.,and Schleper, C. (2006). Archaea predominate among ammonia-oxidizing prokaryotes in soils.Nature 442, 806–809.
Linn, D. M., and Doran, J. W. (1984). Effect of water-filled pore space on CO2 and N2O production intilled and non-tilled soils. Soil Sci. Soc. Am. J. 48, 1267–1272.
Löhnis, F. (1913) “Vorlesungen uber Landwortschaftliche Bacterologia.” Borntraeger, Berlin.Lowrance, R. R., Todd, R. L., Fail, J., Hendrickson, O., Leonard, R., and Asmussen, L. (1984).
Riparian forests as nutrient filters in agricultural water sheds. Bioscience 34, 374–377.Mahendrappa, M. K., Smith, R. L., and Christiansen, A. T. (1966). Nitrifying organisms affected by
climatic region in western U.S. Proc. Soil Sci. Soc. Am. 30, 60–62.Mitsch, W. J., Day, J. W., Gilliam, J. W., Groffman, P. M., Hey, D. L., Randall, G. W., and Wang, N.
(2001). Reducing nitrogen loading to the Gulf of Mexico from the Mississippi River basin: strate-gies to counter a persistent ecological problem. BioScience 51, 373–388.
References and Suggested Reading 363
Ch13-P546807.qxd 11/18/06 7:06 PM Page 363

Mulder, A., van de Graaf, A. A., Robertson, L. A., and Kuenen, J. G. (1995). Anaerobic ammoniumoxidation discovered in a denitrifying fluidized bed reactor. FEMS Microbial. Ecol. 16, 177–184.
Norton, J. M. (2000). Nitrification. In “Handbook of Soil Science” (M. E. Sumner, ed.), pp. C160–181.CRC Press, Boca Raton, FL.
Prosser, J. I. (1989). Autotrophic nitrification in bacteria. In “Advances in Microbial Physiology” (A. H. Rose and D. W. Tempest, eds.), pp. 125–181. Academic Press, San Diego.
Prosser, J. I., and Embley, T. M. (2002). Cultivation-based and molecular approaches to characterisa-tion of terrestrial and aquatic nitrifiers. Antonie van Leeuwenhoek 81, 165–179.
Purkhold, U., Pommerening-Roser, A., Juretschko, S., Schmid, M. C., Koops, H.-P., and Wagner, M.(2000). Phylogeny of all recognized species of ammonia oxidizers based on comparative 16SrRNA and amoA sequence analysis: implications for molecular diversity surveys. Appl. Environ.Microbiol. 66, 5368–5382.
Robertson, G. P., and Vitousek, P. M. (1981). Nitrification in primary and secondary succession.Ecology 62, 376–386.
Robertson, G. P. (1989). Nitrification and denitrification in humid tropical ecosystems. In “MineralNutrients in Tropical Forest and Savanna Ecosystems” (J. Proctor, ed.), pp. 55–70. Blackwell Sci.,Cambridge, UK.
Robertson, G. P. (1997). Nitrogen use efficiency in row-crop agriculture: crop nitrogen use and soilnitrogen loss. In “Ecology in Agriculture” (L. Jackson, ed.), pp. 347–365. Academic Press, New York.
Robertson, G. P. (2000). Denitrification. In “Handbook of Soil Science” (M. E. Sumner, ed.), pp. C181–190. CRC Press, Boca Raton, FL.
Robertson, G. P., and Tiedje, J. M. (1987). Nitrous oxide sources in aerobic soils: nitrification, denitri-fication, and other biological processes. Soil Biol. Biochem. 19, 187–193.
Robertson, G. P., Wedin, D. A., Groffman, P. M., Blair, J. M., Holland, E., Harris, D., and Nadelhoffer,K. (1999). Soil carbon and nitrogen availability: nitrogen mineralization, nitrification, and soil respi-ration potentials. In “Standard Soil Methods for Long-Term Ecological Research” (G. P. Robertson,C. S. Bledsoe, D. C. Coleman, and P. Sollins, eds.), pp. 258–271. Oxford Univ. Press, New York.
Schimel, J. P., and Bennett, J. (2004). Nitrogen mineralization: challenges of a changing paradigm.Ecology 85, 591–602.
Schmidt, I., Hermelink, C., van de Pas-Schoonen, K., Strous, M., den Camp, H. J., Kuenen, J. G., andJetten, M. S. M. (2002). Anaerobic ammonia oxidation in the presence of nitrogen oxides (NOx)by two different lithotrophs. Appl. Environ. Microbiol. 68, 5351–5357.
Sexstone, A. J., Revsbech, N. P., Parkin, T. B., and Tiedje, J. M. (1985). Direct measurement of oxygenprofiles and denitrification rates in soil aggregates. Soil Sci. Soc. Am. J. 49, 645–651.
Silver, W. L., Herman, D. J., and Firestone, M. K. (2001). Dissimilatory nitrate reduction to ammo-nium in upland tropical forest soils. Ecology 82, 2410–2416.
Teske, A., Alm, E., Regan, J. M., Toze, S., Rittman, B. E., and Stahl, D. A. (1994). Evolutionary rela-tionships among ammonia- and nitrite-oxidizing bacteria. J. Bacteriol. 176, 6623–6630.
Tiedje, J. M. (1988). Ecology of denitrification and dissimilatory nitrate reduction to ammonium. In“Biology of Anaerobic Microorganisms” (A. J. B. Zehnder, ed.), pp. 179–244. Wiley, New York.
Tisdale, S. L., Nelson, W. L., Beaton, J. D., and Havlin, J. L. (1993). “Soil Fertility and Fertilizers.” 5thed. Macmillan, New York.
Turner, R. E., and Rabalais, N. N. (1994). Coastal eutrophication near the Mississippi River delta.Nature 368, 619–621.
Vitousek, P. M., Aber, J. D., Howarth, R. W., Likens, G. E., Matson, P. A., Schindler, D. W.,Schlesinger, W. H., and Tilman, D. G. (1997). Human alteration of the global nitrogen cycle:sources and consequences. Ecol. Appl. 7, 737–750.
Winogradsky, S. (1892). Contributions a la morphologie des organismes de la nitrification. Arch. Sci.Biol. 1, 86–137.
Ye, R. W., Averill, B. A., and Tiedje, J. M. (1994). Denitrification of nitrite and nitric oxide. Appl.Environ. Microbiol. 60, 1053–1058.
Zumft, W. G. (1992): The denitrifying procaryotes. In “The Prokaryotes” (A. Balows, ed.). Springer-Verlag, New York.
364 Chapter 13 Nitrogen Transformations
Ch13-P546807.qxd 11/18/06 7:06 PM Page 364

14Biological N Inputs
Peter J. Bottomley
David D. Myrold
Global N Inputs
Biological Nitrogen Fixation
Free-Living N2-Fixing Bacteria
Associative N2-Fixing Bacteria
Phototrophic Bacteria
Symbiotic N2-Fixing Associations between Legumes and Rhizobia
Biotechnology of BNF
Acknowledgments
References and Suggested Reading
GLOBAL N INPUTS
The nonmetallic element N is essential for life. Although a huge amount of N(4 � 1021g) exists in the atmosphere, soils, and waters of Earth, more than 99%of this is in the form of N2 and also is unavailable to almost all living organisms(Table 14.1). To transform N2 into “reactive N,” the triple bond must be broken sothat N can bond with C, H, and O and form the building blocks of life. In the pre-human world, N2 was transformed into reactive N via lightning discharge (5 tera-grams (Tg) N year�1; 1 Tg equals 1012 g) and by biological N fixation (BNF)(100–140 Tg N year�1). Very few organisms possess the “N-fixing” enzyme com-plex necessary to carry out BNF. In the past, reactive N has not accumulated glob-ally, because the microbial process of denitrification (whereby NO3
� is convertedto N2) occurs at approximately the same rate as BNF. During the past 100 years,however, the annual input of anthropogenically created reactive N has increaseddramatically due to (a) modest increases in legume use in agriculture (15 to 30 TgN year�1), (b) large increases in fossil fuel combustion (1 Tg N year�1 in 1860 vs
365
Ch14-P546807.qxd 11/18/06 7:10 PM Page 365

366 Chapter 14 Biological N Inputs
25 Tg N year�1 in 2000), and (c) enormous increases in the use of Haber–Boschprocess-derived fertilizer N for food production (zero, pre-20th century; currently�110 Tg N year�1) (Fig. 14.1). The input of reactive N has increased over 10-fold in100 years, with about 85% being used by agriculture to support the ever-increasinghuman population during the same period. In addition, enhanced use of reactive Nfor food production has had secondary effects on the N cycle. For example, the inten-sification of agriculture and its expansion into forest and grasslands has released
TABLE 14.1 Global Nitrogen Pool Sizesa
Nitrogen pool Pool size (g of N)
Lithosphere 1.0 � 1023
Atmosphere 3.9 � 1021
Coal 1.0 � 1017
Hydrosphere 2.3 � 1019
Soil organic N 1.0 � 1017
Soil fixed NH4� 2.0 � 1016
Biota N 3.5 � 1015
Microbial N 1.5 � 1015
aReprinted from Paul and Clark (1996) bypermission of the publisher.
200
150
001850 1870 1890 1910 1930 1950 1970 1990 2010
2
4
6
50
100
Year
Wor
ld p
opul
atio
n (b
illio
ns)
Tg N
year �1
Population Total NrHaber–Bosch C-BNF Fossil fuel
FIGURE 14.1 Global population trends from 1860 to 2000 (billions, left axis) and reactivenitrogen (Nr) creation (teragrams nitrogen (Tg N) per year, right axis). “Haber–Bosch” represents Nrcreation through the Haber–Bosch process, including production of ammonia for nonfertilizer pur-poses. “C-BNF” (cultivation-induced biological nitrogen fixation) represents Nr creation from culti-vation of legumes, rice, and sugarcane. “Fossil fuel” represents Nr created from fossil fuel combustion.“Total Nr” represents the sum created by these three processes. Reproduced from Galloway et al.(2003); copyright American Institute of Biological Sciences.
Ch14-P546807.qxd 11/18/06 7:10 PM Page 366

reactive N from long-term storage in soil organic matter. It has been estimated thatthe burning of forests and grasslands, draining of wetlands, and soil tillage liber-ate approximately 40 Tg N year�1 of reactive N (Vitousek et al., 1997).
Although yearly estimates of global BNF have not changed much across both pre-and postindustrial eras, the distribution of BNF has changed as a result of urban-ization and intensive agriculture. Large areas of diverse natural vegetation, whichonce included N2-fixing species as part of their floral composition, have beenreplaced by monocultures of non-N2-fixing, high-yielding crop species that requireaddition of reactive N to achieve their yield potentials. In contrast, agriculturalBNF is restricted to smaller areas of intensively managed crop and grazing lands.Unfortunately, increased use of N2-fixing grain legumes for human and domesticanimal consumption often results in net export of N from agricultural soils. Anothermajor consequence of the human-driven alteration of the N cycle involves the move-ment of reactive N from sites of application to remote sites. BNF occurs inside liv-ing organisms in which fixed N is quickly assimilated into cell constituents. Incontrast, reactive N applied to non-N2-fixing crop species as fertilizer or animalwaste has a less certain fate. For example, ammoniacal and urea-based N fertiliz-ers can be converted to various gaseous or water-soluble N oxides (NOx) by themicrobial processes of nitrification and denitrification and dispersed from the siteof application. NH3 can also be dispersed to the atmosphere for deposition else-where (a) during application of anhydrous NH3 or animal waste or (b) after enzy-matic conversion of soil-applied urea to NH3 by the enzyme urease. There areboth positive and negative effects associated with the deposition of reactive N atsites remote from its source. Plant and microbe growth may be stimulated and Nimmobilized. Scientists have estimated that an extra 100–1000 Tg C year�1 maybe fixed globally because of atmospheric transfer and remote deposition of reac-tive N. Too much N deposition, however, can result in soil acidification, greaterNO3
� leaching, and loss of plant species diversity in terrestrial ecosystems.It might seem somewhat ironic that the justification for studying BNF so inten-
sively over the past 100 years lies in the need to increase inputs of reactive N viaBNF into N-limited agroecosystems. These studies continue, however, against thebackdrop of negative environmental consequences caused by the huge globalexcesses of reactive N. Nonetheless, scientists work to thoroughly understand themechanism of BNF in order to increase the efficiency of manufacturing N fertil-izer. In addition, there is an urgent need to learn how certain N2-fixing plants andspecific microorganisms establish symbiotic and endophytic associations whileothers do not. There is hope that one day scientists might be able to create N2-fixingcorn, wheat, and rice and reduce the use of fertilizer N.
BIOLOGICAL NITROGEN FIXATION
BNF is a process exclusively restricted to the prokaryotes of the domains Archaeaand Bacteria. However, there are many examples of symbiotic associations that
Biological Nitrogen Fixation 367
Ch14-P546807.qxd 11/18/06 7:10 PM Page 367

have developed between eukaryotes and prokaryotes that circumvent the eukaryotes’needs for an exogenous supply of fixed N. Bacteria that use N2 as the sole sourceof N are called diazotrophs. Although only a limited number of bacterial speciesfix N2, they represent a wide variety of phylogenetically and physiologically dis-tinct types that occupy different ecological niches (Table 14.2). These bacteria usediverse energy sources including sunlight (phototrophs), reduced inorganic ele-ments and compounds (lithotrophs), and a plethora of different organic substrates(heterotrophs). They are represented by obligate aerobes and facultative and obli-gate anaerobes. This metabolic diversity indicates that diazotrophs can contributefixed N to other life forms in a wide variety of environments.
BNF is mediated by an enzyme complex called nitrogenase, which is com-posed of two proteins (dinitrogenase and nitrogenase reductase). There are threedifferent forms of nitrogenase that differ in their requirements for molybdenum(Mo), vanadium (V), or iron (Fe) as a critical metallic component of the cofactorassociated with the catalytic site. Most of the nitrogenases that have been studiedextensively contain a Mo cofactor. N2 fixation is an energetically expensive process.Two ATP molecules are required for each electron transferred from nitrogenasereductase to dinitrogenase, which contains the catalytic site. Nitrogenase reductaseis recharged with electrons provided by a protein called ferredoxin or flavodoxin.A total of 16ATP molecules are required to provide the six electrons necessary toreduce 1N2 molecule into 2NH3 because 25% of the energy used to reduce N2 is“lost” in the reduction of 2H� to H2. One mole of H2 is formed per mole of N2
368 Chapter 14 Biological N Inputs
TABLE 14.2 Examples of Genera of Diazotrophic Bacteria Arranged by Mode of EnergyGeneration and the Oxygen Sensitivity of Their Diazotrophy
Energy source Sensitivity of N2 fixation to oxygen Examples (Genera)
Heterotrophic Aerobic diazotrophs Azotobacter, GluconacetobacterMicroaerophilic diazotrophs Azospirillum, Herbaspirillum,
MethylococcusFacultatively aerobic diazotrophs Klebsiella, Paenibacillus,
EnterobacterObligately anaerobic diazotrophs Clostridium, Desulfovibrio,
Methanosarcina
Phototrophic Aerobic diazotrophs (primarily Anabaena, Nostocfilamentous heterocyst-forming cyanobacteria)
Microaerophilic diazotrophs Lyngbya, Oscillatoria(filamentous nonheterocystous cyanobacteria)
Facultatively aerobic diazotrophs Rhodobacter(purple nonsulfur bacteria)
Obligately anaerobic diazotrophs Chromatium(purple sulfur bacteria)
Adapted from Young (1992) by permission of the publisher.
Ch14-P546807.qxd 11/18/06 7:10 PM Page 368

transformed to 2 NH3. Considerable interest has been shown in those diazotrophsthat contain an enzyme called uptake hydrogenase, which reoxidizes H2 to protonsand electrons and salvages the reductant lost in nitrogenase-dependent H2 formation.
The high energy costs of BNF can also be illustrated by comparing the amount ofreduced C oxidized g�1 of N assimilated from either N2 or NH4
�-N (Table 14.3).It can be seen that the cost of assimilating N2-N is about twice that of assimilatingNH4
�-N. Several factors contribute to this high energy cost. In addition to the highATP cost of reducing N2 to NH3, at least 20 genes and their products are neededfor synthesis of a completely functional N2-fixing enzyme system (Table 14.4).The genes involved collectively in synthesis of nitrogenase and the catalyticprocess of N2 fixation are called nif genes. Accessory genes are called fix genes, andthey are also necessary for the function and regulation of nitrogenase in micro-aerobic and aerobic diazotrophic bacteria. The catalytic process of N2 fixation isremarkably slow and inefficient. The two proteins must come together and disso-ciate eight times to reduce one molecule of N2 to two NH3. To compensate for thissluggish mechanism, nitrogenase might account for �10% of total cell protein ina diazotrophic microorganism. Finally, many of the nif gene proteins are dena-tured by oxygen and turnover quickly in an aerobic environment. Replacement ofthese denatured proteins constitutes an additional energy expense.
Because of the extreme sensitivity of nitrogenase to irreversible denaturation byO2, aerobic N2-fixing bacteria have developed various O2 protection mechanisms.For example, some diazotrophic O2-evolving cyanobacteria produce specializedcells called heterocysts under N2-fixing conditions (Fig. 14.2). Heterocysts do notdivide like their neighboring vegetative cells, do not evolve O2 or fix CO2, and uselight energy to provide the energy needed for BNF. A combination of respirationand thick cell walls excludes O2 sufficiently well to protect the dinitrogenase enzymecomplex. In some N2-fixing nonheterocystous cyanobacteria, temporal separationof N2 fixation and O2 evolution results in BNF occurring primarily during dark-ness in the absence of O2 production. At least under C-rich laboratory conditions,aerobic, N2-fixing bacteria such as Azotobacter express a high respiratory rate that
Biological Nitrogen Fixation 369
TABLE 14.3 Energy Costs for Biological N2 Fixation Relative to Assimilation of NH4�-Na
N2-N fixed/gEnergy C source NH4
�-N assimilated/gBacterial species source used (mg) C source used (mg)
Anaerobic growth: Clostridium Sucrose 11 22pasteurianum
Microaerophilic growth: Malate 26 48Azospirillum brasilense
Aerobic growth: Azotobacter Sucrose 7 38vinelandii
aAdapted from Hill (1992) by permission of the publisher.
Ch14-P546807.qxd 11/18/06 7:10 PM Page 369

370 Chapter 14 Biological N Inputs
TABLE 14.4 Nitrogen-Fixing (nif) Genes and Their Products
Gene Product and function
nif H Nitrogenase reductase subunit; binds two molecules of MgATP and reducesnitrogenase by single electron transfer
nif D Nitrogenase protein α subunit of dinitrogenasenif K MoFe protein β subunit of dinitrogenasenif F Flavodoxin, reductant of nitrogenase reductasenif J Pyruvate–flavodoxin oxidoreductase; couples oxidation of pyruvate to reduction of
flavodoxinnifS Pyridoxal-dependent cysteine desulfurase; required for synthesis of active
dinitrogenase and nitrogenase reductasenif U Complements nif S; required for mobilization of Fe and S for metallocluster assembly
and synthesis of active enzymenif V Homocitrate synthase; organic component of FeMo cofactornif N Subunit of nif N2E2, which provides a transient site for the assembly of FeMo cofactornif E Subunit of nif N2E2
nif B FeMo cofactor precursor biosynthesisnifQ Early step in FeMo cofactor biosynthesisnif X Intermediate carrier in FeMo cofactor biosynthesisnif Y Intermediate carrier in FeMo cofactor biosynthesisnif W Required for synthesis of fully active dinitrogenasenif Z Required for synthesis of fully active dinitrogenasenifA Positive regulatory proteinnif L Negative regulatory proteinnif T Unknown functionnaf Y Probably an intermediate carrier in FeMo cofactor biosynthesis
Modified from Dean and Jacobsen (1992) by permission of the publisher.
H
H
FIGURE 14.2 N2-fixing heterocystous cyanobacteria recovered from the water fern Azolla.Heterocysts are designated with the letter “H”. Note the high percentage of heterocysts relative to veg-etative cells. This reflects a high rate of N2 fixation by the cyanobacterium in the symbiotic state withthe Azolla. Courtesy of J. C. Meeks; used by permission.
Ch14-P546807.qxd 11/18/06 7:11 PM Page 370

maintains a low O2 concentration inside the cell. If the O2 level increases quickly,however, nitrogenase interacts with other redox-sensitive proteins in the cell thatinvoke a conformational change that inactivates nitrogenase and prevents its irre-versible damage.
Because NH3, the primary product of N2 fixation, is toxic to cells in high con-centrations, N2-fixing bacteria possess highly efficient mechanisms of NH3 assim-ilation that prevent its accumulation. In most diazotrophs the enzyme combinationof glutamine synthetase (GS) and glutamate synthase (GOGAT) carries out thistask (Eqs. (1) and (2)):
(1)
(2)
As can be seen both ATP and reductant are required at this stage of NH3 assimila-tion and add an additional energy burden to the N2-fixing organism. Because BNF isenergetically expensive, bacteria do not usually fix N2 in the presence of reactive Nsources. A number of mechanisms have been identified whereby nitrogenase activ-ity is inhibited, and nif gene expression is down-regulated in response to increasinglevels of NO3
�, NH4�, and/or amino acid N in the environment (Merrick, 1992).
Many attempts have been made to quantify BNF in both natural and agriculturalecosystems, and the values vary widely (Table 14.5). Two methods are generally
Ketoglutarate Glutamine NADH 2 GlGOGAT� � ⎯ →⎯⎯⎯⎯ uutamine NADox�
Glutamate NH ATP3Glutamine synthetase� � ⎯ →⎯⎯⎯⎯⎯⎯⎯⎯ Glutamine ADP Pi� �
Biological Nitrogen Fixation 371
TABLE 14.5 Range of Rates of BNF Measured under Field Conditions by DifferentDiazotrophic Organisms and Their Associations
Diazotrophic bacteria and their associations N2 fixed (kg ha–1 year–1)
Free-living bacteria (associated with wood decay, straw �1–10decomposition, cyanobacterial mats)
Examples of plant–cyanobacterial associationsCryolithic crusts 10–80Azolla �300
Examples of legume–rhizobial associationsSoybean 60–115Beans 50–100Alfalfa 130–250White clover 200
Examples of nonlegume–Frankia associationsAlder 50–300Ceanothus 50–60Hippophae 10–60
Reprinted from Evans and Barber (1977) by permission of the publisher; copyright AAAS.
Ch14-P546807.qxd 11/18/06 7:11 PM Page 371
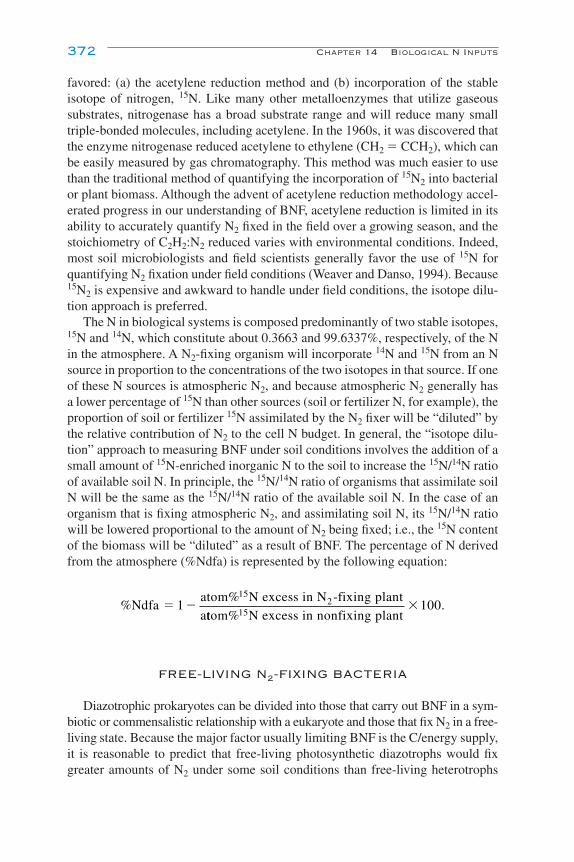
favored: (a) the acetylene reduction method and (b) incorporation of the stableisotope of nitrogen, 15N. Like many other metalloenzymes that utilize gaseoussubstrates, nitrogenase has a broad substrate range and will reduce many smalltriple-bonded molecules, including acetylene. In the 1960s, it was discovered thatthe enzyme nitrogenase reduced acetylene to ethylene (CH2 � CCH2), which canbe easily measured by gas chromatography. This method was much easier to usethan the traditional method of quantifying the incorporation of 15N2 into bacterialor plant biomass. Although the advent of acetylene reduction methodology accel-erated progress in our understanding of BNF, acetylene reduction is limited in itsability to accurately quantify N2 fixed in the field over a growing season, and thestoichiometry of C2H2:N2 reduced varies with environmental conditions. Indeed,most soil microbiologists and field scientists generally favor the use of 15N forquantifying N2 fixation under field conditions (Weaver and Danso, 1994). Because15N2 is expensive and awkward to handle under field conditions, the isotope dilu-tion approach is preferred.
The N in biological systems is composed predominantly of two stable isotopes,15N and 14N, which constitute about 0.3663 and 99.6337%, respectively, of the Nin the atmosphere. A N2-fixing organism will incorporate 14N and 15N from an Nsource in proportion to the concentrations of the two isotopes in that source. If oneof these N sources is atmospheric N2, and because atmospheric N2 generally hasa lower percentage of 15N than other sources (soil or fertilizer N, for example), theproportion of soil or fertilizer 15N assimilated by the N2 fixer will be “diluted” bythe relative contribution of N2 to the cell N budget. In general, the “isotope dilu-tion” approach to measuring BNF under soil conditions involves the addition of asmall amount of 15N-enriched inorganic N to the soil to increase the 15N/14N ratioof available soil N. In principle, the 15N/14N ratio of organisms that assimilate soilN will be the same as the 15N/14N ratio of the available soil N. In the case of anorganism that is fixing atmospheric N2, and assimilating soil N, its 15N/14N ratiowill be lowered proportional to the amount of N2 being fixed; i.e., the 15N contentof the biomass will be “diluted” as a result of BNF. The percentage of N derivedfrom the atmosphere (%Ndfa) is represented by the following equation:
FREE-LIVING N2-FIXING BACTERIA
Diazotrophic prokaryotes can be divided into those that carry out BNF in a sym-biotic or commensalistic relationship with a eukaryote and those that fix N2 in a free-living state. Because the major factor usually limiting BNF is the C/energy supply,it is reasonable to predict that free-living photosynthetic diazotrophs would fixgreater amounts of N2 under some soil conditions than free-living heterotrophs
%Ndfa 1atom% N excess in N -fixing plant
a
152� �
ttom% N excess in nonfixing plant100.
15�
372 Chapter 14 Biological N Inputs
Ch14-P546807.qxd 11/18/06 7:11 PM Page 372

and that the latter would fix measurable amounts of N2 only in the presence of read-ily available plant-derived C, e.g., labile C in the rhizosphere zone of an activelygrowing plant, or during the decomposition of herbaceous and woody plant residuesof high C:N ratio. Facultative and obligately anaerobic diazotrophic bacteria areoften found in decaying wood, where it is assumed that cellulolytic and ligninolyticfungi depolymerize the sugars and phenolics necessary to support diazotrophs(Sylvester and Musgrave, 1991). A similar situation exists in agricultural strawresidues, in which it has been shown that additions of both cellulolytic and dia-zotrophic bacteria enhance BNF and accelerate the decomposition of the N-deficientstraw. It remains extremely difficult to quantify the contribution of BNF by free-living diazotrophs to an ecosystem, even in environments in which BNF can bedetected by the acetylene reduction method. Estimates of free-living BNF in soil andplant residue-enriched environments usually range between �1 and 10 kg N ha�1
year�1, with many natural systems occurring in the lower range of these estimates.
ASSOCIATIVE N2-FIXING BACTERIA
Root secretions and other rhizodepositions are a major source of plant C input tosoil, and diazotrophic bacteria are associated with the roots of plants (Reinhold-Hurek and Hurek, 1998). During the last third of the 20th century, many studiesdemonstrated that a variety of diazotrophic bacteria associate with the roots of trop-ical grasses, notably Paspalum and Digitaria species, where they fix measurableamounts of N2. These bacteria belong to the genera Azospirillum, Herbaspirillum,and Burkholderia. They are found both in the rhizosphere and in the intercellularspaces of the root cortex. It has been claimed these bacteria can provide between 5and 30% of the total N accumulated by the plants. Using the 15N isotope dilutiontechnique, Urquiaga et al. (1992) showed that some Brazilian sugarcane cultivarscould derive �60% of plant N from BNF. A diazotrophic bacterium, Gluconace-tobacter diazotrophicus, was isolated from sugarcane, found to occupy internaltissues at high cell densities (106 to 107 cells g�1) (Fig. 14.3), and could grow onhigh sucrose concentrations (10%) and fix N2 optimally at pH 5.5. Kennedy et al.(2000) showed that a cultivar of sugarcane (SP70-1143) inoculated with a wild-type strain of Glu. diazotrophicus and grown under N-limiting conditions pro-duced a higher biomass and contained more total N than plants inoculated with anif � mutant (cannot fix N2) or that were not inoculated (Table 14.6). When N wasnot limiting, however, both the wild-type and the nif � mutant stimulated greatergrowth and total N content of the plants. Several questions remain unanswered.Although 15N2 was incorporated into plants inoculated with wild-type Glu. dia-zotrophicus, it is unclear what portions of the fixed N remain associated with thebacteria versus being transferred to plant tissues. In addition, it still remains unclearto what extent sugarcane growth enhancement can be attributed to BNF or toimproved sequestration of soil N brought about by production of plant growthhormone-like compounds by Glu. diazotrophicus.
Associative N2-Fixing Bacteria 373
Ch14-P546807.qxd 11/18/06 7:11 PM Page 373

PHOTOTROPHIC BACTERIA
Because BNF is an energy-expensive process, it is not surprising that photosyn-thetic microorganisms are major suppliers of newly fixed N in certain soil ecosys-tems. In rice paddies, for example, cyanobacteria and other photosynthetic bacteriaprovide substantial inputs of N because of the flooded soil conditions early in thegrowing season, the presence of abundant light until canopy closure, adequate phos-phate fertilization, and the low O2 conditions found at the sediment–water inter-face. There is a long history of BNF in rice production in Asia through use of thewater fern Azolla and its cyanobacterial microsymbiont, Anabaena azollae, either asa green manure or in coculture with the rice crop. N inputs of �100 kg N ha�1 year�1
374 Chapter 14 Biological N Inputs
FIGURE 14.3 Scanning electron micrograph of Herbaspirillum seropedicae within themetaxylem of a sugarcane stem. Note that the bacteria are associated closely with the walls of the ves-sel. Courtesy of F. Olivares; used by permission.
TABLE 14.6 Plant Dry Weight and Total N Content of Sugarcane PlantsInoculated with Gluconacetobacter PA15 and a Nondiazotrophic Mutant, Mad3A
Treatment Total plant dry weight (g) Total N content (mg)
Minus fertilizer NUninoculated 5.3d 23.3d
�PA15 8.2c 46.1c
�Mad3A 6.1d 30.7d
With fertilizer NUninoculated 18.1b 116.9b
�PA15 28.3a 160.9a
�Mad3A 23.2a 143.2a
Measurements were made 60 days post-inoculation of plants. Reproduced fromKennedy et al. (2000) by permission of the publisher.
Values followed by different superscript letters are statistically significantlydifferent at p � 0.05.
Ch14-P546807.qxd 11/18/06 7:11 PM Page 374
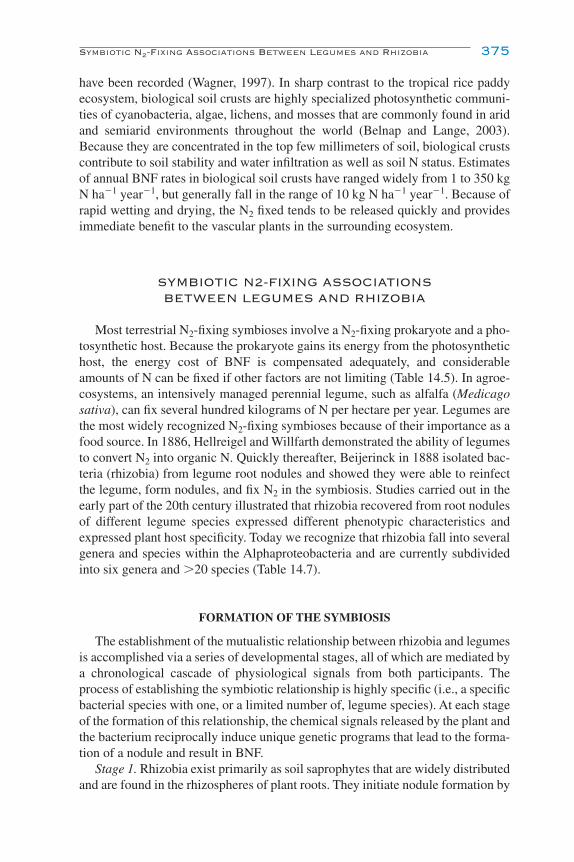
have been recorded (Wagner, 1997). In sharp contrast to the tropical rice paddyecosystem, biological soil crusts are highly specialized photosynthetic communi-ties of cyanobacteria, algae, lichens, and mosses that are commonly found in aridand semiarid environments throughout the world (Belnap and Lange, 2003).Because they are concentrated in the top few millimeters of soil, biological crustscontribute to soil stability and water infiltration as well as soil N status. Estimatesof annual BNF rates in biological soil crusts have ranged widely from 1 to 350 kgN ha�1 year�1, but generally fall in the range of 10 kg N ha�1 year�1. Because ofrapid wetting and drying, the N2 fixed tends to be released quickly and providesimmediate benefit to the vascular plants in the surrounding ecosystem.
SYMBIOTIC N2-FIXING ASSOCIATIONSBETWEEN LEGUMES AND RHIZOBIA
Most terrestrial N2-fixing symbioses involve a N2-fixing prokaryote and a pho-tosynthetic host. Because the prokaryote gains its energy from the photosynthetichost, the energy cost of BNF is compensated adequately, and considerableamounts of N can be fixed if other factors are not limiting (Table 14.5). In agroe-cosystems, an intensively managed perennial legume, such as alfalfa (Medicagosativa), can fix several hundred kilograms of N per hectare per year. Legumes arethe most widely recognized N2-fixing symbioses because of their importance as afood source. In 1886, Hellreigel and Willfarth demonstrated the ability of legumesto convert N2 into organic N. Quickly thereafter, Beijerinck in 1888 isolated bac-teria (rhizobia) from legume root nodules and showed they were able to reinfectthe legume, form nodules, and fix N2 in the symbiosis. Studies carried out in theearly part of the 20th century illustrated that rhizobia recovered from root nodulesof different legume species expressed different phenotypic characteristics andexpressed plant host specificity. Today we recognize that rhizobia fall into severalgenera and species within the Alphaproteobacteria and are currently subdividedinto six genera and �20 species (Table 14.7).
FORMATION OF THE SYMBIOSIS
The establishment of the mutualistic relationship between rhizobia and legumesis accomplished via a series of developmental stages, all of which are mediated bya chronological cascade of physiological signals from both participants. Theprocess of establishing the symbiotic relationship is highly specific (i.e., a specificbacterial species with one, or a limited number of, legume species). At each stageof the formation of this relationship, the chemical signals released by the plant andthe bacterium reciprocally induce unique genetic programs that lead to the forma-tion of a nodule and result in BNF.
Stage 1. Rhizobia exist primarily as soil saprophytes that are widely distributedand are found in the rhizospheres of plant roots. They initiate nodule formation by
Symbiotic N2-Fixing Associations Between Legumes and Rhizobia 375
Ch14-P546807.qxd 11/18/06 7:11 PM Page 375

penetrating a legume root either by infection of root hairs (e.g., clover and pea) or,more rarely, by entry at the sites of lateral root emergence (peanut) or throughpenetration of root primordia found on the stems of some legumes such asSesbania and Aeschynomene. In the case of root-hair infection, the bacteria attach
376 Chapter 14 Biological N Inputs
TABLE 14.7 Genera and Species of the Root Nodule Bacteria of Legumes and Examples of Their Hosts
AllorhizobiumA. undicola (Neptunia)
AzorhizobiumA. caulinodans (Sesbania)
BradyrhizobiumB. canariense (genistoid legumes)B. japonicum (soybean)B. elkanii (soybean)B. liaoningense (soybean)B. spp. (Vigna, Lupinus, etc.)a
MesorhizobiumM. amorphae (Amorpha)M. chacoense (Prosopis)M. ciceri- (Cicer, chickpea)M. huakii- (Astragalus, milkvetch)M. loti- (Lotus, trefoil)M. mediterraneum (Cicer, chickpea)M. plurifarium (tropical trees)
RhizobiumR. etli (bean, Phaseolus)R. galegae (Galega)R. gallicum (bean, Phaseolus)R. giardinii (bean)R. huakuii (Astragalus)R. huautlense (Sesbania)R. indigofera (Indigofera)R. leguminosarum (three biovars nodulate (i) clovers; (ii) peas, lentils, and vetch; (iii) beanR. mongolense (Medicago)R. tropici (bean, Phaseolus, Leucaena)
SinorhizobiumS. americanum (Acacia)S. arboris (tree legumes)S. fredii (soybean)S. kostiense (tree legumes)S. kummerowiae (Kummerowia)S. medicae (annual medics)S. meliloti (alfalfa)S. morelense (Leucaena)S. saheli (Sesbania)S. teranga (Sesbania)
aAlthough many legumes are nodulated by bacteria of the Bradyrhizobium genus, the latter havenot received official species designation. They are referred to by the name of the legume host fromwhich they were isolated (e.g., Bradyrhizobium [Lupinus]).
Ch14-P546807.qxd 11/18/06 7:11 PM Page 376

to the cell wall of the root hair and trigger a series of morphological and physio-logical changes in the latter. Inhibition of cell expansion on one side of the roothair causes it to curl back on itself with the rhizobia attached to the inside surfaceof the curled root hair wall.
Stage 2. Rhizobia pass down the root hair inside a structure known as an infec-tion thread (or tube), which is an invagination of the root hair wall and is clearlyvisible within 2 days of seedling exposure to rhizobia (Fig. 14.4). The infectionthread branches and penetrates into the root cortex, where cortical cells divide andenlarge to form a prenodule in response to the rhizobial invasion.
Stage 3. As the infection thread gets near the dividing cortical cells it formsvarious side branches, each of which eventually comes to a halt at the cell wall ofa cortical cell. At the point of contact, the cell wall dissolves and the rhizobia(10–100 bacterial cells) are delivered into the nodule cell by endocytosis.
Symbiotic N2-Fixing Associations Between Legumes and Rhizobia 377
FIGURE 14.4 Medicago root hair curling and infection thread invasion by rhizobia upon inoc-ulation with Sinorhizobium meliloti. Courtesy of Rene Geurts; used by permission.
Ch14-P546807.qxd 11/18/06 7:11 PM Page 377
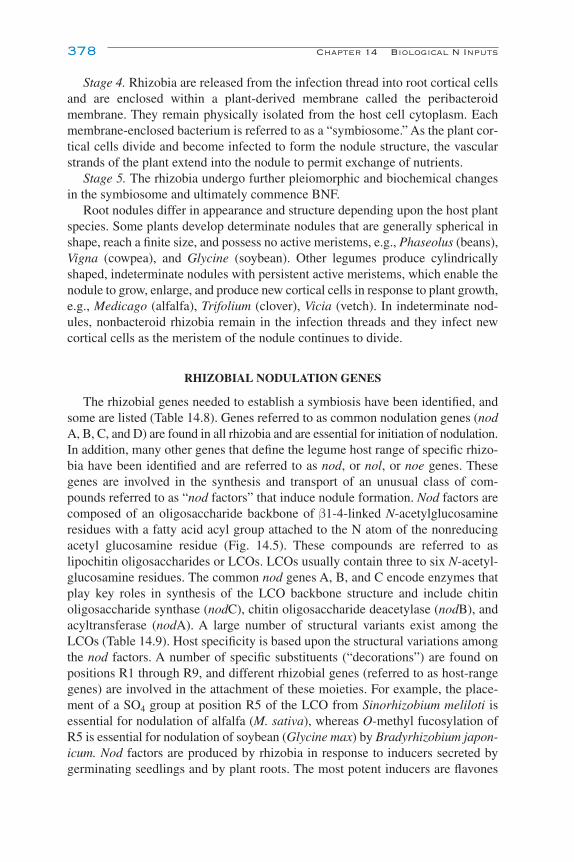
Stage 4. Rhizobia are released from the infection thread into root cortical cellsand are enclosed within a plant-derived membrane called the peribacteroid membrane. They remain physically isolated from the host cell cytoplasm. Eachmembrane-enclosed bacterium is referred to as a “symbiosome.” As the plant cor-tical cells divide and become infected to form the nodule structure, the vascularstrands of the plant extend into the nodule to permit exchange of nutrients.
Stage 5. The rhizobia undergo further pleiomorphic and biochemical changesin the symbiosome and ultimately commence BNF.
Root nodules differ in appearance and structure depending upon the host plantspecies. Some plants develop determinate nodules that are generally spherical inshape, reach a finite size, and possess no active meristems, e.g., Phaseolus (beans),Vigna (cowpea), and Glycine (soybean). Other legumes produce cylindricallyshaped, indeterminate nodules with persistent active meristems, which enable thenodule to grow, enlarge, and produce new cortical cells in response to plant growth,e.g., Medicago (alfalfa), Trifolium (clover), Vicia (vetch). In indeterminate nod-ules, nonbacteroid rhizobia remain in the infection threads and they infect newcortical cells as the meristem of the nodule continues to divide.
RHIZOBIAL NODULATION GENES
The rhizobial genes needed to establish a symbiosis have been identified, andsome are listed (Table 14.8). Genes referred to as common nodulation genes (nodA, B, C, and D) are found in all rhizobia and are essential for initiation of nodulation.In addition, many other genes that define the legume host range of specific rhizo-bia have been identified and are referred to as nod, or nol, or noe genes. Thesegenes are involved in the synthesis and transport of an unusual class of com-pounds referred to as “nod factors” that induce nodule formation. Nod factors arecomposed of an oligosaccharide backbone of β1-4-linked N-acetylglucosamineresidues with a fatty acid acyl group attached to the N atom of the nonreducingacetyl glucosamine residue (Fig. 14.5). These compounds are referred to aslipochitin oligosaccharides or LCOs. LCOs usually contain three to six N-acetyl-glucosamine residues. The common nod genes A, B, and C encode enzymes thatplay key roles in synthesis of the LCO backbone structure and include chitinoligosaccharide synthase (nodC), chitin oligosaccharide deacetylase (nodB), andacyltransferase (nodA). A large number of structural variants exist among theLCOs (Table 14.9). Host specificity is based upon the structural variations amongthe nod factors. A number of specific substituents (“decorations”) are found onpositions R1 through R9, and different rhizobial genes (referred to as host-rangegenes) are involved in the attachment of these moieties. For example, the place-ment of a SO4 group at position R5 of the LCO from Sinorhizobium meliloti isessential for nodulation of alfalfa (M. sativa), whereas O-methyl fucosylation ofR5 is essential for nodulation of soybean (Glycine max) by Bradyrhizobium japon-icum. Nod factors are produced by rhizobia in response to inducers secreted bygerminating seedlings and by plant roots. The most potent inducers are flavones
378 Chapter 14 Biological N Inputs
Ch14-P546807.qxd 11/18/06 7:11 PM Page 378
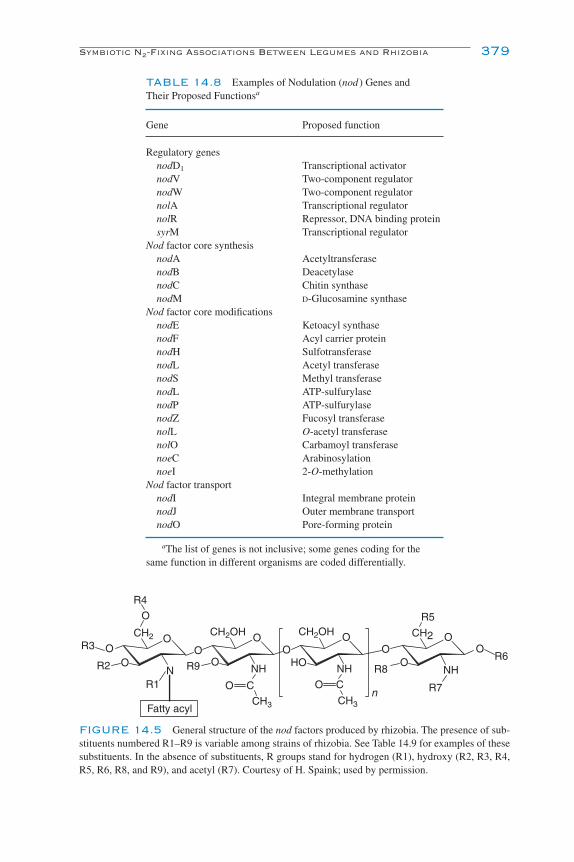
Symbiotic N2-Fixing Associations Between Legumes and Rhizobia 379
TABLE 14.8 Examples of Nodulation (nod ) Genes and Their Proposed Functionsa
Gene Proposed function
Regulatory genesnodD1 Transcriptional activatornodV Two-component regulatornodW Two-component regulatornolA Transcriptional regulatornolR Repressor, DNA binding proteinsyrM Transcriptional regulator
Nod factor core synthesisnodA AcetyltransferasenodB DeacetylasenodC Chitin synthasenodM D-Glucosamine synthase
Nod factor core modificationsnodE Ketoacyl synthasenodF Acyl carrier proteinnodH SulfotransferasenodL Acetyl transferasenodS Methyl transferasenodL ATP-sulfurylasenodP ATP-sulfurylasenodZ Fucosyl transferasenolL O-acetyl transferasenolO Carbamoyl transferasenoeC ArabinosylationnoeI 2-O-methylation
Nod factor transportnodI Integral membrane proteinnodJ Outer membrane transportnodO Pore-forming protein
aThe list of genes is not inclusive; some genes coding for thesame function in different organisms are coded differentially.
R4
R9 R8
R7
R6
R5O
OO
OOO
OHO
OO
O CN
CH2
CH3
CH2OH CH2OH CH2R3
R2
R1
NH
CH3
NH NH
O O O O
Fatty acyl
nO C
FIGURE 14.5 General structure of the nod factors produced by rhizobia. The presence of sub-stituents numbered R1–R9 is variable among strains of rhizobia. See Table 14.9 for examples of thesesubstituents. In the absence of substituents, R groups stand for hydrogen (R1), hydroxy (R2, R3, R4,R5, R6, R8, and R9), and acetyl (R7). Courtesy of H. Spaink; used by permission.
Ch14-P546807.qxd 11/18/06 7:11 PM Page 379
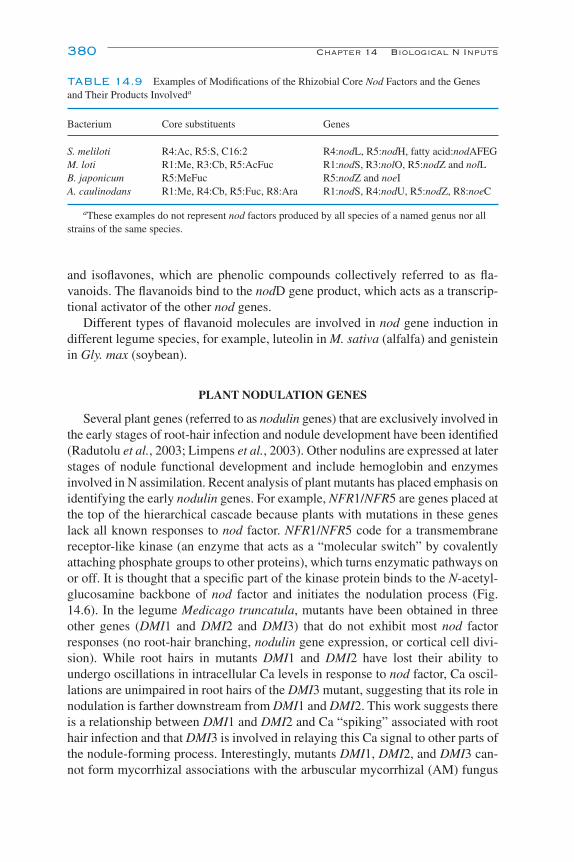
and isoflavones, which are phenolic compounds collectively referred to as fla-vanoids. The flavanoids bind to the nodD gene product, which acts as a transcrip-tional activator of the other nod genes.
Different types of flavanoid molecules are involved in nod gene induction indifferent legume species, for example, luteolin in M. sativa (alfalfa) and genisteinin Gly. max (soybean).
PLANT NODULATION GENES
Several plant genes (referred to as nodulin genes) that are exclusively involved inthe early stages of root-hair infection and nodule development have been identified(Radutolu et al., 2003; Limpens et al., 2003). Other nodulins are expressed at laterstages of nodule functional development and include hemoglobin and enzymesinvolved in N assimilation. Recent analysis of plant mutants has placed emphasis onidentifying the early nodulin genes. For example, NFR1/NFR5 are genes placed atthe top of the hierarchical cascade because plants with mutations in these geneslack all known responses to nod factor. NFR1/NFR5 code for a transmembranereceptor-like kinase (an enzyme that acts as a “molecular switch” by covalentlyattaching phosphate groups to other proteins), which turns enzymatic pathways onor off. It is thought that a specific part of the kinase protein binds to the N-acetyl-glucosamine backbone of nod factor and initiates the nodulation process (Fig.14.6). In the legume Medicago truncatula, mutants have been obtained in threeother genes (DMI1 and DMI2 and DMI3) that do not exhibit most nod factorresponses (no root-hair branching, nodulin gene expression, or cortical cell divi-sion). While root hairs in mutants DMI1 and DMI2 have lost their ability toundergo oscillations in intracellular Ca levels in response to nod factor, Ca oscil-lations are unimpaired in root hairs of the DMI3 mutant, suggesting that its role innodulation is farther downstream from DMI1 and DMI2. This work suggests thereis a relationship between DMI1 and DMI2 and Ca “spiking” associated with roothair infection and that DMI3 is involved in relaying this Ca signal to other parts ofthe nodule-forming process. Interestingly, mutants DMI1, DMI2, and DMI3 can-not form mycorrhizal associations with the arbuscular mycorrhizal (AM) fungus
380 Chapter 14 Biological N Inputs
TABLE 14.9 Examples of Modifications of the Rhizobial Core Nod Factors and the Genesand Their Products Involveda
Bacterium Core substituents Genes
S. meliloti R4:Ac, R5:S, C16:2 R4:nodL, R5:nodH, fatty acid:nodAFEGM. loti R1:Me, R3:Cb, R5:AcFuc R1:nodS, R3:nolO, R5:nodZ and nolLB. japonicum R5:MeFuc R5:nodZ and noeIA. caulinodans R1:Me, R4:Cb, R5:Fuc, R8:Ara R1:nodS, R4:nodU, R5:nodZ, R8:noeC
aThese examples do not represent nod factors produced by all species of a named genus nor allstrains of the same species.
Ch14-P546807.qxd 11/18/06 7:11 PM Page 380

Glomus, implying there are common molecular signals for root infection of plantsby AM fungi and rhizobia. The temporal spectrum of physiological and geneticchanges occurring during nodule organogenesis is just beginning to be under-stood. The emerging picture seems to indicate that nod-signal activities result inchanges of endogenous phytohormone levels and changes in the sensitivity of spe-cific plant tissues to the actions of these phytohormones.
DEVELOPMENT OF BNF AND NITROGEN ASSIMILATORYPROCESSES IN NODULES
Most of the bacterial genes that are specifically induced in bacteroids appear tobe regulated, at least in part, by O2. This is not surprising since, as mentioned ear-lier, the nodule structure and function are designed to provide a microaerobicenvironment for BNF. The outer cortex of the nodule is aerobic but beyond thisregion toward the interior of the nodule there is a significant drop in O2 concen-tration. A low O2 level within the nodule is essential since the nitrogenase enzymeis very O2 labile. However, the low O2 level of the nodule interior creates a paradox-ical situation for the rhizobial symbiont whose metabolism is totally dependent onO2 (i.e., obligate aerobe). To circumvent the problem that rhizobia are obligate
Symbiotic N2-Fixing Associations Between Legumes and Rhizobia 381
Root-hair recognitionof rhizobia
Root-haircurling
Infection-threadgrowth
Infection thread
Rhizobia
Nod factor
NFR1NFR5
LYK3
a b c
FIGURE 14.6 Proposed model of how rhizobial nod factor interacts with the early nodulin proteinsNFR1 and NFR5 to promote root-hair curling. LYK3 is hypothesized to be involved in infection-threadgrowth. Reproduced from Parniske and Downie (2003) by permission of the publisher and the authors.
Ch14-P546807.qxd 11/18/06 7:11 PM Page 381

aerobes and absolutely need O2 to generate ATP, the infected cortical cells of theplant produce an O2-carrying protein called leghemoglobin, which facilitatestransfer of O2 to the bacteroid. In addition, the bacteroid produces a specializedterminal cytochrome oxidase that enables it to respire under low-O2 conditions.
As the rhizobia transform from free-living bacteria into bacteroids, their Cmetabolism is modified so that C is directed into the bacteroid to provide reductantand energy for BNF, and N assimilation is modified so that the plant benefits pri-marily from the BNF and not the rhizobia (Fig. 14.7). Malate and/or succinate arethe carbon sources transported into the bacteroid and used in energy productionand as C skeletons for bacteroid biosynthetic processes. Expression of plant genesinvolved with sucrose metabolism is enhanced in the rhizobia-infected plant cells.There is a severalfold increase in expression of sucrose synthase, which convertsthe photosynthate (sucrose) into precursors for the glycolytic pathway. Glycolysisbreaks down the photosynthate to phosphoenolpyruvate, which can be processedto oxaloacetate and to malate by high levels of phosphoenolpyruvate carboxylaseand malic dehydrogenase in the nodular plant cells.
The bacteroids catabolize malate and use the energy and reductant to produceammonia via BNF. Until recently it was assumed that ammonia was directly trans-ported from the bacteroid for assimilation into amino acids by plant nodule cellsusing GS, GOGAT, aspartate aminotransferase, and asparagine synthase. Waterset al. (1998) showed that B. japonicum bacteroids make alanine via reductive ami-nation of pyruvate and transport it to the nodule cells. High bacteroid activities ofmalic enzyme (which converts malate to pyruvate) are consistent with malate hav-ing a second role of generating pyruvate for assimilation of NH3 into alanine.Hence, ammonia and amino acids (alanine) may be the source(s) of N transferred
382 Chapter 14 Biological N Inputs
Export
AspNH2 Ala
Asp
Oaa
NADNADH
Mal Pyr
Mal
CO2
NH3
PepPhotosynthate
TCA cycle
Reductant�ATP
GlutNH2
GlutNH2N2
→ 2
NH
3
oxoGlut
Glut2 Glut
FIGURE 14.7 Simplified model of carbon and nitrogen metabolism in the bacteroid and theinfected plant cell to illustrate the supply of C and energy from the plant and the assimilation of NH4
�
produced by BNF.
Ch14-P546807.qxd 11/18/06 7:11 PM Page 382

to the plant cell for further processing. In legumes that form indeterminate nod-ules, N is transferred to growth sinks of the plant in the form of basic amino acids,asparagine and glutamine. In contrast, legumes that produce determinate nodulesfurther convert fixed N from basic amino acids into compounds called ureides(allantoic acid, allantoin) that are transported to the growth sinks. Both types of molecules (basic amino acids and ureides) have extremely low C:N ratios andrepresent efficient N-transporting molecules.
SYMBIOTIC ASSOCIATIONS BETWEEN ACTINORHIZALPLANTS AND FRANKIA
Symbiotic associations are formed between the bacterial genus Frankia (grampositive, high G�C, filamentous bacterium) and many nonleguminous plantspecies widely distributed among eight different families and commonly referred toas actinorhizal species (Table 14.10). Well-known plant genera include Alnus,Casuarina, Myrica, Hippophae, Elaeagnus, Ceanothus, and Purshia. These plantsare distributed worldwide and tend to be woody shrubs or trees that colonize N-limited landscapes that are usually in the primary stages of recovery from somedisturbance (wild fire, landslide, flood, and logging). These plants colonize sitesthat range widely in latitude, elevation, and water and nutrient availability, and theamounts of N2 fixed vary considerably (�10 to 300 kg N ha�1 year�1 (Table 14.5)).
In contrast to the first isolation of rhizobia over 100 years ago (1888), Frankiaisolates were first obtained in culture in 1978 (Callaham et al., 1978). Frankia hascontinued to be a notoriously difficult bacterium to isolate from nodules and tostudy in the laboratory; yet, considerable information has been obtained about itby using molecular biological methods that circumvent the need for obtainingpure cultures. Phylogenetic analyses of 16S rDNA and glutamine synthetase genesequences of Frankia strains indicate that the genus belongs to three phylogeneticallydistinct clades or clusters (Fig. 14.8), Clawson et al., 2004). Clade I is represented
Symbiotic N2-Fixing Associations Between Legumes and Rhizobia 383
TABLE 14.10 Families and Genera of N2-FixingPlant–Frankia Actinorhizal Associationsa
Family N2-fixing genera
Betulaceae AlnusCasuarinaceae CasuarinaCoriariaceae CoriariaDatiscaceae DatiscaElaeagnaceae Elaeagnus and HippophaeMyricaceae Myrica and ComptoniaRhamnaceae CeanothusRosaceae Cercocarpus and Purshia
aReprinted from Paul and Clark (1996) by permissionof the publisher.
Ch14-P546807.qxd 11/18/06 7:11 PM Page 383

exclusively by microsymbionts that have been detected in nodules of a wide vari-ety of hosts, but never obtained into culture. Clade II isolates are associated witha few genera of actinorhizal plants (e.g., Casuarina, Alnus, Myrica) that establishtheir symbioses through a root-hair infection process similar to that of legumes.Clade III strains tend to range widely across hosts that primarily practice the inter-cellular infection process.
384 Chapter 14 Biological N Inputs
Comptonia
Myrica
Alnus
Casuarina
Allocasuarina
Gymnostoma
Coriaria
Datisca
Elaeagnus
Hippophae
Shepherdia
Colletia
Discaria
Retanilla
Talguenea
Trevoa
Ceanothus
Dryas
Purshia
Cowania
Chamaebatia
Cercocarpus
Rosaceae
Urticales
Cucurbitales
“Higher” HamamelididaeII
III
I
Plants Frankia symbionts
FIGURE 14.8 Relationships between actinorhizal host genera and three phylogenetically dis-tinct clades of Frankia with emphasis on the mode of root infection that initiates nodule formation. Onthe left of the diagram, thick lines denote plant genera in which root infection occurs via root hairs,thin lines denote plant genera in which infection occurs via intercellular penetration of the root sur-face. On the right side of the diagram, solid lines indicate the presence of typical Frankia strains in nodules of a plant genus. Dashed lines indicate that Frankia clade III strains are rarely found in nodules on these plant genera. Reprinted from Clawson et al. (2004) by permission of the publisher;copyright (2004) Elsevier.
Ch14-P546807.qxd 11/18/06 7:11 PM Page 384
There are many similarities between legumes and actinorhizals in the mode ofplant infection, symbiosis establishment, and N assimilation, but there are also manydifferences. Whereas legume nodules represent stem-like organs, with a periph-eral vascular system and nodule primordia that originate in the root cortex, acti-norhizal nodules consist of modified lateral roots, possess a central vascular system,and arise from nodule primordia originating in the root pericycle. Recently, it wasshown that the expression of some nodulin genes associated with BNF and Nmetabolism is more similar among legumes and intracellularly infected actinorhizalplant species than among the different phylogenetic groups of actinorhizal plants(Pawlowski and Bisseling, 1996). In Frankia, N2 fixation occurs in swellings locatedat the tips of filaments referred to as vesicles. In the symbiotic state, vesicles areproduced in large numbers, with vesicle shape and the degree of septation differ-ing among different host plant species. For example, spherical–septated vesiclesare found in Alnus and elongated–nonseptated vesicles in Coriaria. Interestingly,vesicles are not found in infected cells of Casuarina nodules.
Similar to the legume–rhizobia associations, some actinorhizal plants such asCasuarina and Myrica produce an O2-transporting hemoglobin that correlateswith the presence of an O2 diffusion barrier surrounding infected cells. Most acti-norhizals do not produce hemoglobin, however, and it is generally felt that thevesicle wall of the Frankia itself is the major diffusion barrier to O2. In Coraria,infected cells are surrounded by a suberized periderm layer whose thicknessvaries with O2 concentration.
BIOTECHNOLOGY OF BNF
With the world’s population projected to increase to 8.3 billion by 2025, andthe accompanying demand for plant nutrient N, there will continue to be a need toincrease the contribution of BNF to food and fiber production. As mentioned ear-lier in this chapter, rates of BNF under field conditions vary widely, and there aremany environmental/agronomic factors generally associated with plant nutrition,water availability, and plant disease that hinder N2-fixing species from reachingtheir yield potential under field conditions. We should not overlook the fact thatsome undesirable attributes of N2-fixing species, such as toxin production, alongwith ethnical/historical biases, disfavor their use as major food and fiber sourcesin some parts of the world. The Leguminosae is an enormous plant family distrib-uted worldwide, with 16,000 to 19,000 species in about 750 genera (Allen and Allen,1981). Despite this wealth of diversity, very few legumes have been successfullydomesticated and used worldwide by humans for agricultural purposes. For manyyears attempts to expand the agricultural use of leguminous species beyond theirregions of origin had a checkered history because the appropriate rhizobia werenot always present in the soil. As a consequence, it has been standard practice formany years to inoculate legume seed with appropriate rhizobia before planting alegume species in regions where (a) it has not been grown previously, (b) the
Biotechnology of BNF 385
Ch14-P546807.qxd 11/18/06 7:11 PM Page 385
native flora of the region did not contain legumes that were close relatives of the crop,and (c) an interval of several years exists between the use of a legume in the rotation.Another example of a situation in which inoculation is recommended includesreplacement of an older established cultivar of a legume species with a new disease-resistant variety. The new variety might not form a highly effective symbioticassociation with native rhizobial strains that were effective on the older cultivar.During the 20th century, agronomists and soil microbiologists recognized that manyenvironments in which crop production and soil quality could benefit tremen-dously from BNF contain conditions hostile for survival of rhizobia. As a result,inoculant-quality rhizobial strains are usually prescreened for their ability to tol-erate low pH, high aluminum, high temperature, and desiccation and to be genet-ically stable. Nonetheless, despite our best efforts, we have not yet been able toovercome the facts that many soils contain indigenous or naturalized populationsof rhizobia that are suboptimally effective at BNF on agronomically importantlegumes and that it is extremely difficult to displace them with superior N2-fixingstrains. As scientists make more progress in elucidating the molecular signals neededfor nodulation by rhizobia and infection by mycorrhizal fungi, and with thegenomic sequences of more bacteria and plants becoming available, it is not out-side the realm of possibility that we will learn how to develop other symbiotic/endophytic associations between plants and N2-fixing bacteria. The example ofsugarcane and Glu. diazotrophicus gives hope for a future that includes N2-fixingcereals and other food and fiber crops.
ACKNOWLEDGMENTS
The authors acknowledge the contributions of photographs and figures frommany colleagues who are research specialists in various aspects of BNF. It wouldhave been very difficult to produce this chapter without their assistance.
REFERENCES AND SUGGESTED READING
Allen, O. N., and Allen, E. K. (1981). “Leguminosae: a Source Book of Characteristics, Uses, andNodulation.” Univ. of Wisconsin Press, Madison.
Belnap, J., and Lange, O. L. (2003). “Biological Soil Crusts: Structure, Function and Management.”Ecological Studies Series 150. Springer-Verlag, New York.
Callaham, D., Del Tredici, P., and Torrey, J. G. (1978). Isolation and cultivation in vitro of the actino-mycete causing root nodulation of Comptonia. Science 199, 899–902.
Clawson, M. L., Bourret, A., and Benson, D. R. (2004). Assessing the phylogeny of Frankia–actinorhizal plant nitrogen fixing nodule symbioses with Frankia 16SrRNA and glutamine syn-thetase gene sequences. Mol. Phylogenet. Evol 31, 131–138.
Dean, D. R., and Jacobson, M. R. (1992). Biochemical genetics of nitrogenase. In “BiologicalNitrogen Fixation” (G. Stacey, R. H. Burris, and H. J. Evans, eds.), pp. 763–834. Chapman & Hall,New York.
386 Chapter 14 Biological N Inputs
Ch14-P546807.qxd 11/18/06 7:11 PM Page 386
Evans, H. J., and Barber, L. E. (1977). Biological nitrogen fixation for food and fiber production.Science 197, 332–339.
Galloway, J. N., Aber, J. D., Erisman, J. W., Seitzinger, S. P., Horwath, R. W., Cowling, E. B., andCosby, B. J. (2003). The nitrogen cascade. Bioscience 53, 341–356.
Hill, S. (1992). Physiology of nitrogen fixation in free-living heterotrophs. In “Biological NitrogenFixation” (G. Stacey, R. H. Burris, and H. J. Evans, eds.), pp. 87–134. Chapman & Hall, New York.
Kennedy, C., Lee, S., Sevilla, M., Meletzus, D., Gunapala, N., Gardiol, A., and Davidson, S. (2000).Analysis of genes for nitrogen fixation and studies of plant growth enhancement in the dia-zotrophic endophyte of sugarcane, (Glucon)acetobacter diazotrophicus. In “Nitrogen Fixation:from Molecules to Crop Productivity” (F. O. Pedrosa, M. Hungria, G. Yates, and W. E. Newton,eds.), pp. 401–404. Kluwer Academic, Dordrecht.
Limpens, E., and Bisseling, T. (2003). Signalling in symbiosis. Curr. Opin. Plant Biol. 6, 343–350.Limpens, E., Franken, C., Smit, P., Willemse, J., Bisseling, T., and Geurts, R. (2003). Lys M domain
receptor kinases regulating rhizobial nod factor-induced infection. Science 302, 631–633.Merrick, M. J. (1992). Regulation of nitrogen fixation genes in free-living and symbiotic bacteria. In
“Biological Nitrogen Fixation” (G. Stacey, R. H. Burris, and H. J. Evans, eds.), pp. 835–876.Chapman & Hall, New York.
Parniske, M., and Downie, J. A. (2003). Locks, keys and symbioses. Nature 425, 569–570.Paul, E. A., and Clark, F. E. (1996). Closing the nitrogen cycle. In “Soil Microbiology and
Biochemistry.” 2nd ed. Academic Press, San Diego.Pawlowski, K., and Bisseling, T. (1996). Rhizobial and actinorhizal symbioses: what are the shared
features. Plant Cell 8, 1899–1913.Radutolu, S., Madsen, L., Madsen, E. B., Felle, H. H., Umehara, Y., Grenlund, M., Sato, S., Nakamura,
Y., Tabata, S., Sandal, N., and Stougaard, J. (2003). Plant recognition of symbiotic bacteriarequires two lys M receptor-like kinases. Nature 425, 585–592.
Reinhold-Hurek, B., and Hurek, T. (1998). Life in grasses: diazotrophic endophytes. Trends Microbiol.6, 139–144.
Spaink, H. P. (2000). Root nodulation and infection factors produced by rhizobial bacteria. Annu. Rev.Microbiol. 54, 257–288.
Sylvester, W. B., and Musgrave, D. R. (1991). Free-living diazotrophs. In “Biology and Biochemistryof Nitrogen Fixation” (M. J. Dilworth and A. R. Glenn, eds.), pp. 162–186. Elsevier, New York.
Urquiaga, S., Cruz, K. H. S., and Boddy, R. M. (1992). Contribution of nitrogen fixation to sugar cane:nitrogen-15 and nitrogen-balance estimates. Soil Sci. Soc. Am. J. 56, 105–114.
Vitousek, P. M., Aber, J., Horwath, R. W., Likens, G. E., Matson, P. A., Schindler, D. W., Schlesinger, W. H., and Tilman, D. (1997). Human alterations of the global nitrogen cycle: causesand consequences. Issues Ecol. 1, 1–16.
Wagner, G. M. (1997). Azolla—a review of its biology and utilization. Bot. Rev. 63, 1–26.Waters, J. K., Hughes, B. L., Purcell, L. C., Gerhardt, K. O., Mawhinney, T. P., and Emerich, D. W.
(1998). Alanine, not ammonia, is excreted from N2-fixing soybean nodule bacteroids. Proc. Natl.Acad. Sci. USA 95, 12038–12042.
Weaver, R. W., and Danso, S. K. A. (1994). Dinitrogen fixation. In “Methods of Soil Analysis,” Part 2,“Microbiological and Biochemical Properties” (R. W. Weaver, J. S. Angle, and P. J. Bottomley,eds.), pp. 1019–1045. Soil Sci. Soc. Am., Madison, WI.
Young, J. P. W. (1992). Phylogenetic classification of nitrogen fixing organisms. In “BiologicalNitrogen Fixation” (G. Stacey, R. H. Burris, and H. J. Evans, eds.), pp. 43–86. Chapman & Hall,New York.
References and Suggested Reading 387
Ch14-P546807.qxd 11/18/06 7:11 PM Page 387

Ch14-P546807.qxd 11/18/06 7:11 PM Page 388

15SOIL BIOGEOCHEMICAL
CYCLING OF INORGANIC
NUTRIENTS AND METALS
Alain F. Plante
Introduction
Phosphorus
Sulfur
Micronutrients and Trace Metals
Environmental Significance of P, S, andMetal Biogeochemistry
Conclusion: Microorganisms as Unifiers ofElemental Cycles in Soil
References and Suggested Reading
389
INTRODUCTION
Soil microorganisms have a profound effect on the transformations involved ina large number of biogeochemical cycles other than C and N, such as the macronu-trients phosphorus (P) and sulfur (S), and various micronutrients and environmen-tal pollutants. A conceptual model for the cycling of a generic nutrient or metalelement (Fig. 15.1) illustrates the continuous flow of energy, water, nutrients, andother materials across the ecosystem’s boundaries (from Likens and Bormann,1999). Meteorologic transfers consist of windblown particulate matter, dissolvedsubstances in precipitation, and gases. Geologic fluxes include soluble and partic-ulate matter transported by surface and subsurface water flow and the mass move-ment of mineral materials during events such as erosion, landslides, or lava flows.
Ch15-P546807.qxd 11/18/06 7:12 PM Page 389
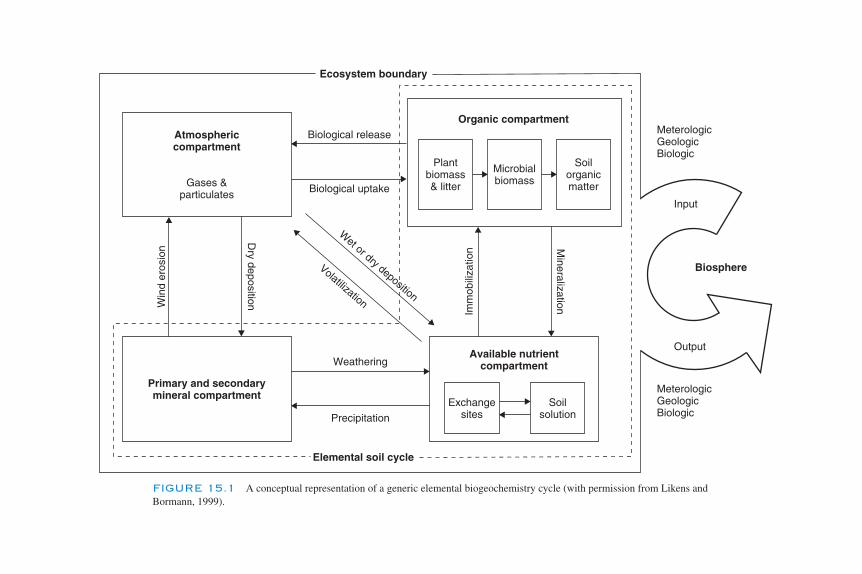
Atmosphericcompartment
Gases &particulates
Primary and secondarymineral compartment
Mineralization
Weathering
Precipitation
Elemental soil cycle
Biological release
Biological uptake
Win
d er
osio
n
Imm
obili
zatio
n
Wet or dry deposition
Volatilization
Available nutrientcompartment
Exchangesites
Soilsolution
MeterologicGeologicBiologic
MeterologicGeologicBiologic
Output
Biosphere
Input
Organic compartment
Plantbiomass& litter
Microbialbiomass
Soilorganicmatter
Ecosystem boundary
Dry deposition
FIGURE 15.1 A conceptual representation of a generic elemental biogeochemistry cycle (with permission from Likens andBormann, 1999).
Ch15-P546807.qxd 11/18/06 7:12 PM Page 390

Biologic fluxes result when chemicals or energy gathered by organisms in oneecosystem are deposited in another (e.g., entrainment of litter material from abovethe soil surface to subsurface layers). The nutrient or metal element may occur infour compartments within the soil ecosystem: (1) atmosphere, (2) living and deadorganic matter, (3) available nutrients, and (4) primary and secondary minerals.Microbially mediated reactions that transform these elements include: (1) miner-alization and immobilization, reactions that transform the element from organic toinorganic and inorganic to organic forms, respectively; (2) reduction and oxida-tion, reactions that involve the transfer of electrons; (3) solubilization, reactionsby which relatively insoluble materials are rendered soluble and therefore avail-able to plants or microorganisms; (4) volatilization, reactions that transform an ele-ment to a volatile or gaseous form; and (5) detoxification, reactions that reduce thetoxicity of an element to the microorganism in question. The last group of reac-tions includes redox reactions as well as alkylation reactions.
The ability of soil microorganisms to oxidize or reduce several elements haslikely developed in response to changing environments over the course of evolutionand is now evident in gradient environments such as soil where O2 is more or lessavailable due to water- versus air-filled porosity (Fig. 15.2). In aerobic environ-ments, stoichiometry may integrate other element cycles, but energy generation isdominated by a union between the C and the O cycles. However, when the redoxpotential (Eh) decreases, a number of other element cycles become more closelyintegrated as alternative electron acceptors (e.g., Fe3�, Mn4�, NO3
�, SO42�) are
utilized by various groups of organisms in microbially mediated oxidation and reduc-tion reactions. An example of element cycle integration is the autotrophic faculta-tive anaerobic bacterium Thiobacillus denitrificans, which is capable of oxidizingsulfide to elemental S using nitrate as its electron acceptor and carbon dioxide asits sole C source under anoxic conditions. The organism can accumulate S extra-cellularly and converts the nitrate to nitrogen gas. Other examples of elementcycle integrations are illustrated under Environmental Significance of P, S, andMetal Biogeochemistry, in which several examples of the unification of Fe and Scycles during the processes of acid mine drainage formation and corrosion aregiven. Our improved understanding of the role of microorganisms in the biogeo-chemistry of many elements, through the application of modern molecular andgenetic tools, will certainly continue to contribute to the development of strategiesto protect the environment from contamination and to extract and recycle valuableresources in a sustainable manner.
PHOSPHORUS
THE SOIL PHOSPHORUS CYCLE
Nitrogen and phosphorus are the elements that most often limit biological pro-ductivity. While the major source of N is atmospherically derived, P is primarily
Phosphorus 391
Ch15-P546807.qxd 11/18/06 7:12 PM Page 391
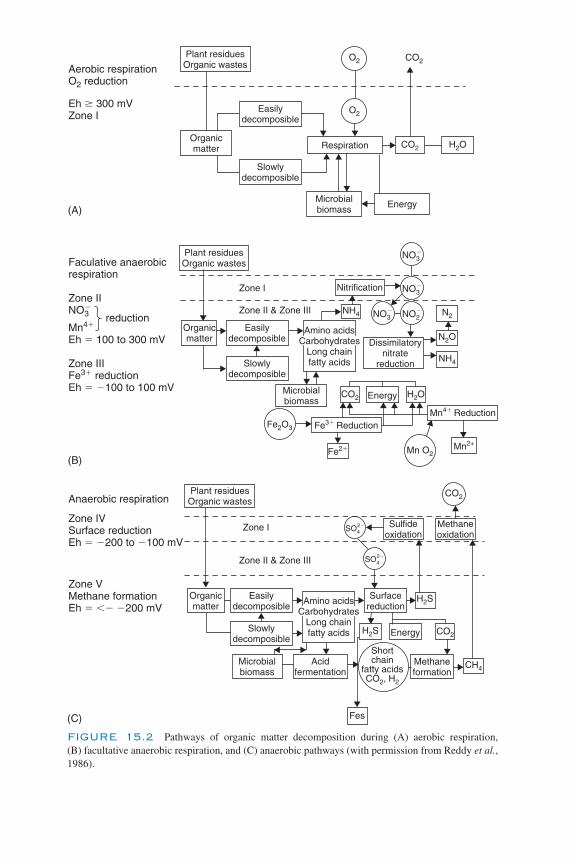
O2
O2
CO2
N2
Mn O2
Fe2O3
CO2
NH4
NH4
CO2
H2O
N2O
H2O
NO2�NO3
�
CO2
NO3�
NO3�
Plant residuesOrganic wastes
Plant residuesOrganic wastes
Plant residuesOrganic wastes
Easilydecomposible
Slowlydecomposible
Organicmatter
Organicmatter
Surfacereduction
Respiration
Microbialbiomass Energy
Nitrification
Dissimilatorynitrate
reduction
Energy
CO2
H2S
H2S Energy
SO42�
SO42�
Zone I
Zone I
Zone II & Zone III
Easilydecomposible
Slowlydecomposible
Sulfideoxidation
Methaneoxidation
Microbialbiomass
Zone II & Zone III
Shortchain
fatty acidsCO2, H2
Methaneformation
CH4
Fes
Easilydecomposible
Slowlydecomposible
Organicmatter
(A)
Aerobic respirationO2 reduction
Eh � 300 mVZone I
(B)
(C)
Faculative anaerobicrespiration
Zone IINO3
�
Mn4�
Eh � 100 to 300 mV
Zone IIIFe3� reductionEh � �100 to 100 mV
reduction
Anaerobic respiration
Zone IVSurface reductionEh � �200 to �100 mV
Zone VMethane formationEh � �� �200 mV
Amino acidsCarbohydrates
Long chainfatty acids
Amino acidsCarbohydrates
Long chainfatty acids
Fe3� ReductionMn4� Reduction
Microbialbiomass
Acidfermentation
Fe2� Mn2+
FIGURE 15.2 Pathways of organic matter decomposition during (A) aerobic respiration, (B) facultative anaerobic respiration, and (C) anaerobic pathways (with permission from Reddy et al.,1986).
Ch15-P546807.qxd 11/18/06 7:12 PM Page 392
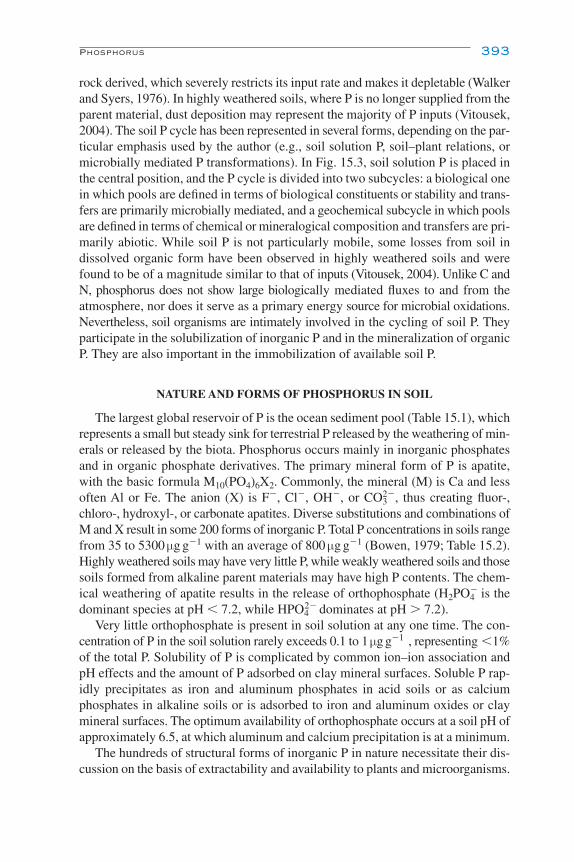
rock derived, which severely restricts its input rate and makes it depletable (Walkerand Syers, 1976). In highly weathered soils, where P is no longer supplied from theparent material, dust deposition may represent the majority of P inputs (Vitousek,2004). The soil P cycle has been represented in several forms, depending on the par-ticular emphasis used by the author (e.g., soil solution P, soil–plant relations, ormicrobially mediated P transformations). In Fig. 15.3, soil solution P is placed inthe central position, and the P cycle is divided into two subcycles: a biological onein which pools are defined in terms of biological constituents or stability and trans-fers are primarily microbially mediated, and a geochemical subcycle in which poolsare defined in terms of chemical or mineralogical composition and transfers are pri-marily abiotic. While soil P is not particularly mobile, some losses from soil indissolved organic form have been observed in highly weathered soils and werefound to be of a magnitude similar to that of inputs (Vitousek, 2004). Unlike C andN, phosphorus does not show large biologically mediated fluxes to and from theatmosphere, nor does it serve as a primary energy source for microbial oxidations.Nevertheless, soil organisms are intimately involved in the cycling of soil P. Theyparticipate in the solubilization of inorganic P and in the mineralization of organicP. They are also important in the immobilization of available soil P.
NATURE AND FORMS OF PHOSPHORUS IN SOIL
The largest global reservoir of P is the ocean sediment pool (Table 15.1), whichrepresents a small but steady sink for terrestrial P released by the weathering of min-erals or released by the biota. Phosphorus occurs mainly in inorganic phosphatesand in organic phosphate derivatives. The primary mineral form of P is apatite,with the basic formula M10(PO4)6X2. Commonly, the mineral (M) is Ca and lessoften Al or Fe. The anion (X) is F�, Cl�, OH�, or CO3
2�, thus creating fluor-,chloro-, hydroxyl-, or carbonate apatites. Diverse substitutions and combinations ofM and X result in some 200 forms of inorganic P. Total P concentrations in soils rangefrom 35 to 5300 µg g�1 with an average of 800 µg g�1 (Bowen, 1979; Table 15.2).Highly weathered soils may have very little P, while weakly weathered soils and thosesoils formed from alkaline parent materials may have high P contents. The chem-ical weathering of apatite results in the release of orthophosphate (H2PO4
� is thedominant species at pH � 7.2, while HPO4
2� dominates at pH � 7.2).Very little orthophosphate is present in soil solution at any one time. The con-
centration of P in the soil solution rarely exceeds 0.1 to 1 µg g�1 , representing �1%of the total P. Solubility of P is complicated by common ion–ion association andpH effects and the amount of P adsorbed on clay mineral surfaces. Soluble P rap-idly precipitates as iron and aluminum phosphates in acid soils or as calciumphosphates in alkaline soils or is adsorbed to iron and aluminum oxides or claymineral surfaces. The optimum availability of orthophosphate occurs at a soil pH ofapproximately 6.5, at which aluminum and calcium precipitation is at a minimum.
The hundreds of structural forms of inorganic P in nature necessitate their dis-cussion on the basis of extractability and availability to plants and microorganisms.
Phosphorus 393
Ch15-P546807.qxd 11/18/06 7:12 PM Page 393
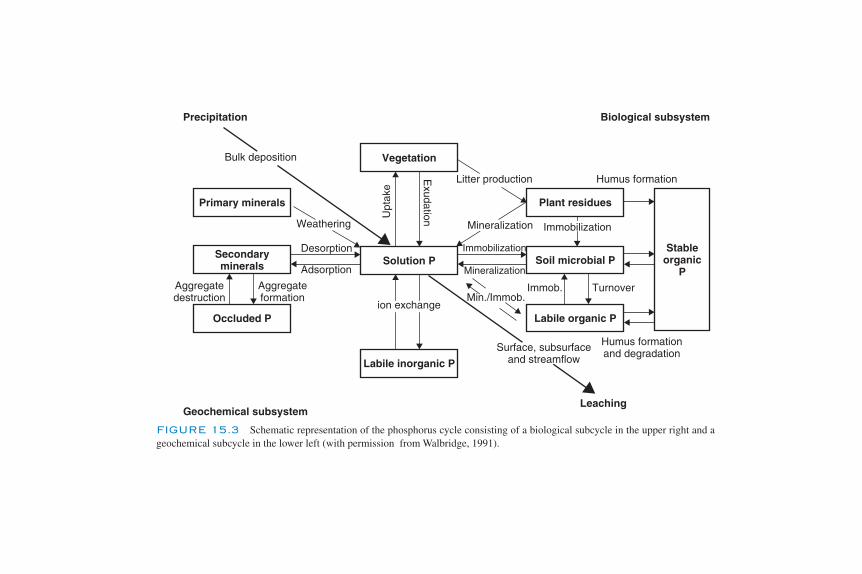
Leaching
Vegetation
Precipitation
Solution P
Labile inorganic P
Primary minerals
Occluded P
Secondaryminerals
Geochemical subsystem
Plant residues
Soil microbial P
Labile organic P
Stableorganic
P
Biological subsystem
Weathering
Upt
ake
Exudation
Desorption
Adsorption
Immobilization
Mineralization
Aggregatedestruction
Aggregateformation
ion exchange
Surface, subsurfaceand streamflow
Min./Immob.
Mineralization
Litter production
Bulk deposition
Humus formation
Humus formationand degradation
TurnoverImmob.
Immobilization
FIGURE 15.3 Schematic representation of the phosphorus cycle consisting of a biological subcycle in the upper right and ageochemical subcycle in the lower left (with permission from Walbridge, 1991).
Ch15-P546807.qxd 11/18/06 7:12 PM Page 394

When P is added to soil as a soluble salt (fertilizer), it becomes fixed or bound tothe extent that very little of the added P is reextractable with water. Hedley et al.(1982) developed a sequential extraction procedure to separate soil P into inorganicand organic pools based on their availability to plants. The major fraction of P isnot extractable by dilute acids or bicarbonate solution. This portion of the retainedP is commonly designated as fixed P. The portion that is extractable by dilute acidor bicarbonate is designated as available P; it is considered to be the amount of soilP available for uptake by living organisms. Available P measured using this approachis partly inorganic and partly organic. That portion of the total P in soil that is resinextractable is designated as exchangeable P, defined as that fraction of the soil Pthat can enter solution by isoionic exchange during a given time span.
Phosphorus in organic molecules constitutes 30–50% of the total P in mostsoils, ranging from as low as 5% to as high as 95%. Despite the importance of soilorganic P, its chemical nature has not been fully characterized. This is due in part toanalytical limitations, as there are no direct methods to characterize soil organic
Phosphorus 395
TABLE 15.1 Major Reservoirs of Phosphorus in the Eartha
Reservoir Total phosphorus (�1015g)
Atmosphere (particulates) 0.000028Land
Soil 96–160Mineable rock (high apatite) 19Biota 2.6Fresh water (dissolved) 0.090
OceanSediments 840,000Dissolved (organic) 80Detritus (particulates) 0.65Biota 0.050–0.12
aWith permission from Bolin et al. (1983).
TABLE 15.2 Total and Organic Phosphorus Concentrations in theSurface Layer (0–10 cm) of Some North American Grassland Soils
Site Total P (µg g�1) Organic P (µg g�1)
Cottonwood, South Dakota, USA 554 310Bridger, Montana, USA 1234 675Osage, Kansas, USA 251 227Ale, Washington, USA 748 29Jornado, New Mexico, USA 445 37Pantex, Texas, USA 94 239Bison, Manitoba, Canada 835 582Pawnee, Colorado, USA 345 131
Ch15-P546807.qxd 11/18/06 7:12 PM Page 395
P. Even solid-state phosphorus-31 nuclear magnetic resonance (31P NMR) spec-troscopy cannot detect organic P in soil because of poor sensitivity and interferencefrom paramagnetic ions. Organic P must therefore be extracted from soil before itcan be quantified and identified (see Turner et al., 2005). Organic P occurs in soilprincipally as phytates or related forms, nucleic acids and their derivatives, andphospholipids (Fig. 15.4). Phytin, primarily polymeric inositol hexaphosphate, issynthesized by plants and accounts for roughly 40% of the organic P found in soil.Some of the polymers are believed to be of microbial origin. Some yeasts synthe-size phosphorylated polymers of mannose and the cell walls of G� bacteria containboth techoic acid, a polymer of ribitol phosphate and glycerophosphate, and a 6-phosphate muramic acid. Lower weight inositol ring compounds carrying one tofive atoms of P also occur in soil and probably represent degradation products ofinositol hexaphosphate.
Constituent parts of nucleic acid molecules are identifiable in hydrolysates ofsoil extracts. These include cytosine, adenine, guanine, uracil, hypoxanthine, andxanthine. The last two are decomposition products of guanine and adenine. Of thetotal organic P in soil, only about 1% can be identified as nucleic acids or their deriv-atives. The susceptibility of nucleic acids to decomposition, together with a lackof incorporation into stable organic matter, is believed to be responsible for theirlow level of occurrence in soil. Extracellular DNA sorbed to soil mineral surfacespersists from 100 to 1000 times as long as free DNA. This mineral-associated DNAis considered to provide for natural genetic transformation of bacteria.
Organic P in alcohol and ether extracts of soil is indicative of the presence ofphospholipids. Choline has been identified; it is one of the products of hydrolysisof lecithin. Most of the glycerophosphate found in soil is believed to be of lipidorigin. Phospholipid P accounts for a similarly low fraction of the soil organic Pas does nucleic acid P. Even smaller amounts of sugar phosphates are found.These are easily decomposable and therefore, together with nucleic acid and phos-pholipid P, cannot be considered as contributing significantly to the estimates of350 to 2000 years as the mean residence time for total organic P in a prairie soil.
While the sizes of the organic P pools in soil generally occur in the order inositolphosphate � polymer organic phosphate � nucleic acid P � phospholipid P, theconcentrations of these pools within the soil biota occur in the reverse sequence.Next to N, P is the most abundant nutrient contained in the microbial biomass.Brookes et al. (1982) developed a method to measure P within the soil microbialbiomass using chloroform (CHCl3) fumigation followed by extraction with NaHCO3
and relating the measured P to the P extracted from an aliquot not treated withCHCl3. Work with soils having pH of 6.2 to 8.2 showed a recovery (Kp) of 40% ofadded 32P-labeled cells, suggesting a calculation of microbial P as
microbial P � (CHCl3 P � control P)/Kp,
where Kp � 0.4. Microbial biomass P concentrations of 5 to 75 µg P g�1 soil werereported, representing from 2 to 5% of the total organic phosphorus in cultivatedsoil and up to 20% in grassland and forested soils.
396 Chapter 15 Soil Biogeochemical Cycling of Inorganic Nutrients
Ch15-P546807.qxd 11/18/06 7:12 PM Page 396

BIOLOGICAL IMPORTANCE OF PHOSPHORUS
Phosphorus is an element essential to life. It plays both structural and func-tional roles in virtually all organisms and is found in cell components such asphospholipids, nucleic acids, and DNA as described above. Phosphorus, through
Phosphorus 397
HO
HO
HO
OH
OH
OH
HO
HO
HO
H
H
H
H
HOH OH
OH
H
OH OH OH
OH
OH
HO
OH
OH
O
OH
(a) Inositol
P
O
O
O
O
O
O
OC
C
COO�
C
R
R' O
O O P
O H
O�
O
R
R'
O
O
O O
O
�O
CH2
POCH2
POCH2
CH2OH
CH2
CH2H2C
CH3
H2N
H2C
HC
CH
O
OC
C
R
R' O
O O P
O
O�
O�
O�
�O
O� O�
O�
O� O
CH2
CH2 CH2H2C
CHC
C
(b) Phosphatidyl inositol
(b) Phosphatidyl serine
(b) Phosphatidyl choline
NH3
NH2
�
N�(CH3)3
P
OO
OHH
O
O
CN N
N N
CC
C C
CH
HC
NC
POCH2
O�
�O
O
O
O
H H HOHH
H
H OH
HO
O O
O
CH2OH
P O
O
P
O
HOH uridine
(c) Ribose 5-phosphate (c) Galactose1-phosphate (c) UDP galactose
O
HCCH
N
N
CH
HN
Ribose-P
(d) Thymidine 5�-phosphate(TMP)
(d) Adenosine 5�-phosphate(AMP)
(d) Aminoimidazole ribonucleotide
H H H H
FIGURE 15.4 Organic phosphorus compounds. (a) Inositol. If given six phosphorus substitutionson the ring (C–P linkages), it becomes inositol hexaphosphate. Fewer substitutions yield 1-, 2-, 3-, 4-,or 5-phosphatidyl inositol phosphates. (b) Phosphoglycerides (C–O–P linkages), shown linked to ser-ine. (c) Phosphate sugars. (d) Nucleic acid components.
Ch15-P546807.qxd 11/18/06 7:12 PM Page 397
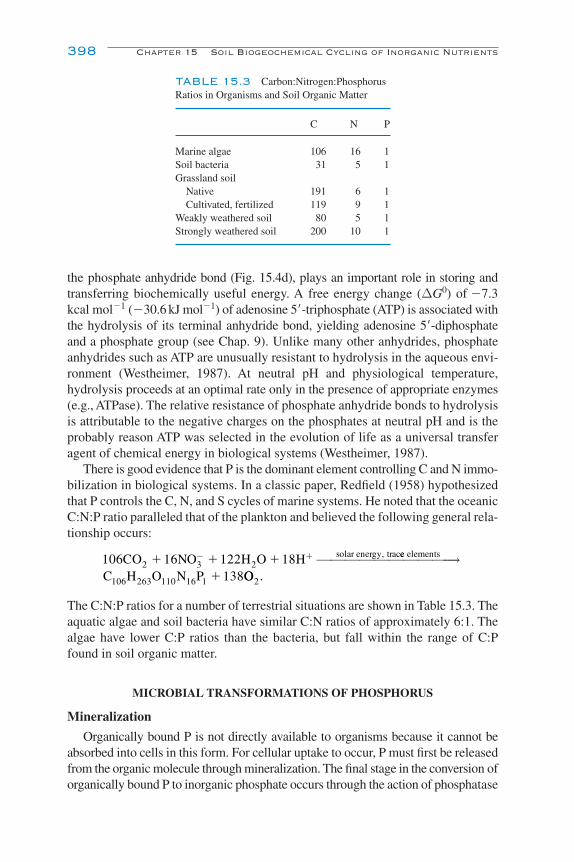
the phosphate anhydride bond (Fig. 15.4d), plays an important role in storing andtransferring biochemically useful energy. A free energy change (∆G0) of �7.3kcal mol�1 (�30.6 kJ mol�1) of adenosine 5�-triphosphate (ATP) is associated withthe hydrolysis of its terminal anhydride bond, yielding adenosine 5�-diphosphateand a phosphate group (see Chap. 9). Unlike many other anhydrides, phosphateanhydrides such as ATP are unusually resistant to hydrolysis in the aqueous envi-ronment (Westheimer, 1987). At neutral pH and physiological temperature,hydrolysis proceeds at an optimal rate only in the presence of appropriate enzymes(e.g., ATPase). The relative resistance of phosphate anhydride bonds to hydrolysisis attributable to the negative charges on the phosphates at neutral pH and is theprobably reason ATP was selected in the evolution of life as a universal transferagent of chemical energy in biological systems (Westheimer, 1987).
There is good evidence that P is the dominant element controlling C and N immo-bilization in biological systems. In a classic paper, Redfield (1958) hypothesizedthat P controls the C, N, and S cycles of marine systems. He noted that the oceanicC:N:P ratio paralleled that of the plankton and believed the following general rela-tionship occurs:
The C:N:P ratios for a number of terrestrial situations are shown in Table 15.3. Theaquatic algae and soil bacteria have similar C:N ratios of approximately 6:1. Thealgae have lower C:P ratios than the bacteria, but fall within the range of C:Pfound in soil organic matter.
MICROBIAL TRANSFORMATIONS OF PHOSPHORUS
Mineralization
Organically bound P is not directly available to organisms because it cannot beabsorbed into cells in this form. For cellular uptake to occur, P must first be releasedfrom the organic molecule through mineralization. The final stage in the conversion oforganically bound P to inorganic phosphate occurs through the action of phosphatase
106CO 16NO 122H O 18H2 3 2solar energy, trac� � �� � ee elements
106 263 110 16 1C H O N P 138⎯ →⎯⎯⎯⎯⎯⎯⎯⎯⎯
� OO2.
398 Chapter 15 Soil Biogeochemical Cycling of Inorganic Nutrients
TABLE 15.3 Carbon:Nitrogen:PhosphorusRatios in Organisms and Soil Organic Matter
C N P
Marine algae 106 16 1Soil bacteria 31 5 1Grassland soil
Native 191 6 1Cultivated, fertilized 119 9 1
Weakly weathered soil 80 5 1Strongly weathered soil 200 10 1
Ch15-P546807.qxd 11/18/06 7:12 PM Page 398

enzymes. The phosphatase group of enzymes includes phytase enzymes that cat-alyze the release of phosphate from phytin and nuclease enzymes that liberate phos-phate from nucleic acids. These enzymes are produced by up to 70–80% of themicrobial population, including bacteria such as Bacillus megaterium, B. subtilis,Serratia spp., Proteus spp., Arthrobacter spp., and Streptomyces spp. and fungi suchas Aspergillus spp., Penicillium spp., Rhizopus spp., and Cunninghamella spp. OnceP is mineralized, it can be taken up by plants, immobilized by the microbial biomass,precipitated in inorganic complexes, or sorbed to mineral surfaces.
Immobilization
Soil microorganisms can cause fixation or immobilization of P, either by pro-moting the formation of inorganic precipitates or by assimilation into organic cellconstituents or intracellular polyphosphate granules. In soils and freshwater sedi-ments, cellular immobilization is important, though fixation of P by Ca2�, Al3�, orFe3� has been observed. In some marine sediments, where phosphorite mineralsoccur, the precipitation mechanism is more important. Microorganisms are indi-rectly involved in phosphorite precipitation by making reactive phosphate available,by making reactive calcium available, or by creating or maintaining the environ-mental conditions that favor phosphate precipitation.
The extent of immobilization of P is affected by the C:P ratio of the organic mate-rials being decomposed and the amount of available P in solution. If insufficient P isavailable in the substrate for assimilation of the substrate C, inorganic P from the soilsolution will be used and net immobilization occurs. Generally, a C:P � 200 willresult in net mineralization, a C:P � 300 results in net immobilization, and C:Pratios between 200 and 300 result in little net change in soluble P concentrations.
Oxidation and Reduction
A number of soil bacteria and fungi have been shown to be capable of oxidizingreduced phosphorus compounds (e.g., phosphite, hypophosphite) either aerobically(Adams and Conrad, 1953) or anaerobically (Foster et al., 1978). The biochemicalpathway for such a microbially mediated reaction has been characterized molecu-larly and genetically, providing some evidence for a previously underappreciatedmicrobial redox cycle for P. The relatively high solubility in water of phosphites,hypophosphites, and phosphonates suggests they may have been important pre-cursors of biochemical P compounds, but the fact that there have been only tracequantities of phosphite and hypophosphite detected in the current environmentsuggests that the existence of microbial pathways of P oxidation might representan ancient evolutionary property (Foster et al., 1978; Schink and Friedrich, 2000).
There is increasing appreciation in the literature for the presence of reducedforms of P such as phosphine (PH3), phosphites, and organic phosphonates, whichprovide a small gaseous link to the P cycle (Glindemann et al., 2005). Microbiallymediated reduction of phosphate remains a controversial topic in the literature (seeMorton and Edwards, 2005; Roels and Verstraete, 2001). The controversy is fueledby thermodynamic calculations that show that the reduction of phosphate is ener-getically unfavorable. However, this does not imply that reduced P compounds
Phosphorus 399
Ch15-P546807.qxd 11/18/06 7:12 PM Page 399
cannot be formed biogenically because other linked mechanisms exist in nature bywhich energetically unfavorable reactions, such as N2 fixation, can occur.
Solubilization
The low solubility of P in soils makes it one of the major nutrients limiting plantgrowth. Frequent applications of soluble forms of P are needed, more than reallynecessary, because only a fraction is used by plants while the rest rapidly formsinsoluble complexes. Traditional P fertilizer production is based on chemical pro-cessing of insoluble mineral phosphate ore, which is expensive and environmen-tally undesirable. In areas where commercially produced P fertilizer is too costly,the microbial solubilization of phosphate rock is seen as a viable alternative (seeWhitelaw, 2000). In India, for example, there is an estimated 40 million tons of P-containing rock deposits that could provide a cheap source of P fertilizer. Onestrategy currently used is to mix rock phosphates with various plant residues in a composting mixture. In some cases, the compost is enriched with known P-solubilizing bacteria. The development of agricultural inoculants has been dif-ficult and knowledge of the genetics of phosphate solubilization is still sparse(Rodriguez et al., 2006).
Phosphate-solubilizing microorganisms are suspected to convert the insolublerock phosphates into soluble forms through the processes of acidification, chela-tion, and exchange reactions, but uncertainty remains concerning the detailedmechanisms, which may be organism-dependent. Carbonic acid and HCO3
� derivedfrom respiratory CO2 are of prime importance in the weathering of soil minerals,but there is poor correlation between CO2 levels and dissolution of apatite. Illmerand Schinner (1995) showed that Aspergillus niger produced citrate, oxalate, andgluconate and suggested that organic acid production may be an important mech-anism for solubilizing aluminum phosphates, but not the only effective mecha-nism. They found that other organisms, such as Penicillium aurantiongriseum andPseudomonas sp. (PI18/89), were effective at solubilizing aluminum or calciumphosphates without producing organic acids. Proton release associated with respi-ration or ammonium assimilation was proposed as the mechanism responsible.Organic acids produced in the rhizosphere by plant roots and associated microor-ganisms may act as chelating agents. These organic chelates form complexes withCa, Fe, or Al, thereby releasing the phosphates to solution. It is currently impos-sible to select any given mechanism from the alternatives, and some researchershave questioned whether sufficient acidity or chelating agents can be generatedmicrobially to appreciably affect P solubility.
SULFUR
THE SOIL SULFUR CYCLE
The terrestrial S cycle involves significant interactions between the pedosphere,the hydrosphere, the biosphere, and the atmosphere. The S cycle (Fig. 15.5) is
400 Chapter 15 Soil Biogeochemical Cycling of Inorganic Nutrients
Ch15-P546807.qxd 11/18/06 7:12 PM Page 400

similar to the soil N cycle, and unlike P, these elements undergo chemical andmicrobially mediated transformations leading to volatilization. Not only is thebiosphere a repository for highly mobile forms of S, but several key reactions of thecycle are accelerated by, and sometimes completely controlled by, microbiologicalactivity. The soil microbial biomass acts as the driving force behind mineralization–immobilization and oxidation–reduction transformations. The primary input ofS to soil occurs during the weathering of soils, which releases sulfate into theavailable pool. Other inputs include plant residue inputs, S fertilizer, pesticides, andirrigation water. Atmospheric deposition can be a significant input of S in areasaffected by atmospheric pollution due to combustion of fossil fuels. Losses of S fromthe soil system include plant uptake and harvesting of residues, long-term fixationinto minerals, leaching of soluble sulfate, and gaseous losses of volatile forms of S.
Sulfur 401
Mineral form
ation
Soil organic SC–O–SC–N–S
C–S
Plant SAmino acids
GlucosinalitesGalactan-SO4
2 �
Microbial SAmino acids
Choline SO42 �
Elemental S
Min
eral
izat
ion
Oxidation
Phototrophic
Respiratory or dissimilatory reduction
Chemotrophic
Serine
sulfh
ydra
se
Assim
ilatio
n
Absorption
Esterases, mineralization
S2O32 �
FeS
CaSO42H2OGypsum
FeS2
Sorbed-SO42 �
Aluminum hydroxysulfates
SO42 �
LakesGround water
Leac
hing
Pre
cipi
tatio
n
Inorganic SSO4
2 �HS� S0
storage
Ester
Sulfate form
ation
Assim
ilatory reduction
Rai
nD
ry d
epos
ition
SO2
FIGURE 15.5 Sulfur (S) transformations in nature. Elemental sulfur is shown as a storageproduct, and the possibility of sulfate sorption in certain soils is included.
Ch15-P546807.qxd 11/18/06 7:12 PM Page 401

NATURE AND FORMS OF SULFUR IN SOIL
The largest global reservoir of S is the lithosphere (Table 15.4). The atmos-pheric content of S represents a relatively small pool, but one that has increasedsignificantly in recent times due to the burning of fossil fuels. Atmospheric emis-sions of S peaked at approximately 70 million metric tons (70 Tg) on an annualbasis in the mid- to late-1980s. The result is acid rain, containing SO4
2�and NO3�,
which is acidifying surface waters and soils. These emissions have declined inrecent decades where pollution abatement has been implemented. Areas withminimal atmospheric pollution receive approximately 1 kg S ha�1 year�1, whileareas downwind from heavily industrialized areas can receive as much as 100 kgS ha�1 year�1. Many soils near cities receive more S from dry deposition throughparticulates than wet deposition from S dissolved in rainfall. Gases such as hydro-gen sulfide (H2S), carbon disulfide (CS2), carbonyl sulfide (COS), methyl mer-captan (CH3SH), dimethyl sulfide ([CH3]2S), and dimethyl disulfide ([CH3]2S2)also enter the atmosphere through microbial transformations of both organic andinorganic S. Atmospheric S in aerosol form is most important to global climatechange because of its impact on haze formation and changing the earth’sreflectance to sunlight.
Most agricultural soils contain S in the range 20–2000 µg S g�1 (Table 15.5).Many volcanic ash, organic, and tidal marsh soils contain 3000 or more µg S g�1,and some desert soils have a total S content in excess of 10,000 µg S g�1. In soilsother than aridisols, the inorganic S fraction is typically small compared to theorganic fraction (Table 15.5). Inorganic S exists in a number of oxidation states,ranging from �6 in SO4
2� to �2 in H2S and its derivatives (Table 15.6). More
402 Chapter 15 Soil Biogeochemical Cycling of Inorganic Nutrients
TABLE 15.4 Major Reservoirs of Sulfur in the Eartha
Reservoir Total sulfur (�1015g)
Atmosphere 0.0048Biosphere 0.76Hydrosphere 1,300,000
Oceans 1,300,000Marine organisms 0.024
Fresh waters 3.0Ice 6.0
Pedosphere 260Soil organic matter 1.1
Lithosphere 24,300,000Continental, sedimentary 5,200,000Continental, granite 7,800,000Continental, basalt 8,800,000Oceanic 2,500,000
aWith permission from Bolin et al. (1983).
Ch15-P546807.qxd 11/18/06 7:12 PM Page 402

than 2000 S-bearing minerals with S contents ranging from 7 to 53% make S the13th most abundant element in the earth’s crust. Weathering during soil formationoccurs very slowly, and primary mineral S is seldom a significant source of plant-available S. Inorganic S exists primarily as SO4
2� in calcareous soils of semiarid andarid regions, in volcanic ash, and in recently reclaimed tidal marsh areas. It may bepresent as gypsum (CaSO4), as a basic aluminum sulfate, or as a contaminant ofCaCO3 in concentrations reaching as high as 3000 µg g�1.
Sulfur 403
TABLE 15.5 Amounts and Distribution of Sulfur in Some World Soils
Total sulfur (�106 g)
Total sulfur Inorganic,Organic
Location Type of soil (µg g–1) reducible C-bonded Ester sulfate
Saskatchewan, Agricultural 88–760 0.5–13 29–59 41–71Canada
British Columbia, Grassland 286–928 ND 31–61 39–69Canada
Forest 162–2328 ND 20–47 53–80Organic 1,122–30,430 ND 28–75 25–72Agricultural 214–438 2 18–45 55–82
Iowa, USA Agricultural 57–618 2–8 43–60 7–18Carolinas, USA Tidal marsh 3,000–35,000 — — —Hawaii, USA Volcanic ash 180–2200 6–50 50–94 50–94Eastern Australia Agricultural 38–545 4–13 10–70 24–76Nigeria Agricultural 25–177 4–20 80–96 80–96Brazil Agricultural 43–398 5–23 20–65 24–59
TABLE 15.6 Oxidation States of Microbiologically ImportantForms of Sulfur in Soil
Compound Formula Oxidation state(s) of sulfur
Sulfate SO42– �6
Pentathionate S5O62– –2, �6
Tetrathionate S4O62– –2, �6
Trithionate S3O62– –2, �6
Dithionate S2O62– �6
Thiosulfate S2O32– –1, �5
Sulfite SO32– �4
Hyposulfite (dithionite) S2O42– �3
Sulfur S8 0Polysulfide Sn
2– –2, 0Sulfide S2– –2
Ch15-P546807.qxd 11/18/06 7:12 PM Page 403
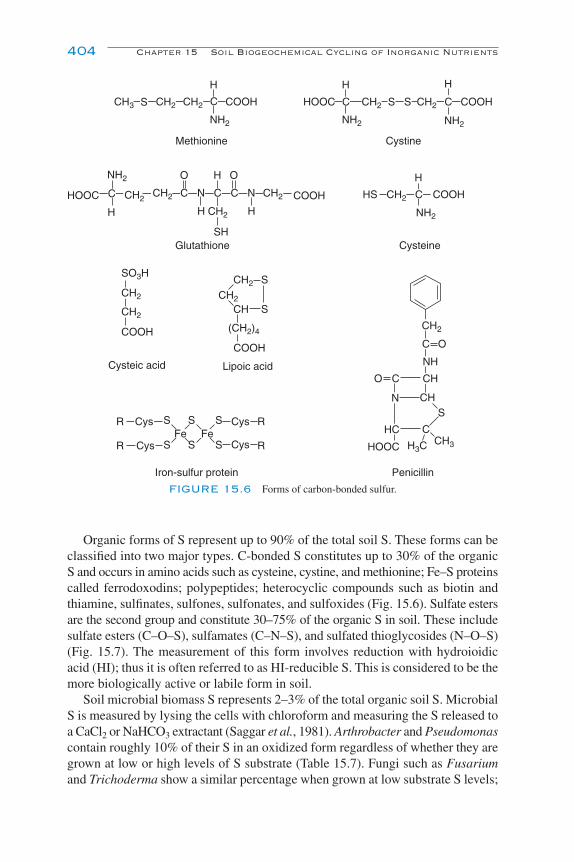
Organic forms of S represent up to 90% of the total soil S. These forms can beclassified into two major types. C-bonded S constitutes up to 30% of the organicS and occurs in amino acids such as cysteine, cystine, and methionine; Fe–S proteinscalled ferrodoxodins; polypeptides; heterocyclic compounds such as biotin andthiamine, sulfinates, sulfones, sulfonates, and sulfoxides (Fig. 15.6). Sulfate estersare the second group and constitute 30–75% of the organic S in soil. These includesulfate esters (C–O–S), sulfamates (C–N–S), and sulfated thioglycosides (N–O–S)(Fig. 15.7). The measurement of this form involves reduction with hydroioidicacid (HI); thus it is often referred to as HI-reducible S. This is considered to be themore biologically active or labile form in soil.
Soil microbial biomass S represents 2–3% of the total organic soil S. MicrobialS is measured by lysing the cells with chloroform and measuring the S released toa CaCl2 or NaHCO3 extractant (Saggar et al., 1981). Arthrobacter and Pseudomonascontain roughly 10% of their S in an oxidized form regardless of whether they aregrown at low or high levels of S substrate (Table 15.7). Fungi such as Fusariumand Trichoderma show a similar percentage when grown at low substrate S levels;
404 Chapter 15 Soil Biogeochemical Cycling of Inorganic Nutrients
NH2
SO3H
COOH
COOH
COOH
COOHHOOC
HOOC
CH3 S CH2 CH2
NH2
COOHC
H
NH2H H
SH
H
HS
Methionine
COOHHOOC
NH2
C S S
H
NH2
H
CH2 CH2 C
Cystine
Cysteine
C CH2CH2 C
O H O
N C
C
CHS
C
N CH2
CH2
CH2
CH3
CH2CH
C
H
CH2 C
Glutathione
CH2
CH2
S
S
(CH2)4
Cysteic acid Lipoic acid
R S
S
S
S
S
SR
R
O
RCys Cys
CysCysFe Fe
Iron-sulfur protein
H3C
Penicillin
CH2
C O
NH
CH
N
HC
FIGURE 15.6 Forms of carbon-bonded sulfur.
Ch15-P546807.qxd 11/18/06 7:12 PM Page 404
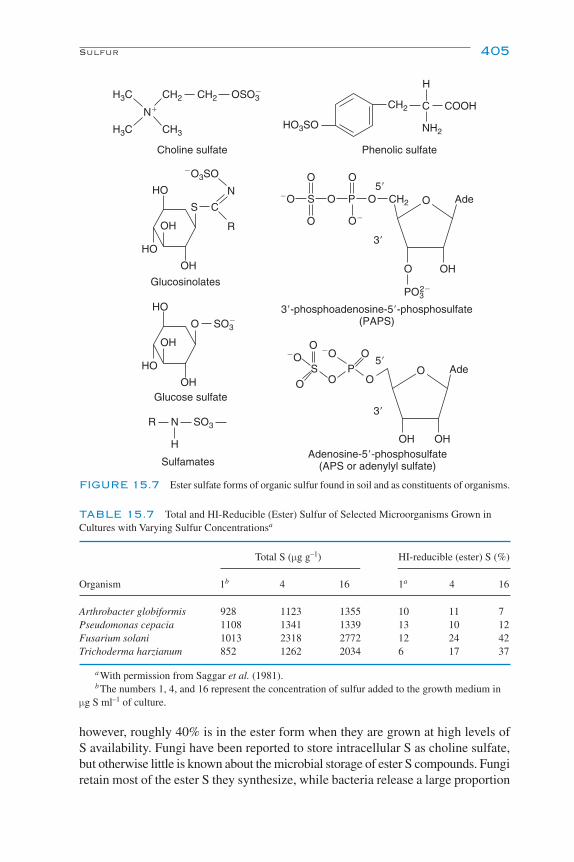
however, roughly 40% is in the ester form when they are grown at high levels ofS availability. Fungi have been reported to store intracellular S as choline sulfate,but otherwise little is known about the microbial storage of ester S compounds. Fungiretain most of the ester S they synthesize, while bacteria release a large proportion
Sulfur 405
N�
H3C
H3C
CH2 CH2 OSO3�
CH3
CH2
HO3SO NH2
H
C COOH
HO
HO
OH
OH
S C
R
N
�O3SO
HO
HO
OH
OH
O SO3�
S O P O
O OH
PO32 �
CH2
O
O O�
�O
O5�
3�
O Ade
R N
H
SO3
O5�
3�
OH OH
OO
O�O�O
O OPS Ade
Choline sulfate
Glucose sulfate
Phenolic sulfate
Glucosinolates
Sulfamates
3�-phosphoadenosine-5�-phosphosulfate(PAPS)
Adenosine-5�-phosphosulfate(APS or adenylyl sulfate)
FIGURE 15.7 Ester sulfate forms of organic sulfur found in soil and as constituents of organisms.
TABLE 15.7 Total and HI-Reducible (Ester) Sulfur of Selected Microorganisms Grown inCultures with Varying Sulfur Concentrationsa
Total S (µg g–1) HI-reducible (ester) S (%)
Organism 1b 4 16 1a 4 16
Arthrobacter globiformis 928 1123 1355 10 11 7Pseudomonas cepacia 1108 1341 1339 13 10 12Fusarium solani 1013 2318 2772 12 24 42Trichoderma harzianum 852 1262 2034 6 17 37
aWith permission from Saggar et al. (1981).bThe numbers 1, 4, and 16 represent the concentration of sulfur added to the growth medium in
µg S ml–1 of culture.
Ch15-P546807.qxd 11/18/06 7:12 PM Page 405

of the ester S into the culture medium. Sulfolipids, which represent another formof ester sulfate, have been reported for a limited number of bacteria. Algal sulfateesters also exist; the well-known algal compound, agar, is a sulfuric acid ester ofa linear galactan. Other forms of organic S, such as phenyl sulfates and elementalS, have been found in a variety of soil organisms. Elemental S has been identifiedin the sporocarps of ectomycorrhizal fungi as well as in other self-inhibited and dormant structures. It is deposited by some of the bacteria capableof utilizing H2S as an electron donor during photosynthesis.
The C:S ratio in SOM is not as consistent as is the C:N ratio. Major differencesare found due to type of parent material, leaching, and S inputs. A worldwide C:N:Sratio could be considered as 130:10:1. Agricultural and grassland soils average90:8:1; luvisols and spodosols under forest conditions can range up to 200:12:1.Wide ratios are found in areas of low S supply, and fertilization with S or atmos-pheric deposition raises the soil S level.
BIOLOGICAL IMPORTANCE OF SULFUR
Sulfur is an element essential to life. Sulfur-containing amino acids maintainthe secondary, tertiary, and quaternary structures of proteins via disulfide linkages.Many enzymes are inhibited when treated with reagents that destroy sulfhydrylgroups. The sulfhydryl groups are also involved in binding of substrates to enzymes.Reduced forms of S can serve as energy sources or source of reducing power forsome prokaryotes. Oxidized forms, especially sulfate, can serve as terminal electronacceptors during anaerobic respiration.
MICROBIAL TRANSFORMATIONS OF SULFUR
Mineralization
Carbon-bonded S is mineralized through various pathways: (1) direct aerobicmineralization during the oxidation of C as an energy source, (2) anaerobic mineral-ization of organic matter (desulfurization), (3) incomplete oxidation of organic S intoinorganic S compounds, (4) biological oxidation of H2S to sulfate via elemental Sand sulfite, (5) biological oxidation of tetrathionate to sulfate via sulfide, (6) hydrol-ysis of cysteine by cysteine desulfhydrolase, and (7) indirect (enzymatic) miner-alization when sulfate esters are hydrolyzed by sulfatases (Lawrence, 1987).The hydrolysis of ester sulfates occurs by splitting the O–S bond, through theaction of sulfatase enzymes:
R-O-SO3� � H2O → ROH � H� � SO4
2�.
There are numerous sulfatases, characterized by high specificity. They include aryl-sulfatases and choline sulfatases, whose production is repressed in the presence ofavailable SO4
2�. The sulfatases are bound to the cell walls of fungi and gram-pos-itive bacteria, while in gram-negative bacteria, they are found in the periplasm.
406 Chapter 15 Soil Biogeochemical Cycling of Inorganic Nutrients
Ch15-P546807.qxd 11/18/06 7:12 PM Page 406
Immobilization
Inorganic S is usually assimilated into organic compounds as SO42� by plants and
most microorganisms. This involves a series of enzymatic reactions called assimila-tory SO4
2� reduction. In the first step, a permease enzyme participates in the transferof SO4
2� across the cell membrane. This step requires the input of energy via ATP toform adenosine 5�-phosphosulfate (APS) and is catalyzed by ATP sulfurylase:
Another ATP is then used to form PAPS using APS kinase:
From here, two pathways can be used to form cysteine. In one, reductive enzymesform the unstable intermediate SO3
2�. This is reduced by NADH to HS�, whichreacts with serine to produce cysteine:
This sequence has been observed in bacteria such as B. subtilis, Staphylococcusaureus, and Enterobacter aerogenes and the fungus A. niger. In the second path-way, glutathione is used to transfer a S group from APS to O-acetylserine to formcysteine:
serine � acetyl-SCoA → O-acetylserine � CoASH,
O-acetylserine � H2S → cysteine � acetate � H�.
This latter sequence has been observed in Escherichia coli and Salmonellatyphimurium. The presence of available cysteine regulates the SO4
2� permease and theenzymes involved early in this pathway. This ensures that these energy-consumingreactions occur only in the absence of available S. The other S-containing amino acid(methionine) is produced via the aspartate family of amino acids and trans-sulfuration,leading to homocysteine, which is then converted to methionine. In bacteria, methio-nine is synthesized from cysteine.
Microbial decomposition of plant residues with C:S ratios �400:1 (�0.1% S)results in immobilization of S. At C:S ratios �200:1 (0.2% S), S is released intothe environment. Sulfur mineralization is less highly correlated with the degrada-tion of C than is N mineralization. The proportion of HI-reducible and C-bondedS is not a good indicator of potentially mineralizable S, nor is the activity of theenzyme arylsulfatase.
PAPS 2 SOPAPS reductase, NADH32� � �e ⎯ →⎯⎯⎯⎯⎯⎯⎯⎯ ��
� �� � ��
PAP
SO 7H 632 SO reductase, NADH3
2
e ⎯ →⎯⎯⎯⎯⎯⎯⎯⎯⎯
⎯
HS 3H O
HS serine2
cysteine synthase
�
�
�
� →→⎯⎯⎯⎯⎯⎯ cysteine H O.2�
APS ATP PAPS ADP.APS kinase� �⎯ →⎯⎯⎯⎯
ATP SO APS PP42 ATP sulfurylase
i� �� ⎯ →⎯⎯⎯⎯⎯⎯ .
Sulfur 407
Ch15-P546807.qxd 11/18/06 7:12 PM Page 407

Oxidation
In the presence of available electron acceptors, reduced forms of S are oxidizedby both chemical and microbial pathways:
HS�→ S0 → S2O32�→ S4O6
2� → SO42�.
A wide variety of organisms are capable of oxidizing S in a wide variety ofenvironments (Table 15.8). As with all soil organisms, the classification of these isstrongly affected by developing molecular techniques. The names of some of theseorganisms may change and new ones may be added, but the basic physiology andenzymes utilized will still apply. These organisms can be divided into threegroups: (1) photoautotrophs, including species of green and purple sulfur bacteria;(2) chemolithotrophs, such as members of the thiobacilli; and (3) heterotrophs,including a wide range of bacteria and fungi. While the first two occur generallyin extreme environments such as hot sulfur springs, the last groups are largelyresponsible for oxidizing S0 in aerobic soils (Germida and Janzen, 1993).
Hydrogen sulfide oxidation has been observed in many unicellular and filamen-tous cyanobacteria (Garlick et al., 1977). The filamentous cyanobacterium Oscilla-toria limnetica can perform anaerobic photosynthesis and uses HS� as theelectron acceptor. The ecological significance of phototrophic HS� oxidation isevident in the flexibility of cyanobacteria to adjust to changing environmental con-ditions of aerobiosis and anaerobic phototrophy in HS-rich environments. Dependingon the environmental conditions present, the resulting reductant is transferred to:(1) CO2 to yield cell material, (2) protons to yield H2 in the absence of CO2, or (3)N2 to yield ammonia when combined N is absent. The green sulfur and purple sul-fur bacteria represent a diverse morphological group, including cocci, vibrio,rods, spirals, and budding and gliding organisms. Both groups are commonlyfound in mud and stagnant waters containing H2S and exposed to light. They arealso found under extreme conditions of high salinity or temperature and occur inS hot springs and saline lakes as a colored layer under salt deposits. The green Sbacteria are strictly anaerobic and obligately phototrophic. They are able to useHS� and S0 as photosynthetic electron donors, which are oxidized to SO4
2�.Thiosulfate (S2O3
2�) is also oxidized by the green S bacteria Chlorobaculum thio-sulfatophilum (formerly Chlorobium limicola subsp. thiosulfatophilum). Theseorganisms have external S granules in the presence of HS� and a homogeneous16S rRNA sequence only distantly related to the purple S bacteria. The purple Sbacteria are Proteobacteria ranging in color from bluish violet through purple,deep red, and orange because of the various carotenoid pigments that dominatethe bacteriochlorophylls in color. These bacteria have a distinctive 16S rRNAcomposition that is shared by the nonphototrophic S oxidizers such as Beggiatoaand Thiobacillus. The phototrophic Proteobacteria include the Chromatiaceae,Ectothiorhodospiraceae, and Rhodospirillaceae families. The Chromatiaceae gen-era Thiospirillum and Thiocapsa store elemental S internally in the presence ofHS�. Allochromatium vinosum (formerly Chromatium vinosum) is a facultative
408 Chapter 15 Soil Biogeochemical Cycling of Inorganic Nutrients
Ch15-P546807.qxd 11/18/06 7:12 PM Page 408

409
TABLE 15.8 Characteristics of Some Sulfur-Oxidizing Archaea and Bacteriaa
Organism Metabolismb Inorganic substratesc pH Temp. (ºC) Enzymes involved
Acidianus ambivalens OL S2–, S0, H2 2.5 94 Sulfur oxygenase/reductaseAcidianus brierleyi OL S2–, S0, TS, TT, H2 1.8 70 Sulfur oxygenaseOscillatoria limnetica OP S2– 7.5 35 Hydrogen sulfide:quinone reductaseChlorobaculum thiosulfatophilum OP S2–, S0, TT, H2 6.8 25–35 Flavocytochrome c, thiosulfate:
cytochrome c reductaseAllochromatium vinosium FP S2–, S0, SO3
2–, TS, H2 7.0 30–35 APS reductase, flavocytochrome c,thiosulfate:cytochrome c reductase
Thiocapsa roseopersicina FP S2–, S0, TS, H2 7.3 20–35 Sulfite:acceptor oxidoreductaseParacoccus denitrificans FL S2–, S0, TS, H2 8.0 30 Thiosulfate-oxidizing enzyme system,
sulfite dehydrogenaseParacoccus versutus FL S2–, S0, TS 8.0 30 Thiosulfate-oxidizing enzyme system,
sulfite dehydrogenaseAcidiphilium acidophilum (formerly FL S2–, S0, SO3
2–, TS, TT 2.5 30 Tetra-, trithionate hydrolase, thiosulfate Thiobacillus acidophilus) dehydrogenaseThiobacillus denitrificans OL S2–, S0, SO3
2–, TS, TT 7.0 30 APS reductase, sulfite oxidaseHalothiobacillus neapolitanus OL S2–, S0, SO3
2–, TS, TT 7.0 30Starkeya novellus (formerly FL S2–, S0, SO3
2–, TS, TT 7.0 30 Sulfite:cytochrome c oxidoreductaseThiobacillus novellus)Acidithiobacillus ferrooxidans OL S2–, S0, SO3
2–, TS, TT, H2 2.5 30 Sulfur:Fe(III) oxidoreductase,sulfide:Fe(III) oxidoreductase
Thermithiobacillus tepidarius OL S2–, S0, SO32–, TS, TT 7.0 44 Trithionate hydrolase, tetrathionate
synthase, sulfite dehydrogenaseAcidithiobacillus thiooxidans OL S2–, S0, SO3
2–, TS, TT 2.5 30 Sulfite:cytochrome c oxidoreductase
aWith permission from Friedrich (1998).bFL, facultative lithotroph; FP, facultative phototroph; OL, obligate lithotroph; OP, obligate phototroph.cTS, thiosulfate; TT, tetrathionate.
Ch15-P546807.qxd 11/18/06 7:12 PM Page 409
photoautotroph, able to grow anaerobically in the light with HS�, SO32�, S2O3
2�,and H2, but not S4O6
2�. It is also capable of aerobic chemotrophic growth in thedark with S2O3
2� and CO2, provided the oxygen concentration is low. Sulfur oxi-dation by this organism proceeds in three steps: (1) oxidation of HS� or S2O3
2� toS0, which is deposited intracellularly; (2) oxidation of HS� or S0 to SO3
2�; and (3)oxidation of SO3
2� to the final product, SO42�. Members of the family Ectoth-
iorhodospiraceae transiently store elemental S outside the cell and subsequentlyoxidize it to SO4
2� upon depletion of HS�. Some of the species in this family aremarine, slightly halophilic curved gram-negative motile cells. Other species growonly in extremely salty alkaline conditions.
A wide, unrelated array of diverse chemolithitrophs have been grouped on thebasis of their sulfur oxidation, including bacteria such as Thiobacillus, Beggiatoa,Thioploca, and Thiothrix and the archaeon Acidianus. Acidianus ambivalens (for-merly Desulfurolobus ambivalens) exhibits the unique combination of dissimila-tory aerobic S oxidation and anaerobic S respiration in one strain. The organismis a strictly acidophilic, extreme thermophilic, and obligately chemolithotrophicarchaeon able to obtain energy from aerobic S oxidation and also grows underanaerobic conditions by reducing SO4
2� with H2 as the electron donor. The thiobacillirepresent the classic S-oxidizing organisms. The historical criterion for classify-ing organisms into the Thiobacillus genus was that all the species are rod-shapedeubacteria able to obtain energy for autotrophic growth by oxidizing inorganic S.Widespread application of 16S rRNA gene sequence analysis and DNA–DNAhybridization have provided tools for clarifying the taxonomy of this genus.Application of these tools has resulted in the reassignment of 14 species of thiobacilliinto other genera (Kelly and Wood, 2000).
The majority of the thiobacilli are obligate aerobes, though some such as T.denitrificans can grow anaerobically by using nitrate as a terminal electron accep-tor. Others use electron donors such as Fe2� (Acidithiobacillus ferrooxidans) orNCS� (Thiobacillus thioparus), rather than S. The fact that they are facultative or obligate chemolithotrophs means they are able to oxidize S independent of thesupply of available C. These bacteria are easily isolated from extreme environ-ments such as hot, acid soils, S-polluted soils near sulfur piles, and soils subjectedto high atmospheric deposition of S. Attempts to isolate these bacteria from agri-cultural soils have been more sporadic. The view that thiobacilli are the dominantplayers in S oxidation in soils is largely based on the observation that these bacte-ria are capable of much higher rates of S oxidation in culture than those achievedby heterotrophs growing under similar conditions. However, the isolation of theseorganisms from agricultural soils has not been very successful, and no consistentcorrelation between S oxidation rates and the presence of thiobacilli has beenfound except that these rates are generally low in soils that lack these organisms.
Sulfur oxidation is also mediated by a large number of heterotrophic soilmicroorganisms including bacteria such as Arthrobacter, Bacillus, Micrococcus,Mycobacterium, and Pseudomonas; some actinomycetes; and fungi such asAbsidia, Alternaria, Fusarium, and Trichoderma. Lawrence and Germida (1991)
410 Chapter 15 Soil Biogeochemical Cycling of Inorganic Nutrients
Ch15-P546807.qxd 11/18/06 7:12 PM Page 410
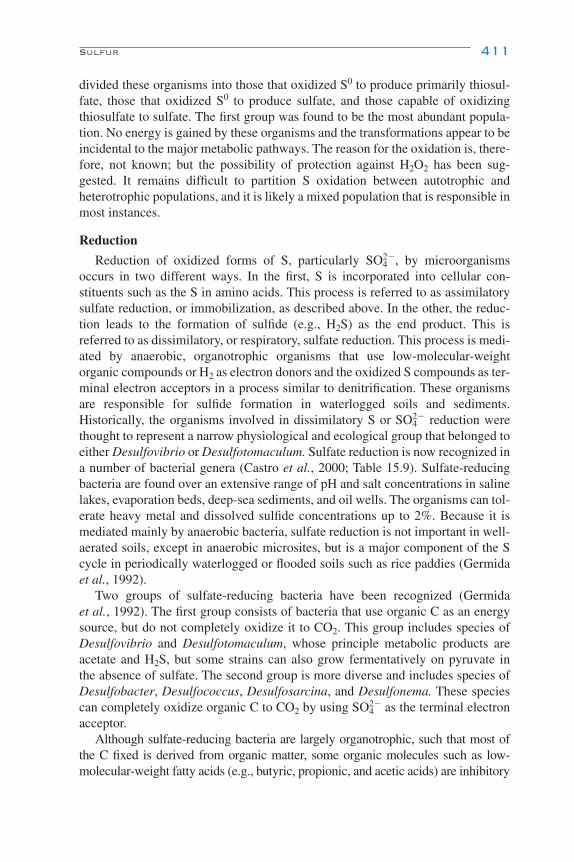
divided these organisms into those that oxidized S0 to produce primarily thiosul-fate, those that oxidized S0 to produce sulfate, and those capable of oxidizing thiosulfate to sulfate. The first group was found to be the most abundant popula-tion. No energy is gained by these organisms and the transformations appear to beincidental to the major metabolic pathways. The reason for the oxidation is, there-fore, not known; but the possibility of protection against H2O2 has been sug-gested. It remains difficult to partition S oxidation between autotrophic andheterotrophic populations, and it is likely a mixed population that is responsible inmost instances.
Reduction
Reduction of oxidized forms of S, particularly SO42�, by microorganisms
occurs in two different ways. In the first, S is incorporated into cellular con-stituents such as the S in amino acids. This process is referred to as assimilatorysulfate reduction, or immobilization, as described above. In the other, the reduc-tion leads to the formation of sulfide (e.g., H2S) as the end product. This isreferred to as dissimilatory, or respiratory, sulfate reduction. This process is medi-ated by anaerobic, organotrophic organisms that use low-molecular-weightorganic compounds or H2 as electron donors and the oxidized S compounds as ter-minal electron acceptors in a process similar to denitrification. These organismsare responsible for sulfide formation in waterlogged soils and sediments.Historically, the organisms involved in dissimilatory S or SO4
2� reduction werethought to represent a narrow physiological and ecological group that belonged toeither Desulfovibrio or Desulfotomaculum. Sulfate reduction is now recognized ina number of bacterial genera (Castro et al., 2000; Table 15.9). Sulfate-reducingbacteria are found over an extensive range of pH and salt concentrations in salinelakes, evaporation beds, deep-sea sediments, and oil wells. The organisms can tol-erate heavy metal and dissolved sulfide concentrations up to 2%. Because it ismediated mainly by anaerobic bacteria, sulfate reduction is not important in well-aerated soils, except in anaerobic microsites, but is a major component of the Scycle in periodically waterlogged or flooded soils such as rice paddies (Germidaet al., 1992).
Two groups of sulfate-reducing bacteria have been recognized (Germidaet al., 1992). The first group consists of bacteria that use organic C as an energysource, but do not completely oxidize it to CO2. This group includes species ofDesulfovibrio and Desulfotomaculum, whose principle metabolic products areacetate and H2S, but some strains can also grow fermentatively on pyruvate inthe absence of sulfate. The second group is more diverse and includes species ofDesulfobacter, Desulfococcus, Desulfosarcina, and Desulfonema. These speciescan completely oxidize organic C to CO2 by using SO4
2� as the terminal electronacceptor.
Although sulfate-reducing bacteria are largely organotrophic, such that most ofthe C fixed is derived from organic matter, some organic molecules such as low-molecular-weight fatty acids (e.g., butyric, propionic, and acetic acids) are inhibitory
Sulfur 411
Ch15-P546807.qxd 11/18/06 7:12 PM Page 411

to growth. In such cases, only certain organic substrates such as lactic and pyruvicacids are utilized as electron donors. These reactions are as follows:
lactic acid, 2 CH3CHOHCOOH � SO42� →
2 CH3COOH � S2� � 2 CO2 � H2O;
pyruvic acid, 4 CH3COCOOH � SO42� → 3 CH3COOH �
CH3COO� � HS� � 4 CO2.
The pathway for dissimilatory reduction uses the same activation of SO42� to APS
as found in assimilatory reduction (see Microbial Transformations of Sulfur—Immobilization). The dissimilatory reduction scheme includes the production ofHSO3
� without the involvement of PAPS, and the other difference is the large pro-duction of HS� without the formation of organic S.
Aside from their obvious importance in the S cycle, sulfate-reducing bacteriaare important regulators of a variety of processes in anaerobic upland and wetland
412 Chapter 15 Soil Biogeochemical Cycling of Inorganic Nutrients
TABLE 15.9 Characteristics of Some Genera of Dissimilatory Sulfate-Reducing Bacteriaa
Genus Morphology Growth temp. (ºC) Substrate/comments
Gram-negativemesophilicDesulfobulbus Lemon to rod 25–40 Incomplete oxidation of acetateDesulfomicrobium Ovoid to rod 25–40 Incomplete oxidation of acetateDesulfomonas Rod 30–40 Complete oxidation of benzoate
and fatty acidsDesulfovibrio Spiral to vibroid 25–40 Incomplete oxidation of lactate;
fatty acids may be completelyoxidized
Desulfobacter Oval to rod 20–33 Incomplete oxidation of lactate and propionate
Desulfococcus Spherical or lemon 28–35 Acetate completely oxidizedDesulfomonile Rod 37 Acetate completely oxidizedDesulfonema Filaments 28–32 Acetate completely oxidizedDesulfosarcina Oval rods or 33 Complete oxidation of
coccoid, packages fatty acids
Gram-positivespore-formingDesulfotomaculum Straight to curved Most 25–40 Lack desulfoviridin, the
rods Some 40–65 usual replacement is P-582
Bacterial thermophilicThermodesulfobacteriumVibroid to rod 65–70 Incomplete oxidation of acetate
Archaeal thermophilicArchaeoglobus Coccoid 64–92 Incomplete oxidation of acetate
aWith permission from Castro et al. (2000).
Ch15-P546807.qxd 11/18/06 7:12 PM Page 412

soils, including organic matter turnover, biodegradation of chlorinated aromatic pol-lutants, and mercury methylation.
Volatilization
The decomposition of organic S compounds in poorly drained soils, sediments,manures, and organic wastes can lead to the formation of volatile organic S com-pounds. These compounds include mercaptans such as methyl mercaptan (CH3SH)and alkyl sulfides such as dimethyl sulfide (CH3SCH3). Volatile S compoundsmay be of importance because they can inhibit plant growth, nitrification, and otherbiochemical processes. These compounds are also undesirable atmospheric pollu-tants causing unpleasant odors and adversely affecting climate.
MICRONUTRIENTS AND TRACE METALS
Micronutrients are chemical elements that are required by plants and microor-ganisms in small amounts. These micronutrients are vital constituents of enzymesor growth hormones. The essential trace elements for plants are iron (Fe), zinc (Zn),manganese (Mn), copper (Cu), boron (B), molybdenum (Mo), and nickel (Ni).Microorganisms and higher animals also require copper (Cu), cobalt (Co), chromium(Cr), selenium (Se), and tin (Sn). Other metal elements such as mercury (Hg), arsenic(As), lead (Pb), and cadmium (Cd) are not essential to organisms, but are found insoils as potentially toxic contaminants. This section will focus on select micronu-trients and nonessential metal elements, which will be referred to collectively as tracemetals for simplicity, even though some of these elements (particularly Fe) canexist in soils at much higher than trace concentrations.
MICRONUTRIENT AND TRACE METAL CYCLING IN SOIL
A generic cycle diagram for micronutrient and trace metals in soils is illus-trated in Fig. 15.8. Concentrations of elements as free ions or soluble complexesare strongly influenced by abiotic reactions such as changes in oxidation state, fix-ation to mineral surfaces, complexation with organic matter, and formation ofinsoluble minerals. Microorganisms are able to solubilize minerals and change thesoil redox potential and pH. Plant availability of micronutrients is therefore highlydependent on microbial activity. Recycling of micronutrients occurs when plantlitter is returned to the soil and mineralized by the microbial biomass, therebyreleasing the trace metals. The production and secretion of various chelatingagents by plant roots and microorganisms promote the dissolution and weatheringof minerals and facilitate the movement of micronutrients to roots. Inputs of mostheavy metal elements are from anthropogenic sources. Human activities since thelate 1800s have released at least 106 metric tons of Hg into the environment. Coalcontains 1200 to 21,000 ng Hg g�1, and the burning of oil and coal releases 2 to
Micronutrients and Trace Metals 413
Ch15-P546807.qxd 11/18/06 7:12 PM Page 413
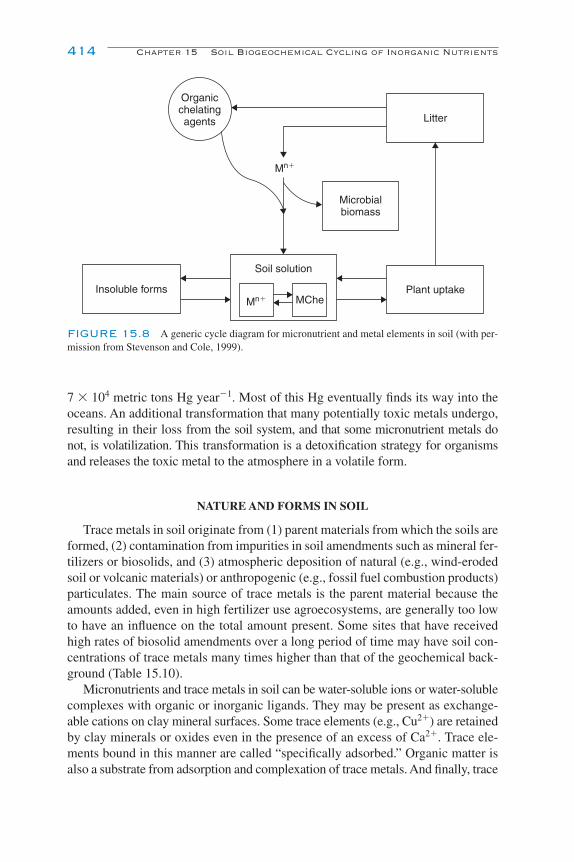
7 � 104 metric tons Hg year�1. Most of this Hg eventually finds its way into theoceans. An additional transformation that many potentially toxic metals undergo,resulting in their loss from the soil system, and that some micronutrient metals donot, is volatilization. This transformation is a detoxification strategy for organismsand releases the toxic metal to the atmosphere in a volatile form.
NATURE AND FORMS IN SOIL
Trace metals in soil originate from (1) parent materials from which the soils areformed, (2) contamination from impurities in soil amendments such as mineral fer-tilizers or biosolids, and (3) atmospheric deposition of natural (e.g., wind-erodedsoil or volcanic materials) or anthropogenic (e.g., fossil fuel combustion products)particulates. The main source of trace metals is the parent material because theamounts added, even in high fertilizer use agroecosystems, are generally too lowto have an influence on the total amount present. Some sites that have receivedhigh rates of biosolid amendments over a long period of time may have soil con-centrations of trace metals many times higher than that of the geochemical back-ground (Table 15.10).
Micronutrients and trace metals in soil can be water-soluble ions or water-solublecomplexes with organic or inorganic ligands. They may be present as exchange-able cations on clay mineral surfaces. Some trace elements (e.g., Cu2�) are retainedby clay minerals or oxides even in the presence of an excess of Ca2�. Trace ele-ments bound in this manner are called “specifically adsorbed.” Organic matter isalso a substrate from adsorption and complexation of trace metals. And finally, trace
414 Chapter 15 Soil Biogeochemical Cycling of Inorganic Nutrients
Organicchelatingagents Litter
Microbialbiomass
Plant uptake
Soil solution
Mn�
Mn� MCheInsoluble forms
FIGURE 15.8 A generic cycle diagram for micronutrient and metal elements in soil (with per-mission from Stevenson and Cole, 1999).
Ch15-P546807.qxd 11/18/06 7:12 PM Page 414
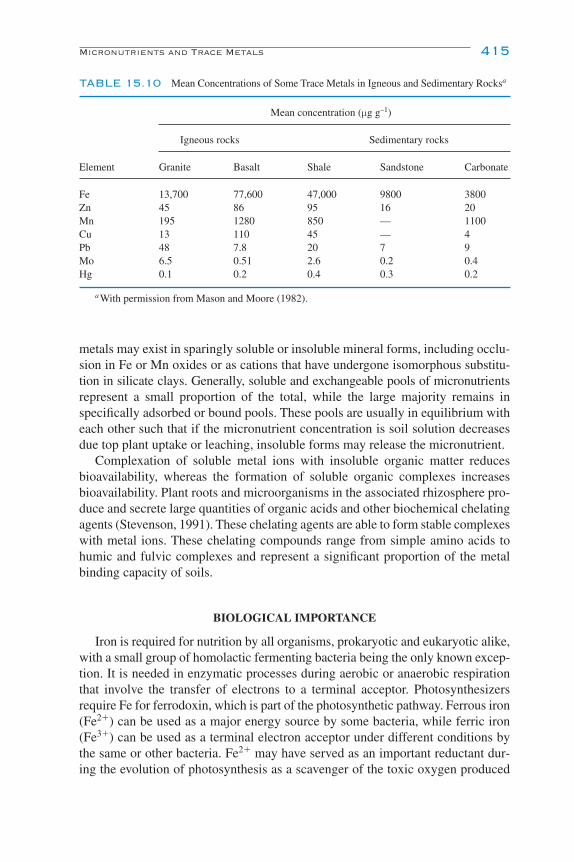
metals may exist in sparingly soluble or insoluble mineral forms, including occlu-sion in Fe or Mn oxides or as cations that have undergone isomorphous substitu-tion in silicate clays. Generally, soluble and exchangeable pools of micronutrientsrepresent a small proportion of the total, while the large majority remains inspecifically adsorbed or bound pools. These pools are usually in equilibrium witheach other such that if the micronutrient concentration is soil solution decreasesdue top plant uptake or leaching, insoluble forms may release the micronutrient.
Complexation of soluble metal ions with insoluble organic matter reducesbioavailability, whereas the formation of soluble organic complexes increasesbioavailability. Plant roots and microorganisms in the associated rhizosphere pro-duce and secrete large quantities of organic acids and other biochemical chelatingagents (Stevenson, 1991). These chelating agents are able to form stable complexeswith metal ions. These chelating compounds range from simple amino acids tohumic and fulvic complexes and represent a significant proportion of the metalbinding capacity of soils.
BIOLOGICAL IMPORTANCE
Iron is required for nutrition by all organisms, prokaryotic and eukaryotic alike,with a small group of homolactic fermenting bacteria being the only known excep-tion. It is needed in enzymatic processes during aerobic or anaerobic respirationthat involve the transfer of electrons to a terminal acceptor. Photosynthesizersrequire Fe for ferrodoxin, which is part of the photosynthetic pathway. Ferrous iron(Fe2�) can be used as a major energy source by some bacteria, while ferric iron(Fe3�) can be used as a terminal electron acceptor under different conditions bythe same or other bacteria. Fe2� may have served as an important reductant dur-ing the evolution of photosynthesis as a scavenger of the toxic oxygen produced
Micronutrients and Trace Metals 415
TABLE 15.10 Mean Concentrations of Some Trace Metals in Igneous and Sedimentary Rocksa
Mean concentration (µg g–1)
Igneous rocks Sedimentary rocks
Element Granite Basalt Shale Sandstone Carbonate
Fe 13,700 77,600 47,000 9800 3800Zn 45 86 95 16 20Mn 195 1280 850 — 1100Cu 13 110 45 — 4Pb 48 7.8 20 7 9Mo 6.5 0.51 2.6 0.2 0.4Hg 0.1 0.2 0.4 0.3 0.2
aWith permission from Mason and Moore (1982).
Ch15-P546807.qxd 11/18/06 7:12 PM Page 415
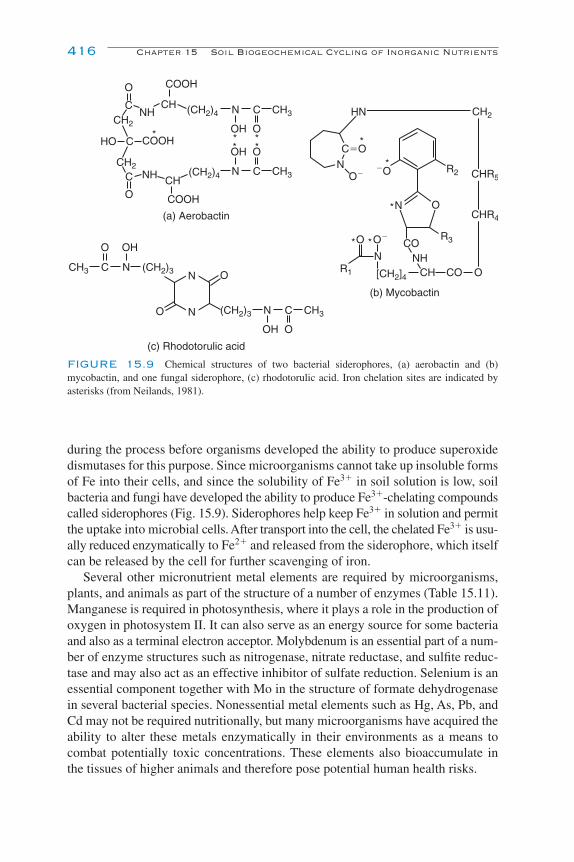
during the process before organisms developed the ability to produce superoxidedismutases for this purpose. Since microorganisms cannot take up insoluble formsof Fe into their cells, and since the solubility of Fe3� in soil solution is low, soilbacteria and fungi have developed the ability to produce Fe3�-chelating compoundscalled siderophores (Fig. 15.9). Siderophores help keep Fe3� in solution and permitthe uptake into microbial cells. After transport into the cell, the chelated Fe3� is usu-ally reduced enzymatically to Fe2� and released from the siderophore, which itselfcan be released by the cell for further scavenging of iron.
Several other micronutrient metal elements are required by microorganisms,plants, and animals as part of the structure of a number of enzymes (Table 15.11).Manganese is required in photosynthesis, where it plays a role in the production ofoxygen in photosystem II. It can also serve as an energy source for some bacteriaand also as a terminal electron acceptor. Molybdenum is an essential part of a num-ber of enzyme structures such as nitrogenase, nitrate reductase, and sulfite reduc-tase and may also act as an effective inhibitor of sulfate reduction. Selenium is anessential component together with Mo in the structure of formate dehydrogenasein several bacterial species. Nonessential metal elements such as Hg, As, Pb, andCd may not be required nutritionally, but many microorganisms have acquired theability to alter these metals enzymatically in their environments as a means tocombat potentially toxic concentrations. These elements also bioaccumulate inthe tissues of higher animals and therefore pose potential human health risks.
416 Chapter 15 Soil Biogeochemical Cycling of Inorganic Nutrients
(a) Aerobactin
(b) Mycobactin
HN
N O
R2
R3
R1
CH2
CHR5
CHR4
C�O*
*NO�
O�
�O
*O*
*
OCOCHNH
CON
[CH2]4
(c) Rhodotorulic acid
OH O
N C CH3(CH2)3
OHO
NCCH3 (CH2)3 N
N
O
O
* **** OH O
N C CH3
OH O
N C CH3
(CH2)4
(CH2)4
COOH
COOH
COOH
O
O
C
C
HO
NH
NH
CH
CH
C
CH2
CH2
FIGURE 15.9 Chemical structures of two bacterial siderophores, (a) aerobactin and (b)mycobactin, and one fungal siderophore, (c) rhodotorulic acid. Iron chelation sites are indicated byasterisks (from Neilands, 1981).
Ch15-P546807.qxd 11/18/06 7:12 PM Page 416
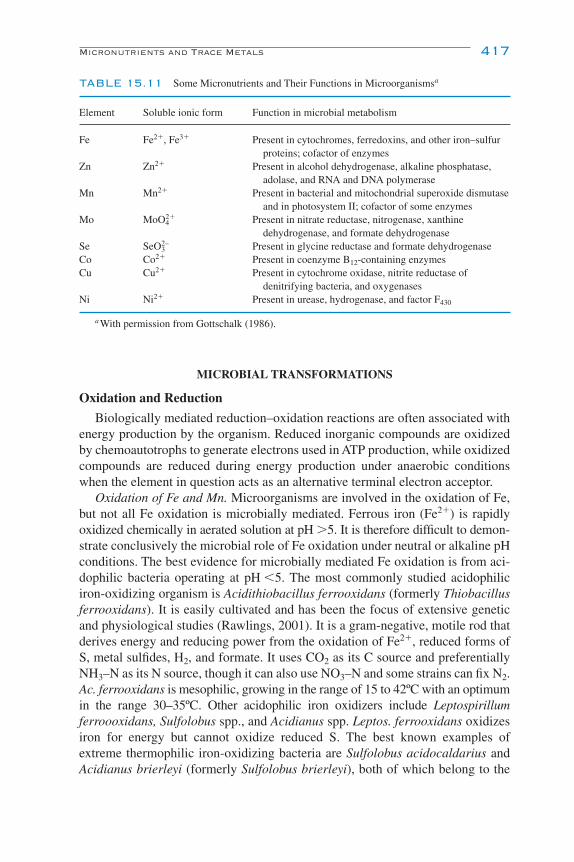
MICROBIAL TRANSFORMATIONS
Oxidation and Reduction
Biologically mediated reduction–oxidation reactions are often associated withenergy production by the organism. Reduced inorganic compounds are oxidizedby chemoautotrophs to generate electrons used in ATP production, while oxidizedcompounds are reduced during energy production under anaerobic conditionswhen the element in question acts as an alternative terminal electron acceptor.
Oxidation of Fe and Mn. Microorganisms are involved in the oxidation of Fe,but not all Fe oxidation is microbially mediated. Ferrous iron (Fe2�) is rapidlyoxidized chemically in aerated solution at pH �5. It is therefore difficult to demon-strate conclusively the microbial role of Fe oxidation under neutral or alkaline pHconditions. The best evidence for microbially mediated Fe oxidation is from aci-dophilic bacteria operating at pH �5. The most commonly studied acidophiliciron-oxidizing organism is Acidithiobacillus ferrooxidans (formerly Thiobacillusferrooxidans). It is easily cultivated and has been the focus of extensive geneticand physiological studies (Rawlings, 2001). It is a gram-negative, motile rod thatderives energy and reducing power from the oxidation of Fe2�, reduced forms ofS, metal sulfides, H2, and formate. It uses CO2 as its C source and preferentiallyNH3–N as its N source, though it can also use NO3–N and some strains can fix N2.Ac. ferrooxidans is mesophilic, growing in the range of 15 to 42ºC with an optimumin the range 30–35ºC. Other acidophilic iron oxidizers include Leptospirillumferroooxidans, Sulfolobus spp., and Acidianus spp. Leptos. ferrooxidans oxidizesiron for energy but cannot oxidize reduced S. The best known examples ofextreme thermophilic iron-oxidizing bacteria are Sulfolobus acidocaldarius andAcidianus brierleyi (formerly Sulfolobus brierleyi), both of which belong to the
Micronutrients and Trace Metals 417
TABLE 15.11 Some Micronutrients and Their Functions in Microorganismsa
Element Soluble ionic form Function in microbial metabolism
Fe Fe2�, Fe3� Present in cytochromes, ferredoxins, and other iron–sulfur proteins; cofactor of enzymes
Zn Zn2� Present in alcohol dehydrogenase, alkaline phosphatase,adolase, and RNA and DNA polymerase
Mn Mn2� Present in bacterial and mitochondrial superoxide dismutaseand in photosystem II; cofactor of some enzymes
Mo MoO42� Present in nitrate reductase, nitrogenase, xanthine
dehydrogenase, and formate dehydrogenaseSe SeO3
2– Present in glycine reductase and formate dehydrogenaseCo Co2� Present in coenzyme B12-containing enzymesCu Cu2� Present in cytochrome oxidase, nitrite reductase of
denitrifying bacteria, and oxygenasesNi Ni2� Present in urease, hydrogenase, and factor F430
aWith permission from Gottschalk (1986).
Ch15-P546807.qxd 11/18/06 7:12 PM Page 417

Archaea. Their temperature range is between 55 and 90ºC, with an optimum in therange 70–75ºC. Sulfur is their usual electron donor, but it can be replaced by Fe2�.
Gallionella ferruginea represents the strongest evidence for enzymatic oxida-tion of Fe under neutral pH conditions; however, it is equivocal. Gallionella arestalked bacteria that use Fe2� as their electron donor and CO2 as their C source.The bean-shaped cells secrete colloidal Fe(OH)3, without an organic matrix. Theyare aerobic and occur in Fe-containing fresh or marine waters. Other bacteria that havebeen associated with Fe oxidation include sheathed bacteria such as Sphaerotilus,Leptothrix, and “Clonothrix.” However, these bacteria are more likely iron-depositingbacteria rather than Fe oxidizers in that they bind already oxidized iron at theircell surfaces. The distinction between abiotic and microbially mediated Fe oxida-tion is difficult as the physicochemical properties of biogenic iron oxides are similarto those of their abiotic counterparts (Fortin and Langley, 2005), and therefore itremains difficult to determine the exact role of microorganisms in their formation.
Bacterial oxidation of Mn2� occurs in both soils and sediments. On ocean bot-toms, microorganisms are responsible for the formation of ferromanganese nod-ules. The chemical oxidation of Mn2� occurs only above pH 8, and therefore Mnoxidation in neutral and acidic environments is microbially mediated. A largenumber of bacterial and fungal groups are participants. Three phylogeneticallydistinct organisms have been studied extensively for Mn oxidation: Leptothrixdiscophora, Pseudomonas putida strains MnB1 and GB-1 (later synonym forArthrobacter siderocapsulatus), and a Bacillus sp. strain (Tebo et al., 2004). Allthree organisms oxidize Mn enzymatically on an exopolymer matrix surroundingthe cell: Leptot. discophora on an extracellular sheath, Ps. putida on the outer mem-brane glycocalyx, and Bacillus on the exosporium (Fig. 15.10). Molecular genetic
418 Chapter 15 Soil Biogeochemical Cycling of Inorganic Nutrients
0.25 µm
0.25 µm0.25 µm1 µm
FIGURE 15.10 Transmission electron micrographs of representatives of the three Mn-oxidizingbacteria (with permission from Tebo et al., 2004). Left, an unidentified Leptothrix sp.; center, sporesof the marine Bacillus sp. strain SG-1; right, Pseudomonas putida strain MnB1.
Ch15-P546807.qxd 11/18/06 7:12 PM Page 418

techniques have revealed that all three organisms possess genes that are involvedin Mn oxidation and that share sequence similarity with multicopper oxidaseenzymes. Other Mn oxidizers, such as Leptothrix pseudoochracea, will oxidizedissolved Mn2� with catalase enzymes that utilize hydrogen peroxide (H2O2).
Some rhizosphere bacteria oxidize Mn and deposit MnO2 on the outside of theroot. Examination shows the root coated with a black precipitate. The easiest methodof control is by genetic selection of the host plant, making it incompatible for thebacteria. Manganese toxicity from excess available Mn can occur in acidic soils.The precipitation of Mn in the filaments of a mycorrhizal fungus has been foundto allow the growth of Mn-sensitive plants in such soils.
Reduction of Fe and Mn. Enzymatic Fe or Mn reduction occurs as part of anaer-obic respiration in which the oxidized form serves as the dominant or exclusiveterminal electron acceptor. It may also accompany fermentation in which the metalserves as a supplementary electron acceptor. Both processes are referred to as dis-similatory iron reduction. When Fe or Mn is reduced during cellular uptake forincorporation into cellular components, the process is referred to as assimilatoryiron or manganese reduction. Dissimilatory reduction is the dominant process andwill be the focus of this discussion.
Iron reduction in the form of anaerobic respiration is an important means ofmineralization of organic matter in low-O2 environments where sulfate and nitrateoccur in amounts insufficient to support sulfate or nitrate respiration. A wide rangeof Archaea and bacteria are able to conserve energy through the reduction of ferric iron (Fe3�) to ferrous iron (Fe2�), and many of the same organisms are alsoable to grow through the reduction of Mn4� to Mn2� (Table 15.12). The environ-mental significance of these processes is that Fe-reducing communities can beresponsible for most of the organic matter oxidation in many subsurface environ-ments, and several xenobiotics can be degraded under anaerobic conditions by Fe and Mn reducers. Historically, studies on the reduction of Fe3� and Mn4�
focused on organisms that grow predominantly by fermentation of sugars withmetals used as minor electron acceptors, typically �5% of the reducing equiva-lents used for metal reduction. Metal reduction through this form of metabolism
Micronutrients and Trace Metals 419
TABLE 15.12A Microbially Mediated Oxidation Reactions of Metals in Soils and Sediments and Examples of Organisms Involveda
Element Half-reaction Strategyb Example organisms involved
Fe 2Fe2� → 2Fe3� � 2e– E Acidithiobacillus ferrooxidansMn Mn2� → Mn4� � 2e– E, D Arthrobacter, PseudomonasHg Hg0 → Hg2� � 2e– NE Bacillus, PseudomonasAs AsO2
– → AsO43– � 2e– D Bacillus, Pseudomonas,
Alcaligenes faecalisSe Se2� → Se0 � 2e– E Bacillus, AcidithiobacillusU U4� � 2e– → U6� E Acidithiobacillus ferrooxidans
Ch15-P546807.qxd 11/18/06 7:12 PM Page 419
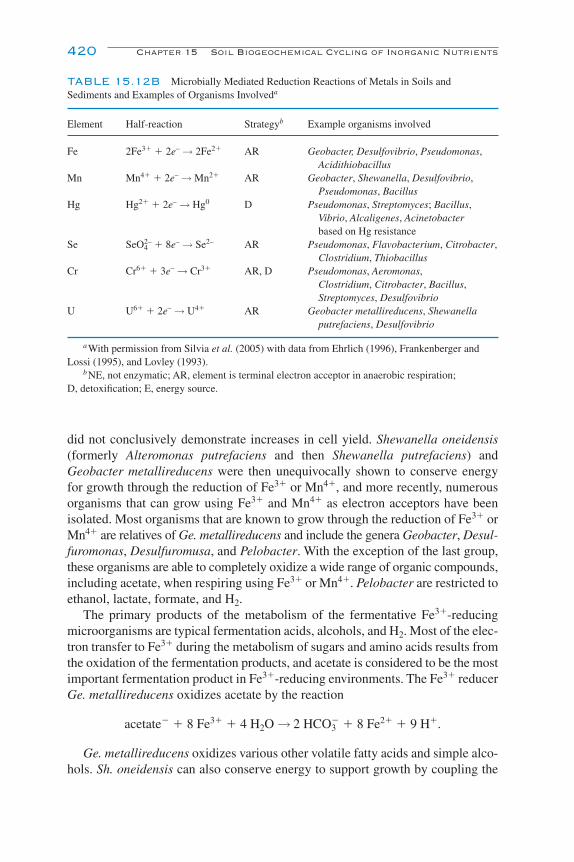
did not conclusively demonstrate increases in cell yield. Shewanella oneidensis(formerly Alteromonas putrefaciens and then Shewanella putrefaciens) andGeobacter metallireducens were then unequivocally shown to conserve energyfor growth through the reduction of Fe3� or Mn4�, and more recently, numerousorganisms that can grow using Fe3� and Mn4� as electron acceptors have beenisolated. Most organisms that are known to grow through the reduction of Fe3� orMn4� are relatives of Ge. metallireducens and include the genera Geobacter, Desul-furomonas, Desulfuromusa, and Pelobacter. With the exception of the last group,these organisms are able to completely oxidize a wide range of organic compounds,including acetate, when respiring using Fe3� or Mn4�. Pelobacter are restricted toethanol, lactate, formate, and H2.
The primary products of the metabolism of the fermentative Fe3�-reducingmicroorganisms are typical fermentation acids, alcohols, and H2. Most of the elec-tron transfer to Fe3� during the metabolism of sugars and amino acids results fromthe oxidation of the fermentation products, and acetate is considered to be the mostimportant fermentation product in Fe3�-reducing environments. The Fe3� reducerGe. metallireducens oxidizes acetate by the reaction
acetate� � 8 Fe3� � 4 H2O → 2 HCO3� � 8 Fe2� � 9 H�.
Ge. metallireducens oxidizes various other volatile fatty acids and simple alco-hols. Sh. oneidensis can also conserve energy to support growth by coupling the
420 Chapter 15 Soil Biogeochemical Cycling of Inorganic Nutrients
TABLE 15.12B Microbially Mediated Reduction Reactions of Metals in Soils and Sediments and Examples of Organisms Involveda
Element Half-reaction Strategyb Example organisms involved
Fe 2Fe3� � 2e– → 2Fe2� AR Geobacter, Desulfovibrio, Pseudomonas,Acidithiobacillus
Mn Mn4� � 2e– → Mn2� AR Geobacter, Shewanella, Desulfovibrio,Pseudomonas, Bacillus
Hg Hg2� � 2e– → Hg0 D Pseudomonas, Streptomyces; Bacillus,Vibrio, Alcaligenes, Acinetobacterbased on Hg resistance
Se SeO42– � 8e– → Se2– AR Pseudomonas, Flavobacterium, Citrobacter,
Clostridium, ThiobacillusCr Cr6� � 3e– → Cr3� AR, D Pseudomonas, Aeromonas,
Clostridium, Citrobacter, Bacillus,Streptomyces, Desulfovibrio
U U6� � 2e– → U4� AR Geobacter metallireducens, Shewanella putrefaciens, Desulfovibrio
aWith permission from Silvia et al. (2005) with data from Ehrlich (1996), Frankenberger andLossi (1995), and Lovley (1993).
bNE, not enzymatic; AR, element is terminal electron acceptor in anaerobic respiration; D, detoxification; E, energy source.
Ch15-P546807.qxd 11/18/06 7:12 PM Page 420
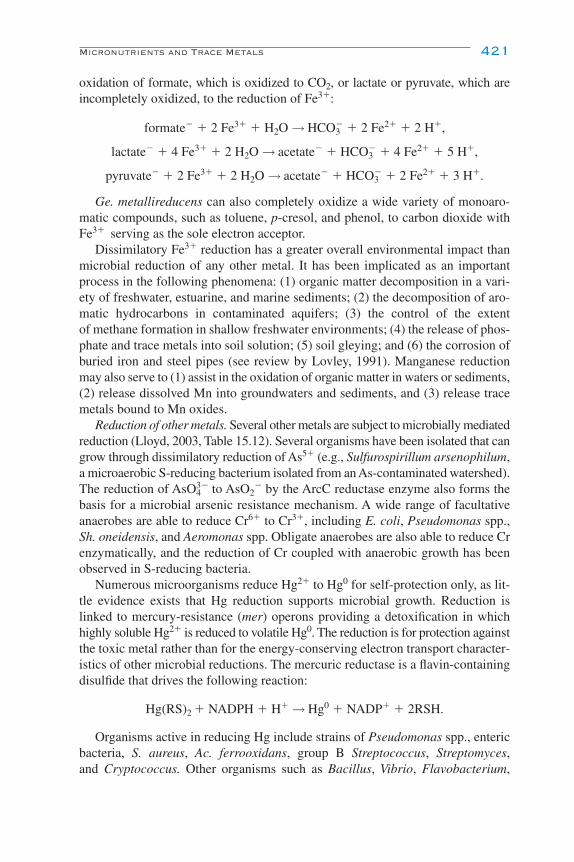
oxidation of formate, which is oxidized to CO2, or lactate or pyruvate, which areincompletely oxidized, to the reduction of Fe3�:
formate� � 2 Fe3� � H2O → HCO3� � 2 Fe2� � 2 H�,
lactate� � 4 Fe3� � 2 H2O → acetate� � HCO3� � 4 Fe2� � 5 H�,
pyruvate� � 2 Fe3� � 2 H2O → acetate� � HCO3� � 2 Fe2� � 3 H�.
Ge. metallireducens can also completely oxidize a wide variety of monoaro-matic compounds, such as toluene, p-cresol, and phenol, to carbon dioxide withFe3� serving as the sole electron acceptor.
Dissimilatory Fe3� reduction has a greater overall environmental impact thanmicrobial reduction of any other metal. It has been implicated as an importantprocess in the following phenomena: (1) organic matter decomposition in a vari-ety of freshwater, estuarine, and marine sediments; (2) the decomposition of aro-matic hydrocarbons in contaminated aquifers; (3) the control of the extent of methane formation in shallow freshwater environments; (4) the release of phos-phate and trace metals into soil solution; (5) soil gleying; and (6) the corrosion ofburied iron and steel pipes (see review by Lovley, 1991). Manganese reductionmay also serve to (1) assist in the oxidation of organic matter in waters or sediments,(2) release dissolved Mn into groundwaters and sediments, and (3) release tracemetals bound to Mn oxides.
Reduction of other metals. Several other metals are subject to microbially mediatedreduction (Lloyd, 2003, Table 15.12). Several organisms have been isolated that cangrow through dissimilatory reduction of As5� (e.g., Sulfurospirillum arsenophilum,a microaerobic S-reducing bacterium isolated from an As-contaminated watershed).The reduction of AsO4
3� to AsO2� by the ArcC reductase enzyme also forms the
basis for a microbial arsenic resistance mechanism. A wide range of facultativeanaerobes are able to reduce Cr6� to Cr3�, including E. coli, Pseudomonas spp.,Sh. oneidensis, and Aeromonas spp. Obligate anaerobes are also able to reduce Crenzymatically, and the reduction of Cr coupled with anaerobic growth has beenobserved in S-reducing bacteria.
Numerous microorganisms reduce Hg2� to Hg0 for self-protection only, as lit-tle evidence exists that Hg reduction supports microbial growth. Reduction islinked to mercury-resistance (mer) operons providing a detoxification in whichhighly soluble Hg2� is reduced to volatile Hg0. The reduction is for protection againstthe toxic metal rather than for the energy-conserving electron transport character-istics of other microbial reductions. The mercuric reductase is a flavin-containingdisulfide that drives the following reaction:
Hg(RS)2 � NADPH � H� → Hg0 � NADP� � 2RSH.
Organisms active in reducing Hg include strains of Pseudomonas spp., entericbacteria, S. aureus, Ac. ferrooxidans, group B Streptococcus, Streptomyces,and Cryptococcus. Other organisms such as Bacillus, Vibrio, Flavobacterium,
Micronutrients and Trace Metals 421
Ch15-P546807.qxd 11/18/06 7:12 PM Page 421

Alcaligenes, and Acinetobacter might also be included based on Hg resistance,which correlates with Hg2�-reducing ability.
Biomethylation Transformations
Microorganisms have been shown to be intimately involved in the interconver-sions of metals between inorganic and organic compounds. Many metals and met-alloids with toxic potential, such as Hg, As, Cd, Pb, Se, Sn, and Te, are subject toalkylation. Binding a C atom to the metal changes an element’s volatility, solubil-ity, and toxicity. All biotic alkylations are accomplished by one of three coen-zymes: N-methyltetrahydrofolate, S-adenosylmethionine, or methylcobalamine.Methylation is accomplished by a wide array of fungi and bacteria (Table 15.13),and a given species of microorganism may methylate several different metals.Methylation affects elements differently. Cadmium alkyls are water insoluble,while the methylated forms of As are soluble and highly toxic. Similarly to Hg,methylated Se undergoes atmospheric transformations that foster detoxification,deposition, and bioaccumulation.
The methylation of Hg can occur under aerobic or anaerobic conditions, butthe process was found to occur more rapidly under the latter conditions (Robinsonand Tuovinen, 1984). Aerobic organisms such as Pseudomonas spp., Bacillus mega-terium, E. coli, En. aerogenes, and even fungi such as A. niger and Scopulariopsisbrevicaulis have been found capable of Hg methylation. However, sulfate reduc-ers such as Desulfovibrio desulfuricans appear to be the principal methylators ofHg. The reaction occurs through the transfer of methyl groups from methylcobal-amine (cobalt prophyrin), or from methylated vitamin B12, to Hg2�. The normalrole of methylcobalamine in D. desulfuricans is to provide the methyl group in
422 Chapter 15 Soil Biogeochemical Cycling of Inorganic Nutrients
TABLE 15.13 Microbial Genera Known to Contribute to Methylation of Metals underAerobic Conditionsa
Genera Arsenic (As) Mercury (Hg) Selenium (Se) Lead (Pb)
FungiAspergillus X X XCandida XNeurospora X XPenicillium X XSaccharomyces X XScopulariopus X X X
BacteriaAeromonas X X XAcinetobacter XBacillus XEscherichia X XFlavobacterium X X XPseudomonas X X X X
aWith permission from Klein and Thayer (1990).
Ch15-P546807.qxd 11/18/06 7:12 PM Page 422
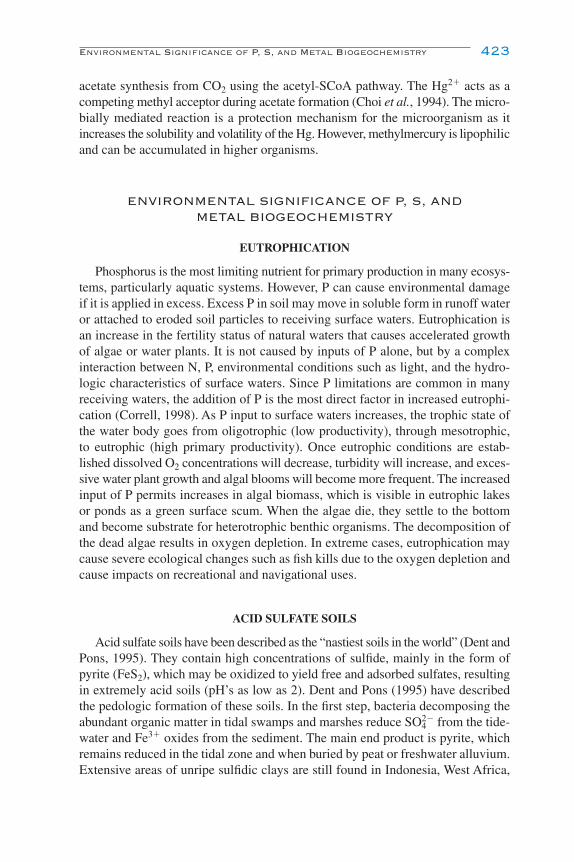
acetate synthesis from CO2 using the acetyl-SCoA pathway. The Hg2� acts as acompeting methyl acceptor during acetate formation (Choi et al., 1994). The micro-bially mediated reaction is a protection mechanism for the microorganism as itincreases the solubility and volatility of the Hg. However, methylmercury is lipophilicand can be accumulated in higher organisms.
ENVIRONMENTAL SIGNIFICANCE OF P, S, ANDMETAL BIOGEOCHEMISTRY
EUTROPHICATION
Phosphorus is the most limiting nutrient for primary production in many ecosys-tems, particularly aquatic systems. However, P can cause environmental damageif it is applied in excess. Excess P in soil may move in soluble form in runoff wateror attached to eroded soil particles to receiving surface waters. Eutrophication isan increase in the fertility status of natural waters that causes accelerated growthof algae or water plants. It is not caused by inputs of P alone, but by a complexinteraction between N, P, environmental conditions such as light, and the hydro-logic characteristics of surface waters. Since P limitations are common in manyreceiving waters, the addition of P is the most direct factor in increased eutrophi-cation (Correll, 1998). As P input to surface waters increases, the trophic state ofthe water body goes from oligotrophic (low productivity), through mesotrophic,to eutrophic (high primary productivity). Once eutrophic conditions are estab-lished dissolved O2 concentrations will decrease, turbidity will increase, and exces-sive water plant growth and algal blooms will become more frequent. The increasedinput of P permits increases in algal biomass, which is visible in eutrophic lakesor ponds as a green surface scum. When the algae die, they settle to the bottomand become substrate for heterotrophic benthic organisms. The decomposition ofthe dead algae results in oxygen depletion. In extreme cases, eutrophication maycause severe ecological changes such as fish kills due to the oxygen depletion andcause impacts on recreational and navigational uses.
ACID SULFATE SOILS
Acid sulfate soils have been described as the “nastiest soils in the world” (Dent andPons, 1995). They contain high concentrations of sulfide, mainly in the form ofpyrite (FeS2), which may be oxidized to yield free and adsorbed sulfates, resultingin extremely acid soils (pH’s as low as 2). Dent and Pons (1995) have describedthe pedologic formation of these soils. In the first step, bacteria decomposing theabundant organic matter in tidal swamps and marshes reduce SO4
2� from the tide-water and Fe3� oxides from the sediment. The main end product is pyrite, whichremains reduced in the tidal zone and when buried by peat or freshwater alluvium.Extensive areas of unripe sulfidic clays are still found in Indonesia, West Africa,
Environmental Significance of P, S, and Metal Biogeochemistry 423
Ch15-P546807.qxd 11/18/06 7:12 PM Page 423
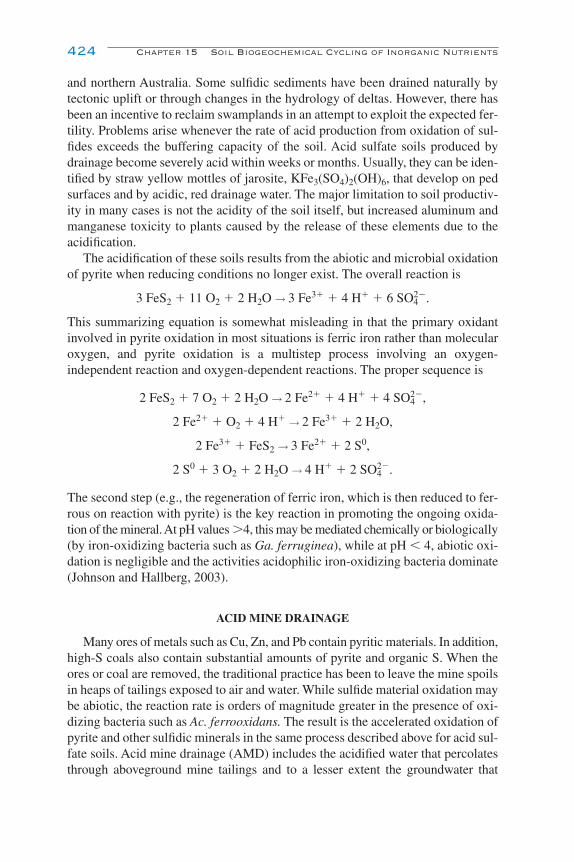
and northern Australia. Some sulfidic sediments have been drained naturally bytectonic uplift or through changes in the hydrology of deltas. However, there hasbeen an incentive to reclaim swamplands in an attempt to exploit the expected fer-tility. Problems arise whenever the rate of acid production from oxidation of sul-fides exceeds the buffering capacity of the soil. Acid sulfate soils produced bydrainage become severely acid within weeks or months. Usually, they can be iden-tified by straw yellow mottles of jarosite, KFe3(SO4)2(OH)6, that develop on pedsurfaces and by acidic, red drainage water. The major limitation to soil productiv-ity in many cases is not the acidity of the soil itself, but increased aluminum andmanganese toxicity to plants caused by the release of these elements due to theacidification.
The acidification of these soils results from the abiotic and microbial oxidationof pyrite when reducing conditions no longer exist. The overall reaction is
3 FeS2 � 11 O2 � 2 H2O → 3 Fe3� � 4 H� � 6 SO42�.
This summarizing equation is somewhat misleading in that the primary oxidantinvolved in pyrite oxidation in most situations is ferric iron rather than molecularoxygen, and pyrite oxidation is a multistep process involving an oxygen-independent reaction and oxygen-dependent reactions. The proper sequence is
2 FeS2 � 7 O2 � 2 H2O → 2 Fe2� � 4 H� � 4 SO42�,
2 Fe2� � O2 � 4 H� → 2 Fe3� � 2 H2O,
2 Fe3� � FeS2 → 3 Fe2� � 2 S0,
2 S0 � 3 O2 � 2 H2O → 4 H� � 2 SO42�.
The second step (e.g., the regeneration of ferric iron, which is then reduced to fer-rous on reaction with pyrite) is the key reaction in promoting the ongoing oxida-tion of the mineral. At pH values �4, this may be mediated chemically or biologically(by iron-oxidizing bacteria such as Ga. ferruginea), while at pH � 4, abiotic oxi-dation is negligible and the activities acidophilic iron-oxidizing bacteria dominate(Johnson and Hallberg, 2003).
ACID MINE DRAINAGE
Many ores of metals such as Cu, Zn, and Pb contain pyritic materials. In addition,high-S coals also contain substantial amounts of pyrite and organic S. When theores or coal are removed, the traditional practice has been to leave the mine spoilsin heaps of tailings exposed to air and water. While sulfide material oxidation maybe abiotic, the reaction rate is orders of magnitude greater in the presence of oxi-dizing bacteria such as Ac. ferrooxidans. The result is the accelerated oxidation ofpyrite and other sulfidic minerals in the same process described above for acid sul-fate soils. Acid mine drainage (AMD) includes the acidified water that percolatesthrough aboveground mine tailings and to a lesser extent the groundwater that
424 Chapter 15 Soil Biogeochemical Cycling of Inorganic Nutrients
Ch15-P546807.qxd 11/18/06 7:12 PM Page 424
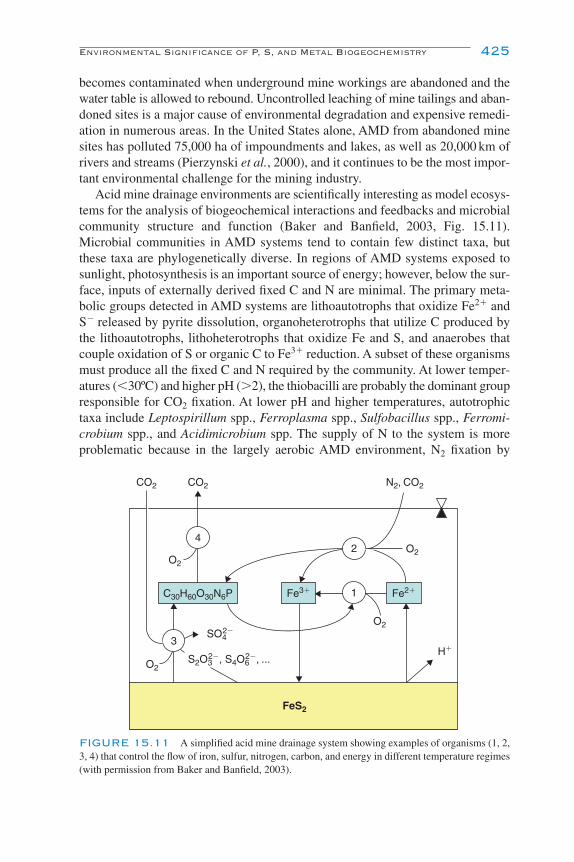
becomes contaminated when underground mine workings are abandoned and thewater table is allowed to rebound. Uncontrolled leaching of mine tailings and aban-doned sites is a major cause of environmental degradation and expensive remedi-ation in numerous areas. In the United States alone, AMD from abandoned minesites has polluted 75,000 ha of impoundments and lakes, as well as 20,000 km ofrivers and streams (Pierzynski et al., 2000), and it continues to be the most impor-tant environmental challenge for the mining industry.
Acid mine drainage environments are scientifically interesting as model ecosys-tems for the analysis of biogeochemical interactions and feedbacks and microbialcommunity structure and function (Baker and Banfield, 2003, Fig. 15.11).Microbial communities in AMD systems tend to contain few distinct taxa, butthese taxa are phylogenetically diverse. In regions of AMD systems exposed tosunlight, photosynthesis is an important source of energy; however, below the sur-face, inputs of externally derived fixed C and N are minimal. The primary meta-bolic groups detected in AMD systems are lithoautotrophs that oxidize Fe2� andS� released by pyrite dissolution, organoheterotrophs that utilize C produced bythe lithoautotrophs, lithoheterotrophs that oxidize Fe and S, and anaerobes thatcouple oxidation of S or organic C to Fe3� reduction. A subset of these organismsmust produce all the fixed C and N required by the community. At lower temper-atures (�30ºC) and higher pH (�2), the thiobacilli are probably the dominant groupresponsible for CO2 fixation. At lower pH and higher temperatures, autotrophictaxa include Leptospirillum spp., Ferroplasma spp., Sulfobacillus spp., Ferromi-crobium spp., and Acidimicrobium spp. The supply of N to the system is moreproblematic because in the largely aerobic AMD environment, N2 fixation by
Environmental Significance of P, S, and Metal Biogeochemistry 425
1
24
3
FeS2
CO2 CO2 N2, CO2
O2
O2
O2
O2
SO42 �
S2O32 �, S4O6
2 �, ...H�
Fe3� Fe2�C30H60O30N6P
FIGURE 15.11 A simplified acid mine drainage system showing examples of organisms (1, 2,3, 4) that control the flow of iron, sulfur, nitrogen, carbon, and energy in different temperature regimes(with permission from Baker and Banfield, 2003).
Ch15-P546807.qxd 11/18/06 7:12 PM Page 425

nitrogenase is inhibited. In moderately acidic AMD, Ac. ferrooxidans may over-come this problem by using tetrathionate as an electron donor and ferric iron(rather than O2) as an electron acceptor when fixing N. N fixation has not yet beenobserved directly in very low pH environments. Another important symbiosis existsbetween heterotrophic and certain autotrophic species in the AMD ecosystem:autotrophs may depend on coexisting heterotrophs to remove organic compoundsthat are toxic to them.
Given that both oxygen and water are required for the formation of AMD, itshould be possible to prevent or minimize AMD production by excluding one, orboth, of these (Johnson and Hallberg, 2005). Options for preventing the formationof AMD include: (1) flooding or sealing of underground mines, (2) underwaterstorage of mine tailings, (3) land-based storage of sealed tailings, (4) blending ofmineral wastes, (5) total solidification of tailings, (6) application of anion surfac-tants, and (7) microencapsulation (coating) of wastes. Given the practical difficul-ties involved in inhibiting the formation of AMD at the source, the strategy moreoften applied is to minimize the impact that AMD has on receiving streams andrivers using “migration control” measures. These measures have been dividedbetween those remediation technologies that rely on biological activities andthose that do not. Abiotic remediation strategies generally involve the addition ofalkaline materials such as lime to neutralize the pH of the AMD, causing many ofthe metals in solution to precipitate. The basis of biological remediation of AMDrelies on the abilities of some microorganisms to generate alkalinity and immobi-lize metals. Microbiological processes that generate net alkalinity are mostly reduc-tive processes and include methanogenesis, sulfate reduction, and iron and manganesereduction. The current state of the art of bioremediation of AMD is to exploit thesereactions in constructed aerobic wetlands, compost reactors, or packed-bed ironoxidation bioreactors.
HEAVY METAL MINING USING MICROBES
The use of microorganisms to extract metals from ore involves the harnessing ofa natural process in an industrial context. Biomining (a general term referring tomicrobially enhanced leaching or oxidation of metals) has some distinct advan-tages over traditional methods, in that it is more environmentally friendly. It doesnot have the high energy requirements of smelting and does not produce harmfulgaseous emissions. The wastes produced from biomining operations are less biolog-ically and chemically active than traditional mine tailings because it has alreadybeen bioleached. Microbial leaching of ore bodies in situ, in stockpiles, or in minetailings also makes metal recovery feasible from low-grade ores in which themetal is not economically recoverable by smelting. For example, biooxidation ofrefractory gold-bearing ores allows this low-grade ore with as little as 1 g of gold(Au) per metric ton, which would otherwise be considered as waste, to be processedat a cost in range of U.S. $4–6 per metric ton (Rawlings, 2002). Biomining iscommonly used for recovery of Au and uranium (U), but copper (Cu) is recovered
426 Chapter 15 Soil Biogeochemical Cycling of Inorganic Nutrients
Ch15-P546807.qxd 11/18/06 7:12 PM Page 426

in by far the greatest quantities. Ferric sulfides usually accompany the Cu sulfidesin ore and hence Fe transformations are components of the reaction chain. Ferrousiron is formed in the ore body by reaction of ferric iron with CuS:
2 Fe3� � CuS → Cu � 2 Fe2� � S0.
The mobilized Cu is recovered from the leachate by sedimentation, solvent action,or electrolysis. The Fe2� remaining after Cu removal is reoxidized (see the previ-ous equation). Also, sulfur-oxidizing bacteria convert S0 to sulfuric acid:
S0 � H2O � O2 → H2SO4.
This acid fortifies the leaching solution, which is recirculated following the metalharvest.
The organisms involved in biomining are acidolithic, chemolithoautotrophic,able to use ferrous iron or reduced S or both as electron donors, and able to fix CO2.Among important species in ore leaching are the following: Acidithiobacillus ferrooxidans, T. thiooxidans, Leptospirillum ferrooxidans, Sulfobacillus thermo-sulfidooxidans, and Acidianus brierleyi.A properly aerated ore body or suspension ofiron- and S-containing mineral in water is an ideal environment for these organisms:air provides the C source (CO2) and preferred electron acceptor (O2), the mineral oressupply the electron donors, and water is the medium for growth. Inoculation of theore body with microorganisms is usually unnecessary. Normally occurring Fe and Soxidizers and acidophilic heterotrophs establish themselves unaided because theacidic environment is not suitable for the growth of other organisms.
Several commercial-scale biomining processors are operating around the world(Rawlings, 2002). The two main types are irrigation-type and stirred-tank processes.Irrigation processes involve the percolation of leaching solutions through crushedore that has been stacked in heaps or dumps or irrigation of an ore body in situwithout bringing the ore to the surface. Stirred-tank-type processors are large(1000–2000 m3) tanks arranged in series and operated in continuous flow mode, inwhich the feed being added to the first tank overflows from tank to tank until theprocess is sufficiently complete. The stirred-tank operations provide a step up inrate and efficiency of biooxidation, but are expensive to construct and operate.Their use is therefore restricted to the pretreatment of high-value gold-bearingarsenopyrite concentrate. Most current biomining processes are operated at ambi-ent temperatures or in tanks at 40–50ºC. Warmer operations are currently beingdeveloped, which will accelerate the process and make it more economical, butwill also require a better understanding of the thermophilic organisms involved.
MICROBIAL CORROSION OF BURIED IRON ANDCONCRETE PIPES
Most microbially influenced corrosion occurs in the presence of microbial con-sortia in which many different physiological types of bacteria interact within thestructure of biofilms. In the anaerobic corrosion of buried iron pipes, the metal
32
Environmental Significance of P, S, and Metal Biogeochemistry 427
Ch15-P546807.qxd 11/18/06 7:12 PM Page 427

428
TABLE 15.14 Some Bacteria Involved in Corrosion Processesa
Oxygen Inorganic Metabolic endOptimal range
Organism requirement component products Habitat Temp. (ºC) pH
Sulfate reducing: Desulfovibrio Anaerobic Sulfate, thiosulfate Hydrogen sulfide Water, soil, mud, 25–30 6–7.5desulfuricans oil reservoir
Sulfur oxidizing: Acidithiobacillus Aerobic Sulfur, thiosulfate Sulfuric acid Soil, water 28–30 2–4thiooxidans
Thiosulfate oxidizing: Aerobic Thiosulfate, sulfur Sulfur, sulfuric acid Soil, water, mud, 28–30 7Thiobacillus thioparus sewage
Iron bacteria: Crenothrix, Aerobic Iron, manganese Ferric or manganese Water 25 8Leptothrix, Gallionella oxides
Nitrate reducing: Thiobacillus Facultative Thiosulfate, Sulfate Soil, mud, peat, 30 7–9denitrificans sulfur, sulfide water
Hydrogen utilizing: Microaerophilic Hydrogen Water Soil, water 28–30 7Hydrogenomonas
aWith permission from Atlas (1984).
Ch15-P546807.qxd 11/18/06 7:12 PM Page 428

Environmental Significance of P, S, and Metal Biogeochemistry 429
surface acts as an anode in an electrochemical reaction and is transformed to Fe2�.An equivalent number of H� ions are produced at the cathode site. The anaerobic,sulfate-reducing bacteria such as Desulfobacter and Desulfovibrio produce S2�,which reacts with Fe2� to produce FeS. At the same time, hydroxyls from waterreact with H� ions. The overall reaction is
4 Fe � SO42�� 4 H2O → FeS � 3 FeOH2� � 5 OH�.
The conditions required for the reaction include anaerobic sites at redox potentialsless than �400 mV, a pH greater than 5.5, low free-O2 content, and the presenceof SO4
2�. Under these conditions, an Fe pipe of 3-mm wall thickness can be cor-roded through in 5 to 7 years. This is one of the most costly microbial reactions innature. It means that buried Fe pipes must be continually replaced or else pro-tected by wrapping with asphalt or plastic. Additional protection is obtained bymaintaining a small electrical current along the pipe (cathodic protection) to pre-vent the formation of an electrode half-cell.
Other corrosion processes are accomplished by miscellaneous aerobic and fac-ultative bacteria (Table 15.14). Metal pipes are not the only ones to be affected bymicrobially induced corrosion. Concrete is a moderately porous mixture of alka-line precipitates and mineral aggregate. Strong acids react with the alkaline mate-rials, causing structural degradation. Concrete sewer pipes are subject to corrosionby a mutualism between autotrophs and heterotrophs and succession of acidophiles(Little et al., 2000; Fig. 15.12).
H2S� 2O2 → H2SO
4
Concrete sewerpipe wall
H2S
Sulfur-reducingbacteria
Sewage
Thiobacilli
H2S
H2S
FIGURE 15.12 Conceptual diagram of the mutualistic relationship between sulfur-reducingbacteria and thiobacilli that causes corrosion in concrete sewer pipes (with permission from Little et al., 2000).
Ch15-P546807.qxd 11/18/06 7:12 PM Page 429
Anaerobic conditions in the sewage support sulfur-reducing bacteria that con-vert sulfate and organic S to H2S, which volatilizes to the sewer atmosphere. The H2Sredissolves in condensate upon reaching the sewer crown, where a second com-munity of aerobic microorganisms including thiobacilli oxidizes it to corrosiveH2SO4. The organism involved in the latter step was called Thiobacillus concre-tivorous when isolated, but was found to be Acidithiobacillus thiooxidans.
CONCLUSION: MICROORGANISMS ASUNIFIERS OF ELEMENTAL CYCLES IN SOIL
Soil microorganisms not only have a profound influence on the fluxes and cyclingof individual element cycles, but also are strong integrators of the various elementcycles. They integrate C, N, S, P, and various metal element cycles through biomassproduction in two related ways: (1) the stoichiometry of biomass production and (2)the selection of alternative electron acceptors under different redox conditions.
Stoichiometric relationships between substrates and decomposers may providea framework to understanding how the internal cycling of nutrient elements in soilis controlled. It would follow that the release of inorganic forms of N, S, and Pwould occur following the oxidation of C to CO2 in ratios similar to those presentin the organic component from which the C was derived. The frequent reportingof average nutrient concentrations and stoichiometric ratios of organisms and soil(e.g., Table 15.3) suggests that these values are reasonably constant and the approachsound. However, the stabilization of organic materials containing N, S, and P insoil is strongly influenced by the soil matrix itself through various physical andchemical protection mechanisms. The protection afforded by the inorganic matrixis a distinguishing feature of the soil environment compared to aquatic systems.Consequently, while biomass stoichiometry may be a dominant control on nutri-ent cycling in aquatic systems (e.g., Redfield, 1958), its potential control is sharedwith overriding protection mechanisms in terrestrial systems.
REFERENCES AND SUGGESTED READING
Adams, F., and Conrad, J. P. (1953). Transition of phosphite to phosphate in soils. Soil Sci. 75,361–371.
Atlas, R. M. (1984). “Microbiology: Fundamentals and Applications.” Prentice–Hall, New York.Baker, B. J., and Banfield, J. F. (2003). Microbial communities in acid mine drainage. FEMS Microbiol.
Ecol. 44, 139–152.Bolin, B., Rosswall, T., Freney, J. R., Ivanov, M. V., and Richey, J. E. (1983). C, N, P, and S cycles,
major reservoirs and fluxes. In “The Major Biogeochemical Cycles and Their Interactions” (B. Bolin and R. B. Cook, eds.), pp. 41–65. Wiley, New York.
Bowen, H. J. M. (1979). “Environmental Chemistry of the Elements.” Academic Press, London.Brookes, P. C., Powlson, D. S., and Jenkinson, D. S. (1982). Measurement of microbial biomass phos-
phorus in soil. Soil Biol. Biochem. 14, 319–329.Castro, H. F., Williams, N. H., and Ogram, A. (2000). Phylogeny of sulfate-reducing bacteria. FEMS
Microbiol. Ecol. 31, 1–9.
430 Chapter 15 Soil Biogeochemical Cycling of Inorganic Nutrients
Ch15-P546807.qxd 11/18/06 7:12 PM Page 430

Choi, S. C., Chase, T., and Bartha, R. (1994). Metabolic pathways leading to mercury methylation inDesulfovibrio desulfuricans LS. Appl. Environ. Microbiol. 60, 4072–4077.
Correll, D. L. (1998). The role of phosphorus in the eutrophication of receiving waters: a review.J. Environ. Qual. 27, 261–266.
Dent, D. L., and Pons, L. J. (1995). A world perspective on acid sulfate soils. Geoderma 67, 263–276.Ehrlich, H. L. (1996). “Geomicrobiology.” 3rd ed. Dekker, New York.Fortin, D., and Langley, S. (2005). Formation and occurrence of biogenic iron-rich minerals. Earth-Sci.
Rev. 72, 1–19.Foster, T. L., Winans, L., and Helms, S. J. S. (1978). Anaerobic utilization of phosphite and hypophosphite
by Bacillus sp. Appl. Environ. Microbiol. 35, 937–944.Frankenberger, W. T., and Losi, M. E. (1995). Applications of bioremediation in the cleanup of heavy
elements and metalloids. In “Bioremediation: Science and Applications” (H. D. Skipper andR. F. Turco, eds.), pp. 173–210. Soil Sci. Soc. Am., Madison, WI.
Friedrich, C. G. (1998). Physiology and genetics of sulfur-oxidizing bacteria. In “Advances in MicrobialPhysiology” (R. K. Poole, ed.), Vol. 39, pp. 235–289. Academic Press, San Diego.
Garlick, S., Oren, A., and Padan, E. (1977). Occurrence of facultative anoxygenic photosynthesis amongfilamentous and unicellular cyanobacteria. J. Bacteriol. 129, 623–629.
Germida, J. J., and Janzen, H. H. (1993). Factors affecting the oxidation of elemental sulfur in soils.Fertil. Res. 35, 101–114.
Germida, J. J., Wainwright, M., and Gupta, V. V. S. R. (1992). Biochemistry of sulfur cycling in soil. In “Soil Biochemistry” (G. Stotzky and J.-M. Bollag, eds.), Vol. 7, pp. 1–53. Dekker, New York.
Glindemann, D., Edwards, M., Liu, J., and Kuschk, P. (2005). Phosphine in soils, sludges, biogasesand atmospheric implications—a review. Ecol. Eng. 24, 457–463.
Gottschalk, G. (1986). “Bacterial Metabolism.” 2nd ed. Springer-Verlag, New York.Hedley, M. J., Stewart, J. W. B., and Chauhan, B. S. (1982). Changes in inorganic and organic soil phos-
phorus fractions induced by cultivation practices and by laboratory incubations. Soil Sci. Soc. Am.J. 46, 970–976.
Illmer, P., and Schinner, F. (1995). Solubilization of inorganic calcium phosphates—solubilizationmechanisms. Soil Biol. Biochem. 27, 257–263.
Johnson, D. B., and Hallberg, K. B. (2003). The microbiology of acidic mine waters. Res. Microbiol.154, 466–473.
Johnson, D. B., and Hallberg, K. B. (2005). Acid mine drainage remediation options: a review. Sci.Total Environ. 338, 3–14.
Kelly, D. P., and Wood, A. P. (2000). Reclassification of some species of Thiobacillus to the newly des-ignated genera Acidithiobacillus gen. nov., Halothiobacillus gen. nov. and Thermithiobacillus gen.nov. Int. J. Syst. Evol. Microbiol. 50, 511–516.
Klein, D. A., and Thayer, J. S. (1990). Interactions between soil microbial communities and organometalcomplexes. In “Soil Biochemistry” (G. Stotzky and J.-M. Bollag, eds.), Vol. 6, pp. 431–481.Dekker, New York.
Lawrence, J. R. (1987). “Microbial Oxidation of Elemental Sulfur in Agricultural Soils.” Univ. ofSaskatchewan, Saskatoon. [Ph.D. dissertation]
Lawrence, J. R., and Germida, J. J. (1991). Enumeration of sulfur-oxidizing populations in Saskatchewanagricultural soils. Can. J. Soil Sci. 71, 127–136.
Likens, G. E., and Bormann, F. H. (1999). “Biogeochemistry of a Forested Ecosystem.” 2nd ed.Springer-Verlag, New York.
Little, B. J., Ray, R. I., and Pope, R. K. (2000). Relationship between corrosion and the biological sul-fur cycle: a review. Corrosion 56, 433–443.
Lloyd, J. R. (2003). Microbial reduction of metals and radionuclides. FEMS Microbiol. Rev. 27,411–425.
Lovley, D. R. (1991). Dissimilatory Fe(III) and Mn(IV) reduction. Microbiol. Rev. 55, 259–287.Lovley, D. R. (1993). Dissimilatory metal reduction. Annu. Rev. Microbiol. 47, 263–290.Mason, B. H., and Moore, G. B. (1982). “Principles of Geochemistry.” 4th ed. Wiley, New York.
References and Suggested Reading 431
Ch15-P546807.qxd 11/18/06 7:12 PM Page 431

Morton, S. C., and Edwards, M. (2005). Reduced phosphorus compounds in the environment. Crit.Rev. Environ. Sci. Technol. 35, 333–364.
Neilands, J. B. (1981). Microbial iron compounds. Annu. Rev. Biochem. 50, 715–731.Pierzynski, G. M., Sims, J. T., and Vance, G. F. (2000). “Soils and Environmental Quality.” 2nd ed. CRC
Press, Boca Raton, FL.Rawlings, D. E. (2001). The molecular genetics of Thiobacillus ferrooxidans and other mesophilic,
acidophilic, chemolithotrophic, iron- or sulfur-oxidizing bacteria. Hydrometallurgy 59, 187–201.Rawlings, D. E. (2002). Heavy metal mining using microbes. Annu. Rev. Microbiol. 56, 65–91.Reddy, K. R., Feijtel, T. C., and Patrick, W. H. (1986). Effect of soil redox conditions on microbial oxi-
dation of organic matter. In “The Role of Organic Matter in Modern Agriculture” (Y. Chen and Y. Avnimelech, eds.), pp. 117–153. Nijhoff, Dordrecht.
Redfield, A. C. (1958). The biological control of chemical factors in the environment. Am. Sci. 46,205–221.
Robinson, J. B., and Tuovinen, O. H. (1984). Mechanisms of microbial resistance and detoxificationof mercury and organomercury compounds: physiological, biochemical and genetic analyses.Microbiol. Rev. 48, 95–124.
Rodriguez, H., Fraga, R., Gonzalez, T., and Bashan, Y. (2006). Genetics of phosphate solubilizaton and itspotential applications for improving plant growth-promoting bacteria. Plant Soil 287, 15–21.
Roels, J., and Verstraete, W. (2001). Biological formation of volatile phosphorus compounds. BioresourceTechnol. 79, 243–250.
Saggar, S., Bettany, J. R., and Stewart, J. W. B. (1981). Measurement of microbial sulfur in soil. SoilBiol. Biochem. 13, 493–498.
Schink, B., and Friedrich, M. (2000). Phosphite oxidation by sulphate reduction. Nature 406, 37–37.Silvia, D. M., Fuhrmann, J. J., Hartel, P. G., and Zuberer, D. A. (2005). “Principles and Applications
of Soil Microbiology.” 2nd ed. Prentice–Hall, Upper Saddle River, NJ.Stevenson, F. J. (1991). Organic matter–micronutrient reactions in soil. In “Micronutrients in Agriculture”
(J. J. Mortvedt et al., eds.), pp. 145–186. Am. Soc. Agronomy, Madison, WI.Stevenson, F. J., and Cole, M. A. (1999). “Cycles of Soil: Carbon, Nitrogen, Phosphorus, Sulfur,
Micronutrients.” 2nd ed. Wiley, New York.Tebo, B. M., Bargar, J. R., Clement, B. G., Dick, G. J., Murray, K. J., Parker, D., Verity, R., and
Webb, S. M. (2004). Biogenic manganese oxides: properties and mechanisms of formation. Annu.Rev. Earth Planet. Sci. 32, 287–328.
Turner, B. L., Cade-Menun, B. J., Condron, L. M., and Newman, S. (2005). Extraction of soil organicphosphorus. Talanta 66, 294–306.
Vitousek, P. (2004). “Nutrient Cycling and Limitation: Hawai’i as a Model System.” Princeton Univ.Press, Princeton, NJ.
Walbridge, M. R. (1991). Phosphorus availability in acid organic soils of the lower North Carolinacoastal plain. Ecology 72, 2083–2100.
Walker, T. W., and Syers, J. K. (1976). Fate of phosphorus during pedogenesis. Geoderma 15, 1–19.Westheimer, F. H. (1987). Why nature chose phosphates. Science 235, 1173–1178.Whitelaw, M. A. (2000). Growth promotion of plants inoculated with phosphate-solubilizing fungi.
Adv. Agron. 69, 99–151.
432 Chapter 15 Soil Biogeochemical Cycling of Inorganic Nutrients
Ch15-P546807.qxd 11/18/06 7:12 PM Page 432

16The Dynamics of SoilOrganic Matter andNutrient Cycling
Alain F. PlanteWilliam J. Parton
Introduction
Reaction Kinetics
Modeling the Dynamics of Decomposition and NutrientTransformations
Establishing Pool Sizes and Kinetic Constants
Model Selection and Evaluation
References and Suggested Reading
INTRODUCTION
Knowledge of the turnover rates of plant and animal residues, microbial bod-ies, and soil organic matter (SOM) is a prerequisite for understanding the avail-ability and cycling of nutrients such as C, N, S, and P. This understanding isessential in describing ecosystem dynamics and in calculating crop nutrient needsrelative to environmental pollution control. It is also necessary if we are to gainan understanding of how turnover might affect C sequestration and, in turn, bealtered by global change. The significance of microbially mediated decay prod-ucts involved in SOM decomposition and nutrient cycling can best be determinedusing mathematical analysis of tracer and non-tracer data. This requires knowledgeof the various reservoirs or pool sizes in the system under study and the rates atwhich materials are transformed within and transferred between them.
433
Ch16-P546807.qxd 11/18/06 7:13 PM Page 433

434 Chapter 16 The Dynamics of Soil Organic Matter
REACTION KINETICS
Understanding the dynamics of nutrient, plant residue, or SOM transforma-tions in the field requires meaningful mathematical expressions for the biological,chemical, and physical processes involved. The reaction rate of decomposition(represented by the change in substrate concentration with time, dS/dt) can beexpressed as a function of the concentration of one or more of the substrates beingdegraded. The order of the reaction is the value of the exponent on the substrateconcentration in the equation used to describe the reaction.
ZERO-ORDER REACTIONS
Zero-order reactions are those in which the rate of transformation of a substrateis unaffected by changes in the substrate concentration (the exponent on S on theright-hand side of the equation is zero, S0 � 1, thus zero order). Zero-order kinet-ics can be described using the following equation
(1)
In this case, the reaction rate is determined by factors other than the substrate con-centration, such as the amount of catalyst. At high substrate concentrations, at whichsubstrate levels are not limiting, enzymatic reactions are usually zero order, e.g.,nitrification at high NH4
� levels and denitrification at high NO3� levels. Figure 16.1
shows plots of zero-order reactions compared to plots of other kinetic equations.After integration, the equation can be solved for the substrate concentration as afunction of time and becomes
St � S0 � kt (2)
where St (concentration) is the amount of substrate remaining at any time, S0 (con-centration) the initial amount of substrate in the system, k (concentration time�1)the rate constant, and t (time) the time since the initiation of the reaction. A usefulterm to describe the reaction kinetics is the half-life, which is the time required totransform one-half of the initial substrate, e.g.,
St � S0 �2 then
t1/2 � S0 �2k (3)
The mean residence time (or turnover time) is the time required to transform aquantity of material equal to the starting amount S0 (i.e., St � S0) then at steady state
tmrt � S0 �k (4)
dS
dtk� �
Ch16-P546807.qxd 11/18/06 7:13 PM Page 434

FIRST-ORDER REACTIONS
In first-order reactions, the rate of transformation of a substrate is proportionalto the substrate concentration. The rate of change of substrate S with time is
(5)
The decrease in the concentration of the substrate with time t is dependent onthe rate constant k times the concurrent concentration S of the substrate. Afterintegration, we obtain the equation
St � S0e�kt (6)
where St is the concentration of the substrate remaining at any time t. The rate con-stant k involves some expression per unit time (e.g., h�1, day�1, or year�1).
To calculate the time required to transform one-half the initial substrate(St � S0/2), we start with
ln( /2)0
01/2
S
Skt
⎡
⎣⎢⎢
⎤
⎦⎥⎥ � �
dS
dtkS� �
Reaction Kinetics 435
Sub
stra
te c
onc.
Sub
stra
te c
onc.
Sub
stra
te c
onc.
Sub
stra
te c
onc.
TimeTime
Time Time
(a)
(c) (d)
(b)
FIGURE 16.1 Graphical representation of kinetic equations depicting the shapes of substratedecomposition curves: (a) zero order, (b) first order, (c) with exponential growth, and (d) with logisticgrowth.
Ch16-P546807.qxd 11/18/06 7:13 PM Page 435

which is
t1/2 � ln 2�k � 0.693�k (7)
The mean residence time (turnover time of an amount of substrate at steadystate equivalent in size to the starting amount) for first-order reactions is equal to1/k. Note that tmrt for zero-order reactions is S0 �k.
ENZYMATIC KINETICS
Because extracellular enzymes are responsible for much of the substrate depletionin soils, the kinetics of enzyme reactions can be used to model substrate depletion.Enzyme kinetics are represented by the hyperbolic, Michaelis–Menton equation,
(8)
where Vm is the maximum reaction rate (concentration time�1), and is proportionalto the total mass of enzyme in the soil (and hence to the total active biomass), andKm is the Michaelis–Menton, or half-saturation, constant and is the substrate con-centration at which the reaction occurs at half the maximum velocity, Vm�2. Km isinversely related to enzyme–substrate affinity, which tends to have higher valuesin soil than in aqueous solutions and to decrease when soil slurries are shaken;therefore Km is inversely proportional to diffusivity.
Figure 16.2 illustrates how Michaelis–Menton kinetics contain both first- andzero-order regions.
dS
dtV
S
K S�
�m
m
436 Chapter 16 The Dynamics of Soil Organic Matter
Km
Vmax
Vel
ocity
of r
eact
ion
(v)
Vm2
Substrate concentration, A
FIGURE 16.2 Graphical expression of the Michaelis–Menton kinetic parameters for an enzy-matic reaction.
Ch16-P546807.qxd 11/18/06 7:13 PM Page 436
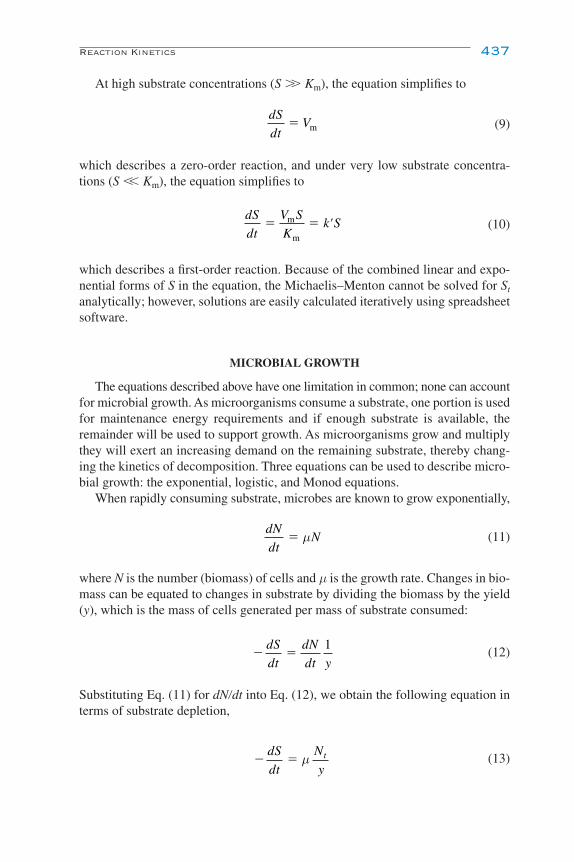
At high substrate concentrations (S �� Km), the equation simplifies to
(9)
which describes a zero-order reaction, and under very low substrate concentra-tions (S �� Km), the equation simplifies to
(10)
which describes a first-order reaction. Because of the combined linear and expo-nential forms of S in the equation, the Michaelis–Menton cannot be solved for St
analytically; however, solutions are easily calculated iteratively using spreadsheetsoftware.
MICROBIAL GROWTH
The equations described above have one limitation in common; none can accountfor microbial growth. As microorganisms consume a substrate, one portion is usedfor maintenance energy requirements and if enough substrate is available, theremainder will be used to support growth. As microorganisms grow and multiplythey will exert an increasing demand on the remaining substrate, thereby chang-ing the kinetics of decomposition. Three equations can be used to describe micro-bial growth: the exponential, logistic, and Monod equations.
When rapidly consuming substrate, microbes are known to grow exponentially,
(11)
where N is the number (biomass) of cells and µ is the growth rate. Changes in bio-mass can be equated to changes in substrate by dividing the biomass by the yield(y), which is the mass of cells generated per mass of substrate consumed:
(12)
Substituting Eq. (11) for dN�dt into Eq. (12), we obtain the following equation interms of substrate depletion,
(13)� �dS
dt
N
ytµ
� �dS
dt
dN
dt y
1
dN
dtN� µ
dS
dt
V S
Kk'S� �m
m
dS
dtV� m
Reaction Kinetics 437
Ch16-P546807.qxd 11/18/06 7:13 PM Page 437

where Nt is the biomass at any given time. Measuring biomass at all given times isunrealistic, therefore Nt can be described in terms of initial biomass, N0, such thatNt � N0 � Nt � N0, and the above equation expands to
and collecting terms
(14)
Expressing all terms as substrate, considering that the total amount of substrateconsumed since t � 0 is S0 � St � (Nt � N0)�y, and letting X0 � N0�y where X0
becomes the amount of substrate needed to produce N0, then the differential formof the exponential equation for substrate depletion is
(15)
While the exponential equation links substrate depletion with microbial growth,it is well recognized that microbes do not grow exponentially at all times. Rather,microbial populations grow to a limit (K). As the population increases, the growthrate (µ) decreases due to competition among individuals for increasingly scarce sub-strate resources. Microbial growth to a limit is expressed by the logistic equation
(16)
A similar exercise of algebra to express the logistic equation in terms of substrate,considering that K is the maximum biomass (original biomass plus that generatedby converting all the original substrate into biomass), yields the differential equa-tion for logistic growth in terms of substrate depletion:
(17)
Initially, S � S0 and the reaction rate is governed primarily by X0. As the micro-bial population grows, S decreases such that the first term in the equation abovedecreases while the second term increases. Therefore, two competing trends gov-ern the substrate depletion rate. The rate of substrate depletion is maximized at�dS�dtmax � µ(S0 � X0)�4. The differential form of the logistic equation can beintegrated and solved for St to give
(18)S S X
S X
S
Xe
tt
� � ��
� � �
0 00 0
0
0
1 1⎛
⎝⎜⎜⎜⎜
⎞
⎠⎟⎟⎟⎟
µ
� ��
� �dS
dt
S
S XS X Sµ
00 0( )
0
⎛
⎝⎜⎜⎜⎜
⎞
⎠⎟⎟⎟⎟
dN
dt
N
KN� �µ 1
⎛⎝⎜⎜⎜
⎞⎠⎟⎟⎟
� � � �dS
dtS X Sµ( )0 0
� � ��dS
dt
N
y
N N
ytµ 0 0( )
µ
� � � �dS
dt
N
y
N
y
N
ytµ µ µ0 0
438 Chapter 16 The Dynamics of Soil Organic Matter
Ch16-P546807.qxd 11/18/06 7:13 PM Page 438
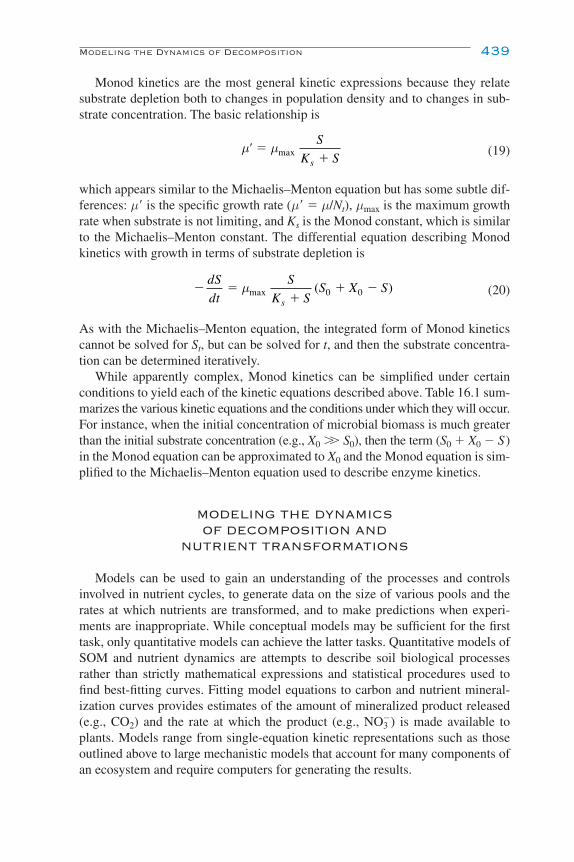
Monod kinetics are the most general kinetic expressions because they relatesubstrate depletion both to changes in population density and to changes in sub-strate concentration. The basic relationship is
(19)
which appears similar to the Michaelis–Menton equation but has some subtle dif-ferences: µ� is the specific growth rate (µ� � µ/Nt), µmax is the maximum growthrate when substrate is not limiting, and Ks is the Monod constant, which is similarto the Michaelis–Menton constant. The differential equation describing Monodkinetics with growth in terms of substrate depletion is
(20)
As with the Michaelis–Menton equation, the integrated form of Monod kineticscannot be solved for St, but can be solved for t, and then the substrate concentra-tion can be determined iteratively.
While apparently complex, Monod kinetics can be simplified under certainconditions to yield each of the kinetic equations described above. Table 16.1 sum-marizes the various kinetic equations and the conditions under which they will occur.For instance, when the initial concentration of microbial biomass is much greaterthan the initial substrate concentration (e.g., X0 �� S0), then the term (S0 � X0 � S)in the Monod equation can be approximated to X0 and the Monod equation is sim-plified to the Michaelis–Menton equation used to describe enzyme kinetics.
MODELING THE DYNAMICS OF DECOMPOSITION AND
NUTRIENT TRANSFORMATIONS
Models can be used to gain an understanding of the processes and controlsinvolved in nutrient cycles, to generate data on the size of various pools and therates at which nutrients are transformed, and to make predictions when experi-ments are inappropriate. While conceptual models may be sufficient for the firsttask, only quantitative models can achieve the latter tasks. Quantitative models ofSOM and nutrient dynamics are attempts to describe soil biological processesrather than strictly mathematical expressions and statistical procedures used tofind best-fitting curves. Fitting model equations to carbon and nutrient mineral-ization curves provides estimates of the amount of mineralized product released(e.g., CO2) and the rate at which the product (e.g., NO3
�) is made available toplants. Models range from single-equation kinetic representations such as thoseoutlined above to large mechanistic models that account for many components ofan ecosystem and require computers for generating the results.
� ��
� �dS
dt
S
K SS X S
s
µmax 0 0( )
µ µ'S
K Ss
��
max
Modeling the Dynamics of Decomposition 439
Ch16-P546807.qxd 11/18/06 7:13 PM Page 439

TABLE 16.1 The Monod Kinetic Equation, Its Simplifications, and the Conditions under Which the Simplifications Can Be Made
SolveCondition Outcome Kinetics Differential form Integrated form for S?
Monod N
S0 �� Ks Ks � S � S Exponential St � S0 � X0 � X0ekt Y
S0 �� Ks Ks � S � Ks Logistic Y
X0 �� S0 S0 � X0 � S � X0 Michaelis– NMenton
X0 �� S0 S0 � X0 � S � X0 First order St � S0e�kt Y
and S0 �� Ks Ks � S � Ks
X0 �� S0 S0 � X0 � S � X0 Zero order St � S0 � kt Y
and S0 �� Ks Ks � S � S
� �dS
dt
S X
Kk S
s
µmax 0 �
S S KS
SV tt s
t0
0m� � �ln
⎛
⎝
⎜⎜⎜⎜⎜
⎞
⎠
⎟⎟⎟⎟⎟⎟� �
��
�
dS
dt
S X
K Sk
S
K Ss sµmax
0 �
S S XS X
S
Xe
tt
� � ��
� � �0 0
0 0
0
01 1
⎛
⎝⎜⎜⎜⎜⎜
⎞
⎠
⎟⎟⎟⎟⎟µ
� � � �dSdt
S
KS X S
s
µmax ( )0 0
� � � �dSdt
S X Sµmax ( )0 0
KS
SS X K
X
Xst
stln ( )ln
00 0
0
⎛
⎝⎜⎜⎜⎜⎜
⎞
⎠
⎟⎟⎟⎟⎟
⎛
⎝⎜⎜� � � ⎜⎜⎜⎜
⎞
⎠
⎟⎟⎟⎟⎟� �( ) maxS X t0 0 µ� �
�� �
dSdt
SK S
S X Ss
µmax ( )0 0
� � �dS
dtX kµmax 0 �
440
Ch16-P546807.qxd 11/18/06 7:13 PM Page 440
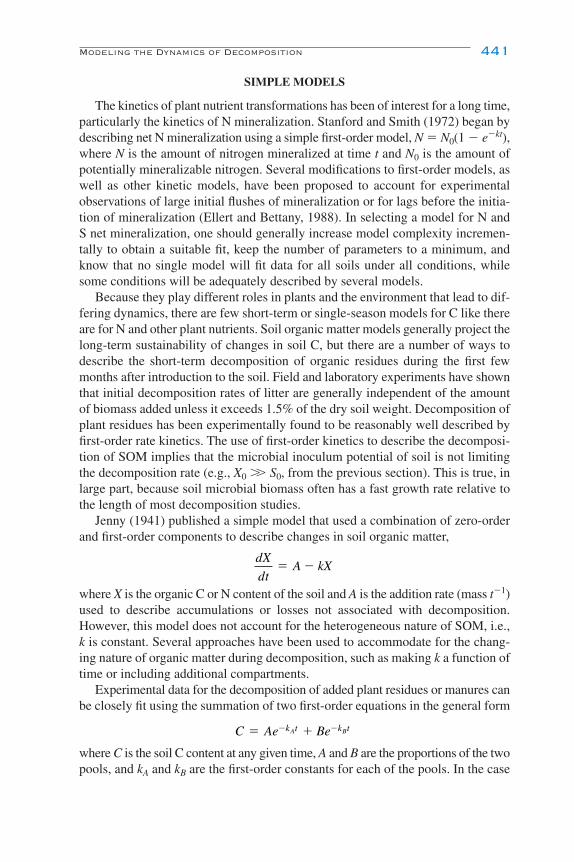
SIMPLE MODELS
The kinetics of plant nutrient transformations has been of interest for a long time,particularly the kinetics of N mineralization. Stanford and Smith (1972) began bydescribing net N mineralization using a simple first-order model, N � N0(1 � e�kt),where N is the amount of nitrogen mineralized at time t and N0 is the amount ofpotentially mineralizable nitrogen. Several modifications to first-order models, aswell as other kinetic models, have been proposed to account for experimentalobservations of large initial flushes of mineralization or for lags before the initia-tion of mineralization (Ellert and Bettany, 1988). In selecting a model for N andS net mineralization, one should generally increase model complexity incremen-tally to obtain a suitable fit, keep the number of parameters to a minimum, andknow that no single model will fit data for all soils under all conditions, whilesome conditions will be adequately described by several models.
Because they play different roles in plants and the environment that lead to dif-fering dynamics, there are few short-term or single-season models for C like thereare for N and other plant nutrients. Soil organic matter models generally project thelong-term sustainability of changes in soil C, but there are a number of ways todescribe the short-term decomposition of organic residues during the first fewmonths after introduction to the soil. Field and laboratory experiments have shownthat initial decomposition rates of litter are generally independent of the amountof biomass added unless it exceeds 1.5% of the dry soil weight. Decomposition ofplant residues has been experimentally found to be reasonably well described byfirst-order rate kinetics. The use of first-order kinetics to describe the decomposi-tion of SOM implies that the microbial inoculum potential of soil is not limitingthe decomposition rate (e.g., X0 �� S0, from the previous section). This is true, inlarge part, because soil microbial biomass often has a fast growth rate relative tothe length of most decomposition studies.
Jenny (1941) published a simple model that used a combination of zero-orderand first-order components to describe changes in soil organic matter,
where X is the organic C or N content of the soil and A is the addition rate (mass t�1)used to describe accumulations or losses not associated with decomposition.However, this model does not account for the heterogeneous nature of SOM, i.e.,k is constant. Several approaches have been used to accommodate for the chang-ing nature of organic matter during decomposition, such as making k a function oftime or including additional compartments.
Experimental data for the decomposition of added plant residues or manures canbe closely fit using the summation of two first-order equations in the general form
where C is the soil C content at any given time, A and B are the proportions of the twopools, and kA and kB are the first-order constants for each of the pools. In the case
C Ae Bek t k tA B� �� �
dX
dtA kX� �
Modeling the Dynamics of Decomposition 441
Ch16-P546807.qxd 11/18/06 7:13 PM Page 441
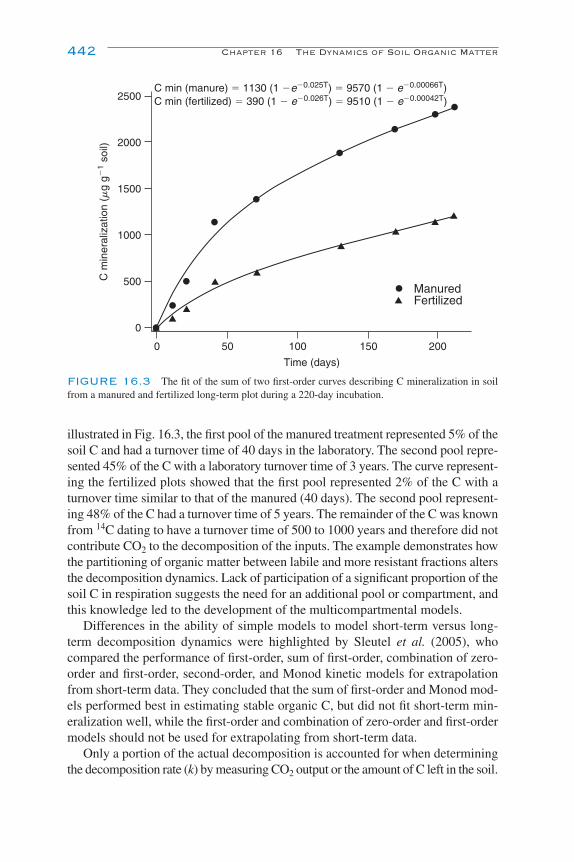
illustrated in Fig. 16.3, the first pool of the manured treatment represented 5% of thesoil C and had a turnover time of 40 days in the laboratory. The second pool repre-sented 45% of the C with a laboratory turnover time of 3 years. The curve represent-ing the fertilized plots showed that the first pool represented 2% of the C with aturnover time similar to that of the manured (40 days). The second pool represent-ing 48% of the C had a turnover time of 5 years. The remainder of the C was knownfrom 14C dating to have a turnover time of 500 to 1000 years and therefore did notcontribute CO2 to the decomposition of the inputs. The example demonstrates howthe partitioning of organic matter between labile and more resistant fractions altersthe decomposition dynamics. Lack of participation of a significant proportion of thesoil C in respiration suggests the need for an additional pool or compartment, andthis knowledge led to the development of the multicompartmental models.
Differences in the ability of simple models to model short-term versus long-term decomposition dynamics were highlighted by Sleutel et al. (2005), whocompared the performance of first-order, sum of first-order, combination of zero-order and first-order, second-order, and Monod kinetic models for extrapolationfrom short-term data. They concluded that the sum of first-order and Monod mod-els performed best in estimating stable organic C, but did not fit short-term min-eralization well, while the first-order and combination of zero-order and first-ordermodels should not be used for extrapolating from short-term data.
Only a portion of the actual decomposition is accounted for when determiningthe decomposition rate (k) by measuring CO2 output or the amount of C left in the soil.
442 Chapter 16 The Dynamics of Soil Organic Matter
0
0
500
1500
1000
2000
2500
50 100 150 200
Time (days)
ManuredFertilized
C m
iner
aliz
atio
n (m
g g�
1 so
il)C min (manure) � 1130 (1 �e�0.025T) � 9570 (1 � e�0.00066T)C min (fertilized) � 390 (1 � e�0.026T) � 9510 (1 � e�0.00042T)
FIGURE 16.3 The fit of the sum of two first-order curves describing C mineralization in soilfrom a manured and fertilized long-term plot during a 220-day incubation.
Ch16-P546807.qxd 11/18/06 7:13 PM Page 442
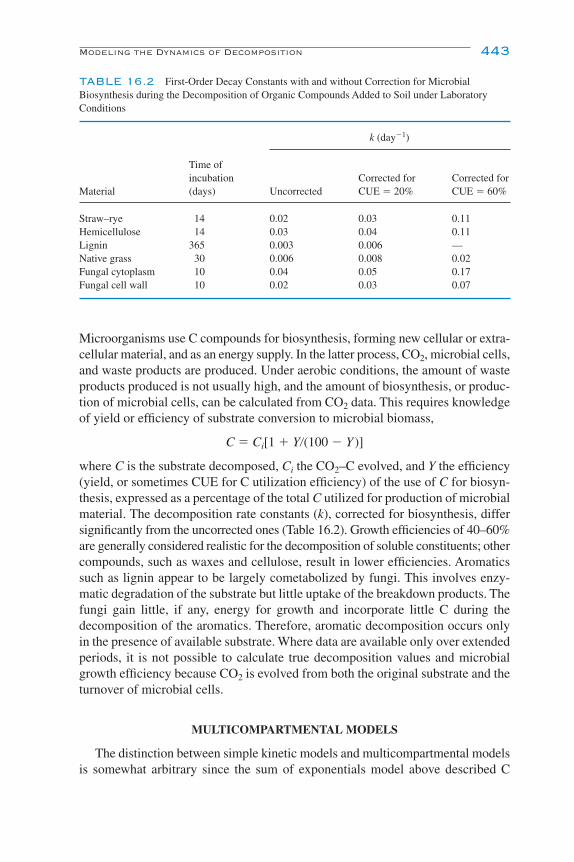
Microorganisms use C compounds for biosynthesis, forming new cellular or extra-cellular material, and as an energy supply. In the latter process, CO2, microbial cells,and waste products are produced. Under aerobic conditions, the amount of wasteproducts produced is not usually high, and the amount of biosynthesis, or produc-tion of microbial cells, can be calculated from CO2 data. This requires knowledgeof yield or efficiency of substrate conversion to microbial biomass,
C � Ci[1 � Y�(100 � Y)]
where C is the substrate decomposed, Ci the CO2–C evolved, and Y the efficiency(yield, or sometimes CUE for C utilization efficiency) of the use of C for biosyn-thesis, expressed as a percentage of the total C utilized for production of microbialmaterial. The decomposition rate constants (k), corrected for biosynthesis, differsignificantly from the uncorrected ones (Table 16.2). Growth efficiencies of 40–60%are generally considered realistic for the decomposition of soluble constituents; othercompounds, such as waxes and cellulose, result in lower efficiencies. Aromaticssuch as lignin appear to be largely cometabolized by fungi. This involves enzy-matic degradation of the substrate but little uptake of the breakdown products. Thefungi gain little, if any, energy for growth and incorporate little C during thedecomposition of the aromatics. Therefore, aromatic decomposition occurs onlyin the presence of available substrate. Where data are available only over extendedperiods, it is not possible to calculate true decomposition values and microbialgrowth efficiency because CO2 is evolved from both the original substrate and theturnover of microbial cells.
MULTICOMPARTMENTAL MODELS
The distinction between simple kinetic models and multicompartmental models is somewhat arbitrary since the sum of exponentials model above described C
Modeling the Dynamics of Decomposition 443
TABLE 16.2 First-Order Decay Constants with and without Correction for MicrobialBiosynthesis during the Decomposition of Organic Compounds Added to Soil under LaboratoryConditions
k (day�1)
Time ofincubation Corrected for Corrected for
Material (days) Uncorrected CUE � 20% CUE � 60%
Straw–rye 14 0.02 0.03 0.11Hemicellulose 14 0.03 0.04 0.11Lignin 365 0.003 0.006 —Native grass 30 0.006 0.008 0.02Fungal cytoplasm 10 0.04 0.05 0.17Fungal cell wall 10 0.02 0.03 0.07
Ch16-P546807.qxd 11/18/06 7:13 PM Page 443
mineralization from two pools or compartments. Generally, compartmental mod-els are needed when a single equation is insufficient to describe the multiple trans-formation processes that occur simultaneously in soils. A multicompartmentalmodel is depicted graphically as a set of boxes, each of which represents a pool orcompartment. Most often, the pools are defined conceptually, but they can also bemeasurable fractions of SOM (see Alternative SOM Models). A series of arrows con-necting the various pools represents transformations of organic matter or a nutri-ent element from one form to the other. The graphical representation of the modelcan be written as a series of simultaneous reactions. Some simple compartmentalmodels can be solved analytically (e.g., in equation form), such as the sum of expo-nentials describe above, but as the models become more complex and include morecompartments, it becomes necessary to solve them numerically.
The advent of computers permitted the solution of complex systems modelsthat require iterative solving of multiple equations to address multicompartmentdynamics. The modeling of soil biological processes began with ecologists work-ing in natural ecosystems in the 1960s and 1970s. Early modeling in agriculturalsystems focused on crop production in response to physical parameters, rather thanbiological processes. A new emphasis in the 1970s on the environmental impactsof agriculture led to early models of N dynamics, including nitrate leaching anddenitrification. Further emphasis on agroecology and SOM management in the1980s and 1990s has led to the development of a large number of models of soilorganic matter dynamics. Several reviews comparing many of these models areavailable (e.g., McGill, 1996; Molina and Smith, 1998; Paustian, 1994; Smith et al.,1997). A subset of these comparisons is provided in Table 16.3.
Paustian (1994) classified multicompartmental models of SOM dynamics aseither “process-oriented” or “organism-oriented.” There are far fewer organism-oriented models (Table 16.3), which are sometimes called “food web models” anddescribe the flow of organic matter and nutrients through different functional ortaxonomic groups of soil organisms. Process-oriented models are those that focuson the processes mediating the transformations of organic matter and nutrients, ratherthan on the activity of specific organisms or groups of organisms. In process-oriented model types, soil organisms, if present, tend to be represented as a genericbiomass or as part of a pool of active SOM. This approach precludes the possibil-ity of modeling changes in organic matter dynamics or nutrient cycling that mightoccur due to changes in the activity or composition of the soil organism commu-nity. Schimel (2001), however, points out that the microbiological underpinningsin process-oriented models are not absent, but are implicit and buried in the equa-tion structure of the model as kinetic constants and response functions.
If most biochemical reactions in soils are mediated by enzymes and followMichaelis–Menton kinetics, and if soil microbial populations grow and die backregularly, why is it that most process-oriented models use first-order kinetics todescribe SOM and nutrient dynamics (Table 16.3)? As demonstrated previously,Monod or Michaelis–Menton kinetics can be simplified to first-order kineticswhen substrate concentrations are sufficiently low. Several studies have shownthat soil respiration usually occurs at 20 to 65% of its maximum potential rate.
444 Chapter 16 The Dynamics of Soil Organic Matter
Ch16-P546807.qxd 11/18/06 7:13 PM Page 444
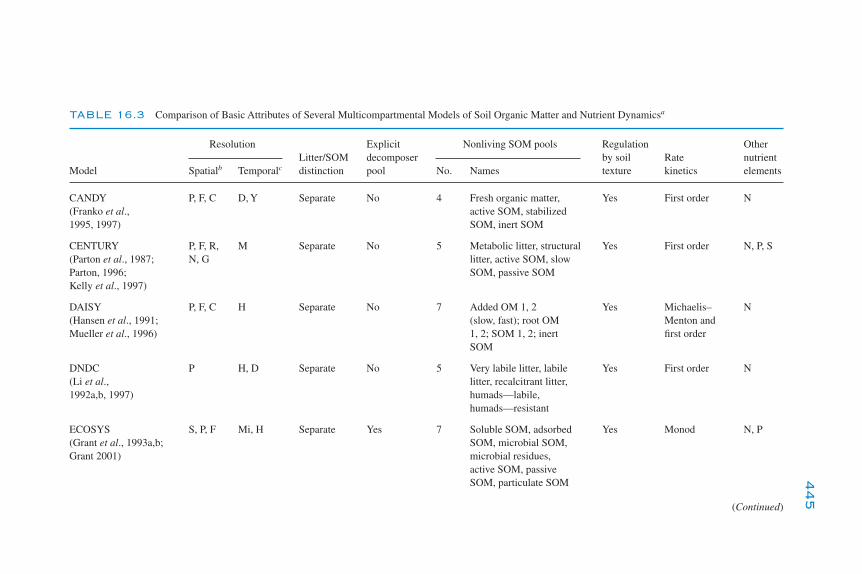
TABLE 16.3 Comparison of Basic Attributes of Several Multicompartmental Models of Soil Organic Matter and Nutrient Dynamicsa
Resolution Explicit Nonliving SOM pools Regulation OtherLitter/SOM decomposer by soil Rate nutrient
Model Spatialb Temporalc distinction pool No. Names texture kinetics elements
CANDY P, F, C D, Y Separate No 4 Fresh organic matter, Yes First order N(Franko et al., active SOM, stabilized1995, 1997) SOM, inert SOM
CENTURY P, F, R, M Separate No 5 Metabolic litter, structural Yes First order N, P, S(Parton et al., 1987; N, G litter, active SOM, slow Parton, 1996; SOM, passive SOMKelly et al., 1997)
DAISY P, F, C H Separate No 7 Added OM 1, 2 Yes Michaelis– N(Hansen et al., 1991; (slow, fast); root OM Menton and Mueller et al., 1996) 1, 2; SOM 1, 2; inert first order
SOM
DNDC P H, D Separate No 5 Very labile litter, labile Yes First order N(Li et al., litter, recalcitrant litter,1992a,b, 1997) humads—labile,
humads—resistant
ECOSYS S, P, F Mi, H Separate Yes 7 Soluble SOM, adsorbed Yes Monod N, P(Grant et al., 1993a,b; SOM, microbial SOM,Grant 2001) microbial residues,
active SOM, passive SOM, particulate SOM
(Continued)
445
Ch16-P546807.qxd 11/18/06 7:13 PM Page 445

TABLE 16.3—Continued
Resolution Explicit Nonliving SOM pools Regulation OtherLitter/SOM decomposer by soil Rate nutrient
Model Spatialb Temporalc distinction pool No. Names texture kinetics elements
Soil food web model P, F Mi, H Separate Yes 4 Labile litter, resistant litter, No Michaelis– N(Hunt et al., 1984, stable SOM, refractile Menton, 1987) SOM logistic, and
first order
ITE P, F Mi Separate Yes 2 Biomass, SOM No Michaelis– N(Thornley and Verberne, Menton and1989; Thornley and first orderCannell, 1992)
NCSOIL S D Separate No 5 Litter Pool I—labile, No First order N(Molina et al., 1983, Pool I—resistant, 1997) Pool II—labile,
Pool II—resistant
PHOENIX P, F D, W, Mo Separate Yes 4 Metabolic litter, structural No Monod and N(McGill et al., 1981) litter, humads, resistant pseudo-first
SOM order
Q-SOIL P, F Y Combined No 1 Single pool No Pseudo-first —(Bosatta and Ågren order1985, 1994)
RothC P, F, C, R, Mo Separate No 4 Decomposable litter, Yes First order —(Jenkinson et al., 1987; N, G resistant litter, humus,Jenkinson, 1990) inert SOM
446
Ch16-P546807.qxd 11/18/06 7:13 PM Page 446
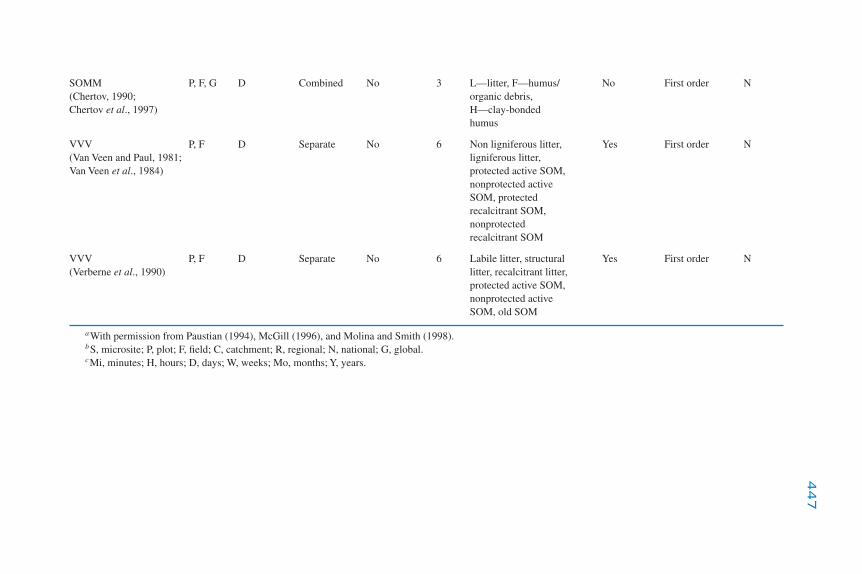
SOMM P, F, G D Combined No 3 L—litter, F—humus/ No First order N(Chertov, 1990; organic debris, Chertov et al., 1997) H—clay-bonded
humus
VVV P, F D Separate No 6 Non ligniferous litter, Yes First order N(Van Veen and Paul, 1981; ligniferous litter, Van Veen et al., 1984) protected active SOM,
nonprotected active SOM, protected recalcitrant SOM, nonprotected recalcitrant SOM
VVV P, F D Separate No 6 Labile litter, structural Yes First order N(Verberne et al., 1990) litter, recalcitrant litter,
protected active SOM, nonprotected active SOM, old SOM
aWith permission from Paustian (1994), McGill (1996), and Molina and Smith (1998).bS, microsite; P, plot; F, field; C, catchment; R, regional; N, national; G, global.cMi, minutes; H, hours; D, days; W, weeks; Mo, months; Y, years.
447
Ch16-P546807.qxd 11/18/06 7:13 PM Page 447

This is generally low enough that using first-order kinetics would not introducesignificant errors. The size of the microbial population remains implicit in the first-order kinetic constant k� (as X0 in the µmaxX0/Ks term). A fundamental assumptionof process-oriented models is that microbial processes are never limited by thesize of the microbial population. In other words, there is always sufficient micro-bial diversity, and populations grow rapidly enough, to adapt to environmentalstresses and changes in substrate supply. These assumptions are generally validfor ecosystem-level models of organic matter dynamics and decomposition; how-ever, caution should be used when modeling specific processes performed byspecific organisms, such as nitrification.
Most models of soil organic matter dynamics begin by modeling the decay oflitter at the soil surface. The models assume that plant material contains a readilydecomposable fraction (typically water-extractable material—sugars, soluble phe-nols, and amino acids) and a more resistant fraction containing cellulose andlignin (see Chap. 12 for additional information on C inputs to soil). Experimentshave shown that the initial plant litter N, polyphenol, carbohydrate, and lignincontents control litter decay rates along with the abiotic temperature and moistureenvironment (higher decay rates with higher soil temperature and moisture condi-tions). Decomposition of different plant material for long periods (2 to 5 years)under various climatic conditions shows that 5–25% of the original C remains.The remaining material consists of plant lignins, microbial products, and humicmaterial. The lignin:N ratio of plant material is positively correlated to the frac-tion of plant material resistant to decomposition. Most litter decay models includemicrobes that decompose plant material and form microbial products with a slowdecay rate. Many of the models also assume that the majority of plant lignin(�70%) is directly transformed into organic material with a decay rate similar tothat of microbial products. Native SOM located below ground is generally describedusing multiple pools to acknowledge its chemical heterogeneity. The number ofpools included in each model varies significantly (Table 16.3). The division ofSOM into various pools is based on stabilization mechanisms, bioavailability, andbiochemical and kinetic parameters. Generally, the pools consist of at least onesmall “active” pool with a rapid turnover rate and one or more larger pools with slowerturnover rates ranging from a few decades to thousands of years. The active poolsare more closely associated with measurable entities such as microbial biomass,while the longer lived pools are generally more conceptual.
A detailed description of each model is beyond the scope of this chapter; however,we present the Rothamsted, Van Veen and Paul, and Century models as examples,with the focus on how they are constructed and on differences among them.
Rothamsted Model
The Rothamsted model (ROTH) was developed using the long-term wheat plots inRothamsted, England, and has more recently been used to simulate SOM dynam-ics at regional and global scales (Jenkinson and Rayner, 1977; Jenkinson et al.,1992). The model represents five SOM fractions: (1) resistant plant material
448 Chapter 16 The Dynamics of Soil Organic Matter
Ch16-P546807.qxd 11/18/06 7:13 PM Page 448

(k � 0.03 year�1), (2) decomposable plant material (k � 4 year�1), (3) microbialbiomass (k � 0.41 year�1), (4) chemically stabilized SOM (k � 0.0003 year�1),and (5) physically stabilized SOM (k � 0.014). The large number of data sets usedto parameterize the model included incubations with 14C-labeled plant material(1- to 10-year periods), 1950–1990 thermonuclear radiocarbon generated by atmos-pheric bomb testing, microbial biomass estimates generated from chloroform fumi-gations, radiocarbon dating of SOM fractions, and measured long-term soil Clevels at the Rothamsted plots. The decomposition rate of each of these compo-nents was assumed to be first order. It was also assumed that during decomposi-tion each of the five components decayed to CO2, microbial biomass, and humifiedorganic matter in similar proportions (Fig. 16.4). The fit between the model andthe experimentally determined results suggested that the model was a useful rep-resentation of the turnover of SOM in cropped soils. The model has since beentested using a variety of SOM data sets from cropping systems, including data setsfrom Rothamsted, England; western Canadian wheat–fallow systems; and sugar-cane soils in Brazil.
The initial version of the Rothamsted model used measured C inputs to drivethe model. However, later versions simulate plant production and nutrient cycling.More recently, Jenkinson (1990) added the impact of cation-exchange capacity onSOM stabilization. This alters the partitioning between CO2 and biomass plushumus. Cation exchange capacity was preferred over clay content because it alsoaccounts for changes in clay mineralogy. The new version of the model alsoreplaced the small highly resistant pool (k � 0.00035 year�1) with an inert pool toaccount for the very old measured radiocarbon ages of SOM. Results from boththe ROTH and the Century models suggest there is a considerable amount of uncer-tainty about the processes that control the formation of passive or inert SOM.Recent experimental results from Australia would suggest that charcoal from theburning of grass and trees is an important source of inert SOM. However, the neces-sity for an inert pool versus a very recalcitrant pool is still under debate.
Modeling the Dynamics of Decomposition 449
Organicinputs
DPM
RPM BIO
BIOHUM
HUMIOM
decay
CO2
CO2
FIGURE 16.4 The ROTHC model showing the flow of carbon through the turnover model(with permission from Jenkinson, 1990). DPM, decomposable plant material; RPM, resistant plantmaterial; IOM, inert organic matter; BIO, microbial biomass; HUM, humified organic matter.
Ch16-P546807.qxd 11/18/06 7:13 PM Page 449

Van Veen and Paul Model
Van Veen and Paul (1981; Van Veen et al., 1984) developed a SOM model (Fig. 16.5)in which plant litter is divided into three fractions: (1) easily decomposable sugarsand amino acids, (2) slowly decomposable cellulose and hemicellulose, and (3)resistant lignin. The soil C pools include: (1) microbial biomass, (2) decomposableSOM, and (3) recalcitrant SOM. The model assumes that microbes decompose theSOM and litter pools and that a certain fraction of the material decomposed willbe stabilized into microbial biomass. Once dead, the microbial biomass can be con-sidered as an easily decomposable pool (cytoplasm) and a more resistant compo-nent (cell wall). Table 16.4 shows the decomposition rate constant of the microbialbiomass and the size of the microbial product pools. The size of the microbial prod-uct pools is small, as these values describe only the products formed from therecently added residue, as would be found in a 14C-labeling experiment. Having themodel separately follow tracers such as 14C and 15N can yield a great deal of infor-mation about recently added components and results in rigorous testing of the model.
The model includes the impact of soil texture on soil C stabilization (higher stabi-lization with higher silt and clay content), direct transfer of lignin-like plant mate-rial to the decomposable SOM pool, and the concept that both decomposable andrecalcitrant SOM is divided into physically protected and nonprotected fractions.The physically protected SOM fraction has a lower decomposition rate as a resultof soil physical aggregation (harder for microbes to decompose plant material in
450 Chapter 16 The Dynamics of Soil Organic Matter
Abovegrounddecomposition
Litter
Roots Beneath ground
Biomass
Not physicallyprotected
Physicallyprotected
CO2CO2
CO2
CO2
Decomposablefraction
Ligniferousfraction
Non-ligninfraction
Ligniferousfraction
Recalcitrant nativesoil organic matter
Decomposable nativesoil organic matter
Not physicallyprotected
Physicallyprotected
50%
50%
80% 20%33%67%
FIGURE 16.5 The structure of the Van Veen and Paul model for soil organic matter dynamics(with permission from Van Veen and Paul, 1981).
Ch16-P546807.qxd 11/18/06 7:13 PM Page 450
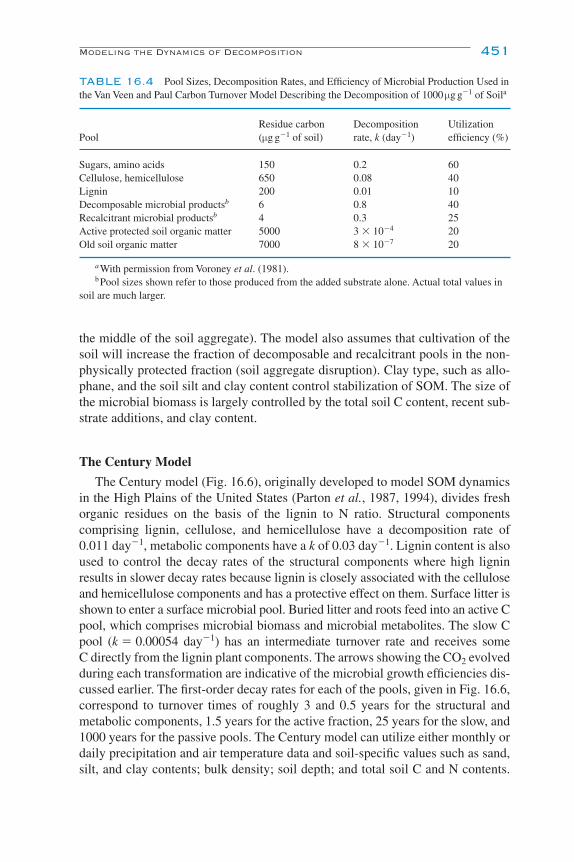
the middle of the soil aggregate). The model also assumes that cultivation of thesoil will increase the fraction of decomposable and recalcitrant pools in the non-physically protected fraction (soil aggregate disruption). Clay type, such as allo-phane, and the soil silt and clay content control stabilization of SOM. The size ofthe microbial biomass is largely controlled by the total soil C content, recent sub-strate additions, and clay content.
The Century Model
The Century model (Fig. 16.6), originally developed to model SOM dynamicsin the High Plains of the United States (Parton et al., 1987, 1994), divides freshorganic residues on the basis of the lignin to N ratio. Structural componentscomprising lignin, cellulose, and hemicellulose have a decomposition rate of 0.011 day�1, metabolic components have a k of 0.03 day�1. Lignin content is alsoused to control the decay rates of the structural components where high ligninresults in slower decay rates because lignin is closely associated with the celluloseand hemicellulose components and has a protective effect on them. Surface litter isshown to enter a surface microbial pool. Buried litter and roots feed into an active Cpool, which comprises microbial biomass and microbial metabolites. The slow Cpool (k � 0.00054 day�1) has an intermediate turnover rate and receives someC directly from the lignin plant components. The arrows showing the CO2 evolvedduring each transformation are indicative of the microbial growth efficiencies dis-cussed earlier. The first-order decay rates for each of the pools, given in Fig. 16.6,correspond to turnover times of roughly 3 and 0.5 years for the structural andmetabolic components, 1.5 years for the active fraction, 25 years for the slow, and1000 years for the passive pools. The Century model can utilize either monthly ordaily precipitation and air temperature data and soil-specific values such as sand,silt, and clay contents; bulk density; soil depth; and total soil C and N contents.
Modeling the Dynamics of Decomposition 451
TABLE 16.4 Pool Sizes, Decomposition Rates, and Efficiency of Microbial Production Used inthe Van Veen and Paul Carbon Turnover Model Describing the Decomposition of 1000 µg g�1 of Soila
Residue carbon Decomposition Utilization Pool (µg g�1 of soil) rate, k (day�1) efficiency (%)
Sugars, amino acids 150 0.2 60Cellulose, hemicellulose 650 0.08 40Lignin 200 0.01 10Decomposable microbial productsb 6 0.8 40Recalcitrant microbial productsb 4 0.3 25Active protected soil organic matter 5000 3 � 10�4 20Old soil organic matter 7000 8 � 10�7 20
aWith permission from Voroney et al. (1981).bPool sizes shown refer to those produced from the added substrate alone. Actual total values in
soil are much larger.
Ch16-P546807.qxd 11/18/06 7:13 PM Page 451
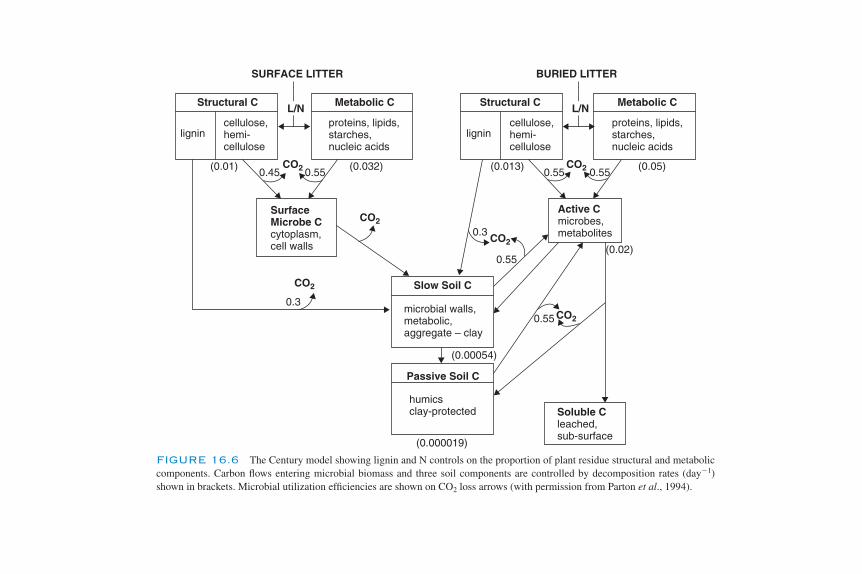
Structural C
lignincellulose,hemi-cellulose
SURFACE LITTER BURIED LITTER
lignincellulose,hemi-cellulose
Structural CMetabolic C
proteins, lipids,starches,nucleic acids
Metabolic C
proteins, lipids,starches,nucleic acids
SurfaceMicrobe Ccytoplasm,cell walls
Active Cmicrobes,metabolites
Slow Soil C
Passive Soil C
microbial walls,metabolic,aggregate – clay
humicsclay-protected Soluble C
leached,sub-surface
CO2
CO2
CO2
CO2
CO2
CO2
L/N L/N
0.55
0.55
0.550.550.45(0.01)
0.3
(0.00054)
(0.000019)
0.55(0.05)
(0.02)
(0.013)(0.032)
0.3
FIGURE 16.6 The Century model showing lignin and N controls on the proportion of plant residue structural and metaboliccomponents. Carbon flows entering microbial biomass and three soil components are controlled by decomposition rates (day�1)shown in brackets. Microbial utilization efficiencies are shown on CO2 loss arrows (with permission from Parton et al., 1994).
Ch16-P546807.qxd 11/18/06 7:13 PM Page 452
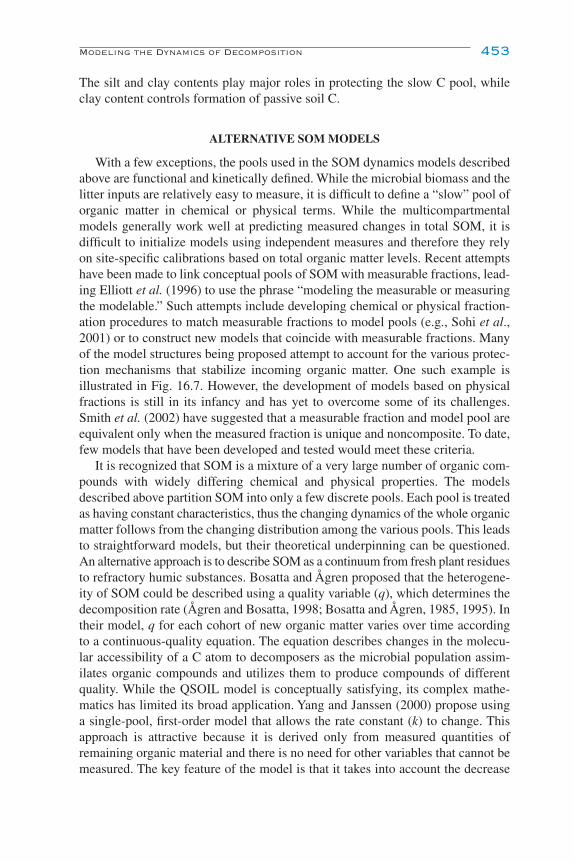
The silt and clay contents play major roles in protecting the slow C pool, whileclay content controls formation of passive soil C.
ALTERNATIVE SOM MODELS
With a few exceptions, the pools used in the SOM dynamics models describedabove are functional and kinetically defined. While the microbial biomass and thelitter inputs are relatively easy to measure, it is difficult to define a “slow” pool oforganic matter in chemical or physical terms. While the multicompartmentalmodels generally work well at predicting measured changes in total SOM, it isdifficult to initialize models using independent measures and therefore they relyon site-specific calibrations based on total organic matter levels. Recent attemptshave been made to link conceptual pools of SOM with measurable fractions, lead-ing Elliott et al. (1996) to use the phrase “modeling the measurable or measuringthe modelable.” Such attempts include developing chemical or physical fraction-ation procedures to match measurable fractions to model pools (e.g., Sohi et al.,2001) or to construct new models that coincide with measurable fractions. Manyof the model structures being proposed attempt to account for the various protec-tion mechanisms that stabilize incoming organic matter. One such example isillustrated in Fig. 16.7. However, the development of models based on physicalfractions is still in its infancy and has yet to overcome some of its challenges.Smith et al. (2002) have suggested that a measurable fraction and model pool areequivalent only when the measured fraction is unique and noncomposite. To date,few models that have been developed and tested would meet these criteria.
It is recognized that SOM is a mixture of a very large number of organic com-pounds with widely differing chemical and physical properties. The modelsdescribed above partition SOM into only a few discrete pools. Each pool is treatedas having constant characteristics, thus the changing dynamics of the whole organicmatter follows from the changing distribution among the various pools. This leadsto straightforward models, but their theoretical underpinning can be questioned.An alternative approach is to describe SOM as a continuum from fresh plant residuesto refractory humic substances. Bosatta and Ågren proposed that the heterogene-ity of SOM could be described using a quality variable (q), which determines thedecomposition rate (Ågren and Bosatta, 1998; Bosatta and Ågren, 1985, 1995). Intheir model, q for each cohort of new organic matter varies over time accordingto a continuous-quality equation. The equation describes changes in the molecu-lar accessibility of a C atom to decomposers as the microbial population assim-ilates organic compounds and utilizes them to produce compounds of differentquality. While the QSOIL model is conceptually satisfying, its complex mathe-matics has limited its broad application. Yang and Janssen (2000) propose usinga single-pool, first-order model that allows the rate constant (k) to change. Thisapproach is attractive because it is derived only from measured quantities ofremaining organic material and there is no need for other variables that cannot bemeasured. The key feature of the model is that it takes into account the decrease
Modeling the Dynamics of Decomposition 453
Ch16-P546807.qxd 11/18/06 7:13 PM Page 453
over time of the average and actual mineralization rates, which the authors refer toas “aging.”
MODELS OF NON-C NUTRIENT ELEMENTS
Nutrient cycles in soil are tightly coupled through the nutrient demands of themicrobial biomass during decomposition. For this reason, several of the C-centricmulticompartmental models of SOM dynamics are able to model nutrient ele-ments such as N, P, and S (Table 16.3). Models that describe the dynamics of
454 Chapter 16 The Dynamics of Soil Organic Matter
UnprotectedSOM
Physicallyprotected
SOM
Chemicallyprotected
SOM
Biochemicallyprotected SOM
CO2
CO2
CO2
CO2
�250 µmPOM C
53–250 µmPOM C
Silt- and clay-associated
C
Non-hydrolyzableC
Adsorption/desorption
Aggregate formation/turnover
Condensation/complexation
FIGURE 16.7 A soil organic matter dynamics model based on measurable fractions thataccount for various protection mechanisms (with permission from Six et al., 2002).
Ch16-P546807.qxd 11/18/06 7:13 PM Page 454

nutrient elements differ in scale and scope from the models of SOM dynamics.While SOM models evolved out of ecological and environmental perspectives,models of nutrient dynamics evolved primarily from the desire to improve agro-nomic crop production and fertilizer use efficiency. More recently, nutrient mod-els have been extended to the study of environmental pollution from excessfertilizer or the land spreading of manures and wastes.
Frissel and Van Veen (1982) classified models of soil N in terms of (1) their pur-pose, prediction, management, or scientific understanding; (2) their time span; (3) whether they were budget-based or dynamic models; and (4) whether the modelswere dominated by transport processes, SOM dynamics, or soil–plant relations.Models of soil N dynamics generally include descriptions of physical processes suchas the transport of water, solutes, heat, and gases; biological processes such as min-eralization, immobilization, nitrification, and denitrification; and physicochemicalprocesses such as volatilization, adsorption, and fixation. Model structures of soilN models, for example ANIMO illustrated in Fig. 16.8, generally resemble theconceptual depiction of the soil N cycle. A large set of models of N turnover in thesoil–plant system, both stand-alone models and submodels, have been comparedby running simulations on the same data set (de Willigen, 1991), similar to thecomparison of SOM models performed by Smith et al. (1997). The conclusions ofthe N model comparison were that the models adequately predicted abovegroundprocesses such as plant uptake of N and dry matter production, but the simulationof belowground microbial N transformations was the most problematic. Wu and
Modeling the Dynamics of Decomposition 455
N2O, N2
Nitr
ifica
tion
Denitrification
Fertilizer
NO3�
Atmospheredeposition
N in soilorganic matter
Mineralization
Min
eral
izat
ion
Immobilization
Organic N in plantlitter and manure
Dec
ay
Dissolution
Dissolution
Adsorption
Desorption
Volatilization
Plant uptake
NH3NH4�
N in solubleorganic matter
NH4� at soil
complex
Leaching Harvest output
FIGURE 16.8 The structure of the ANIMO N submodel for soil nitrogen dynamics (with per-mission from Wu and McGechan, 1998).
Ch16-P546807.qxd 11/18/06 7:13 PM Page 455

McGechan (1998) provide a more detailed examination of four N dynamics mod-els (SOILN, ANIMO, DAISY, and SUNDIAL), in which they focused on theequations representing the constituent processes. SOILN was found to have themost detailed treatment of plant uptake. ANIMO had the most complex treatmentof animal slurry and also the most mechanistic representation of denitrification. Inboth comparisons, the models demonstrated individual strengths and weaknesses,but in general they are more similar than they are different.
Phosphorus cycling models have been developed and incorporated into plant–soil ecosystem models. Similar to N, the demand for P cycling models arosebecause soil P availability is the major nutrient limiting plant production in manytropical systems and, conversely, because P from nonpoint sources such as agri-cultural soils has a major environmental impact on water quality. Despite this, fewmodels calculating long-term changes in soil P have been developed partly becauseof the many complicated solid-phase interactions of P sorption to minerals overand above the biological transformations. Jones et al. (1984) originally developedroutines for simulating soil P dynamics, which became incorporated into the EPIC(erosion–productivity impact calculator) model. These routines have since beenincorporated into several other models that describe the transport of soluble andparticulate P, adsorption and desorption, mineralization and immobilization betweenorganic and inorganic forms, leaching, plant uptake, and runoff. As an example,the model structure of the GLEAMS P model is illustrated in Fig. 16.9. Lewis andMcGechan (2002) compared four of the published P cycling models (ANIMO,GLEAMS, DAYCENT, and MACRO) and concluded that all the existing modelshave substantial limitations and that a hybrid submodel combining the best fea-tures of these models needs to be developed. Unfortunately, there are limited data
456 Chapter 16 The Dynamics of Soil Organic Matter
P run offP sedimentP leaching
FertilizerP
Grain P
Stalk P
Root P
Organic P(animalwaste)
Stableorganicsoil P
Freshorganicsoil P
Labileinorganic
soil P
Activeinorganic
soil P
Stableinorganic
soil P
FIGURE 16.9 The structure of the GLEAMS P submodel for soil phosphorous dynamics (withpermission from Lewis and McGechan, 2002).
Ch16-P546807.qxd 11/18/06 7:13 PM Page 456
available to describe the critical process represented in P cycling models, thuslimiting the accuracy of existing and new P cycling models.
ECOSYSTEM MODELS: INTERACTIONS OF NUTRIENTCYCLING AND SOM DYNAMICS
The initial computer models of SOM dynamics were expanded in the 1980s toinclude nutrient cycling and plant production submodels. The most recentlydeveloped SOM models are capable of simulating losses of nutrients from leach-ing of NO3
� and dissolved organic matter and nitrogen gas losses (N2O, N2, and NOx)from nitrification and denitrification. These models have also been incorporatedinto long-term models of soil development (500,000 to 4 million years), whichinclude plant production, soil N and P dynamics, and SOM dynamics. Applied toa scenario in the humid tropics, the century model correctly demonstrated that N isthe primary limiting factor for plant growth during early soil development (20,000to 300,000 years), while P limits plant growth for old soils (�550,000 years).
Ecosystem-level models are generally a hierarchical construction of modelsubcomponents (Fig. 16.10). Each of the model subcomponents can consist of amodel representing more detailed processes. The figure demonstrates that micro-bial transformations have a big impact on available soil nutrients and that avail-able soil nutrients then impact nutrient uptake by the plants, which modifies plantproduction and crop yields. Climate, land use, and soil physical information aredrivers for plant production, soil water transport, and microbial transformations.The hierarchical construction provides a means of connecting various componentsinto a single cohesive model that can examine the large number of interacting param-eters required to examine processes at large spatial and temporal scales. However,the complexity of the agroecosystem models can make it difficult to verify that theresults are reasonable. For example, the failure of the model to properly simulatedenitrification N2O and N2 gas fluxes can result from an error in estimating plantdemand for NO3 and NH4, and net uptake of NO3 and NH4 by soil microbes, or errorsin simulating soil water content. Generally, models that are applied at larger spatialand temporal scales use input data of lower resolution; therefore errors in estimatingthe validity of model output are not easily scaled up and become difficult to estimate.
Both data and modeling studies show that there are strong interactions betweennutrient availability and SOM dynamics. The Century model can simulate theinteractions among plant production, nutrient cycling, and SOM dynamics.Paustian et al. (1992) used field-plot data from a 40-year agricultural experimentin Sweden (see Table 16.5) to test the Century model and demonstrate the inter-active impact of adding different types of organic matter (sawdust, green manure,farmyard manure, and straw) and inorganic fertilizer on plant production andnutrient uptake, nutrient cycling, and SOM dynamics. The results for the low Ncontent (�0.5% N) organic additions (straw and sawdust) show that there is adecrease in plant N uptake for sawdust and no change for straw, while soil N andC levels are higher compared to the control treatment (no addition). The decreased
Modeling the Dynamics of Decomposition 457
Ch16-P546807.qxd 11/18/06 7:13 PM Page 457
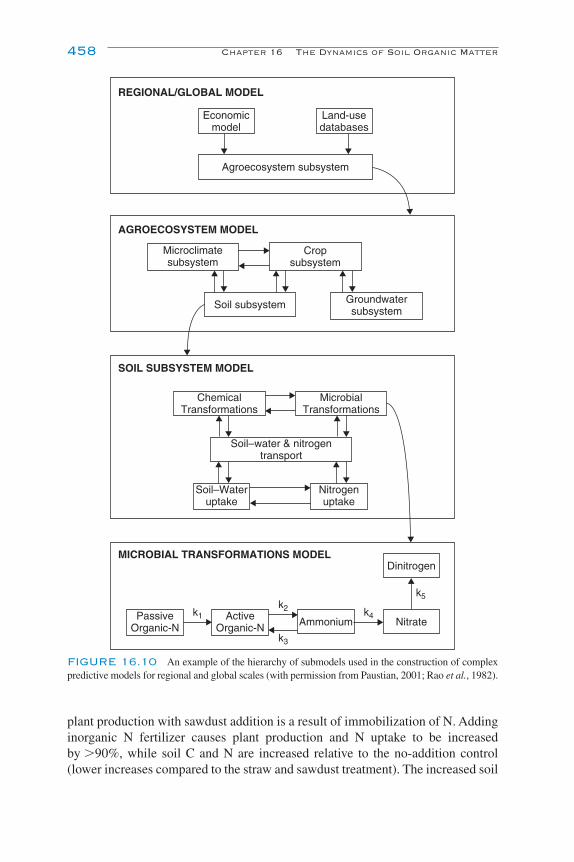
plant production with sawdust addition is a result of immobilization of N. Addinginorganic N fertilizer causes plant production and N uptake to be increasedby �90%, while soil C and N are increased relative to the no-addition control(lower increases compared to the straw and sawdust treatment). The increased soil
458 Chapter 16 The Dynamics of Soil Organic Matter
Economicmodel
Land-usedatabases
Agroecosystem subsystem
SOIL SUBSYSTEM MODEL
AGROECOSYSTEM MODEL
REGIONAL/GLOBAL MODEL
MICROBIAL TRANSFORMATIONS MODEL
Microclimatesubsystem
Cropsubsystem
Groundwatersubsystem
Soil subsystem
MicrobialTransformations
ChemicalTransformations
Soil–water & nitrogentransport
Soil–Wateruptake
Nitrogenuptake
Dinitrogen
Ammonium NitratePassiveOrganic-N
ActiveOrganic-N
k1
k3
k2 k4
k5
FIGURE 16.10 An example of the hierarchy of submodels used in the construction of complexpredictive models for regional and global scales (with permission from Paustian, 2001; Rao et al., 1982).
Ch16-P546807.qxd 11/18/06 7:13 PM Page 458

C and N levels result from increases in root C inputs. The high-N-content organicadditions (farmyard manure and green manure) result in large increases in plantproduction and N uptake and substantial increases in soil C and N levels. Approxi-mately 40% of the added N from the inorganic fertilizer and high-N organic addi-tions goes into increased plant N uptake, while organic N additions result in greaterstabilization of N in the soil (40% vs 20% for inorganic N fertilizer). Comparisonof model results with observed data is quite favorable; however, more informationwill be needed to accurately predict the role of SOM in controlling global CO2
levels.
ESTABLISHING POOL SIZES ANDKINETIC CONSTANTS
The various forms of organic matter in the soil–plant system and the complexchanges that it undergoes can be rationalized using a pool structure. A pool can bedefined as a compartment containing material of unique and uniform composi-tion. An example of biological and chemical pool sizes can be found in the analy-sis of two Swedish agricultural systems (Table 16.6). The standing crop of barleyfertilized with 120 kg N ha�1 is greater than that of alfalfa, but the primary pro-duction of alfalfa is greater when one considers both the two harvests per annumand the root turnover in the alfalfa crop. The shoot-to-root ratio of 6:1 for barleyis typical of many agricultural crops. The perennial alfalfa with more roots thanshoots is representative of perennial crops. The microbial biomass is equivalent toabout 50% of the weight of the plant standing crop and greatly exceeds the meta-zoan biomass. The uncultivated alfalfa has a soil fauna biomass of 105 kg C ha�1
compared to the 55 kg C ha�1 in the barley field. The soil organisms account forslightly more than 3% of the total soil C in both systems, and direct microscopyof the bacteria and fungi shows the predominance of fungal biomass. The annualC balance of the two systems (Table 16.7) shows the root respiration as 11–12%
Establishing Pool Sizes and Kinetic Constants 459
TABLE 16.5 Observed versus Simulated Plant N Uptake and Change in Soil N and C(1990–1956) for Different Organic Matter Management Practices for a Site in Swedena
No Fertilizer Green FarmFallow amendment N Straw manure manure Sawdust
Plant N uptake 4.7 9.4 4.7 8.7 6.9 3.6 (g N m�2) (4.1) (9.3) (4.0) (8.6) (7.3) (2.1)
Change in soil �100 �56 �25 �6 �38 �119 �25 N (g N m�2) (�97) (�85) (�35) (�12) (�52) (�48) (�46)
Change in soil �700 �800 �200 0.0 �300 �1000 �500 C (g C m�2) (�720) (�790) (�250) (�300) (�500) (�950) (�560)
aSimulated values were generated by the Century model and are presented in parentheses. Withpermission from Paustian et al. (1992).
Ch16-P546807.qxd 11/18/06 7:13 PM Page 459
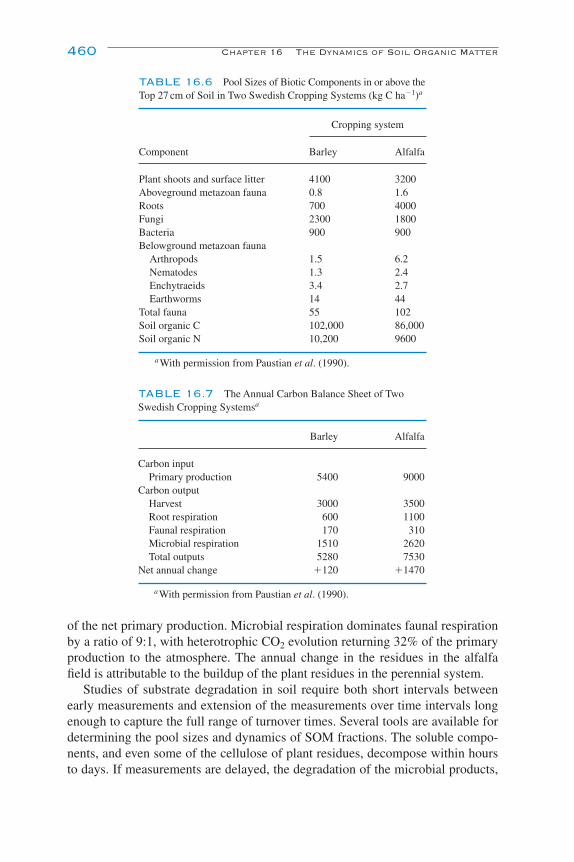
of the net primary production. Microbial respiration dominates faunal respirationby a ratio of 9:1, with heterotrophic CO2 evolution returning 32% of the primaryproduction to the atmosphere. The annual change in the residues in the alfalfafield is attributable to the buildup of the plant residues in the perennial system.
Studies of substrate degradation in soil require both short intervals betweenearly measurements and extension of the measurements over time intervals longenough to capture the full range of turnover times. Several tools are available fordetermining the pool sizes and dynamics of SOM fractions. The soluble compo-nents, and even some of the cellulose of plant residues, decompose within hoursto days. If measurements are delayed, the degradation of the microbial products,
460 Chapter 16 The Dynamics of Soil Organic Matter
TABLE 16.6 Pool Sizes of Biotic Components in or above theTop 27 cm of Soil in Two Swedish Cropping Systems (kg C ha�1)a
Cropping system
Component Barley Alfalfa
Plant shoots and surface litter 4100 3200Aboveground metazoan fauna 0.8 1.6Roots 700 4000Fungi 2300 1800Bacteria 900 900Belowground metazoan fauna
Arthropods 1.5 6.2Nematodes 1.3 2.4Enchytraeids 3.4 2.7Earthworms 14 44
Total fauna 55 102Soil organic C 102,000 86,000Soil organic N 10,200 9600
aWith permission from Paustian et al. (1990).
TABLE 16.7 The Annual Carbon Balance Sheet of TwoSwedish Cropping Systemsa
Barley Alfalfa
Carbon inputPrimary production 5400 9000
Carbon outputHarvest 3000 3500Root respiration 600 1100Faunal respiration 170 310Microbial respiration 1510 2620Total outputs 5280 7530
Net annual change �120 �1470
aWith permission from Paustian et al. (1990).
Ch16-P546807.qxd 11/18/06 7:13 PM Page 460

rather than that of the original substrate, is measured. Incubations in the labora-tory or in the field, extending to hundreds of days or longer, are needed to evaluatethe more persistent components. Generally, incubations incorporating respirationmeasurements and curve-fitting analysis are sufficient for determining the short-termdynamics. Soil organic matter components also occur in intermediate pools withturnover times of 10–100 years. In some cases, the turnover rates of these con-stituents can be measured by using the stable isotope 13C (Balesdent et al., 1987).This isotope accounts for 1.1% of the CO2-C of the air. Plants with the C3 photo-synthetic pathway discriminate more against this isotope than do plants with the C4
pathway, resulting in differential 13C enrichment of plant materials. Residue inputsand SOM turnover can be measured using mass spectrometry in soils formed underC3 plants (cool season grasses, trees) if C4 plants such as maize or sorghum are thengrown or if residues from these plants are added. The reverse sequence of crops willalso make measurements possible. The natural abundance of 13C in the plants andsoil may provide insufficient differentiation. In this case, artificially labeling plantmaterials with 13C by growing them in closed chambers with enriched 13CO2 or14CO2 may provide a better tracer. Studies examining the transformations of N, suchas plant uptake or mineralization, can be done using the 15N stable isotope tracer.
The slow decomposition rates of the most resistant fractions, making up 50%of the soil C and persisting for hundreds to thousands of years, are not easilymeasured with normal tracer techniques. For this, we resort to C dating, which uti-lizes the much longer half-life of naturally occurring 14C (Paul et al., 1997). Suchstudies have found that the average age (mean residence time) of organic matter inthe surface of temperate agricultural soils ranged between modern and 1100 years,with an average of 560 years. Deeper in the soil profile (50–100 cm), the averageage was 2757 years and ranged from 1500 to 6600 years. It is important to notethat studies of nutrient and organic matter turnover are best conducted on well-characterized, long-term plots where the yield or primary productivity compo-nents, soil type, and long-term climate and management controls are known.
MODEL SELECTION AND EVALUATION
As mechanistic soil–crop–water–atmosphere models become increasinglyaccepted as tools for analyzing agronomic or environmental issues, users are beingfaced with an increasing number of models to choose from. Ideally, a simulationmodel would include all of the processes dictating the dynamics of SOM or nutrientelements at a level of detail that represents the current state of the art in understand-ing, and model selection would be a moot point. Unfortunately, an ideal model forcomplex and heterogeneous agroecosystems is impractical. Not all system pro-cesses are fully understood and thus each model includes various approximationsand simplifications. In addition, the documentation available for each model gener-ally does not refer to the validity, limits, and potential applications of the model,which would provide some guidance in the selection of the most appropriate model.
Model Selection and Evaluation 461
Ch16-P546807.qxd 11/18/06 7:13 PM Page 461

462 Chapter 16 The Dynamics of Soil Organic Matter
35
30
25
20
15
19681970197219741976197819801982198419861988199019921994
35
30
25
20
15
19681970197219741976197819801982198419861988199019921994
35
30
25
20
15
19681970197219741976197819801982198419861988199019921994
35
30
25
20
15
19681970197219741976197819801982198419861988199019921994
CENTURY
DNDC
CANDY
ROTHC(a)
(b)
(c)
(d)
FIGURE 16.11 Observed vs simulated soil carbon levels for the Century, ROTHC, CANDY, andDNDC models at the Tamworth lucerne/clover crop rotations (with permission from Smith et al., 1997).
Ch16-P546807.qxd 11/18/06 7:13 PM Page 462
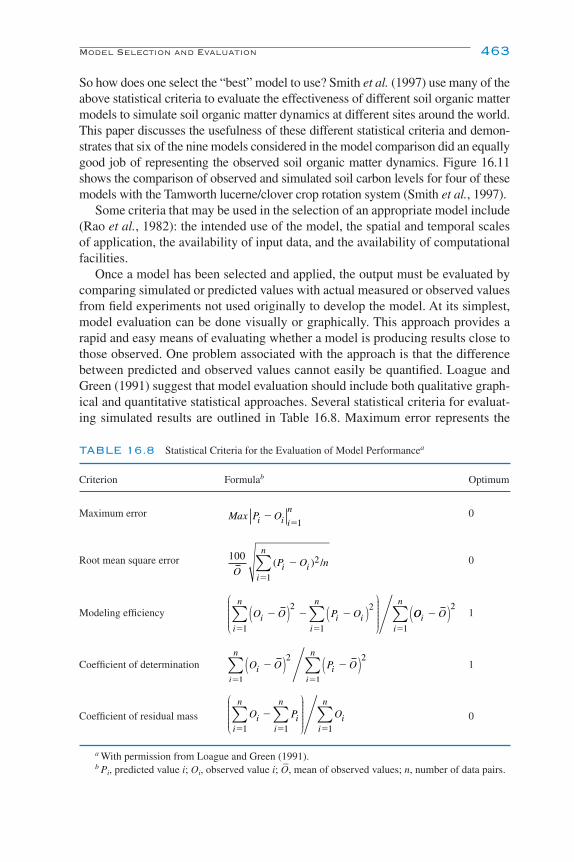
Model Selection and Evaluation 463
So how does one select the “best” model to use? Smith et al. (1997) use many of theabove statistical criteria to evaluate the effectiveness of different soil organic mattermodels to simulate soil organic matter dynamics at different sites around the world.This paper discusses the usefulness of these different statistical criteria and demon-strates that six of the nine models considered in the model comparison did an equallygood job of representing the observed soil organic matter dynamics. Figure 16.11shows the comparison of observed and simulated soil carbon levels for four of thesemodels with the Tamworth lucerne/clover crop rotation system (Smith et al., 1997).
Some criteria that may be used in the selection of an appropriate model include(Rao et al., 1982): the intended use of the model, the spatial and temporal scalesof application, the availability of input data, and the availability of computationalfacilities.
Once a model has been selected and applied, the output must be evaluated bycomparing simulated or predicted values with actual measured or observed valuesfrom field experiments not used originally to develop the model. At its simplest,model evaluation can be done visually or graphically. This approach provides arapid and easy means of evaluating whether a model is producing results close tothose observed. One problem associated with the approach is that the differencebetween predicted and observed values cannot easily be quantified. Loague andGreen (1991) suggest that model evaluation should include both qualitative graph-ical and quantitative statistical approaches. Several statistical criteria for evaluat-ing simulated results are outlined in Table 16.8. Maximum error represents the
TABLE 16.8 Statistical Criteria for the Evaluation of Model Performancea
Criterion Formulab Optimum
Maximum error 0
Root mean square error 0
Modeling efficiency 1
Coefficient of determination 1
Coefficient of residual mass 0
a With permission from Loague and Green (1991).b Pi, predicted value i; Oi, observed value i; O
–, mean of observed values; n, number of data pairs.
O P Oi ii
n
i
n
ii
n�
�� �11 1∑∑ ∑
⎛
⎝
⎜⎜⎜⎜⎜⎜
⎞
⎠
⎟⎟⎟⎟⎟⎟⎟
O O P Oii
n
ii
n� �
� �
( ) ( )∑ ∑2 2
1 1
O O P Oii
n
i ii
n� � �
� �
( ) ( )⎛
⎝
⎜⎜⎜⎜⎜⎜
⎞
⎠
⎟⎟⎟⎟⎟⎟⎟∑ ∑2
1
2
1
OO Oii
n�
�
( )∑ 2
1
100
1O
P O ni ii
n( ) /�
�
2∑
Max P Oi i i
n�
�1
Ch16-P546807.qxd 11/18/06 7:13 PM Page 463
single largest difference between a pair of predicted and observed values. The rootmean square error represents the total difference between the predicted and theobserved values, proportioned against the mean observed value. Modeling effi-ciency (EF) assesses the accuracy of simulations by comparing the variance ofpredicted from observed values to the variance of observed values from the meanof the observations. The EF is essentially a comparison of the efficiency of thechosen model to the efficiency of a very simple predictive model: the mean of theobservations. The coefficient of determination is a measure of the proportion ofthe total variance in the observed data that is explained by the predicted data. Last,the coefficient of residual mass gives an indication of the consistent errors in thedistribution of all simulated values across all measurements.
Ultimately, a model that performs well (i.e., in which modeled output matchesobservations reasonably well) is not necessarily a “good” model. A good model isconceptually clear and can be easily communicated to others. A bad model mayperform well, but because it can be inspected and modified only with great diffi-culty, there is no way to determine if the validation is pure chance or somethingmeaningful. It is important that the user understand the assumptions and limita-tions of a selected model at each stage of its use and application.
REFERENCES AND SUGGESTED READING
Ågren, G. I., and Bosatta, E. (1998). “Theoretical Ecosystem Ecology: Understanding ElementCycles.” Cambridge Univ. Press, Cambridge, UK.
Balesdent, J., Mariotti, A., and Guillet, B. (1987). Natural 13C abundance as a tracer for studies of soilorganic matter dynamics. Soil Biol. Biochem. 19, 25–30.
Bosatta, E., and Ågren, G. I. (1985). Theoretical analysis of decomposition of heterogeneous sub-strates. Soil Biol. Biochem. 17, 601–610.
Bosatta, E., and Ågren, G. I. (1994). Theoretical analysis of microbial biomass dynamics in soils. SoilBiol. Biochem. 26, 143–148.
Bosatta, E., and Ågren, G. I. (1995). The power and reactive continuum models as particular cases ofthe Q-theory of organic matter dynamics. Geochim. Cosmochim. Acta 59, 3833–3835.
Chertov, O. G. (1990). SPECOM—a single tree model of pine stand raw humus soil ecosystem. Ecol.Model. 50, 107–132.
Chertov, O. G., Kornarov, A. S., Crocker, G., Grace, P., Klir, J., Korschens, M., Poulton, P. R., andRichter, D. (1997). Simulating trends of soil organic carbon in seven long-term experiments usingthe SOMM model of the humus types. Geoderma 81, 121–135.
de Willigen, P. (1991). Nitrogen turnover in the soil-crop system: comparison of fourteen simulationmodels. Fertil. Res. 27, 141–149.
Ellert, B. H., and Bettany, J. R. (1988). Comparison of kinetic models for describing net sulfur andnitrogen mineralization. Soil Sci. Soc. Am. J. 52, 1692–1702.
Elliott, E. T., Paustian, K., and Frey, S. D. (1996). Modeling the measurable or measuring the mode-lable: a hierarchical approach to isolating meaningful soil organic matter fractionations. In“Evaluation of Soil Organic Matter Models” (D. S. Powlson et al., eds.), Vol. 138, pp. 161–180.Springer–Verlag, Berlin.
Franko, U., Crocker, G. J., Grace, P. R., Klir, J., Korschens, M., Poulton, P. R., and Richter, D. (1997).Simulating trends in soil organic carbon in long-term experiments using the CANDY model.Geoderma 81, 109–120.
464 Chapter 16 The Dynamics of Soil Organic Matter
Ch16-P546807.qxd 11/18/06 7:13 PM Page 464
Franko, U., Oelschlagel, B., and Schenk, S. (1995). Simulation of temperature, water and nitrogendynamics using the model CANDY. Ecol. Model. 81, 213–222.
Frissel, M. J., and Van Veen, J. A. (1982). A review of models for investigating the behavior of nitro-gen in soil. Philos. Trans. R. Soc. London B 296, 341–349.
Grant, R. F. (2001). A review of the Canadian ecosystem model ecosys. In “Modeling Carbon andNitrogen Dynamics for Soil Management” (M. J. Shaffer et al., eds.), pp. 173–264. CRC Press,Boca Raton, FL.
Grant, R. F., Juma, N. G., and McGill, W. B. (1993a). Simulation of carbon and nitrogen transforma-tions in soil—mineralization. Soil Biol. Biochem. 25, 1317–1329.
Grant, R. F., Juma, N. G., and McGill, W. B. (1993b). Simulation of carbon and nitrogen transforma-tions in soil—microbial biomass and metabolic products. Soil Biol. Biochem. 25, 1331–1338.
Hansen, S., Jensen, H. E., Nielsen, N. E., and Svendsen, H. (1991). Simulation of nitrogen dynamicsand biomass production in winter-wheat using the Danish simulation-model. Daisy. Fertil. Res. 27,245–259.
Hunt, H. W., Coleman, D. C., Cole, C. V., Ingham, R. E., Elliott, E. T., and Woods, L. E. (1984).Simulation model of a food web with bacteria, amoebae and nematodes in soil. In “CurrentPerspectives in Microbial Ecology” (M. J. Klug and C. A. Reddy, eds.), pp. 346–352. Am. Soc.Microbiol., Washington, DC.
Hunt, H. W., Coleman, D. C., Ingham, E. R., Ingham, R. E., Elliott, E. T., Moore, J. C., Rose, S. L.,Reid, C. P. P., and Morley, C. R. (1987). The detrital food web in a shortgrass prairie. Biol. Fertil.Soils 3, 57–68.
Jenkinson, D. S. (1990). The turnover of organic carbon and nitrogen in soil. Philos. Trans. R. Soc.London B 329, 361–368.
Jenkinson, D. S., and Rayner, J. H. (1977). Turnover of soil organic matter in some of Rothamstedclassical experiments. Soil Sci. 123, 298–305.
Jenkinson, D. S., Harkness, D. D., Vance, E. D., Adams, D. E., and Harrison, A. F. (1992). Calculatingnet primary production and annual input of organic matter to soil from the amount and radiocar-bon content of soil organic matter. Soil Biol. Biochem. 24, 295–308.
Jenkinson, D. S., Hart, P. B. S., Rayner, J. H., and Parry, L. C. (1987). Modelling the turnover oforganic matter in long-term experiments. Intercoll. Bull. 15, 1–8.
Jenny, H. (1941). “The Factors of Soil Formation.” McGraw–Hill, New York.Jones, C. A., Cole, C. V., Sharpley, A. N., and Williams, J. R. (1984). A simplified soil and plant phos-
phorus model. 1. Documentation. Soil Sci. Soc. Am. J. 48, 800–805.Kelly, R. H., Parton, W. J., Crocker, G. J., Graced, P. R., Klir, J., Korschens, M., Poulton, P. R., and
Richter, D. D. (1997). Simulating trends in soil organic carbon in long-term experiments using thecentury model. Geoderma 81, 75–90.
Lewis, D. R., and McGechan, M. B. (2002). A review of field scale phosphorus dynamics models.Biosyst. Eng. 82, 359–380.
Li, C. S., Frolking, S., and Frolking, T. A. (1992a). A model of nitrous-oxide evolution from soil drivenby rainfall events. 1. Model structure and sensitivity. J. Geophys. Res. 97, 9759–9776.
Li, C. S., Frolking, S., and Frolking, T. A. (1992b). A model of nitrous-oxide evolution from soil drivenby rainfall events. 2. Model applications. J. Geophys. Res. 97, 9777–9783.
Li, C., Frolking, S., Crocker, G. J., Grace, P. R., Klir, J., Korchens, M., and Poulton, P. R. (1997).Simulating trends in soil organic carbon in long-term experiments using the DNDC model.Geoderma 81, 45–60.
Loague, K., and Green, R. E. (1991). Statistical and graphical methods for evaluating solute transportmodels: overview and application. J. Contam. Hydrol. 7, 51–73.
McGill, W. B. (1996). Review and classification of ten soil organic matter (SOM) models. In“Evaluation of Soil Organic Matter Models” (D. S. Powlson et al., eds.), Vol. 138, pp. 111–132.Springer-Verlag, Berlin.
McGill, W. B., Hunt, H. W., Woodmansee, R. G., and Reuss, J. O. (1981). PHOENIX: a model of thedynamics of carbon and nitrogen in grassland soils. In “Terrestrial Nitrogen Cycles—Process,
References and Suggested Reading 465
Ch16-P546807.qxd 11/18/06 7:13 PM Page 465
Ecosystem Strategies and Management Impacts” (F. E. Clark and T. Rosswall, eds.), pp. 49–115.Swedish Nat. Sci. Rsch. Council, Stockholm.
Molina, J. A. E., and Smith, P. (1998). Modeling carbon and nitrogen processes in soils. In “Advancesin Agronomy” (D. L. Sparks, ed.), Vol. 62, pp. 253–298. Academic Press, San Diego.
Molina, J. A. E., Clapp, C. E., Shaffer, M. J., Chichester, F. W., and Larson, W. E. (1983). NCSOIL, amodel of nitrogen and carbon transformations in soil: description, calibration, and behavior. SoilSci. Soc. Am. J. 47, 85–91.
Molina, J. A. E., Crocker, G. J., Grace, P. R., Klir, J., Korschens, M., Poulton, P. R., and Richter, D. D.(1997). Simulating trends in soil organic carbon in long-term experiments using the NCSOIL andNCSWAP models. Geoderma 81, 91–107.
Mueller, T., Jensen, L. S., Hansen, S., and Nielsen, N. E. (1996). Simulating soil carbon and nitrogendynamics with the soil–plant–atmosphere system model DAISY. In “Evaluation of Soil OrganicMatter Models Using Existing Long-Term Datasets” (D. S. Powlson et al., eds.), Vol. 38, pp.275–282. Springer-Verlag, Berlin.
Parton, W. J. (1996). The CENTURY model. In “Evaluation of Soil Organic Matter Models UsingExisting Long-Term Datasets” (D. S. Powlson et al., eds.), Vol. 38, pp. 283–293. Springer-Verlag,Berlin.
Parton, W. J., Schimel, D. S., Cole, C. V., and Ojima, D. S. (1987). Analysis of factors controlling soilorganic matter levels in Great-Plains grasslands. Soil Sci. Soc. Am. J. 51, 1173–1179.
Parton, W. J., Woomer, P. L., and Martin, A. (1994). Modelling soil organic matter dynamics and plantproductivity in tropical ecosystems. In “The Biological Management of Tropical Soil Fertility”(P. L. Woomer and M. J. Swift, eds.), pp. 121–188. Wiley–Sayce, Chichester.
Paul, E. A., Follett, R. F., Leavitt, S. W., Halvorson, A., Peterson, G. A., and Lyon, D. J. (1997).Radiocarbon dating for determination of soil organic matter pool sizes and dynamics. Soil Sci. Soc.Am. J. 61, 1058–1067.
Paustian, K. (1994). Modelling soil biology and biochemical processes for sustainable agricultureresearch. In “Soil Biota: Management in Sustainable Farming Systems” (C. E. Pankhurst et al.,eds.), pp. 182–193. CSIRO Pub., Collingwood.
Paustian, K. (2001). Modelling soil organic matter dynamics—global challenges. In “SustainableManagement of Soil Organic Matter” (R. M. Rees et al., eds.), pp. 43–53. CAB International,Wallingford, UK.
Paustian, K., Andren, O., Clarholm, M., Hansson, A. C., Johansson, G., Lagerlof, J., Lindberg, T.,Pettersson, R., and Sohlenius, B. (1990). Carbon and nitrogen budgets of 4 agroecosystems withannual and perennial crops with and without N-fertilization. J. Appl. Ecol. 27, 60–84.
Paustian, K., Parton, W. J., and Persson, J. (1992). Modeling soil organic matter in organic-amendedand nitrogen-fertilized long-term plots. Soil Sci. Soc. Am. J. 56, 476–488.
Rao, P. S. C., Jessup, R. E., and Hornsby, A. G. (1982). Simulation of nitrogen in agroecosystems: cri-teria for model selection and use. Plant Soil 67, 35–43.
Schimel, J. (2001). Biogeochemical models: implicit versus explicit microbiology. In “Global Bio-geochemical Cycles in the Climate System” (E.-D. Schulze et al., eds.), pp. 177–183. AcademicPress, San Diego.
Six, J., Conant, R. T., Paul, E. A., and Paustian, K. (2002). Stabilization mechanisms of soil organicmatter: implications for C-saturation of soils. Plant Soil 241, 155–176.
Sleutel, S., De Neve, S., Prat Roibas, M. R., and Hofman, G. (2005). The influence of model type andincubation time on the estimation of stable organic carbon in organic materials. Eur. J. Soil Sci. 56,505–514.
Smith, J. U., Smith, P., Monaghan, R., and MacDonald, J. (2002). When is a measured soil organicmatter fraction equivalent to a model pool? Eur. J. Soil Sci. 53, 405–416.
Smith, P., Smith, J. U., Powlson, D. S., McGill, W. B., Arah, J. R. M., Chertov, O. G., Coleman, K.,Franko, U., Frolking, S., Jenkinson, D. S., Jensen, L. S., Kelly, R. H., Klein-Gunnewiek, H.,Komarov, A. S., Li, C., Molina, J. A. E., Mueller, T., Parton, W. J., Thornley, J. H. M., andWhitmore, A. P. (1997). A comparison of the performance of nine soil organic matter models usingdatasets from seven long-term experiments. Geoderma 81, 153–225.
466 Chapter 16 The Dynamics of Soil Organic Matter
Ch16-P546807.qxd 11/18/06 7:13 PM Page 466
Sohi, S. P., Mahieu, N., Arah, J. R. M., Powlson, D. S., Madari, B., and Gaunt, J. L. (2001). A proce-dure for isolating soil organic matter fractions suitable for modeling. Soil Sci. Soc. Am. J. 65,1121–1128.
Stanford, G., and Smith, S. J. (1972). Nitrogen mineralization potentials of soils. Soil Sci. Soc. Am.Proc. 36, 465–472.
Thornley, J. H. M., and Cannell, M. G. R. (1992). Nitrogen relations in a forest plantation—soilorganic-matter ecosystem model. Ann. Bot. 70, 137–151.
Thornley, J. H. M., and Verberne, E. L. J. (1989). A model of nitrogen flows in grassland. Plant CellEnviron. 12, 863–886.
Van Veen, J. A., and Paul, E. A. (1981). Organic carbon dynamics in grassland soils. 1. Backgroundinformation and computer simulation. Can. J. Soil Sci. 61, 185–201.
Van Veen, J. A., Ladd, J. N., and Frissel, M. J. (1984). Modeling C and N turnover through the micro-bial biomass in soil. Plant Soil 76, 257–274.
Verberne, E. L. J., Hassink, J., Dewilligen, P., Groot, J. J. R., and Vanveen, J. A. (1990). Modelingorganic-matter dynamics in different soils. Neth. J. Agric. Sci. 38, 221–238.
Voroney, R. P., Van Veen, J. A., and Paul, E. A. (1981). Organic carbon dynamics in grassland soils. 2. Model validation and simulation of the long-term effects of cultivation and rainfall erosion. Can.J. Soil Sci. 61, 211–224.
Wu, L., and McGechan, M. B. (1998). A review of carbon and nitrogen processes in four soil nitrogendynamics models. J. Agric. Eng. Res. 69, 279–305.
Yang, H. S., and Janssen, B. H. (2000). A mono-component model of carbon mineralization with adynamic rate constant. Eur. J. Soil Sci. 51, 517–529.
References and Suggested Reading 467
Ch16-P546807.qxd 11/18/06 7:13 PM Page 467

Ch16-P546807.qxd 11/18/06 7:13 PM Page 468

PART
VSoil Organisms: Man and Nature
Ch17-P546807.qxd 11/18/06 7:15 PM Page 469

Ch17-P546807.qxd 11/18/06 7:15 PM Page 470
17Management of
Organisms and TheirProcesses in Soils
Jeffrey L. Smith
Harold P. Collins
Introduction
Changing Soil Organism Populations and Processes
Alternative Agricultural Management
The Potential for Managing Microorganisms and Their Processes
Concluding Comments on Microbial Ecology
References and Suggested Reading
471
INTRODUCTION
Historically humans have managed organisms inadvertently, consciously, andsometimes by simple intuition. One of man’s first introductions to a microbialprocess occurred over 100,000 years ago when fruit fermented and formed wine(Purser, 1977). Reference to wine-making methods were recorded on ceramicartifacts dating to 5000 years BCE. Enhancements to wine making and viticulturewere made during the times of the Egyptians, Romans, and Greeks, who also pro-moted its use in everyday life. It was not until the mid-1800s that Louis Pasteurdiscovered the process of fermentation, shedding light on the thousands of yearsof humans managing organisms to their benefit (Forester, 1998). A similar storycould be told of cheese and cheese making, as archaeologists have evidence ofcheese consumption dating back to 6000 years BCE and depictions of it on Egyptiantomb murals dating to 2000 BCE (Smith, 1995). Management of organisms for
Ch17-P546807.qxd 11/18/06 7:15 PM Page 471
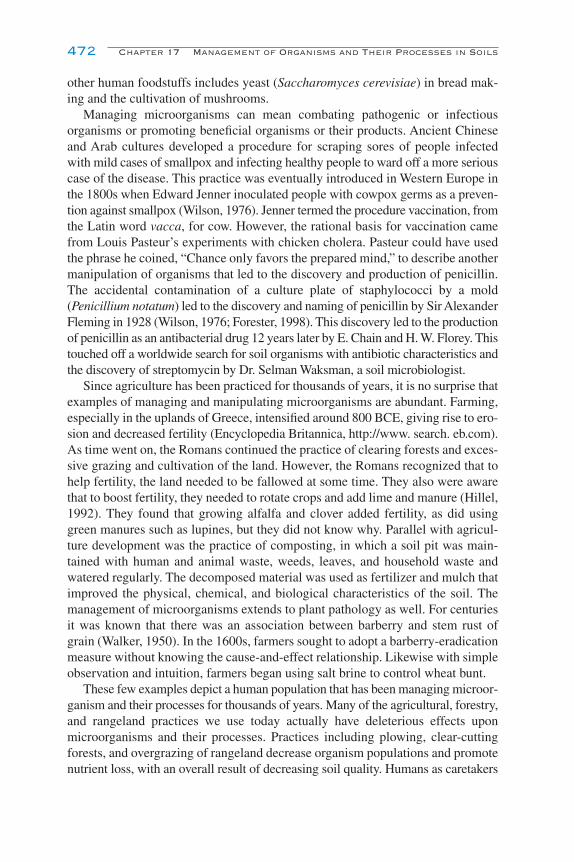
472 Chapter 17 Management of Organisms and Their Processes in Soils
other human foodstuffs includes yeast (Saccharomyces cerevisiae) in bread mak-ing and the cultivation of mushrooms.
Managing microorganisms can mean combating pathogenic or infectiousorganisms or promoting beneficial organisms or their products. Ancient Chineseand Arab cultures developed a procedure for scraping sores of people infectedwith mild cases of smallpox and infecting healthy people to ward off a more seriouscase of the disease. This practice was eventually introduced in Western Europe inthe 1800s when Edward Jenner inoculated people with cowpox germs as a preven-tion against smallpox (Wilson, 1976). Jenner termed the procedure vaccination, fromthe Latin word vacca, for cow. However, the rational basis for vaccination camefrom Louis Pasteur’s experiments with chicken cholera. Pasteur could have usedthe phrase he coined, “Chance only favors the prepared mind,” to describe anothermanipulation of organisms that led to the discovery and production of penicillin.The accidental contamination of a culture plate of staphylococci by a mold(Penicillium notatum) led to the discovery and naming of penicillin by Sir AlexanderFleming in 1928 (Wilson, 1976; Forester, 1998). This discovery led to the productionof penicillin as an antibacterial drug 12 years later by E. Chain and H. W. Florey. Thistouched off a worldwide search for soil organisms with antibiotic characteristics andthe discovery of streptomycin by Dr. Selman Waksman, a soil microbiologist.
Since agriculture has been practiced for thousands of years, it is no surprise thatexamples of managing and manipulating microorganisms are abundant. Farming,especially in the uplands of Greece, intensified around 800 BCE, giving rise to ero-sion and decreased fertility (Encyclopedia Britannica, http://www. search. eb.com).As time went on, the Romans continued the practice of clearing forests and exces-sive grazing and cultivation of the land. However, the Romans recognized that tohelp fertility, the land needed to be fallowed at some time. They also were awarethat to boost fertility, they needed to rotate crops and add lime and manure (Hillel,1992). They found that growing alfalfa and clover added fertility, as did usinggreen manures such as lupines, but they did not know why. Parallel with agricul-ture development was the practice of composting, in which a soil pit was main-tained with human and animal waste, weeds, leaves, and household waste andwatered regularly. The decomposed material was used as fertilizer and mulch thatimproved the physical, chemical, and biological characteristics of the soil. Themanagement of microorganisms extends to plant pathology as well. For centuriesit was known that there was an association between barberry and stem rust ofgrain (Walker, 1950). In the 1600s, farmers sought to adopt a barberry-eradicationmeasure without knowing the cause-and-effect relationship. Likewise with simpleobservation and intuition, farmers began using salt brine to control wheat bunt.
These few examples depict a human population that has been managing microor-ganism and their processes for thousands of years. Many of the agricultural, forestry,and rangeland practices we use today actually have deleterious effects uponmicroorganisms and their processes. Practices including plowing, clear-cuttingforests, and overgrazing of rangeland decrease organism populations and promotenutrient loss, with an overall result of decreasing soil quality. Humans as caretakers
Ch17-P546807.qxd 11/18/06 7:15 PM Page 472

of the land must reverse land degradation to increase soil quality and ecosystemhealth to provide food and fiber for a growing world population. We can begin thislong journey by developing ways in which to manage organisms and their benefi-cial processes in soil systems.
CHANGING SOIL ORGANISM POPULATIONSAND PROCESSES
Soil organic matter (SOM), a direct result of microbial activity, plays a role interrestrial ecosystem development and functioning. In both undisturbed and culti-vated systems, potential productivity is directly related to SOM concentrationsand turnover. The dominant effect that SOM has on ecosystem structure and sta-bility is clear evidence for the need to protect current organic matter levels and todevelop management practices that will enhance soils with declining SOM con-tents (see Chap. 12 for more detail on organic matter). Organic matter contents insoils range from less than 0.2% in desert soils to over 80% in peat soils. In tem-perate regions, SOM ranges between 0.4 and 10.0%, with soils of humid regionsaveraging 3–4% and those in semiarid areas 1–3%. Although it is only a smallfraction of the soil, components of SOM are the chief binding agents for soilaggregates that, in turn, control air and water relations for root growth and provideresistance to wind and water erosion. With 95% of soil nitrogen (N), 40% of soilphosphorus (P), and 90% of soil sulfur (S) being associated with the SOM frac-tion, decomposition and turnover can supply most macronutrients needed forplant growth (Smith and Elliott, 1990; Smith et al., 1992). During decomposition,microorganisms assimilate complex organic substrates for energy and carbon (C)and release inorganic nutrients. This process is controlled by temperature, mois-ture, soil disturbance, and the quality of SOM as a microbial substrate. These fac-tors, together with the size and activity of the microbial population, regulate therate of decomposition and nutrient release (Smith and Paul, 1990; Smith, 1994).
The two most significant regional ecosystem disturbances that directly decreaseSOM are tropical and boreal deforestation and the intensive cropping of theworld’s prime farmland and forests. Forests and agricultural lands contain 90% ofterrestrial C and are responsible for 80% of the yearly primary C production(Smith and Paul, 1990). The decrease in SOM is paralleled by declines in soil pro-ductivity and contributes to increasing global CO2 concentrations. In both forestand agricultural ecosystems, the management of plant residues is necessary toprevent SOM decline and possible ecosystem collapse.
Recent years have witnessed increased concern about environmental pollutionfrom synthetic chemicals and disposal of wastes. Problems with toxic waste dumps,garbage landfills, and acid rainfall have focused attention on the soil, the mostwidely used depository. The soil as a depository is a perturbed system, experiencinggross changes in temperature, moisture, and biological activity. Controlling fac-tors and processes may be drastically altered under these circumstances, causing
Changing Soil Organism Populations and Processes 473
Ch17-P546807.qxd 11/18/06 7:15 PM Page 473

chemical cycling, ecosystem stability, and system resiliency to shift in unpre-dictable ways.
TILLAGE AND EROSION
Tillage affects the amount of SOM buildup or loss in two ways: (1) through thephysical disturbance and mixing of soil and the exposure of soil aggregates to dis-ruptive forces and (2) through incorporation and distribution of plant residues in thesoil profile. The degree of residue incorporation has a major effect on microbialactivity and the rate of decomposition. Decomposition rates of residues are generallyslower when left on the soil surface than when buried in soil. The combination ofreduced litter decomposition rates and less soil disturbance usually results in greateramounts of SOM in reduced tillage vs conventionally tilled systems (Dalal et al.,1991). Tillage also alters the physical and chemical properties of the soil environ-ment by affecting water content and aeration, as well as the microclimate near thesoil surface. These in turn regulate the soil biota and the biological processes theymediate. Conventional cropping practices with intensive tillage simplify micro-bial community structure, resulting in lower stability or resiliency in function. Forexample, reductions in stability have led to gaps in biochemical functions relatedto N transformations during periods of environmental stress or when plants arenot present. Reduced tillage and cover crops generate soil-litter conditions verydifferent from those of conventional systems. The distributions and types of residuesmodify microbial biomass, pathogen, and nematode and insect community struc-ture and regulate microbial mineralization/immobilization rates controlling theloss of C and N from soil (Curci et al., 1997; Calderon et al., 2000).
Between 35 and 50% of the SOM and N were lost during the first 50 years oftillage in the Great Plains of the United States (Bauer and Black, 1981). This lossis most rapid during the first few years of cultivation, and eventually an apparentequilibrium is established, provided constant management practices are employed.The time required to reach this equilibrium will vary depending on climatic con-ditions, extent of erosion, type and rate of residue return, and soil type.
Over a 14-year period in Canada, cultivated, brown, prairie soils lost 26% oftheir SOM and 33% of their N. In the next 20 years, losses decreased by half(Doughty et al., 1954; Campbell et al., 1975). In other Canadian soils, over a 60-to 80-year period, C and N losses ranged from 50 to 60% and 40 to 60%, respec-tively (Campbell et al., 1976; Voroney et al., 1981). There is substantially less infor-mation concerning the effects of cultivation on chemical and physical soil propertiesin semiarid tropical regions. A 1986 study (Dalal and Mayer, 1986) found that soilsin southern Queensland, Australia, had lost 36% of their C and N over a 20- to 70-year period and that numerous fertility parameters related to SOM levels weredeclining. Losses of C and N from tillage are usually determined by comparingcultivated with native uncultivated systems, but other factors are also involved inthese losses. The effect of tillage in the long term is to decrease the SOM level,which, in turn, disrupts nutrient cycling and fertility and degrades soil quality.
474 Chapter 17 Management of Organisms and Their Processes in Soils
Ch17-P546807.qxd 11/18/06 7:15 PM Page 474

The practice of no tillage was developed to counteract the destructive effects oftillage. In two studies in the United States soil attributes from no-tillage fieldswere compared to those of conventionally tilled fields (Doran, 1980) and Conser-vation Reserve Program (CRP) fields were compared to paired, conventionallytilled fields (Staben et al., 1997). The no-tilled fields were in no-till between 5 and10 years and the CRP fields had been returned to grass for 7 years. The results arepresented in Table 17.1 and are expressed as the ratio of the no-till data to the con-ventionally tilled or CRP data. Total soil C and N increased in the no-till soils butreturning cropland to grassland had little effect. Similarly, the microbial biomassincreased only in the no-till system compared to the conventional system. Return-ing fields to a less disturbed state significantly increased the numbers of fungi andbacteria and the dehydrogenase enzyme activity (a measure of biological activ-ity). Nutrient cycling as measured as potentially mineralizable N increased by35% in the no-till system and only 13% in the converted grass system. These datafrom widely different geographical locations and soil types show the importanceand significance of tillage for organism populations and function. More impor-tantly the CRP data suggest the effect on organisms is not simply due to increasesin soil organic C.
In a compilation of 106 studies (Wardle, 1995), scientists were able to developan index of the effects of tillage on detrital food webs and compare conventionaltillage to no tillage. In most of the studies, the soil total C and N concentrationswere less in the conventionally tilled soil compared to the no-tilled soil, as was thesoil microbial biomass. However, as in the previous studies cited above, the increasein the microbial biomass in the no-till soils seemed to be greater than would beexpected from an increase in SOM. This phenomenon is usually attributed to anincrease in SOM quality due to frequent additions of residues to the surface of the
Changing Soil Organism Populations and Processes 475
TABLE 17.1 Ratios of Nutrients and MicrobialPopulations in the 0- to 7.5-cm Soil Depth of No-Tillage,Conventional Tillage, and Conservation Reserve Program Soils
Soil parameter NT:CTa CRP:CTb
Total carbon 1.25 0.99Total nitrogen 1.20 1.10Microbial biomass 1.14 1.04Fungi 1.57 1.59Aerobic bacteria 1.41 1.16Dehydrogenase 1.50 1.40PMNc 1.35 1.13
aRatio of no-tillage to conventional tillage values.bRatio of Conservation Reserve Program to conventional
tillage values.cPotentially mineralizable nitrogen.
Ch17-P546807.qxd 11/18/06 7:15 PM Page 475

soil compared to rapidly decomposed buried residue, which contains more recal-citrant compounds.
In soil ecology, there is a good deal of interest in disturbance effects on trophiclevels but also on organism diversity within the trophic level. A limited subset ofstudies tended to show that species diversity of the microfaunal groups is unchangedby tillage, while the macrofaunal groups can be elevated or reduced in diversity bytillage. The changes in organism biodiversity and its variability due to tillage arelikely unpredictable because of the complexity and lack of understanding of theinteractions between trophic levels. Overall, this indicates that soil food webs arefairly stable and have a significant amount of resiliency.
The microflora (bacteria and fungi) were generally mildly inhibited by tillage,whereas the microfauna of nematodes and protozoa was mildly to moderatelyinhibited by tillage in 50% of the studies. The mesofauna group of collembolan andmites tended to be moderately inhibited and the macrofauna group of earthwormsand beetles was moderately to extremely inhibited by tillage. Thus, in general thelarger organisms were more likely to be reduced than the smaller organisms undertillage systems compared to no-till systems.
Compaction is widespread worldwide and particularly significant where inten-sive mechanization is applied to soils subject to high rainfall or irrigation. Soilcompaction has dramatic effects on plant growth, the soil biota, and biologicalprocesses. Compaction has been shown to affect specific microbial activities, e.g.,soil respiration and the denitrification potential through direct effects on soil watercontent and aeration. A study (Robertson et al., 2000) showed that greenhouse gasemissions were eightfold higher in compacted conventionally tilled systems thanin no-till. There is also increasing evidence for the role of pore size in regulatingsoil microbial populations and their biochemical processes. The shift in the rela-tive abundance of pore sizes induced by soil compaction directly affects the abun-dance of microbial populations (Postma and van Veen, 1990). Compactionreduced the predation efficiency of protozoa or nematodes on bacteria due to adecrease in accessible pore space. The manipulation of habitable pore space dueto tillage disturbance and soil compaction may regulate the types of organismspresent and thus control the transformation of essential plant nutrients.
Tillage not only reduces SOM through disruption and oxidation, but also cancreate significant soil erosion over the landscape. The loss of soil through erosionis a significant problem worldwide. In some areas with highly erodible land-scapes, such as areas of the United States, soil loss rates can exceed 38 T soil ha�1
year�1. It is estimated that about 20% of the soil C dislocated by erosion will bereleased into the atmosphere as CO2, the rest being deposited over other land areasand into streams and rivers. Since it is mainly surface soil that is lost during ero-sion events, there is an associated loss of SOM high in biological activity. Towardthe end of the 20th century, conservation tillage practices were increasingly imple-mented to reduce erosion and increase soil fertility. These practices have also beenshown to increase soil biological activity and the mass of soil organisms in thesurface soil.
476 Chapter 17 Management of Organisms and Their Processes in Soils
Ch17-P546807.qxd 11/18/06 7:15 PM Page 476

Soil erosion and SOM loss are by-products of agricultural production and con-tribute to C and N losses. There is also a parallel and significant effect on soilorganism populations and activity. Biological activity and biodiversity are impor-tant in determining deleterious effects of management on soil physical and chem-ical properties and the resulting effects on the sustainability of agricultural land.More research is needed to identify the relationships between microbial commu-nity composition (biodiversity), soil processes, and soil fertility on the health ofthe soil and its ability to provide a medium for plant growth.
RANGELAND AND FOREST HEALTH
Much of the environmental movement of the 1970s and 1980s focused ondecreasing the degradation of the environment, be it developing better fishingequipment to decrease damage to ocean bottoms and the trapping of nontarget fishto educational campaigns concerning the destruction of the rainforests. In the1990s, the scientific community turned from monitoring degrading practices toevaluating a holistic attribute, ecosystem health. This direction began with workon soil quality, much like air and water quality assessments of the 1980s, andevolved into such work as rangeland health and forest ecosystem health. TheNational Research Council suggested that rangeland health be defined as “thedegree to which the integrity of the soil and ecological processes of rangelandecosystems are sustained.” Healthy would be the dictionary definition of: (1) functioning properly or normally in its vital functions, (2) free from malfunc-tion of any kind, and (3) productive of good of any kind. These definitions alsoapply to forest ecosystems.
At the core of ecosystem health is soil quality, defined as “the capacity of a soil tofunction within ecosystem boundaries to sustain biological productivity, maintainenvironmental quality, and promote plant and animal health.” The major issues are:
1. productivity—the ability of soil to enhance plant and biological productivity;2. environmental quality—the ability of soil to attenuate environmental con-
taminants, pathogens, and offsite damage;3. animal health—the interrelationship between soil quality and plant, animal,
and human health.
Within the context of the soil quality concept, it is evident that soil biology,specifically microorganisms and their processes, will play a major role in deter-mining the health of the ecosystem. Thus, in situ parameters or management thatenhance or degrade microbial habitat will shift the health of the system. Attributesthat affect the functioning of the soil system are listed in Table 17.2 and, whenmeasured in the context of the proper ecological question, can be used to evaluateecosystem health. The proper ecological question means “what is the function ofthe ecosystem?” or “what is the ecosystem going to be used for?” Thus, the soilquality attributes for an urban area may be different from the soil quality attributesfor range- and pasture land.
Changing Soil Organism Populations and Processes 477
Ch17-P546807.qxd 11/18/06 7:15 PM Page 477
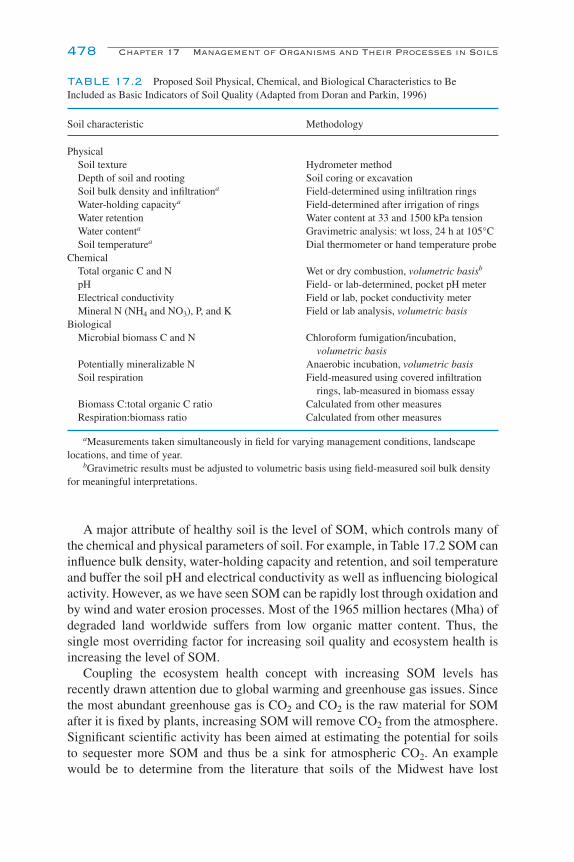
A major attribute of healthy soil is the level of SOM, which controls many ofthe chemical and physical parameters of soil. For example, in Table 17.2 SOM caninfluence bulk density, water-holding capacity and retention, and soil temperatureand buffer the soil pH and electrical conductivity as well as influencing biologicalactivity. However, as we have seen SOM can be rapidly lost through oxidation andby wind and water erosion processes. Most of the 1965 million hectares (Mha) ofdegraded land worldwide suffers from low organic matter content. Thus, thesingle most overriding factor for increasing soil quality and ecosystem health isincreasing the level of SOM.
Coupling the ecosystem health concept with increasing SOM levels hasrecently drawn attention due to global warming and greenhouse gas issues. Sincethe most abundant greenhouse gas is CO2 and CO2 is the raw material for SOMafter it is fixed by plants, increasing SOM will remove CO2 from the atmosphere.Significant scientific activity has been aimed at estimating the potential for soilsto sequester more SOM and thus be a sink for atmospheric CO2. An examplewould be to determine from the literature that soils of the Midwest have lost
478 Chapter 17 Management of Organisms and Their Processes in Soils
TABLE 17.2 Proposed Soil Physical, Chemical, and Biological Characteristics to Be Included as Basic Indicators of Soil Quality (Adapted from Doran and Parkin, 1996)
Soil characteristic Methodology
PhysicalSoil texture Hydrometer methodDepth of soil and rooting Soil coring or excavationSoil bulk density and infiltrationa Field-determined using infiltration ringsWater-holding capacitya Field-determined after irrigation of ringsWater retention Water content at 33 and 1500 kPa tensionWater contenta Gravimetric analysis: wt loss, 24 h at 105°CSoil temperaturea Dial thermometer or hand temperature probe
ChemicalTotal organic C and N Wet or dry combustion, volumetric basisb
pH Field- or lab-determined, pocket pH meterElectrical conductivity Field or lab, pocket conductivity meterMineral N (NH4 and NO3), P, and K Field or lab analysis, volumetric basis
BiologicalMicrobial biomass C and N Chloroform fumigation/incubation,
volumetric basisPotentially mineralizable N Anaerobic incubation, volumetric basisSoil respiration Field-measured using covered infiltration
rings, lab-measured in biomass essayBiomass C:total organic C ratio Calculated from other measuresRespiration:biomass ratio Calculated from other measures
aMeasurements taken simultaneously in field for varying management conditions, landscapelocations, and time of year.
bGravimetric results must be adjusted to volumetric basis using field-measured soil bulk densityfor meaningful interpretations.
Ch17-P546807.qxd 11/18/06 7:15 PM Page 478

upward of 50% of their SOM due to cultivation and then calculate how much Ccould be sequestered by returning this land to the native state. In reality, this is nota trivial calculation; however, this analysis can be done with many types of landand management practices (see suggested reading). Rangelands and forests havebeen identified as the ecosystems likely to store significant amounts of additionalC in soil and plant material; however, it will be the soil microflora and their pro-cessing of plant C that will govern the rate and amount of C that is stored.
The magnitude of rangeland and forest land in the United States and worldwideis staggering. Grazing land in the United States constitutes 336 Mha, 48% of whichis technically rangeland (161 Mha), about the same as cropland; rangeland com-bined with grassland pasture totals 239 Mha. Grazing land is estimated to cover55% of the total U.S. land area and about the same on a global basis. Forest eco-systems occupy 298 Mha in the United States and 3650 Mha globally, excludingboreal forests. Ecosystem scientists believe that through proper management, theseecotypes occupying vast areas can sequester large amounts of C in the soil, pro-viding an increase in soil quality and ecosystem health and removing the green-house gas CO2 from the atmosphere.
There are a number of management practices and land use changes that couldbenefit increasing soil C in range- and grazing land. Much of the semiarid and aridgrazing lands are highly erodible subject to both wind and water erosion and wouldbenefit by conversion to managed grasslands with greater input intensity. Improvinggrazing management has been shown to increase soil C compared to nongrazedexclosures. However, the increases in total soil C and N with grazing may be soiltexture dependent. The conversion of forest to pasture and marginal cropland topasture can also substantially increase soil C as can better management of fertil-ity and plant species composition. The estimations of the amount of soil C thatcould be stored in managed U.S. privately owned grazing lands range from 30 to 110 million metric tons (MMT) C year�1 or 142 to 519 kg-C ha�1 year�1. Thelatter value can be compared to the CRP land that converts cropland to grasslandand increases the sequestration of soil C by 400 to 1000 kg-C ha�1 year�1.
Forest management practices also contribute to the increase in soil quality andecosystem health by increasing soil C. The conversion of marginal land andhighly erodible land to forest will increase soil C and also provide an abovegroundcomponent of sequestered C to the ecosystem. Increasing intensively managedtimberland and canopy cover in urban areas has a large potential effect on soil Cand maximum C sequestration. Even with the negative aspects of wood removaland burning, growing short-rotation woody crops for energy has a substantialpotential to sequester soil C. The U.S. estimates for these practices on forest andmarginal land range from 276 to 529 MMT-C year�1; this can be compared to anestimate of 75 to 208 MMT-C year�1 from more intensive management of U.S.cropland.
The potential amount of increased C sequestration in soils of grazing lands andcroplands of the United States amounts to about 13% of the 1600 MMT-CEyear�1 (CE represents C equivalents) greenhouse gas emissions from the United
Changing Soil Organism Populations and Processes 479
Ch17-P546807.qxd 11/18/06 7:15 PM Page 479

States. With the increase in C sequestered by forests in soil and above ground thispercentage more than doubles. Thus, soil C sequestration is a viable mechanismof reducing greenhouse emissions from the United States. Considering the globalmagnitude of the land area in rangeland and forest, if these lands could also bemanaged, soil C could be a significant strategy in reducing global greenhouse gases.
Thus when speaking about the health of an ecosystem, we must consider thewhole system, including feedbacks. The system just described shows the benefitof increasing SOM to forest ecosystem health in addition to the benefit of reducinggreenhouse gases. However, since increasing SOM is a balance between primaryplant production and microbial decomposition it is the maintenance of suitablemicrobial habitat that will control the ecosystem health.
ALTERNATIVE AGRICULTURAL MANAGEMENT
ORGANIC AGRICULTURE
Organic agriculture strives to integrate human, environmental, and economicallysustainable production systems. The term organic does not necessarily refer to thetypes of inputs to the system but more to the holistic interaction of the plants, soil,animals, and humans in the system. Organic agriculture management promotesmaintaining SOM levels for soil fertility, providing plant nutrients through micro-bial decomposition of organic materials, and control of pests, disease, and weedswith crop rotations, natural control agents, and pest-resistant plant varieties (Oelhaf,1978; Lampkin and Measures, 2001). Organic agriculture is practiced in almostall countries and has been applied to all agricultural products including livestockand milk.
In the 1990s, the land area under organic agriculture production and the num-ber of agricultural products produced organically exploded worldwide. At thepresent time, there are 24 Mha worldwide in organic production, including graz-ing lands for organic livestock production. The global distribution of organicfarmed land and the number of farms are shown in Fig. 17.1. The large land areaand small number of farms in the Oceania/Australia region is due to large areasused for grazing livestock production with no inputs. Early in organic agriculturedevelopment, standards varied and certification of organic production was con-trolled on a regional basis or within country organizations. Now organic certifica-tion bodies worldwide are accredited by the International Federation of OrganicAgriculture Movements (www.Ifoam.org), which sets basic standard organicpractices.
Soil properties and soil functioning will be altered as a consequence of con-verting from conventional fertilizer-based farming to organic farming. During theconversion to organic production SOM levels and other nutrients can decrease(Wander et al., 1994; Rees et al., 2001). However, if manures are incorporated intothe transition increases in these soil properties can be achieved. Transition affects
480 Chapter 17 Management of Organisms and Their Processes in Soils
Ch17-P546807.qxd 11/18/06 7:15 PM Page 480

a combination of changes in the microbial community and a physical redistributionof SOM fractions (Wander and Traina, 1996; Clark et al., 1998). In the long term,soils under organic management will tend to increase in SOM. In addition, organi-cally managed soils also have increased levels of biologically active SOM, whichpromotes an active microflora. This is why organically managed soils have a greatermicrobial biomass, more active microbial respiration, and a higher rate of N min-eralization than conventionally farmed soils (Reganold et al., 1993; Clark et al.,1998).
Since organic systems are often low nutrient input systems, with respect to N, P, and K, the cycling of SOM by microorganisms is important because plantsrely on nutrients solely from SOM. These systems may work due to an increase inmicrobial biodiversity as transition to organic management occurs. Organic sys-tems have higher catabolic activity and nutrient cycling stability as the microbialdiversity increases. However, this increase in diversity and its relationship to soilfunction are poorly understood, leading others to conclude that microbial bio-diversity is not the primary regulator of SOM dynamics. The mechanistic basis ofthe microbial diversity–soil function relationship with respect to C and N cyclingneeds further study.
Alternative Agricultural Management 481
Latin America
Europe
North America
Asia
Africa
Oceania
Latin America
Europe
North America
Asia
Africa
Oceania
Mha
5.8
10
0.325.5
0.881.5
71
61
11
2
170
150
farms � 1000
FIGURE 17.1 Hectares in organic food production and number of organic farms on a globalbasis.
Ch17-P546807.qxd 11/18/06 7:15 PM Page 481

There are scant scientific studies on the nutritional benefits of organicallygrown foods; however, higher levels of vitamin C, flavonoids, and nutrient ele-ments Ca, Mg, and Fe and superior taste are commonly cited. Comparatively, inconventionally fertilized soils it has been shown that excess N can decrease thenutritional quality and taste of crops and make plants more susceptible to diseasesand insects. Excess N is also responsible for decreasing the vitamin C of crops.The most often cited benefits of organically grown foods are probably what maynot be on and in the foodstuffs, such as herbicide and pesticide residues and highconcentrations of nitrates. In addition, no genetically modified (GM) crops oringredients are allowed in organic foods, and in animal production there is no rou-tine use of antibiotics.
BIODYNAMIC AGRICULTURE
Another example of organic-based food production is biodynamic agricultureor farming, which is rooted in the lectures of Dr. Rudolf Steiner in 1924 to a groupof farmers concerned with decreasing crop quality, yield, and animal health. Dr. Steiner was a philosopher and editor of Goethe’s scientific writings. The lec-tures described a holistic view of a farm as an organism with the plant and animalcommunity of a natural habitat striving for a certain balance in which the numbersof species and individuals are constant. Farm management including clearing,plowing, cutting, and grazing along with using monoculture crops creates an imbal-ance in the system, preventing periods of recovery, thus creating an unsustainableagricultural system. In similar fashion the use of pesticides kills both pests andbeneficial organisms, creating an imbalanced system, which destroys productiv-ity. The biodynamic approach is based on an understanding of the interrelation-ships between of living organisms and the processes that make up the ecologicalsystem (Koepf et al., 1976).
Biodynamic farming is a system of organic farming that includes crop diversi-fication, use of green manures, and use of compost and manures improved by bio-dynamic preparations. The biodynamic preparations consist of selected plant andanimal substances that undergo fermentation for a year and then are used toenhance compost and manure used in the farming operation. These preparationscan also be applied directly to soil as a spray to enhance biological activity. Theuse of biodynamic preparations is the main difference between biodynamic farm-ing and traditional organic agriculture.
Part of the biodynamic philosophy is that a healthy, active soil microbial pop-ulation will enhance plant–microbe interactions and nutrient cycling and reducesoil pathogens. Studies over the first decade of the 21st century have shown thatbiodynamically managed fields maintain higher soil C levels, microbial respira-tion, mineralizable N, earthworm populations, and microbial biomass C and Nand greater enzyme activities. The biodynamic farms had better overall soil qualitymostly due to enhanced microbial decomposition and stabilization of organic mat-ter. Thus, the manipulation of soil organism populations to a larger, more active,
482 Chapter 17 Management of Organisms and Their Processes in Soils
Ch17-P546807.qxd 11/18/06 7:15 PM Page 482

and perhaps more diverse community through particular amendments provides ameans to shift from a chemical-based to an organic-based agriculture.
COMPOSTING
Composting is the active process of converting organic material to more stabi-lized forms of C through the action of microorganisms. Specifically, composting isthe biological decomposition of wastes consisting of organic substances of plant oranimal origin under controlled conditions to a state sufficiently stable for storageand utilization (Diaz et al., 1993). Compost as a product can be used in gardens, innurseries, and on agricultural land. With respect to management of organisms,composting is perhaps the prime example since we manage the microbial processand the microbial product and manage the use of compost in microbially based sys-tems (Cooperband, 2002). As the compost definition implies, practically any plantor animal material can be composted. Compost plays a major role in the agricul-ture of developing countries using organic agriculture and biodynamic farming,being relied upon to provide organic matter and nutrients and increase soil tilth. Italso plays a role in processing the human waste stream. The United States aloneproduces nearly 10 MMT of sewage sludge and 185 MMT of garbage annually, ona dry weight basis. Less than 15% of municipal solid waste is recycled; however,more than 30% of the sewage sludge is beneficially used as composted products(Rynk, 1992; http://compost.css.cornell.edu/OnFarmHandbook).
Traditionally yard waste is thought of as “the” compost material; however,manure, meat and dairy waste, wood, sawdust, and crop residue can be composted.In addition, animal carcass composting is receiving significant attention due to theenvironmental benefits versus burial, which can contribute to groundwater contam-ination. One important aspect of the material that affects the compost process andproduct is the C:N ratio of the starting material, ideally it should be 25 to 30:1.Typical C:N ratios of different materials are shown in Table 17.3. Materials can be
Alternative Agricultural Management 483
TABLE 17.3 C:N Ratios of VariousCompost Materials
Materials C:N
Activated sludge 6Grass clippings 12–15Manure 20–50Poultry manure 15Soil humus 10Sawdust 200–500Vegetable waste 12Wheat straw 80Wood 400
Ch17-P546807.qxd 11/18/06 7:15 PM Page 483

mixed to adjust the C:N ratio for a consistent product. There are numerous methodsused for preparing materials and the environment for the composting process,including using waste materials alone, mixing organic materials of different quality,adding external nutrients and/or inocula, and controlling the physical environmentto promote aerobic or anaerobic decomposition.
In compost terminology, process strategy refers to the management of the bio-logical and chemical activity of the composting process. The biological process-ing uses terminology referring to the stage of the composting, such as active stage(mesophilic), high-rate stage (thermophilic), controlled (cooling), and curing stage(maturing) (Fig. 17.2). Configuration refers to the physical management of theprocess such as using piles, stacks, or windrows. Composting configurationsrange from windrow or open systems to enclosed systems, with windrow furtherclassified as either static or turned. An example of a static system would be a sta-tionary undisturbed mound of organic material with air being forced up throughthe mound or pulled down through the mound. In contrast, a turned system usesmixing as the aeration method, which also enhances the uniformity of decompo-sition and reduction in material particle size. The turned system is considered thetraditional composting method for organic material (see Diaz et al., 1993, formore detail). With any composting system managing the composting process willconsistently produce compost with the desired characteristics.
484 Chapter 17 Management of Organisms and Their Processes in Soils
200 days
Mesophilicphase
Mesophiles
Thermophilicphase
Coolingdownphase
Maturingphase
Labilesubstrates
utilized
Straw windrow turning eventAppearanceof soil fauna
Thermophiles
TemperatureMineralizationof cell wall
Lignindegradation Formation
of humicmicrobial products
Turnovers ofmesophiles
NH4�
mineralization
High C/N ratio Low
70
60
50
40
30
20
10
1010
109
108
107
106
105
104
Org
anis
ms
g�1
stra
w
FIGURE 17.2 The organisms and processes occurring during composting of straw. The lengthof time varies with outside temperature and extent of mixing but usually involves 200 days (from W. R. Horwath, personal communication).
Ch17-P546807.qxd 11/18/06 7:16 PM Page 484
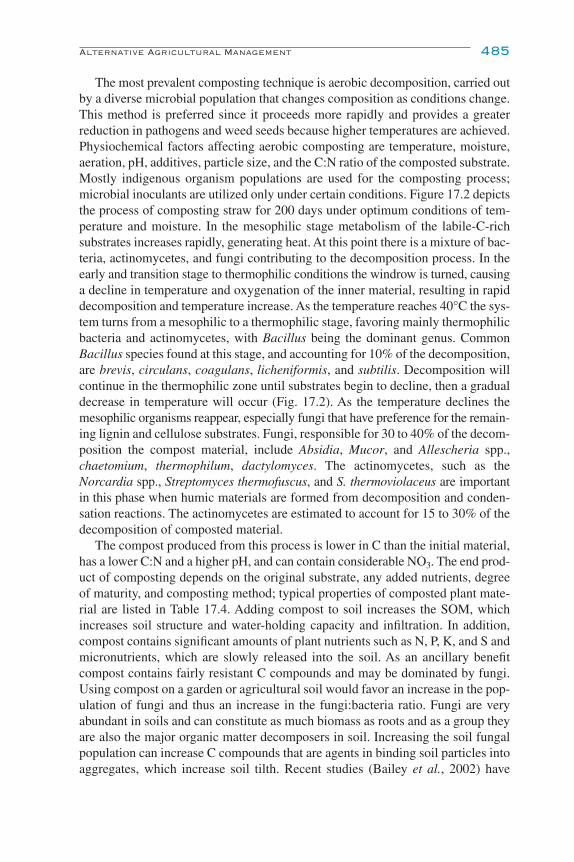
The most prevalent composting technique is aerobic decomposition, carried outby a diverse microbial population that changes composition as conditions change.This method is preferred since it proceeds more rapidly and provides a greaterreduction in pathogens and weed seeds because higher temperatures are achieved.Physiochemical factors affecting aerobic composting are temperature, moisture,aeration, pH, additives, particle size, and the C:N ratio of the composted substrate.Mostly indigenous organism populations are used for the composting process;microbial inoculants are utilized only under certain conditions. Figure 17.2 depictsthe process of composting straw for 200 days under optimum conditions of tem-perature and moisture. In the mesophilic stage metabolism of the labile-C-richsubstrates increases rapidly, generating heat. At this point there is a mixture of bac-teria, actinomycetes, and fungi contributing to the decomposition process. In theearly and transition stage to thermophilic conditions the windrow is turned, causinga decline in temperature and oxygenation of the inner material, resulting in rapiddecomposition and temperature increase. As the temperature reaches 40°C the sys-tem turns from a mesophilic to a thermophilic stage, favoring mainly thermophilicbacteria and actinomycetes, with Bacillus being the dominant genus. CommonBacillus species found at this stage, and accounting for 10% of the decomposition,are brevis, circulans, coagulans, licheniformis, and subtilis. Decomposition willcontinue in the thermophilic zone until substrates begin to decline, then a gradualdecrease in temperature will occur (Fig. 17.2). As the temperature declines themesophilic organisms reappear, especially fungi that have preference for the remain-ing lignin and cellulose substrates. Fungi, responsible for 30 to 40% of the decom-position the compost material, include Absidia, Mucor, and Allescheria spp.,chaetomium, thermophilum, dactylomyces. The actinomycetes, such as theNorcardia spp., Streptomyces thermofuscus, and S. thermoviolaceus are importantin this phase when humic materials are formed from decomposition and conden-sation reactions. The actinomycetes are estimated to account for 15 to 30% of thedecomposition of composted material.
The compost produced from this process is lower in C than the initial material,has a lower C:N and a higher pH, and can contain considerable NO3. The end prod-uct of composting depends on the original substrate, any added nutrients, degreeof maturity, and composting method; typical properties of composted plant mate-rial are listed in Table 17.4. Adding compost to soil increases the SOM, whichincreases soil structure and water-holding capacity and infiltration. In addition,compost contains significant amounts of plant nutrients such as N, P, K, and S andmicronutrients, which are slowly released into the soil. As an ancillary benefitcompost contains fairly resistant C compounds and may be dominated by fungi.Using compost on a garden or agricultural soil would favor an increase in the pop-ulation of fungi and thus an increase in the fungi:bacteria ratio. Fungi are veryabundant in soils and can constitute as much biomass as roots and as a group theyare also the major organic matter decomposers in soil. Increasing the soil fungalpopulation can increase C compounds that are agents in binding soil particles intoaggregates, which increase soil tilth. Recent studies (Bailey et al., 2002) have
Alternative Agricultural Management 485
Ch17-P546807.qxd 11/18/06 7:16 PM Page 485

shown there is increased soil C storage in soils with greater fungal:bacterial ratios.Thus, as a consequence of using compost on our soil we have managed the soilmicroorganism population to our benefit.
CROP ROTATIONS AND GREEN MANURES
Crop rotations have been practiced over the long history of agriculture. Studiesdating from the 1840s on have shown that N supplied to grain crops was the majorreason for using crop rotations containing legumes (Triplett and Mannering,1978). With the advent of inexpensive nitrogen fertilizers, crop rotations contain-ing legumes declined. Only recently has the value of crop rotations specificallyincluding legumes been recognized as critical in maintaining SOM and soil pro-ductivity. Researchers in Canada studied the nutrient dynamics in a CanadianLuvisol after 50 years of cropping to a 2-year rotation (wheat–fallow) or a 5-yearrotation (wheat–oats–barley–forage–forage) (McGill et al., 1986). Their resultsshowed that the soil cropped to the 5-year rotation contained greater amounts oforganic C and N. In addition they found that microbial turnover (i.e., carbon min-eralization) was twice as fast in the 2-year rotation. The 5-year rotation doubledthe input of carbon into the soil over the 2-year system and had a greater percent-age of organic C and N in biological form. These results suggest that longer crop-ping system rotations that include forage or legumes will conserve SOM, maintaina greater biological nutrient pool, and put more nutrients into the soil than inten-sive rotations.
In a 10-year study, a low-input diverse crop system with manure and a low-inputcash grain system with legumes showed significant increases in SOM comparedto a conventional corn/soybean rotation (Wander et al., 1994). In addition, in bothlow-input (multiple crop rotations) systems the microbial biomass was greater andits activity higher than the conventional rotation of corn/soybeans with chemicalinputs. The low-input systems also mineralized significantly more N and themicrobial biomass contained 33 kg N ha�1 more N than the conventional system.
486 Chapter 17 Management of Organisms and Their Processes in Soils
TABLE 17.4 General Compost Properties
%N �2C:N �20%Ash 10–20%Moisture 10–20%P 0.15–1.5Color Brown blackOdor Earthy%Water-holding capacity 150–200CEC (meq 100 g–1) 75–100%Reducing sugars �35
Ch17-P546807.qxd 11/18/06 7:16 PM Page 486
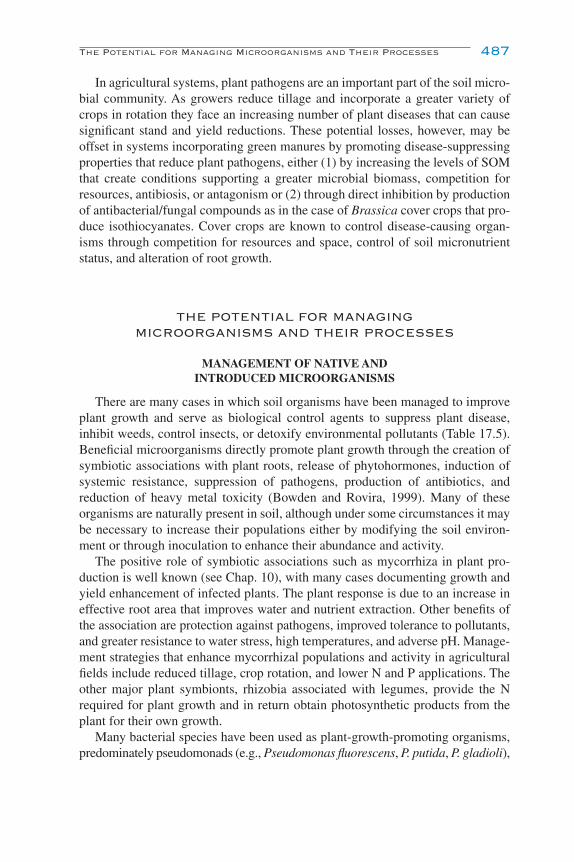
In agricultural systems, plant pathogens are an important part of the soil micro-bial community. As growers reduce tillage and incorporate a greater variety ofcrops in rotation they face an increasing number of plant diseases that can causesignificant stand and yield reductions. These potential losses, however, may beoffset in systems incorporating green manures by promoting disease-suppressingproperties that reduce plant pathogens, either (1) by increasing the levels of SOMthat create conditions supporting a greater microbial biomass, competition forresources, antibiosis, or antagonism or (2) through direct inhibition by productionof antibacterial/fungal compounds as in the case of Brassica cover crops that pro-duce isothiocyanates. Cover crops are known to control disease-causing organ-isms through competition for resources and space, control of soil micronutrientstatus, and alteration of root growth.
THE POTENTIAL FOR MANAGINGMICROORGANISMS AND THEIR PROCESSES
MANAGEMENT OF NATIVE AND INTRODUCED MICROORGANISMS
There are many cases in which soil organisms have been managed to improveplant growth and serve as biological control agents to suppress plant disease,inhibit weeds, control insects, or detoxify environmental pollutants (Table 17.5).Beneficial microorganisms directly promote plant growth through the creation ofsymbiotic associations with plant roots, release of phytohormones, induction ofsystemic resistance, suppression of pathogens, production of antibiotics, andreduction of heavy metal toxicity (Bowden and Rovira, 1999). Many of theseorganisms are naturally present in soil, although under some circumstances it maybe necessary to increase their populations either by modifying the soil environ-ment or through inoculation to enhance their abundance and activity.
The positive role of symbiotic associations such as mycorrhiza in plant pro-duction is well known (see Chap. 10), with many cases documenting growth andyield enhancement of infected plants. The plant response is due to an increase ineffective root area that improves water and nutrient extraction. Other benefits ofthe association are protection against pathogens, improved tolerance to pollutants,and greater resistance to water stress, high temperatures, and adverse pH. Manage-ment strategies that enhance mycorrhizal populations and activity in agriculturalfields include reduced tillage, crop rotation, and lower N and P applications. Theother major plant symbionts, rhizobia associated with legumes, provide the Nrequired for plant growth and in return obtain photosynthetic products from theplant for their own growth.
Many bacterial species have been used as plant-growth-promoting organisms,predominately pseudomonads (e.g., Pseudomonas fluorescens, P. putida, P. gladioli),
The Potential for Managing Microorganisms and Their Processes 487
Ch17-P546807.qxd 11/18/06 7:16 PM Page 487

bacilli (e.g., Bacillus subtilis, B. cereus, B. circulans), and others (e.g., Azospirillum,Serratia, Flavobacterium, Alcaligenes, Klebsiella, Enterobacter). Many of thesebacteria produce the growth regulators auxins, cytokinins, gibberellins, or ethyl-ene or abscisic acid, which stimulates plant growth (Arshad and Frankenberger,1998). Azospirillum inoculation increases the density and length of root hairs aswell as the elongation of lateral roots, increasing root surface area. The increasedroot area results in greater niche areas promoting greater colonization of species.
MANAGING MICROBIAL POPULATIONS AS AGENTS OFBIOLOGICAL CONTROL
One of the fastest growing areas in pesticide development is the use of microor-ganisms for the biological control of pests (biopesticides). The fundamental con-cept of biological control is the selection and introduction of specific organisms tocontrol a particular pest. The organism(s) selected might be a predator, parasite,competitor, or pathogen of the targeted pest. Biological control occurs widely innature, masking the fact that most pests never become serious problems becauseof the controls exerted by other members of the community. Biological controlmethods are commonly a part of an overall integrated pest management programto reduce the legal, environmental, and public safety hazards of chemicals. Inaddition, it may be a less expensive alternative to the use of some pesticides.Unlike most pesticides, biological control agents are often specific for a particular
488 Chapter 17 Management of Organisms and Their Processes in Soils
TABLE 17.5 Examples of Bacteria and Fungi Introduced to Improve AgriculturalProductivity, Control Pests, and Degrade Toxic Substances in Soil
Example Microorganisms
Plant growth Bradyrhizobia, Mycorrhizae, Azotobacter, PGPRBa
Biological controlPlant pathogens Trichoderma, Fusaria, PseudomonasInsects Bacillus, SaccharopolysporaWeeds Colletotrichum, Phytophthora, Sclerotinia, Pseudomonas
BioremediationAromatic hydrocarbonsPolycyclic Stropharia, SphungomonasBTEX (benzene, toluene, Bacillus, Cladophidophora, Pseudomonas, Azoarcusethylbenzene, xylene)
Pesticides–carbamates Achromobacter, PseudomonasOrganophosphates Flavobacterium, PseudomonasPentachorophenol Athrobacter, Mycobacterium, Flavobacterium,
PhanerochaeteTriazines Klebsiella, Rhodococcus
Heavy metals, radionuclides Deinococcus, Geobacter, Shewanella
aPGPRB, plant-growth-promoting bacteria.
Ch17-P546807.qxd 11/18/06 7:16 PM Page 488
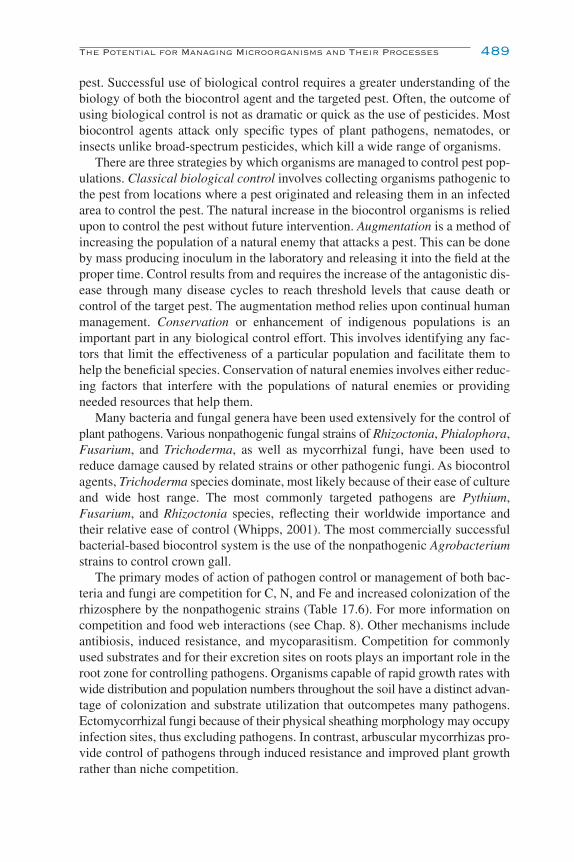
pest. Successful use of biological control requires a greater understanding of thebiology of both the biocontrol agent and the targeted pest. Often, the outcome ofusing biological control is not as dramatic or quick as the use of pesticides. Mostbiocontrol agents attack only specific types of plant pathogens, nematodes, orinsects unlike broad-spectrum pesticides, which kill a wide range of organisms.
There are three strategies by which organisms are managed to control pest pop-ulations. Classical biological control involves collecting organisms pathogenic tothe pest from locations where a pest originated and releasing them in an infectedarea to control the pest. The natural increase in the biocontrol organisms is reliedupon to control the pest without future intervention. Augmentation is a method ofincreasing the population of a natural enemy that attacks a pest. This can be doneby mass producing inoculum in the laboratory and releasing it into the field at theproper time. Control results from and requires the increase of the antagonistic dis-ease through many disease cycles to reach threshold levels that cause death orcontrol of the target pest. The augmentation method relies upon continual humanmanagement. Conservation or enhancement of indigenous populations is animportant part in any biological control effort. This involves identifying any fac-tors that limit the effectiveness of a particular population and facilitate them tohelp the beneficial species. Conservation of natural enemies involves either reduc-ing factors that interfere with the populations of natural enemies or providingneeded resources that help them.
Many bacteria and fungal genera have been used extensively for the control ofplant pathogens. Various nonpathogenic fungal strains of Rhizoctonia, Phialophora,Fusarium, and Trichoderma, as well as mycorrhizal fungi, have been used toreduce damage caused by related strains or other pathogenic fungi. As biocontrolagents, Trichoderma species dominate, most likely because of their ease of cultureand wide host range. The most commonly targeted pathogens are Pythium,Fusarium, and Rhizoctonia species, reflecting their worldwide importance andtheir relative ease of control (Whipps, 2001). The most commercially successfulbacterial-based biocontrol system is the use of the nonpathogenic Agrobacteriumstrains to control crown gall.
The primary modes of action of pathogen control or management of both bac-teria and fungi are competition for C, N, and Fe and increased colonization of therhizosphere by the nonpathogenic strains (Table 17.6). For more information oncompetition and food web interactions (see Chap. 8). Other mechanisms includeantibiosis, induced resistance, and mycoparasitism. Competition for commonlyused substrates and for their excretion sites on roots plays an important role in theroot zone for controlling pathogens. Organisms capable of rapid growth rates withwide distribution and population numbers throughout the soil have a distinct advan-tage of colonization and substrate utilization that outcompetes many pathogens.Ectomycorrhizal fungi because of their physical sheathing morphology may occupyinfection sites, thus excluding pathogens. In contrast, arbuscular mycorrhizas pro-vide control of pathogens through induced resistance and improved plant growthrather than niche competition.
The Potential for Managing Microorganisms and Their Processes 489
Ch17-P546807.qxd 11/18/06 7:16 PM Page 489

The production of antimicrobial metabolites is one of the most studied aspects of biocontrol. Antibiotics produced by a wide range of bacteria and fungiinclude pyrrolnitrin, phycocyanin, 2,4-diacetylphoroglucinol xanthobactin, andzwittermycin A.
CONTROL OF INSECTS
Insect infestations can cause a significant decrease in crop productivity. Infes-tations have been historically difficult to control without the use of highly toxicsynthetic chemicals. The most well known biopesticides for insect control are theBacillus thuringiensis (Bt) formulations for the control of lepidopterous pests.This bacterium produces a protein that by itself is harmless to most insects, but isconverted to a potent toxin in the gut of specific target insects following ingestion.The mode of action of Bt is very specific. Different strains of Bt are specific to dif-ferent receptors in the gut wall of insects. Bt toxicity depends on recognizing
490 Chapter 17 Management of Organisms and Their Processes in Soils
TABLE 17.6 Mechanisms of Biocontrol by Soil Bacterial and Fungal Agents
Method of control Organism Mechanism
Competition Niche exclusion, high reproduction rates, nutrient uptake, iron-chelating compounds
AntibiosisBacteria Pseudomonas, Bacillus, Inhibition by production of
Streptomyces, antimicrobial compounds, e.g., HCN,Agrobacterium oomycin A, 2,4-diacetylphoroglucinol,
zwittermycin, phenazine 1-carboxylic acid, pyrrolnitrin, agrocin 84
Fungi Trichoderma, Inhibition by production of Talaromyces, Penicillium antimicrobial compounds, e.g.,
glioviron, gliotoxin, hydrogen peroxide, penicillin
Induced resistance Bacillus, Pseudomonas, Biochemical changes in plant cell walls Fusarium, Trichoderma, that are induced by physical or Pythium biochemical agents, e.g., siderophores,
chitinases, peroxidase, lipopolysaccharides, phytoalexins, ethylene, salicylic acid
Mycoparasitism Verticillium, Trichoderma, The process of mycoparasites is to senseConiothyrium host, direct growth, contact, recognize,
attach, penetrate, and exit; they produce cell-wall-degrading lytic enzymes, chitinases, β1,3-glucanases, cellulases, proteases
Ch17-P546807.qxd 11/18/06 7:16 PM Page 490
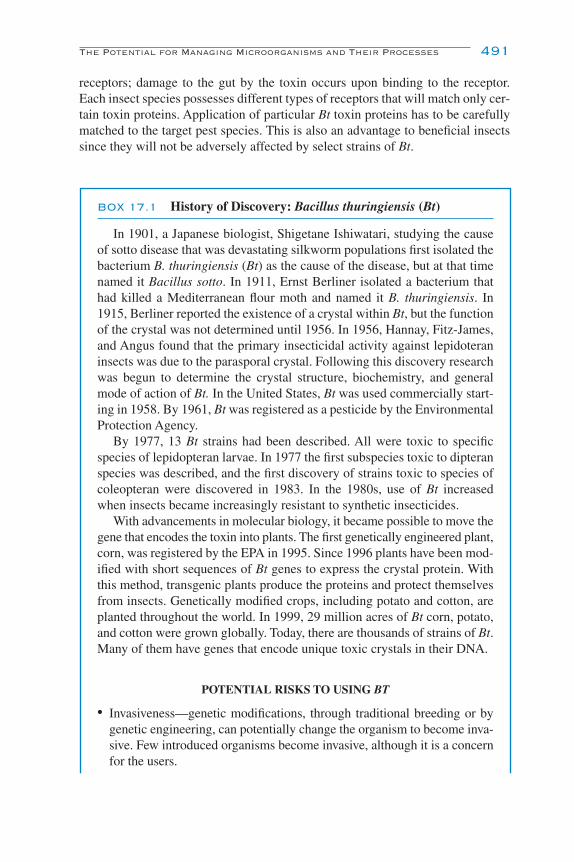
receptors; damage to the gut by the toxin occurs upon binding to the receptor.Each insect species possesses different types of receptors that will match only cer-tain toxin proteins. Application of particular Bt toxin proteins has to be carefullymatched to the target pest species. This is also an advantage to beneficial insectssince they will not be adversely affected by select strains of Bt.
The Potential for Managing Microorganisms and Their Processes 491
BOX 17.1 History of Discovery: Bacillus thuringiensis (Bt)
In 1901, a Japanese biologist, Shigetane Ishiwatari, studying the causeof sotto disease that was devastating silkworm populations first isolated thebacterium B. thuringiensis (Bt) as the cause of the disease, but at that timenamed it Bacillus sotto. In 1911, Ernst Berliner isolated a bacterium thathad killed a Mediterranean flour moth and named it B. thuringiensis. In1915, Berliner reported the existence of a crystal within Bt, but the functionof the crystal was not determined until 1956. In 1956, Hannay, Fitz-James,and Angus found that the primary insecticidal activity against lepidoteraninsects was due to the parasporal crystal. Following this discovery researchwas begun to determine the crystal structure, biochemistry, and generalmode of action of Bt. In the United States, Bt was used commercially start-ing in 1958. By 1961, Bt was registered as a pesticide by the EnvironmentalProtection Agency.
By 1977, 13 Bt strains had been described. All were toxic to specificspecies of lepidopteran larvae. In 1977 the first subspecies toxic to dipteranspecies was described, and the first discovery of strains toxic to species ofcoleopteran were discovered in 1983. In the 1980s, use of Bt increasedwhen insects became increasingly resistant to synthetic insecticides.
With advancements in molecular biology, it became possible to move thegene that encodes the toxin into plants. The first genetically engineered plant,corn, was registered by the EPA in 1995. Since 1996 plants have been mod-ified with short sequences of Bt genes to express the crystal protein. Withthis method, transgenic plants produce the proteins and protect themselvesfrom insects. Genetically modified crops, including potato and cotton, areplanted throughout the world. In 1999, 29 million acres of Bt corn, potato,and cotton were grown globally. Today, there are thousands of strains of Bt.Many of them have genes that encode unique toxic crystals in their DNA.
POTENTIAL RISKS TO USING BT
• Invasiveness—genetic modifications, through traditional breeding or bygenetic engineering, can potentially change the organism to become inva-sive. Few introduced organisms become invasive, although it is a concernfor the users.
Ch17-P546807.qxd 11/18/06 7:16 PM Page 491
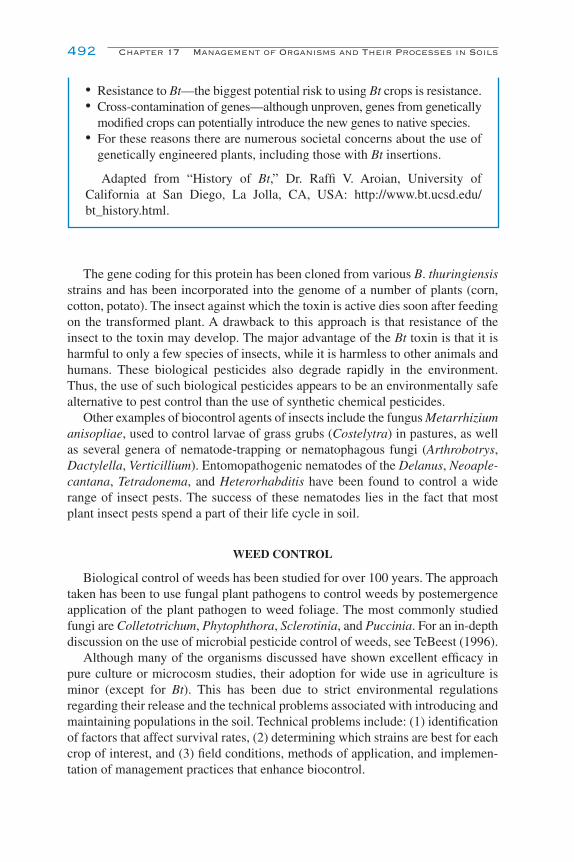
The gene coding for this protein has been cloned from various B. thuringiensisstrains and has been incorporated into the genome of a number of plants (corn,cotton, potato). The insect against which the toxin is active dies soon after feedingon the transformed plant. A drawback to this approach is that resistance of theinsect to the toxin may develop. The major advantage of the Bt toxin is that it isharmful to only a few species of insects, while it is harmless to other animals andhumans. These biological pesticides also degrade rapidly in the environment.Thus, the use of such biological pesticides appears to be an environmentally safealternative to pest control than the use of synthetic chemical pesticides.
Other examples of biocontrol agents of insects include the fungus Metarrhiziumanisopliae, used to control larvae of grass grubs (Costelytra) in pastures, as wellas several genera of nematode-trapping or nematophagous fungi (Arthrobotrys,Dactylella, Verticillium). Entomopathogenic nematodes of the Delanus, Neoaple-cantana, Tetradonema, and Heterorhabditis have been found to control a widerange of insect pests. The success of these nematodes lies in the fact that mostplant insect pests spend a part of their life cycle in soil.
WEED CONTROL
Biological control of weeds has been studied for over 100 years. The approachtaken has been to use fungal plant pathogens to control weeds by postemergenceapplication of the plant pathogen to weed foliage. The most commonly studiedfungi are Colletotrichum, Phytophthora, Sclerotinia, and Puccinia. For an in-depthdiscussion on the use of microbial pesticide control of weeds, see TeBeest (1996).
Although many of the organisms discussed have shown excellent efficacy inpure culture or microcosm studies, their adoption for wide use in agriculture isminor (except for Bt). This has been due to strict environmental regulationsregarding their release and the technical problems associated with introducing andmaintaining populations in the soil. Technical problems include: (1) identificationof factors that affect survival rates, (2) determining which strains are best for eachcrop of interest, and (3) field conditions, methods of application, and implemen-tation of management practices that enhance biocontrol.
492 Chapter 17 Management of Organisms and Their Processes in Soils
• Resistance to Bt—the biggest potential risk to using Bt crops is resistance.• Cross-contamination of genes—although unproven, genes from genetically
modified crops can potentially introduce the new genes to native species.• For these reasons there are numerous societal concerns about the use of
genetically engineered plants, including those with Bt insertions.
Adapted from “History of Bt,” Dr. Raffi V. Aroian, University ofCalifornia at San Diego, La Jolla, CA, USA: http://www.bt.ucsd.edu/bt_history.html.
Ch17-P546807.qxd 11/18/06 7:16 PM Page 492
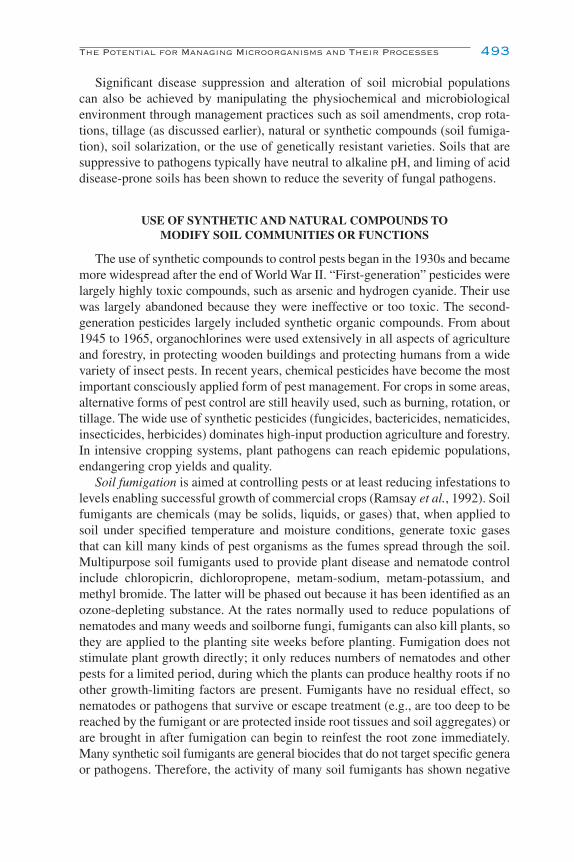
Significant disease suppression and alteration of soil microbial populations can also be achieved by manipulating the physiochemical and microbiologicalenvironment through management practices such as soil amendments, crop rota-tions, tillage (as discussed earlier), natural or synthetic compounds (soil fumiga-tion), soil solarization, or the use of genetically resistant varieties. Soils that aresuppressive to pathogens typically have neutral to alkaline pH, and liming of aciddisease-prone soils has been shown to reduce the severity of fungal pathogens.
USE OF SYNTHETIC AND NATURAL COMPOUNDS TOMODIFY SOIL COMMUNITIES OR FUNCTIONS
The use of synthetic compounds to control pests began in the 1930s and becamemore widespread after the end of World War II. “First-generation” pesticides werelargely highly toxic compounds, such as arsenic and hydrogen cyanide. Their usewas largely abandoned because they were ineffective or too toxic. The second-generation pesticides largely included synthetic organic compounds. From about1945 to 1965, organochlorines were used extensively in all aspects of agricultureand forestry, in protecting wooden buildings and protecting humans from a widevariety of insect pests. In recent years, chemical pesticides have become the mostimportant consciously applied form of pest management. For crops in some areas,alternative forms of pest control are still heavily used, such as burning, rotation, ortillage. The wide use of synthetic pesticides (fungicides, bactericides, nematicides,insecticides, herbicides) dominates high-input production agriculture and forestry.In intensive cropping systems, plant pathogens can reach epidemic populations,endangering crop yields and quality.
Soil fumigation is aimed at controlling pests or at least reducing infestations tolevels enabling successful growth of commercial crops (Ramsay et al., 1992). Soilfumigants are chemicals (may be solids, liquids, or gases) that, when applied tosoil under specified temperature and moisture conditions, generate toxic gasesthat can kill many kinds of pest organisms as the fumes spread through the soil.Multipurpose soil fumigants used to provide plant disease and nematode controlinclude chloropicrin, dichloropropene, metam-sodium, metam-potassium, andmethyl bromide. The latter will be phased out because it has been identified as anozone-depleting substance. At the rates normally used to reduce populations ofnematodes and many weeds and soilborne fungi, fumigants can also kill plants, sothey are applied to the planting site weeks before planting. Fumigation does notstimulate plant growth directly; it only reduces numbers of nematodes and otherpests for a limited period, during which the plants can produce healthy roots if noother growth-limiting factors are present. Fumigants have no residual effect, sonematodes or pathogens that survive or escape treatment (e.g., are too deep to bereached by the fumigant or are protected inside root tissues and soil aggregates) orare brought in after fumigation can begin to reinfest the root zone immediately.Many synthetic soil fumigants are general biocides that do not target specific generaor pathogens. Therefore, the activity of many soil fumigants has shown negative
The Potential for Managing Microorganisms and Their Processes 493
Ch17-P546807.qxd 11/18/06 7:16 PM Page 493

effects on both beneficial and deleterious populations of soil organisms. Numerousstudies show significant reductions in soil processes involved in the cycling of plantnutrients, symbiosis, and soil tilth.
Organic pesticides are usually considered as those pesticides that come from natural sources. The fundamental difference between organic and syntheticpesticides is not their toxicity, but their origin—whether they are extracted fromnatural plants, insects, or mineral ores or are chemically synthesized. These natu-ral sources are usually plants, as is the case with pyrethrum (pyrethins), rotenone,or ryania (botanical insecticides), or minerals, such as boric acid, cryolite, or diatomaceous earth. Two of the most common organic pesticides, copper andsulfur, are used as fungicides by organic growers. Because they are not as effectiveas their synthetic counterparts, they are applied at significantly higher rates.Copper fungicides are used to treat foliage, seeds, wood, fabric, and leather as aprotectant against blights, downy mildews, and rusts. In agriculture, copper com-pounds, especially copper sulfate, are used as fungicides, pesticides, algicides,nutritional supplements in animal feeds, and fertilizers. Copper is the 18th mostused pesticide in the United States. Over 13 million pounds of copper wereapplied to 54 crops in 1997. Copper, oil, and sulfur combined accounted for a full25% of U.S. pesticide use.
Organic pesticides are largely insecticides and nematicides, although they dohave efficacy against some bacterial and fungal pathogens. The efficiency of oil-seed meals of neem (Azadirachta indica), castor (Ricinus communis), mustard(Brassica campestris), and duan (Eruca sativa) has been evaluated against plant-parasitic nematodes and soil-inhabiting fungi that infest a number of crops. Thepopulation of plant-parasitic nematodes, Meloidogyne incognita, Rotylenchulusreniformis, Tylenchorhynchus brassicae, Helicotylenchus indicus, etc., and thefrequency of the pathogenic fungi Macrophomina phaseolina, Rhizoctonia solani,Phyllosticta phaseolina, Fusarium oxysporum f. ciceri, etc., have been signifi-cantly reduced by these treatments; whereas populations of saprophytic fungihave increased.
Soil solarization is a nonchemical technique used for the control of many soil-borne pathogens and pests (Katan and Devay, 1991; Gamliel et al., 2000). Thissimple technique captures radiant heat energy from the sun, thereby causing phys-ical, chemical, and biological changes in the soil. Transparent polyethylene plas-tic placed on moist soil during the hot summer months increases soil temperaturesto levels (71°C) lethal to many soilborne plant pathogens, weed seeds, andseedlings (including parasitic seed plants); nematodes; and some soil-residingmites. Soil solarization also improves plant nutrition by increasing the availabilityof nitrogen and other essential nutrients. Beneficial microbial populations, such asmycorrhizal fungi, Trichoderma sp., actinomycetes, and some beneficial bacteriasurvive the solarization process and rapidly recolonize the soil. These is turn maycontribute to a biological control of pathogens and pests and/or stimulate plantgrowth. Soil solarization also has been shown to be effective at reducing nema-tode populations, but less dramatically than it does fungal pathogens and weeds.
494 Chapter 17 Management of Organisms and Their Processes in Soils
Ch17-P546807.qxd 11/18/06 7:16 PM Page 494

Nematodes generally are more tolerant of heat and control is less effective in soildepths beyond 12 in. Solarization may therefore be useful and economically fea-sible for shallow-rooted crops.
MANIPULATING SOIL POPULATIONS FORBIOREMEDIATION OF XENOBIOTICS
Bioremediation manages microorganisms to reduce, eliminate, contain, ortransform contaminants present in soils, sediments, water, or air. Various forms ofbioremediation have been documented throughout recorded history. The com-posting of agricultural residues and sewage treatment are based on the use ofmicroorganisms to catalyze chemical transformations. Composting dates back to6000 BCE, with the modern use of bioremediation beginning over 100 years agowith the design and operation of the first biological sewage treatment plant in Sussex,England, in 1891. Over the past several decades, in situ degradation of biologi-cally foreign chemical compounds (solvents, explosives, polycyclic aromatichydrocarbons, heavy metals, radionuclides, etc.) has been used as a cost-effectivealternative to incineration or burial in landfills (Alexander, 1994). An advantage ofbioremediation over other methods is that it transforms contaminants instead ofsimply moving them from one source to another as in the practice of land filling(Table 17.7). Also it is relatively low cost compared to other methods of removal.In a bioremediation process, microorganisms break down contaminants to obtainchemical energy. It involves the manipulation of microorganisms and their meta-bolic processes (enzymes) to degrade compounds of concern. Figure 17.3 showsthe microbial degradation pathway of a pesticide, DDT (Bumpus and Aust, 1987).
Phanerochaete chrysosporium (and several other species) uses a peroxidaseenzyme system that acts in concert with H2O2, produced by the fungus, to degrademany recalcitrant organics, especially those with structures similar to lignin,which naturally degrades in soil systems. Degradable contaminants include DDT,lindane, chlordane, TNT, and PCBs. Bacteria and fungi have been shown to breakdown practically all hydrocarbon contamination in the natural environment.
Through studying natural processes, researchers have been able to determinewhat conditions are necessary for degradation and what organisms are activedegraders of specific pollutants and manipulate them. Examples of aerobic bacte-ria managed for their degradative abilities include Pseudomonas, Alcaligenes,Sphingomonas, Rhodococcus, and Mycobacterium. These bacteria have beenreported to degrade pesticides and hydrocarbons, both alkane and polyaromaticcompounds (PAHs). Many of these organisms are capable of using the contami-nant as the sole source of C and energy. In the absence of O2, anaerobic bacteria havebeen used in the remediation of polychlorinated biphenyls (PCBs) and dechlori-nation of trichloroethylene (TCE) and chloroform. Ligninolytic fungi, such as P. chrysosporium, have the ability to degrade an extremely diverse group of per-sistent PAHs. Methylotrophs use the methane monooxygenase pathway to degradea wide range of compounds including the chlorinated aliphatics, trichloroethylene,
The Potential for Managing Microorganisms and Their Processes 495
Ch17-P546807.qxd 11/18/06 7:16 PM Page 495

and 1,2-dichloroethane. Geobacter sulfurreducens (Fig. 17.4) grows with insolu-ble Mn(IV) oxides as the electron acceptor.
Several factors influence the success of bioremediation and should be consid-ered on a site-by-site basis. Factors include the existence of a microbial populationcapable of degrading the contaminant, availability of contaminants in the microbialpopulations, the type of contaminant, its concentration, and environmental factorssuch as soil type, temperature, pH, the presence of oxygen, or other electron
496 Chapter 17 Management of Organisms and Their Processes in Soils
TABLE 17.7 Description of Common Bioremediation Approaches
In situ bioremediation of soil The goal of aerobic in situ bioremediation is to supply oxygen and nutrients to the microorganisms in the soil and does not require excavation or removal of contaminated soils. In situ techniques can vary in the way they supply oxygen to the organisms that degrade the contaminants. Two such methods are bioventing and injection of hydrogen peroxide. Remediationcan take years to reach cleanup goals.
Bioventing Bioventing systems deliver air from the atmosphere into the soil above the water table through injection wells where contamination is located. Nutrients, nitrogen, and phosphorusmay be added to increase the growth rate of the microorganisms.
Injection of hydrogen peroxide This process delivers oxygen by circulating hydrogen peroxidethrough contaminated soils to stimulate the activity of indigenous microbial populations.
Ex situ bioremediation of soil Ex situ techniques require excavation and treatment of the contaminated soil. Ex situ techniques include slurry- and solid-phase techniques.
Liquid slurry phase Contaminated soil is combined with water and other additives in a bioreactor and mixed to keep indigenous microorganisms in contact with the contaminants.
Solid phase Solid-phase bioremediation treats soils in aboveground treatment areas equipped with collection systems to prevent contaminants from escaping.
Landfarming Contaminated soils are excavated and spread on a pad with a system that collects leachates or contaminated liquids that seep out of the contaminated soil. The soil is periodically turned to mix air or provide nutrients.
Soil biopiles Contaminated soil is piled to several meters over an air distribution system. Moisture and nutrient levels are incorporated to maximize microbial activity.
Composting Biodegradable contaminates are mixed with straw, hay, or otherC-rich compounds to facilitate optimum levels of air and water to microbial populations. The three commonly used designs are static pile composting, mechanically agitated in-vessel composting, and windrow composting.
Adapted from U.S. EPA (1996).
Ch17-P546807.qxd 11/18/06 7:16 PM Page 496
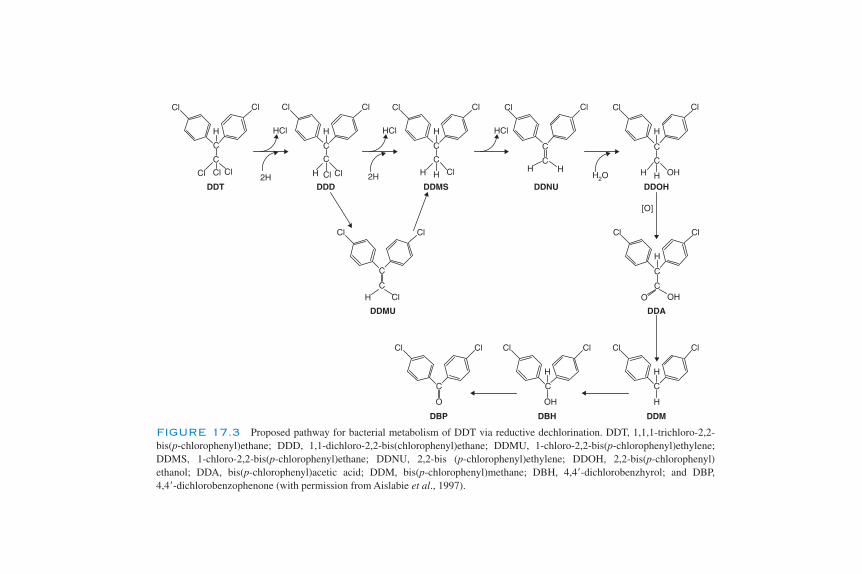
DBP
DDMU
DBH
DDT
DDM
DDD2H
HCl
DDMS2H
HCl
DDNU
HCl
H2ODDOH
C
H
ClCl
Cl Cl
C
Cl
H
H OHH
Cl Cl
C
C
Cl
HH
Cl
C
C
H
H ClH
Cl Cl
C
C
H
Cl ClH
Cl Cl
C
C
Cl
ClH
Cl
C
C
DDA
Cl
OHO
Cl
H
C
C
O
ClCl
C
OH
ClCl
H
C
H
ClCl
H
C
[O]
FIGURE 17.3 Proposed pathway for bacterial metabolism of DDT via reductive dechlorination. DDT, 1,1,1-trichloro-2,2-bis(p-chlorophenyl)ethane; DDD, 1,1-dichloro-2,2-bis(chlorophenyl)ethane; DDMU, 1-chloro-2,2-bis(p-chlorophenyl)ethylene;DDMS, 1-chloro-2,2-bis(p-chlorophenyl)ethane; DDNU, 2,2-bis (p-chlorophenyl)ethylene; DDOH, 2,2-bis(p-chlorophenyl)ethanol; DDA, bis(p-chlorophenyl)acetic acid; DDM, bis(p-chlorophenyl)methane; DBH, 4,4�-dichlorobenzhyrol; and DBP, 4,4�-dichlorobenzophenone (with permission from Aislabie et al., 1997).
Ch17-P546807.qxd 11/18/06 7:16 PM Page 497

acceptors and nutrients. Although microorganisms are present in contaminatedsoils, they are not necessarily present in the numbers required for intrinsic biore-mediation. Their growth and activity are typically stimulated with the addition ofnutrients and O2 (Table 17.8).
The most common pollutants in the environment are the monoaromatic hydro-carbons produced from gasoline and diesel fuel production (Phelps and Young,2000). Gasoline contains 20% by volume benzene, toluene, and xylene (BTEX).BTEX compounds enter the environment through accidental surface spills or
498 Chapter 17 Management of Organisms and Their Processes in Soils
FIGURE 17.4 Geobacter sulfurreducens is the dominant metal-reducing microorganism iso-lated from subsurface environments and aquifers. It oxidizes aromatic hydrocarbons with Fe(III) as theelectron acceptor. It can also oxidize organic pollutants while reducing other metals such as Mn(IV),U(VI), Te(VII), Co(VI), and Au(III). (Image courtesy of D. Lovely, University of Massachusetts.Reproduced from Anonymous (2003.)
TABLE 17.8 Environmental Conditions Influencing Biodegradation
Condition required forParameter microbial activity Optimum for oil degradation
Soil moisture 25–28% of water holding capacity 30–90%Soil pH 5.5–5.8 6.5–8.0Oxygen content Aerobic, minimum air-filled pore 10–40%
space 10%Nutrient content N and P C:N:P � 100:10:1Temperature (°C) 15–45 20–30Contaminants Not too toxic Hydrocarbon 5–10% of dry
wt of soilHeavy metals �2000 ppm 700 ppmSoil type Low clay or silt content
From Vidali (2001).
Ch17-P546807.qxd 11/18/06 7:16 PM Page 498
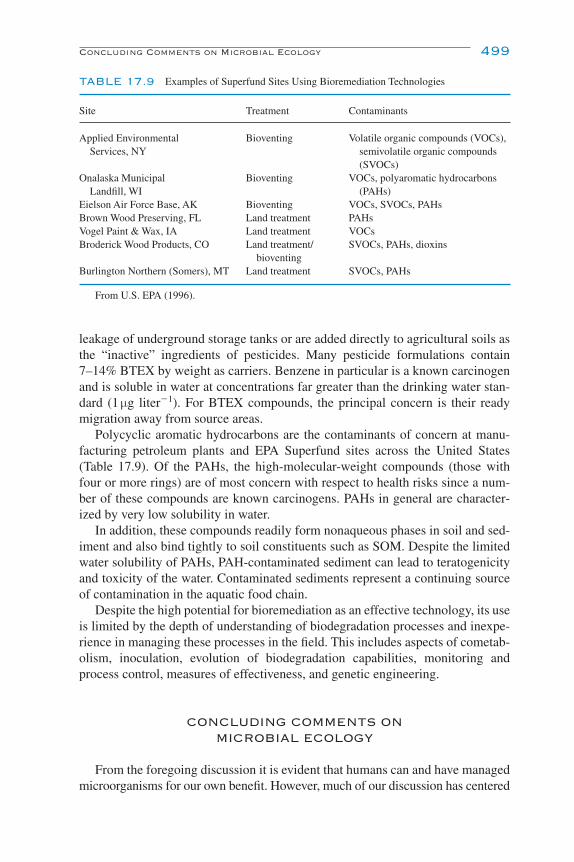
leakage of underground storage tanks or are added directly to agricultural soils asthe “inactive” ingredients of pesticides. Many pesticide formulations contain7–14% BTEX by weight as carriers. Benzene in particular is a known carcinogenand is soluble in water at concentrations far greater than the drinking water stan-dard (1 µg liter�1). For BTEX compounds, the principal concern is their readymigration away from source areas.
Polycyclic aromatic hydrocarbons are the contaminants of concern at manu-facturing petroleum plants and EPA Superfund sites across the United States(Table 17.9). Of the PAHs, the high-molecular-weight compounds (those withfour or more rings) are of most concern with respect to health risks since a num-ber of these compounds are known carcinogens. PAHs in general are character-ized by very low solubility in water.
In addition, these compounds readily form nonaqueous phases in soil and sed-iment and also bind tightly to soil constituents such as SOM. Despite the limitedwater solubility of PAHs, PAH-contaminated sediment can lead to teratogenicityand toxicity of the water. Contaminated sediments represent a continuing sourceof contamination in the aquatic food chain.
Despite the high potential for bioremediation as an effective technology, its useis limited by the depth of understanding of biodegradation processes and inexpe-rience in managing these processes in the field. This includes aspects of cometab-olism, inoculation, evolution of biodegradation capabilities, monitoring andprocess control, measures of effectiveness, and genetic engineering.
CONCLUDING COMMENTS ON MICROBIAL ECOLOGY
From the foregoing discussion it is evident that humans can and have managedmicroorganisms for our own benefit. However, much of our discussion has centered
Concluding Comments on Microbial Ecology 499
TABLE 17.9 Examples of Superfund Sites Using Bioremediation Technologies
Site Treatment Contaminants
Applied Environmental Bioventing Volatile organic compounds (VOCs),Services, NY semivolatile organic compounds
(SVOCs)Onalaska Municipal Bioventing VOCs, polyaromatic hydrocarbons
Landfill, WI (PAHs)Eielson Air Force Base, AK Bioventing VOCs, SVOCs, PAHsBrown Wood Preserving, FL Land treatment PAHsVogel Paint & Wax, IA Land treatment VOCsBroderick Wood Products, CO Land treatment/ SVOCs, PAHs, dioxins
bioventingBurlington Northern (Somers), MT Land treatment SVOCs, PAHs
From U.S. EPA (1996).
Ch17-P546807.qxd 11/18/06 7:16 PM Page 499
on “unnatural” systems in which we manipulate the organism environment toaccomplish the desired outcome. For example, culturing all of the organisms in agram of soil and using them in a fermentation of grape juice would produceundrinkable wine, but inoculating the fermentation with specific species of micro-organisms produces a quality product. In composting for gardens or commercialproduction, the operation is usually controlled at least with respect to ingredients,aeration, and moisture.
But what are the options and benefits with organisms and their management in “natural” environments? In natural environments, the mass of organisms andspecies composition (structure) are governed by the environment, including habi-tat, moisture, and temperature. Organisms form trophic levels with various modesof interaction and coexistence, from symbiotic to predatory. The community ofsoil organisms may increase or decrease and their composition may change prin-cipally due to influences of abiotic microclimate and natural input of metaboli-cally available substrates (plant litter, leachates, and exudates). The complexity ofthe system dictates that introduced organisms must find a niche to survive and bepersistent. In general, organisms introduced into a soil system do not usually sur-vive more than a period of days to weeks. The reason for poor survival rates couldbe due to nutrient competition, susceptibility to predation and chemical attack dueto differences in cell chemistry from culturing, or simply nutrient deficiencies.
In natural systems, organisms can be structured compartmentally to be close toother organism for symbiosis, away from other organisms for protection, and inproximity to nutrients and water. An example of organism symbiosis is fungibreaking down the macromolecule cellulose into smaller more “digestible” com-pounds that can be utilized by other bacteria and fungi that cannot utilize cellulosedirectly. In addition, an organism may need a specific growth factor or vitaminthat may be produced by specific bacteria, thus by growing in a mixed culture(soil) the first organism receives “nutritional symbiosis.” There is, however, a down side to living among a myriad of different organisms, that is, some arepredators and some will resort to predation to survive. Predation is probably thebiggest factor in organism composition changes over time. When carbon inputsfrom litter reach the soil, bacteria increase in numbers, and then bacterial-feedingprotozoa increase and a new short equilibrium will be reached in community com-position. This cyclic flux in population structure drives the complex food web sys-tem of the soil and dictates nutrient availability to plants. From this perspective,perhaps it is the soil microflora who is doing the “managing” in many ecosystems.
REFERENCES AND SUGGESTED READING
Aislabie, J. M., Richards, N. K., and Boul, H. L. (1997). Microbial degradation of DDT and itsresidues—a review. N. Z. J. Agric. Res. 40, 269–282.
Alexander, M. (1994). “Biodegradation and Bioremediation.” Academic Press, New York.Anonymous (2003). “Bioremediation of Metals and Radionuclides: a NABIR Primer.” 2nd ed.
Lawrence Berkeley National Laboratory, U.S. Department of Energy Publication LBNL-42595.
500 Chapter 17 Management of Organisms and Their Processes in Soils
Ch17-P546807.qxd 11/18/06 7:16 PM Page 500

Arshad, M., and Frankenberger, W. T. (1998). Plant growth-regulating substances in the rhizosphere:microbial production and functions. Adv. Agron. 62, 46–125.
Bailey, V. L., Smith, J. L., and Bolton, H., Jr. (2002). Fungal-to-bacterial ratios in soils investigated forenhanced C sequestration. Soil Biol. Biochem. 34, 997–1007.
Bauer, A., and Black A. L. (1981). Soil carbon, nitrogen and bulk density comparisons in two croplandtillage systems after 2 years and in virgin grassland. Soil Sci. Soc. Am. J. 45, 1166–1170.
Bowden, G. D., and Rovira, A. D. (1999). The rhizosphere and its management to improve plantgrowth. Adv. Agron. 66, 2–76.
Bumpus, J. A., and Aust, S. D. (1987). Biodegradation of DDT [1,1,1-trichloro-2,2-bis(4-chlorophenyl)ethane] by the white rot fungus Phanerochaete chrysosporium. Appl. Environ.Microbiol. 53, 2001–2008.
Calderon, F. J., Jackson, L. E., Scow, K. M., and Rolston, D. E. (2000). Microbial responses to simu-lated tillage in cultivated and uncultivated soils. Soil Biol. Biochem. 32, 1547–1559.
Campbell, C. A., Nicholaichuk, W., and Warder, F. G. (1975). Effects of a wheat-summer-fallow rota-tion on subsoil nitrate. Can. J. Soil. Sci. 55, 279–286.
Campbell, C. A., Paul, E. A., and McGill, W. B. (1976). Effect of cultivation and cropping on theamounts and forms of soil N. In “Western Canadian Nitrogen Symposium Proceedings” pp. 7–101.Calgary, Alberta.
Clark, M. S., Horwath, W. R., Shennan, C., and Scow, K. M. (1998). Changes in soil chemical proper-ties resulting from organic and low-input farming practices. Soil Sci. Soc. Am. J. 90, 662–671.
Cooperband, L. (2002). “The Art and Science of Composting.” Univ. of Wisconsin Press, Madison.Curci, M., Pizzigallo, M. D. R., Crecchio, C., and Mininni, R. (1997). Effects of conventional tillage
on biochemical properties of soils. Biol. Fertil. Soils 25, 1–6.Dalal, R. C., and Mayer, R. J. (1986). Long-term trends in fertility of soils under continuous cultiva-
tion and cereal cropping in southern Queensland. II. Total organic carbon and its rate of loss fromthe soil profile. Aust. J. Soil Res. 24, 281–292.
Dalal, R. C., Henderson, P. A., and Glasby, J. M. (1991). Organic matter and microbial biomass after20 years of zero-tillage. Soil Biol. Biochem. 5, 435–441.
Diaz, L. F., Savage, G. M., Eggerth, L. L., and Golueke, C. G. (1993). “Composting and recyclingmunicipal solid waste.” Lewis Publishers, Boca Raton, Florida.
Doran, J. W. (1980). Soil microbial and biochemical changes associated with reduced tillage. Soil Sci.Soc. Am. J. 44, 765–771.
Doran, J. W., and Parkin, T. B. (1996). Quantitative indicators of soil quality: a minimum data set. In“Methods for Assessing Soil Quality” (J. W. Doran and A. J. Jones, eds.), Special Publication 49,pp. 25–38. Soil Sci. Soc. Am., Madison, WI.
Doughty, J. L., Cook, F. D., and Warder, F. G. (1954). Effect of cultivation on the organic matter andnitrogen of brown soils. Can. J. Agric. Sci. 34, 406–410.
Forester, E. (1998). “Louis Pasteur.” Johns Hopkins Univ. Press, Baltimore.Gamliel, A., Grinsten, A., Zilberg, V., Beniches, M., Ucko, O., and Katan, J. (2000). Control of soil-
borne diseases by combining soil solarization and fumigants. Acta Hortic. 71, 157–164.Hillel, D. J. (1992). “Out of the Earth: Civilization and the Life of The Soil.” Univ. of California Press,
Berkeley.Katan, J., and DeVay, J. E. (1991). “Soil Solarization.” CRC Press, Boston.Koepf, H. H., Pettersson, B. D., and Schaumann, W. (1976). “Bio-dynamic agriculture: an introduc-
tion.” Anthroposophic Press, Spring Valley, New York.Lampkin, N., and Measures, M. (2001). “Organic Farming Management Handbook.” Univ. of Wales
Press, Aberystwyth.McGill, W. B., Cannon, K. R., Robertson, J. A., and Cook, F. D. (1986). Dynamics of soil microbial
biomass and water soluble organic C in Breton L after 50 years of cropping to two rotations. Can. J. Soil Sci. 66, 1–19.
Oelhaf, R. C. (1978). “Organic Agriculture.” Wiley, New York.Phelps, C. D., and Young, L. Y. (2000). Biodegradation of BTEX under anaerobic conditions: a review.
Adv. Agron. 70, 330–359.
References and Suggested Reading 501
Ch17-P546807.qxd 11/18/06 7:16 PM Page 501
Postma, J., and van Veen, J. A. (1990). Habitable pore space and survival of Rhizobium leguminosarumbiovar trifolii introduced into soil. Microb. Ecol. 19, 149–161.
Purser, J. E. (1977). “The Winemakers of the Pacific Northwest.” Harbor House, Vashon Island, WA.Ramsay, C., Haglund, B., and Santo, G. (1992). “Bulletin 21: Soil Fumigation.” Washington State
Univ. Press, Pullman.Rees, R. M., Ball, B. C., Campbell, C. D., and Watson, C. A. (2001). “Sustainable Management of Soil
Organic Matter.” CAB International, Wallingford, UK.Reganold, J. P., Palmer, A. S., Lockhart, J. C., and Macgregor, A. N. (1993). Soil quality and financial
performance of biodynamic and conventional farms in New Zealand. Science 269, 344–349.Robertson, G. P., Paul, E. A., and Harwood, R. R. (2000). Greenhouse gases in intensive agriculture: con-
tributions of individual gases to the radiative forcing of the atmosphere. Science 289, 1922–1925.Rynk, R. (1992). “On-Farm Composting Handbook.” NRAES Cooperative Extension, Ithaca, NY.Sattler, F., and Wistinghauser, E. (1992). “Bio-Dynamic Farming Practice.” Bio-dynamic Agric.
Assoc., West Midlands, UK.Smith, J. H. (1995). “Cheesemaking in Scotland—a History.” Scottish Dairy Assoc., Glasgow.Smith, J. L. (1994). Cycling of nitrogen through microbial activity. In “Soil Biology: Effects on Soil
Quality” (J. L. Hatfield and B. A. Stewart, eds.), pp. 91–120. CRC Press, Boca Raton, FL.Smith, J. L., and Elliot, L. F. (1990). Tillage and residue management effects on soil organic matter
dynamics in semi-arid regions. In “Dryland Agriculture: Strategies for Sustainability”(B. A. Stewart, ed.), Vol. 13, pp. 69–88. Springer-Verlag, New York.
Smith, J. L., and Paul, E. A. (1990). The significance of soil microbial biomass estimations. In “SoilBiochemistry” (G. M. Bollag and G. Stotzkey, eds.), Vol. 6, pp. 357–396. Dekker, New York.
Smith, J. L., Papendick, R. I., Bezdicek, D. F., and Lynch, J. M. (1992). Soil organic matter dynamicsand crop residue management. In “Soil Microbial Ecology” (B. Metting, ed.), pp. 65–94. Dekker,New York.
Staben, M. L., Bezdicek, D. F., Smith, J. L., and Fauci, M. F. (1997). Microbiological assessment ofsoil quality in conservation reserve program and wheat–fallow soil. Soil Sci. Soc. Am. J. 61,124–130.
TeBeest, D. O. (1996). Biological control of weeds with plant pathogens and microbial pesticides. Adv.Agron. 56, 115–135.
Triplett, G. B. Jr., and Mannering, J. V. (1978). Crop residue management in crop rotation and multiplecropping systems. In “Crop Residue Management Systems” (W. R. Oschwald, ed.) Special Publica-tion 31, pp. 198–206. Am. Soc. Agron., Madison, Wisconsin.
U.S. Environmental Protection Agency (1996). “A Citizen’s Guide to Bioremediation.” Solid Waste andEmergency Response, Technology Innovation Office, Technology Fact Sheet EPA 542-F-96-007.
Vidali, M. (2001). Bioremediation: an overview. Pure Appl. Chem. 73, 1163–1172.Voroney, R. P., and Schuman, G. E. (1981). Organic C dynamics in grassland soils. II. Model valida-
tion and simulation of the long-term effects of cultivation and rainfall erosion. Can. J. Soil Sci. 61,211–224.
Walker, J. C. (1950). “Plant Pathology.” McGraw–Hill, New York.Wander, M. M., Traina, S. J., Stinner, B. R., and Peters, S. E. (1994). Organic and conventional man-
agement effects on biologically active soil organic matter pools. Soil Sci. Soc. Am. J. 58, 1130–1139.Wander, M. M., and Traina, S. J. (1996). Organic matter fractions from organic and conventional man-
aged soils. I. Carbon and nitrogen distribution. Soil Sci. Soc. Am. J. 60, 1081–1087.Wardle, D. A. (1995). Impacts of disturbance on detritus food webs in agro-ecosystems of contrasting
tillage and weed management practices. Adv. Ecol. Res. 26, 105–182.Wilson, D. (1976). “In Search of Penicillin.” Random House, New York.Whipps, J. M. (2001). Microbial interactions and biocontrol in the rhizosphere. J. Exp. Bot. 52, 487–511.
502 Chapter 17 Management of Organisms and Their Processes in Soils
Ch17-P546807.qxd 11/18/06 7:16 PM Page 502
18Soil Microbiology,
Ecology, andBiochemistry for the
21st Century
Josh Schimel
Introduction
Soil Community Ecology—Controls over Population andCommunity Dynamics
Microbial Life at the Microbial Scale—the MicrobialLandscape
A Whole Profile Perspective
Scaling to the Ecosystem
Application
Conclusions
References
A book on soil microbiology should include a study of the occurrence of microorgan-isms in the soil, their activities and their role in soil processes. It is this last phase which hasbeen studied least and where the information available is far from satisfactory in explain-ing what is taking place in the soil. —Selman Waksman, 1926 (Waksman, 1932).
INTRODUCTION
The first chapter of this book discussed the history of soil biology, weaving thethreads of microbiology, biochemistry, and ecology as they developed toward the
503
Ch18-P546807.qxd 11/20/06 11:14 AM Page 503
504 Chapter 18 Soil Microbiology, Ecology, and Biochemistry
modern day. Many of our basic ideas about soil biology, such as N cycling processes,the concept of “active” vs recalcitrant litter fractions, and the concept of the linksbetween microbial communities and processes were developed, though in a somewhat nascent form, by around 1930 (Waksman 1927, 1932). Over the decadessince, those ideas have developed into much more sophisticated forms (Chaps.2–17). We have developed a more “systems” view of the soil; for example, theidea of element cycles was not clearly developed in Waksman (1932), though allthe components of the N cycle were in place. The concept of soil as an integralpart of the ecosystem was also not well developed. The term “ecosystem” in theEnglish language was coined in 1935 by Tansley (1935). The European literaturehad earlier developed a more ecosystem-oriented view of soil processes as shownby the further interpretations of Jenny (1941). One element of the growing ecosys-tem focus has been the shifting of focus away from agriculture to other kinds ofhuman-impacted systems as well as to natural ecosystems (Chap. 1). We are devel-oping a much stronger understanding of the role of soil food webs and consumerdynamics in soil function (Chap. 7). Additionally, and importantly, we have developed a more biochemical understanding of process dynamics as shown inChap. 8. Processes whose basic controls were recognized qualitatively in Waksman(1932) can now be described quantitatively, allowing us to develop simulationmodels of soil processes over large scales of space and time (Chap. 16).
While the last 70 years of the 20th century have thus been a period of immensegrowth and accomplishment in soil microbiology, biochemistry, and ecology, onecan argue that much of the work during this period has largely been developingthe full promise of the ideas and directions that were developed during the earlypart of the 20th century. We know vastly more about soil systems, of the diversityof soil organisms, and of the linkages between soil systems and ecosystems.However, “the information available (linking populations and processes) is farfrom satisfactory in explaining what is taking place in the soil” remains a truestatement. Thus, this raises the question “What do we need to do to ensure thatstatement is no longer true when the next-generation textbook in this field is writ-ten in some years?”
Science advances through a feedback cycle in which theory develops in stepwith the tools to test and further develop those theories. Tools may limit the ques-tions we can answer, but theory controls the questions we ask. Through much ofthe 20th century, technological developments were evolutionary, rather than revo-lutionary, and the theoretical advances paralleled them. The most obvious techni-cal constraint that limited development was the inability to study microbialprocesses at the site of the activity and the inability to study the organisms with-out culturing them. The inability to study organisms and their processes at the spa-tial scale at which they actually live and interact still limits our research today.Measurements and thinking were based on aggregating at a scale a million timeslarger than a single organism. Measuring respiration from a soil core can be analo-gized to measuring the integrated CO2 flux from North America. That is actuallya useful thing to do (Dilling et al., 2003), but lumping Death Valley and North
Ch18-P546807.qxd 11/20/06 11:14 AM Page 504

Dakota, and both heterotrophs and autotrophs as well as Archaea and nematodes,makes it impossible to evaluate who the important players are or how they func-tion. Increasingly, in soil science, we are growing beyond treating “microsites” asa euphemism for “we can’t explain it based on overall properties” and developingtheory that treats the soil as a complex landscape (e.g., Schimel and Bennett,2004; Allison, 2005).
Several technologies are allowing us to begin resolving the scale issues. Isotopetracers allow us to analyze chemical pathways and to evaluate gross rates of individ-ual processes, rather than just net production of final products (Chap. 3). Micro-scale sensors will allow us to measure the environment and processes occurring atthe microsite scale (Noll et al., 2005). Microscopy and visualization tools (visual,confocal, electron, atomic force, etc.) are allowing us to examine soil organismsin their native habitat at the scale at which they actually live (Chap. 4). Finally, akey tool in bridging scales is simulation modeling (Chap. 16). The developmentof computing has been as necessary as the analytical tools themselves in allowingus to integrate knowledge from different approaches. The important question as towhy models based on abiotic controls and soil organic matter pools and fluxesappear to work so well without more than an implicit interpretation of microbialpopulation still has to be answered. It could be that we are not yet asking the mostimportant questions and demanding exact enough answers.
Each of the new technologies, by itself, has produced exciting new science, asdescribed in previous chapters. However, it is the ability to use new tools in syn-chrony that will power the soil biology of the 21st century. The theme for soilmicrobiology, ecology, and biochemistry over the next decades is likely to be“integration.” Integrating knowledge of community composition and function,integrating information from multiple disciplines to better understand soil sys-tems, and integrating across scales to better understand how processes that occurat micrometers play out at meters and kilometers.
Several areas are particularly ripe for effective integration to produce new, usefulknowledge about the diversity and functioning of soil communities. The first of theseis in linking biotic populations and the processes they carry out. This has been animportant research area in macroecology (Hobbie, 1992) and with the advent ofmolecular methods for analyzing the microbial community in situ, we are finallyable to address the challenge posed by Selman Waksman in 1926. When the tech-niques were becoming available for analyzing microbial community composition,the first papers published discussing the linkage between community compositionand function tended to be theoretical, hypothesizing about when such linkages wouldbe observable and using the limited case studies available to develop theory (e.g.,Schimel, 1995; Groffman and Bohlen, 1999). Increasingly, however, research isusing an integration of physiological (Chap. 3) and molecular tools (Chap. 4) toeffectively link community composition and function (e.g., Zak et al., 2003; Galloet al., 2004; Balser and Firestone, 2005; Smithwick et al., 2005). By linking isotopicand molecular analyses we can evaluate which organisms are using which substratesand how fast. This can be done through both 13C PLFA analyses (McMahon et al.,
Introduction 505
Ch18-P546807.qxd 11/20/06 11:14 AM Page 505
2005) and stable isotope probing (Friedrich, 2006). Genomic and proteomicapproaches are allowing us to evaluate which organisms have which genes and whichare expressed in situ (Riesenfeld et al., 2004; Schulze, 2004). Tying these to the basicunderstanding of physiology and biochemistry of soil organisms as discussed inChap. 9 will allow us to truly determine the controls on important soil processes.This in turn will lead to the possibility of better managing human-affected sys-tems in fields such as global change and soil and ecosystem sustainability.
Studies linking community composition and function raise several issues thatprovide direction for future research. One obvious question, as discussed in Chap. 8,is why are soil communities different? Although there is extensive work on charac-terizing soil communities, we have only limited and qualitative understanding of thefactors that regulate community composition. The second issue is the challenge ofscaling population–process linkages up to the ecosystem and even landscape level.A third issue is that microbial ecology has gone a somewhat separate path from thatof macroecology. Both fields could benefit from more dialogue between them.
SOIL COMMUNITY ECOLOGY—CONTROLSOVER POPULATION AND COMMUNITY DYNAMICS
At the broadest range of scales, soil communities vary among ecosystems insomewhat predictable ways. For example, coniferous forest soils tend to be dom-inated by fungi because only fungi have the enzyme systems to effectively breakdown wood (Chap. 12). Disturbed systems and some grasslands tend to be domi-nated by bacteria (Chap. 5). At much finer phylogenetic scales, species shiftswithin a plant functional group do not appear to cause substantial variation in theoverall composition of the soil community (Porazinska et al., 2003), although indi-vidual plant species can select for specific soil organisms (Bergsma-Vlami et al.,2005). Other examples include plant–microbial interactions such as the mycor-rhizas that may or may not be beneficial to the host plants depending on the spe-cific soil-nutrient characteristics (Chap. 10). At more intermediate scales, thetransition in growth form from shortgrass to tallgrass prairie does seem to causeshifts in microbial community composition (McCulley and Burke, 2004).
Environmental factors, such as drought, wetting–drying, and seasonal change,can cause substantial changes in the microbial community (Schimel et al., 2006;Chap. 8). For example, in the Colorado alpine, there is a major shift between dis-tinct summer and winter communities (Schadt et al., 2003). The summer communityis dominated by bacteria, while the winter community is more heavily fungal, withseveral previously unknown lineages of fungi dominating. The winter communityis better at using phenolic compounds (Lipson et al., 2002), and as it dies away inthe spring the nutrient flush released provides the plant community with most oftheir nutrients to support summertime growth. This seasonal swing in the microbial
506 Chapter 18 Soil Microbiology, Ecology, and Biochemistry
Ch18-P546807.qxd 11/20/06 11:14 AM Page 506
community thus dominates the annual nutrient cycle of the entire ecosystem(Jaeger et al., 1999). However, the question remains unanswered—what specificfactors cause the switch between communities? This example merely highlightsthe questions that remain to be answered and identify microbial community andpopulation biology as fruitful areas of research. An interesting question in thisarena is, how well will results and theories about community dynamics that havebeen developed in plant ecology apply in microbial ecology?
MICROBIAL LIFE AT THE MICROBIAL SCALE—THE MICROBIAL LANDSCAPE
As we learn more about the factors that regulate microbial populations andactivities, the more we realize that the soil is not a homogeneous medium. Rather,the opposite; it is the most physically complex environment for life on the planet.Soil is formed into complex aggregate and pore structures. Consumers, rangingfrom amoebae to arthropods, patrol the larger pores as they forage (Chap. 7). Soilbiota likely cover less than 1% of the surface area of the soil particles, they maybe trapped in soil micropores and they commonly live embedded in polysaccha-ride biofilms (Chap. 11).
This leads to the issue that while we often discuss “the” soil community, thatlanguage may be misleading. The soil community is likely not a single aggregateentity with thousands of species, but rather a spatially structured collection ofmany subcommunities, each of which may be quite distinct (Zhou et al.,2002). The diversity we observe at the soil sample level may actually be gammadiversity—landscape-scale diversity among communities from the perspective ofsoil microorganisms—rather than alpha diversity—species diversity within a singlearea (Odum and Barrett, 2005). Increasingly, visualization and microscale analy-sis techniques are allowing us to observe and analyze soils at the spatial scales atwhich soil organisms actually live and will provide a better understanding of thesedynamics.
The importance of viewing the soil as a heterogeneous biotic landscape is thateach of the different sites that occur in soil, with different organisms and differentphysical/chemical conditions, may behave differently. The functioning of theoverall soil system is not a simple average of different microsites (Schimel andBennett, 2004). One well-known example of this is the rhizosphere, which is dif-ferent from bulk soil (Chaps. 10 and 11). The flow of C, consumption of O2, andrelease of specific C compounds produce an environment in which soil communi-ties are distinct in terms of their composition, metabolic rates, and nutrientturnover characteristics (Chap. 10). This has been known for many years, yet fewstudies have analyzed or modeled the spatial extent and structure of rhizospheresand how much of total soil processes they account for. Adequately understandingthe total system-level impact of roots and rhizospheres on the soil biota requires
Microbial Life at the Microbial Scale—the Microbial Landscape 507
Ch18-P546807.qxd 11/20/06 11:14 AM Page 507

integrating modeling of root architecture with models of root effects on organismsand soil food webs. This remains a challenge but is becoming more practicable.
Another well-known example of macroscale effects resulting from microscalestructure is denitrification. This is an important process in soil and global Ncycling and is an important influence on atmospheric chemistry through the pro-duction of N2O (Chap. 13). Denitrification occurs in anaerobic microsites in thesoil and it is thought that these microsites can occur either in the interior of aggre-gates, where limited O2 diffusion allows anaerobiosis (Sexstone et al., 1985), orin organic matter-rich spots, where rapid O2 consumption produces anaerobiosis(Parkin, 1987). As with the rhizosphere, developing a full picture of denitrificationrequires understanding the production and distribution of anaerobic microsites (anissue of soil structure and physics) with the distribution of denitrifying organismsin a three-dimensional modeling structure to evaluate the movement of O2, NO3
�,and bioavailable C within the soil. Such a concept is not new (Smith, 1980), butlittle recent work has been done in this area.
While denitrification has long been known to be largely a result of micrositedynamics, other N cycle processes appear to be sensitive to such phenomena as well.Nitrate is commonly taken up by soil microorganisms, even when substantial con-centrations of NH4
� are measurable in the soil (e.g., Jackson et al., 1989). This occurs despite physiological studies showing that in the presence of NH4
�, micro-organisms shut down NO3
� assimilation (Rice and Tiedje, 1989). How then, do youexplain whole-soil NO3
� assimilation without postulating that there are sites whereNH4
� is absent and microbes are N-limited and therefore can use NO3�? Another
example is that plants take up N in situ, even in situations in which net mineralizationassays (Chap. 13) measure net immobilization (Giblin et al., 1991). Clearly, N isavailable and plant roots are able to intercept some portion of it when they are pres-ent. Schimel and Bennett (2004) proposed a microsite-based model of soil N cyclingthat integrates root interception of N moving between N-rich and N-poor micrositesto explain changing patterns of plant N uptake across nutrient availability gradients.
Integrating a stronger spatial component into our understanding of soilprocesses is likely to require more effective incorporation of the role of consumersand pathogens in regulating microbial population dynamics. Different groups offauna prefer different species of microorganisms (Ronn et al., 2002), thus poten-tially regulating the dynamics of specific microbial populations and the processesthey carry out. Selective feeding interacts with soil spatial structure because,although bacteria and fungi are largely immobile, consumers must be able to for-age. Because microorganisms acquire resources via diffusion (enzymes awayfrom and substrates back to the cell), they are able to exist in micropores and toremain active under dry conditions when water films are thin and microsites arehydrologically disconnected. Consumers and pathogens (e.g., bacteriophage),however, must be able to move to find new prey or hosts. For protozoa, viruses,and nematodes, this requires water-filled pores of appropriate size. Larger con-sumers, such as mites, require air-filled pores. The variation in pore structure andwhich organisms are able to function in each class of pores led to the development
508 Chapter 18 Soil Microbiology, Ecology, and Biochemistry
Ch18-P546807.qxd 11/20/06 11:14 AM Page 508
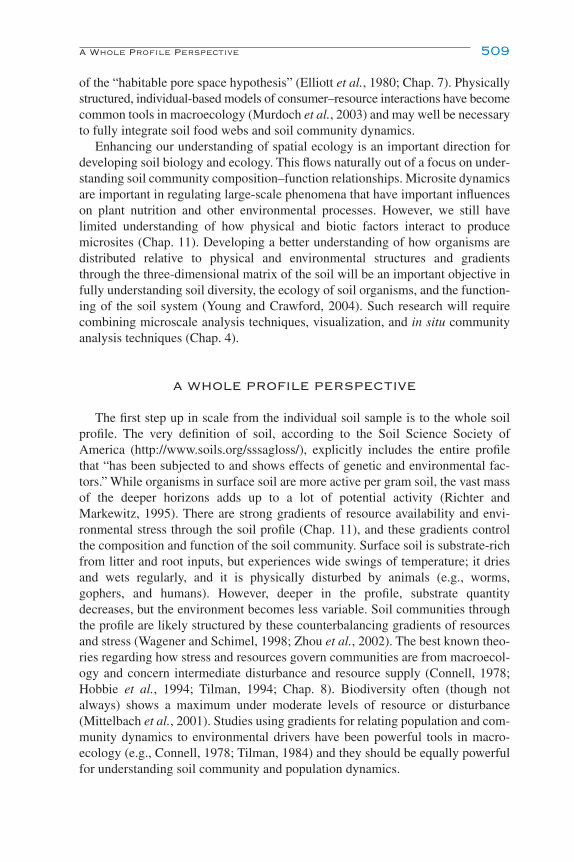
of the “habitable pore space hypothesis” (Elliott et al., 1980; Chap. 7). Physicallystructured, individual-based models of consumer–resource interactions have becomecommon tools in macroecology (Murdoch et al., 2003) and may well be necessaryto fully integrate soil food webs and soil community dynamics.
Enhancing our understanding of spatial ecology is an important direction fordeveloping soil biology and ecology. This flows naturally out of a focus on under-standing soil community composition–function relationships. Microsite dynamicsare important in regulating large-scale phenomena that have important influenceson plant nutrition and other environmental processes. However, we still have limited understanding of how physical and biotic factors interact to producemicrosites (Chap. 11). Developing a better understanding of how organisms aredistributed relative to physical and environmental structures and gradientsthrough the three-dimensional matrix of the soil will be an important objective infully understanding soil diversity, the ecology of soil organisms, and the function-ing of the soil system (Young and Crawford, 2004). Such research will requirecombining microscale analysis techniques, visualization, and in situ communityanalysis techniques (Chap. 4).
A WHOLE PROFILE PERSPECTIVE
The first step up in scale from the individual soil sample is to the whole soilprofile. The very definition of soil, according to the Soil Science Society ofAmerica (http://www.soils.org/sssagloss/), explicitly includes the entire profilethat “has been subjected to and shows effects of genetic and environmental fac-tors.” While organisms in surface soil are more active per gram soil, the vast massof the deeper horizons adds up to a lot of potential activity (Richter andMarkewitz, 1995). There are strong gradients of resource availability and envi-ronmental stress through the soil profile (Chap. 11), and these gradients controlthe composition and function of the soil community. Surface soil is substrate-richfrom litter and root inputs, but experiences wide swings of temperature; it driesand wets regularly, and it is physically disturbed by animals (e.g., worms,gophers, and humans). However, deeper in the profile, substrate quantitydecreases, but the environment becomes less variable. Soil communities throughthe profile are likely structured by these counterbalancing gradients of resourcesand stress (Wagener and Schimel, 1998; Zhou et al., 2002). The best known theo-ries regarding how stress and resources govern communities are from macroecol-ogy and concern intermediate disturbance and resource supply (Connell, 1978;Hobbie et al., 1994; Tilman, 1994; Chap. 8). Biodiversity often (though notalways) shows a maximum under moderate levels of resource or disturbance(Mittelbach et al., 2001). Studies using gradients for relating population and com-munity dynamics to environmental drivers have been powerful tools in macro-ecology (e.g., Connell, 1978; Tilman, 1984) and they should be equally powerfulfor understanding soil community and population dynamics.
A Whole Profile Perspective 509
Ch18-P546807.qxd 11/20/06 11:14 AM Page 509
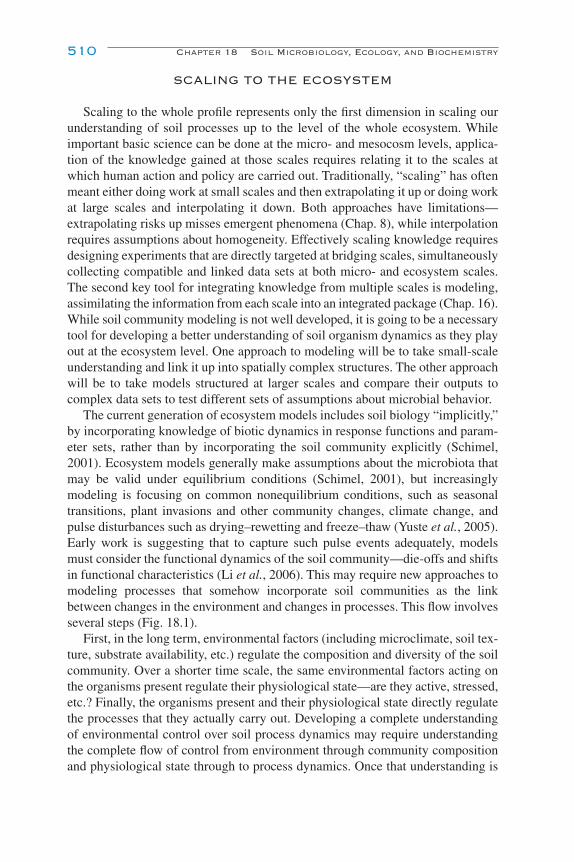
SCALING TO THE ECOSYSTEM
Scaling to the whole profile represents only the first dimension in scaling ourunderstanding of soil processes up to the level of the whole ecosystem. Whileimportant basic science can be done at the micro- and mesocosm levels, applica-tion of the knowledge gained at those scales requires relating it to the scales atwhich human action and policy are carried out. Traditionally, “scaling” has oftenmeant either doing work at small scales and then extrapolating it up or doing workat large scales and interpolating it down. Both approaches have limitations—extrapolating risks up misses emergent phenomena (Chap. 8), while interpolationrequires assumptions about homogeneity. Effectively scaling knowledge requiresdesigning experiments that are directly targeted at bridging scales, simultaneouslycollecting compatible and linked data sets at both micro- and ecosystem scales.The second key tool for integrating knowledge from multiple scales is modeling,assimilating the information from each scale into an integrated package (Chap. 16).While soil community modeling is not well developed, it is going to be a necessarytool for developing a better understanding of soil organism dynamics as they playout at the ecosystem level. One approach to modeling will be to take small-scaleunderstanding and link it up into spatially complex structures. The other approachwill be to take models structured at larger scales and compare their outputs tocomplex data sets to test different sets of assumptions about microbial behavior.
The current generation of ecosystem models includes soil biology “implicitly,”by incorporating knowledge of biotic dynamics in response functions and param-eter sets, rather than by incorporating the soil community explicitly (Schimel,2001). Ecosystem models generally make assumptions about the microbiota thatmay be valid under equilibrium conditions (Schimel, 2001), but increasinglymodeling is focusing on common nonequilibrium conditions, such as seasonaltransitions, plant invasions and other community changes, climate change, andpulse disturbances such as drying–rewetting and freeze–thaw (Yuste et al., 2005).Early work is suggesting that to capture such pulse events adequately, modelsmust consider the functional dynamics of the soil community—die-offs and shiftsin functional characteristics (Li et al., 2006). This may require new approaches tomodeling processes that somehow incorporate soil communities as the linkbetween changes in the environment and changes in processes. This flow involvesseveral steps (Fig. 18.1).
First, in the long term, environmental factors (including microclimate, soil tex-ture, substrate availability, etc.) regulate the composition and diversity of the soilcommunity. Over a shorter time scale, the same environmental factors acting onthe organisms present regulate their physiological state—are they active, stressed,etc.? Finally, the organisms present and their physiological state directly regulatethe processes that they actually carry out. Developing a complete understandingof environmental control over soil process dynamics may require understandingthe complete flow of control from environment through community compositionand physiological state through to process dynamics. Once that understanding is
510 Chapter 18 Soil Microbiology, Ecology, and Biochemistry
Ch18-P546807.qxd 11/20/06 11:14 AM Page 510

developed it should become possible to simplify and condense the information todevelop models that go directly from environmental factors to response functionsand process rates, but in a more mechanistic way that captures the essential organ-ismal dynamics and is more robust to a changing environment than current models.Developing this level of understanding will require highly integrated, interscalestudy of the physical, chemical, and biological processes that occur in soil.
APPLICATION
Ultimately better understanding of population–process linkages, the spatialecology of soil organisms, and how to scale this knowledge to the ecosystemshould provide increased power for applying this knowledge. How do we manip-ulate soil systems to achieve desired goals—increased nutrient cycling efficiency,reduced greenhouse gas emissions, pollutant biodegradation, C sequestration, andinvasive plant species control (Chap. 17). The 21st century has been described asthe “Biotech Century” (Rifkin, 1998) We are already learning that in environmen-tal applications, ignoring the ecology of the soil biota is a likely path to failure.For example, in the early days of genetically engineered microorganisms, therewas a lot of concern about environmental release (Tiedje et al., 1993). Most stud-ies, however, found the biggest problem was getting the organisms to survive longenough to do what you want them to! In some cases, adding organisms is effec-tively just adding the nutrients contained within them that are released when theydie. Thus, it has become clear that effective environmental applications ofbiotechnology, whether using introduced or existing organisms, require a solidunderstanding of the organisms’ ecology (Chaps. 8 and 17).
One target for applied soil biology is pollutant management. Microorganismshave diverse physiological capabilities that allow them to degrade a wide range oforganic chemicals (Chap. 17). Thus, by either applying microbes to a contaminated
Application 511
Environment:PhysicalChemicalClimatological
Communities:CompositionDiversity
Physiological state:StressResource limitation
MicrobialProcesses
FIGURE 18.1 Linkages between environmental factors, microbial community composition,physiological state, and process dynamics.
Ch18-P546807.qxd 11/20/06 11:14 AM Page 511
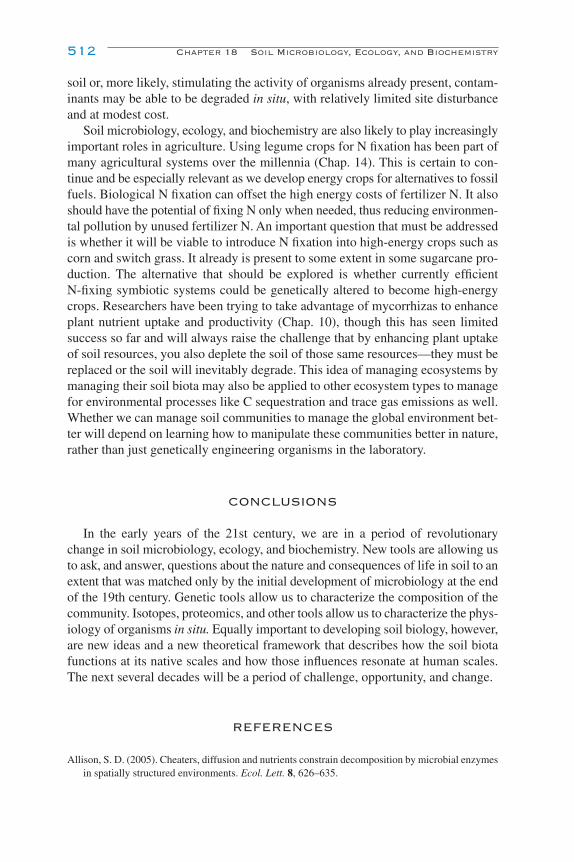
soil or, more likely, stimulating the activity of organisms already present, contam-inants may be able to be degraded in situ, with relatively limited site disturbanceand at modest cost.
Soil microbiology, ecology, and biochemistry are also likely to play increasinglyimportant roles in agriculture. Using legume crops for N fixation has been part ofmany agricultural systems over the millennia (Chap. 14). This is certain to con-tinue and be especially relevant as we develop energy crops for alternatives to fossilfuels. Biological N fixation can offset the high energy costs of fertilizer N. It alsoshould have the potential of fixing N only when needed, thus reducing environmen-tal pollution by unused fertilizer N. An important question that must be addressedis whether it will be viable to introduce N fixation into high-energy crops such ascorn and switch grass. It already is present to some extent in some sugarcane pro-duction. The alternative that should be explored is whether currently efficient N-fixing symbiotic systems could be genetically altered to become high-energycrops. Researchers have been trying to take advantage of mycorrhizas to enhanceplant nutrient uptake and productivity (Chap. 10), though this has seen limitedsuccess so far and will always raise the challenge that by enhancing plant uptakeof soil resources, you also deplete the soil of those same resources—they must bereplaced or the soil will inevitably degrade. This idea of managing ecosystems bymanaging their soil biota may also be applied to other ecosystem types to managefor environmental processes like C sequestration and trace gas emissions as well.Whether we can manage soil communities to manage the global environment bet-ter will depend on learning how to manipulate these communities better in nature,rather than just genetically engineering organisms in the laboratory.
CONCLUSIONS
In the early years of the 21st century, we are in a period of revolutionarychange in soil microbiology, ecology, and biochemistry. New tools are allowing usto ask, and answer, questions about the nature and consequences of life in soil to anextent that was matched only by the initial development of microbiology at the endof the 19th century. Genetic tools allow us to characterize the composition of thecommunity. Isotopes, proteomics, and other tools allow us to characterize the phys-iology of organisms in situ. Equally important to developing soil biology, however,are new ideas and a new theoretical framework that describes how the soil biotafunctions at its native scales and how those influences resonate at human scales.The next several decades will be a period of challenge, opportunity, and change.
REFERENCES
Allison, S. D. (2005). Cheaters, diffusion and nutrients constrain decomposition by microbial enzymesin spatially structured environments. Ecol. Lett. 8, 626–635.
512 Chapter 18 Soil Microbiology, Ecology, and Biochemistry
Ch18-P546807.qxd 11/20/06 11:14 AM Page 512

Balser, T. C., and Firestone, M. K. (2005). Linking microbial community composition and soilprocesses in a California annual grassland and mixed-conifer forest. Biogeochemistry 73,395–415.
Bergsma-Vlami, M., Prins, M. E., and Raaijmakers, J. M. (2005). Influence of plant species on popu-lation dynamics, genotypic diversity and antibiotic production in the rhizosphere by indigenousPseudomonas spp. FEMS Microbiol. Ecol. 52, 59–69.
Connell, J. (1978). Diversity in tropical rain forests and coral reefs. Science 199, 1302–1310.Dilling, L., Doney, S. C., Edmonds, J., Gurney, K. R., Harriss, R., Schimel, D., Stephens, B., and
Stokes, G. (2003). The role of carbon cycle observations and knowledge in carbon management.Annu. Rev. Environ. Resour. 28, 521–558.
Elliott, E. T., Anderson, R. V., Coleman, D. C., and Cole, C. V. (1980). Habitable pore space and micro-bial trophic interactions. Oikos 35, 327–335.
Friedrich, M. W. (2006). Stable-isotope probing of DNA: insights into the function of uncultivatedmicroorganisms from isotopically labeled metagenomes. Curr. Opin. Biotechnol. 17, 59–66.
Gallo, M., Amonette, R., Lauber, C., Sinsabaugh, R. L., and Zak, D. R. (2004). Microbial communitystructure and oxidative enzyme activity in nitrogen-amended north temperate forest soils. MicrobialEcol. 48, 218–229.
Giblin, A. E., Nadelhoffer, K. J., Shaver, G. R., Laundre, J. A., and McKerrow, A. J. (1991).Biogeochemical diversity along a riverside toposequence in arctic Alaska. Ecol. Monogr. 61,415–435.
Groffman, P. M., and Bohlen, P. J. (1999). Soil and sediment biodiversity—Cross-system comparisonsand large-scale effects. BioScience 49, 139–148.
Hobbie, S. E. (1992). Effects of plant species on nutrient cycling. TREE 7, 336–339.Hobbie, S. E., Jensen, D. B., and Chapin, F. S. I. (1994). Resource supply and disturbance as controls
over present and future plant diversity. In “Biodiversity and Ecosystem Function” (E.-D. Schulzeand H. A. Mooney, eds.), pp. 385–408. Springer-Verlag, Berlin.
Jackson, L. E., Schimel, J. P., and Firestone, M. K. (1989). Short-term partitioning of ammonium andnitrate between plants and microbes in an annual grassland. Soil Biol. Biochem 21, 409–415.
Jaeger, C. H., Monson, R. K., Fisk, M. C., and Schmidt, S. K. (1999). Seasonal partitioning of nitro-gen by plants and soil microorganisms in an alpine ecosystem. Ecology 80, 1883–1891.
Jenny, H. (1941). “Factors of Soil Formation: a System of Quantitative Pedology.” McGraw–Hill, New York.
Li, X., Meixner, T., Sickman, J. O., Miller, A. E., Schimel, J. P., and Melack, J. M. (2006). Decadal-scale dynamics of water, carbon and nitrogen in a California chaparral ecosystem: DAYCENTmodeling results. Biogeochemistry 77, 217–245.
Lipson, D. A., Schadt, C. W., and Schmidt, S. K. (2002). Changes in soil microbial community struc-ture and function in an alpine dry meadow following spring snow melt. Microb. Ecol. 43, 307–314.
McCulley, R. L., and Burke, I. C. (2004). Microbial community composition across the Great Plains:landscape versus regional variability. Soil Sci. Soc. Am. J. 68, 106–115.
McMahon, S. K., Williams, M. A., Bottomley, P. J., and Myrold, D. D. (2005). Dynamics of microbialcommunities during decomposition of carbon-13 labeled ryegrass fractions in soil. Soil Sci. Soc.Am. J. 69, 1238–1247.
Mittelbach, G. G., Steiner, C. F., Scheiner, S. M., Gross, K. L., Reynolds, H. L., Waide, R. B., Willig, M. R., Dodson, S. I., and Gough, L. (2001). What is the observed relationship betweenspecies richness and productivity? Ecology 82, 2381–2396.
Murdoch, W. W., Briggs, C. J., and Nisbet, R. M. (2003). “Consumer-Resource Dynamics.” PrincetonUniv. Press, Princeton, NJ.
Noll, M., Matthies, D., Frenzel, P., Derakshani, M., and Liesack, W. (2005). Succession of bacterialcommunity structure and diversity in a paddy soil oxygen gradient. Environ. Microbiol. 7, 382–395.
Odum, E. P., and Barrett, G. W. (2005). “Fundamentals of Ecology.” 5th ed. Thompson Brooks/Cole,Belmont, CA.
Parkin, T. B. (1987). Soil microsites as a source of denitrification variability. Soil Sci. Soc. Am. J. 51,1194–1199.
References 513
Ch18-P546807.qxd 11/20/06 11:14 AM Page 513
Porazinska, D. L., Bardgett, R. D., Blaauw, M. B., Hunt, H. W., Parsons, A. N., Seastedt, T. R., andWall, D. H. (2003). Relationships at the aboveground–belowground interface: plants, soil biota,and soil processes. Ecol. Monogr. 73, 377–395.
Rice, C. W., and Tiedje, J. M. (1989). Regulation of nitrate assimilation by ammonium in soils and inisolated soil microorganisms. Soil Biol. Biochem. 21, 597–602.
Richter, D. D., and Markewitz, D. (1995). How deep is soil? BioScience 45, 600–609.Riesenfeld, C. S., Schloss, P. D., and Handelsman, J. (2004). METAGENOMICS: genomic analysis of
microbial communities. Annu. Rev. Genet. 38, 525–552.Rifkin, J. (1998). “The Biotech Century.” Jeremy P. Tarcher/Putnam, New York.Ronn, R., McCaig, A. E., Griffiths, B. S., and Prosser, J. I. (2002). Impact of protozoan grazing on bac-
terial community structure in soil microcosms. Appl. Environ. Microb. 68, 6094–6105.Schadt, C. W., Martin, A. P., Lipson, D. A., and Schmidt, S. K. (2003). Seasonal dynamics of previ-
ously unknown fungal lineages in tundra soils. Science 301, 1359–1361.Schimel, J. (1995). Ecosystem consequences of microbial diversity and community structure. In
“Arctic and Alpine Biodiversity: Patterns, Causes, and Ecosystem Consequences” (F. Chapin andC. Korner, eds.), pp. 239–254. Springer-Verlag, Berlin.
Schimel, J. (2001). Biogeochemical models: implicit versus explicit microbiology. In “GlobalBiogeochemical Cycles in the Climate System” (E.-D. Schulze, M. Heimann, S. Harrison, E. Holland, J. Lloyd, I. Prentice, and D. Schimel, eds.), pp. 177–183. Academic Press, San Diego.
Schimel, J., Balser, T. C., and Wallenstein, M. (2006). Stress effects on microbial communities and theimplications for ecosystem function. Ecology (in press).
Schimel, J. P., and Bennett, J. (2004). Nitrogen mineralization: challenges of a changing paradigm.Ecology 85, 591–602.
Schulze, W. (2004). Environmental proteomics—what proteins from soil and surface water can tell us:a perspective. Biogeosci. Discuss. 1, 195–218.
Sexstone, A., Revsbech, N., Parkin, T., and Tiedje, J. (1985). Direct measurement of oxygen profilesand denitrification rates in soil aggregates. Soil Sci. Soc. Am. J. 49, 645–651.
Smith, K. A. (1980). A model of the extent of anaerobic zones in aggregated soils and its potentialapplication to estimates of denitrification. J. Soil Sci. 31, 263–267.
Smithwick, E. A. H., Turner, M. G., Metzger, K. L., and Balser, T. C. (2005). Variation in NH4� min-
eralization and microbial communities with stand age in lodgepole pine (Pinus contorta) forests,Yellowstone National Park (USA). Soil Biol. Biochem. 37, 1546–1559.
Tansley, A. G. (1935). The use and abuse of vegetational concepts and terms. Ecology 16, 284–307.Tiedje, J. M., Colwell, R., Grossman, Y., Hodson, R., Lenski, R., Mack, R., and Regal, P. (1993). The
planned introduction of genetically engineered organisms: ecological considerations and recom-mendations. Ecology 70, 298–315.
Tilman, D. (1994). Community diversity and succession: the roles of competition, dispersal, and habi-tat modification. In “Biodiversity and Ecosystem Function” (E.-D. Schulze and H. A. Mooney,eds.), pp. 327–344. Springer-Verlag, Berlin.
Tilman, G. D. (1984). Plant dominance along an experimental nutrient gradient. Ecology 65, 1445–1453.Wagener, S. M., and Schimel, J. P. (1998). Stratification of soil ecological processes: a study of the
birch forest floor in the Alaskan taiga. Oikos 81, 63–74.Waksman, S. (1927). “Principles of Soil Microbiology.” Williams & Wilkins, Baltimore.Waksman, S. (1932). “Principles of Soil Microbiology.” 2nd ed. Williams & Wilkins, Baltimore.Young, I. M., and Crawford, J. W. (2004). Interactions and self-organization in the soil–microbe com-
plex. Science 304, 1634–1637.Yuste, J. C., Janssens, I. A., and Ceulemans, R. (2005). Calibration and validation of an empirical
approach to model soil CO2 efflux in a deciduous forest. Biogeochemistry 73, 209–230.Zak, D. R., Holmes, W. E., White, D. C., Peacock, A. D., and Tilman, D. (2003). Plant diversity, soil
microbial communities, and ecosystem function: are there any links? Ecology 84, 2042–2050.Zhou, J. Z., Xia, B. C., Treves, D. S., Wu, L. Y., Marsh, T. L., O’Neill, R. V., Palumbo, A. V., and
Tiedje, J. M. (2002). Spatial and resource factors influencing high microbial diversity in soil. Appl.Environ. Microbiol. 68, 326–334.
514 Chapter 18 Soil Microbiology, Ecology, and Biochemistry
Ch18-P546807.qxd 11/20/06 11:14 AM Page 514