Soft Drink Consumption and Risk of Developing Cardiometabolic Risk Factors and the Metabolic...
10
Soft Drink Consumption and Risk of Developing Cardiometabolic Risk Factors and the Metabolic Syndrome in Middle-Aged Adults in the Community Ravi Dhingra, MD; Lisa Sullivan, PhD; Paul F. Jacques, PhD; Thomas J. Wang, MD; Caroline S. Fox, MD; James B. Meigs, MD, MPH; Ralph B. D’Agostino, PhD; J. Michael Gaziano, MD, MPH; Ramachandran S. Vasan, MD Background—Consumption of soft drinks has been linked to obesity in children and adolescents, but it is unclear whether it increases metabolic risk in middle-aged individuals. Methods and Results—We related the incidence of metabolic syndrome and its components to soft drink consumption in participants in the Framingham Heart Study (6039 person-observations, 3470 in women; mean age 52.9 years) who were free of baseline metabolic syndrome. Metabolic syndrome was defined as the presence of 3 of the following: waist circumference 35 inches (women) or 40 inches (men); fasting blood glucose 100 mg/dL; serum triglycerides 150 mg/dL; blood pressure 135/85 mm Hg; and high-density lipoprotein cholesterol 40 mg/dL (men) or 50 mg/dL (women). Multivariable models included adjustments for age, sex, physical activity, smoking, dietary intake of saturated fat, trans fat, fiber, magnesium, total calories, and glycemic index. Cross-sectionally, individuals consuming 1 soft drink per day had a higher prevalence of metabolic syndrome (odds ratio [OR], 1.48; 95% CI, 1.30 to 1.69) than those consuming 1 drink per day. On follow-up (mean of 4 years), new-onset metabolic syndrome developed in 765 (18.7%) of 4095 participants consuming 1 drink per day and in 474 (22.6%) of 2059 persons consuming 1 soft drink per day. Consumption of 1 soft drink per day was associated with increased odds of developing metabolic syndrome (OR, 1.44; 95% CI, 1.20 to 1.74), obesity (OR, 1.31; 95% CI, 1.02 to 1.68), increased waist circumference (OR, 1.30; 95% CI, 1.09 to 1.56), impaired fasting glucose (OR, 1.25; 95% CI, 1.05 to 1.48), higher blood pressure (OR, 1.18; 95% CI, 0.96 to 1.44), hypertriglyceridemia (OR, 1.25; 95% CI, 1.04 to 1.51), and low high-density lipoprotein cholesterol (OR, 1.32; 95% CI 1.06 to 1.64). Conclusions—In middle-aged adults, soft drink consumption is associated with a higher prevalence and incidence of multiple metabolic risk factors. (Circulation. 2007;116:480-488.) Key Words: diabetes mellitus metabolic syndrome epidemiology obesity risk factors carbonated beverages S everal reports from the United States and Europe indicate increasing consumption of soft drinks among children, adolescents, and adults over the past 3 decades. 1,2 Many clinical studies have linked the rising consumption of soft drinks to the present epidemic of obesity and diabetes mellitus among children and adolescents 3–6 and to the development of hypertension in adults. 7 Furthermore, Clinical Perspective p 488 added sweeteners in soft drinks have been linked to an increase in serum triglycerides levels in some reports 8,9 but not in others. 10,11 The association of soft drink consumption with obesity and higher insulin resistance has been attributed to multiple factors, including greater caloric intake, the high Received January 12, 2007; accepted May 15, 2007. From the National Heart, Lung, and Blood Institute’s Framingham Heart Study (R.D., T.J.W., C.S.F., R.S.V.), Framingham, Mass; Massachusetts Veterans Epidemiology Research and Information Center (R.D., J.M.G.), VA Boston Healthcare System, Boston, Mass; Division of Aging (R.D., J.M.G.), Brigham and Women’s Hospital, Harvard Medical School, Boston, Mass; Alice Peck Day Memorial Hospital (R.D.), Lebanon, NH; Department of Biostatistics (L.S., R.B.D.), Boston University School of Public Health, Boston, Mass; Jean Mayer USDA Human Nutrition Research Center on Aging (P.F.J.), Tufts University, Boston, Mass; Division of Cardiology (T.J.W.) and Department of Medicine (J.B.M.), Massachusetts General Hospital, Harvard Medical School, Boston, Mass; National Heart, Lung, and Blood Institute (C.S.F.), Bethesda, Md; Divisions of Preventive Medicine and Cardiovascular Medicine (J.M.G.), Brigham and Women’s Hospital, Boston, Mass; and Cardiology Section and the Department of Preventive Medicine and Epidemiology (R.S.V.), Boston University School of Medicine, Boston, Mass. The online-only Data Supplement, consisting of tables, is available with this article at http://circ.ahajournals.org/cgi/content/full/ CIRCULATIONAHA.107.689935/DC1. Guest Editor for this article was Gregory L. Burke, MD, MSc. Correspondence to Ramachandran S. Vasan, MD, Framingham Heart Study, 73 Mount Wayte Ave, Suite 2, Framingham, MA 01702-5803. E-mail [email protected] © 2007 American Heart Association, Inc. Circulation is available at http://www.circulationaha.org DOI: 10.1161/CIRCULATIONAHA.107.689935 480 Epidemiology by guest on August 3, 2016 http://circ.ahajournals.org/ Downloaded from
-
Upload
independent -
Category
Documents
-
view
5 -
download
0
Transcript of Soft Drink Consumption and Risk of Developing Cardiometabolic Risk Factors and the Metabolic...

Soft Drink Consumption and Risk of DevelopingCardiometabolic Risk Factors and the Metabolic Syndrome
in Middle-Aged Adults in the CommunityRavi Dhingra, MD; Lisa Sullivan, PhD; Paul F. Jacques, PhD; Thomas J. Wang, MD;
Caroline S. Fox, MD; James B. Meigs, MD, MPH; Ralph B. D’Agostino, PhD;J. Michael Gaziano, MD, MPH; Ramachandran S. Vasan, MD
Background—Consumption of soft drinks has been linked to obesity in children and adolescents, but it is unclear whetherit increases metabolic risk in middle-aged individuals.
Methods and Results—We related the incidence of metabolic syndrome and its components to soft drink consumptionin participants in the Framingham Heart Study (6039 person-observations, 3470 in women; mean age 52.9 years)who were free of baseline metabolic syndrome. Metabolic syndrome was defined as the presence of �3 of thefollowing: waist circumference �35 inches (women) or �40 inches (men); fasting blood glucose �100 mg/dL;serum triglycerides �150 mg/dL; blood pressure �135/85 mm Hg; and high-density lipoprotein cholesterol �40mg/dL (men) or �50 mg/dL (women). Multivariable models included adjustments for age, sex, physical activity,smoking, dietary intake of saturated fat, trans fat, fiber, magnesium, total calories, and glycemic index.Cross-sectionally, individuals consuming �1 soft drink per day had a higher prevalence of metabolic syndrome(odds ratio [OR], 1.48; 95% CI, 1.30 to 1.69) than those consuming �1 drink per day. On follow-up (mean of 4years), new-onset metabolic syndrome developed in 765 (18.7%) of 4095 participants consuming �1 drink per dayand in 474 (22.6%) of 2059 persons consuming �1 soft drink per day. Consumption of �1 soft drink per day wasassociated with increased odds of developing metabolic syndrome (OR, 1.44; 95% CI, 1.20 to 1.74), obesity (OR,1.31; 95% CI, 1.02 to 1.68), increased waist circumference (OR, 1.30; 95% CI, 1.09 to 1.56), impaired fastingglucose (OR, 1.25; 95% CI, 1.05 to 1.48), higher blood pressure (OR, 1.18; 95% CI, 0.96 to 1.44),hypertriglyceridemia (OR, 1.25; 95% CI, 1.04 to 1.51), and low high-density lipoprotein cholesterol (OR, 1.32;95% CI 1.06 to 1.64).
Conclusions—In middle-aged adults, soft drink consumption is associated with a higher prevalence and incidence ofmultiple metabolic risk factors. (Circulation. 2007;116:480-488.)
Key Words: diabetes mellitus � metabolic syndrome � epidemiology � obesity � risk factors � carbonated beverages
Several reports from the United States and Europeindicate increasing consumption of soft drinks among
children, adolescents, and adults over the past 3 decades.1,2
Many clinical studies have linked the rising consumptionof soft drinks to the present epidemic of obesity anddiabetes mellitus among children and adolescents3– 6 and tothe development of hypertension in adults.7 Furthermore,
Clinical Perspective p 488
added sweeteners in soft drinks have been linked to anincrease in serum triglycerides levels in some reports8,9 butnot in others.10,11 The association of soft drink consumptionwith obesity and higher insulin resistance has been attributedto multiple factors, including greater caloric intake, the high
Received January 12, 2007; accepted May 15, 2007.From the National Heart, Lung, and Blood Institute’s Framingham Heart Study (R.D., T.J.W., C.S.F., R.S.V.), Framingham, Mass; Massachusetts
Veterans Epidemiology Research and Information Center (R.D., J.M.G.), VA Boston Healthcare System, Boston, Mass; Division of Aging (R.D., J.M.G.),Brigham and Women’s Hospital, Harvard Medical School, Boston, Mass; Alice Peck Day Memorial Hospital (R.D.), Lebanon, NH; Department ofBiostatistics (L.S., R.B.D.), Boston University School of Public Health, Boston, Mass; Jean Mayer USDA Human Nutrition Research Center on Aging(P.F.J.), Tufts University, Boston, Mass; Division of Cardiology (T.J.W.) and Department of Medicine (J.B.M.), Massachusetts General Hospital, HarvardMedical School, Boston, Mass; National Heart, Lung, and Blood Institute (C.S.F.), Bethesda, Md; Divisions of Preventive Medicine and CardiovascularMedicine (J.M.G.), Brigham and Women’s Hospital, Boston, Mass; and Cardiology Section and the Department of Preventive Medicine andEpidemiology (R.S.V.), Boston University School of Medicine, Boston, Mass.
The online-only Data Supplement, consisting of tables, is available with this article at http://circ.ahajournals.org/cgi/content/full/CIRCULATIONAHA.107.689935/DC1.
Guest Editor for this article was Gregory L. Burke, MD, MSc.Correspondence to Ramachandran S. Vasan, MD, Framingham Heart Study, 73 Mount Wayte Ave, Suite 2, Framingham, MA 01702-5803. E-mail
[email protected]© 2007 American Heart Association, Inc.
Circulation is available at http://www.circulationaha.org DOI: 10.1161/CIRCULATIONAHA.107.689935
480
Epidemiology
by guest on August 3, 2016http://circ.ahajournals.org/Downloaded from
fructose corn syrup content,12 less satiety and compensation,and a general effect of consuming refined carbohydrates (seereview by Drewnowski and Bellisle13).
The aforementioned data raise the possibility that theconsumption of soft drinks can fuel metabolic derangements,including insulin resistance, that can translate into a greaterrisk of developing abdominal obesity, high triglyceride lev-els, low levels of high-density lipoprotein cholesterol (HDL-C), elevated blood pressure, and impaired glucose tolerance;this constellation of metabolic traits has been collectivelyreferred to as the metabolic syndrome.14 Higher prevalence ofthe metabolic syndrome poses greater risk for cardiovasculardisease in the community,15 although the independent contri-bution of this entity to vascular risk beyond its componentshas been questioned.16
In the present prospective investigation, we tested thehypothesis that greater soft drink consumption increases therisk of developing metabolic risk factors (alone and incombination [metabolic syndrome]) in middle-aged adults inthe community. Additionally, we evaluated whether metabol-ic risk varied on the basis of consumption of sugar-sweetened(“regular”) versus artificially sweetened (“diet”) soft drinks.
MethodsStudy SampleThe Framingham Heart Study began in 1948 with the enrollment of5209 participants into the original study cohort.17 In 1971, childrenof the original cohort participants and the spouses of the childrenwere enrolled into the Framingham Offspring Study (n�5124).18
Offspring study participants are evaluated approximately every 4years. Information on daily consumption of soft drinks was collectedvia a physician-administered questionnaire at each study visit fromthe fourth (1987–1991) through the sixth (1995–1998) examinationcycles. That examination questionnaire did not elicit informationregarding consumption of regular versus diet soft drinks; however,such information was available from the self-administered foodfrequency questionnaires (FFQ; Willett questionnaire)19 completedby participants at the fifth (1992–1995) and sixth examination cycles(see below).
For the present investigation, we selected offspring cohort partic-ipants who attended any 2 consecutive examinations from the fourththrough the seventh (1998–2001) examination cycles. We excludedparticipants with missing data on covariates (n�207) and those with
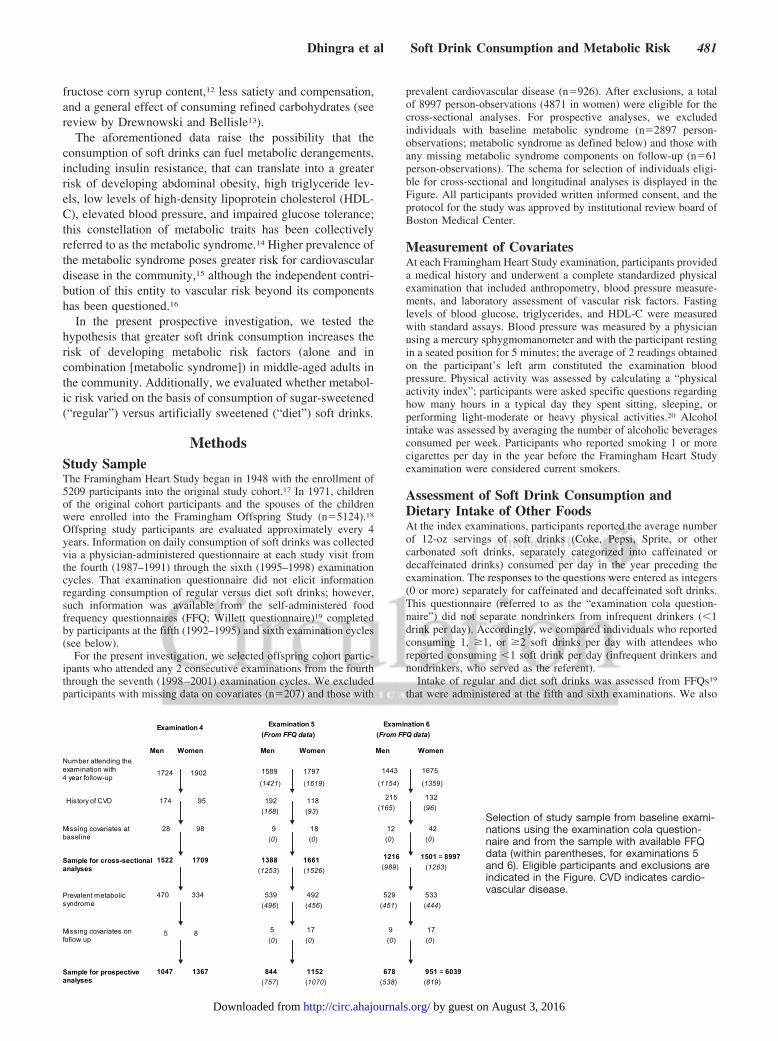
prevalent cardiovascular disease (n�926). After exclusions, a totalof 8997 person-observations (4871 in women) were eligible for thecross-sectional analyses. For prospective analyses, we excludedindividuals with baseline metabolic syndrome (n�2897 person-observations; metabolic syndrome as defined below) and those withany missing metabolic syndrome components on follow-up (n�61person-observations). The schema for selection of individuals eligi-ble for cross-sectional and longitudinal analyses is displayed in theFigure. All participants provided written informed consent, and theprotocol for the study was approved by institutional review board ofBoston Medical Center.
Measurement of CovariatesAt each Framingham Heart Study examination, participants provideda medical history and underwent a complete standardized physicalexamination that included anthropometry, blood pressure measure-ments, and laboratory assessment of vascular risk factors. Fastinglevels of blood glucose, triglycerides, and HDL-C were measuredwith standard assays. Blood pressure was measured by a physicianusing a mercury sphygmomanometer and with the participant restingin a seated position for 5 minutes; the average of 2 readings obtainedon the participant’s left arm constituted the examination bloodpressure. Physical activity was assessed by calculating a “physicalactivity index”; participants were asked specific questions regardinghow many hours in a typical day they spent sitting, sleeping, orperforming light-moderate or heavy physical activities.20 Alcoholintake was assessed by averaging the number of alcoholic beveragesconsumed per week. Participants who reported smoking 1 or morecigarettes per day in the year before the Framingham Heart Studyexamination were considered current smokers.
Assessment of Soft Drink Consumption andDietary Intake of Other FoodsAt the index examinations, participants reported the average numberof 12-oz servings of soft drinks (Coke, Pepsi, Sprite, or othercarbonated soft drinks, separately categorized into caffeinated ordecaffeinated drinks) consumed per day in the year preceding theexamination. The responses to the questions were entered as integers(0 or more) separately for caffeinated and decaffeinated soft drinks.This questionnaire (referred to as the “examination cola question-naire”) did not separate nondrinkers from infrequent drinkers (�1drink per day). Accordingly, we compared individuals who reportedconsuming 1, �1, or �2 soft drinks per day with attendees whoreported consuming �1 soft drink per day (infrequent drinkers andnondrinkers, who served as the referent).
Intake of regular and diet soft drinks was assessed from FFQs19
that were administered at the fifth and sixth examinations. We also
(451) (444)
(1154) (1359)
(165) (96)
1216 1501 = 8997
678 951 = 6039
(0) (0)
5 17
215 132
Examination 4 Examination 5 Examination 6
Men Men Men WomenWomenWomen
(From FFQ data) (From FFQ data)
Number attending theexamination with4 year follow-up
1724 1902 1589 1797
(1421) (1619)
1443 1675
History of CVD 174 95 192 118
(168) (93)
Missing covariates atbaseline
28 98 9 18 12 42
(0) (0) (0) (0)
Sample for cross-sectionalanalyses
Prevalent metabolicsyndrome
Missing covariates onfollow up
Sample for prospectiveanalyses
1522 1709
470 334
5 8
1047 1367
1388 1661
(1253) (1526)
529 533
(989) (1263)
9 17
539 492
844 1152
(496) (456)
(0) (0)
(757) (1070) (538) (819)
Selection of study sample from baseline exami-nations using the examination cola question-naire and from the sample with available FFQdata (within parentheses, for examinations 5and 6). Eligible participants and exclusions areindicated in the Figure. CVD indicates cardio-vascular disease.
Dhingra et al Soft Drink Consumption and Metabolic Risk 481
by guest on August 3, 2016http://circ.ahajournals.org/Downloaded from
assessed the dietary information on consumption of total calories,saturated fat, trans fat, fiber, magnesium, and glycemic index fromthe FFQ.19 Because a FFQ was not administered at the fourthexamination cycle, dietary covariate data from the fifth examinationcycle were used for analyses using information from the examinationcola questionnaire at all 3 examinations.
Data from the FFQ were considered valid only if total energyintakes reported were �2.51 MJ/d (600 kcal/d) for men and womenbut �17.54 MJ/d (4200 kcal/d) for men or �16.74 MJ/d (4000kcal/d) for women and if fewer than 13 food items were left blank.Each food item was categorized in 9 categories that ranged fromnever or �1 serving per month to �6 servings per day. Forassessment of saturated fat, trans fat, or dietary fiber, the nutrientintakes from all specific food items were multiplied by the frequencyof consumption. The validity of the FFQ has been demonstratedpreviously.21
Definition and Components of theMetabolic SyndromeThe metabolic syndrome was considered present if 3 or more of thefollowing individual components were present14,22: waist circumfer-ence �35 inches (88 cm) for women or �40 inches (102 cm) formen; fasting blood sugar �100 mg/dL (5.5 mmol/L) or treatmentwith oral hypoglycemic agents or insulin; blood pressure �135/85 mm Hg or treatment for hypertension; serum triglycerides �150mg/dL (1.7 mmol/L) or treatment for hypertriglyceridemia (withniacin or fibrates); and HDL-C �40 mg/dL (1.03 mmol/L) in men or�50 mg/dL (1.3 mmol/L) in women.
Statistical AnalysesAge- and sex-adjusted baseline characteristics of the participantgroups defined according to the number of soft drinks consumed in1 day (�1, 1, or �2 per day) were compared by multiple linear andmultiple logistic regression analysis for continuous and categoricalcharacteristics, respectively. Data on consumption of soft drinks ateach of the 3 eligible baseline examinations (examination colaquestionnaire) were used for this purpose. Tests for trend in baselinecharacteristics across soft drink consumption categories were per-formed with multiple regression. We also assessed the baselinecharacteristics after excluding participants with prevalent metabolicsyndrome at baseline examinations (sample used for incidenceanalyses; see below).
Soft Drink Consumption and Prevalence of theMetabolic SyndromeWe used data from examinations 4, 5, and 6 (examination colaquestionnaire) and generalized estimating equations to compare theprevalence of metabolic syndrome in participants who consumed �1soft drink per day with those who consumed �1 soft drink per day(referent). Each participant could contribute up to 3 person-examinations of data for analysis. We also evaluated a dose responseby comparing individuals who consumed 1 soft drink per day andthose who consumed �2 soft drinks per day with the referent group.We constructed multivariable models in hierarchical fashion withadjustment for age and sex (model I) and for age, sex, physicalactivity index, smoking, dietary consumption of saturated fat, transfat, fiber, magnesium, total calories, and glycemic index (model II).
We used soft drink consumption data from FFQs at examinations5 and 6, which yielded a smaller sample (Figure), to relate theprevalence of metabolic syndrome across the following categories ofintake of regular versus diet soft drinks using generalized estimatingequations: (1) �1 diet or regular soft drink per week (referent), (2)1 to 6 diet soft drinks per week, (3) �1 diet soft drink per day, (4)1 to 6 regular soft drinks per week, (5) 1 to 6 regular or diet softdrinks per week, and (6) �1 regular soft drink per day. Individualsreporting consumption of both diet and regular soft drinks �1/d(n�16) were grouped into the last category empirically. We evalu-ated the 2 sets of models (I and II) noted above.
Soft Drink Consumption and Incidence of theMetabolic SyndromeTo assess the relations of soft drink consumption to the incidenceof metabolic syndrome, we excluded participants with prevalentmetabolic syndrome at each of examination cycles 4, 5, and 6(n�2897 person-observations). Then, we used pooled logisticregression analyses by combining each 4-year follow-up period ofobservations to relate the number of soft drinks consumed per day(examination cola questionnaire) to the incidence of metabolicsyndrome (from examination cycles 4 to 5, 5 to 6, and 6 to 7).23
The eligible participants were free of metabolic syndrome at eachbaseline examination, and in this setting, pooled logistic regres-sion has been shown to provide risk estimates similar to time-dependent Cox models.24 We compared the consumption of softdrinks �1 per day with infrequent drinkers (�1 per day; referent)and also tested for a dose response by comparing groups consum-ing 1 and �2 soft drinks per day with the referent group. Weevaluated 2 sets of models (covariates as in models I and IIabove), which paralleled the analyses of prevalence of metabolicsyndrome.
Consumption of soft drinks varies with age and by sex.25 It hasalso been suggested that the effects of soft drinks and carbohydrateson metabolic traits may vary according to age, sex,26 and baselinebody weight.27 Therefore, we assessed for effect modification by age(modeled as a continuous variable), sex, and body mass index (�30versus �30 kg/m2) by incorporating appropriate interaction terms inthe multivariable models. We repeated analyses with additionallyadjustment for alcohol consumption and baseline levels of systolicand diastolic blood pressure, blood glucose, serum triglycerides, andHDL-C. These models were constructed to account for baselinelevels of metabolic traits. Additionally, we repeated analyses toexamine the association between consumption of caffeinated anddecaffeinated soft drinks, considered separately, and incidence of themetabolic syndrome. Because individuals with diabetes mellitus area particularly high-risk group for developing metabolic abnormali-ties, we also repeated our analyses after excluding those withprevalent diabetes mellitus at baseline.
To compare the risk of new-onset metabolic syndrome accordingto the type of soft drink consumed (regular versus diet), we used datafrom the FFQs at examinations 5 and 6 and evaluated the incidenceof the metabolic syndrome across categories of soft drinks con-sumed. The 6 categories of regular and diet soft drinks were thosenoted above (for the analyses of the prevalence of metabolicsyndrome), and 2 sets of models were evaluated (models I and II, asdescribed above).
Incidence of Individual Components ofMetabolic SyndromeWe used multivariable logistic regression to evaluate the relations ofsoft drink consumption to the incidence of each individual compo-nent of metabolic syndrome using data from the examination colaquestionnaire. We excluded participants who had the specific meta-bolic trait prevalent at baseline; for example, we excluded individ-uals with blood glucose �100 mg/dL (5.5 mmol/L) from the“at-risk” group for analysis that examined the incidence of impairedfasting glucose. Thus, we examined the incidence of increased waistcircumference, impaired fasting glucose, high blood pressure, hyper-triglyceridemia, and low HDL-C (all defined as above) according tothe number of soft drinks consumed per day.
We evaluated 2 sets of models (I and II, as noted above) andcompared the risk of developing metabolic traits associated withconsumption of �1 soft drinks per day with that in infrequentdrinkers (�1 soft drinks per day). We also evaluated for a doseresponse as detailed above. We did not perform analyses of devel-opment of individual metabolic syndrome components in relation toregular versus diet soft drink intake using the FFQ data at examina-tions 5 and 6 because the grouping of incident events into 6categories resulted in modest numbers of events in each category.
482 Circulation July 31, 2007
by guest on August 3, 2016http://circ.ahajournals.org/Downloaded from
All analyses were performed with SAS software version 9.0 (SASInstitute, Cary, NC). A 2-sided probability value of �0.05 wasconsidered statistically significant.
The authors had full access to and take full responsibility for theintegrity of the data. All authors have read and agree to themanuscript as written.
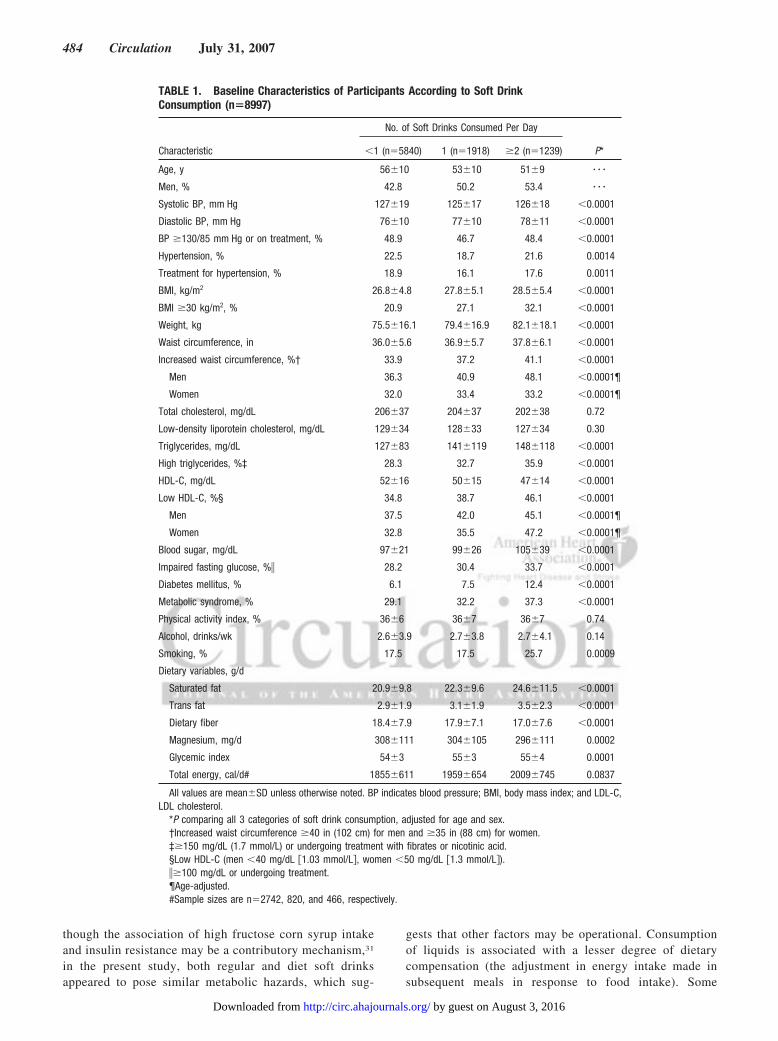
ResultsThe baseline characteristics of participants according to thecategories of soft drinks consumed per day are presented inTable 1. Approximately 35% of the participants reportedconsuming �1 soft drink per day in response to the exami-nation cola questionnaire (data based on all 3 examinations).In comparison, only 22% of participants reported intake of atleast 1 soft drink (diet or regular) per day in response to theFFQ (data available for examinations 5 and 6 only). Thelower proportion reporting daily intake on the FFQ may berelated to the greater number of options available to indicatesoft drink intake; participants drinking 1 to 6 soft drinks perweek (also 22% on the FFQ) may have rounded theirresponses on the examination cola questionnaire to thenearest integer.
In age- and sex-adjusted models, the prevalence of obesity(assessed both by body mass index and by waist circumfer-ence), high blood pressure, glucose intolerance, low HDL-C,and hypertriglyceridemia was significantly higher in thosewho consumed a greater number of soft drinks per day.Serum total cholesterol, low-density lipoprotein cholesterol,physical activity index, and alcohol consumption did not varyacross categories of soft drinks consumed. Similar trendswere obtained when we excluded individuals with prevalentmetabolic syndrome (Data Supplement, Table I).
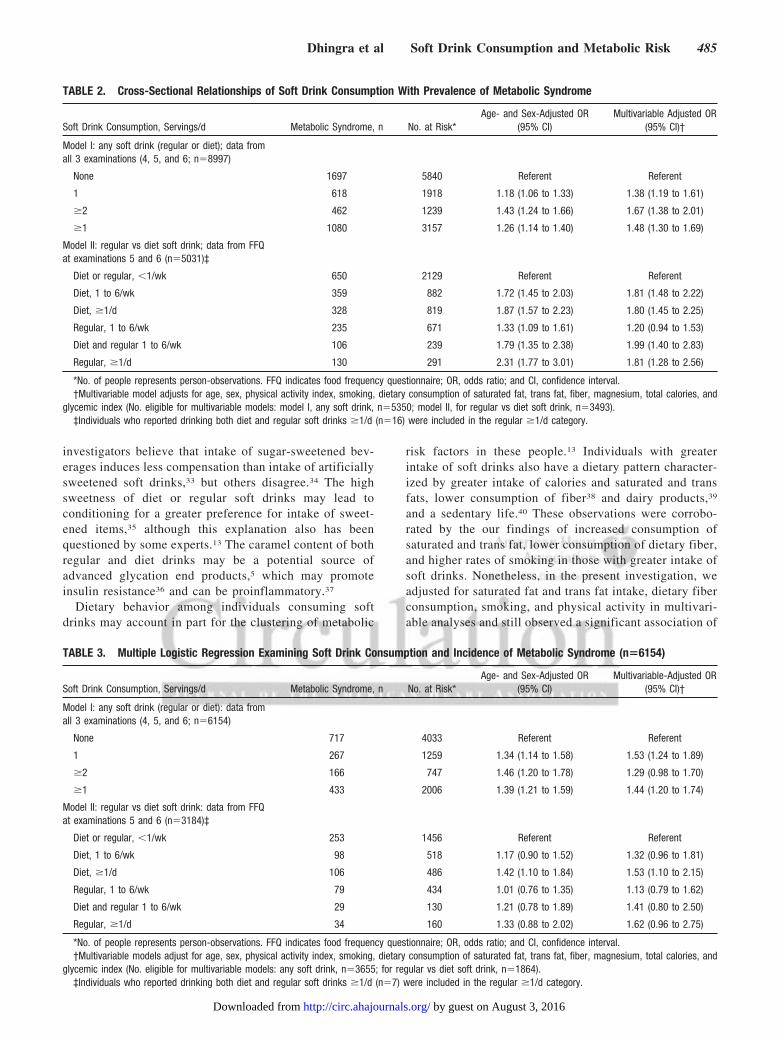
Prevalence of the Metabolic SyndromeThere was a 48% higher adjusted prevalence of metabolicsyndrome among those who consumed 1 or more soft drinksper day relative to individuals with infrequent soft drinkconsumption (Table 2). We observed a rising prevalence ofmetabolic syndrome across categories of 1 and �2 soft drinksper day. In parallel analyses with the data from the FFQ(Table 2), participants who consumed �1 diet or regular softdrink per day had nearly a 1.8-fold adjusted prevalence ofmetabolic syndrome compared with infrequent drinkers (�1per week).
Incidence of the Metabolic SyndromeIndividuals who consumed at least 1 soft drink per day had a44% higher adjusted risk (95% CI, 20% to 74%) of develop-ing metabolic syndrome compared with infrequent drinkers inmultivariable-adjusted analyses (Table 3). There was noeffect modification by age, body mass index, or sex (interac-tion terms were not statistically significant). After additionaladjustment for baseline levels of covariates (blood sugar,systolic and diastolic blood pressure, triglycerides, andHDL-C) and alcohol consumption in our models, the associ-ation of consumption of �1 soft drink per day with incidenceof metabolic syndrome remained robust (odds ratio [OR],1.44; 95% CI, 1.19 to 1.74). Further exclusion of individualswith diabetes mellitus at baseline (n�138) attenuated theassociation (OR for �1 soft drink per day, 1.16; 95% CI 1.00
to 1.34). After stratification of analyses by caffeinated versusdecaffeinated drinks, results were consistent with the primaryanalyses; consumption of �1 soft drink per day was associ-ated with incident metabolic syndrome for both types ofbeverages (Data Supplement, Table II).
In analyses with FFQ data (Table 3), intake of at least 1regular or diet soft drink per day was associated with a �50%higher incidence of metabolic syndrome than among thosewho drank �1 soft drink per week, although the associationwas borderline significant for intake of �1 regular soft drinkper day (P�0.07). We also observed a graded increase in therisk of metabolic syndrome from those who were consuming1 to 6 diet or regular soft drinks per week to those who drank�1 soft drinks per day (diet or regular).
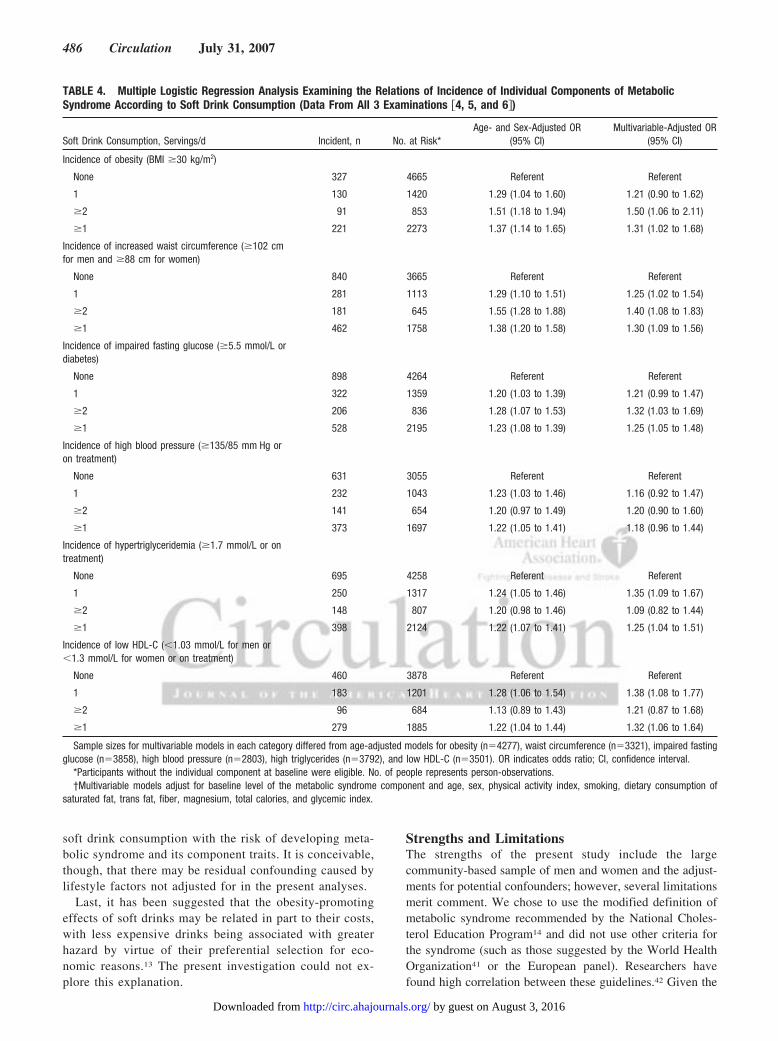
Incidence of Individual Components of theMetabolic SyndromeCompared with infrequent drinkers, individuals who con-sumed �1 soft drink per day had a 25% to 32% higheradjusted risk of incidence of each individual metabolic trait(Table 4), with the exception of development of high bloodpressure, for which there was a borderline significant 18%higher adjusted odds (P�0.10).
DiscussionIn the present study, we observed a significantly higherprevalence of metabolic syndrome among middle-aged adultswho consumed �1 soft drink per day. This association wasconsistent for intake of both regular and diet soft drinks. Ourprospective analyses corroborated the cross-sectional find-ings; we observed an increase in the incidence of metabolicsyndrome among adults consuming at least 1 soft drink perday, regardless of whether it was of the regular or diet type.Additionally, consumption of soft drinks daily was associatedwith a higher incidence of each metabolic syndrome compo-nent. The present study extends results from prior studies thatreported that a greater intake of soft drinks is associated withincreased prevalence of metabolic syndrome,28 higher risk ofobesity,4–6 high blood pressure,7 and diabetes mellitus.5 Thesimilar metabolic hazard posed by both regular and diet softdrinks is noteworthy given the lack of calories in the latter;however, other studies have also reported associations of dietsoft drinks with weight gain in boys29 and with hypertensionin adult women.7
MechanismsThere are several mechanisms that can explain the higher riskof metabolic abnormalities associated with greater consump-tion of soft drinks. These can be broadly grouped underphysiological effects, dietary behavior, and the economics offood choice.13
There are several physiological effects of soft drinks thatmay pose an adverse metabolic risk. Larger consumptionof added nutritive sweeteners such as high fructose cornsyrup (the primary sweetener in soft drinks) can lead toweight gain, increased insulin resistance,30,31 a lowering ofHDL-C,32 and an increase in triglyceride levels.27 Typi-cally, in the United States, the high fructose corn syrupadded to the beverages contains �55% fructose.30,31 Al-
Dhingra et al Soft Drink Consumption and Metabolic Risk 483
by guest on August 3, 2016http://circ.ahajournals.org/Downloaded from
though the association of high fructose corn syrup intakeand insulin resistance may be a contributory mechanism,31
in the present study, both regular and diet soft drinksappeared to pose similar metabolic hazards, which sug-
gests that other factors may be operational. Consumptionof liquids is associated with a lesser degree of dietarycompensation (the adjustment in energy intake made insubsequent meals in response to food intake). Some
TABLE 1. Baseline Characteristics of Participants According to Soft DrinkConsumption (n�8997)
No. of Soft Drinks Consumed Per Day
Characteristic �1 (n�5840) 1 (n�1918) �2 (n�1239) P*
Age, y 56�10 53�10 51�9 � � �
Men, % 42.8 50.2 53.4 � � �
Systolic BP, mm Hg 127�19 125�17 126�18 �0.0001
Diastolic BP, mm Hg 76�10 77�10 78�11 �0.0001
BP �130/85 mm Hg or on treatment, % 48.9 46.7 48.4 �0.0001
Hypertension, % 22.5 18.7 21.6 0.0014
Treatment for hypertension, % 18.9 16.1 17.6 0.0011
BMI, kg/m2 26.8�4.8 27.8�5.1 28.5�5.4 �0.0001
BMI �30 kg/m2, % 20.9 27.1 32.1 �0.0001
Weight, kg 75.5�16.1 79.4�16.9 82.1�18.1 �0.0001
Waist circumference, in 36.0�5.6 36.9�5.7 37.8�6.1 �0.0001
Increased waist circumference, %† 33.9 37.2 41.1 �0.0001
Men 36.3 40.9 48.1 �0.0001¶
Women 32.0 33.4 33.2 �0.0001¶
Total cholesterol, mg/dL 206�37 204�37 202�38 0.72
Low-density liporotein cholesterol, mg/dL 129�34 128�33 127�34 0.30
Triglycerides, mg/dL 127�83 141�119 148�118 �0.0001
High triglycerides, %‡ 28.3 32.7 35.9 �0.0001
HDL-C, mg/dL 52�16 50�15 47�14 �0.0001
Low HDL-C, %§ 34.8 38.7 46.1 �0.0001
Men 37.5 42.0 45.1 �0.0001¶
Women 32.8 35.5 47.2 �0.0001¶
Blood sugar, mg/dL 97�21 99�26 105�39 �0.0001
Impaired fasting glucose, %� 28.2 30.4 33.7 �0.0001
Diabetes mellitus, % 6.1 7.5 12.4 �0.0001
Metabolic syndrome, % 29.1 32.2 37.3 �0.0001
Physical activity index, % 36�6 36�7 36�7 0.74
Alcohol, drinks/wk 2.6�3.9 2.7�3.8 2.7�4.1 0.14
Smoking, % 17.5 17.5 25.7 0.0009
Dietary variables, g/d
Saturated fat 20.9�9.8 22.3�9.6 24.6�11.5 �0.0001
Trans fat 2.9�1.9 3.1�1.9 3.5�2.3 �0.0001
Dietary fiber 18.4�7.9 17.9�7.1 17.0�7.6 �0.0001
Magnesium, mg/d 308�111 304�105 296�111 0.0002
Glycemic index 54�3 55�3 55�4 0.0001
Total energy, cal/d# 1855�611 1959�654 2009�745 0.0837
All values are mean�SD unless otherwise noted. BP indicates blood pressure; BMI, body mass index; and LDL-C,LDL cholesterol.
*P comparing all 3 categories of soft drink consumption, adjusted for age and sex.†Increased waist circumference �40 in (102 cm) for men and �35 in (88 cm) for women.‡�150 mg/dL (1.7 mmol/L) or undergoing treatment with fibrates or nicotinic acid.§Low HDL-C (men �40 mg/dL �1.03 mmol/L�, women �50 mg/dL �1.3 mmol/L�).��100 mg/dL or undergoing treatment.¶Age-adjusted.#Sample sizes are n�2742, 820, and 466, respectively.
484 Circulation July 31, 2007
by guest on August 3, 2016http://circ.ahajournals.org/Downloaded from
investigators believe that intake of sugar-sweetened bev-erages induces less compensation than intake of artificiallysweetened soft drinks,33 but others disagree.34 The highsweetness of diet or regular soft drinks may lead toconditioning for a greater preference for intake of sweet-ened items,35 although this explanation also has beenquestioned by some experts.13 The caramel content of bothregular and diet drinks may be a potential source ofadvanced glycation end products,5 which may promoteinsulin resistance36 and can be proinflammatory.37
Dietary behavior among individuals consuming softdrinks may account in part for the clustering of metabolic
risk factors in these people.13 Individuals with greaterintake of soft drinks also have a dietary pattern character-ized by greater intake of calories and saturated and transfats, lower consumption of fiber38 and dairy products,39
and a sedentary life.40 These observations were corrobo-rated by the our findings of increased consumption ofsaturated and trans fat, lower consumption of dietary fiber,and higher rates of smoking in those with greater intake ofsoft drinks. Nonetheless, in the present investigation, weadjusted for saturated fat and trans fat intake, dietary fiberconsumption, smoking, and physical activity in multivari-able analyses and still observed a significant association of
TABLE 2. Cross-Sectional Relationships of Soft Drink Consumption With Prevalence of Metabolic Syndrome
Soft Drink Consumption, Servings/d Metabolic Syndrome, n No. at Risk*Age- and Sex-Adjusted OR
(95% CI)Multivariable Adjusted OR
(95% CI)†
Model I: any soft drink (regular or diet); data fromall 3 examinations (4, 5, and 6; n�8997)
None 1697 5840 Referent Referent
1 618 1918 1.18 (1.06 to 1.33) 1.38 (1.19 to 1.61)
�2 462 1239 1.43 (1.24 to 1.66) 1.67 (1.38 to 2.01)
�1 1080 3157 1.26 (1.14 to 1.40) 1.48 (1.30 to 1.69)
Model II: regular vs diet soft drink; data from FFQat examinations 5 and 6 (n�5031)‡
Diet or regular, �1/wk 650 2129 Referent Referent
Diet, 1 to 6/wk 359 882 1.72 (1.45 to 2.03) 1.81 (1.48 to 2.22)
Diet, �1/d 328 819 1.87 (1.57 to 2.23) 1.80 (1.45 to 2.25)
Regular, 1 to 6/wk 235 671 1.33 (1.09 to 1.61) 1.20 (0.94 to 1.53)
Diet and regular 1 to 6/wk 106 239 1.79 (1.35 to 2.38) 1.99 (1.40 to 2.83)
Regular, �1/d 130 291 2.31 (1.77 to 3.01) 1.81 (1.28 to 2.56)
*No. of people represents person-observations. FFQ indicates food frequency questionnaire; OR, odds ratio; and CI, confidence interval.†Multivariable model adjusts for age, sex, physical activity index, smoking, dietary consumption of saturated fat, trans fat, fiber, magnesium, total calories, and
glycemic index (No. eligible for multivariable models: model I, any soft drink, n�5350; model II, for regular vs diet soft drink, n�3493).‡Individuals who reported drinking both diet and regular soft drinks �1/d (n�16) were included in the regular �1/d category.
TABLE 3. Multiple Logistic Regression Examining Soft Drink Consumption and Incidence of Metabolic Syndrome (n�6154)
Soft Drink Consumption, Servings/d Metabolic Syndrome, n No. at Risk*Age- and Sex-Adjusted OR
(95% CI)Multivariable-Adjusted OR
(95% CI)†
Model I: any soft drink (regular or diet): data fromall 3 examinations (4, 5, and 6; n�6154)
None 717 4033 Referent Referent
1 267 1259 1.34 (1.14 to 1.58) 1.53 (1.24 to 1.89)
�2 166 747 1.46 (1.20 to 1.78) 1.29 (0.98 to 1.70)
�1 433 2006 1.39 (1.21 to 1.59) 1.44 (1.20 to 1.74)
Model II: regular vs diet soft drink: data from FFQat examinations 5 and 6 (n�3184)‡
Diet or regular, �1/wk 253 1456 Referent Referent
Diet, 1 to 6/wk 98 518 1.17 (0.90 to 1.52) 1.32 (0.96 to 1.81)
Diet, �1/d 106 486 1.42 (1.10 to 1.84) 1.53 (1.10 to 2.15)
Regular, 1 to 6/wk 79 434 1.01 (0.76 to 1.35) 1.13 (0.79 to 1.62)
Diet and regular 1 to 6/wk 29 130 1.21 (0.78 to 1.89) 1.41 (0.80 to 2.50)
Regular, �1/d 34 160 1.33 (0.88 to 2.02) 1.62 (0.96 to 2.75)
*No. of people represents person-observations. FFQ indicates food frequency questionnaire; OR, odds ratio; and CI, confidence interval.†Multivariable models adjust for age, sex, physical activity index, smoking, dietary consumption of saturated fat, trans fat, fiber, magnesium, total calories, and
glycemic index (No. eligible for multivariable models: any soft drink, n�3655; for regular vs diet soft drink, n�1864).‡Individuals who reported drinking both diet and regular soft drinks �1/d (n�7) were included in the regular �1/d category.
Dhingra et al Soft Drink Consumption and Metabolic Risk 485
by guest on August 3, 2016http://circ.ahajournals.org/Downloaded from
soft drink consumption with the risk of developing meta-bolic syndrome and its component traits. It is conceivable,though, that there may be residual confounding caused bylifestyle factors not adjusted for in the present analyses.
Last, it has been suggested that the obesity-promotingeffects of soft drinks may be related in part to their costs,with less expensive drinks being associated with greaterhazard by virtue of their preferential selection for eco-nomic reasons.13 The present investigation could not ex-plore this explanation.
Strengths and LimitationsThe strengths of the present study include the largecommunity-based sample of men and women and the adjust-ments for potential confounders; however, several limitationsmerit comment. We chose to use the modified definition ofmetabolic syndrome recommended by the National Choles-terol Education Program14 and did not use other criteria forthe syndrome (such as those suggested by the World HealthOrganization41 or the European panel). Researchers havefound high correlation between these guidelines.42 Given the
TABLE 4. Multiple Logistic Regression Analysis Examining the Relations of Incidence of Individual Components of MetabolicSyndrome According to Soft Drink Consumption (Data From All 3 Examinations �4, 5, and 6�)
Soft Drink Consumption, Servings/d Incident, n No. at Risk*Age- and Sex-Adjusted OR
(95% CI)Multivariable-Adjusted OR
(95% CI)
Incidence of obesity (BMI �30 kg/m2)
None 327 4665 Referent Referent
1 130 1420 1.29 (1.04 to 1.60) 1.21 (0.90 to 1.62)
�2 91 853 1.51 (1.18 to 1.94) 1.50 (1.06 to 2.11)
�1 221 2273 1.37 (1.14 to 1.65) 1.31 (1.02 to 1.68)
Incidence of increased waist circumference (�102 cmfor men and �88 cm for women)
None 840 3665 Referent Referent
1 281 1113 1.29 (1.10 to 1.51) 1.25 (1.02 to 1.54)
�2 181 645 1.55 (1.28 to 1.88) 1.40 (1.08 to 1.83)
�1 462 1758 1.38 (1.20 to 1.58) 1.30 (1.09 to 1.56)
Incidence of impaired fasting glucose (�5.5 mmol/L ordiabetes)
None 898 4264 Referent Referent
1 322 1359 1.20 (1.03 to 1.39) 1.21 (0.99 to 1.47)
�2 206 836 1.28 (1.07 to 1.53) 1.32 (1.03 to 1.69)
�1 528 2195 1.23 (1.08 to 1.39) 1.25 (1.05 to 1.48)
Incidence of high blood pressure (�135/85 mm Hg oron treatment)
None 631 3055 Referent Referent
1 232 1043 1.23 (1.03 to 1.46) 1.16 (0.92 to 1.47)
�2 141 654 1.20 (0.97 to 1.49) 1.20 (0.90 to 1.60)
�1 373 1697 1.22 (1.05 to 1.41) 1.18 (0.96 to 1.44)
Incidence of hypertriglyceridemia (�1.7 mmol/L or ontreatment)
None 695 4258 Referent Referent
1 250 1317 1.24 (1.05 to 1.46) 1.35 (1.09 to 1.67)
�2 148 807 1.20 (0.98 to 1.46) 1.09 (0.82 to 1.44)
�1 398 2124 1.22 (1.07 to 1.41) 1.25 (1.04 to 1.51)
Incidence of low HDL-C (�1.03 mmol/L for men or�1.3 mmol/L for women or on treatment)
None 460 3878 Referent Referent
1 183 1201 1.28 (1.06 to 1.54) 1.38 (1.08 to 1.77)
�2 96 684 1.13 (0.89 to 1.43) 1.21 (0.87 to 1.68)
�1 279 1885 1.22 (1.04 to 1.44) 1.32 (1.06 to 1.64)
Sample sizes for multivariable models in each category differed from age-adjusted models for obesity (n�4277), waist circumference (n�3321), impaired fastingglucose (n�3858), high blood pressure (n�2803), high triglycerides (n�3792), and low HDL-C (n�3501). OR indicates odds ratio; CI, confidence interval.
*Participants without the individual component at baseline were eligible. No. of people represents person-observations.†Multivariable models adjust for baseline level of the metabolic syndrome component and age, sex, physical activity index, smoking, dietary consumption of
saturated fat, trans fat, fiber, magnesium, total calories, and glycemic index.
486 Circulation July 31, 2007
by guest on August 3, 2016http://circ.ahajournals.org/Downloaded from
observational nature of the present study, we cannot infer thatthe observed associations are causal. As noted above, it isconceivable that residual confounding by lifestyle/dietaryfactors not adjusted for may have contributed to the metabolicrisks associated with soft drink intake. Finally, participants inthe present study were all white Americans, which may limitthe generalizability of our results to nonwhites.
ConclusionsIn our large community-based sample of middle-aged adults,soft drink consumption was associated with higher risk ofdeveloping adverse metabolic traits and the metabolic syndrome.The present observational data raise the possibility that publichealth policy measures to limit the rising consumption of softdrinks in the community may be associated with a lowering ofthe burden of metabolic risk factors in adults.
Sources of FundingThis work was supported through National Institutes of Health/National Heart, Lung, and Blood Institute contracts N01-HC-25195,1R01HL67288, and 2K24HL04334 (Dr Vasan) and K23HL74077(Dr Wang) and by a career development award from the AmericanDiabetes Association (Dr Meigs).
DisclosuresNone.
References1. Nielsen SJ, Popkin BM. Changes in beverage intake between 1977 and
2001. Am J Prev Med. 2004;27:205–210.2. Vereecken CA, Inchley J, Subramanian SV, Hublet A, Maes L. The
relative influence of individual and contextual socio-economic status onconsumption of fruit and soft drinks among adolescents in Europe. Eur JPublic Health. 2005;15:224–232.
3. James J, Thomas P, Cavan D, Kerr D. Preventing childhood obesity byreducing consumption of carbonated drinks: cluster randomised con-trolled trial (published correction appears in BMJ. 2004;328:1236). BMJ.2004;328:1237.
4. Ludwig DS, Peterson KE, Gortmaker SL. Relation between consumptionof sugar-sweetened drinks and childhood obesity: a prospective, obser-vational analysis. Lancet. 2001;357:505–508.
5. Schulze MB, Manson JE, Ludwig DS, Colditz GA, Stampfer MJ, WillettWC, Hu FB. Sugar-sweetened beverages, weight gain, and incidence oftype 2 diabetes in young and middle-aged women. JAMA. 2004;292:927–934.
6. Troiano RP, Briefel RR, Carroll MD, Bialostosky K. Energy and fatintakes of children and adolescents in the United States: data from theNational Health and Nutrition Examination Surveys. Am J Clin Nutr.2000;72:1343S–1353S.
7. Winkelmayer WC, Stampfer MJ, Willett WC, Curhan GC. Habitualcaffeine intake and the risk of hypertension in women. JAMA. 2005;294:2330–2335.
8. Parks EJ, Hellerstein MK. Carbohydrate-induced hypertriacylglycer-olemia: historical perspective and review of biological mechanisms.Am J Clin Nutr. 2000;71:412–433.
9. Smith JB, Niven BE, Mann JI. The effect of reduced extrinsic sucroseintake on plasma triglyceride levels. Eur J Clin Nutr. 1996;50:498–504.
10. Surwit RS, Feinglos MN, McCaskill CC, Clay SL, Babyak MA,Brownlow BS, Plaisted CS, Lin PH. Metabolic and behavioral effects ofa high-sucrose diet during weight loss. Am J Clin Nutr. 1997;65:908–915.
11. Swanson JE, Laine DC, Thomas W, Bantle JP. Metabolic effects ofdietary fructose in healthy subjects. Am J Clin Nutr. 1992;55:851–856.
12. Jurgens H, Haass W, Castaneda TR, Schurmann A, Koebnick C, Dom-browski F, Otto B, Nawrocki AR, Scherer PE, Spranger J, Ristow M,Joost HG, Havel PJ, Tschop MH. Consuming fructose-sweetened bev-erages increases body adiposity in mice. Obes Res. 2005;13:1146–1156.
13. Drewnowski A, Bellisle F. Liquid calories, sugar, and body weight.Am J Clin Nutr. 2007;85:651–661.
14. Grundy SM, Cleeman JI, Daniels SR, Donato KA, Eckel RH, FranklinBA, Gordon DJ, Krauss RM, Savage PJ, Smith SC Jr, Spertus JA, CostaF. Diagnosis and management of the metabolic syndrome: an AmericanHeart Association/National Heart, Lung, and Blood Institute scientificstatement. Circulation. 2005;13:322–327.
15. Wilson PW, D’Agostino RB, Parise H, Sullivan L, Meigs JB. Metabolicsyndrome as a precursor of cardiovascular disease and type 2 diabetesmellitus. Circulation. 2005;112:3066–3072.
16. Kahn R, Buse J, Ferrannini E, Stern M. The metabolic syndrome: time fora critical appraisal: joint statement from the American Diabetes Asso-ciation and the European Association for the Study of Diabetes. DiabetesCare. 2005;28:2289–2304.
17. Dawber TR, Meadors GF, Moore FE. Epidemiologic approaches to heartdisease: the Framingham Study. Am J Public Health. 1951;41:279–286.
18. Kannel WB, Feinleib M, McNamara PM, Garrison RJ, Castelli WP. Aninvestigation of coronary heart disease in families: the FraminghamOffspring Study. Am J Epidemiol. 1979;110:281–290.
19. Willett WC, Sampson L, Stampfer MJ, Rosner B, Bain C, Witschi J,Hennekens CH, Speizer FE. Reproducibility and validity of a semiquan-titative food frequency questionnaire. Am J Epidemiol. 1985;122:51–65.
20. Kannel WB, Belanger A, D’Agostino R, Israel I. Physical activity andphysical demand on the job and risk of cardiovascular disease and death:the Framingham Study. Am Heart J. 1986;112:820–825.
21. Rimm EB, Giovannucci EL, Stampfer MJ, Colditz GA, Litin LB, WillettWC. Reproducibility and validity of an expanded self-administered semi-quantitative food frequency questionnaire among male health profes-sionals. Am J Epidemiol. 1992;135:1114–1126.
22. Expert Panel on Detection, Evaluation, and Treatment of High BloodCholesterol in Adults. Executive Summary of the Third Report of theNational Cholesterol Education Program (NCEP) Expert Panel onDetection, Evaluation, and Treatment of High Blood Cholesterol inAdults (Adult Treatment Panel III). JAMA. 2001;285:2486–2497.
23. Cupples LA, D’Agostino RB, Anderson K, Kannel WB. Comparison ofbaseline and repeated measure covariate techniques in the FraminghamHeart Study. Stat Med. 1988;7:205–222.
24. D’Agostino RB, Lee ML, Belanger AJ, Cupples LA, Anderson K, KannelWB. Relation of pooled logistic regression to time dependent Coxregression analysis: the Framingham Heart Study. Stat Med. 1990;9:1501–1515.
25. Storey ML, Forshee RA, Anderson PA. Beverage consumption in the USpopulation. J Am Diet Assoc. 2006;106:1992–2000.
26. Vartanian LR, Schwartz MB, Brownell KD. Effects of soft drink con-sumption on nutrition and health: a systematic review and meta-analysis.Am J Public Health. 2007;97:667–675.
27. Willett W, Manson J, Liu S. Glycemic index, glycemic load, and risk oftype 2 diabetes. Am J Clin Nutr 2002;76:274S–280S.
28. Yoo S, Nicklas T, Baranowski T, Zakeri IF, Yang SJ, Srinivasan SR,Berenson GS. Comparison of dietary intakes associated with metabolicsyndrome risk factors in young adults: the Bogalusa Heart Study.Am J Clin Nutr. 2004;80:841–848.
29. Berkey CS, Rockett HRH, Field AE, Gillman MW, Colditz GA.Sugar-added beverages and adolescent weight change. Obesity Res. 2004;12:778–788.
30. Bray GA, Nielsen SJ, Popkin BM. Consumption of high-fructose cornsyrup in beverages may play a role in the epidemic of obesity. Am J ClinNutr. 2004;79:537–543.
31. Elliott SS, Keim NL, Stern JS, Teff K, Havel PJ. Fructose, weight gain,and the insulin resistance syndrome. Am J Clin Nutr. 2002;76:911–922.
32. Frost G, Leeds AA, Dore CJ, Madeiros S, Brading S, Dornhorst A.Glycaemic index as a determinant of serum HDL-cholesterol concen-tration. Lancet. 1999;353:1045–1048.
33. Van Wymelbeke V, Beridot-Therond ME, de LG, V, Fantino M.Influence of repeated consumption of beverages containing sucrose orintense sweeteners on food intake. Eur J Clin Nutr. 2004;58:154–161.
34. Holt SH, Sandona N, Brand-Miller JC. The effects of sugar-free vssugar-rich beverages on feelings of fullness and subsequent food intake.Int J Food Sci Nutr. 2000;51:59–71.
35. Davidson TL, Swithers SE. A Pavlovian approach to the problem ofobesity. Int J Obes Relat Metab Disord. 2004;28:933–935.
36. Hofmann SM, Dong HJ, Li Z, Cai W, Altomonte J, Thung SN, Zeng F,Fisher EA, Vlassara H. Improved insulin sensitivity is associated withrestricted intake of dietary glycoxidation products in the db/db mouse.Diabetes. 2002;51:2082–2089.
37. Vlassara H, Cai W, Crandall J, Goldberg T, Oberstein R, Dardaine V,Peppa M, Rayfield EJ. Inflammatory mediators are induced by dietary
Dhingra et al Soft Drink Consumption and Metabolic Risk 487
by guest on August 3, 2016http://circ.ahajournals.org/Downloaded from
glycotoxins, a major risk factor for diabetic angiopathy (published cor-rection appears in Proc Natl Acad Sci U S A. 2003;100:763). Proc NatlAcad Sci U S A. 2002;99:15596–15601.
38. Pereira MA, Kartashov AI, Ebbeling CB, Van Horn L, Slattery ML,Jacobs DR Jr, Ludwig DS. Fast-food habits, weight gain, and insulinresistance (the CARDIA study): 15-year prospective analysis. Lancet.2005;365:36–42.
39. Rampersaud GC, Bailey LB, Kauwell GP. National survey beverageconsumption data for children and adolescents indicate the need toencourage a shift toward more nutritive beverages. J Am Diet Assoc.2003;103:97–100.
40. Hu FB, Li TY, Colditz GA, Willett WC, Manson JE. Television watchingand other sedentary behaviors in relation to risk of obesity and type 2diabetes mellitus in women. JAMA. 2003;289:1785–1791.
41. World Health Organization. Definition, Diagnosis and Classification ofDiabetes Mellitus and Its Complications: Report of a WHO Consultation,Part 1: Diagnosis and Classification of Diabetes Mellitus. Geneva, Swit-zerland: World Health Organization; 1999:1–59.
42. Boronat M, Chirino R, Varillas VF, Saavedra P, Marrero D, Fabregas M,Novoa J. Prevalence of the metabolic syndrome in the island of GranCanaria: comparison of 3 major diagnostic proposals. Diabet Med. 2005;22:1751–1756.
CLINICAL PERSPECTIVEConsumption of soft drinks among children, adolescents, and middle-aged adults has risen in the United States and Europeduring the past 3 decades. Prior studies have shown a higher prevalence of obesity and diabetes mellitus in children whoconsume more soft drinks, although these associations are less clear for adults. We evaluated the relations of metabolicsyndrome and its components to soft drink consumption in Framingham participants. Cross-sectionally, individualsconsuming at least 1 soft drink per day had �50% higher prevalence of the metabolic syndrome than those consuming �1drink per day. During a follow-up period of �4 years, consumption of �1 soft drink per day was associated with a higherincidence of metabolic syndrome and a higher incidence of each of its components, ie, obesity, increased waistcircumference, impaired fasting glucose, higher blood pressure, hypertriglyceridemia, and low high-density lipoproteincholesterol. Analyses that used food frequency questionnaire data suggested that intake of �1 drink per day of eitherregular or diet soft drinks was associated with a �50% higher incidence of metabolic syndrome compared with intake of�1 soft drink per week. We conclude that consumption of more than 1 soft drink per day is associated with a higherprevalence and incidence of multiple metabolic risk factors in middle-aged adults. Our observational data raise thepossibility that public health measures to limit consumption of soft drinks may be associated with a lowering of the burdenof cardiometabolic risk factors in adults.
488 Circulation July 31, 2007
by guest on August 3, 2016http://circ.ahajournals.org/Downloaded from
Meigs, Ralph B. D'Agostino, J. Michael Gaziano and Ramachandran S. VasanRavi Dhingra, Lisa Sullivan, Paul F. Jacques, Thomas J. Wang, Caroline S. Fox, James B.
Metabolic Syndrome in Middle-Aged Adults in the CommunitySoft Drink Consumption and Risk of Developing Cardiometabolic Risk Factors and the
Print ISSN: 0009-7322. Online ISSN: 1524-4539 Copyright © 2007 American Heart Association, Inc. All rights reserved.
is published by the American Heart Association, 7272 Greenville Avenue, Dallas, TX 75231Circulation published online July 23, 2007;Circulation.
http://circ.ahajournals.org/content/early/2007/07/23/CIRCULATIONAHA.107.689935.citationWorld Wide Web at:
The online version of this article, along with updated information and services, is located on the
http://circ.ahajournals.org/content/suppl/2007/07/16/CIRCULATIONAHA.107.689935.DC1.htmlData Supplement (unedited) at:
http://circ.ahajournals.org//subscriptions/
is online at: Circulation Information about subscribing to Subscriptions:
http://www.lww.com/reprints Information about reprints can be found online at: Reprints:
document. Permissions and Rights Question and Answer this process is available in the
click Request Permissions in the middle column of the Web page under Services. Further information aboutOffice. Once the online version of the published article for which permission is being requested is located,
can be obtained via RightsLink, a service of the Copyright Clearance Center, not the EditorialCirculationin Requests for permissions to reproduce figures, tables, or portions of articles originally publishedPermissions:
by guest on August 3, 2016http://circ.ahajournals.org/Downloaded from