Perception of Neighborhood Crime and Drugs Increases Cardiometabolic Risk in Chilean Adolescents
6
Original article Perception of Neighborhood Crime and Drugs Increases Cardiometabolic Risk in Chilean Adolescents Suzanna M. Martinez, Ph.D., M.S. a, b, * , Estela Blanco, M.P.H., M.S. b , Jorge Delva, Ph.D. c , Raquel Burrows, M.D. d , Marcela Reyes, M.D., Ph.D. d , Betsy Lozoff, M.D. e , and Sheila Gahagan, M.D., M.P.H. b, e a Division of General Pediatrics, School of Medicine, University of California, San Francisco, San Francisco, California b Division of Child Development and Community Health, Department of Pediatrics, University of California, San Diego, San Diego, California c School of Social Work, University of Michigan, Ann Arbor, Michigan d Institute of Nutrition and Food Technology (INTA), University of Chile, Santiago, Chile e Center for Human Growth and Development, University of Michigan, Ann Arbor, Michigan Article history: Received May 23, 2013; Accepted October 30, 2013 Keywords: Chile; Neighborhood; Crime; Latent profile analysis (LPA); Cardiometabolic risk; Socioeconomic status; Adolescents A B S T R A C T Purpose: Studies report an association between neighborhood risk and both obesity and car- diometabolic risk factors (CMR) among adolescents. Here we describe the effect of perceived neighborhood risk on adiposity and CMR among Chilean adolescents. Methods: Participants were 523 low- to middle-income Chilean adolescents. We assessed neighborhood risk in early adolescence, adiposity in childhood and in early and later adolescence, and blood pressure and fasting glucose in later adolescence. Neighborhood risk profiles were estimated using latent profile analysis (LPA) and based on reported perceptions of crime and drug sales/use. Using linear and logistic regression, we examined the effect of neighborhood risk on adiposity and CMR. Results: Mean age in early and later adolescence was 14 and 17 years, respectively. Participants were 52% male, with a mean BMI z-score of .67, and 8% met criteria for metabolic syndrome. LPA identified two neighborhood profiles: 61% low risk and 39% high risk. In later adolescence, being in the high risk profile predicted a higher BMI z-score, waist-to-height ratio, and fat mass index (p < .05). Adolescents in the high risk profile had three times greater odds of meeting criteria for metabolic syndrome (OR ¼ 3.1, 95% CI: 1.5, 5.8) compared with those in the low risk profile. Conclusions: Our findings suggest that there are physiological responses to living in a neighbor- hood perceived as “risky,” which may contribute to obesity and CMR even in adolescence. For Chilean neighborhoods with high crime and drugs, targeted public health interventions and pol- icies for youth could be beneficial. Ó 2014 Society for Adolescent Health and Medicine. All rights reserved. IMPLICATIONS AND CONTRIBUTION Perceived neighborhood disadvantage, indepen- dent of socioeconomic status (SES), predicted higher body mass index (BMI), central adiposity, and metabolic syn- drome. The relationship be- tween disadvantage type and health may change throughout the life course. Perceptions of social environment can have deleterious health effects. It is well-established that socioeconomic status (SES) relates to health. Yet it remains unclear how neighborhood disadvantage damages health while accounting for personal SES and whether the effect of neighborhood disadvantage on health is contextual (neighborhood or collective SES) or compositional (personal or household SES) [1]. Studies in economically developed countries Disclaimer: The content is solely the responsibility of the authors and does not necessarily represent the official views of the National Institutes of Health. * Address correspondence to: Suzanna M. Martinez, Ph.D., M.S., Division of General Pediatrics, School of Medicine, UC San Francisco, 3333 California Street, Suite 245, San Francisco, CA 94118. E-mail address: [email protected] (S.M. Martinez). www.jahonline.org 1054-139X/$ e see front matter Ó 2014 Society for Adolescent Health and Medicine. All rights reserved. http://dx.doi.org/10.1016/j.jadohealth.2013.10.207 Journal of Adolescent Health 54 (2014) 718e723
-
Upload
independent -
Category
Documents
-
view
0 -
download
0
Transcript of Perception of Neighborhood Crime and Drugs Increases Cardiometabolic Risk in Chilean Adolescents

Journal of Adolescent Health 54 (2014) 718e723
www.jahonline.org
Original article
Perception of Neighborhood Crime and Drugs IncreasesCardiometabolic Risk in Chilean Adolescents
Suzanna M. Martinez, Ph.D., M.S. a,b,*, Estela Blanco, M.P.H., M.S. b, Jorge Delva, Ph.D. c,Raquel Burrows, M.D. d, Marcela Reyes, M.D., Ph.D. d, Betsy Lozoff, M.D. e, andSheila Gahagan, M.D., M.P.H. b,eaDivision of General Pediatrics, School of Medicine, University of California, San Francisco, San Francisco, CaliforniabDivision of Child Development and Community Health, Department of Pediatrics, University of California, San Diego, San Diego, Californiac School of Social Work, University of Michigan, Ann Arbor, Michigand Institute of Nutrition and Food Technology (INTA), University of Chile, Santiago, ChileeCenter for Human Growth and Development, University of Michigan, Ann Arbor, Michigan
Article history: Received May 23, 2013; Accepted October 30, 2013Keywords: Chile; Neighborhood; Crime; Latent profile analysis (LPA); Cardiometabolic risk; Socioeconomic status; Adolescents
A B S T R A C TIMPLICATIONS AND
Purpose: Studies report an association between neighborhood risk and both obesity and car-diometabolic risk factors (CMR) among adolescents. Here we describe the effect of perceivedneighborhood risk on adiposity and CMR among Chilean adolescents.Methods: Participants were 523 low- to middle-income Chilean adolescents. We assessedneighborhood risk in early adolescence, adiposity in childhood and in early and later adolescence,and blood pressure and fasting glucose in later adolescence. Neighborhood risk profiles wereestimated using latent profile analysis (LPA) and based on reported perceptions of crime and drugsales/use. Using linear and logistic regression, we examined the effect of neighborhood risk onadiposity and CMR.Results: Mean age in early and later adolescence was 14 and 17 years, respectively. Participantswere 52% male, with a mean BMI z-score of .67, and 8% met criteria for metabolic syndrome.LPA identified two neighborhood profiles: 61% low risk and 39% high risk. In later adolescence,being in the high risk profile predicted a higher BMI z-score, waist-to-height ratio, and fat massindex (p < .05). Adolescents in the high risk profile had three times greater odds of meetingcriteria for metabolic syndrome (OR ¼ 3.1, 95% CI: 1.5, 5.8) compared with those in the low riskprofile.Conclusions: Our findings suggest that there are physiological responses to living in a neighbor-hood perceived as “risky,” which may contribute to obesity and CMR even in adolescence. ForChilean neighborhoods with high crime and drugs, targeted public health interventions and pol-icies for youth could be beneficial.
� 2014 Society for Adolescent Health and Medicine. All rights reserved.
Disclaimer: The content is solely the responsibility of the authors and does notnecessarily represent the official views of the National Institutes of Health.* Address correspondence to: Suzanna M. Martinez, Ph.D., M.S., Division of
General Pediatrics, School of Medicine, UC San Francisco, 3333 California Street,Suite 245, San Francisco, CA 94118.
E-mail address: [email protected] (S.M. Martinez).
1054-139X/$ e see front matter � 2014 Society for Adolescent Health and Medicine. All rights reserved.http://dx.doi.org/10.1016/j.jadohealth.2013.10.207
CONTRIBUTION� Perceived neighborhooddisadvantage, indepen-dent of socioeconomicstatus (SES), predictedhigher body mass index(BMI), central adiposity,and metabolic syn-drome.
� The relationship be-tween disadvantagetype and health maychange throughout thelife course.
� Perceptions of socialenvironment can havedeleterious healtheffects.
It is well-established that socioeconomic status (SES) relatesto health. Yet it remains unclear how neighborhood disadvantagedamages health while accounting for personal SES and whetherthe effect of neighborhood disadvantage on health is contextual(neighborhood or collective SES) or compositional (personal orhousehold SES) [1]. Studies in economically developed countries

S.M. Martinez et al. / Journal of Adolescent Health 54 (2014) 718e723 719
have demonstrated an effect of neighborhood contextual factorson adult health independent of individual SES [2,3]. In devel-oping countries, this relationship remains understudied butnevertheless important.
In the United States, United Kingdom, and Canada, studieshave shown a relationship between the environment and bothobesity and cardiometabolic risk factors (CMR), includingmetabolic syndrome (MetS), dyslipidemia, and hypertension[4e6]. Many studies have focused on the built environment andresidential factors, while few have accounted for neighborhoodcontext and social interactions such as perceptions about crime,safety, and risk behaviors. Neighborhoods with high levels ofdisorder, such as crime, danger, drug use, and public drinking,have been associated with poor health in residents even aftercontrolling for individual SES [4]. Thus, it is these neighborhoodperceptions that may directly or indirectly influence health.Studies show that individuals who feel less threatened byneighborhood crime are less likely to be hypertensive [7] andthose who feel threatened are at increased risk for high BMI andheart disease [8]. To understand relationships between neigh-borhood factors and health, it is important to incorporateneighborhood perceptions as a measure of risk, which as a col-lective social factor could impair health. Chile is a middle-incomecountry with one of the most uneven distributions of wealth inthe world [9]. Similar to large metropolitan areas, Santiago,Chile’s capital, has a higher crime rate than that of Chile overall:29% of households reported having a member be a victim of acrime in Santiago, compared with 26% overall for 2012 [10]. Froma list of national problems, crime combined with drug traffickingwas the problem most frequently rated as “important” by San-tiago residents (24.3% of residents), just ahead of poverty (23.5%)[10]. Income inequality has been examined in Chile, withresearch providing some evidence that community differencesmay be related to self-reported poor health [9]. In addition,obesity has reached high proportions comparable to those of theUnited States, putting Chileans at risk for developing CMR [11].
Most of the literature pertaining to neighborhood context andcardiovascular health is limited for several reasons. First, moststudies have focused on self-reported weight and health out-comes. Only a few studies considered CMR. For example, in arecent review [2] of 75 studies in developed countries, 63examined obesity (48 based on self-report), 12 considered hy-pertension (six based on self-report), four considered diabetes(three based on self-report), four considered dyslipidemia (onebased on self-report), and three considered MetS. Second, moststudies have been conducted in adult populations. In the samereview by Leal and Chaix, only a third of the 75 studies wereconducted with children and adolescents, none of whichincluded direct measures of weight. All 75 studies focused onneighborhood context and weight status, with half finding thatneighborhood disadvantage related to a higher BMI. To date,there are no longitudinal studies examining the relationshipbetween neighborhood context, CMR, and objectively measuredweight status in adolescent populations. If neighborhooddisadvantage can accelerate the progression of poor health ordisease-related health outcomes, it is important to examine thelongitudinal nature of this relationship to prevent the accelera-tion of these negative health outcomes in adulthood.
The purpose of this study was to examine the relationshipbetween perceived neighborhood crime and drug use andmeasured BMI, waist circumference, blood pressure, and MetSwhile accounting for overall household SES in a longitudinal
cohort study of adolescents in Santiago, Chile. We used latentprofile analysis to group adolescents of low- to middle-incomebackgrounds by neighborhood characteristicsdhigh risk versuslow risk. We hypothesized that obesity and CMR would be worsein adolescents of a high risk neighborhood profile.
Methods
Study cohort and setting
The current study sample included 535 adolescent partici-pants of low- to middle-income backgrounds in Santiago, Chile.Adolescents and their mothers (or caregivers) were participantsin an ongoing longitudinal cohort study, which began as an ironanemia deficiency (IDA) preventive trial between 1991 and 1996[12]. Healthy infants were recruited from four contiguous low-to-middle income, working-class, communities located in thesouthern part of Santiago (n¼ 1,657). These neighborhoods wereselected based on their close proximity to the research site, theInstitute for Nutrition and Food Technology (INTA), University ofChile. Details about the enrollment and trial have been previ-ously described [12]. Between 2005 and 2012, the cohortparticipated in a follow-up of the IDA study at 10 years and 16years and in two other studies: one related to substance use andneighborhood characteristics in early adolescence (between theages of 12 and 15 years) and the other related to cardiovascularrisk in late adolescence (between the ages of 16 and 18 years). Inlate adolescence, we invited a randomly selected subset of 888adolescents to participate, of whom 679 participants wereassessed (76%).
Study design
Our study sample included 535 cohort participants who wereassessed at three time points, occurring between 2005 and 2012.For this study, we used data collected at each of these three timepoints. At 10 years and in early adolescence, assessments werecompleted by a nurse and research psychologists and in lateradolescence by physicians. This study was approved by theInstitutional Review Boards at INTA, the University of Michigan,and the University of California, San Diego.
Exposure: Neighborhood risk
Adolescents’ subjective perception of their neighborhood wasassessed using three questions on neighborhood crime and druguse from the National Survey of American Life: AdolescentQuestionnaire [13]. The questions were on a 5-point scale. Weasked: “Howoften are there problemswithmuggings, burglaries,assaults or anything else like that in your neighborhood?” withresponse options ranging from “very often” to “never”; “Howmuch of a problem is the selling and use of drugs in yourneighborhood?” with response categories “very serious” to“never”; “During the past 12 months, how often have you seenpeople selling illegal drugs in your neighborhood?” withresponse categories “almost every day” to “never.”We coded thequestions to reflect that higher scores represented more neigh-borhood risk. Questions were pilot tested with participants priorto commencing the study for comprehension, face validity, andlanguage equivalence. Youth reported understanding the ques-tions and response categories.

Table 1Characteristics of low- to middle-income adolescents in Santiago, Chile, overalland by neighborhood profilea
Overalln ¼ 535
Low riskn ¼ 319
High riskn ¼ 216
Cardiometabolic risk factorsFemale, (%) 48.2 53.3 40.7Overweight/obese at 14 y, (%)* 38.0 36.5 40.4Overweight/obese at 17 y, (%) 37.8 35.1 41.7BMI z-score at 10 y .8 (1.0) .8 (.9) .8 (1.0)BMI z-score at 14 y .7 (1.0) .6 (.9) .7 (.9)BMI z-score at 17 y .7 (1.2) .5 (1.1) .8 (1.2)Meets MetS criteria, (%)* 8.4 5.2 13.2BP �90th percentile, (%) 12.1 10.3 14.8DBP �90th percentile, (%)* 7.1 .04 11.6SBP �90th percentile, (%) 8.4 7.5 9.7Waist:height (cm)* .4 (.1) .4 (.1) .5 (.1)Fat mass index 7.2 (3.9) 7.1 (3.8) 7.5 (4.2)
Socioeconomic statusOverall SES z-score �.03 (1.0) .02 (1.0) �.11 (.8)
BMI ¼ body mass index; BP ¼ blood pressure; DBP ¼ diastolic blood pressure;MetS¼metabolic syndrome; SBP¼ systolic blood pressure; SES¼ socioeconomicstatus.
a Values are mean (SD) or %.* p< .05, t-test or Chi-square test of differences between neighborhood profile.
S.M. Martinez et al. / Journal of Adolescent Health 54 (2014) 718e723720
Outcomes: Cardiometabolic risk factors
We examined five CMR and biomarkers: body mass index z-score (BMI), waist-to-height ratio (WHtR), fat mass index (FMI),MetS, and blood pressure (BP) �90th percentile. Anthropometryand blood pressure were measured in later adolescence (be-tween 16 and 18 years) by two trained physicians. Weight andheight were assessed in duplicate with a Precision Hispana scaleand a stadiometer accurate to .1 kg and .1 cm, respectively. Par-ticipants were measured without shoes, wearing underwear, inthe Frankfurt position. Blood pressure was also measured twice.If first and second measurements did not match for height,weight, and BP, the measurements were repeated. BMI z-scoreswere calculated usingWorld Health Organization (WHO) growthstandards, which adjust for age and sex. WHtR was calculated aswaist (cm) divided by height (cm) and used as a measure ofcentral adiposity. WHtR is an effective way of measuringabdominal adiposity in youth [14]. BP �90th percentile wasdefined as a systolic or diastolic BP �90th percentile for age, sex,and height [15]. Total fat mass was assessed using Lunar ProdigyDual Energy X-Ray Absorptiometry scan (DXA; GE Healthcare,Madison, WI). We used the Cook criteria for MetS [16], having�3of the following 5 factors: elevated blood pressure, a low high-density lipoprotein cholesterol level, a high triglyceride level, ahigh fasting glucose level, and abdominal obesity, which areadjusted for age and sex [17]. All participants were measuredaccording to standard protocols on the same machine calibratedevery other day. Fat mass index was calculated (fat mass [kg]/height2 [m2]).
Covariates
We considered the following covariates: sex, age, BMI at age10 years and in early adolescence, and maternal BMI (measuredwhen participants were 10 years old). The parent completed amodified Graffar index, which assessed SES [18]. We used the 13items to obtain a composite score using a linear combination ofthe mother’s completed years of education, the father’scompleted years of education, maximum level of combinedoccupational prestige of the mother and father, and family in-come. SES was standardized so that it had a mean of zero and astandard deviation of 1, with higher values representing higherSES. The created variable was labeled overall (household) SES.
Statistical analyses
We used PASW/SPSS (Version 18; Chicago, IL) to determinedescriptive statistics such as frequencies, means, and standarddeviations.
Latent profile analysis, an exploratory technique, was used tocreate neighborhood risk profiles using the items describedabove. The first step involved fitting a one-profile model to thedata to establish a baseline. We tested latent profile solutions ofone to three profiles. Models were compared in order to examinethe best fit to the data, using the following fit indices: the AkaikeInformation Criterion (AIC) [19], the Bayesian Information Cri-terion (BIC) [20], the Adjusted BIC (ABIC) [21], and a boot-strapped LoeMendelleRubin Test (LMRT) [22]. Sample sizes, andinterpretability of the profiles determined the number of latentprofiles. These indices allow for the comparison of non-nestedmodels and for the selection of the true model when thatmodel is a candidate, and minimize useful risk functions when
the true model is not a candidate. Smaller AIC, BIC, and ABICvalues, and a significant LMRT test (i.e., p < .05) indicated the“higher profile” solution fit the data better (e.g., two-profilebetter than one-profile). Lastly, an entropy value approaching1.0 was used to indicate a clear distinction between profiles [23].Because there is no criterion for “good” fit, these values wereuseful when comparing two or more models.
The estimated profiles were examined for group differencesusing independent t-tests and Chi-square tests. We performed across-sectional analysis to examine the relationship betweenneighborhood profile and BMI in early adolescence, controllingfor previous BMI at age 10 years. Longitudinal analyses wereperformed to examine the effect of neighborhood risk profile onhealth outcomes in later adolescence. Although we assessed theimpact of neighborhood risk on meeting MetS criteria, we alsoexamined neighborhood risk independently with WHtR and BPto understand the impact of neighborhood risk on each outcome.Multivariate linear regression models were estimated for eachcontinuous health outcome: BMI z-score, WHtR, and FMI. Lo-gistic regression was employed to explore odds of MetS and BP�90th percentile. All models controlled for household SES, sex,age, BMI at 10 and 14 years old, and maternal BMI. BMI at age 10years was controlled for in early adolescence, with BMI at 14years of age being controlled for in later adolescence. Overall SESwas included in all models; age in models of waist:height; andsex in models of waist:height and BP. Maternal BMI wascontrolled for in all weight-related models. All statistics wereperformed using a p value significant at p < .05. All LPA andmultivariate analyses were performed using the MPlus 6 soft-ware (Muthen & Muthen). For multivariate analyses we reportstandardized betas.
Results
A summary of participant characteristics is provided inTable 1. Fifty-four percent of participants were male. Participantswere, on average, 14 years old in early adolescence and 17 yearsold in later adolescence. At both time points, the mean BMI z-score was .7, with over a third being classified as overweight/
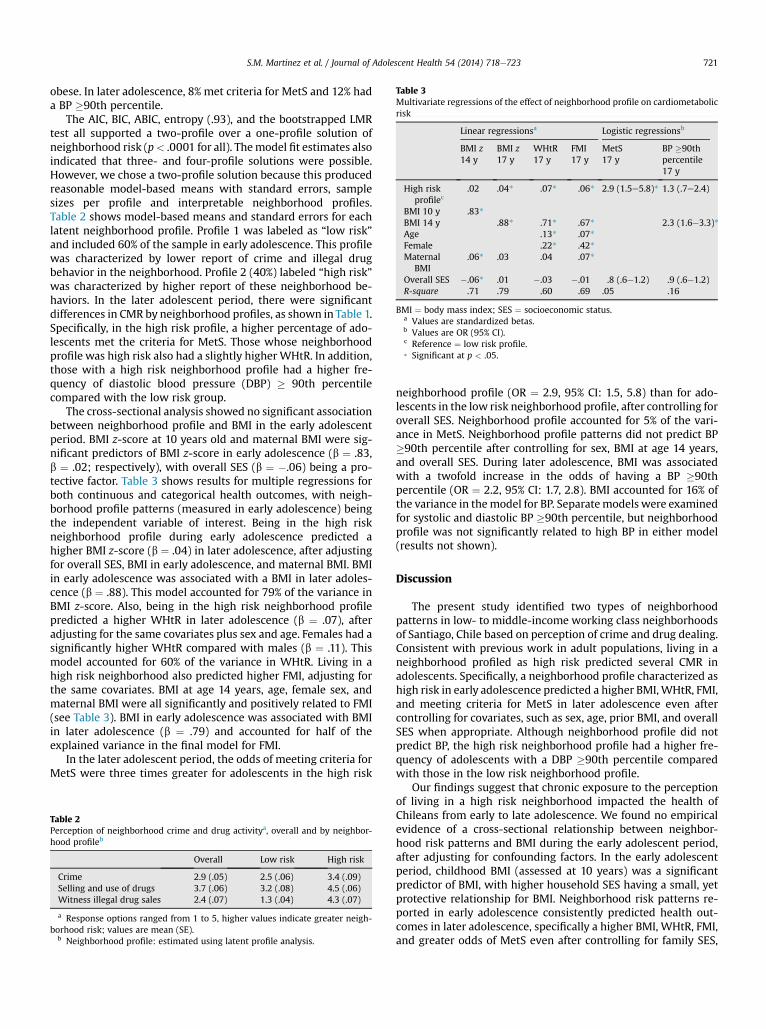
Table 3Multivariate regressions of the effect of neighborhood profile on cardiometabolicrisk
Linear regressionsa Logistic regressionsb
BMI z14 y
BMI z17 y
WHtR17 y
FMI17 y
MetS17 y
BP �90thpercentile17 y
High riskprofilec
.02 .04* .07* .06* 2.9 (1.5e5.8)* 1.3 (.7e2.4)
BMI 10 y .83*BMI 14 y .88* .71* .67* 2.3 (1.6e3.3)*Age .13* .07*Female .22* .42*Maternal
BMI.06* .03 .04 .07*
Overall SES �.06* .01 �.03 �.01 .8 (.6e1.2) .9 (.6e1.2)R-square .71 .79 .60 .69 .05 .16
BMI ¼ body mass index; SES ¼ socioeconomic status.a Values are standardized betas.b Values are OR (95% CI).c Reference ¼ low risk profile.* Significant at p < .05.
S.M. Martinez et al. / Journal of Adolescent Health 54 (2014) 718e723 721
obese. In later adolescence, 8% met criteria for MetS and 12% hada BP �90th percentile.
The AIC, BIC, ABIC, entropy (.93), and the bootstrapped LMRtest all supported a two-profile over a one-profile solution ofneighborhood risk (p< .0001 for all). Themodel fit estimates alsoindicated that three- and four-profile solutions were possible.However, we chose a two-profile solution because this producedreasonable model-based means with standard errors, samplesizes per profile and interpretable neighborhood profiles.Table 2 shows model-based means and standard errors for eachlatent neighborhood profile. Profile 1 was labeled as “low risk”and included 60% of the sample in early adolescence. This profilewas characterized by lower report of crime and illegal drugbehavior in the neighborhood. Profile 2 (40%) labeled “high risk”was characterized by higher report of these neighborhood be-haviors. In the later adolescent period, there were significantdifferences in CMR by neighborhood profiles, as shown in Table 1.Specifically, in the high risk profile, a higher percentage of ado-lescents met the criteria for MetS. Those whose neighborhoodprofile was high risk also had a slightly higher WHtR. In addition,those with a high risk neighborhood profile had a higher fre-quency of diastolic blood pressure (DBP) � 90th percentilecompared with the low risk group.
The cross-sectional analysis showed no significant associationbetween neighborhood profile and BMI in the early adolescentperiod. BMI z-score at 10 years old and maternal BMI were sig-nificant predictors of BMI z-score in early adolescence (b ¼ .83,b ¼ .02; respectively), with overall SES (b ¼ �.06) being a pro-tective factor. Table 3 shows results for multiple regressions forboth continuous and categorical health outcomes, with neigh-borhood profile patterns (measured in early adolescence) beingthe independent variable of interest. Being in the high riskneighborhood profile during early adolescence predicted ahigher BMI z-score (b ¼ .04) in later adolescence, after adjustingfor overall SES, BMI in early adolescence, and maternal BMI. BMIin early adolescence was associated with a BMI in later adoles-cence (b ¼ .88). This model accounted for 79% of the variance inBMI z-score. Also, being in the high risk neighborhood profilepredicted a higher WHtR in later adolescence (b ¼ .07), afteradjusting for the same covariates plus sex and age. Females had asignificantly higher WHtR compared with males (b ¼ .11). Thismodel accounted for 60% of the variance in WHtR. Living in ahigh risk neighborhood also predicted higher FMI, adjusting forthe same covariates. BMI at age 14 years, age, female sex, andmaternal BMI were all significantly and positively related to FMI(see Table 3). BMI in early adolescence was associated with BMIin later adolescence (b ¼ .79) and accounted for half of theexplained variance in the final model for FMI.
In the later adolescent period, the odds of meeting criteria forMetS were three times greater for adolescents in the high risk
Table 2Perception of neighborhood crime and drug activitya, overall and by neighbor-hood profileb
Overall Low risk High risk
Crime 2.9 (.05) 2.5 (.06) 3.4 (.09)Selling and use of drugs 3.7 (.06) 3.2 (.08) 4.5 (.06)Witness illegal drug sales 2.4 (.07) 1.3 (.04) 4.3 (.07)
a Response options ranged from 1 to 5, higher values indicate greater neigh-borhood risk; values are mean (SE).
b Neighborhood profile: estimated using latent profile analysis.
neighborhood profile (OR ¼ 2.9, 95% CI: 1.5, 5.8) than for ado-lescents in the low risk neighborhood profile, after controlling foroverall SES. Neighborhood profile accounted for 5% of the vari-ance in MetS. Neighborhood profile patterns did not predict BP�90th percentile after controlling for sex, BMI at age 14 years,and overall SES. During later adolescence, BMI was associatedwith a twofold increase in the odds of having a BP �90thpercentile (OR ¼ 2.2, 95% CI: 1.7, 2.8). BMI accounted for 16% ofthe variance in themodel for BP. Separatemodels were examinedfor systolic and diastolic BP �90th percentile, but neighborhoodprofile was not significantly related to high BP in either model(results not shown).
Discussion
The present study identified two types of neighborhoodpatterns in low- to middle-income working class neighborhoodsof Santiago, Chile based on perception of crime and drug dealing.Consistent with previous work in adult populations, living in aneighborhood profiled as high risk predicted several CMR inadolescents. Specifically, a neighborhood profile characterized ashigh risk in early adolescence predicted a higher BMI,WHtR, FMI,and meeting criteria for MetS in later adolescence even aftercontrolling for covariates, such as sex, age, prior BMI, and overallSES when appropriate. Although neighborhood profile did notpredict BP, the high risk neighborhood profile had a higher fre-quency of adolescents with a DBP �90th percentile comparedwith those in the low risk neighborhood profile.
Our findings suggest that chronic exposure to the perceptionof living in a high risk neighborhood impacted the health ofChileans from early to late adolescence. We found no empiricalevidence of a cross-sectional relationship between neighbor-hood risk patterns and BMI during the early adolescent period,after adjusting for confounding factors. In the early adolescentperiod, childhood BMI (assessed at 10 years) was a significantpredictor of BMI, with higher household SES having a small, yetprotective relationship for BMI. Neighborhood risk patterns re-ported in early adolescence consistently predicted health out-comes in later adolescence, specifically a higher BMI, WHtR, FMI,and greater odds of MetS even after controlling for family SES,

S.M. Martinez et al. / Journal of Adolescent Health 54 (2014) 718e723722
prior BMI, and other covariates. These findings suggest that inchildhood and early adolescence the relationship between beingsocioeconomically disadvantaged and obesity is compositional(i.e., related to household-level factors). However, as adolescentsgain independence and freedom to navigate their neighborhoodthis relationship may become contextual (i.e., related toneighborhood/environmental-level factors).
Other possibilities of the neighborhood effect could relate toits influence on physical activity. We did not examine physicalactivity as a risk factor of CMR and obesity, but it is well-established that physical activity declines with age, even withinadolescence. The decline in physical activity during adolescence,perhaps due to peer influence, coupled with neighborhood riskmay take a toll on adolescent health over time. Studies consis-tently show that in low-income neighborhoods, with high levelsof disorder, children are less physically active [24,25]. In somedeveloping countries and urban areas elsewhere, parents do notallow children to play outside unsupervised due to crime. Ifchildren do not learn to be physically active early on, it is unlikelythat they will become physically active in adolescence. This maybe the case in Santiago where low levels of physical activity arereported among children [26]. In our sample, parents may havebeen less encouraging of outdoor activities due to high levels ofcrime and illicit behaviors involving drug use and sales.Furthermore, as adolescents developed their own awareness andperceptions of their neighborhood, their risk perceptions couldhave acted as a barrier to physical activity, particularly in riskierneighborhoods with limited facilities and resources for physicalactivity. Additionally, recent statistics estimated that air pollu-tion levels in Santiago were high in comparison with those inNorth America [27], which may decrease opportunities forphysical activity. Lastly, peer influence on diet could haveresulted in poor nutrition. Over time these factors could havesimultaneous and negative effects on adolescent health.
A potential weakness of the current study is that the samplewas constrained to low- to middle-income Chilean adolescentsliving in an urban setting of Santiago, Chile. Therefore, ourfindings may not generalize to rural or high-income Chileanpopulations. Additionally, our measure of “neighborhood risk”may not represent perceived neighborhood risk. Actual crimestatistics may have been more reliable. In Chile, however,perception and reported safety are not always in agreement. Inthe 2011 National Survey of Urban Citizen Safety, 43% of Santiagoresidents reported perceiving themselves as a victim of a crime inthe next year, yet the 2012 survey revealed that 29% reportedbeing a victim of a crime, indicating that Santiago residentsperceive themselves to be more vulnerable than the actualdocumented crime statistics imply [10]. Thus, using perceivedneighborhood risk as a predictor is a strength for several reasons.First, perceived neighborhood risk may have captured a betterpicture of neighborhood crime and drug use as residents aremore aware of the daily hassles in their surrounding environ-ment than researchers who may not be privy to such issuesduring field observations. Additionally, perceived danger hasbeen related to stress reaction and decreased opportunity tobeing outdoors [28,29]. In this vein, we assessed social in-teractions as a measure of neighborhood context, which isunderstudied in the area of neighborhood disadvantage andCMR. This study also contributes to the growing literature onadolescent health in developing countries, specifically in Chilewhere obesity is a concern. Amajor strength of this studywas theuse of objective measures for health outcomes and repeated
measures of adiposity. As such, we were able to control for pastand current weight status. We also controlled for household SES,which allowed us to examine contextual and compositional re-lationships between neighborhood socioeconomic characteris-tics and adolescent health.
A major strength of the study is the longitudinal design,allowing us to establish temporal precedence. Adolescents wereasked about their neighborhood two to three years before thehealth assessments occurred. We found that a high risk neigh-borhood profile significantly predicted worse health outcomesrelated to adiposity. Thus, these data provide evidence that thenegative perceptions of one’s social environment can haveserious and deleterious health effects on adolescents. Strategiesto decrease crime and drug dealing in neighborhoods couldresult in improved adolescent health outcomes. Such efforts,however, require resources that are often unavailable. Thus, ourfindings suggest that clinicians and public health practitionersshould consider neighborhood risk as a sign of vulnerability forincreased obesity and CMR. As such, practitioners may moreeffectively address making healthy lifestyle choices to engage inhealth-protective behaviors.
Acknowledgments
This research was funded by R01HL088530 (NIH-NHLBI, PI:Gahagan); R01HD33487 (NIH-NICHD, PIs: Lozoff and Gahagan);R01DA021181 (NIH-NIDA, PI: Delva). The first author acknowl-edges D. Eastern Kang Sim for his support. All authors would liketo thank the study participants for their on-going commitment tothe project.
References
[1] Ross CE, Mirowsky J. Neighborhood socioeconomic status and health:Context or composition? City & Community 2008;7:163e79.
[2] Leal C, Chaix B. The influence of geographic life environments on car-diometabolic risk factors: A systematic review, a methodological assess-ment and a research agenda. Obes Rev 2011;12:217e30.
[3] Ludwig J, Sanbonmatsu L, Gennetian L, et al. Neighborhoods, obesity, anddiabetesdA randomized social experiment. N Engl JMed 2011;365:1509e19.
[4] Laraia BA, Karter AJ, Warton EM, et al. Place matters: Neighborhooddeprivation and cardiometabolic risk factors in the Diabetes Study ofNorthern California (DISTANCE). Soc Sci Med 2012;74:1082e90.
[5] White HL, Matheson FI, Moineddin R, et al. Neighbourhood deprivation andregional inequalities in self-reported health among Canadians: Are weequally at risk? Health & Place 2011;17:361e9.
[6] Fraser LK, Edwards KL, Tominitz M, et al. Food outlet availability, depri-vation and obesity in a multi-ethnic sample of pregnant women in Brad-ford. UK. Soc Sci Med 2012;75:1048e56.
[7] Mujahid MS, Roux AVD, Morenoff JD, et al. Neighborhood characteristicsand hypertension. Epidemiology 2008;19:590e8.
[8] Mobley LR, Root ED, Finkelstein EA, et al. Environment, obesity, and car-diovascular disease risk in low-income women. Am J Prev Med 2006;30:327e332.e1.
[9] Subramanian SV, Delgado I, Jadue L, et al. Income inequality and health:Multilevel analysis of Chilean communities. J Epidemiol Community Health2003;57:844e8.
[10] Encuesta Nacional Urbana de Seguridad Ciudadana (ENUSC 2012)dMin-isterio del Interior y Seguridad Pública. Available at: http://www.dsp.gov.cl/enusc_2012.html. Accessed on September 16, 2013.
[11] de Onis M, Blossner M. Prevalence and trends of overweight among pre-school children in developing countries. Am J Clin Nutr 2000;72:1032e9.
[12] Lozoff B, De Andraca I, Castillo M, et al. Behavioral and developmentaleffects of preventing iron-deficiency anemia in healthy full-term infants.Pediatrics 2003;112:846e54.
[13] National Survey of American Life: Adolescent questionnaire. Availableat: http://www.rcgd.isr.umich.edu/prba/questionnaires/nsaladolqn.pdf.Accessed on October 19, 2013.
[14] Savva SC, Tornaritis M, Savva ME, et al. Waist circumference and waist-to-height ratio are better predictors of cardiovascular disease risk factors inchildren than body mass index. Int J Obes 2000;24:1453e8.

S.M. Martinez et al. / Journal of Adolescent Health 54 (2014) 718e723 723
[15] National High Blood Pressure Education Program Working Group on HighBlood Pressure in Children and Adolescents. The fourth report on thediagnosis, evaluation, and treatment of high blood pressure in children andadolescents. Pediatrics 2004;114(Suppl. 2):555e76.
[16] Cook S, Weitzman M, Auinger P, et al. Prevalence of metabolic syndromephenotype in adolescents: Findings from the third National Health andNutrition Examination Survey. Arch Pediatr Adolesc Med 2003;157:821e7.
[17] Fernández J, Redden D, Pietrobelli A, Allison D. Waist circumference per-centiles in nationally representative samples of African-American, Euro-pean-American, and Mexican-American children and adolescents.Pediatrics 2004;145:439e44.
[18] Graffar M. Une methode de clasificacion sociale d’echantillons de popula-tion. Courier 1956;6:455e9.
[19] Akaike H. Factor-analysis and AIC. Psychometrika 1987;52:317e32.[20] Schwarz G. Estimating dimension of a model. Ann Stat 1978;6:461e4.[21] Sclove SL. Application of model-selection criteria to some problems in
multivariate-analysis. Psychometrika 1987;52:333e43.[22] Nylund KL, Asparoutiov T, Muthen BO. Deciding on the number of classes
in latent class analysis and growth mixture modeling: A Monte Carlosimulation study. Struct Equ Modeling 2007;14:535e69.
[23] Celeux G, Soromenho G. An entropy criterion for assessing the number ofclusters in a mixture model. J Classification 1996;13:195e212.
[24] Binns HJ, Forman JA, Karr CJ, et al. The built environment: Designingcommunities to promote physical activity in children. Pediatrics 2009;123:1591e8.
[25] Kerr J, Rosenberg D, Sallis JF, et al. Active commuting to school: Associa-tions with environment and parental concerns. Med Sci Sports Exerc 2006;38:787e94.
[26] Liberona Y, Castillo O, Engler V, et al. Nutritional profile of school childrenfrom different socio-economic levels in Santiago, Chile. Public Health Nutr2011;14:142e9.
[27] Cakmak S, Dales RE, Vidal CB. Air pollution and mortality in Chile: Sus-ceptibility among the elderly. EHP 2007;115:524e7.
[28] Franzini L, Taylor W, Elliott MN, et al. Neighborhood characteristicsfavorable to outdoor physical activity: Disparities by socioeconomic andracial/ethnic composition. Health & Place 2010;16:267e74.
[29] Steptoe A, Feldman PJ. Neighborhood problems as sources of chronicstress: Development of a measure of neighborhood problems, and associ-ations with socioeconomic status and health. Ann Behav Med 2001;23:177e85.