Socio-economic Assessment to Identify the Poor in Pilot Areas ...
122
Support to the Health, Nutrition and Population Sector Programme in Bangladesh BMZ-No.: 2003 66 237 / 2005 70 424 Component A: Health Financing Component Socio-Economic Assessment to identify the Poor in Pilot Areas and Baseline Studies on Willingness to Pay, Health Seeking Behaviour, Health Expenses (OOP) and Patient Satisfaction June 2012 Presented to: Ministry of Health and Family Welfare Health Economics Unit Dhaka-1215 Bangladesh KfW Entwicklungsbank Abt. L I b Palmengartenstr. 5-9 60325 Frankfurt am Main Germany
-
Upload
khangminh22 -
Category
Documents
-
view
0 -
download
0
Transcript of Socio-economic Assessment to Identify the Poor in Pilot Areas ...
Support to the Health, Nutrition and Population Sector Programme
in Bangladesh BMZ-No.: 2003 66 237 / 2005 70 424
Component A:
Health Financing Component
Socio-Economic Assessment to identify the Poor in Pilot Areas and Baseline Studies on
Willingness to Pay, Health Seeking Behaviour, Health Expenses (OOP) and Patient Satisfaction
June 2012
Presented to:
Ministry of Health and Family Welfare Health Economics Unit Dhaka-1215 Bangladesh
KfW Entwicklungsbank Abt. L I b Palmengartenstr. 5-9 60325 Frankfurt am Main Germany
Socio-economic Assessment to Identify the Poor in Pilot Areas and Baseline Studies on
Willingness to Pay, Health Seeking Behaviour, Health Expenses and Patient Satisfaction
Prepared for
Health Economics Unit Ministry of Health & Family Welfare
14/2 Topkhana Road Dhaka-1000, Bangladesh
Prepared by
Abul Barkat1 Matiur Rahman2 Rumana Huque3 Murtaza Majid2 Avijit Poddar2
Golam Mahiyuddin2 Muhammad Badiuzzaman4
House 5, Road 8, Mohammadia Housing Society, Mohammadpur, Dhaka 1207, Bangladesh
Phone: (88 02) 811 6972, 815 7621, Fax: (88 02) 8157620 E-mail: [email protected], [email protected], Web: www.hdrc-bd.com
Dhaka: June 2012
___________________________________________________________________________________
>1 Professor and Chair, Department of Economics, University of Dhaka; Chief Advisor (Hon.),HDRC & Study Team Leader >2 Senior Consultant, Human Development Research Centre >3 Associate Professor, Department of Health Economics, University of Dhaka >4 Consultant, Human Development Research Centre
Acknowledgement Sasthyo Shuroksha Karmasuchi (SSK) is a new initiative taken by Ministry of Health and Family Welfare (MoHFW) to introduce a national health insurance scheme to be piloted in three Upazilas (sub-district) from three districts under Chittagong, Dhaka and Khulna division of Bangladesh. Designing of health insurance scheme is a crucial phase before implementation of such initiatives. This study has generated an extensive knowledge base on poor identification strategy, health seeking behaviour, health care expenditure, willingness to pay and patient satisfaction.
In terms of complexity, volume, extent of issues covered and very short time span this study has been a challenging and not-easy-to accomplish endeavour. It is an outcome of team effort of the consultants of Human Development Research Centre (HDRC), the GFA consulting group and Health Economics Unit of MoHFW. We are thankful to GFA consulting group for entrusting us with the responsibility to conduct the study under the auspices of HDRC.
We are immensely grateful to Mr. Prosanto Bhusan Barua, Additional Secretary and Former Chief, Health Economics Unit, MoHFW for his contribution in finalising study methodology. We express our gratitude to Md. Ashadul Islam, Joint Chief, Health Economics Unit, MoHFW for his valuable remarks on the draft report. We are also thankful to Mr. Md. Hafizur Rahman, Deputy Chief, Health Economics Unit, MoHFW and Dr. Ahmed Mustafa, Senior Assistant Chief (Health Economist), Health Economics Unit, MoHFW for their valuable inputs and suggestions in designing study methodology and finalising data collection instruments.
We express our sense of deep gratitude to Mr. Lars Chr. Kyburg, team leader, Health Financing Technical Assistance, GFA Consulting Group, Health Economics Unit, MoHFW for his sincere cooperation extended throughout the study. We gratefully acknowledge the contribution of Pulak Priya Mutsuddy, National Expert (Health Economist), Health Financing Technical Assistance, GFA Consulting Group, Health Economics Unit, MoHFW. We are truly grateful to Mr. Md. Azmal Kabir, Research Coordinator, Health Financing Technical Assistance, GFA Consulting Group, Health Economics Unit, MoHFW for his earnest cooperation extended throughout the study. We are thankful to Mr. Habibur Rahman, Senior Programme Manager, KfW office Dhaka for his comments on the findings of the draft report.
We are thankful to all the participants in the Workshop on Shahthyo Suroksha Karmashuchi held at Ruposhi bangle Hotel on 20 June, 2012 for their valuable comments and remarks towards the study findings.
We are sincerely indebted to those households who participated in this study by providing necessary information at the time of data collection. We are also grateful to patients who participated in exit patient survey at the health facilities. Our special thanks go to the doctors of Upazila Health Complex (UHC) and Union Health and Family Welfare Centre (UH&FWC) and local government institutions’ representatives who shared their thought and opinion pertaining to the existing health facility management and its’ improvement.
We are indeed grateful to the Research Associates, technical and support staff of HDRC, and all the field staffs worked in data collection process for this study.
All our efforts with this study would really be fruitful on the day when poor people would be able to get health services easily.
Abul Barkat, Ph.D Dhaka: 24 June, 2012 Professor of Economics, University of Dhaka & Team Leader of the Study
ABBRIVIATIONS
ARI Acute Respiratory Infection BBS Bangladesh Bureau of Statistic BDHS Bangladesh Demographic and Health Survey BDT Bangladesh Taka BMMS Bangladesh Maternal Health Services & Mortality Survey BNHA Bangladesh National Health Accounts BPL Below Poverty Line CBN Cost of Basic Need CC Community Clinic CHC Community Health Clinic DCI Data Collection Instrument DSF Demand Side Financing FE Field Enumerator FGD Focus Group Discussion FI Field Investigator FS Field Supervisor FWV Family Welfare Visitor HDRC Human Development Research Centre HEU Health Economics Unit HH Household HIES Household Income and Expenditure Survey KII Key Informant Interview LGI Local Government Institution MICS Multiple Indicator Cluster Survey MOHFW Ministry of Health and Family Welfare NGO Non-Government Organization NHA National Health Account NHE National Health Expenditure OR Odds Ratio OOP Out of Pocket Payment PCA Principal Component Analysis PHC Primary Healthcare Center PPS Probability Proportionate to Size PRA Participatory Rapid Appraisal PSU Primary Sample Unit QCO Quality Control Officer RD Rural Dispensary SACMO Sub-assistant Community Medical Officer SSK Sasthyo Shuroksha Karmasuchi SSNP Social Safety Net Programme STD Sexually Transmitted Diseases STI Sexually Transmitted Infection THE Total Health Expenditure TK. Taka ToR Terms of Reference UH&FPO Upazila Health & Family Planning Officer UH&FWC Union Health and Family Welfare Centre UHC Upazila Health Complex UP Union Parishad VGD Vulnerable Group Development VGF Vulnerable Group Feeding WTP Willingness to Pay
CONTENTS
Sl. No. Title Page # Abbreviations Acknowledgement Executive Summary ............................................................................................................................ i-iv
CHAPTER 1: INTRODUCTION ................................................................................................................. 1
1.1 Background and Issues of the Study ................................................................................................ 1 1.2. Objectives of the Study .................................................................................................................... 1 1.3. Rationale of Study............................................................................................................................ 2 1.4. Organization of the Report ............................................................................................................... 2
CHAPTER 2: METHODOLOGY ................................................................................................................ 3
2.1 Introduction ............................................................................................................................... 3 2.2 Conceptual and Methodological Approach...................................................................................... 3 2.3 Sampling Procedure ........................................................................................................................ 6 2.3.1 Sample size for primary sampling units (PSU) ................................................................................ 6 2.3.2 Selection of Sample Village ............................................................................................................. 8 2.3.3 Sample Size for Households ............................................................................................................ 8 2.3.4 Sampling for Patient Satisfaction ..................................................................................................... 8 2.3.5 Sampling for Qualitative Data ......................................................................................................... 9 2.4 Data Collection Methods ............................................................................................................... 10 2.4.1 Household Census: Poverty Identification and Verification .......................................................... 10 2.4.2 Baseline Studies: Health seeking behaviour, health expenses, willingness to pay and patient satisfaction ........................................................................................................ 11 2.4.3 Data Collection Instruments .......................................................................................................... 11 2.5 Data Analysis and Triangulation ................................................................................................... 12 2.6 Study Implementations .................................................................................................................. 12 2.7 Ethical Consideration ..................................................................................................................... 13 2.8 Study Limitation ............................................................................................................................ 13
CHAPTER 3: FINDINGS OF THE STUDY ............................................................................................. 14
3.1 Introduction ............................................................................................................................. 14 3.2 Findings of Census: Identification and Verification of Poor ......................................................... 14 3.2.1 Poor Identification and Verification Strategy ................................................................................ 14 3.2.2 Below Poverty Line Households: Magnitude and Distribution by Locations ............................... 16 3.2.3 Verification of Listed Poor Households......................................................................................... 17 3.2.4 Issuance of Health Cards to Identified BPL Households, Ensuring IT Database-Updating and
Scaling-up ............................................................................................................................. 18 3.3 Findings of Survey: Health Care Seeking Behaviour, Health Expenses, Willingness to Pay
and Patient Satisfaction .................................................................................................................. 19 3.3.1 Household Characteristics ............................................................................................................. 19 3.3.2 Respondent’s Characteristics ......................................................................................................... 22 3.3.3 Pattern of Disease Occurrence ....................................................................................................... 23 3.3.4 Health Care Seeking Behaviour .................................................................................................... 24 3.3.5 Health Care Expenditure ................................................................................................................ 33 3.3.6 General Attitude and Practice about Health Risk .......................................................................... 36 3.3.7 Willingness to Pay ......................................................................................................................... 37 3.3.8 Patient’s Satisfaction ..................................................................................................................... 41
CHAPTER 4: CONCLUSION AND RECOMMENDATION ................................................................... 43 Reference ............................................................................................................................. 45
Sl. No. Title Page #
List of Figures
Figure 2.1: Overall approach and methodology of the study ................................................................ 5 Figure 3.1: Age and sex distribution of household population............................................................ 20 Figure 3.2: Distribution of respondents by specific age groups (in %) ............................................... 22 Figure 3.3: Education of the overall respondents (in %) .................................................................... 23 Figure 3.4: Distribution of the household members received medical care during last 3 months by
major diseases/illness ...................................................................................................... 23 Figure 3.5: Wealth quintile of the household members who received medical care during last 3
month ............................................................................................................................. 24 Figure 3.6: Percentage distribution of the ill persons/clients who consulted to service
providers/service delivery points during last 3 months ................................................... 25 Figure 3.7: Distribution of the respondents receiving medical care by type of services ..................... 26 Figure 3.8: Distribution of respondents receiving medical care by type of services by wealth
quintiles ............................................................................................................................. 27 Figure 3.9: Distribution of patients by severity of disease/illness during medical consultation ........ 28 Figure 3.10 Distribution of household decesion maker to seek medicare (in %) .............................. 29 Figure 3.11: Percentage distribution of inpatient costs by type of expenditure in Tungipara ............... 32 Figure 3.12: Percentage distribution of out patient expenditure by type of expenditure in Tungipara . 35 Figure 3.13: Percentage distribution of inpatient costs by type of costs in Debhata ............................. 35 Figure 3.13A: Inpatient costs by type of expenditure in Tungipara (%) .................................................. 35 Figure 3.13B: Out patient expenditure by type of expenditure in Tungipara (%) ................................... 35 Figure 3.14A: Inpatient costs by type of expenditure in Debhata (%) ..................................................... 35 Figure 3.14B: Out patient costs by type of costs in Debhata (%) ............................................................ 35 Figure 3.15: Health Care Expenditure by Major Service provider ....................................................... 36 Figure 3.16: Household perception about health problem as risk (%) .................................................. 36 Figure 3.17: Major coping strategies with health risk if main wage earner becomes severely ill (%) .. 37 Figure 3.18: Household reported willingness to pay to be enrolled in the insurance scheme (%) ........ 37 Figure 3.19: Reasons regarding Unacceptability to Join Insurance Scheme (%) ................................. 38 Figure 3.20: Level of interest to accept benefit package in exchange of money (%) ............................ 38 Figure 3.21: Preference in selecting benefit package (%) ..................................................................... 39 Figure 3.22: Preference in selecting benefit package by economic status (%) ..................................... 39 Figure 3.23: Patient’s satisfaction on health service (%) ..................................................................... 41 List of Tables
Table 2.1: Sample determination and selection at a glance: quantitative and qualitative .................. 10 Table 2.2: List of Data Collection Instruments and Respondents ..................................................... 12 Table 3.1: Below poverty line households under various poverty definition (%) ............................. 16 Table 3.2: Spatial distribution of benefit recipient households by number of satisfying poverty
identification criteria (%) .................................................................................................. 18 Table 3.3: Multivariate analysis showing key factors associated with non-utilization of public
healthcare facilities in three Upazilas (aggregated) . ........................................................ 30 Table 3.4: Multivariate analysis showing key factors associated with non-utilization of public
healthcare facilities in Rangunia Upazila. ........................................................................ 31 Table 3.5: Multivariate analysis showing key factors associated with non-utilization of public
healthcare facilities in Tungipara Upazila. ....................................................................... 31 Table 3.6: Multivariate analysis showing key factors associated with non-utilization of public
healthcare facilities in Debhata Upazila. .......................................................................... 32 Table 3.7: Health care expenditure by disease and by area in last three months (in Tk.) .................. 33 Table 3.8: Average health care expenditure by area and by wealth status (in Tk.) ........................... 34 Table 3.9: Average health care expenditure by area and by sex (in Tk.) ........................................... 34 Table 3.10: Distribution of respondents by their willingness to pay of average amount of money
per month by packages (%)............................................................................................... 40
Sl. No. Title Page #
List of Boxes
Box 3.1: Socio-economic indicators of BPL households ................................................................ 15 Box 3.2: Distribution of BPL (using CBN) Households (%) .......................................................... 17 Box 3.3: Sensitivity and Specificity of identified SSNP Beneficiary .............................................. 18 Box 3.4: Proposed package of health care (%) ................................................................................ 39 Box 3.5: Indicators used for assessing patient’s satisfaction ........................................................... 41 List of Map Map 1: Sample Upazila and Union in Bangladesh map .................................................................. 7 Annexure:
Annex 1: Data Tables .................................................................................................................. 46-85 Annex 2: Data Collection Instrument ........................................................................................ 86-106 Annex 3: Study Area ............................................................................................................... 107-108 Annex 4: Study Team Members .............................................................................................. 109-111 Annex 5: List of Below Poverty Line Household .................................................................. 112-251 Annex 6: Terms of Reference

EXECUTIVE SUMMARY Background Information of Study
Health Economics Unit of MoHFW, with the assistance from KfW (German Development Bank) and GFA consulting group has undertaken Shasthyo Shuroksha Karmasuchi (SSK) Project to introduce a health insurance scheme in three pilot Upazilas: Debhata (Satkhira), Rangunia (Chittagong) and Tungipara (Gopalganj).
At the rolling-out phase the project initiated a study having the following specific objectives:
(i) conduct a socio-economic assessment of households by using beneficiary selection criteria of major social safety-net programmes (SSNP) to identify the poor, (ii) verify the list of poor endorsed by Local Government Institutions (LGIs), (iii) recommend mechanisms for issuance of health cards to identified below poverty line (BPL) families, ensure IT database updates and a feasible mechanism for poor identification at scale up level, (iv) identify the health services used by the poor (including the provider and expenses of such services), and (v) conduct sample survey at the community level on health seeking behaviour, willingness to pay, and patient satisfaction.
Methodology Being designed as quantitative and qualitative cross sectional, the study exploited two methods: (i) Household census to identify below poverty line (BPL) households and verification of list of poor (SSNP beneficiaries) endorsed by LGIs, and (ii) Household survey for assessing health seeking behaviour, health care expenditure, willingness to pay and patient satisfaction.
The study covered randomly selected 9 Unions and 2 Paurashavas of 3 pilot Upazilas using probability sampling approach. For rural areas, 46 villages were selected as primary enumeration units, and in Paurashavas, a total of 11 mahallahs were randomly selected as primary enumeration units. The household census covered all 18,505 households in primary enumeration areas, while household survey involved 844 randomly selected households. The study made use of six different types of data collection instruments like poor household identification format, household interview schedule, exit patient interview schedule, key informant interview check-lists, and focus group discussion guidelines. The data collection was conducted in two phases in April 2012 where household census and household survey was conducted in phase-1 and phase-2 respectively.
Key Findings A total of 21 poverty identification criteria were selected based on beneficiary selection
criteria of eight major SSNP. The most pronounced four criteria are “main earning person or head of family is a casual day laborer (45%), landless household owning homestead only and no other land (44%), household have no permanent income source (29%), and household does not have regular income (26%)”.
Any household satisfying at least any three poor identification criteria (out of 21) needs to be classified as BPL households, and households not complying with any single criterion are to be classified as contextual non-poor households.
About 41% households (satisfying at least three criteria) fall below poverty line in the three pilot Upazilas of SSK. Proportion of BPL households varies with definition of
HDRC Socio-economic Assessment to Identify the Poor in Pilot Areas and Baseline Studies on Willingness to Pay, Health
Seeking Behaviour, Health Expenses and Patient Satisfaction
ii
poor where increasing or decreasing the number of criteria (satisfied) will change the proportion of BPL households.
About 67% of current SSNP beneficiaries are BPL households (satisfying at least three criteria) implying estimated inclusion error is 33.2%. Use of various definitions of BPL (varying number of satisfying poor identification criteria) reveals that the estimated inclusion error ranges between 7% and 93%. Sensitivity analysis shows that a small proportion of listed beneficiaries are contextually poor (13.8% sensitive to poor) and specificity analysis reveals that list has to a large extent bias to non-poor (33.2%).
About 37% reported that at least one of household members has suffered from fever during last 3 months in 3 pilot Upazilas taken together. The reported incidences of three major illnesses (fever, ARI and diarrhea) are highest in Rangunia (43%, 11% and 7% respectively). ARI, diarrhoea, helminthiasis, scabies and malnutrition are most prevalent among the under 5 children and common cold, enteric fever, dysentery, peptic ulcer, hypertension, diabetes, and asthma and skin diseases are most common in adults. Menstrual disorder, leukorrhoea (white discharge), delivery complications, back pain, urinary tract infection and anemia among women.
People mostly prefer going for self treatment or pharmacy (23%), formal private practitioner (21%), and Upazila Health Complex (19%). The frequency of visiting service provider depends on the distance from the facility or service provider and household’s ability to pay for the service. The pattern of visiting UHC for services from qualified providers slightly vary by locations; around 17% in Debhata and Rangunia, and 23% in Tungipara. Reported instances of availing health service from District Hospitals and above is low and varies between 3% and 7% in different Upazilas. Instances of receiving service in private clinics have been reported to be comparatively higher (ranging from 8% to 14%).
Among those who go for treatment to Upazila Health Complex (UHC), a substantial large majority (92%) go for receiving out-patient medical services (ranging between 86% in Debhata and 96% in Rangunia) and only a few avail in-patient services. Across the Upazilas people use to seek health care services from qualified providers when they are severely ill. About 42% in Debhata, 33% in Rangunia and 94% in Tungipara reported the same. The people of Tungipara are more reluctant as well as less capable to go for treatment at early stage of disease.
For pregnancy related services (mostly ANC) households are usually commonly dependent on nearby government clinics and hospitals (UH&FWC and UHC) irrespective of locations.
The most commonly reported three reasons for not availing services from public sector health facilities in all the three Upazilas are: (i) long distance from home (Odds ratio = 25.7) (ii) non-availability of free medicine (Odds ratio = 20.4), and (iii) doctors are not examining properly (Odds ratio = 15.5).
The average amount of health care expenditure per household is Tk. 1,521.5 during last three months preceding survey. Across the Upazilas the average health care expenditure varies considerably by economic status. Absolute amount of health care expenditure is lower among the households in poorest quintile (Tk. 686) as compared to the higher wealth quintile (Tk. 2,795). In Rangunia, the richest quintile spends 3.5 times higher compared to poorest. In Tungipara, the difference is about 4 times and in Debhata it is almost two times.
HDRC Socio-economic Assessment to Identify the Poor in Pilot Areas and Baseline Studies on Willingness to Pay, Health
Seeking Behaviour, Health Expenses and Patient Satisfaction
iii
The expenditure on drugs and diagnostic test constitutes the major share (57% and
20%) of total health care expenditure. On average, a service seeker spends Tk. 861 for purchasing medicines out of total treatment cost (Tk. 1,736). The total treatment cost substantially varies by facility, from Tk. 520 for self treatment, Tk. 943 in UHC and Tk. 22,496 in Medical College Hospital.
About 75% of the households are willing to accept the insurance scheme. Majority of those (44%) who were willing to accept the scheme, preferred to have free consultation, diagnostic facilities, inpatient care, surgical facilities, transportation costs for referral and preventive care to be included in the benefit package (Benefit Package-3) .
The willingness to pay for three different benefit packages across the pilot Upazilas is low. The estimated annual premium per household (about 35% of total households reported of paying insurance premium) for health insurance is Tk. 1,064 for mostly preferred benefit package-3.
Recommendations Based on the above findings, the study team recommends SSK Project to consider the following:
1. The eligible poor for SSK scheme should be those satisfying any 3 of the 4 criteria which includes (i) main earning person or head of family is a casual day laborer, (ii) landless household owning homestead only and no other land, (iii) household have no permanent income source, and (iv) household does not have regular income.
2. Regarding issuance of SSK benefit card, maintenance and up-gradation of the data base during rolling-out stage a joint team comprising SSK officials, LGI representatives and consultants should be engaged for preparing the comprehensive beneficiary list containing names and appropriate identification (including photograph) of all members of BPL households. The group should issue individual SSK benefit card to each and every members of BPL households.
3. Proposed joint-team will visit every village and mahalla of respective Upazila to prepare list of beneficiary with comprehensive information to issue SSK benefit card. There will be a mechanism for incorporating new members in or out from households at Unions or Ward level.
4. Interaction with poor reveals apprehension of bias without involvement of third party in poor identification. The main reason for proposing inclusion of consultant is to prepare an un-biased comprehensive list of beneficiaries. The consultant should train the respective SSK staff so that during the scaling-up period the identification of BPL households can be continued in an un-biased manner, data base is maintained as well as up-graded and SSK benefit cards are regularly issued.
5. Deployment of more number of doctors and other service providers and ensuring regular presence would lead to reduce waiting time.
6. Adequate supply of medicine and improved quality of care are necessary for optimal utilization of public health facilities.
7. The benefit package should cover consultation fee, diagnostic fees, drugs, immunization, inpatient cost, transportation costs for referred cases and surgery cost (Package 3).
HDRC Socio-economic Assessment to Identify the Poor in Pilot Areas and Baseline Studies on Willingness to Pay, Health
Seeking Behaviour, Health Expenses and Patient Satisfaction
iv
8. As willingness to pay among different non-poor strata for different benefit packages is
very low, a mechanism needs to be developed to aware the people about the benefits of SSK packages.
9. Before implementing the scheme, mass campaign and behavioural change communication activities is crucial to create awareness among community relating to receipt of medical care at proper time and from qualified service providers.
10. A number of supply side barriers in accessing services at public facilities needs to be removed. Health care providers need to be more committed in providing quality care in public facilities so as to build clients’ trust on public facilities.
HDRC Socio-economic Assessment to Identify the Poor in Pilot Areas and Baseline Studies on Willingness to Pay,
Health Seeking Behaviour, Health Expenses and Patient Satisfaction
1
Chapter-1
INTRODUCTION 1.1 Background and Issues of the Study Health is now universally regarded as an important index of human development and one being the starting point for the other and vice versa. The health consequences of poverty are severe. Poor health tends to increase poverty in two ways (a) indirectly, through its negative impact on growth and development; (b) directly, the economic status determines the purchasing power, standard of living, quality of life, family size, pattern of disease and deviant behaviours of the community. It is also an important factor in seeking health care. Despite a remarkable progress in respect of building physical infrastructure, development and deployment of various categories of human resource, procurement of equipment and other logistic supports, morbidity and mortality situation in Bangladesh still remains unsatisfactory. In spite of the existence of a free and well established service delivery infrastructure in Bangladesh, utilisation of public facilities is still poor. Majorities are getting health services from semi qualified or unqualified allopathic practitioners and traditional (ayurvedic, homeopathic, uninani/kabiraj, spiritual healers and others) service providers. Besides, public expenditure continues to favour the rich relative to the poor. Health care expenditure of the MOHFW at different levels shows that 27% of the primary level health care allocation is going to the richest quintile and 21% to the poorest quintile. At all three levels – primary, secondary and tertiary – the poor people receive less healthcare resources provided by the public sector than the rich people, as opposed to the policy objective as well as meeting universal health coverage. The undeserved majority is largely rural and are particularly prone to the largest burden of cost. The financing of health care in Bangladesh is mainly dominated by the government’s revenues, out-of pocket payments and development partners’ funding. Household out of pocket expenditures constitute by far the largest component of the National Health Expenditure (NHE). Its share of NHE remained between 68% and 69%, during 1996-97 to 2001/02 periods. As share of Total Health Expenditure (THE), household Out of Pocket (OOP) health expenditure has been in the range of 64% to 65% in recent years (NHA, 2007). The absence of third party payments through health care insurance or social insurance in Bangladesh remains the major reason of the continued dominance of household OOP expenditure in National Health Expenditure. Tax-based funding for the health sector is clearly insufficient in Bangladesh, which requires a new approach to pool taxpayer’s money with health insurance contributions. Investments to reduce health risks among poor and provision of insurance against devastating health care costs are important elements in a health financing strategy for reducing poverty (World Development Report 1993). 1.2. Objectives of the Study The General objective of the study is to identify Shasthyo Shuroksha Karmasuchi (SSK) beneficiaries by socio-economic category and prepare enrolment of Below Poverty Line (BPL) beneficiaries by collecting enrolment data on a computerised database and determine household/ patient attitudes towards the existing health care system.
HDRC Socio-economic Assessment to Identify the Poor in Pilot Areas and Baseline Studies on Willingness to Pay,
Health Seeking Behaviour, Health Expenses and Patient Satisfaction
2
The specific objectives are to:
1. Conduct a socio-economic assessment of the population by using existing Vulnerable Group Development (VGD), and Vulnerable Group Feeding (VGF) household and other social safety-net beneficiary selection criteria of local government to identify the poor
2. Verify the list of poor endorsed by local government bodies including Community Clinic Management Committee (Community Group)
3. Recommend mechanisms for issuance of health cards to identified BPL families ensuring IT database updates
4. Recommend a feasible mechanism for poor identification at scale up level 5. Identify the health services that are used by the poor - including the provider and
expenses of such services and determine OOP for target population 6. Conduct a representative sample survey at the community level on
health seeking behaviour, willingness to pay and patient satisfaction with special focus on hospital level care by socio-economic
category, age, gender and type of services/conditions
1.3. Rationale of Study
An appropriate health financing strategy could be a key determinant of health system performance in terms of equity, efficiency, and quality. In this context, the Health Economics Unit (HEU) of Ministry of Health and Family Welfare (MOHFW) of Bangladesh plans to design a social health protection scheme in the name of Shastho Surokhsha Karmasuchi (SSK) in selected areas with the assistance from KfW (German Development Bank) and GFA consulting group. Before initiating the pilot scheme, Health Economics Unit of MOHFW (supported by German Development Cooperation and financed through KfW) has taken a timely initiative to carry out a baseline study to gather evidence-based learning on the socio-economic status of the population, their willingness to pay, health seeking behaviour, health expenses (OOP) and patients satisfaction. 1.4. Organisation of the Report This report comprises of five chapters and is primarily outlined to provide empirical evidence on various research tasks set by study objectives. Chapter-1introduces background, objective and rationale of the study. A detail discussion on methodological approach, data collection procedure and study implementation is provided in the second chapter. In chapter-3, the detail findings of the study with statistical analysis and discussion based on empirical evidences has been made. Key findings of the study with possible recommendations are made in chapter four under the title of conclusion and recommendation. A separate volume on list of poor in the sample locations under pilot upazilas has been prepared. In addition, data tables, data collection instruments, study locations and list of study team members including field staff are provided in annex.
HDRC Socio-economic Assessment to Identify the Poor in Pilot Areas and Baseline Studies on Willingness to Pay,
Health Seeking Behaviour, Health Expenses and Patient Satisfaction
3
Chapter 2 METHODOLOGY
2.1 Introduction Considering the aim and objectives of the study a sound methodology has been devised and subsequently followed in all phases of this study. This chapter aims to provide a detail description of conceptual and methodological approach and study procedure including sample size determination and selection. Methods of data collection (both quantitative and qualitative) and implementation of data collection related activities have also been discussed. At the end, a small deliberation on data analysis technique has been pursued. 2.2 Conceptual and Methodological Approach The major objectives of this particular study can be divided into two categories namely (i) identifying poor families to prepare a list of Below Poverty Line (BPL) families, and verification of existing list of poor endorsed by Local Government Institutions (LGIs), and (ii) baseline studies assessing health seeking behavior, willingness to pay and patient satisfaction by age, gender and income level. In relation to the first major objectives of poor family identification and verification the present study intends to recommend a feasible mechanism for poor family identification at scale up level and mechanisms for issuance of health cards to identified BPL families. The broad thematic areas and the core dimensions of this research study are outlined below:
Identification of Below Poverty Line (BPL) Families: Identification of BPL families requires proper definition of BPL at the first stage. To identify BPL families we have primarily considered various indicators used to identify poor in beneficiary selection for various social safety net programmes (SSNP) in Bangladesh. These indicators include land and asset ownership, housing characteristics, employment status and physical disability. It is worth mentioning that this study does not use income poverty line or poverty line based on food intake. The detail discussion on definition of BPL for identifying poor families is provided in section 3.2 of Chapter 3. This study has prepared a complete list of below poverty line (BPL) families, and developed feasible mechanism to identify poor at scale up level. Moreover, this study has suggested a mechanism to issue health cards to these identified BPL families.
Verification of List of Poor Households: At the inception phase of the study it was assumed that the LGI especially, Union Parishad have prepared and kept the list of poor households living in the area under their jurisdiction. This study aims to verify existing list of poor endorsed by LGIs for selecting SSNP beneficiaries and/or list of SSNP beneficiaries. In reality, we did not find any list of poor households as such available at LGIs for verification through physical visit in this study. We have collected data on whether households receive any type of SSNP or not to prepare a list of SSNP beneficiary households in the sample areas. The substrata objective was to complement the task of poor verification. It provides opportunity to check as well as verify poverty status of SSNP beneficiary households.
HDRC Socio-economic Assessment to Identify the Poor in Pilot Areas and Baseline Studies on Willingness to Pay,
Health Seeking Behaviour, Health Expenses and Patient Satisfaction
4
Health Care Seeking Behaviour: A current scenario of health seeking behaviour of households by age, gender and income level has been drawn in this study. A number of relevant issues like morbidity in last three months, whether received treatment or not, sources of care, reasons for choosing provider, reasons for not seeking care from public facilities, and unmet health care need are considered in analysing health seeking behaviour. Data on health seeking behaviour was collected for eligible members (suffered from disease within a specific time period) from each household.
Health Care Expenditure: Estimates on average amount of expenditure for health
care has been made in this study. In estimation process we considered the type of services received by households during illness in last three months, total out-of pocket expenditure, and expenditure by types (doctor’s fee, cost of medicine, cost of diagnostic test, cost of transportation etc.). Data on health seeking behaviour was collected for member/s suffered from any type of morbidity in last three months preceding the survey.
Willingness to Pay: Willingness to pay (WTP) is the amount of payment which, combined with the presence of the service package, gives the person the same level of benefit and satisfaction as could be derived in case of no payment and acquisition of the service package. WTP depends on a number of factors including affordability, knowledge and perceived quality of care. In order to avoid these biases, ‘Choice Modeling’ technique is used in this study to estimate the value of the WTP through a choice experiment. Under the approach, a hypothetical scenario was presented to the respondents. They were given a number of choices (e.g., different benefit packages with different premiums) to select the best one. This study aims to estimate the willingness to pay for health services used by households by age, gender and economic status.
Patient Satisfaction: Satisfaction on health services provided by health provider at
facility level has been assessed in this study. Patient satisfaction is assessed by using a number of indicators such as staff availability, staff attitudes, availability of drugs and medical supplies, facility cleanliness and hygiene, privacy and confidentiality, quality and quantity of inpatient food, waiting time, and quality of treatment received. Data on patient satisfaction is collected from patients receiving services from various health facilities.
Methodologically, this study is a cross sectional survey where data is collected from various types of respondents (households, patients and health related service providers) under the study area for one point of time and it will serve as a baseline situation as well. Diagrammatic representation of the study design covering methodological approach and implementation procedure is shown in figure 2.1. Probabilistic sampling strategy has been applied to determine sample size for Union (lowest administrative unit) and households as well to ensure representation of pilot areas. To select the sample households a representative number of villages under each Union was determined and randomly selected. In addition, purposive sampling is used for qualitative data collection. To address poverty identification and verification objective of the study, a census method (survey covering all household) for data collection in the study area is followed. On the other hand, for baseline studies a representative sample survey at the village level is conducted to collect data on health seeking behaviour, willingness to pay and patient satisfaction by socio- economic category, age, gender and type of services/conditions from household and individual level. This sample
HDRC Socio-economic Assessment to Identify the Poor in Pilot Areas and Baseline Studies on Willingness to Pay,
Health Seeking Behaviour, Health Expenses and Patient Satisfaction
5
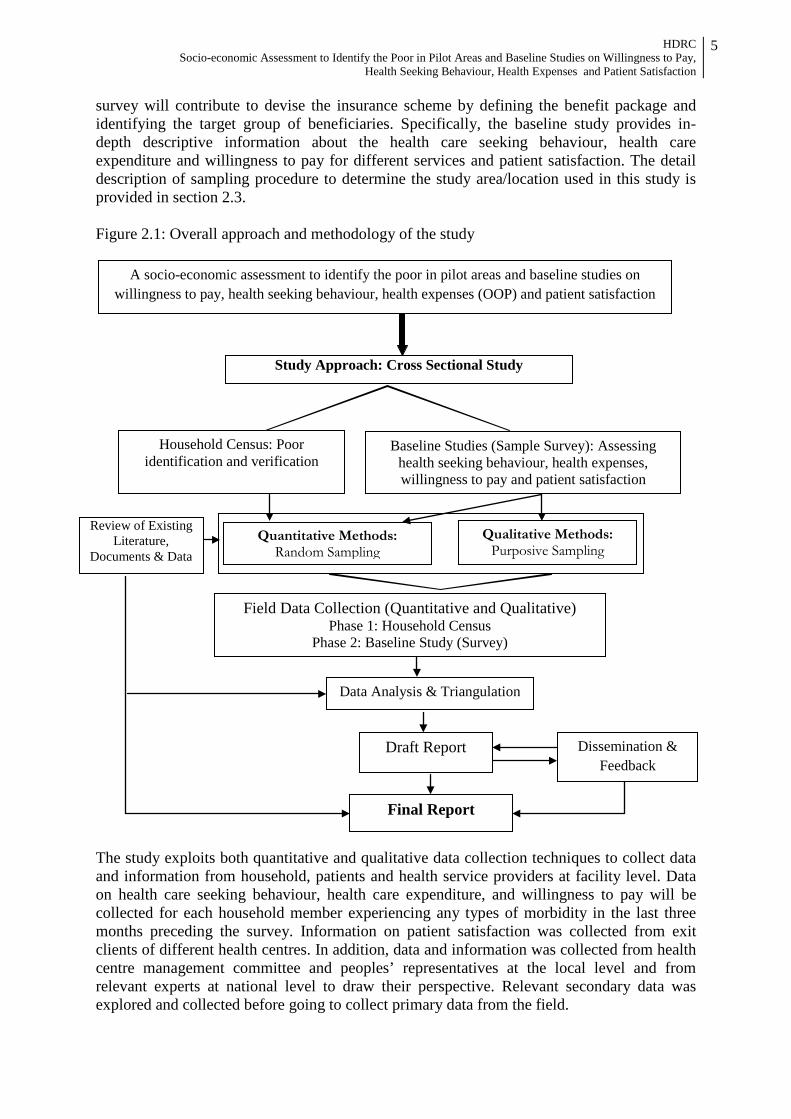
survey will contribute to devise the insurance scheme by defining the benefit package and identifying the target group of beneficiaries. Specifically, the baseline study provides in-depth descriptive information about the health care seeking behaviour, health care expenditure and willingness to pay for different services and patient satisfaction. The detail description of sampling procedure to determine the study area/location used in this study is provided in section 2.3. Figure 2.1: Overall approach and methodology of the study The study exploits both quantitative and qualitative data collection techniques to collect data and information from household, patients and health service providers at facility level. Data on health care seeking behaviour, health care expenditure, and willingness to pay will be collected for each household member experiencing any types of morbidity in the last three months preceding the survey. Information on patient satisfaction was collected from exit clients of different health centres. In addition, data and information was collected from health centre management committee and peoples’ representatives at the local level and from relevant experts at national level to draw their perspective. Relevant secondary data was explored and collected before going to collect primary data from the field.
A socio-economic assessment to identify the poor in pilot areas and baseline studies on willingness to pay, health seeking behaviour, health expenses (OOP) and patient satisfaction
Study Approach: Cross Sectional Study
Household Census: Poor identification and verification
Field Data Collection (Quantitative and Qualitative) Phase 1: Household Census
Phase 2: Baseline Study (Survey)
Draft Report Dissemination & Feedback
Final Report
Data Analysis & Triangulation
Review of Existing Literature,
Documents & Data
Baseline Studies (Sample Survey): Assessing health seeking behaviour, health expenses, willingness to pay and patient satisfaction
Quantitative Methods: Random Sampling
Qualitative Methods: Purposive Sampling
HDRC Socio-economic Assessment to Identify the Poor in Pilot Areas and Baseline Studies on Willingness to Pay,
Health Seeking Behaviour, Health Expenses and Patient Satisfaction
6
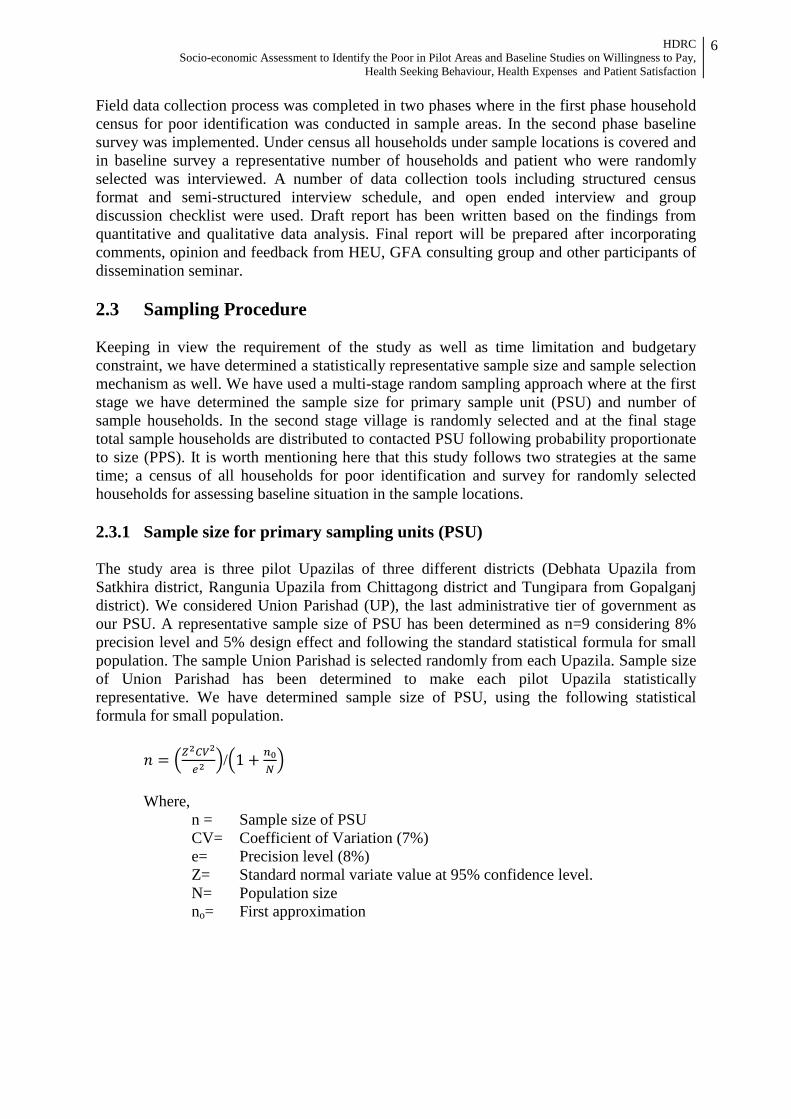
Field data collection process was completed in two phases where in the first phase household census for poor identification was conducted in sample areas. In the second phase baseline survey was implemented. Under census all households under sample locations is covered and in baseline survey a representative number of households and patient who were randomly selected was interviewed. A number of data collection tools including structured census format and semi-structured interview schedule, and open ended interview and group discussion checklist were used. Draft report has been written based on the findings from quantitative and qualitative data analysis. Final report will be prepared after incorporating comments, opinion and feedback from HEU, GFA consulting group and other participants of dissemination seminar. 2.3 Sampling Procedure Keeping in view the requirement of the study as well as time limitation and budgetary constraint, we have determined a statistically representative sample size and sample selection mechanism as well. We have used a multi-stage random sampling approach where at the first stage we have determined the sample size for primary sample unit (PSU) and number of sample households. In the second stage village is randomly selected and at the final stage total sample households are distributed to contacted PSU following probability proportionate to size (PPS). It is worth mentioning here that this study follows two strategies at the same time; a census of all households for poor identification and survey for randomly selected households for assessing baseline situation in the sample locations. 2.3.1 Sample size for primary sampling units (PSU) The study area is three pilot Upazilas of three different districts (Debhata Upazila from Satkhira district, Rangunia Upazila from Chittagong district and Tungipara from Gopalganj district). We considered Union Parishad (UP), the last administrative tier of government as our PSU. A representative sample size of PSU has been determined as n=9 considering 8% precision level and 5% design effect and following the standard statistical formula for small population. The sample Union Parishad is selected randomly from each Upazila. Sample size of Union Parishad has been determined to make each pilot Upazila statistically representative. We have determined sample size of PSU, using the following statistical formula for small population.
𝑛 = �𝑍2𝐶𝑉2
𝑒2�/�1 + 𝑛0
𝑁�
Where,
n = Sample size of PSU CV= Coefficient of Variation (7%) e= Precision level (8%) Z= Standard normal variate value at 95% confidence level. N= Population size no= First approximation
HDRC Socio-economic Assessment to Identify the Poor in Pilot Areas and Baseline Studies on Willingness to Pay,
Health Seeking Behaviour, Health Expenses and Patient Satisfaction
7
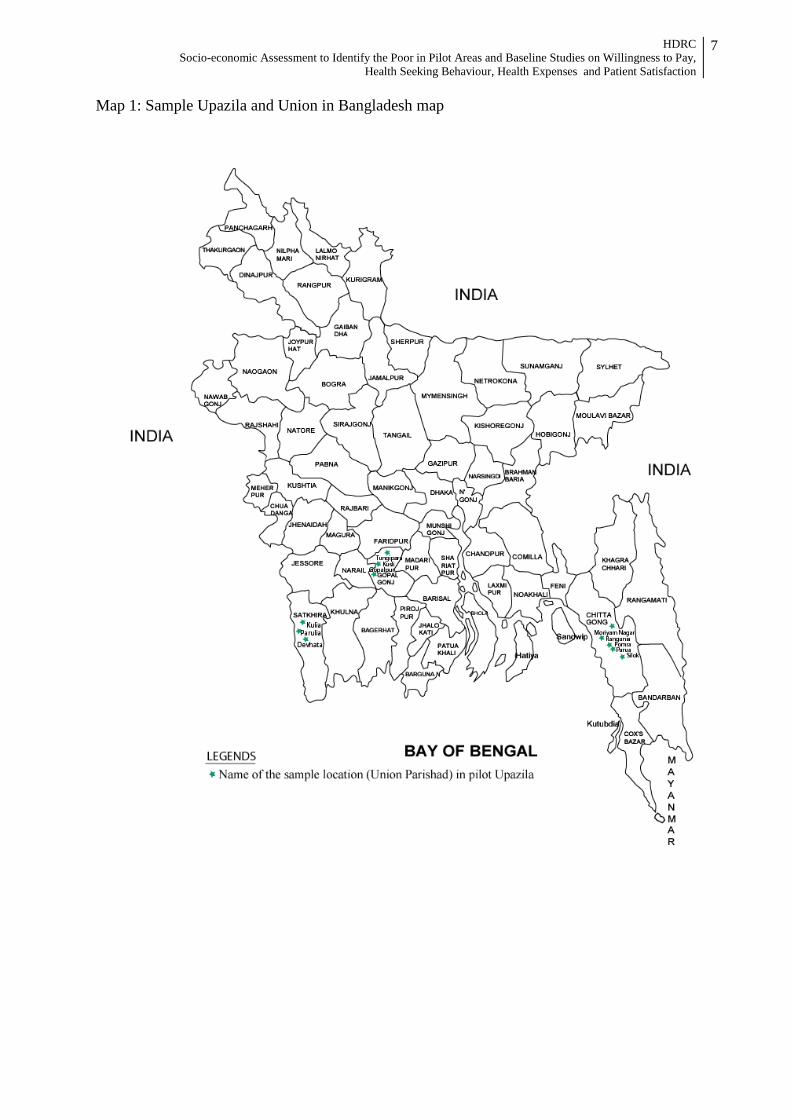
Map 1: Sample Upazila and Union in Bangladesh map

HDRC Socio-economic Assessment to Identify the Poor in Pilot Areas and Baseline Studies on Willingness to Pay,
Health Seeking Behaviour, Health Expenses and Patient Satisfaction
8
2.3.2 Selection of Sample Village
The average number of villages in each Union Parishad is approximately 21 based on available information provided by Bangladesh Bureau of Statistics (BBS). A statistically representative number of villages have been determined as 5 for each UP following similar formula, precision level, and design effect used for PSU determination. The sample villages are selected randomly from each Union Parishad (list provided by respective UP). Thus the total number of sample villages in three pilot Upazilas is 45 (at the time of census and survey implementation the total number of sample villages increased to 47). In addition, for capturing urban area of two pilot upazila (i.e., Tungipara and Rangunia) we took 11 mahalla from these 2 Paurashava (municipality) with equal proportion. Finally, the total sample size for villages (rural) and mahalla (urban) is 46 and 10 respectively. 2.3.3 Sample Size for Households In determining sample size for households we considered poverty status of the population so that our sample households can be representative for both poor and non-poor households. According to Report on Household Income and Expenditure Survey -2010 of BBS, the head count rate of incidence of poverty is estimated 31.5% at national level. We have determined the number of sampling households with the following statistical formula:
𝑛 = 𝑁1+𝑁×(𝑒)2
Where, n = Sample size of PSU N= Population size e= Precision level (5%)
A representative sample size of households has been determined as n=836 with 5% Precision level and 5% design effect. This sample size for household is representative for each pilot Upazila and for poor and non-poor groups of population as well. It gives us the opportunity to compare our findings by locations and by poverty status. At the time of sample selection in the village and mahalla level the total number of sample households was increased to 844 (from 836) due to some practicalities. 2.3.4 Sampling for Patient Satisfaction For the purpose of collecting data on patient satisfaction on various services provided at health service providers, intercept sampling at Upazila Health Complex (UHC), Union Health and Family Welfare Centre (UH&FWC), Community Clinics (CC) and other health centres has been used. Regarding community clinic we selected 2 clinics randomly out of 9 from each sample Union, 3 UHC and 9 UH&FWC under pilot Upazila. During service delivery hours, 10 randomly selected service recipients (exit patient) were interviewed to assess their satisfaction level of various health services. The number of sample health service facilities and sample exit patients are as follows.
UHC = 3 UH&FWC = 9 Community Clinic =18 Total number of sample health facilities = 30 Total number of patients for interview = 300 (10 patients per facility)

HDRC Socio-economic Assessment to Identify the Poor in Pilot Areas and Baseline Studies on Willingness to Pay,
Health Seeking Behaviour, Health Expenses and Patient Satisfaction
9
2.3.5 Sampling for Qualitative Data Qualitative data is collected from purposively selected sample respondents by applying qualitative data collection methods like key informant interview (KII) and focus group discussion (FGD). Key Informant Interview (KII) To collect data and information regarding peoples’ health seeking behaviour, health expenditure, ability to pay, quality of service delivery and management of health facilities, issuance of health cards, and identification BPL families we conducted KII with health service providers at Upazila, Union and community level, elected representatives of local government bodies and experts from policy level. The total number of respondents for KII is 30 at different level of stakeholders. The selection of sample respondents for KII is as follows.
UHC (doctor) = 3 UH&FWC (doctor) = 9 Community Clinic (Medical Assistant) = 3 Community Clinic (Committee member) = 3 UP Chairmen/Members = 9 Experts from policy level = 3 Total = 30
Focus Group Discussion (FGD) Community peoples’ knowledge, perception and experience are considered crucial for designing any types of health system designing and implementation. Apart from quantitative data on health seeking behaviour, health expenditure, willingness to pay, quality of service delivery and management of health facilities it was thought necessary to collect data on peoples’ experience, perception and aspiration on the subject issues relevant to this study. FGD with community people had been proposed where three groups: poor, non-poor and community women were considered. A total of 9 FGDs were conducted where 3 FGDs for poor peoples, 3 FGDs for non-poor and 3 FGDs for community women. In each pilot Upazila FGD with these three groups were conducted separately. Participants and number of FGD, at a glance are as follows;
Community People: Poor = 3 Community People: Non-poor = 3 Community People: Women = 3 Total = 9 *Number of participants in each FGD was 7 to 9
HDRC Socio-economic Assessment to Identify the Poor in Pilot Areas and Baseline Studies on Willingness to Pay,
Health Seeking Behaviour, Health Expenses and Patient Satisfaction
10
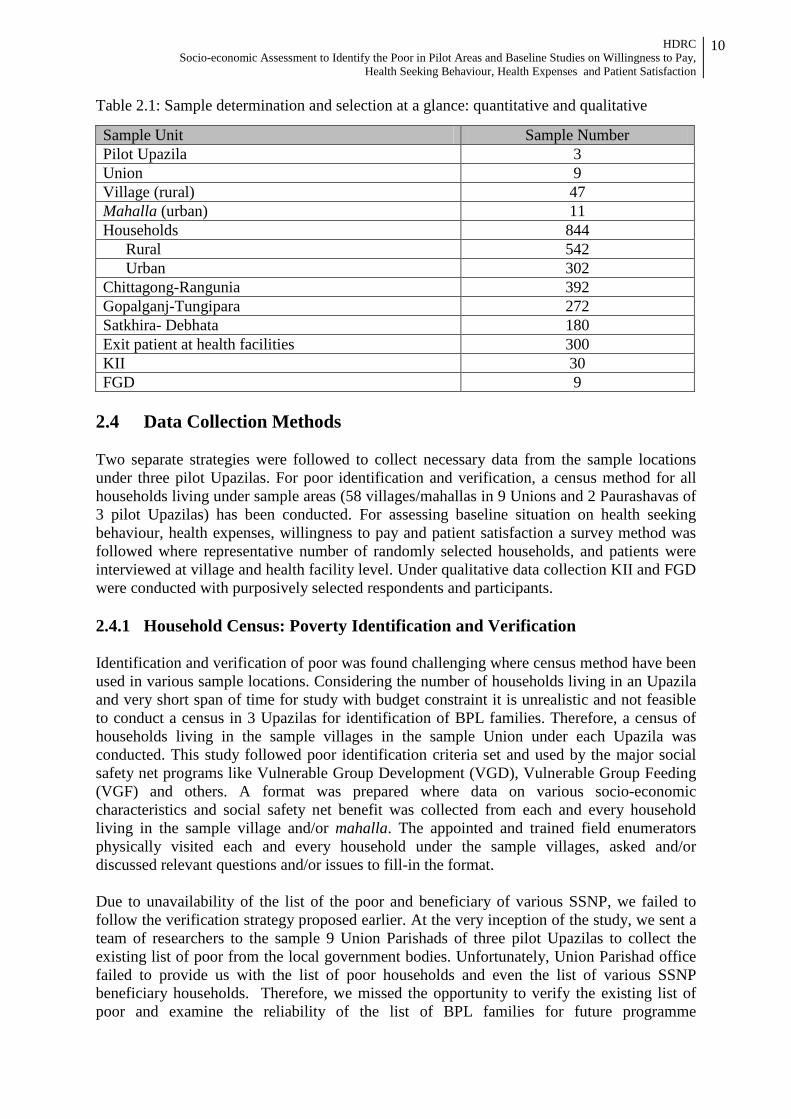
Table 2.1: Sample determination and selection at a glance: quantitative and qualitative
Sample Unit Sample Number Pilot Upazila 3 Union 9 Village (rural) 47 Mahalla (urban) 11 Households 844
Rural 542 Urban 302
Chittagong-Rangunia 392 Gopalganj-Tungipara 272 Satkhira- Debhata 180 Exit patient at health facilities 300 KII 30 FGD 9
2.4 Data Collection Methods Two separate strategies were followed to collect necessary data from the sample locations under three pilot Upazilas. For poor identification and verification, a census method for all households living under sample areas (58 villages/mahallas in 9 Unions and 2 Paurashavas of 3 pilot Upazilas) has been conducted. For assessing baseline situation on health seeking behaviour, health expenses, willingness to pay and patient satisfaction a survey method was followed where representative number of randomly selected households, and patients were interviewed at village and health facility level. Under qualitative data collection KII and FGD were conducted with purposively selected respondents and participants. 2.4.1 Household Census: Poverty Identification and Verification Identification and verification of poor was found challenging where census method have been used in various sample locations. Considering the number of households living in an Upazila and very short span of time for study with budget constraint it is unrealistic and not feasible to conduct a census in 3 Upazilas for identification of BPL families. Therefore, a census of households living in the sample villages in the sample Union under each Upazila was conducted. This study followed poor identification criteria set and used by the major social safety net programs like Vulnerable Group Development (VGD), Vulnerable Group Feeding (VGF) and others. A format was prepared where data on various socio-economic characteristics and social safety net benefit was collected from each and every household living in the sample village and/or mahalla. The appointed and trained field enumerators physically visited each and every household under the sample villages, asked and/or discussed relevant questions and/or issues to fill-in the format. Due to unavailability of the list of the poor and beneficiary of various SSNP, we failed to follow the verification strategy proposed earlier. At the very inception of the study, we sent a team of researchers to the sample 9 Union Parishads of three pilot Upazilas to collect the existing list of poor from the local government bodies. Unfortunately, Union Parishad office failed to provide us with the list of poor households and even the list of various SSNP beneficiary households. Therefore, we missed the opportunity to verify the existing list of poor and examine the reliability of the list of BPL families for future programme
HDRC Socio-economic Assessment to Identify the Poor in Pilot Areas and Baseline Studies on Willingness to Pay,
Health Seeking Behaviour, Health Expenses and Patient Satisfaction
11
intervention. At this backdrop, we devised an alternative methodology to complete the assigned verification task. Under verification task we collected data on whether household receives any type of SSNP benefits or not, and afterwards we have matched this information with the poverty status of households assessed through identification process. This census for poor identification and verification has provided us the hands on experience of poor identification-verification and the methodology for same task in case of scaling up. 2.4.2 Baseline Studies: Health seeking behaviour, health expenses, willingness to pay and patient satisfaction To gauge baseline situation on health seeking behaviour, health expenses, willingness to pay and patient satisfaction by age, gender and income level in the pilot areas this study followed a sample survey procedure. Under sample survey we conducted household and exit patient survey, key informant interview and focus group discussion. Under household and exit patient survey we interviewed a representative number of randomly selected households at village/mahalla level, and a representative number of exit patients at different health facility level. A semi-structured interview schedule was used to collect data on primarily health seeking behaviour, health expenses, and willingness to pay from randomly selected households living in sample villages/mahallahs. A structured questionnaire was used in exit patient survey to collect data on patient satisfaction. In selection of exit patient for interview we put effort at maximum level to ensure randomness. However, it is a practical situation where patients receiving health care are in a hurry to leave the health facility, the field data collection team could not properly ensure randomness and in that case rather willingness to give interview was more valued to us. At least gender balance and age category were ensured in exit patient survey. To complement and supplement quantitative data collected from household and exit patient survey a purposively determined number of key informant interview (KII) and focus group discussion was conducted. For conducting KII a checklist was prepared to interview 30 key informants (detail on type of key informant please see section 2.3.5) from the selected pilot Upazilas including policy makers, health care management committee members, health care providers, local government representatives, community leaders and other stakeholders. Respondents/participants of KII were selected purposively based on their knowledge on local peoples’ health seeking behaviour-practice related issues, health service providers and health care management. In addition, focus group discussion was designed to collect data on local peoples’ view on health seeking behaviour-practice related issues, health service providers and health care management. FGD sessions with community women, poor people and non-poor people were conducted separately. An FGD checklist was prepared to conduct such group discussion. Every session was organised with the help of local community leaders. A two member team having appropriate qualification and skill was formed and trained before field operation. 2.4.3 Data Collection Instruments A total of six different data collection instruments (DCIs) have been prepared to collect relevant data in this study. Before finalisation all data collection instruments were pre-tested in the field and shared with HEU and GFA consulting group. For implementation of data collection endeavour all DCIs were translated into Bengali for convenience. The data collection instruments are as follows:

HDRC Socio-economic Assessment to Identify the Poor in Pilot Areas and Baseline Studies on Willingness to Pay,
Health Seeking Behaviour, Health Expenses and Patient Satisfaction
12
Table 2.2: List of Data Collection Instruments and Respondents
Type of data collection instruments Respondents/Sources DCI-1 Poor Household Identification
Format Households (Census)
DCI-2 Interview Schedule: Household Households (Sample Survey) DCI-3 Key Informant Interview Doctors of UHC and UH&FWC, LGIs representatives,
and CC management committee member DCI-4 Key Informant Interview Local Civil Society Member DCI-5 Interview Schedule: Exit Patient Patient receiving health service at UHC, UH&FWC and
Community Clinic DCI-6 Focus Group Discussion Women, Poor and Non-poor households 2.5 Data Analysis and Triangulation The collected quantitative data is analysed by using both descriptive and analytical statistics. Transcribed qualitative data is analysed with respect to context, process, and outcomes. Triangulation of secondary data and literature, primary data collected from field survey and various types of interaction with relevant stakeholders are made to ensure sound analysis. We have triangulated quantitative and qualitative data derived from this study. The purpose of triangulation in this study is to increase the credibility and validity of the results. 2.6 Study Implementations The accompanying study has been implemented in collaboration between the Study Team of Human Development Research Centre (HDRC) and HEU-GFA Consulting groups. During the inception phase, for understanding the study context and reality of the pilot Upazilas the study team members visited the study locations and met health service providers and LGI representatives. Study design and data collection strategies were finalised in consultation with HEU-GFA Consulting groups. To achieve the two broad categories of study objectives data collection process was implemented in two phases. In the first phase poor identification and verification related activities (household census) were implemented and in the second phase data for baseline studies (survey) on health seeking behaviour, health expenses, willingness to pay and patient satisfaction by age, gender and income level were collected. A field data collection team comprising of Field Enumerator (FE), Field Investigator (FI), FGD Moderator (FM), FGD Note Taker (FN), Field Supervisor (FS), Quality Control Officer (QCO) and Field Coordinator (FC) was formed to conduct census and survey. At the first phase of data collection, a team of FE, FS and QCO was recruited and trained for household census regarding identification and verification of BPL families. A total number of 45 FEs and 9 FSs were employed for 7 days. For smooth implementation of field data collection under second phase (baseline studies), a total number of 48 FIs, 3 FMs, 3 FNs, 9 FSs 3 QCOs and 3 FCs were employed for 9 days. Two separate trainings for each phase of data collection were imparted. The duration of training was 1 day for household census and 3 days for baseline studies (surveys). Quality control during primary data collection, management and processing was done with highest importance. During both census and survey, HDRC maintained a multilayer hierarchical structure where each layer has the provision of interacting with one another to generate the best outcome. In this interactive structure, the field team (comprising Field Enumerators/Investigators, Field Supervisors, Quality Control Officer, and Field

HDRC Socio-economic Assessment to Identify the Poor in Pilot Areas and Baseline Studies on Willingness to Pay,
Health Seeking Behaviour, Health Expenses and Patient Satisfaction
13
Coordinator) and the core team maintained close liaison with each other by providing necessary feedback and support. Field Coordinators maintained constant touch with the field staffs and made necessary field visits to observe how the questionnaire were filled-in and took remedial measure immediately in case of any inconsistency found. In terms of ensuring the quality data, Quality Control Officers played a very crucial role in the data collection process by constantly moving around the sample spots, field checking, and data monitoring. Field checking was done in both ‘presence’ and ‘absence’ of the FIs and/or FSs. ‘Checking in presence’ means verification of the field staff in the sample area during the time of survey. ‘Checking in absence’ means verification of the work of field team in a sample area after the team had left the site, having completed its assigned work in the area. During their field checking, the QCOs performed re-interview, and checked the data accuracy. Some of the reported non-response items were also checked to ensure that they were all due to valid reasons. In the interactive process, field team can share their views and suggestions directly with the study team members. The notable feature of the interactive process adopted by HDRC is that- the top layer i.e., the study team maintained close interaction with the field staffs through frequent field visits. Moreover, the field staffs always had the provision of contacting (through phone or other means) a respective person of the study team member in certain circumstances. 2.7 Ethical Consideration A number of key ethical precautions have been considered in this study in order to protect the rights of research participants. First of all, voluntary participation was ensured up to level that the participants were not at all coerced in participating in census and survey. Closely related to the notion of voluntary participation is the requirement of informed consent. We also guaranteed the participants’ confidentiality i.e., the identifying information will not be made available to anyone who is not directly involved in the study. An unsparing principle of anonymity is maintained throughout the study. 2.8 Study Limitation This study followed a sound methodology to achieve the objectives and predominantly based on empirical findings. There are few limitations which was found and felt by the research team while conducting this study. Due to time and resource constraints and too many objectives in a single study it was a challenge to maintain due attention to all the study objectives. Due to the nature of the study, a lot of primary data was collected on various issues where the research team faced the challenge bias originated from memory recall problem. Especially, this is very much true for health care expenditure by items and by providers. In case of poverty identification and verification, the study was also dependent on the households reporting about their socio-economic status which could create some sort of bias in poverty estimation. Finally, there is gap of triangulation among various study findings which could be done if more time would be given.

HDRC Socio-economic Assessment to Identify the Poor in Pilot Areas and Baseline Studies on Willingness to Pay,
Health Seeking Behaviour, Health Expenses and Patient Satisfaction
14
Chapter 3 FINDINGS OF THE STUDY
3.1 Introduction The accompanying chapter has been written to present the study findings based on empirical evidences collected from the study areas in a way where findings from household census in the sample locations to identify below poverty line families has been presented under the first section and findings from household and patient survey on baseline situation of health seeking behaviour, health expenses, willingness to pay and patient satisfaction has been presented in the second section of the study. 3.2 Findings of Census: Identification and Verification of the Poor
3.2.1 Poor Identification and Verification Strategy Identification of households living below poverty line (BPL) in a geographic area is a daunting task. However, considering the aim and objectives of Shastyo Shuroksha Karmasuchi (SSK) it is a major stepping stone to devise a methodology for identification of BPL households, assess the extent of inequality and social exclusion, and capture the nature of vulnerability in order to design proper interventions. It is equally vital to prepare a list of such households and workout the scaling mechanism. Although the poverty researchers have already pointed out different manifestations which encompass many features that make people vulnerable, there is no single method for identifying the poverty line. Most commonly poverty is measured by drawing a scale using direct calorie intake (DCI) or cost of basic needs (CBN) or international poverty line method. It is worth noting that CBN provides high precision estimates for constructing poverty lines (upper and lower) in a situation where high quality relevant data is generated. However, this particular method of poverty line construction is administrable for sample households. Such limitation acts as major impediment for administering the method for identification of all BPL households of geographical areas units like union, upazila, district, etc. It is revealed that 31.5% households in Bangladesh are living below poverty line (HIES 2010), while about 5 years back the proportion of the same category household was 40% (HIES 2005). In the last decade an approach has been developed to identify socio-economic status of adequately representative sample of households (non-homogeneous) by constructing wealth index and disaggregating into wealth quintiles, where the lowest quintile represents the poorest (in other sense it constructs a poverty line using qualitative variables converted into dichotomous values). Studies depict that about 17.9% are living in lowest quintile (poorest) and 19.8% in the quintile next to poorest category (BDHS 2011). Around four years back the share of households in respective quintiles has been reported as 19.2% and 19.6% (BDHS 2007). It indicates that in terms of wealth index around 39% of households in Bangladesh were poor during the period of last 7 to 10 years. Moreover, BMMS 2010 findings reveal that about 22.7% are in the poorest (lowest) quintile. District wise disaggregation manifests that proportion households living in poorest quintile ranges between 1.5% (Dhaka) and 43.4% (Bhola). It is worth noting that in 15 out of 64 districts the same proportion is 30% and above. However, this method is highly resource consuming, albeit, practically applicable for sample survey.
HDRC Socio-economic Assessment to Identify the Poor in Pilot Areas and Baseline Studies on Willingness to Pay,
Health Seeking Behaviour, Health Expenses and Patient Satisfaction
15
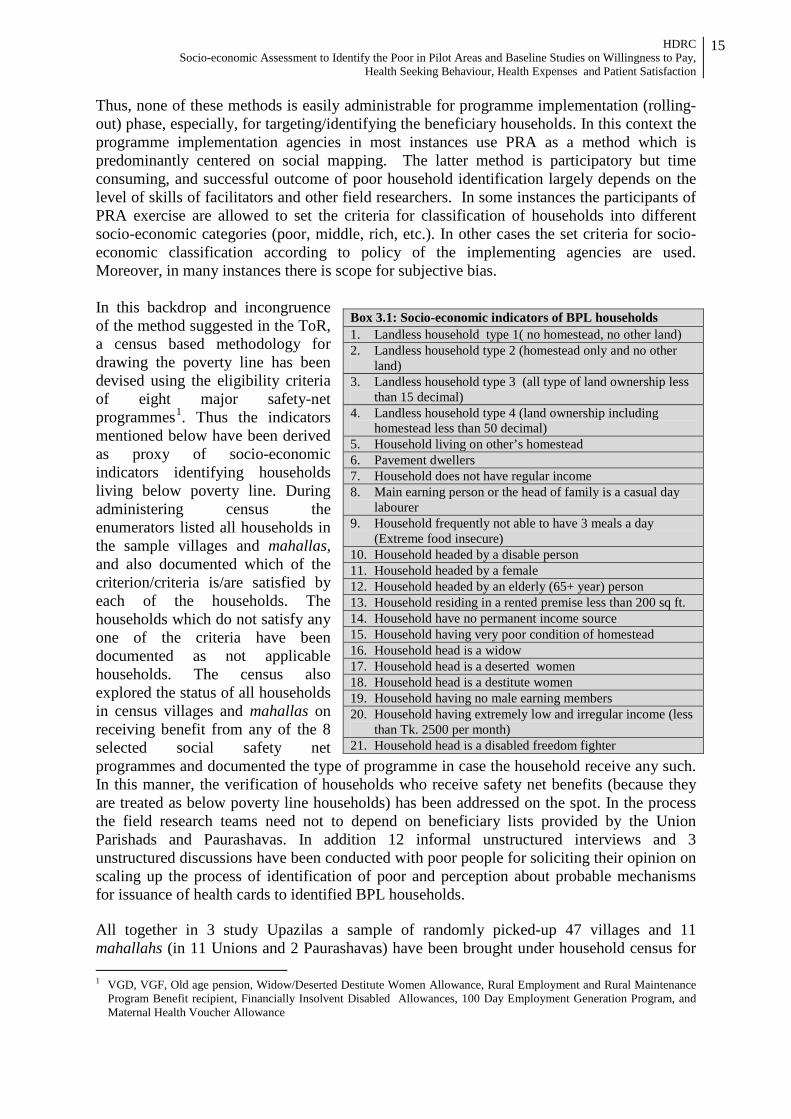
Thus, none of these methods is easily administrable for programme implementation (rolling-out) phase, especially, for targeting/identifying the beneficiary households. In this context the programme implementation agencies in most instances use PRA as a method which is predominantly centered on social mapping. The latter method is participatory but time consuming, and successful outcome of poor household identification largely depends on the level of skills of facilitators and other field researchers. In some instances the participants of PRA exercise are allowed to set the criteria for classification of households into different socio-economic categories (poor, middle, rich, etc.). In other cases the set criteria for socio-economic classification according to policy of the implementing agencies are used. Moreover, in many instances there is scope for subjective bias. In this backdrop and incongruence of the method suggested in the ToR, a census based methodology for drawing the poverty line has been devised using the eligibility criteria of eight major safety-net programmes1. Thus the indicators mentioned below have been derived as proxy of socio-economic indicators identifying households living below poverty line. During administering census the enumerators listed all households in the sample villages and mahallas, and also documented which of the criterion/criteria is/are satisfied by each of the households. The households which do not satisfy any one of the criteria have been documented as not applicable households. The census also explored the status of all households in census villages and mahallas on receiving benefit from any of the 8 selected social safety net programmes and documented the type of programme in case the household receive any such. In this manner, the verification of households who receive safety net benefits (because they are treated as below poverty line households) has been addressed on the spot. In the process the field research teams need not to depend on beneficiary lists provided by the Union Parishads and Paurashavas. In addition 12 informal unstructured interviews and 3 unstructured discussions have been conducted with poor people for soliciting their opinion on scaling up the process of identification of poor and perception about probable mechanisms for issuance of health cards to identified BPL households. All together in 3 study Upazilas a sample of randomly picked-up 47 villages and 11 mahallahs (in 11 Unions and 2 Paurashavas) have been brought under household census for 1 VGD, VGF, Old age pension, Widow/Deserted Destitute Women Allowance, Rural Employment and Rural Maintenance
Program Benefit recipient, Financially Insolvent Disabled Allowances, 100 Day Employment Generation Program, and Maternal Health Voucher Allowance
Box 3.1: Socio-economic indicators of BPL households 1. Landless household type 1( no homestead, no other land) 2. Landless household type 2 (homestead only and no other
land) 3. Landless household type 3 (all type of land ownership less
than 15 decimal) 4. Landless household type 4 (land ownership including
homestead less than 50 decimal) 5. Household living on other’s homestead 6. Pavement dwellers 7. Household does not have regular income 8. Main earning person or the head of family is a casual day
labourer 9. Household frequently not able to have 3 meals a day
(Extreme food insecure) 10. Household headed by a disable person 11. Household headed by a female 12. Household headed by an elderly (65+ year) person 13. Household residing in a rented premise less than 200 sq ft. 14. Household have no permanent income source 15. Household having very poor condition of homestead 16. Household head is a widow 17. Household head is a deserted women 18. Household head is a destitute women 19. Household having no male earning members 20. Household having extremely low and irregular income (less
than Tk. 2500 per month) 21. Household head is a disabled freedom fighter
HDRC Socio-economic Assessment to Identify the Poor in Pilot Areas and Baseline Studies on Willingness to Pay,
Health Seeking Behaviour, Health Expenses and Patient Satisfaction
16
identification of BPL households. Thus, the census has been carried out involving all 18,505 households (Debhata 5,453 households, 8,046 and 5,006 households respectively in Rangunia and Tungipara upazilas). 3.2.2 Below Poverty Line Households: Magnitude and Distribution by Locations The census finding shows that across the study area about 29% households (ranging between about 28% in Debhata and 30% in Rangunia) on average do not satisfy any one of the poverty identification criteria and therefore, these households can be considered as contextual non-poor households in the study area (Table 3.1). The 4 most pronounced poor identification criteria out of total 21 criteria are; “main earning person or head of family is a casual day laborer (45%), landless household owning homestead only & no other land (44%), household have no permanent income source (29%) and household does not have regular income (26%)” in these three Upazilas altogether. The main earning person in 45% households is a casual day laborer while this scenario varies depending upon Upazilas (53% in Tungipara, 37% in Rangunia and 49% in Debhata). About 44% households own no land except homestead (ranging between 35% in Tungipara and 48% in Rangunia. Furthermore, about 26% households do not have any regular income (ranging between 6% in Rangunia and 47% in Tungipara. A similar proportion of households (29%) do not have any permanent source of income. It is worth mentioning that the proportions of household satisfying other criteria are low (for detail see annex table 3.1).
Table 3.1: Below poverty line households under various poverty definitions (%) # Criteria Satisfied Location: Upazila
Debhata Rangunia Tungipara All At least one 72.4 70.3 70.7 71 At least two 61.3 47.8 62 55.6 At least three 44.3 30.3 54.2 40.9 At least four 31.8 5.6 32.5 20.6 At least five 8.9 1.0 8.2 5.3 Six and above 3.9 0.3 2.9 2.1 None 27.8 29.6 29.3 29 N 5,453 8,046 5,006 18,505 The data depict that about 5% of the households in the census area satisfy any five or more criteria (Table 3.1). It is worth noting that while in Dabhata and Tungipara the proportion varies between 8% and 9%, the same is applicable for only 1% of households in Rangunia. However, 71% households across the location on average comply with at least one criterion. Analysis exposes that across the board about 21% households satisfies at least 4 criteria and about 41% have been identified as households meeting 3 or more criteria. The distribution of both the categories of households varies substantially between Upazilas. From the census findings it has been appeared that both in Tungipara and Debhata almost one-in-three households (about 32%) fulfill at least 4 poverty identification criteria, while around 6% households in Rangunia demonstrate similar features. It is noteworthy that about 30%, 20% and 12% households respectively in Gopalganj, Satkhira and Chittagong districts are living in the poorest quintile while the national figure for the same is 21.7% (BMMS 2010).
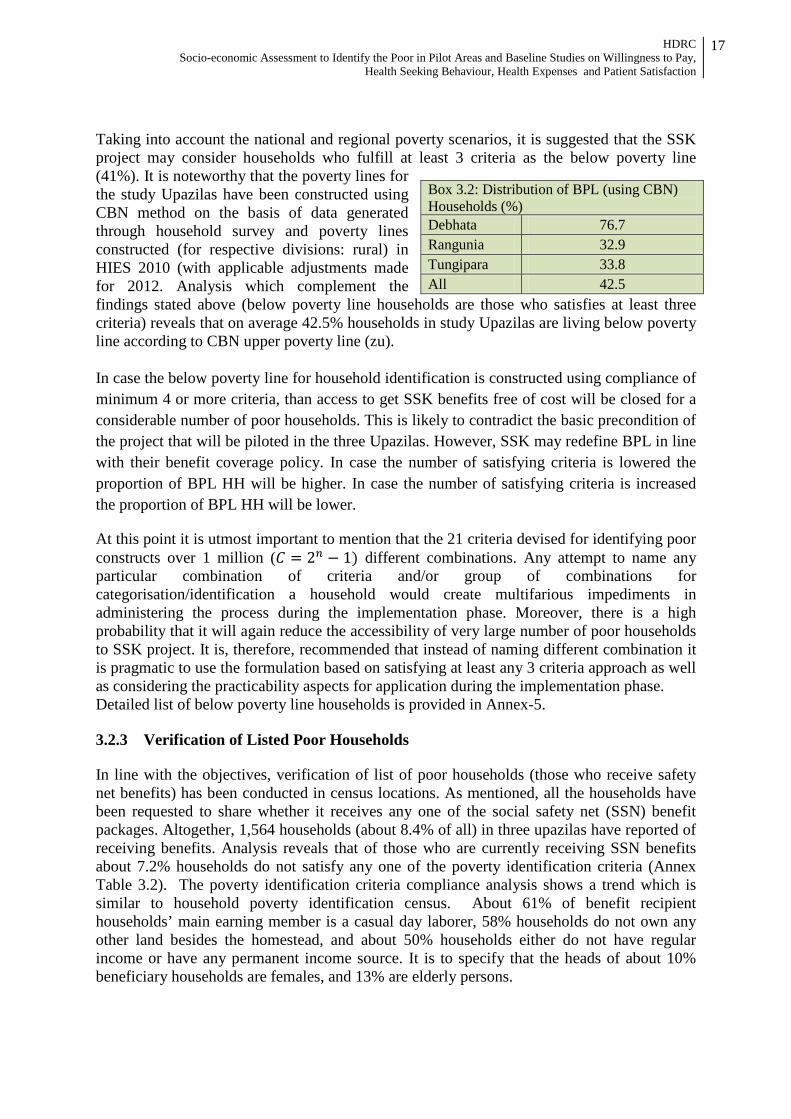
HDRC Socio-economic Assessment to Identify the Poor in Pilot Areas and Baseline Studies on Willingness to Pay,
Health Seeking Behaviour, Health Expenses and Patient Satisfaction
17
Taking into account the national and regional poverty scenarios, it is suggested that the SSK project may consider households who fulfill at least 3 criteria as the below poverty line (41%). It is noteworthy that the poverty lines for the study Upazilas have been constructed using CBN method on the basis of data generated through household survey and poverty lines constructed (for respective divisions: rural) in HIES 2010 (with applicable adjustments made for 2012. Analysis which complement the findings stated above (below poverty line households are those who satisfies at least three criteria) reveals that on average 42.5% households in study Upazilas are living below poverty line according to CBN upper poverty line (zu). In case the below poverty line for household identification is constructed using compliance of minimum 4 or more criteria, than access to get SSK benefits free of cost will be closed for a considerable number of poor households. This is likely to contradict the basic precondition of the project that will be piloted in the three Upazilas. However, SSK may redefine BPL in line with their benefit coverage policy. In case the number of satisfying criteria is lowered the proportion of BPL HH will be higher. In case the number of satisfying criteria is increased the proportion of BPL HH will be lower.
At this point it is utmost important to mention that the 21 criteria devised for identifying poor constructs over 1 million (𝐶 = 2𝑛 − 1) different combinations. Any attempt to name any particular combination of criteria and/or group of combinations for categorisation/identification a household would create multifarious impediments in administering the process during the implementation phase. Moreover, there is a high probability that it will again reduce the accessibility of very large number of poor households to SSK project. It is, therefore, recommended that instead of naming different combination it is pragmatic to use the formulation based on satisfying at least any 3 criteria approach as well as considering the practicability aspects for application during the implementation phase. Detailed list of below poverty line households is provided in Annex-5. 3.2.3 Verification of Listed Poor Households In line with the objectives, verification of list of poor households (those who receive safety net benefits) has been conducted in census locations. As mentioned, all the households have been requested to share whether it receives any one of the social safety net (SSN) benefit packages. Altogether, 1,564 households (about 8.4% of all) in three upazilas have reported of receiving benefits. Analysis reveals that of those who are currently receiving SSN benefits about 7.2% households do not satisfy any one of the poverty identification criteria (Annex Table 3.2). The poverty identification criteria compliance analysis shows a trend which is similar to household poverty identification census. About 61% of benefit recipient households’ main earning member is a casual day laborer, 58% households do not own any other land besides the homestead, and about 50% households either do not have regular income or have any permanent income source. It is to specify that the heads of about 10% beneficiary households are females, and 13% are elderly persons.
Box 3.2: Distribution of BPL (using CBN) Households (%) Debhata 76.7 Rangunia 32.9 Tungipara 33.8 All 42.5
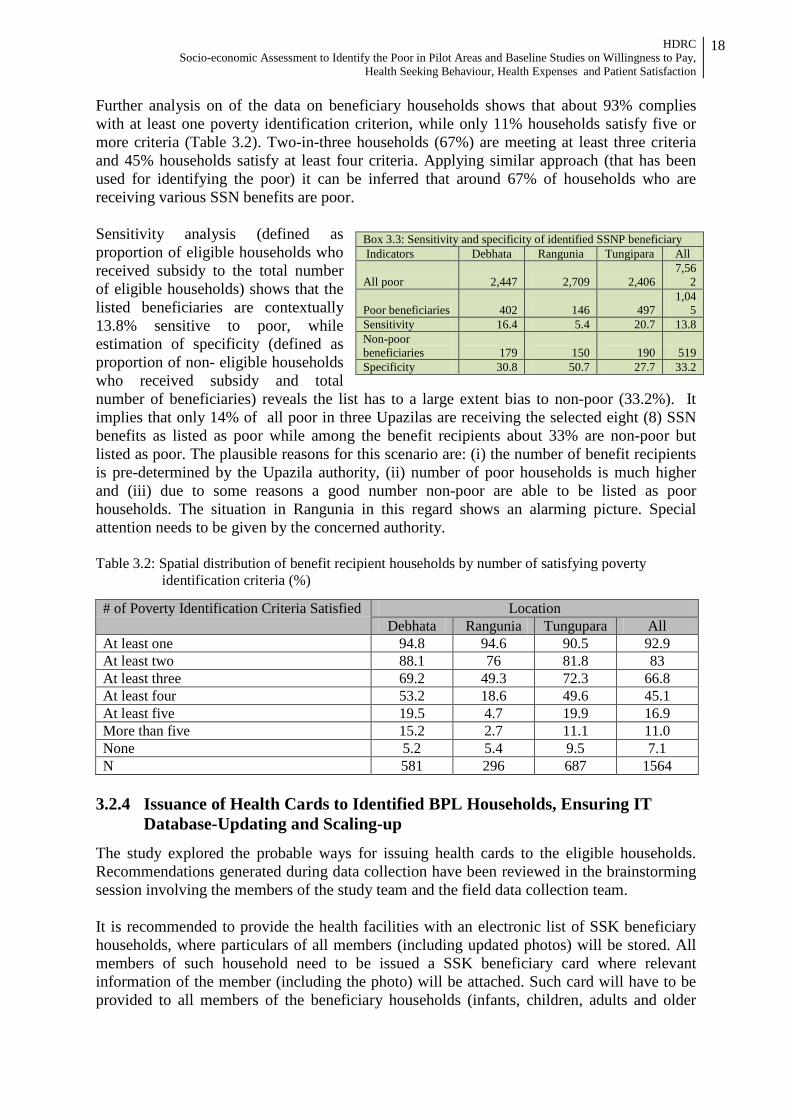
HDRC Socio-economic Assessment to Identify the Poor in Pilot Areas and Baseline Studies on Willingness to Pay,
Health Seeking Behaviour, Health Expenses and Patient Satisfaction
18
Further analysis on of the data on beneficiary households shows that about 93% complies with at least one poverty identification criterion, while only 11% households satisfy five or more criteria (Table 3.2). Two-in-three households (67%) are meeting at least three criteria and 45% households satisfy at least four criteria. Applying similar approach (that has been used for identifying the poor) it can be inferred that around 67% of households who are receiving various SSN benefits are poor. Sensitivity analysis (defined as proportion of eligible households who received subsidy to the total number of eligible households) shows that the listed beneficiaries are contextually 13.8% sensitive to poor, while estimation of specificity (defined as proportion of non- eligible households who received subsidy and total number of beneficiaries) reveals the list has to a large extent bias to non-poor (33.2%). It implies that only 14% of all poor in three Upazilas are receiving the selected eight (8) SSN benefits as listed as poor while among the benefit recipients about 33% are non-poor but listed as poor. The plausible reasons for this scenario are: (i) the number of benefit recipients is pre-determined by the Upazila authority, (ii) number of poor households is much higher and (iii) due to some reasons a good number non-poor are able to be listed as poor households. The situation in Rangunia in this regard shows an alarming picture. Special attention needs to be given by the concerned authority. Table 3.2: Spatial distribution of benefit recipient households by number of satisfying poverty
identification criteria (%)
# of Poverty Identification Criteria Satisfied Location Debhata Rangunia Tungupara All
At least one 94.8 94.6 90.5 92.9 At least two 88.1 76 81.8 83 At least three 69.2 49.3 72.3 66.8 At least four 53.2 18.6 49.6 45.1 At least five 19.5 4.7 19.9 16.9 More than five 15.2 2.7 11.1 11.0 None 5.2 5.4 9.5 7.1 N 581 296 687 1564
3.2.4 Issuance of Health Cards to Identified BPL Households, Ensuring IT Database-Updating and Scaling-up
The study explored the probable ways for issuing health cards to the eligible households. Recommendations generated during data collection have been reviewed in the brainstorming session involving the members of the study team and the field data collection team. It is recommended to provide the health facilities with an electronic list of SSK beneficiary households, where particulars of all members (including updated photos) will be stored. All members of such household need to be issued a SSK beneficiary card where relevant information of the member (including the photo) will be attached. Such card will have to be provided to all members of the beneficiary households (infants, children, adults and older
Box 3.3: Sensitivity and specificity of identified SSNP beneficiary Indicators Debhata Rangunia Tungipara All
All poor 2,447 2,709 2,406 7,56
2
Poor beneficiaries 402 146 497 1,04
5 Sensitivity 16.4 5.4 20.7 13.8 Non-poor beneficiaries 179 150 190 519 Specificity 30.8 50.7 27.7 33.2
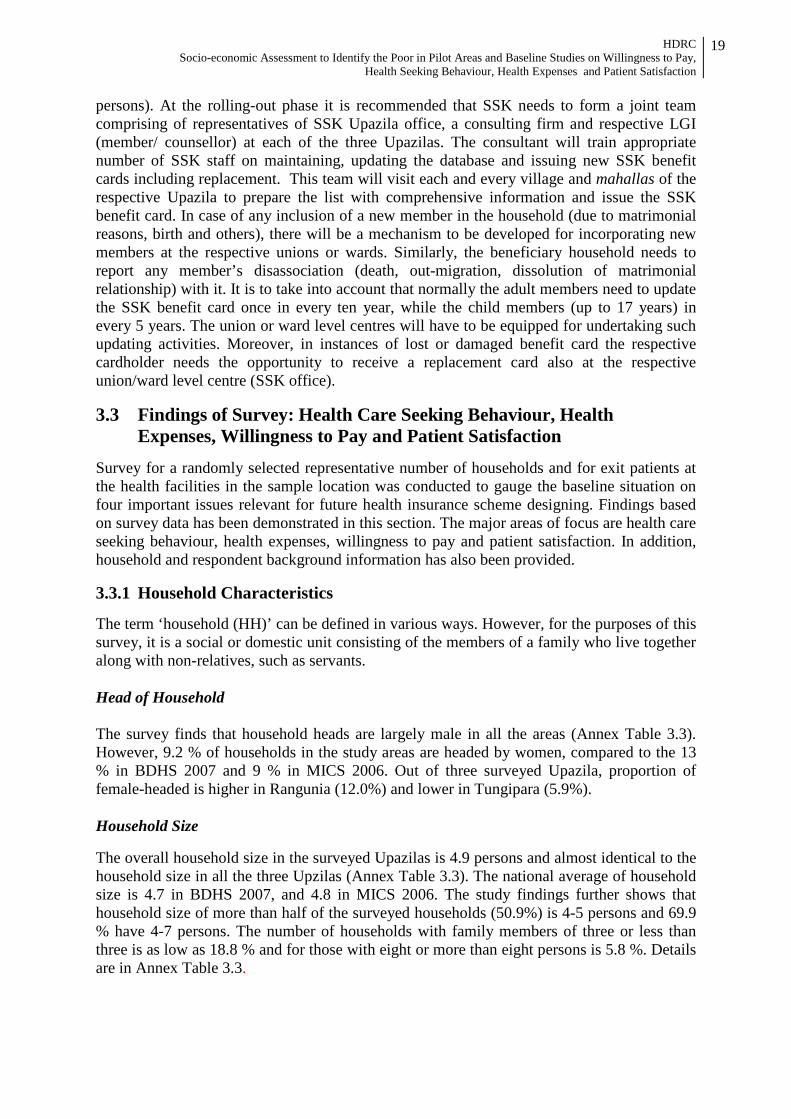
HDRC Socio-economic Assessment to Identify the Poor in Pilot Areas and Baseline Studies on Willingness to Pay,
Health Seeking Behaviour, Health Expenses and Patient Satisfaction
19
persons). At the rolling-out phase it is recommended that SSK needs to form a joint team comprising of representatives of SSK Upazila office, a consulting firm and respective LGI (member/ counsellor) at each of the three Upazilas. The consultant will train appropriate number of SSK staff on maintaining, updating the database and issuing new SSK benefit cards including replacement. This team will visit each and every village and mahallas of the respective Upazila to prepare the list with comprehensive information and issue the SSK benefit card. In case of any inclusion of a new member in the household (due to matrimonial reasons, birth and others), there will be a mechanism to be developed for incorporating new members at the respective unions or wards. Similarly, the beneficiary household needs to report any member’s disassociation (death, out-migration, dissolution of matrimonial relationship) with it. It is to take into account that normally the adult members need to update the SSK benefit card once in every ten year, while the child members (up to 17 years) in every 5 years. The union or ward level centres will have to be equipped for undertaking such updating activities. Moreover, in instances of lost or damaged benefit card the respective cardholder needs the opportunity to receive a replacement card also at the respective union/ward level centre (SSK office).
3.3 Findings of Survey: Health Care Seeking Behaviour, Health Expenses, Willingness to Pay and Patient Satisfaction
Survey for a randomly selected representative number of households and for exit patients at the health facilities in the sample location was conducted to gauge the baseline situation on four important issues relevant for future health insurance scheme designing. Findings based on survey data has been demonstrated in this section. The major areas of focus are health care seeking behaviour, health expenses, willingness to pay and patient satisfaction. In addition, household and respondent background information has also been provided. 3.3.1 Household Characteristics The term ‘household (HH)’ can be defined in various ways. However, for the purposes of this survey, it is a social or domestic unit consisting of the members of a family who live together along with non-relatives, such as servants. Head of Household The survey finds that household heads are largely male in all the areas (Annex Table 3.3). However, 9.2 % of households in the study areas are headed by women, compared to the 13 % in BDHS 2007 and 9 % in MICS 2006. Out of three surveyed Upazila, proportion of female-headed is higher in Rangunia (12.0%) and lower in Tungipara (5.9%). Household Size The overall household size in the surveyed Upazilas is 4.9 persons and almost identical to the household size in all the three Upzilas (Annex Table 3.3). The national average of household size is 4.7 in BDHS 2007, and 4.8 in MICS 2006. The study findings further shows that household size of more than half of the surveyed households (50.9%) is 4-5 persons and 69.9 % have 4-7 persons. The number of households with family members of three or less than three is as low as 18.8 % and for those with eight or more than eight persons is 5.8 %. Details are in Annex Table 3.3.
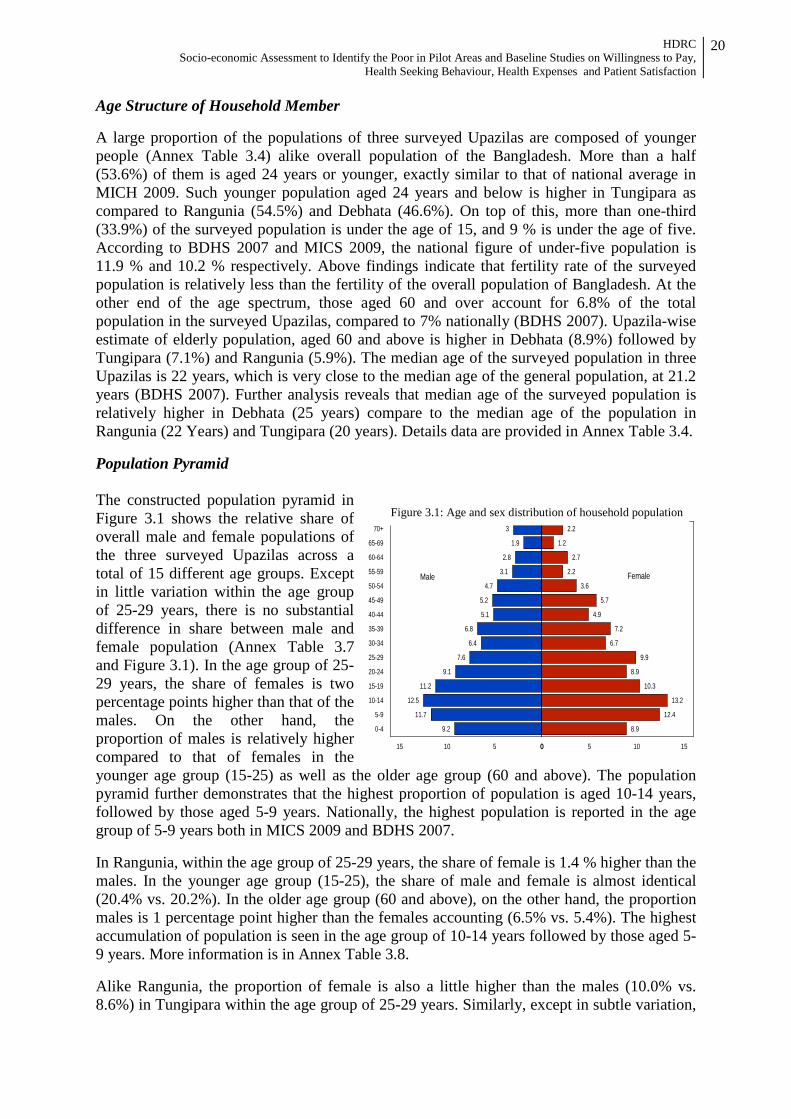
HDRC Socio-economic Assessment to Identify the Poor in Pilot Areas and Baseline Studies on Willingness to Pay,
Health Seeking Behaviour, Health Expenses and Patient Satisfaction
20
3
1.9
2.8
3.1
4.7
5.2
5.1
6.8
6.4
7.6
9.1
11.2
12.5
11.7
9.2
2.2
1.2
2.7
2.2
3.6
5.7
4.9
7.2
6.7
9.9
8.9
10.3
13.2
12.4
8.9
70+
65-69
60-64
55-59
50-54
45-49
40-44
35-39
30-34
25-29
20-24
15-19
10-14
5-9
0-4
051015 0 5 10 15
Male Female
Figure 3.1: Age and sex distribution of household population
Age Structure of Household Member A large proportion of the populations of three surveyed Upazilas are composed of younger people (Annex Table 3.4) alike overall population of the Bangladesh. More than a half (53.6%) of them is aged 24 years or younger, exactly similar to that of national average in MICH 2009. Such younger population aged 24 years and below is higher in Tungipara as compared to Rangunia (54.5%) and Debhata (46.6%). On top of this, more than one-third (33.9%) of the surveyed population is under the age of 15, and 9 % is under the age of five. According to BDHS 2007 and MICS 2009, the national figure of under-five population is 11.9 % and 10.2 % respectively. Above findings indicate that fertility rate of the surveyed population is relatively less than the fertility of the overall population of Bangladesh. At the other end of the age spectrum, those aged 60 and over account for 6.8% of the total population in the surveyed Upazilas, compared to 7% nationally (BDHS 2007). Upazila-wise estimate of elderly population, aged 60 and above is higher in Debhata (8.9%) followed by Tungipara (7.1%) and Rangunia (5.9%). The median age of the surveyed population in three Upazilas is 22 years, which is very close to the median age of the general population, at 21.2 years (BDHS 2007). Further analysis reveals that median age of the surveyed population is relatively higher in Debhata (25 years) compare to the median age of the population in Rangunia (22 Years) and Tungipara (20 years). Details data are provided in Annex Table 3.4. Population Pyramid The constructed population pyramid in Figure 3.1 shows the relative share of overall male and female populations of the three surveyed Upazilas across a total of 15 different age groups. Except in little variation within the age group of 25-29 years, there is no substantial difference in share between male and female population (Annex Table 3.7 and Figure 3.1). In the age group of 25-29 years, the share of females is two percentage points higher than that of the males. On the other hand, the proportion of males is relatively higher compared to that of females in the younger age group (15-25) as well as the older age group (60 and above). The population pyramid further demonstrates that the highest proportion of population is aged 10-14 years, followed by those aged 5-9 years. Nationally, the highest population is reported in the age group of 5-9 years both in MICS 2009 and BDHS 2007. In Rangunia, within the age group of 25-29 years, the share of female is 1.4 % higher than the males. In the younger age group (15-25), the share of male and female is almost identical (20.4% vs. 20.2%). In the older age group (60 and above), on the other hand, the proportion males is 1 percentage point higher than the females accounting (6.5% vs. 5.4%). The highest accumulation of population is seen in the age group of 10-14 years followed by those aged 5-9 years. More information is in Annex Table 3.8. Alike Rangunia, the proportion of female is also a little higher than the males (10.0% vs. 8.6%) in Tungipara within the age group of 25-29 years. Similarly, except in subtle variation,
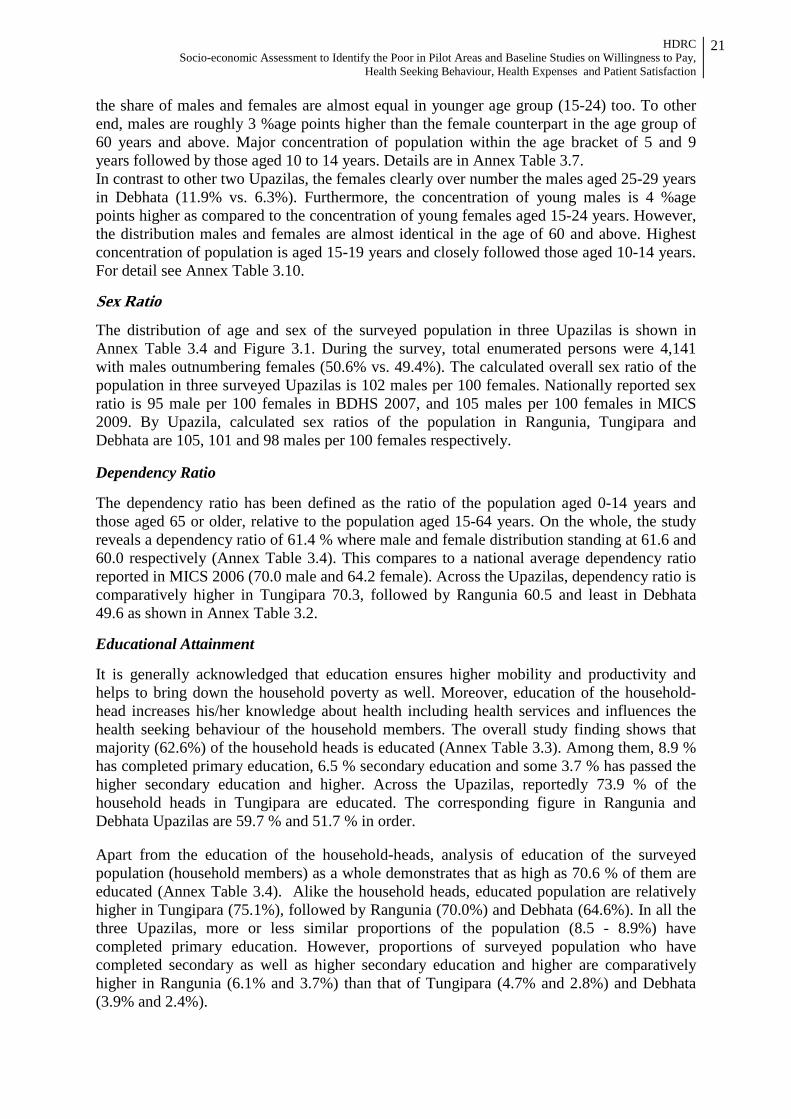
HDRC Socio-economic Assessment to Identify the Poor in Pilot Areas and Baseline Studies on Willingness to Pay,
Health Seeking Behaviour, Health Expenses and Patient Satisfaction
21
the share of males and females are almost equal in younger age group (15-24) too. To other end, males are roughly 3 %age points higher than the female counterpart in the age group of 60 years and above. Major concentration of population within the age bracket of 5 and 9 years followed by those aged 10 to 14 years. Details are in Annex Table 3.7. In contrast to other two Upazilas, the females clearly over number the males aged 25-29 years in Debhata (11.9% vs. 6.3%). Furthermore, the concentration of young males is 4 %age points higher as compared to the concentration of young females aged 15-24 years. However, the distribution males and females are almost identical in the age of 60 and above. Highest concentration of population is aged 15-19 years and closely followed those aged 10-14 years. For detail see Annex Table 3.10. Sex Ratio
The distribution of age and sex of the surveyed population in three Upazilas is shown in Annex Table 3.4 and Figure 3.1. During the survey, total enumerated persons were 4,141 with males outnumbering females (50.6% vs. 49.4%). The calculated overall sex ratio of the population in three surveyed Upazilas is 102 males per 100 females. Nationally reported sex ratio is 95 male per 100 females in BDHS 2007, and 105 males per 100 females in MICS 2009. By Upazila, calculated sex ratios of the population in Rangunia, Tungipara and Debhata are 105, 101 and 98 males per 100 females respectively. Dependency Ratio The dependency ratio has been defined as the ratio of the population aged 0-14 years and those aged 65 or older, relative to the population aged 15-64 years. On the whole, the study reveals a dependency ratio of 61.4 % where male and female distribution standing at 61.6 and 60.0 respectively (Annex Table 3.4). This compares to a national average dependency ratio reported in MICS 2006 (70.0 male and 64.2 female). Across the Upazilas, dependency ratio is comparatively higher in Tungipara 70.3, followed by Rangunia 60.5 and least in Debhata 49.6 as shown in Annex Table 3.2. Educational Attainment It is generally acknowledged that education ensures higher mobility and productivity and helps to bring down the household poverty as well. Moreover, education of the household-head increases his/her knowledge about health including health services and influences the health seeking behaviour of the household members. The overall study finding shows that majority (62.6%) of the household heads is educated (Annex Table 3.3). Among them, 8.9 % has completed primary education, 6.5 % secondary education and some 3.7 % has passed the higher secondary education and higher. Across the Upazilas, reportedly 73.9 % of the household heads in Tungipara are educated. The corresponding figure in Rangunia and Debhata Upazilas are 59.7 % and 51.7 % in order. Apart from the education of the household-heads, analysis of education of the surveyed population (household members) as a whole demonstrates that as high as 70.6 % of them are educated (Annex Table 3.4). Alike the household heads, educated population are relatively higher in Tungipara (75.1%), followed by Rangunia (70.0%) and Debhata (64.6%). In all the three Upazilas, more or less similar proportions of the population (8.5 - 8.9%) have completed primary education. However, proportions of surveyed population who have completed secondary as well as higher secondary education and higher are comparatively higher in Rangunia (6.1% and 3.7%) than that of Tungipara (4.7% and 2.8%) and Debhata (3.9% and 2.4%).
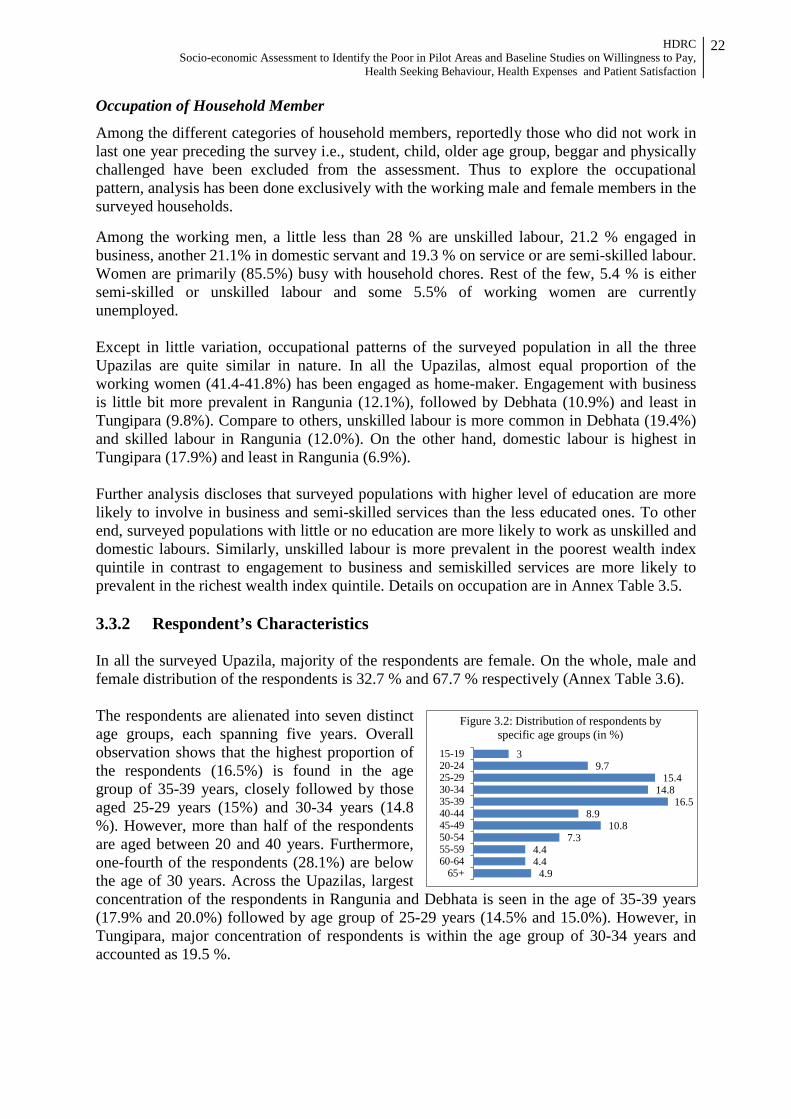
HDRC Socio-economic Assessment to Identify the Poor in Pilot Areas and Baseline Studies on Willingness to Pay,
Health Seeking Behaviour, Health Expenses and Patient Satisfaction
22
3 9.7
15.4 14.8
16.5 8.9
10.8 7.3
4.4 4.4
4.9
15-1920-2425-2930-3435-3940-4445-4950-5455-5960-64
65+
Figure 3.2: Distribution of respondents by specific age groups (in %)
Occupation of Household Member
Among the different categories of household members, reportedly those who did not work in last one year preceding the survey i.e., student, child, older age group, beggar and physically challenged have been excluded from the assessment. Thus to explore the occupational pattern, analysis has been done exclusively with the working male and female members in the surveyed households. Among the working men, a little less than 28 % are unskilled labour, 21.2 % engaged in business, another 21.1% in domestic servant and 19.3 % on service or are semi-skilled labour. Women are primarily (85.5%) busy with household chores. Rest of the few, 5.4 % is either semi-skilled or unskilled labour and some 5.5% of working women are currently unemployed. Except in little variation, occupational patterns of the surveyed population in all the three Upazilas are quite similar in nature. In all the Upazilas, almost equal proportion of the working women (41.4-41.8%) has been engaged as home-maker. Engagement with business is little bit more prevalent in Rangunia (12.1%), followed by Debhata (10.9%) and least in Tungipara (9.8%). Compare to others, unskilled labour is more common in Debhata (19.4%) and skilled labour in Rangunia (12.0%). On the other hand, domestic labour is highest in Tungipara (17.9%) and least in Rangunia (6.9%). Further analysis discloses that surveyed populations with higher level of education are more likely to involve in business and semi-skilled services than the less educated ones. To other end, surveyed populations with little or no education are more likely to work as unskilled and domestic labours. Similarly, unskilled labour is more prevalent in the poorest wealth index quintile in contrast to engagement to business and semiskilled services are more likely to prevalent in the richest wealth index quintile. Details on occupation are in Annex Table 3.5. 3.3.2 Respondent’s Characteristics In all the surveyed Upazila, majority of the respondents are female. On the whole, male and female distribution of the respondents is 32.7 % and 67.7 % respectively (Annex Table 3.6). The respondents are alienated into seven distinct age groups, each spanning five years. Overall observation shows that the highest proportion of the respondents (16.5%) is found in the age group of 35-39 years, closely followed by those aged 25-29 years (15%) and 30-34 years (14.8 %). However, more than half of the respondents are aged between 20 and 40 years. Furthermore, one-fourth of the respondents (28.1%) are below the age of 30 years. Across the Upazilas, largest concentration of the respondents in Rangunia and Debhata is seen in the age of 35-39 years (17.9% and 20.0%) followed by age group of 25-29 years (14.5% and 15.0%). However, in Tungipara, major concentration of respondents is within the age group of 30-34 years and accounted as 19.5 %.
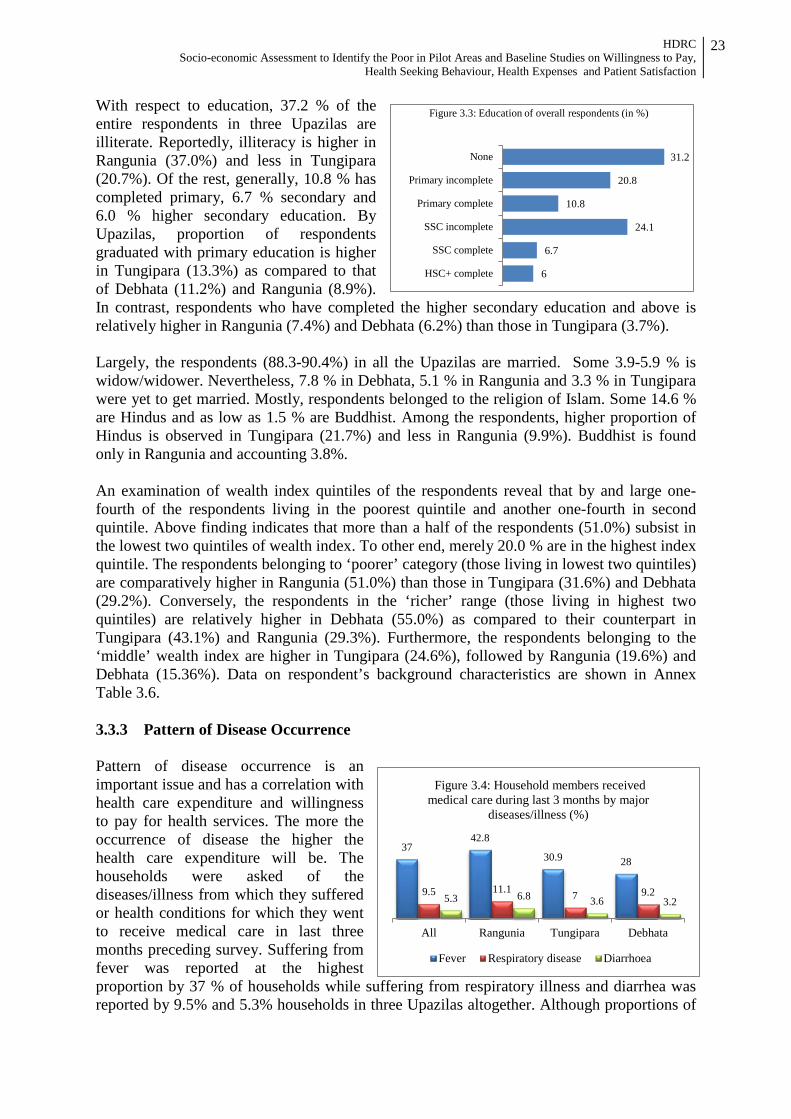
HDRC Socio-economic Assessment to Identify the Poor in Pilot Areas and Baseline Studies on Willingness to Pay,
Health Seeking Behaviour, Health Expenses and Patient Satisfaction
23
31.2
20.8
10.8
24.1
6.7
6
None
Primary incomplete
Primary complete
SSC incomplete
SSC complete
HSC+ complete
Figure 3.3: Education of overall respondents (in %) With respect to education, 37.2 % of the entire respondents in three Upazilas are illiterate. Reportedly, illiteracy is higher in Rangunia (37.0%) and less in Tungipara (20.7%). Of the rest, generally, 10.8 % has completed primary, 6.7 % secondary and 6.0 % higher secondary education. By Upazilas, proportion of respondents graduated with primary education is higher in Tungipara (13.3%) as compared to that of Debhata (11.2%) and Rangunia (8.9%). In contrast, respondents who have completed the higher secondary education and above is relatively higher in Rangunia (7.4%) and Debhata (6.2%) than those in Tungipara (3.7%). Largely, the respondents (88.3-90.4%) in all the Upazilas are married. Some 3.9-5.9 % is widow/widower. Nevertheless, 7.8 % in Debhata, 5.1 % in Rangunia and 3.3 % in Tungipara were yet to get married. Mostly, respondents belonged to the religion of Islam. Some 14.6 % are Hindus and as low as 1.5 % are Buddhist. Among the respondents, higher proportion of Hindus is observed in Tungipara (21.7%) and less in Rangunia (9.9%). Buddhist is found only in Rangunia and accounting 3.8%. An examination of wealth index quintiles of the respondents reveal that by and large one-fourth of the respondents living in the poorest quintile and another one-fourth in second quintile. Above finding indicates that more than a half of the respondents (51.0%) subsist in the lowest two quintiles of wealth index. To other end, merely 20.0 % are in the highest index quintile. The respondents belonging to ‘poorer’ category (those living in lowest two quintiles) are comparatively higher in Rangunia (51.0%) than those in Tungipara (31.6%) and Debhata (29.2%). Conversely, the respondents in the ‘richer’ range (those living in highest two quintiles) are relatively higher in Debhata (55.0%) as compared to their counterpart in Tungipara (43.1%) and Rangunia (29.3%). Furthermore, the respondents belonging to the ‘middle’ wealth index are higher in Tungipara (24.6%), followed by Rangunia (19.6%) and Debhata (15.36%). Data on respondent’s background characteristics are shown in Annex Table 3.6. 3.3.3 Pattern of Disease Occurrence Pattern of disease occurrence is an important issue and has a correlation with health care expenditure and willingness to pay for health services. The more the occurrence of disease the higher the health care expenditure will be. The households were asked of the diseases/illness from which they suffered or health conditions for which they went to receive medical care in last three months preceding survey. Suffering from fever was reported at the highest proportion by 37 % of households while suffering from respiratory illness and diarrhea was reported by 9.5% and 5.3% households in three Upazilas altogether. Although proportions of
37 42.8
30.9 28
9.5 11.1 7 9.2 5.3 6.8 3.6 3.2
All Rangunia Tungipara Debhata
Figure 3.4: Household members received medical care during last 3 months by major
diseases/illness (%)
Fever Respiratory disease Diarrhoea
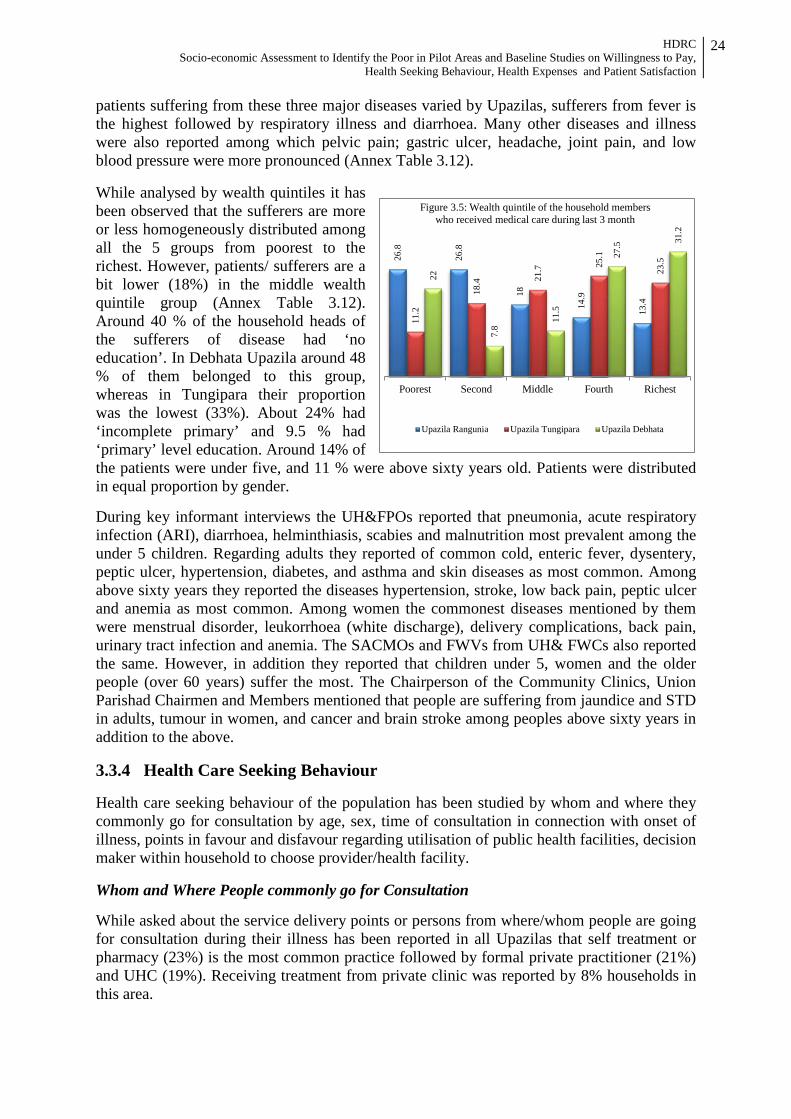
HDRC Socio-economic Assessment to Identify the Poor in Pilot Areas and Baseline Studies on Willingness to Pay,
Health Seeking Behaviour, Health Expenses and Patient Satisfaction
24
patients suffering from these three major diseases varied by Upazilas, sufferers from fever is the highest followed by respiratory illness and diarrhoea. Many other diseases and illness were also reported among which pelvic pain; gastric ulcer, headache, joint pain, and low blood pressure were more pronounced (Annex Table 3.12). While analysed by wealth quintiles it has been observed that the sufferers are more or less homogeneously distributed among all the 5 groups from poorest to the richest. However, patients/ sufferers are a bit lower (18%) in the middle wealth quintile group (Annex Table 3.12). Around 40 % of the household heads of the sufferers of disease had ‘no education’. In Debhata Upazila around 48 % of them belonged to this group, whereas in Tungipara their proportion was the lowest (33%). About 24% had ‘incomplete primary’ and 9.5 % had ‘primary’ level education. Around 14% of the patients were under five, and 11 % were above sixty years old. Patients were distributed in equal proportion by gender. During key informant interviews the UH&FPOs reported that pneumonia, acute respiratory infection (ARI), diarrhoea, helminthiasis, scabies and malnutrition most prevalent among the under 5 children. Regarding adults they reported of common cold, enteric fever, dysentery, peptic ulcer, hypertension, diabetes, and asthma and skin diseases as most common. Among above sixty years they reported the diseases hypertension, stroke, low back pain, peptic ulcer and anemia as most common. Among women the commonest diseases mentioned by them were menstrual disorder, leukorrhoea (white discharge), delivery complications, back pain, urinary tract infection and anemia. The SACMOs and FWVs from UH& FWCs also reported the same. However, in addition they reported that children under 5, women and the older people (over 60 years) suffer the most. The Chairperson of the Community Clinics, Union Parishad Chairmen and Members mentioned that people are suffering from jaundice and STD in adults, tumour in women, and cancer and brain stroke among peoples above sixty years in addition to the above. 3.3.4 Health Care Seeking Behaviour Health care seeking behaviour of the population has been studied by whom and where they commonly go for consultation by age, sex, time of consultation in connection with onset of illness, points in favour and disfavour regarding utilisation of public health facilities, decision maker within household to choose provider/health facility. Whom and Where People commonly go for Consultation While asked about the service delivery points or persons from where/whom people are going for consultation during their illness has been reported in all Upazilas that self treatment or pharmacy (23%) is the most common practice followed by formal private practitioner (21%) and UHC (19%). Receiving treatment from private clinic was reported by 8% households in this area.
26.8
26.8
18
14.9
13.4
11.2
18.4
21.7
25.1
23.5
22
7.8
11.5
27.5
31.2
Poorest Second Middle Fourth Richest
Figure 3.5: Wealth quintile of the household members who received medical care during last 3 month
Upazila Rangunia Upazila Tungipara Upazila Debhata
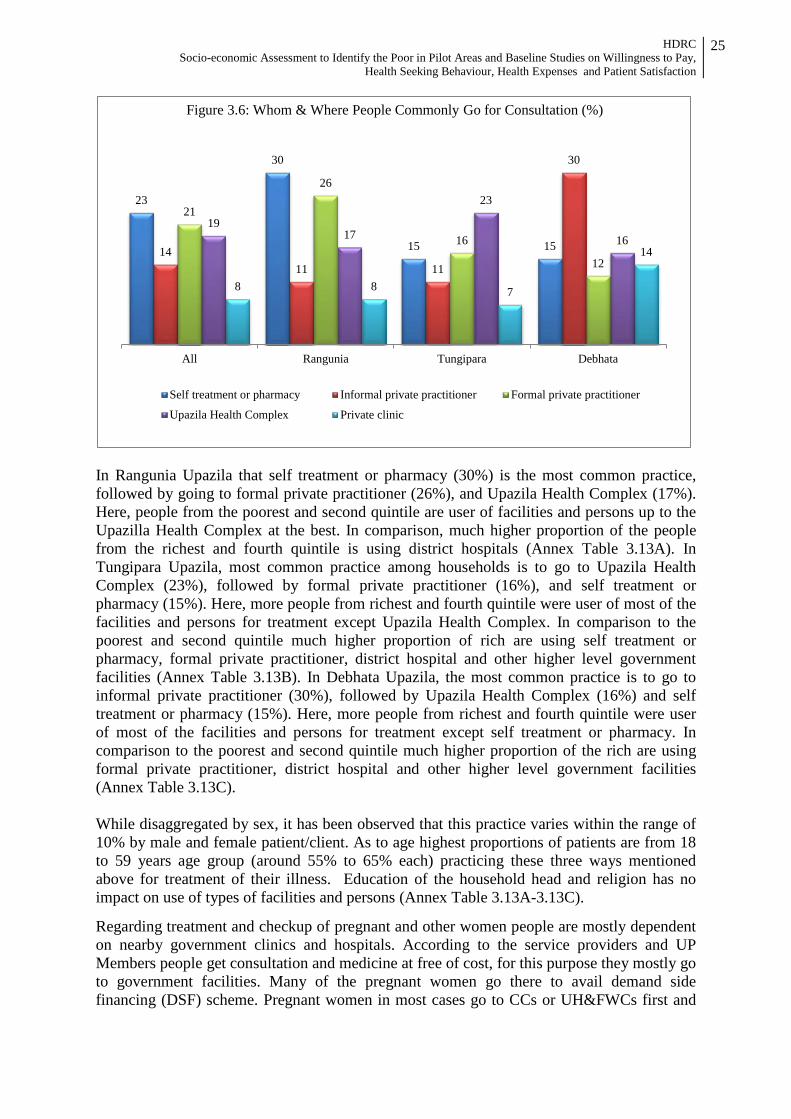
HDRC Socio-economic Assessment to Identify the Poor in Pilot Areas and Baseline Studies on Willingness to Pay,
Health Seeking Behaviour, Health Expenses and Patient Satisfaction
25
In Rangunia Upazila that self treatment or pharmacy (30%) is the most common practice, followed by going to formal private practitioner (26%), and Upazila Health Complex (17%). Here, people from the poorest and second quintile are user of facilities and persons up to the Upazilla Health Complex at the best. In comparison, much higher proportion of the people from the richest and fourth quintile is using district hospitals (Annex Table 3.13A). In Tungipara Upazila, most common practice among households is to go to Upazila Health Complex (23%), followed by formal private practitioner (16%), and self treatment or pharmacy (15%). Here, more people from richest and fourth quintile were user of most of the facilities and persons for treatment except Upazila Health Complex. In comparison to the poorest and second quintile much higher proportion of rich are using self treatment or pharmacy, formal private practitioner, district hospital and other higher level government facilities (Annex Table 3.13B). In Debhata Upazila, the most common practice is to go to informal private practitioner (30%), followed by Upazila Health Complex (16%) and self treatment or pharmacy (15%). Here, more people from richest and fourth quintile were user of most of the facilities and persons for treatment except self treatment or pharmacy. In comparison to the poorest and second quintile much higher proportion of the rich are using formal private practitioner, district hospital and other higher level government facilities (Annex Table 3.13C). While disaggregated by sex, it has been observed that this practice varies within the range of 10% by male and female patient/client. As to age highest proportions of patients are from 18 to 59 years age group (around 55% to 65% each) practicing these three ways mentioned above for treatment of their illness. Education of the household head and religion has no impact on use of types of facilities and persons (Annex Table 3.13A-3.13C).
Regarding treatment and checkup of pregnant and other women people are mostly dependent on nearby government clinics and hospitals. According to the service providers and UP Members people get consultation and medicine at free of cost, for this purpose they mostly go to government facilities. Many of the pregnant women go there to avail demand side financing (DSF) scheme. Pregnant women in most cases go to CCs or UH&FWCs first and
23
30
15 15 14 11 11
30
21
26
16
12
19 17
23
16
8 8 7
14
All Rangunia Tungipara Debhata
Figure 3.6: Whom & Where People Commonly Go for Consultation (%)
Self treatment or pharmacy Informal private practitioner Formal private practitioner
Upazila Health Complex Private clinic

HDRC Socio-economic Assessment to Identify the Poor in Pilot Areas and Baseline Studies on Willingness to Pay,
Health Seeking Behaviour, Health Expenses and Patient Satisfaction
26
then go to UHCs and District Hospitals. They only go to private clinics whenever service providers or required service is not available at government facilities. Non-availability of required number of doctors is a great factor in this regard. According to most of them pregnant women is mostly dependant on the UHFWCs and UHCs for antenatal and post-natal check-ups. They also go to NGO clinics for this purpose. When people get sick they generally prefer to go nearby government facilities. Many of them also go to local pharmacies and village doctors. However, rich people mostly prefer private facilities as doctors as other services with good quality are available there and they can afford this. While discussed the same in FGD with poor residents of 3 Upazilas, almost the same has been reported by the discussants. Accompaniment with Patient during Consultation The respondents reporting of consulting somebody/facilities were asked whether somebody accompanied them or not. In Rangunia of the patients were accompanied by somebody. It is 78 % for Tungipara and 73 % for Debhata Upazila. Accompaniment is higher for females than those of the males (Annex Table 3.14). Types of Services Received The respondents reported of consulting somebody/facilities were asked about the types of services received, whether indoor or outdoor. Most of the patients (92%) reported of receiving out-patient services while only 8%received in-patient services. In Rangunia Upazila, around 96% of the respondents reported receiving outdoor medical services and 4% received indoor services. Male and female are almost equal in proportion among those received outdoor or indoor services. Half of the patients receiving outdoor services were from 18-59 years age group, and 15% were under fives. Around 54% of the patients receiving outdoor services were from poorest and second quintile, and only 28% from the richest and fourth quintile (Annex Table 3.15A). In Tungipara Upazila, around 89 % of the respondents reported of receiving outdoor medical services and 11 % received indoor services. Male and female are almost equal in proportion among those received outdoor services. 58 % of the patients receiving outdoor services were from 18-59 years age group, and 13 % were under fives. Only 27 % of the patients receiving outdoor services were from poorest and second quintile, and 49 % from the richest and fourth quintile (Annex Table 3.15B). In Debhata Upazila, around 23 % of the respondents reported of receiving outdoor medical services and 4 % received indoor services. Higher proportion of females received outdoor medical services (54%) and indoor medical services than their male counterparts. 57% of the patients receiving outdoor services were from 18-59 years age group, and 17 % were under 5 years. Around 32 % of the patients receiving outdoor services were from poorest and second quintile, and 56 % from the richest and fourth quintile (Annex Table 3.15C).
8 4 11 14
92 96 89 86
All Rangunia Tungipara Debhata
Figure 3.7: Distribution of the respondents receiving medical care by type of services (%)
Indoor Outdoor
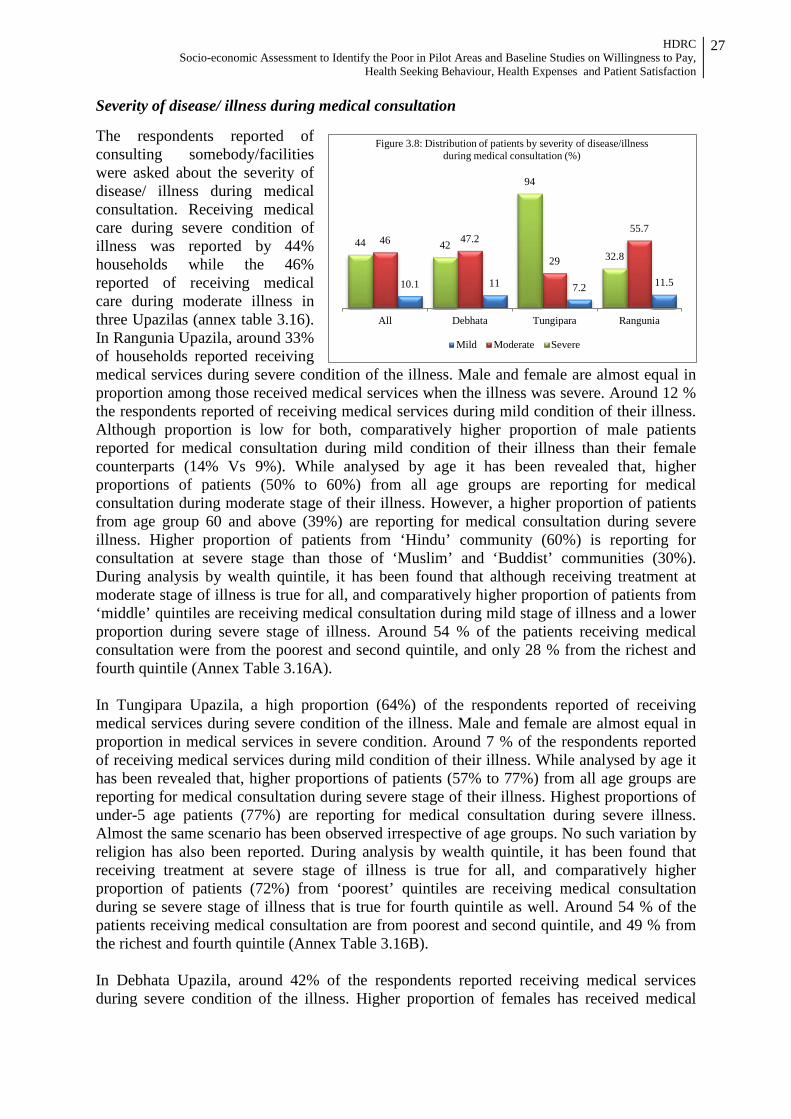
HDRC Socio-economic Assessment to Identify the Poor in Pilot Areas and Baseline Studies on Willingness to Pay,
Health Seeking Behaviour, Health Expenses and Patient Satisfaction
27
Severity of disease/ illness during medical consultation The respondents reported of consulting somebody/facilities were asked about the severity of disease/ illness during medical consultation. Receiving medical care during severe condition of illness was reported by 44% households while the 46% reported of receiving medical care during moderate illness in three Upazilas (annex table 3.16). In Rangunia Upazila, around 33% of households reported receiving medical services during severe condition of the illness. Male and female are almost equal in proportion among those received medical services when the illness was severe. Around 12 % the respondents reported of receiving medical services during mild condition of their illness. Although proportion is low for both, comparatively higher proportion of male patients reported for medical consultation during mild condition of their illness than their female counterparts (14% Vs 9%). While analysed by age it has been revealed that, higher proportions of patients (50% to 60%) from all age groups are reporting for medical consultation during moderate stage of their illness. However, a higher proportion of patients from age group 60 and above (39%) are reporting for medical consultation during severe illness. Higher proportion of patients from ‘Hindu’ community (60%) is reporting for consultation at severe stage than those of ‘Muslim’ and ‘Buddist’ communities (30%). During analysis by wealth quintile, it has been found that although receiving treatment at moderate stage of illness is true for all, and comparatively higher proportion of patients from ‘middle’ quintiles are receiving medical consultation during mild stage of illness and a lower proportion during severe stage of illness. Around 54 % of the patients receiving medical consultation were from the poorest and second quintile, and only 28 % from the richest and fourth quintile (Annex Table 3.16A). In Tungipara Upazila, a high proportion (64%) of the respondents reported of receiving medical services during severe condition of the illness. Male and female are almost equal in proportion in medical services in severe condition. Around 7 % of the respondents reported of receiving medical services during mild condition of their illness. While analysed by age it has been revealed that, higher proportions of patients (57% to 77%) from all age groups are reporting for medical consultation during severe stage of their illness. Highest proportions of under-5 age patients (77%) are reporting for medical consultation during severe illness. Almost the same scenario has been observed irrespective of age groups. No such variation by religion has also been reported. During analysis by wealth quintile, it has been found that receiving treatment at severe stage of illness is true for all, and comparatively higher proportion of patients (72%) from ‘poorest’ quintiles are receiving medical consultation during se severe stage of illness that is true for fourth quintile as well. Around 54 % of the patients receiving medical consultation are from poorest and second quintile, and 49 % from the richest and fourth quintile (Annex Table 3.16B). In Debhata Upazila, around 42% of the respondents reported receiving medical services during severe condition of the illness. Higher proportion of females has received medical
11.5 7.2 11 10.1
55.7
29
47.2 46 32.8
94
42 44
RanguniaTungiparaDebhataAll
Figure 3.8: Distribution of patients by severity of disease/illness during medical consultation (%)
Mild Moderate Severe
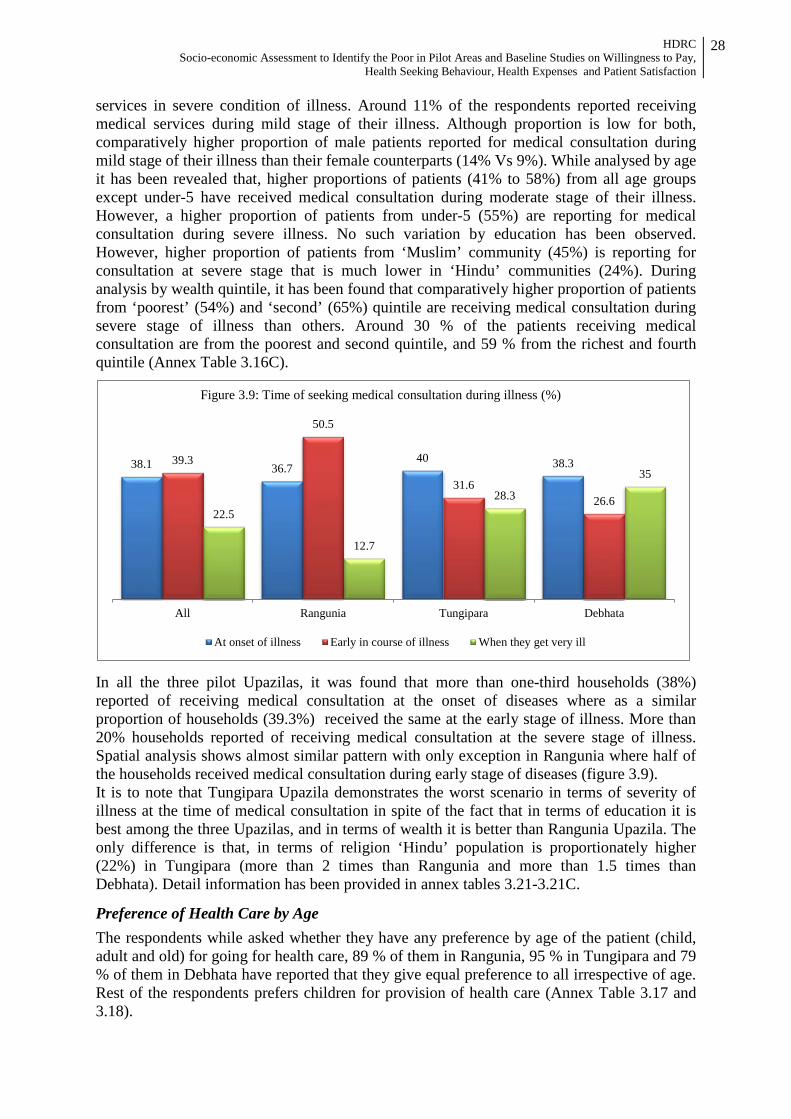
HDRC Socio-economic Assessment to Identify the Poor in Pilot Areas and Baseline Studies on Willingness to Pay,
Health Seeking Behaviour, Health Expenses and Patient Satisfaction
28
services in severe condition of illness. Around 11% of the respondents reported receiving medical services during mild stage of their illness. Although proportion is low for both, comparatively higher proportion of male patients reported for medical consultation during mild stage of their illness than their female counterparts (14% Vs 9%). While analysed by age it has been revealed that, higher proportions of patients (41% to 58%) from all age groups except under-5 have received medical consultation during moderate stage of their illness. However, a higher proportion of patients from under-5 (55%) are reporting for medical consultation during severe illness. No such variation by education has been observed. However, higher proportion of patients from ‘Muslim’ community (45%) is reporting for consultation at severe stage that is much lower in ‘Hindu’ communities (24%). During analysis by wealth quintile, it has been found that comparatively higher proportion of patients from ‘poorest’ (54%) and ‘second’ (65%) quintile are receiving medical consultation during severe stage of illness than others. Around 30 % of the patients receiving medical consultation are from the poorest and second quintile, and 59 % from the richest and fourth quintile (Annex Table 3.16C).
In all the three pilot Upazilas, it was found that more than one-third households (38%) reported of receiving medical consultation at the onset of diseases where as a similar proportion of households (39.3%) received the same at the early stage of illness. More than 20% households reported of receiving medical consultation at the severe stage of illness. Spatial analysis shows almost similar pattern with only exception in Rangunia where half of the households received medical consultation during early stage of diseases (figure 3.9). It is to note that Tungipara Upazila demonstrates the worst scenario in terms of severity of illness at the time of medical consultation in spite of the fact that in terms of education it is best among the three Upazilas, and in terms of wealth it is better than Rangunia Upazila. The only difference is that, in terms of religion ‘Hindu’ population is proportionately higher (22%) in Tungipara (more than 2 times than Rangunia and more than 1.5 times than Debhata). Detail information has been provided in annex tables 3.21-3.21C.
Preference of Health Care by Age
The respondents while asked whether they have any preference by age of the patient (child, adult and old) for going for health care, 89 % of them in Rangunia, 95 % in Tungipara and 79 % of them in Debhata have reported that they give equal preference to all irrespective of age. Rest of the respondents prefers children for provision of health care (Annex Table 3.17 and 3.18).
38.1 36.7 40 38.3 39.3
50.5
31.6 26.6
22.5
12.7
28.3
35
All Rangunia Tungipara Debhata
Figure 3.9: Time of seeking medical consultation during illness (%)
At onset of illness Early in course of illness When they get very ill
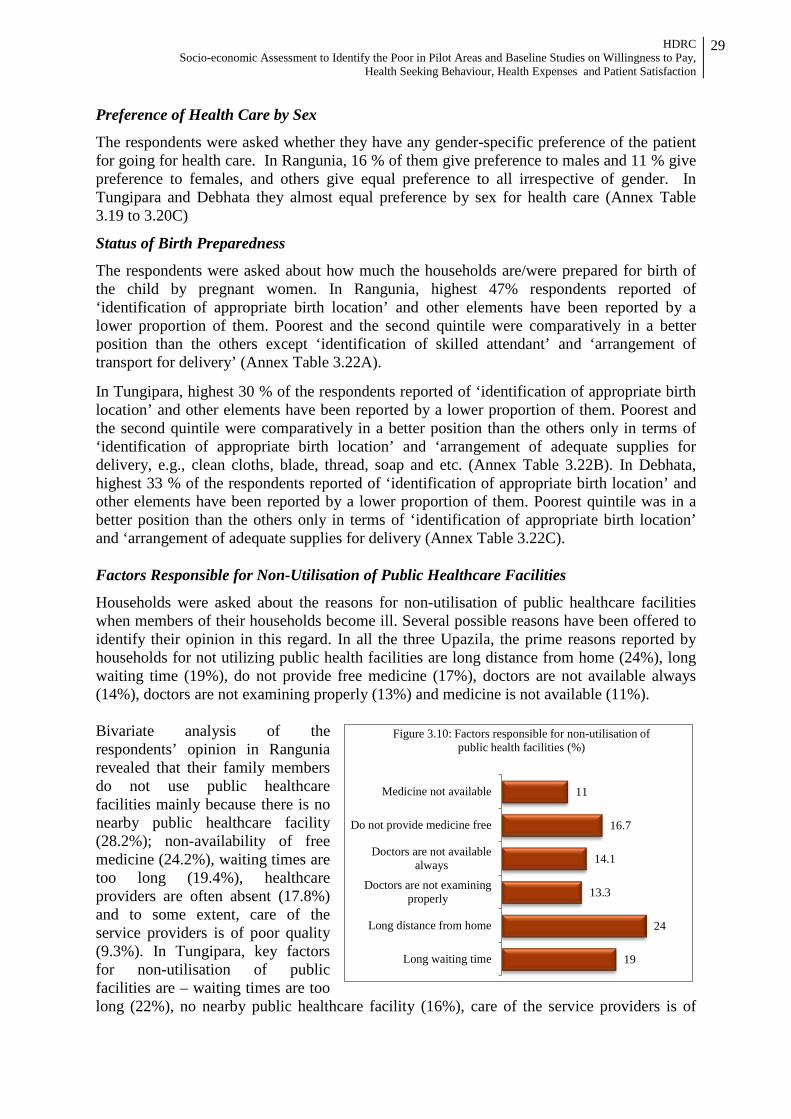
HDRC Socio-economic Assessment to Identify the Poor in Pilot Areas and Baseline Studies on Willingness to Pay,
Health Seeking Behaviour, Health Expenses and Patient Satisfaction
29
Preference of Health Care by Sex
The respondents were asked whether they have any gender-specific preference of the patient for going for health care. In Rangunia, 16 % of them give preference to males and 11 % give preference to females, and others give equal preference to all irrespective of gender. In Tungipara and Debhata they almost equal preference by sex for health care (Annex Table 3.19 to 3.20C)
Status of Birth Preparedness
The respondents were asked about how much the households are/were prepared for birth of the child by pregnant women. In Rangunia, highest 47% respondents reported of ‘identification of appropriate birth location’ and other elements have been reported by a lower proportion of them. Poorest and the second quintile were comparatively in a better position than the others except ‘identification of skilled attendant’ and ‘arrangement of transport for delivery’ (Annex Table 3.22A).
In Tungipara, highest 30 % of the respondents reported of ‘identification of appropriate birth location’ and other elements have been reported by a lower proportion of them. Poorest and the second quintile were comparatively in a better position than the others only in terms of ‘identification of appropriate birth location’ and ‘arrangement of adequate supplies for delivery, e.g., clean cloths, blade, thread, soap and etc. (Annex Table 3.22B). In Debhata, highest 33 % of the respondents reported of ‘identification of appropriate birth location’ and other elements have been reported by a lower proportion of them. Poorest quintile was in a better position than the others only in terms of ‘identification of appropriate birth location’ and ‘arrangement of adequate supplies for delivery (Annex Table 3.22C). Factors Responsible for Non-Utilisation of Public Healthcare Facilities
Households were asked about the reasons for non-utilisation of public healthcare facilities when members of their households become ill. Several possible reasons have been offered to identify their opinion in this regard. In all the three Upazila, the prime reasons reported by households for not utilizing public health facilities are long distance from home (24%), long waiting time (19%), do not provide free medicine (17%), doctors are not available always (14%), doctors are not examining properly (13%) and medicine is not available (11%). Bivariate analysis of the respondents’ opinion in Rangunia revealed that their family members do not use public healthcare facilities mainly because there is no nearby public healthcare facility (28.2%); non-availability of free medicine (24.2%), waiting times are too long (19.4%), healthcare providers are often absent (17.8%) and to some extent, care of the service providers is of poor quality (9.3%). In Tungipara, key factors for non-utilisation of public facilities are – waiting times are too long (22%), no nearby public healthcare facility (16%), care of the service providers is of
19
24
13.3
14.1
16.7
11
Long waiting time
Long distance from home
Doctors are not examiningproperly
Doctors are not availablealways
Do not provide medicine free
Medicine not available
Figure 3.10: Factors responsible for non-utilisation of public health facilities (%)

HDRC Socio-economic Assessment to Identify the Poor in Pilot Areas and Baseline Studies on Willingness to Pay,
Health Seeking Behaviour, Health Expenses and Patient Satisfaction
30
poor quality (15.7%) and non-availability of required medicine (10%). Apart from these, do not feel to consult anyone for their illness, healthcare providers are often absent, and non-availability of free medicine has also been reported by 9.7 %, 9.3 % and 9.3 % respectively for non-utilisation of public healthcare facilities. Similarly in Debhata, the principal factors of non-utilisation of public healthcare facilities are – there is no nearby public healthcare facility (24.4%), care of the service providers is of poor quality (22.6%), non-availability of required medicine (22%), waiting times are too long (12.5%), healthcare providers are often absent (10.1%) and to some extent non-availability of specialist physician (9.5%). Detail data is given in annex table 3.23. However, to assess the statistical association between the dependent variable (non-utilisation of public healthcare facilities) and independent variables (over 23 discrete factors/reasons of non-utilisation of public healthcare facilities) multivariate analysis has been done using logistic regression. The magnitude and direction of associations were expressed as odds ratios (OR). Principal component analysis (PCA) for three Upazilas altogether it was found that there are major seven reasons associated with non-utilization of public health facilities (Table 3.3). The reasons are long distance from home (OR= 25.7), do not provide medicine free (OR=20.4), doctors are not examining properly (OR=15.5), harsh behavior of the doctor (OR=14.3), dealings of staff is harsh (OR=9.9), doctors are not available always (OR=7.9), specialist physician not available (OR=7.7) and long waiting time (OR=5.3). Table 3.3: Multivariate analysis showing key factors associated with non-utilisation of public
healthcare facilities in three Upazilas (aggregated)
Reported Factors Value (Odds Ratio)
95% Confidence Interval Lower Upper
Didn’t know where to go 3.1 0.7 13.6
Did not feel to consult 1.6 0.8 3.5 Long waiting time 5.3 3.2 9.0 Long distance from home 25.7 10.5 62.8 Dealings of the staff is harsh 9.9 1.4 74.2 Harsh behavior of the doctor 14.3 1.9 104.8 Doctors are not examining properly 15.5 5.7 42.1 Doctors are not available always 7.9 3.8 16.3 Specialist physician not available 7.7 2.4 24.7 Do not provide medicine free 20.4 7.5 55.3 Medicine not available 4.6 2.4 8.8 Loss of wage 2.3 0.5 10.2 No cure after taking medicines from public facilities 0.16 0.03 0.8 After ‘Principal Component Analysis (PCA)’, it is found that in Rangunia, out of more than 23 given factors, 6 factors/reasons i.e., non-availability of free medicine (OR=27.89), waiting times are too long (OR=20.96), no nearby public healthcare facility (OR=16.62), non-availability of specialist physician (OR=9.08), and harsh behaviour of the service providers (OR=6.28) are strongly associated with non-utilisation of public healthcare facilities (Table 3.4).
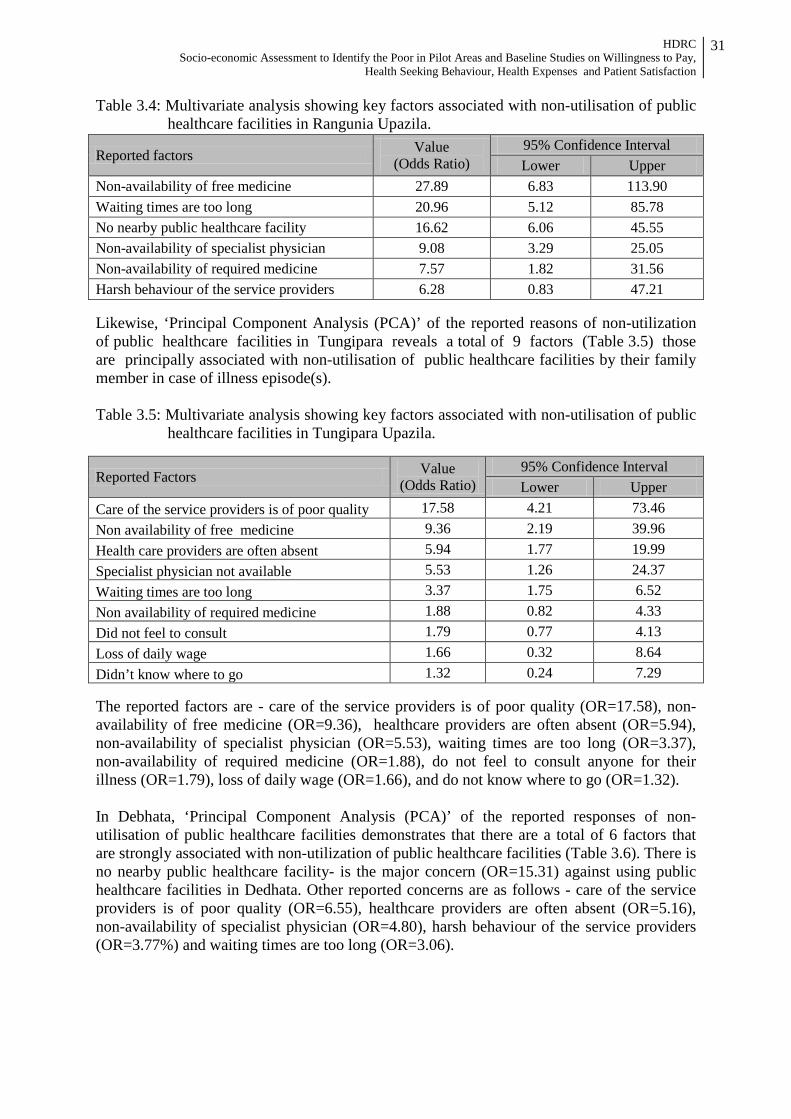
HDRC Socio-economic Assessment to Identify the Poor in Pilot Areas and Baseline Studies on Willingness to Pay,
Health Seeking Behaviour, Health Expenses and Patient Satisfaction
31
Table 3.4: Multivariate analysis showing key factors associated with non-utilisation of public healthcare facilities in Rangunia Upazila.
Reported factors Value (Odds Ratio)
95% Confidence Interval Lower Upper
Non-availability of free medicine 27.89 6.83 113.90 Waiting times are too long 20.96 5.12 85.78 No nearby public healthcare facility 16.62 6.06 45.55 Non-availability of specialist physician 9.08 3.29 25.05 Non-availability of required medicine 7.57 1.82 31.56 Harsh behaviour of the service providers 6.28 0.83 47.21 Likewise, ‘Principal Component Analysis (PCA)’ of the reported reasons of non-utilization of public healthcare facilities in Tungipara reveals a total of 9 factors (Table 3.5) those are principally associated with non-utilisation of public healthcare facilities by their family member in case of illness episode(s). Table 3.5: Multivariate analysis showing key factors associated with non-utilisation of public
healthcare facilities in Tungipara Upazila.
Reported Factors Value (Odds Ratio)
95% Confidence Interval Lower Upper
Care of the service providers is of poor quality 17.58 4.21 73.46 Non availability of free medicine 9.36 2.19 39.96 Health care providers are often absent 5.94 1.77 19.99 Specialist physician not available 5.53 1.26 24.37 Waiting times are too long 3.37 1.75 6.52 Non availability of required medicine 1.88 0.82 4.33 Did not feel to consult 1.79 0.77 4.13 Loss of daily wage 1.66 0.32 8.64 Didn’t know where to go 1.32 0.24 7.29 The reported factors are - care of the service providers is of poor quality (OR=17.58), non-availability of free medicine (OR=9.36), healthcare providers are often absent (OR=5.94), non-availability of specialist physician (OR=5.53), waiting times are too long (OR=3.37), non-availability of required medicine (OR=1.88), do not feel to consult anyone for their illness (OR=1.79), loss of daily wage (OR=1.66), and do not know where to go (OR=1.32). In Debhata, ‘Principal Component Analysis (PCA)’ of the reported responses of non-utilisation of public healthcare facilities demonstrates that there are a total of 6 factors that are strongly associated with non-utilization of public healthcare facilities (Table 3.6). There is no nearby public healthcare facility- is the major concern (OR=15.31) against using public healthcare facilities in Dedhata. Other reported concerns are as follows - care of the service providers is of poor quality (OR=6.55), healthcare providers are often absent (OR=5.16), non-availability of specialist physician (OR=4.80), harsh behaviour of the service providers (OR=3.77%) and waiting times are too long (OR=3.06).
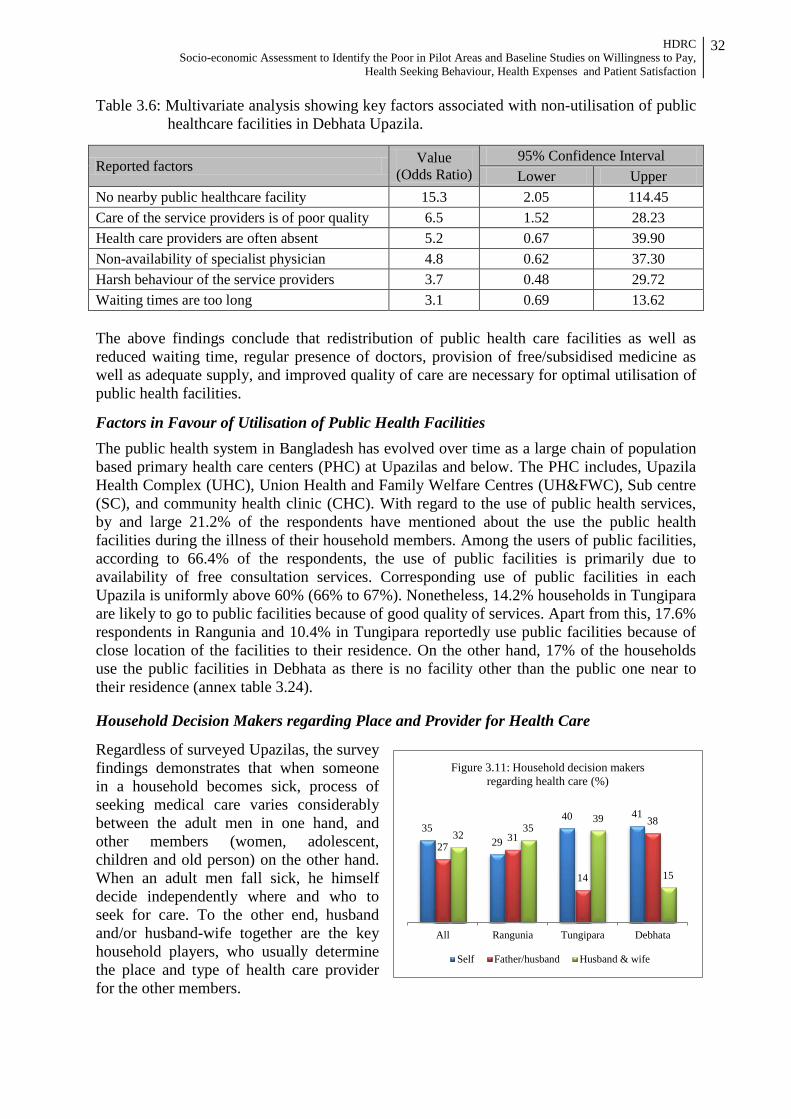
HDRC Socio-economic Assessment to Identify the Poor in Pilot Areas and Baseline Studies on Willingness to Pay,
Health Seeking Behaviour, Health Expenses and Patient Satisfaction
32
Table 3.6: Multivariate analysis showing key factors associated with non-utilisation of public healthcare facilities in Debhata Upazila.
Reported factors Value (Odds Ratio)
95% Confidence Interval Lower Upper
No nearby public healthcare facility 15.3 2.05 114.45 Care of the service providers is of poor quality 6.5 1.52 28.23 Health care providers are often absent 5.2 0.67 39.90 Non-availability of specialist physician 4.8 0.62 37.30 Harsh behaviour of the service providers 3.7 0.48 29.72 Waiting times are too long 3.1 0.69 13.62 The above findings conclude that redistribution of public health care facilities as well as reduced waiting time, regular presence of doctors, provision of free/subsidised medicine as well as adequate supply, and improved quality of care are necessary for optimal utilisation of public health facilities.
Factors in Favour of Utilisation of Public Health Facilities
The public health system in Bangladesh has evolved over time as a large chain of population based primary health care centers (PHC) at Upazilas and below. The PHC includes, Upazila Health Complex (UHC), Union Health and Family Welfare Centres (UH&FWC), Sub centre (SC), and community health clinic (CHC). With regard to the use of public health services, by and large 21.2% of the respondents have mentioned about the use the public health facilities during the illness of their household members. Among the users of public facilities, according to 66.4% of the respondents, the use of public facilities is primarily due to availability of free consultation services. Corresponding use of public facilities in each Upazila is uniformly above 60% (66% to 67%). Nonetheless, 14.2% households in Tungipara are likely to go to public facilities because of good quality of services. Apart from this, 17.6% respondents in Rangunia and 10.4% in Tungipara reportedly use public facilities because of close location of the facilities to their residence. On the other hand, 17% of the households use the public facilities in Debhata as there is no facility other than the public one near to their residence (annex table 3.24). Household Decision Makers regarding Place and Provider for Health Care
Regardless of surveyed Upazilas, the survey findings demonstrates that when someone in a household becomes sick, process of seeking medical care varies considerably between the adult men in one hand, and other members (women, adolescent, children and old person) on the other hand. When an adult men fall sick, he himself decide independently where and who to seek for care. To the other end, husband and/or husband-wife together are the key household players, who usually determine the place and type of health care provider for the other members.
35 29
40 41
27 31
14
38 32
35 39
15
All Rangunia Tungipara Debhata
Figure 3.11: Household decision makers regarding health care (%)
Self Father/husband Husband & wife
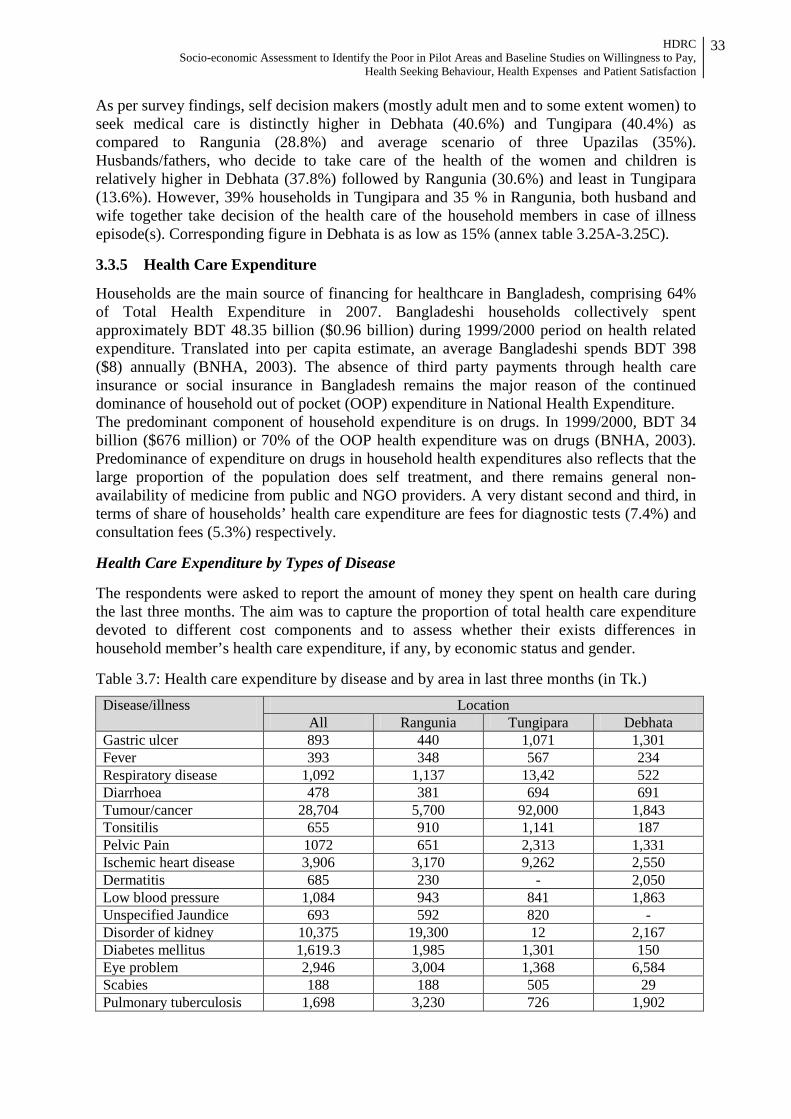
HDRC Socio-economic Assessment to Identify the Poor in Pilot Areas and Baseline Studies on Willingness to Pay,
Health Seeking Behaviour, Health Expenses and Patient Satisfaction
33
As per survey findings, self decision makers (mostly adult men and to some extent women) to seek medical care is distinctly higher in Debhata (40.6%) and Tungipara (40.4%) as compared to Rangunia (28.8%) and average scenario of three Upazilas (35%). Husbands/fathers, who decide to take care of the health of the women and children is relatively higher in Debhata (37.8%) followed by Rangunia (30.6%) and least in Tungipara (13.6%). However, 39% households in Tungipara and 35 % in Rangunia, both husband and wife together take decision of the health care of the household members in case of illness episode(s). Corresponding figure in Debhata is as low as 15% (annex table 3.25A-3.25C). 3.3.5 Health Care Expenditure
Households are the main source of financing for healthcare in Bangladesh, comprising 64% of Total Health Expenditure in 2007. Bangladeshi households collectively spent approximately BDT 48.35 billion ($0.96 billion) during 1999/2000 period on health related expenditure. Translated into per capita estimate, an average Bangladeshi spends BDT 398 ($8) annually (BNHA, 2003). The absence of third party payments through health care insurance or social insurance in Bangladesh remains the major reason of the continued dominance of household out of pocket (OOP) expenditure in National Health Expenditure. The predominant component of household expenditure is on drugs. In 1999/2000, BDT 34 billion ($676 million) or 70% of the OOP health expenditure was on drugs (BNHA, 2003). Predominance of expenditure on drugs in household health expenditures also reflects that the large proportion of the population does self treatment, and there remains general non-availability of medicine from public and NGO providers. A very distant second and third, in terms of share of households’ health care expenditure are fees for diagnostic tests (7.4%) and consultation fees (5.3%) respectively. Health Care Expenditure by Types of Disease The respondents were asked to report the amount of money they spent on health care during the last three months. The aim was to capture the proportion of total health care expenditure devoted to different cost components and to assess whether their exists differences in household member’s health care expenditure, if any, by economic status and gender. Table 3.7: Health care expenditure by disease and by area in last three months (in Tk.) Disease/illness Location
All Rangunia Tungipara Debhata Gastric ulcer 893 440 1,071 1,301 Fever 393 348 567 234 Respiratory disease 1,092 1,137 13,42 522 Diarrhoea 478 381 694 691 Tumour/cancer 28,704 5,700 92,000 1,843 Tonsitilis 655 910 1,141 187 Pelvic Pain 1072 651 2,313 1,331 Ischemic heart disease 3,906 3,170 9,262 2,550 Dermatitis 685 230 - 2,050 Low blood pressure 1,084 943 841 1,863 Unspecified Jaundice 693 592 820 - Disorder of kidney 10,375 19,300 12 2,167 Diabetes mellitus 1,619.3 1,985 1,301 150 Eye problem 2,946 3,004 1,368 6,584 Scabies 188 188 505 29 Pulmonary tuberculosis 1,698 3,230 726 1,902
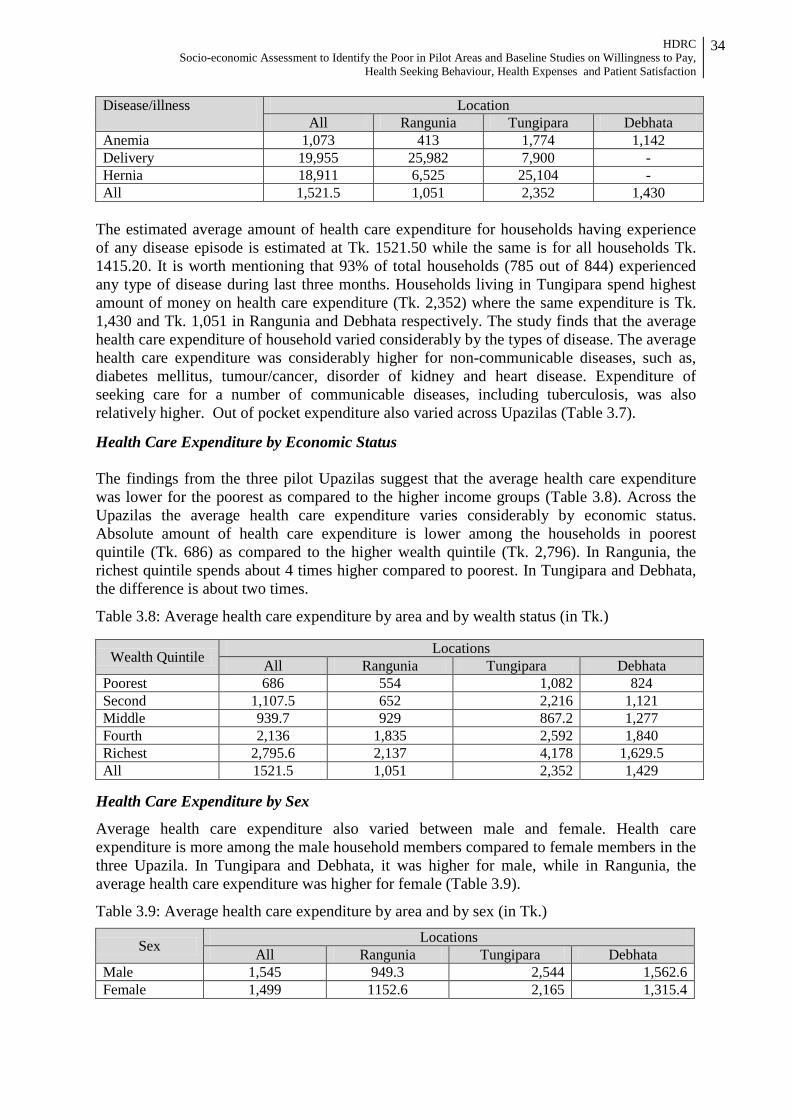
HDRC Socio-economic Assessment to Identify the Poor in Pilot Areas and Baseline Studies on Willingness to Pay,
Health Seeking Behaviour, Health Expenses and Patient Satisfaction
34
Disease/illness Location All Rangunia Tungipara Debhata
Anemia 1,073 413 1,774 1,142 Delivery 19,955 25,982 7,900 - Hernia 18,911 6,525 25,104 - All 1,521.5 1,051 2,352 1,430
The estimated average amount of health care expenditure for households having experience of any disease episode is estimated at Tk. 1521.50 while the same is for all households Tk. 1415.20. It is worth mentioning that 93% of total households (785 out of 844) experienced any type of disease during last three months. Households living in Tungipara spend highest amount of money on health care expenditure (Tk. 2,352) where the same expenditure is Tk. 1,430 and Tk. 1,051 in Rangunia and Debhata respectively. The study finds that the average health care expenditure of household varied considerably by the types of disease. The average health care expenditure was considerably higher for non-communicable diseases, such as, diabetes mellitus, tumour/cancer, disorder of kidney and heart disease. Expenditure of seeking care for a number of communicable diseases, including tuberculosis, was also relatively higher. Out of pocket expenditure also varied across Upazilas (Table 3.7).
Health Care Expenditure by Economic Status The findings from the three pilot Upazilas suggest that the average health care expenditure was lower for the poorest as compared to the higher income groups (Table 3.8). Across the Upazilas the average health care expenditure varies considerably by economic status. Absolute amount of health care expenditure is lower among the households in poorest quintile (Tk. 686) as compared to the higher wealth quintile (Tk. 2,796). In Rangunia, the richest quintile spends about 4 times higher compared to poorest. In Tungipara and Debhata, the difference is about two times.
Table 3.8: Average health care expenditure by area and by wealth status (in Tk.)
Wealth Quintile Locations All Rangunia Tungipara Debhata
Poorest 686 554 1,082 824 Second 1,107.5 652 2,216 1,121 Middle 939.7 929 867.2 1,277 Fourth 2,136 1,835 2,592 1,840 Richest 2,795.6 2,137 4,178 1,629.5 All 1521.5 1,051 2,352 1,429
Health Care Expenditure by Sex
Average health care expenditure also varied between male and female. Health care expenditure is more among the male household members compared to female members in the three Upazila. In Tungipara and Debhata, it was higher for male, while in Rangunia, the average health care expenditure was higher for female (Table 3.9).
Table 3.9: Average health care expenditure by area and by sex (in Tk.)
Sex Locations All Rangunia Tungipara Debhata
Male 1,545 949.3 2,544 1,562.6 Female 1,499 1152.6 2,165 1,315.4
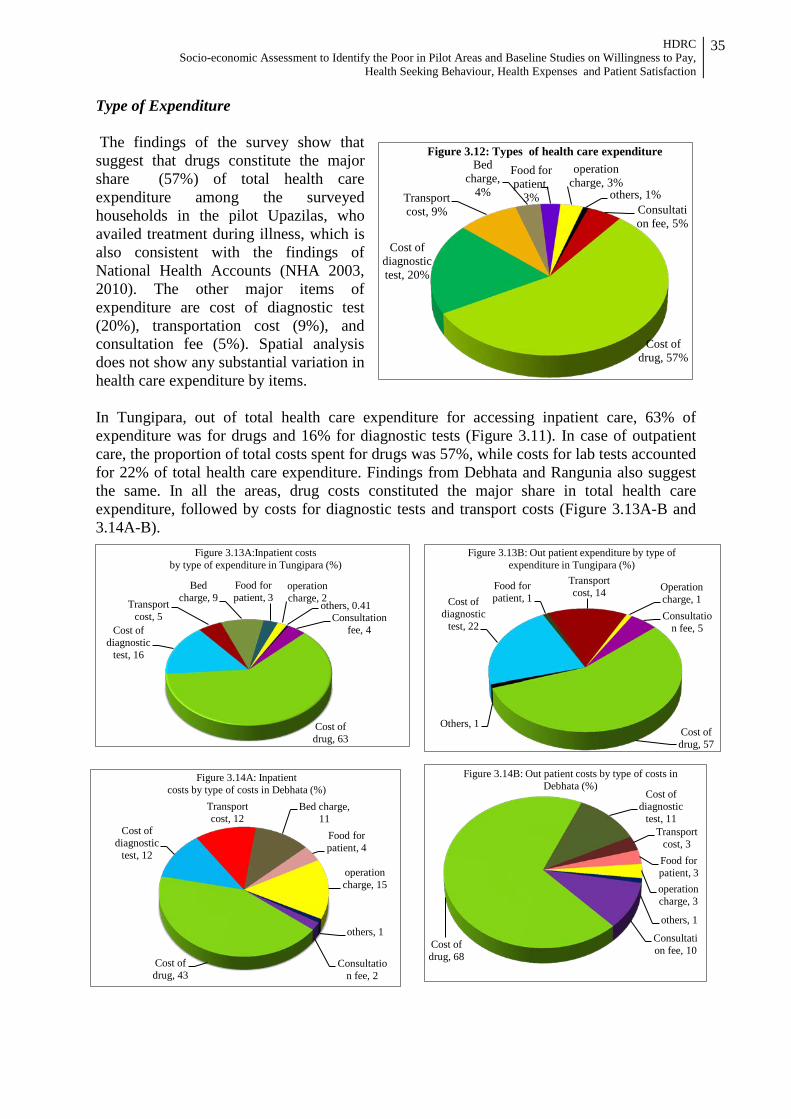
HDRC Socio-economic Assessment to Identify the Poor in Pilot Areas and Baseline Studies on Willingness to Pay,
Health Seeking Behaviour, Health Expenses and Patient Satisfaction
35
Type of Expenditure The findings of the survey show that suggest that drugs constitute the major share (57%) of total health care expenditure among the surveyed households in the pilot Upazilas, who availed treatment during illness, which is also consistent with the findings of National Health Accounts (NHA 2003, 2010). The other major items of expenditure are cost of diagnostic test (20%), transportation cost (9%), and consultation fee (5%). Spatial analysis does not show any substantial variation in health care expenditure by items. In Tungipara, out of total health care expenditure for accessing inpatient care, 63% of expenditure was for drugs and 16% for diagnostic tests (Figure 3.11). In case of outpatient care, the proportion of total costs spent for drugs was 57%, while costs for lab tests accounted for 22% of total health care expenditure. Findings from Debhata and Rangunia also suggest the same. In all the areas, drug costs constituted the major share in total health care expenditure, followed by costs for diagnostic tests and transport costs (Figure 3.13A-B and 3.14A-B).
Consultation fee, 5%
Cost of drug, 57%
Cost of diagnostic test, 20%
Transport cost, 9%
Bed charge,
4%
Food for patient,
3%
operation charge, 3%
others, 1%
Figure 3.12: Types of health care expenditure
Consultation fee, 4
Cost of drug, 63
Cost of diagnostic
test, 16
Transport cost, 5
Bed charge, 9
Food for patient, 3
operation charge, 2
others, 0.41
Figure 3.13A:Inpatient costs by type of expenditure in Tungipara (%)
Consultation fee, 5
Cost of drug, 57
Others, 1
Cost of diagnostic
test, 22
Food for patient, 1
Transport cost, 14 Operation
charge, 1
Figure 3.13B: Out patient expenditure by type of expenditure in Tungipara (%)
Consultation fee, 2
Cost of drug, 43
Cost of diagnostic
test, 12
Transport cost, 12
Bed charge, 11
Food for patient, 4
operation charge, 15
others, 1
Figure 3.14A: Inpatient costs by type of costs in Debhata (%)
Consultation fee, 10 Cost of
drug, 68
Cost of diagnostic
test, 11 Transport
cost, 3 Food for patient, 3 operation charge, 3
others, 1
Figure 3.14B: Out patient costs by type of costs in Debhata (%)
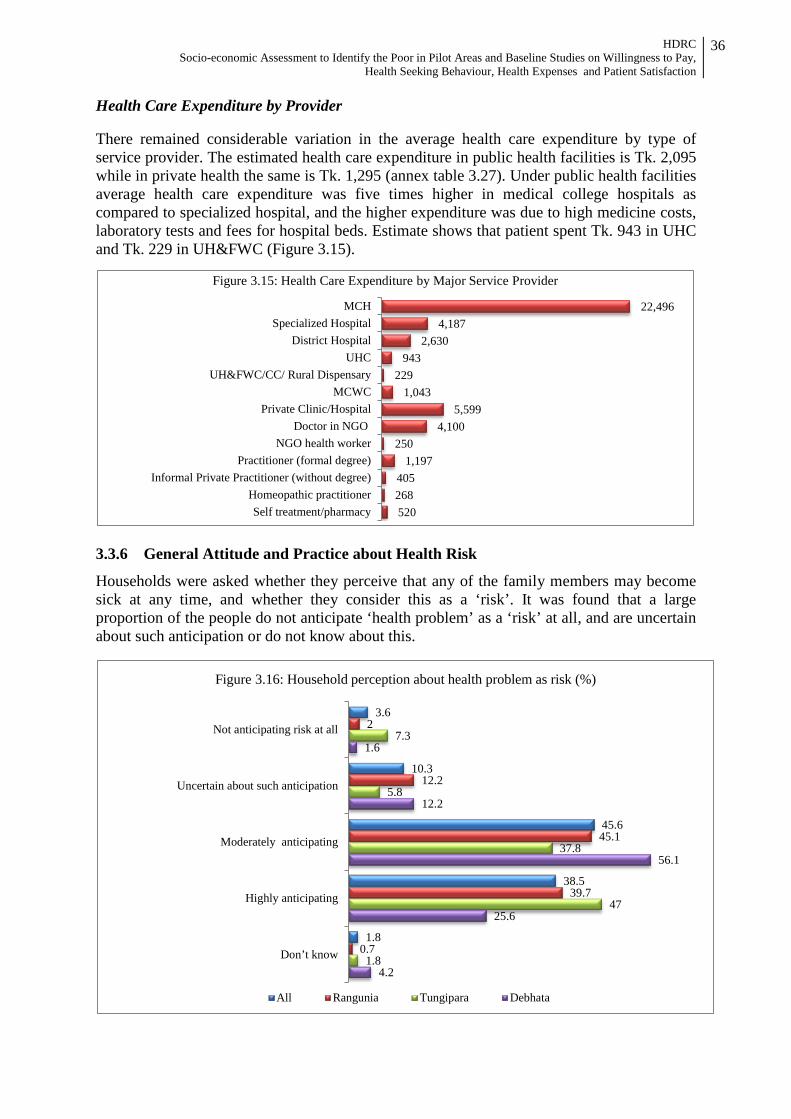
HDRC Socio-economic Assessment to Identify the Poor in Pilot Areas and Baseline Studies on Willingness to Pay,
Health Seeking Behaviour, Health Expenses and Patient Satisfaction
36
Health Care Expenditure by Provider There remained considerable variation in the average health care expenditure by type of service provider. The estimated health care expenditure in public health facilities is Tk. 2,095 while in private health the same is Tk. 1,295 (annex table 3.27). Under public health facilities average health care expenditure was five times higher in medical college hospitals as compared to specialized hospital, and the higher expenditure was due to high medicine costs, laboratory tests and fees for hospital beds. Estimate shows that patient spent Tk. 943 in UHC and Tk. 229 in UH&FWC (Figure 3.15).
3.3.6 General Attitude and Practice about Health Risk
Households were asked whether they perceive that any of the family members may become sick at any time, and whether they consider this as a ‘risk’. It was found that a large proportion of the people do not anticipate ‘health problem’ as a ‘risk’ at all, and are uncertain about such anticipation or do not know about this.
22,496 4,187
2,630 943
229 1,043
5,599 4,100
250 1,197
405 268 520
MCHSpecialized Hospital
District HospitalUHC
UH&FWC/CC/ Rural DispensaryMCWC
Private Clinic/HospitalDoctor in NGO
NGO health workerPractitioner (formal degree)
Informal Private Practitioner (without degree)Homeopathic practitionerSelf treatment/pharmacy
Figure 3.15: Health Care Expenditure by Major Service Provider
3.6
10.3
45.6
38.5
1.8
2
12.2
45.1
39.7
0.7
7.3
5.8
37.8
47
1.8
1.6
12.2
56.1
25.6
4.2
Not anticipating risk at all
Uncertain about such anticipation
Moderately anticipating
Highly anticipating
Don’t know
Figure 3.16: Household perception about health problem as risk (%)
All Rangunia Tungipara Debhata
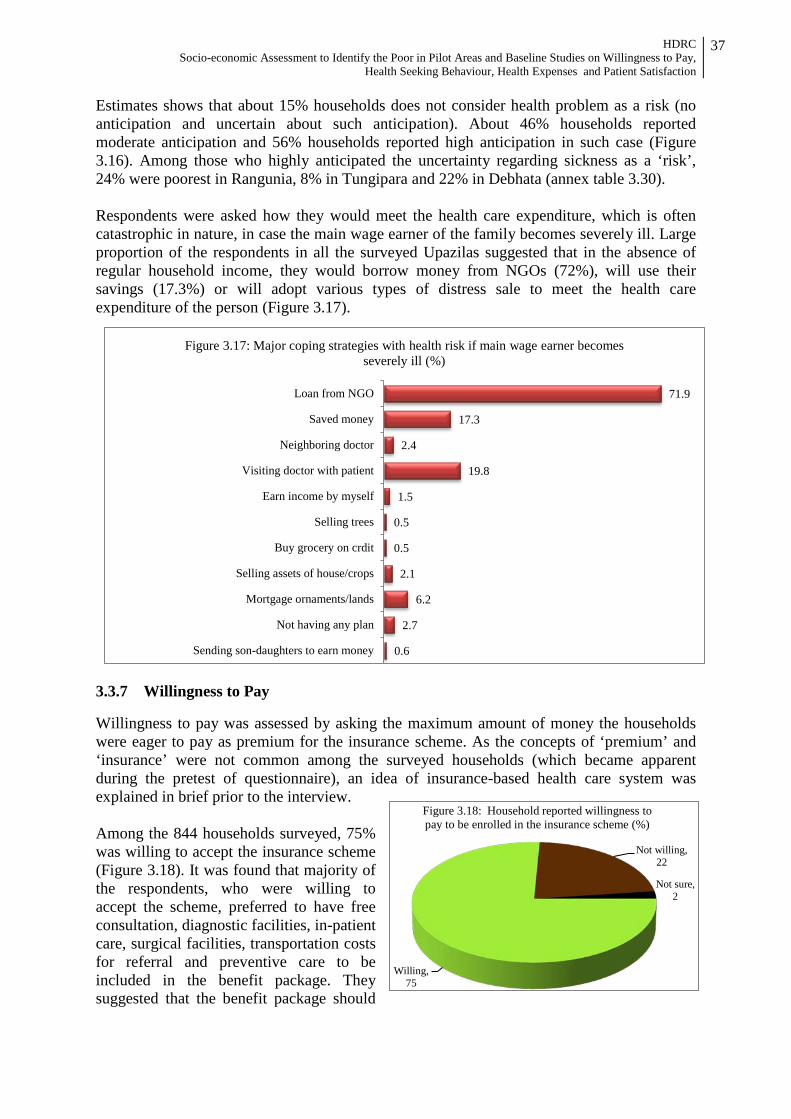
HDRC Socio-economic Assessment to Identify the Poor in Pilot Areas and Baseline Studies on Willingness to Pay,
Health Seeking Behaviour, Health Expenses and Patient Satisfaction
37
Estimates shows that about 15% households does not consider health problem as a risk (no anticipation and uncertain about such anticipation). About 46% households reported moderate anticipation and 56% households reported high anticipation in such case (Figure 3.16). Among those who highly anticipated the uncertainty regarding sickness as a ‘risk’, 24% were poorest in Rangunia, 8% in Tungipara and 22% in Debhata (annex table 3.30). Respondents were asked how they would meet the health care expenditure, which is often catastrophic in nature, in case the main wage earner of the family becomes severely ill. Large proportion of the respondents in all the surveyed Upazilas suggested that in the absence of regular household income, they would borrow money from NGOs (72%), will use their savings (17.3%) or will adopt various types of distress sale to meet the health care expenditure of the person (Figure 3.17).
3.3.7 Willingness to Pay Willingness to pay was assessed by asking the maximum amount of money the households were eager to pay as premium for the insurance scheme. As the concepts of ‘premium’ and ‘insurance’ were not common among the surveyed households (which became apparent during the pretest of questionnaire), an idea of insurance-based health care system was explained in brief prior to the interview. Among the 844 households surveyed, 75% was willing to accept the insurance scheme (Figure 3.18). It was found that majority of the respondents, who were willing to accept the scheme, preferred to have free consultation, diagnostic facilities, in-patient care, surgical facilities, transportation costs for referral and preventive care to be included in the benefit package. They suggested that the benefit package should
Willing, 75
Not willing, 22
Not sure, 2
Figure 3.18: Household reported willingness to pay to be enrolled in the insurance scheme (%)
71.9
17.3
2.4
19.8
1.5
0.5
0.5
2.1
6.2
2.7
0.6
Loan from NGO
Saved money
Neighboring doctor
Visiting doctor with patient
Earn income by myself
Selling trees
Buy grocery on crdit
Selling assets of house/crops
Mortgage ornaments/lands
Not having any plan
Sending son-daughters to earn money
Figure 3.17: Major coping strategies with health risk if main wage earner becomes severely ill (%)
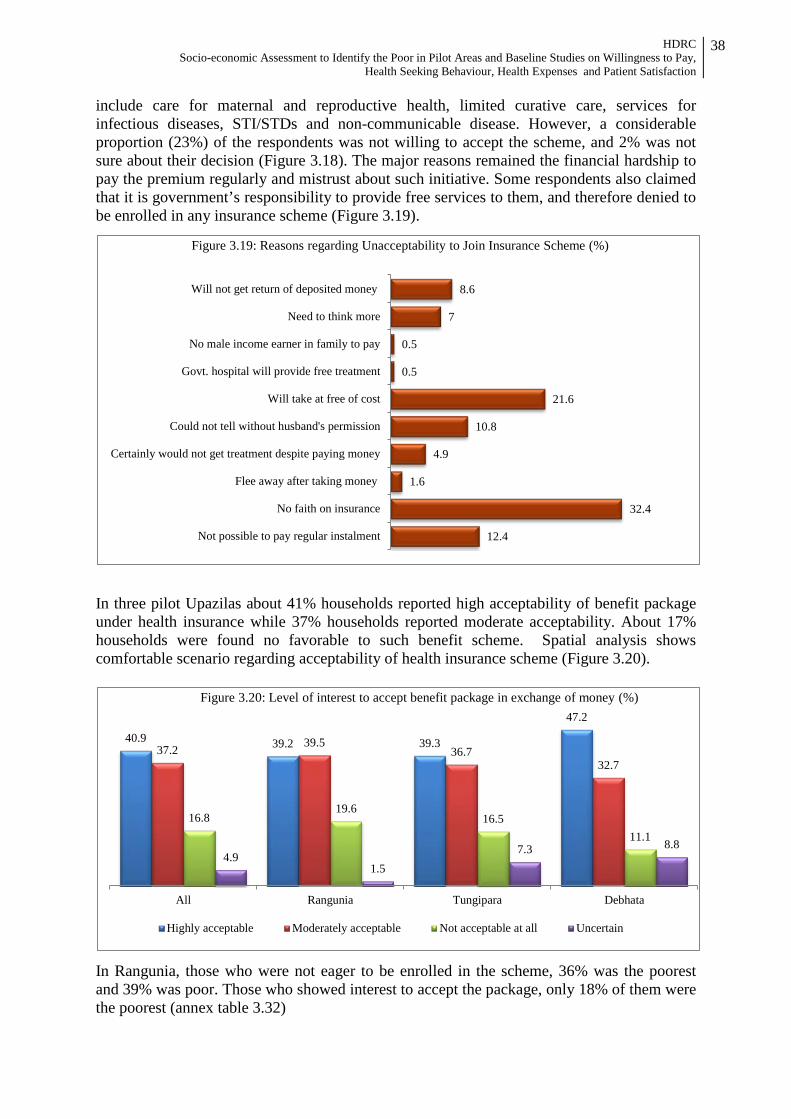
HDRC Socio-economic Assessment to Identify the Poor in Pilot Areas and Baseline Studies on Willingness to Pay,
Health Seeking Behaviour, Health Expenses and Patient Satisfaction
38
include care for maternal and reproductive health, limited curative care, services for infectious diseases, STI/STDs and non-communicable disease. However, a considerable proportion (23%) of the respondents was not willing to accept the scheme, and 2% was not sure about their decision (Figure 3.18). The major reasons remained the financial hardship to pay the premium regularly and mistrust about such initiative. Some respondents also claimed that it is government’s responsibility to provide free services to them, and therefore denied to be enrolled in any insurance scheme (Figure 3.19).
In three pilot Upazilas about 41% households reported high acceptability of benefit package under health insurance while 37% households reported moderate acceptability. About 17% households were found no favorable to such benefit scheme. Spatial analysis shows comfortable scenario regarding acceptability of health insurance scheme (Figure 3.20).
In Rangunia, those who were not eager to be enrolled in the scheme, 36% was the poorest and 39% was poor. Those who showed interest to accept the package, only 18% of them were the poorest (annex table 3.32)
12.4
32.4
1.6
4.9
10.8
21.6
0.5
0.5
7
8.6
Not possible to pay regular instalment
No faith on insurance
Flee away after taking money
Certainly would not get treatment despite paying money
Could not tell without husband's permission
Will take at free of cost
Govt. hospital will provide free treatment
No male income earner in family to pay
Need to think more
Will not get return of deposited money
Figure 3.19: Reasons regarding Unacceptability to Join Insurance Scheme (%)
40.9 39.2 39.3
47.2
37.2 39.5 36.7
32.7
16.8 19.6
16.5 11.1
4.9 1.5
7.3 8.8
All Rangunia Tungipara Debhata
Figure 3.20: Level of interest to accept benefit package in exchange of money (%)
Highly acceptable Moderately acceptable Not acceptable at all Uncertain
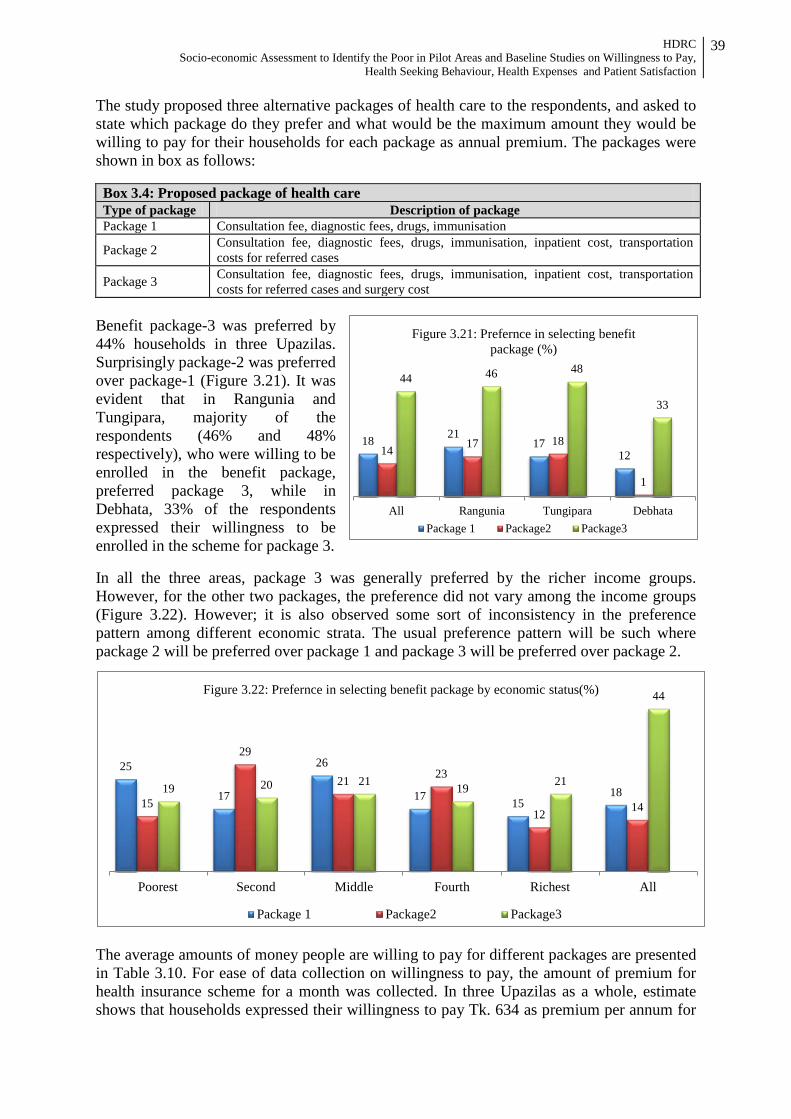
HDRC Socio-economic Assessment to Identify the Poor in Pilot Areas and Baseline Studies on Willingness to Pay,
Health Seeking Behaviour, Health Expenses and Patient Satisfaction
39
The study proposed three alternative packages of health care to the respondents, and asked to state which package do they prefer and what would be the maximum amount they would be willing to pay for their households for each package as annual premium. The packages were shown in box as follows: Box 3.4: Proposed package of health care Type of package Description of package Package 1 Consultation fee, diagnostic fees, drugs, immunisation
Package 2 Consultation fee, diagnostic fees, drugs, immunisation, inpatient cost, transportation costs for referred cases
Package 3 Consultation fee, diagnostic fees, drugs, immunisation, inpatient cost, transportation costs for referred cases and surgery cost
Benefit package-3 was preferred by 44% households in three Upazilas. Surprisingly package-2 was preferred over package-1 (Figure 3.21). It was evident that in Rangunia and Tungipara, majority of the respondents (46% and 48% respectively), who were willing to be enrolled in the benefit package, preferred package 3, while in Debhata, 33% of the respondents expressed their willingness to be enrolled in the scheme for package 3. In all the three areas, package 3 was generally preferred by the richer income groups. However, for the other two packages, the preference did not vary among the income groups (Figure 3.22). However; it is also observed some sort of inconsistency in the preference pattern among different economic strata. The usual preference pattern will be such where package 2 will be preferred over package 1 and package 3 will be preferred over package 2.
The average amounts of money people are willing to pay for different packages are presented in Table 3.10. For ease of data collection on willingness to pay, the amount of premium for health insurance scheme for a month was collected. In three Upazilas as a whole, estimate shows that households expressed their willingness to pay Tk. 634 as premium per annum for
18 21 17
12 14 17 18
1
44 46 48
33
All Rangunia Tungipara Debhata
Figure 3.21: Prefernce in selecting benefit package (%)
Package 1 Package2 Package3
25
17
26
17 15 18
15
29
21 23
12 14 19 20 21 19 21
44
Poorest Second Middle Fourth Richest All
Figure 3.22: Prefernce in selecting benefit package by economic status(%)
Package 1 Package2 Package3

HDRC Socio-economic Assessment to Identify the Poor in Pilot Areas and Baseline Studies on Willingness to Pay,
Health Seeking Behaviour, Health Expenses and Patient Satisfaction
40
package-1 and Tk. 1,063 and Tk. 1,064 for package-2 and 3 respectively. Similar estimates by economic status shows amount of premium for the poorest households are found more compared to the richest section of the society. For most preferred benefit package (package-3), an average households expressed willingness to pay for annual insurance premium at Tk. 1,064 while the poorest expressed their willingness to pay at Tk. 1,836 and the richest expressed their willingness to pay at Tk.1,236. It is worth noting that about 34.5% households expressed their willingness to pay for package-3 while 14% and 11% expressed the same for package 1 and 2 respectively. Among the poorest households, 33% households expressed their willingness to pay for package-3 while 17% and 8% expressed the same for package 1 and 2 respectively. For the richest households, 37% households expressed their willingness to pay for package-3 while 11% and 7% expressed the same for package 1 and 2 respectively. Table 3.10: Distribution of respondents by their willingness to pay of average amount of money per
month by packages
Wealth Quintile Amount of premium by benefit packages (in Tk.)
Premium for Package 1 Premium for Package 2 Premium for Package 3
All Upazilas Poorest 71.9 83.6 153.4 Second 49.5 125.6 75.5 Middle 34.4 82.1 68.4 Fourth 39.0 57.1 45.4 Richest 73.3 78.6 103.1 All 52.8 88.6 88.7 Rangunia Poorest 51.4 78.2 107.3 Second 35.8 78.9 123.1 Middle 37.5 112.5 97.3 Fourth 64.4 57.5 77.0 Richest 78.6 133.3 125.5 Tungipara Poorest 155.0 150.0 303.3 Second 84.2 230.6 29.2 Middle 33.5 59.0 34.2 Fourth 12.1 56.7 35.5 Richest 102.5 58.1 84.0 Debhata Poorest 18.75 10.00 49.57 Second 20.00 - 46.67 Middle 18.33 70.00 17.14 Fourth 28.75 - 17.67 Richest 31.00 - 82.46
The willingness to pay for all the packages was lowest in Debhata. The poorest income group was willing to pay only Tk. 10 per month for their family for package-2, Tk. 18.7 for package-1 and Tk. 24 for package-3. It was found that in Rangunia and Debhata, poor people are generally willing to pay fewer amounts as compared to their richer counterpart. However, in Tungipara, the average amount of money that poor people are willing to pay for package 2 and 3 were higher than their richer counterpart.
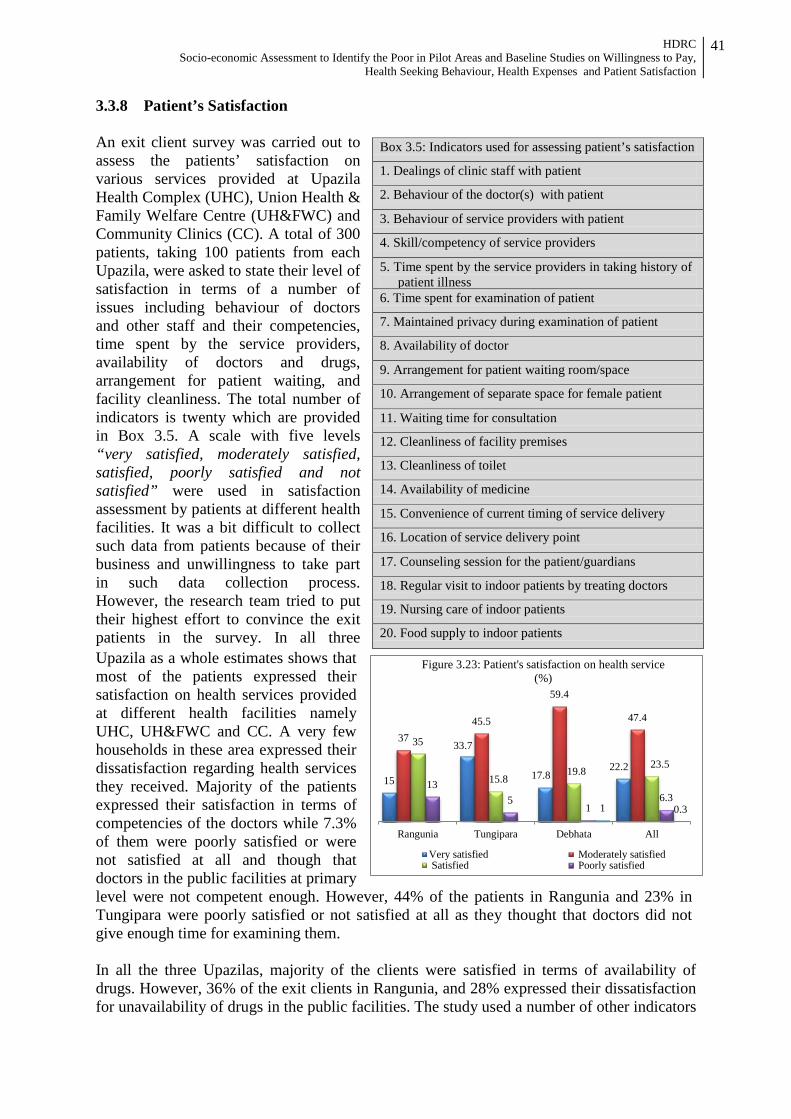
HDRC Socio-economic Assessment to Identify the Poor in Pilot Areas and Baseline Studies on Willingness to Pay,
Health Seeking Behaviour, Health Expenses and Patient Satisfaction
41
3.3.8 Patient’s Satisfaction An exit client survey was carried out to assess the patients’ satisfaction on various services provided at Upazila Health Complex (UHC), Union Health & Family Welfare Centre (UH&FWC) and Community Clinics (CC). A total of 300 patients, taking 100 patients from each Upazila, were asked to state their level of satisfaction in terms of a number of issues including behaviour of doctors and other staff and their competencies, time spent by the service providers, availability of doctors and drugs, arrangement for patient waiting, and facility cleanliness. The total number of indicators is twenty which are provided in Box 3.5. A scale with five levels “very satisfied, moderately satisfied, satisfied, poorly satisfied and not satisfied” were used in satisfaction assessment by patients at different health facilities. It was a bit difficult to collect such data from patients because of their business and unwillingness to take part in such data collection process. However, the research team tried to put their highest effort to convince the exit patients in the survey. In all three Upazila as a whole estimates shows that most of the patients expressed their satisfaction on health services provided at different health facilities namely UHC, UH&FWC and CC. A very few households in these area expressed their dissatisfaction regarding health services they received. Majority of the patients expressed their satisfaction in terms of competencies of the doctors while 7.3% of them were poorly satisfied or were not satisfied at all and though that doctors in the public facilities at primary level were not competent enough. However, 44% of the patients in Rangunia and 23% in Tungipara were poorly satisfied or not satisfied at all as they thought that doctors did not give enough time for examining them. In all the three Upazilas, majority of the clients were satisfied in terms of availability of drugs. However, 36% of the exit clients in Rangunia, and 28% expressed their dissatisfaction for unavailability of drugs in the public facilities. The study used a number of other indicators
Box 3.5: Indicators used for assessing patient’s satisfaction
1. Dealings of clinic staff with patient
2. Behaviour of the doctor(s) with patient
3. Behaviour of service providers with patient
4. Skill/competency of service providers
5. Time spent by the service providers in taking history of patient illness
6. Time spent for examination of patient
7. Maintained privacy during examination of patient
8. Availability of doctor
9. Arrangement for patient waiting room/space
10. Arrangement of separate space for female patient
11. Waiting time for consultation
12. Cleanliness of facility premises
13. Cleanliness of toilet
14. Availability of medicine
15. Convenience of current timing of service delivery
16. Location of service delivery point
17. Counseling session for the patient/guardians
18. Regular visit to indoor patients by treating doctors
19. Nursing care of indoor patients
20. Food supply to indoor patients
15
33.7
17.8 22.2
37 45.5
59.4
47.4
35
15.8 19.8
23.5
13 5
1 6.3
1 0.3
Rangunia Tungipara Debhata All
Figure 3.23: Patient's satisfaction on health service (%)
Very satisfied Moderately satisfied Satisfied Poorly satisfied
HDRC Socio-economic Assessment to Identify the Poor in Pilot Areas and Baseline Studies on Willingness to Pay,
Health Seeking Behaviour, Health Expenses and Patient Satisfaction
42
to assess client satisfaction. It was found that a considerable proportion of the clients were not satisfied about the arrangement for patient waiting room and room for women patient, the waiting time for consultation and the cleanliness of the complex and toilets. The detail findings by indicators and location are presented in annex table 3.28.

HDRC Socio-economic Assessment to Identify the Poor in Pilot Areas and Baseline Studies on Willingness to Pay,
Health Seeking Behaviour, Health Expenses and Patient Satisfaction
43
Chapter 4
CONCLUSION AND RECOMMENDATION Key Findings The study conducted through a socio-economic assessment has successfully identified the poor in three SSK pilot Upazillas. It has also assessed the health seeking behaviour, patient satisfaction, health expenses and willingness to pay for health services. In line with the objectives, identification of BPL households has been made in sample villages and mahallahs of the three upazilas employing a comprehensive list of poverty identification criteria (comprising 21 indicators) prepared on the basis of eligibility criteria used for targeting major social safety net programmes. The identification exercise administered census of households in the sample villages and mahallahs, and that yielded a complete classification of households into two major categories: (i) BPL households, (ii) above-PL households including contextual rich households. As concluded, about 41% households fall below poverty line satisfying at least 3 out of 21 indicators. The findings have been complemented by drawing the upper poverty line (applying CBN method) applicable for each of the Upazilas using household census data. National poverty scenario constructed using wealth index method and disaggregated by districts also reveals similar proportion of BPL households. Verification of existing SSN beneficiary household shows that about 7% households do not comply with any one of the identification indicators (contextual rich), about 67% current SSN beneficiaries are BPL households and about 26% households are in between. Regarding suffering from diseases during last 3 months suffering from fever has been mentioned by more than one third of them, and respiratory illness including ARI and diarrhoea are next two. Among others, pelvic pain, gastric ulcer, headache, joint pain, and low blood pressure are more prevalent.
About 37% reported that at least one of household members has suffered from fever during last 3 months in 3 pilot Upazilas taken together. The reported incidences of three major illnesses (fever, ARI and diarrhea) are highest in Rangunia (43%, 11% and 7% respectively). ARI, diarrhoea, helminthiasis, scabies and malnutrition are most prevalent among the under 5 children and common cold, enteric fever, dysentery, peptic ulcer, hypertension, diabetes, and asthma and skin diseases are most common in adults. Menstrual disorder, leukorrhoea (white discharge), delivery complications, back pain, urinary tract infection and anemia among women.
People mostly prefer going for self treatment or pharmacy (23%), formal private practitioner (21%), and Upazila Health Complex (19%). The frequency of visiting service provider depends on the distance from the facility or service provider and household’s ability to pay for the service. The pattern of visiting UHC for services from qualified providers slightly vary by locations; around 17% in Debhata and Rangunia, and 23% in Tungipara. Reported instances of availing health service from District Hospitals and above is low and varies between 3% and 7% in different Upazilas. Instances of receiving service in private clinics have been reported to be comparatively higher (ranging from 8% to 14%).
Among those who go for treatment to Upazila Health Complex (UHC), a substantial large majority (92%) go for receiving out-patient medical services (ranging between 86% in

HDRC Socio-economic Assessment to Identify the Poor in Pilot Areas and Baseline Studies on Willingness to Pay,
Health Seeking Behaviour, Health Expenses and Patient Satisfaction
44
Debhata and 96% in Rangunia) and only a few avail in-patient services. Across the Upazilas people use to seek health care services from qualified providers when they are severely ill. About 42% in Debhata, 33% in Rangunia and 94% in Tungipara reported the same. The people of Tungipara are more reluctant as well as less capable to go for treatment at early stage of disease.
Almost all households give equal preference to all members irrespective of age, and rest of them (only a few) attach more preference to children for health care. They also give equal preference to male and female. Only 10% to 15% give preference to sex where males are predominant. Status of birth preparedness is very poor and only one-third to half of them has done ‘identification of appropriate birth location’.
The most commonly reported three reasons for not availing services from public sector health facilities in all the three Upazilas are: (i) long distance from home (Odds ratio = 25.7) (ii) non-availability of free medicine (Odds ratio = 20.4), and (iii) doctors are not examining properly (Odds ratio = 15.5).
The average amount of health care expenditure per household is Tk. 1,521.5 during last three months preceding survey. Across the Upazilas the average health care expenditure varies considerably by economic status. Absolute amount of health care expenditure is lower among the households in poorest quintile (Tk. 686) as compared to the higher wealth quintile (Tk. 2,795). In Rangunia, the richest quintile spends 3.5 times higher compared to poorest. In Tungipara, the difference is about 4 times and in Debhata it is almost two times.
The expenditure on drugs and diagnostic test constitutes the major share (57% and 20%) of total health care expenditure. On average, a service seeker spends Tk. 861 for purchasing medicines out of total treatment cost (Tk. 1,736). The total treatment cost substantially varies by facility, from Tk. 520 for self treatment, Tk. 943 in UHC and Tk. 22,496 in Medical College Hospital. About 75% of the households are willing to accept the insurance scheme. Majority of those (44%) who were willing to accept the scheme, preferred to have free consultation, diagnostic facilities, inpatient care, surgical facilities, transportation costs for referral and preventive care to be included in the benefit package (Benefit Package-3) .
Recommendations The study team recommends the followings for proper identification of the poor and successful implementation of the health financing pilot in selected areas.
1. The eligible poor for SSK scheme should be those satisfying any of the 4 criteria which includes (i) main earning person or head of family is a casual day laborer, (ii) landless household owning homestead only and no other land, (iii) household have no permanent income source, and (iv) household does not have regular income.
2. Regarding issuance of SSK benefit card, maintenance and up-gradation of the data base during rolling-out stage a joint team comprising SSK officials, LGI representatives and consultants should be engaged for preparing the comprehensive beneficiary list containing names and appropriate identification (including photograph) of all members of BPL households. The group should issue individual SSK benefit card to each and every members of BPL households.
3. Proposed joint-team will visit every village and mahalla of respective Upazila to prepare list of beneficiary with comprehensive information to issue SSK benefit card. There will
HDRC Socio-economic Assessment to Identify the Poor in Pilot Areas and Baseline Studies on Willingness to Pay,
Health Seeking Behaviour, Health Expenses and Patient Satisfaction
45
be a mechanism for incorporating new members in or out from households at Unions or Ward level.
4. Interaction with poor reveals apprehension of bias without involvement of third party in poor identification. The main reason for proposing inclusion of consultant is to prepare an un-biased comprehensive list of beneficiaries. The consultant should train the respective SSK staff so that during the scaling-up period the identification of BPL households can be continued in an un-biased manner, data base is maintained as well as up-graded and SSK benefit cards are regularly issued.
5. Deployment of more number of doctors and other service providers and ensuring regular presence would lead to reduce waiting time.
6. Adequate supply of medicine and improved quality of care are necessary for optimal utilization of public health facilities.
7. The benefit package should cover consultation fee, diagnostic fees, drugs, immunization, inpatient cost, transportation costs for referred cases and surgery cost (Package 3).
REFERENCES
Bangladesh Bureau of Statistics (2007) Report of the Household Income and Expenditure
Survey, 2005, Planning Division, Ministry of Planning, Government of Peoples’ Republic of Bangladesh
Bangladesh Bureau of Statistics (2011) Preliminary Report of the Household Income and
Expenditure Survey, 2010, Statistics Division, Ministry of Planning, Government of Peoples’ Republic of Bangladesh
BDHS (2007) Bangladesh Demographic and Health Service 2007, National Institute of
Population Research and Training (NIPORT), Mitra and Associates, and Macro International (2009), Dhaka, Bangladesh
BNHA (2010) Bangladesh National Health Accounts (BNHA), Health Economics Unit,
Ministry of Health and Family Welfare, GOB. BNHA (2003) Bangladesh National Health Accounts, 1999-2001, Health Economics Unit,
Ministry of Health and Family Welfare, GOB. DFID (2000) Linking Poverty Reduction and Environmental Management: Policy Challenges
and Opportunities, Discussion Document prepared by DFID. MICS (2009) Multiple Indicator Cluster Survey (2009) Progotir Pathey, Volume I: Technical
Report, Bangladesh Bureau of Statistics, and Unicef, Dhaka and Bangladesh World Bank (1993) ‘World Development Report 1993: Investing in Bangladesh’ Washington
DC: The World Bank
HDRC Socio-economic Assessment to Identify the Poor in Pilot Areas and Baseline Studies on Willingness to Pay,
Health Seeking Behaviour, Health Expenses and Patient Satisfaction
46
Annex-1 Data Tables
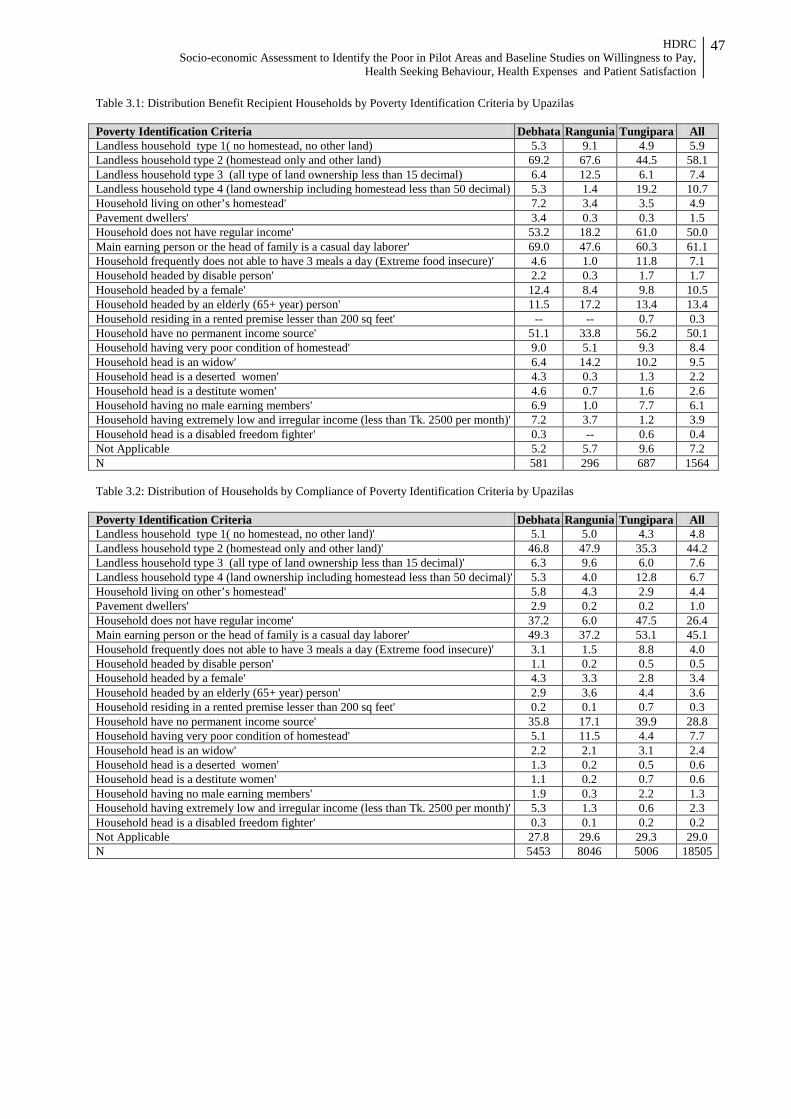
HDRC Socio-economic Assessment to Identify the Poor in Pilot Areas and Baseline Studies on Willingness to Pay,
Health Seeking Behaviour, Health Expenses and Patient Satisfaction
47
Table 3.1: Distribution Benefit Recipient Households by Poverty Identification Criteria by Upazilas Poverty Identification Criteria Debhata Rangunia Tungipara All Landless household type 1( no homestead, no other land) 5.3 9.1 4.9 5.9 Landless household type 2 (homestead only and other land) 69.2 67.6 44.5 58.1 Landless household type 3 (all type of land ownership less than 15 decimal) 6.4 12.5 6.1 7.4 Landless household type 4 (land ownership including homestead less than 50 decimal) 5.3 1.4 19.2 10.7 Household living on other’s homestead' 7.2 3.4 3.5 4.9 Pavement dwellers' 3.4 0.3 0.3 1.5 Household does not have regular income' 53.2 18.2 61.0 50.0 Main earning person or the head of family is a casual day laborer' 69.0 47.6 60.3 61.1 Household frequently does not able to have 3 meals a day (Extreme food insecure)' 4.6 1.0 11.8 7.1 Household headed by disable person' 2.2 0.3 1.7 1.7 Household headed by a female' 12.4 8.4 9.8 10.5 Household headed by an elderly (65+ year) person' 11.5 17.2 13.4 13.4 Household residing in a rented premise lesser than 200 sq feet' -- -- 0.7 0.3 Household have no permanent income source' 51.1 33.8 56.2 50.1 Household having very poor condition of homestead' 9.0 5.1 9.3 8.4 Household head is an widow' 6.4 14.2 10.2 9.5 Household head is a deserted women' 4.3 0.3 1.3 2.2 Household head is a destitute women' 4.6 0.7 1.6 2.6 Household having no male earning members' 6.9 1.0 7.7 6.1 Household having extremely low and irregular income (less than Tk. 2500 per month)' 7.2 3.7 1.2 3.9 Household head is a disabled freedom fighter' 0.3 -- 0.6 0.4 Not Applicable 5.2 5.7 9.6 7.2 N 581 296 687 1564 Table 3.2: Distribution of Households by Compliance of Poverty Identification Criteria by Upazilas Poverty Identification Criteria Debhata Rangunia Tungipara All Landless household type 1( no homestead, no other land)' 5.1 5.0 4.3 4.8 Landless household type 2 (homestead only and other land)' 46.8 47.9 35.3 44.2 Landless household type 3 (all type of land ownership less than 15 decimal)' 6.3 9.6 6.0 7.6 Landless household type 4 (land ownership including homestead less than 50 decimal)' 5.3 4.0 12.8 6.7 Household living on other’s homestead' 5.8 4.3 2.9 4.4 Pavement dwellers' 2.9 0.2 0.2 1.0 Household does not have regular income' 37.2 6.0 47.5 26.4 Main earning person or the head of family is a casual day laborer' 49.3 37.2 53.1 45.1 Household frequently does not able to have 3 meals a day (Extreme food insecure)' 3.1 1.5 8.8 4.0 Household headed by disable person' 1.1 0.2 0.5 0.5 Household headed by a female' 4.3 3.3 2.8 3.4 Household headed by an elderly (65+ year) person' 2.9 3.6 4.4 3.6 Household residing in a rented premise lesser than 200 sq feet' 0.2 0.1 0.7 0.3 Household have no permanent income source' 35.8 17.1 39.9 28.8 Household having very poor condition of homestead' 5.1 11.5 4.4 7.7 Household head is an widow' 2.2 2.1 3.1 2.4 Household head is a deserted women' 1.3 0.2 0.5 0.6 Household head is a destitute women' 1.1 0.2 0.7 0.6 Household having no male earning members' 1.9 0.3 2.2 1.3 Household having extremely low and irregular income (less than Tk. 2500 per month)' 5.3 1.3 0.6 2.3 Household head is a disabled freedom fighter' 0.3 0.1 0.2 0.2 Not Applicable 27.8 29.6 29.3 29.0 N 5453 8046 5006 18505
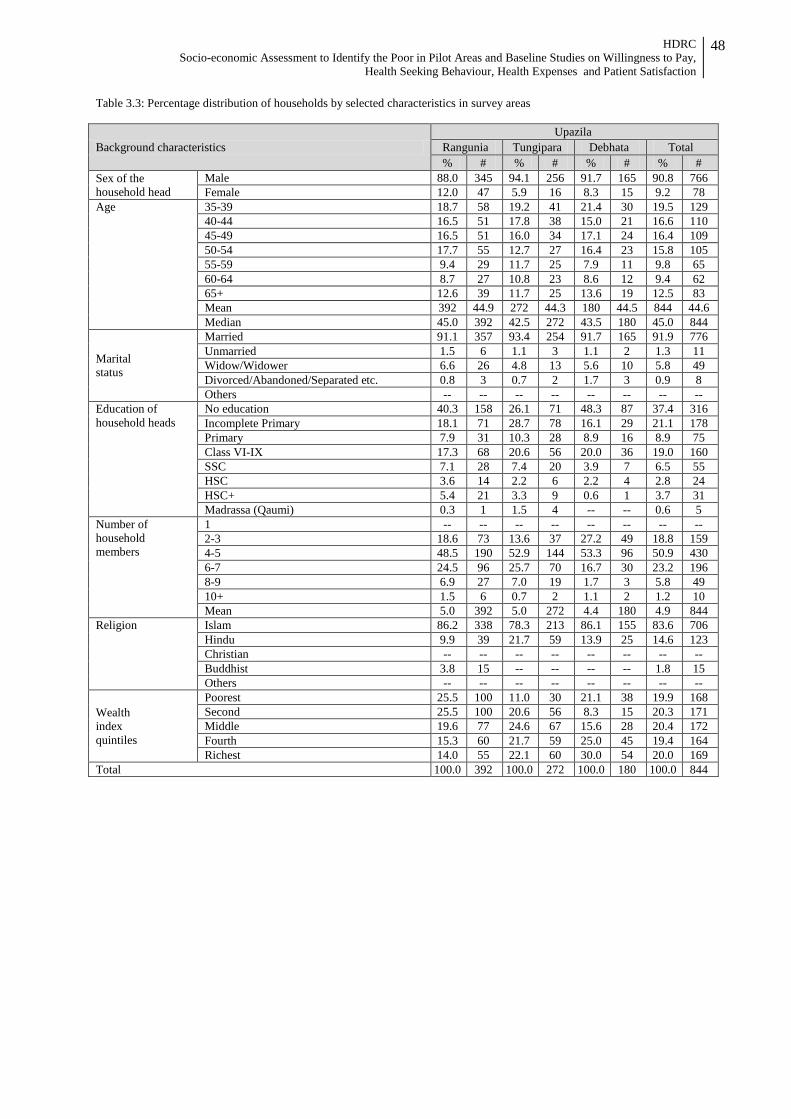
HDRC Socio-economic Assessment to Identify the Poor in Pilot Areas and Baseline Studies on Willingness to Pay,
Health Seeking Behaviour, Health Expenses and Patient Satisfaction
48
Table 3.3: Percentage distribution of households by selected characteristics in survey areas
Background characteristics Upazila
Rangunia Tungipara Debhata Total % # % # % # % #
Sex of the household head
Male 88.0 345 94.1 256 91.7 165 90.8 766 Female 12.0 47 5.9 16 8.3 15 9.2 78
Age 35-39 18.7 58 19.2 41 21.4 30 19.5 129 40-44 16.5 51 17.8 38 15.0 21 16.6 110 45-49 16.5 51 16.0 34 17.1 24 16.4 109 50-54 17.7 55 12.7 27 16.4 23 15.8 105 55-59 9.4 29 11.7 25 7.9 11 9.8 65 60-64 8.7 27 10.8 23 8.6 12 9.4 62 65+ 12.6 39 11.7 25 13.6 19 12.5 83 Mean 392 44.9 272 44.3 180 44.5 844 44.6 Median 45.0 392 42.5 272 43.5 180 45.0 844
Marital status
Married 91.1 357 93.4 254 91.7 165 91.9 776 Unmarried 1.5 6 1.1 3 1.1 2 1.3 11 Widow/Widower 6.6 26 4.8 13 5.6 10 5.8 49 Divorced/Abandoned/Separated etc. 0.8 3 0.7 2 1.7 3 0.9 8 Others -- -- -- -- -- -- -- --
Education of household heads
No education 40.3 158 26.1 71 48.3 87 37.4 316 Incomplete Primary 18.1 71 28.7 78 16.1 29 21.1 178 Primary 7.9 31 10.3 28 8.9 16 8.9 75 Class VI-IX 17.3 68 20.6 56 20.0 36 19.0 160 SSC 7.1 28 7.4 20 3.9 7 6.5 55 HSC 3.6 14 2.2 6 2.2 4 2.8 24 HSC+ 5.4 21 3.3 9 0.6 1 3.7 31 Madrassa (Qaumi) 0.3 1 1.5 4 -- -- 0.6 5
Number of household members
1 -- -- -- -- -- -- -- -- 2-3 18.6 73 13.6 37 27.2 49 18.8 159 4-5 48.5 190 52.9 144 53.3 96 50.9 430 6-7 24.5 96 25.7 70 16.7 30 23.2 196 8-9 6.9 27 7.0 19 1.7 3 5.8 49 10+ 1.5 6 0.7 2 1.1 2 1.2 10 Mean 5.0 392 5.0 272 4.4 180 4.9 844
Religion Islam 86.2 338 78.3 213 86.1 155 83.6 706 Hindu 9.9 39 21.7 59 13.9 25 14.6 123 Christian -- -- -- -- -- -- -- -- Buddhist 3.8 15 -- -- -- -- 1.8 15 Others -- -- -- -- -- -- -- --
Wealth index quintiles
Poorest 25.5 100 11.0 30 21.1 38 19.9 168 Second 25.5 100 20.6 56 8.3 15 20.3 171 Middle 19.6 77 24.6 67 15.6 28 20.4 172 Fourth 15.3 60 21.7 59 25.0 45 19.4 164 Richest 14.0 55 22.1 60 30.0 54 20.0 169
Total 100.0 392 100.0 272 100.0 180 100.0 844
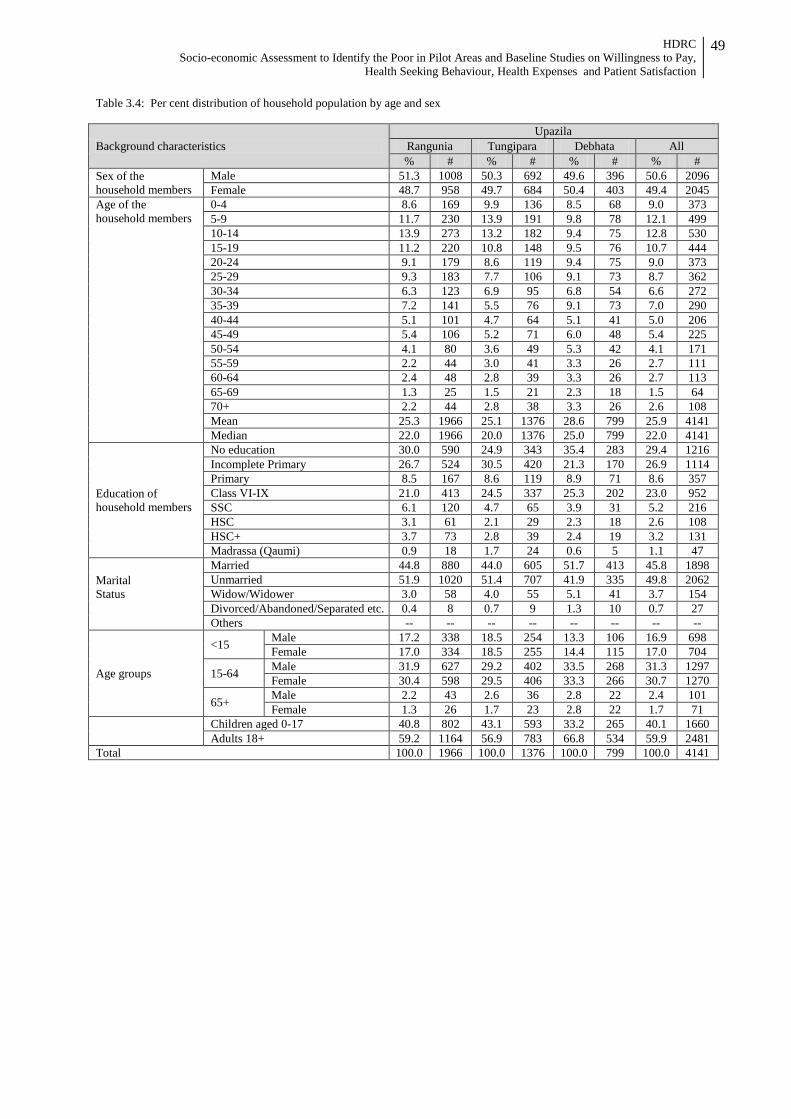
HDRC Socio-economic Assessment to Identify the Poor in Pilot Areas and Baseline Studies on Willingness to Pay,
Health Seeking Behaviour, Health Expenses and Patient Satisfaction
49
Table 3.4: Per cent distribution of household population by age and sex
Background characteristics Upazila
Rangunia Tungipara Debhata All % # % # % # % #
Sex of the household members
Male 51.3 1008 50.3 692 49.6 396 50.6 2096 Female 48.7 958 49.7 684 50.4 403 49.4 2045
Age of the household members
0-4 8.6 169 9.9 136 8.5 68 9.0 373 5-9 11.7 230 13.9 191 9.8 78 12.1 499 10-14 13.9 273 13.2 182 9.4 75 12.8 530 15-19 11.2 220 10.8 148 9.5 76 10.7 444 20-24 9.1 179 8.6 119 9.4 75 9.0 373 25-29 9.3 183 7.7 106 9.1 73 8.7 362 30-34 6.3 123 6.9 95 6.8 54 6.6 272 35-39 7.2 141 5.5 76 9.1 73 7.0 290 40-44 5.1 101 4.7 64 5.1 41 5.0 206 45-49 5.4 106 5.2 71 6.0 48 5.4 225 50-54 4.1 80 3.6 49 5.3 42 4.1 171 55-59 2.2 44 3.0 41 3.3 26 2.7 111 60-64 2.4 48 2.8 39 3.3 26 2.7 113 65-69 1.3 25 1.5 21 2.3 18 1.5 64 70+ 2.2 44 2.8 38 3.3 26 2.6 108 Mean 25.3 1966 25.1 1376 28.6 799 25.9 4141 Median 22.0 1966 20.0 1376 25.0 799 22.0 4141
Education of household members
No education 30.0 590 24.9 343 35.4 283 29.4 1216 Incomplete Primary 26.7 524 30.5 420 21.3 170 26.9 1114 Primary 8.5 167 8.6 119 8.9 71 8.6 357 Class VI-IX 21.0 413 24.5 337 25.3 202 23.0 952 SSC 6.1 120 4.7 65 3.9 31 5.2 216 HSC 3.1 61 2.1 29 2.3 18 2.6 108 HSC+ 3.7 73 2.8 39 2.4 19 3.2 131 Madrassa (Qaumi) 0.9 18 1.7 24 0.6 5 1.1 47
Marital Status
Married 44.8 880 44.0 605 51.7 413 45.8 1898 Unmarried 51.9 1020 51.4 707 41.9 335 49.8 2062 Widow/Widower 3.0 58 4.0 55 5.1 41 3.7 154 Divorced/Abandoned/Separated etc. 0.4 8 0.7 9 1.3 10 0.7 27 Others -- -- -- -- -- -- -- --
Age groups
<15 Male 17.2 338 18.5 254 13.3 106 16.9 698 Female 17.0 334 18.5 255 14.4 115 17.0 704
15-64 Male 31.9 627 29.2 402 33.5 268 31.3 1297 Female 30.4 598 29.5 406 33.3 266 30.7 1270
65+ Male 2.2 43 2.6 36 2.8 22 2.4 101 Female 1.3 26 1.7 23 2.8 22 1.7 71
Children aged 0-17 40.8 802 43.1 593 33.2 265 40.1 1660 Adults 18+ 59.2 1164 56.9 783 66.8 534 59.9 2481
Total 100.0 1966 100.0 1376 100.0 799 100.0 4141
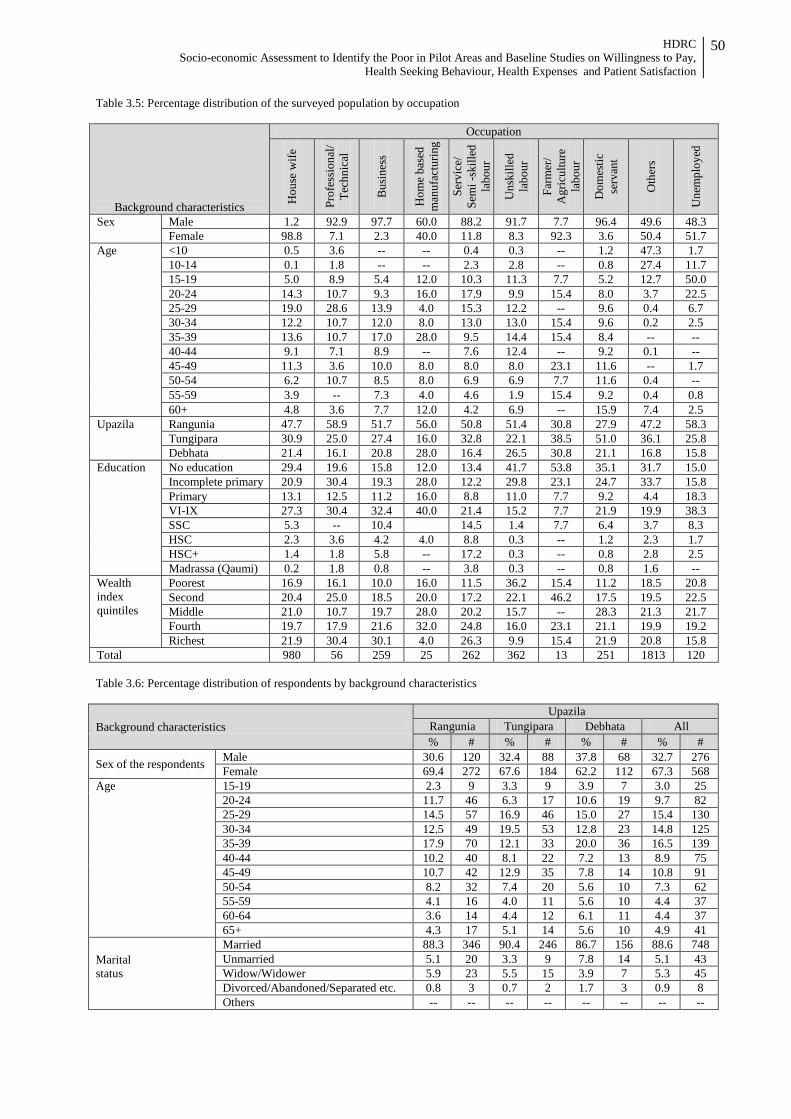
HDRC Socio-economic Assessment to Identify the Poor in Pilot Areas and Baseline Studies on Willingness to Pay,
Health Seeking Behaviour, Health Expenses and Patient Satisfaction
50
Table 3.5: Percentage distribution of the surveyed population by occupation
Background characteristics
Occupation
Hou
se w
ife
Prof
essi
onal
/ Te
chni
cal
Bus
ines
s
Hom
e ba
sed
man
ufac
turin
g
Serv
ice/
Se
mi -
skill
ed
labo
ur
Uns
kille
d
labo
ur
Farm
er/
Agr
icul
ture
la
bour
Dom
estic
se
rvan
t
Oth
ers
Une
mpl
oyed
Sex Male 1.2 92.9 97.7 60.0 88.2 91.7 7.7 96.4 49.6 48.3 Female 98.8 7.1 2.3 40.0 11.8 8.3 92.3 3.6 50.4 51.7
Age <10 0.5 3.6 -- -- 0.4 0.3 -- 1.2 47.3 1.7 10-14 0.1 1.8 -- -- 2.3 2.8 -- 0.8 27.4 11.7 15-19 5.0 8.9 5.4 12.0 10.3 11.3 7.7 5.2 12.7 50.0 20-24 14.3 10.7 9.3 16.0 17.9 9.9 15.4 8.0 3.7 22.5 25-29 19.0 28.6 13.9 4.0 15.3 12.2 -- 9.6 0.4 6.7 30-34 12.2 10.7 12.0 8.0 13.0 13.0 15.4 9.6 0.2 2.5 35-39 13.6 10.7 17.0 28.0 9.5 14.4 15.4 8.4 -- -- 40-44 9.1 7.1 8.9 -- 7.6 12.4 -- 9.2 0.1 -- 45-49 11.3 3.6 10.0 8.0 8.0 8.0 23.1 11.6 -- 1.7 50-54 6.2 10.7 8.5 8.0 6.9 6.9 7.7 11.6 0.4 -- 55-59 3.9 -- 7.3 4.0 4.6 1.9 15.4 9.2 0.4 0.8 60+ 4.8 3.6 7.7 12.0 4.2 6.9 -- 15.9 7.4 2.5
Upazila Rangunia 47.7 58.9 51.7 56.0 50.8 51.4 30.8 27.9 47.2 58.3 Tungipara 30.9 25.0 27.4 16.0 32.8 22.1 38.5 51.0 36.1 25.8 Debhata 21.4 16.1 20.8 28.0 16.4 26.5 30.8 21.1 16.8 15.8
Education No education 29.4 19.6 15.8 12.0 13.4 41.7 53.8 35.1 31.7 15.0 Incomplete primary 20.9 30.4 19.3 28.0 12.2 29.8 23.1 24.7 33.7 15.8 Primary 13.1 12.5 11.2 16.0 8.8 11.0 7.7 9.2 4.4 18.3 VI-IX 27.3 30.4 32.4 40.0 21.4 15.2 7.7 21.9 19.9 38.3 SSC 5.3 -- 10.4 14.5 1.4 7.7 6.4 3.7 8.3 HSC 2.3 3.6 4.2 4.0 8.8 0.3 -- 1.2 2.3 1.7 HSC+ 1.4 1.8 5.8 -- 17.2 0.3 -- 0.8 2.8 2.5 Madrassa (Qaumi) 0.2 1.8 0.8 -- 3.8 0.3 -- 0.8 1.6 --
Wealth index quintiles
Poorest 16.9 16.1 10.0 16.0 11.5 36.2 15.4 11.2 18.5 20.8 Second 20.4 25.0 18.5 20.0 17.2 22.1 46.2 17.5 19.5 22.5 Middle 21.0 10.7 19.7 28.0 20.2 15.7 -- 28.3 21.3 21.7 Fourth 19.7 17.9 21.6 32.0 24.8 16.0 23.1 21.1 19.9 19.2 Richest 21.9 30.4 30.1 4.0 26.3 9.9 15.4 21.9 20.8 15.8
Total 980 56 259 25 262 362 13 251 1813 120 Table 3.6: Percentage distribution of respondents by background characteristics
Background characteristics Upazila
Rangunia Tungipara Debhata All % # % # % # % #
Sex of the respondents Male 30.6 120 32.4 88 37.8 68 32.7 276 Female 69.4 272 67.6 184 62.2 112 67.3 568
Age 15-19 2.3 9 3.3 9 3.9 7 3.0 25 20-24 11.7 46 6.3 17 10.6 19 9.7 82 25-29 14.5 57 16.9 46 15.0 27 15.4 130 30-34 12.5 49 19.5 53 12.8 23 14.8 125 35-39 17.9 70 12.1 33 20.0 36 16.5 139 40-44 10.2 40 8.1 22 7.2 13 8.9 75 45-49 10.7 42 12.9 35 7.8 14 10.8 91 50-54 8.2 32 7.4 20 5.6 10 7.3 62 55-59 4.1 16 4.0 11 5.6 10 4.4 37 60-64 3.6 14 4.4 12 6.1 11 4.4 37 65+ 4.3 17 5.1 14 5.6 10 4.9 41
Marital status
Married 88.3 346 90.4 246 86.7 156 88.6 748 Unmarried 5.1 20 3.3 9 7.8 14 5.1 43 Widow/Widower 5.9 23 5.5 15 3.9 7 5.3 45 Divorced/Abandoned/Separated etc. 0.8 3 0.7 2 1.7 3 0.9 8 Others -- -- -- -- -- -- -- --
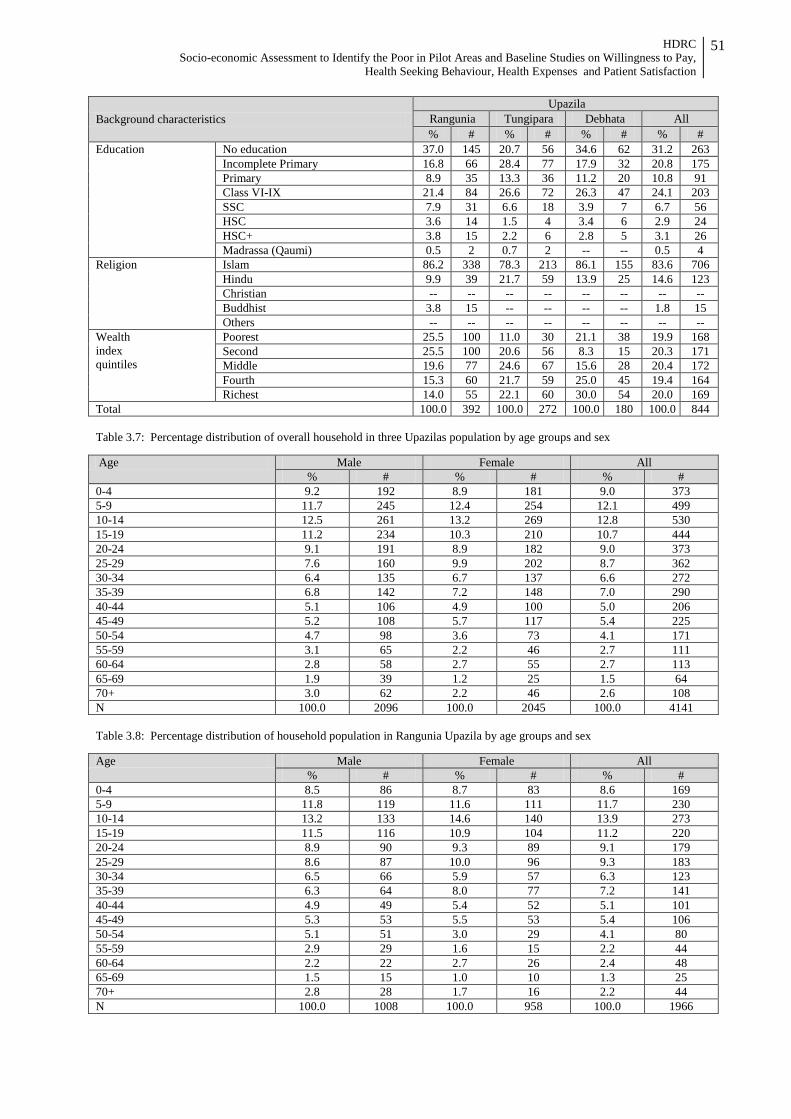
HDRC Socio-economic Assessment to Identify the Poor in Pilot Areas and Baseline Studies on Willingness to Pay,
Health Seeking Behaviour, Health Expenses and Patient Satisfaction
51
Background characteristics Upazila
Rangunia Tungipara Debhata All % # % # % # % #
Education No education 37.0 145 20.7 56 34.6 62 31.2 263 Incomplete Primary 16.8 66 28.4 77 17.9 32 20.8 175 Primary 8.9 35 13.3 36 11.2 20 10.8 91 Class VI-IX 21.4 84 26.6 72 26.3 47 24.1 203 SSC 7.9 31 6.6 18 3.9 7 6.7 56 HSC 3.6 14 1.5 4 3.4 6 2.9 24 HSC+ 3.8 15 2.2 6 2.8 5 3.1 26 Madrassa (Qaumi) 0.5 2 0.7 2 -- -- 0.5 4
Religion Islam 86.2 338 78.3 213 86.1 155 83.6 706 Hindu 9.9 39 21.7 59 13.9 25 14.6 123 Christian -- -- -- -- -- -- -- -- Buddhist 3.8 15 -- -- -- -- 1.8 15 Others -- -- -- -- -- -- -- --
Wealth index quintiles
Poorest 25.5 100 11.0 30 21.1 38 19.9 168 Second 25.5 100 20.6 56 8.3 15 20.3 171 Middle 19.6 77 24.6 67 15.6 28 20.4 172 Fourth 15.3 60 21.7 59 25.0 45 19.4 164 Richest 14.0 55 22.1 60 30.0 54 20.0 169
Total 100.0 392 100.0 272 100.0 180 100.0 844 Table 3.7: Percentage distribution of overall household in three Upazilas population by age groups and sex Age Male Female All
% # % # % # 0-4 9.2 192 8.9 181 9.0 373 5-9 11.7 245 12.4 254 12.1 499 10-14 12.5 261 13.2 269 12.8 530 15-19 11.2 234 10.3 210 10.7 444 20-24 9.1 191 8.9 182 9.0 373 25-29 7.6 160 9.9 202 8.7 362 30-34 6.4 135 6.7 137 6.6 272 35-39 6.8 142 7.2 148 7.0 290 40-44 5.1 106 4.9 100 5.0 206 45-49 5.2 108 5.7 117 5.4 225 50-54 4.7 98 3.6 73 4.1 171 55-59 3.1 65 2.2 46 2.7 111 60-64 2.8 58 2.7 55 2.7 113 65-69 1.9 39 1.2 25 1.5 64 70+ 3.0 62 2.2 46 2.6 108 N 100.0 2096 100.0 2045 100.0 4141 Table 3.8: Percentage distribution of household population in Rangunia Upazila by age groups and sex Age Male Female All
% # % # % # 0-4 8.5 86 8.7 83 8.6 169 5-9 11.8 119 11.6 111 11.7 230 10-14 13.2 133 14.6 140 13.9 273 15-19 11.5 116 10.9 104 11.2 220 20-24 8.9 90 9.3 89 9.1 179 25-29 8.6 87 10.0 96 9.3 183 30-34 6.5 66 5.9 57 6.3 123 35-39 6.3 64 8.0 77 7.2 141 40-44 4.9 49 5.4 52 5.1 101 45-49 5.3 53 5.5 53 5.4 106 50-54 5.1 51 3.0 29 4.1 80 55-59 2.9 29 1.6 15 2.2 44 60-64 2.2 22 2.7 26 2.4 48 65-69 1.5 15 1.0 10 1.3 25 70+ 2.8 28 1.7 16 2.2 44 N 100.0 1008 100.0 958 100.0 1966
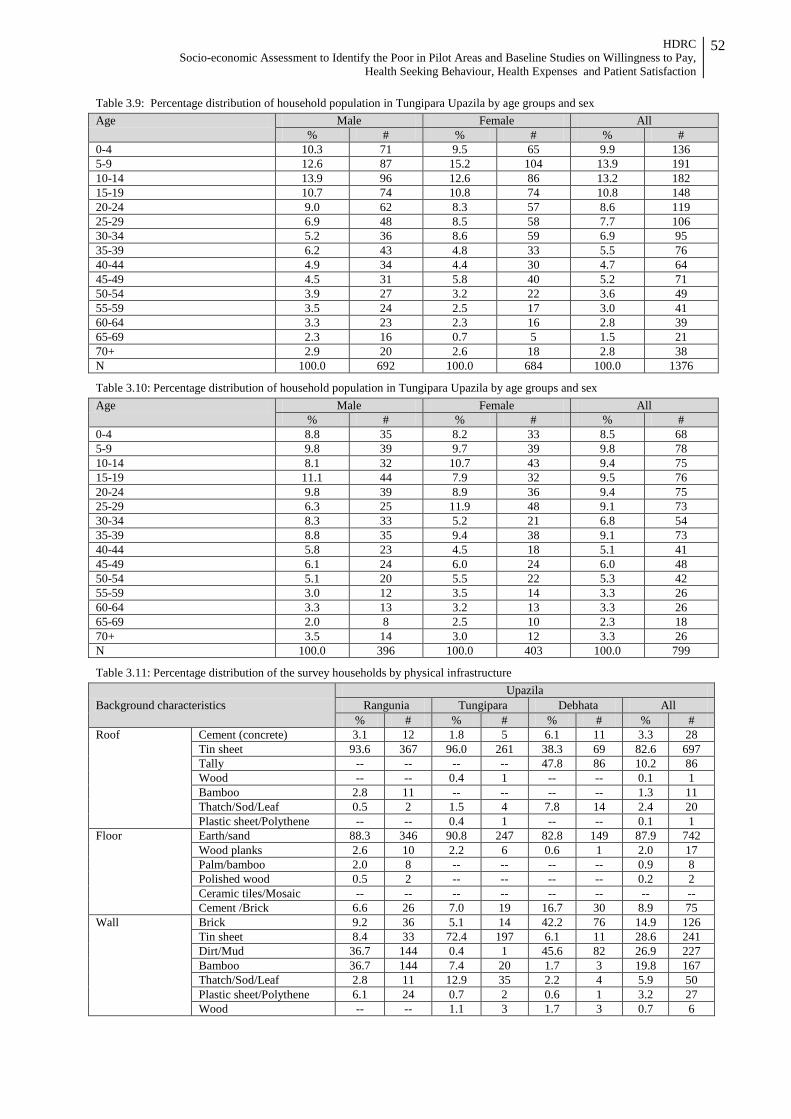
HDRC Socio-economic Assessment to Identify the Poor in Pilot Areas and Baseline Studies on Willingness to Pay,
Health Seeking Behaviour, Health Expenses and Patient Satisfaction
52
Table 3.9: Percentage distribution of household population in Tungipara Upazila by age groups and sex
Age Male Female All % # % # % #
0-4 10.3 71 9.5 65 9.9 136 5-9 12.6 87 15.2 104 13.9 191 10-14 13.9 96 12.6 86 13.2 182 15-19 10.7 74 10.8 74 10.8 148 20-24 9.0 62 8.3 57 8.6 119 25-29 6.9 48 8.5 58 7.7 106 30-34 5.2 36 8.6 59 6.9 95 35-39 6.2 43 4.8 33 5.5 76 40-44 4.9 34 4.4 30 4.7 64 45-49 4.5 31 5.8 40 5.2 71 50-54 3.9 27 3.2 22 3.6 49 55-59 3.5 24 2.5 17 3.0 41 60-64 3.3 23 2.3 16 2.8 39 65-69 2.3 16 0.7 5 1.5 21 70+ 2.9 20 2.6 18 2.8 38 N 100.0 692 100.0 684 100.0 1376
Table 3.10: Percentage distribution of household population in Tungipara Upazila by age groups and sex
Age Male Female All % # % # % #
0-4 8.8 35 8.2 33 8.5 68 5-9 9.8 39 9.7 39 9.8 78 10-14 8.1 32 10.7 43 9.4 75 15-19 11.1 44 7.9 32 9.5 76 20-24 9.8 39 8.9 36 9.4 75 25-29 6.3 25 11.9 48 9.1 73 30-34 8.3 33 5.2 21 6.8 54 35-39 8.8 35 9.4 38 9.1 73 40-44 5.8 23 4.5 18 5.1 41 45-49 6.1 24 6.0 24 6.0 48 50-54 5.1 20 5.5 22 5.3 42 55-59 3.0 12 3.5 14 3.3 26 60-64 3.3 13 3.2 13 3.3 26 65-69 2.0 8 2.5 10 2.3 18 70+ 3.5 14 3.0 12 3.3 26 N 100.0 396 100.0 403 100.0 799
Table 3.11: Percentage distribution of the survey households by physical infrastructure
Background characteristics Upazila
Rangunia Tungipara Debhata All % # % # % # % #
Roof Cement (concrete) 3.1 12 1.8 5 6.1 11 3.3 28 Tin sheet 93.6 367 96.0 261 38.3 69 82.6 697 Tally -- -- -- -- 47.8 86 10.2 86 Wood -- -- 0.4 1 -- -- 0.1 1 Bamboo 2.8 11 -- -- -- -- 1.3 11 Thatch/Sod/Leaf 0.5 2 1.5 4 7.8 14 2.4 20 Plastic sheet/Polythene -- -- 0.4 1 -- -- 0.1 1
Floor Earth/sand 88.3 346 90.8 247 82.8 149 87.9 742 Wood planks 2.6 10 2.2 6 0.6 1 2.0 17 Palm/bamboo 2.0 8 -- -- -- -- 0.9 8 Polished wood 0.5 2 -- -- -- -- 0.2 2 Ceramic tiles/Mosaic -- -- -- -- -- -- -- -- Cement /Brick 6.6 26 7.0 19 16.7 30 8.9 75
Wall Brick 9.2 36 5.1 14 42.2 76 14.9 126 Tin sheet 8.4 33 72.4 197 6.1 11 28.6 241 Dirt/Mud 36.7 144 0.4 1 45.6 82 26.9 227 Bamboo 36.7 144 7.4 20 1.7 3 19.8 167 Thatch/Sod/Leaf 2.8 11 12.9 35 2.2 4 5.9 50 Plastic sheet/Polythene 6.1 24 0.7 2 0.6 1 3.2 27 Wood -- -- 1.1 3 1.7 3 0.7 6
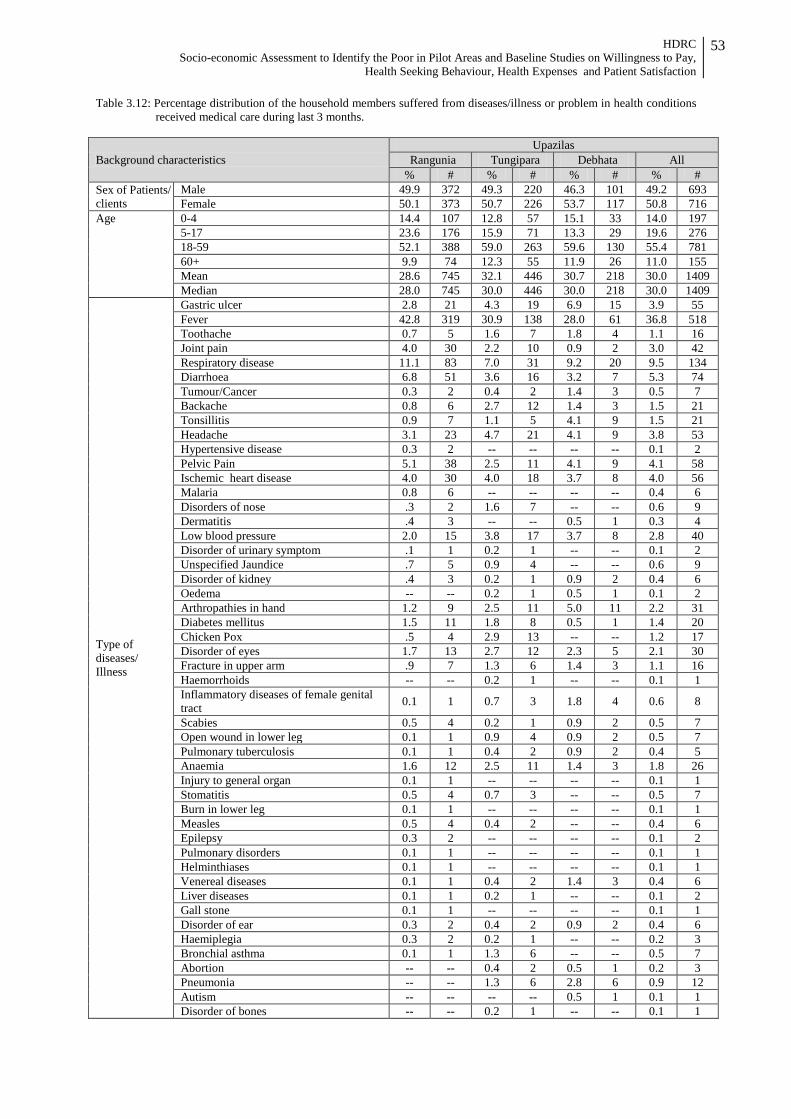
HDRC Socio-economic Assessment to Identify the Poor in Pilot Areas and Baseline Studies on Willingness to Pay,
Health Seeking Behaviour, Health Expenses and Patient Satisfaction
53
Table 3.12: Percentage distribution of the household members suffered from diseases/illness or problem in health conditions received medical care during last 3 months.
Background characteristics Upazilas
Rangunia Tungipara Debhata All % # % # % # % #
Sex of Patients/ clients
Male 49.9 372 49.3 220 46.3 101 49.2 693 Female 50.1 373 50.7 226 53.7 117 50.8 716
Age 0-4 14.4 107 12.8 57 15.1 33 14.0 197 5-17 23.6 176 15.9 71 13.3 29 19.6 276 18-59 52.1 388 59.0 263 59.6 130 55.4 781 60+ 9.9 74 12.3 55 11.9 26 11.0 155 Mean 28.6 745 32.1 446 30.7 218 30.0 1409 Median 28.0 745 30.0 446 30.0 218 30.0 1409
Type of diseases/ Illness
Gastric ulcer 2.8 21 4.3 19 6.9 15 3.9 55 Fever 42.8 319 30.9 138 28.0 61 36.8 518 Toothache 0.7 5 1.6 7 1.8 4 1.1 16 Joint pain 4.0 30 2.2 10 0.9 2 3.0 42 Respiratory disease 11.1 83 7.0 31 9.2 20 9.5 134 Diarrhoea 6.8 51 3.6 16 3.2 7 5.3 74 Tumour/Cancer 0.3 2 0.4 2 1.4 3 0.5 7 Backache 0.8 6 2.7 12 1.4 3 1.5 21 Tonsillitis 0.9 7 1.1 5 4.1 9 1.5 21 Headache 3.1 23 4.7 21 4.1 9 3.8 53 Hypertensive disease 0.3 2 -- -- -- -- 0.1 2 Pelvic Pain 5.1 38 2.5 11 4.1 9 4.1 58 Ischemic heart disease 4.0 30 4.0 18 3.7 8 4.0 56 Malaria 0.8 6 -- -- -- -- 0.4 6 Disorders of nose .3 2 1.6 7 -- -- 0.6 9 Dermatitis .4 3 -- -- 0.5 1 0.3 4 Low blood pressure 2.0 15 3.8 17 3.7 8 2.8 40 Disorder of urinary symptom .1 1 0.2 1 -- -- 0.1 2 Unspecified Jaundice .7 5 0.9 4 -- -- 0.6 9 Disorder of kidney .4 3 0.2 1 0.9 2 0.4 6 Oedema -- -- 0.2 1 0.5 1 0.1 2 Arthropathies in hand 1.2 9 2.5 11 5.0 11 2.2 31 Diabetes mellitus 1.5 11 1.8 8 0.5 1 1.4 20 Chicken Pox .5 4 2.9 13 -- -- 1.2 17 Disorder of eyes 1.7 13 2.7 12 2.3 5 2.1 30 Fracture in upper arm .9 7 1.3 6 1.4 3 1.1 16 Haemorrhoids -- -- 0.2 1 -- -- 0.1 1 Inflammatory diseases of female genital tract 0.1 1 0.7 3 1.8 4 0.6 8
Scabies 0.5 4 0.2 1 0.9 2 0.5 7 Open wound in lower leg 0.1 1 0.9 4 0.9 2 0.5 7 Pulmonary tuberculosis 0.1 1 0.4 2 0.9 2 0.4 5 Anaemia 1.6 12 2.5 11 1.4 3 1.8 26 Injury to general organ 0.1 1 -- -- -- -- 0.1 1 Stomatitis 0.5 4 0.7 3 -- -- 0.5 7 Burn in lower leg 0.1 1 -- -- -- -- 0.1 1 Measles 0.5 4 0.4 2 -- -- 0.4 6 Epilepsy 0.3 2 -- -- -- -- 0.1 2 Pulmonary disorders 0.1 1 -- -- -- -- 0.1 1 Helminthiases 0.1 1 -- -- -- -- 0.1 1 Venereal diseases 0.1 1 0.4 2 1.4 3 0.4 6 Liver diseases 0.1 1 0.2 1 -- -- 0.1 2 Gall stone 0.1 1 -- -- -- -- 0.1 1 Disorder of ear 0.3 2 0.4 2 0.9 2 0.4 6 Haemiplegia 0.3 2 0.2 1 -- -- 0.2 3 Bronchial asthma 0.1 1 1.3 6 -- -- 0.5 7 Abortion -- -- 0.4 2 0.5 1 0.2 3 Pneumonia -- -- 1.3 6 2.8 6 0.9 12 Autism -- -- -- -- 0.5 1 0.1 1 Disorder of bones -- -- 0.2 1 -- -- 0.1 1

HDRC Socio-economic Assessment to Identify the Poor in Pilot Areas and Baseline Studies on Willingness to Pay,
Health Seeking Behaviour, Health Expenses and Patient Satisfaction
54
Background characteristics Upazilas
Rangunia Tungipara Debhata All % # % # % # % #
Haematemesis (Blood vomiting) 0.5 4 0.9 4 -- -- 0.6 8 Dog bite -- -- 0.4 2 -- -- 0.1 2 General weakness -- -- 0.2 1 -- -- 0.1 1 Disorders related to pregnancy -- -- 1.3 6 -- -- 0.4 6 Anal fissure -- -- 0.2 1 -- -- 0.1 1 Delivery (Child-birth) 0.3 2 0.2 1 -- -- 0.2 3 Disorders of umbilicus -- -- 0.2 1 -- -- 0.1 1 Hernia 0.3 2 0.9 4 -- -- 0.4 6 Appendicitis -- -- 0.7 3 2.8 6 0.6 9 Psychological problems -- -- 0.7 3 -- -- 0.2 3 Hydrocele -- -- 0.2 1 0.5 1 0.1 2 Accident -- -- -- -- 1.4 3 0.2 3
Education of household head
No education 41.7 311 33.0 146 47.9 104 39.9 561 Incomplete Primary 24.0 179 28.4 126 14.3 31 23.9 336 Primary 9.3 69 7.9 35 13.4 29 9.5 133 Class VI-IX 15.6 116 21.4 95 21.2 46 18.3 257 SSC 4.4 33 3.6 16 1.8 4 3.8 53 HSC 1.6 12 2.0 9 0.9 2 1.6 23 HSC+ 2.7 20 2.7 12 -- -- 2.3 32 Madrassa (Qaumi) 0.7 5 0.9 4 0.5 1 0.7 10
Wealth quintiles
Poorest 26.8 200 11.2 50 22.0 48 21.1 298 Second 26.8 200 18.4 82 7.8 17 21.2 299 Middle 18.0 134 21.7 97 11.5 25 18.2 256 Fourth 14.9 111 25.1 112 27.5 60 20.1 283 Richest 13.4 100 23.5 105 31.2 68 19.4 273
Total 100.0 745 100.0 446 100.0 218 100.0 1409 Table 3.13: Percentage distribution of the ill persons/clients who consulted to service providers/service delivery points when
they became sick or had problem in health conditions during last 3 months at 3 Upazilas
Background characteristics
Self
/ pha
rmac
y
Hom
eopa
thic
pra
ctiti
oner
Info
rmal
Priv
ate
Prac
titio
ner
(mod
ern
med
icin
e)
Form
al P
rivat
e Pr
actit
ione
r (m
edic
al g
radu
ate)
UH
&FW
C/S
C/R
D
UH
C
Dis
trict
hos
pita
l
Mat
erna
l and
Chi
ld W
elfa
re
Cen
tre
Med
ical
col
lege
hos
pita
l
Spec
ializ
ed h
ospi
tal
Priv
ate
clin
ic/h
ospi
tal
NG
O ru
n H
ealth
Cen
tre
NG
O h
ealth
wor
ker
Oth
er
All
Sex of Patient/Client
Male 52.3 57.9 45.7 49.0 37.9 48.7 50.0 100.0 45.5 45.8 47.1 -- 100.0 60.0 49.2 Female 47.7 42.1 54.3 51.0 62.1 51.3 50.0 -- 54.5 54.2 52.9 100.0 -- 40.0 50.8
Age of the Patient/Client
0-4 14.0 19.3 16.8 15.8 13.8 14.6 8.6 -- 9.1 12.5 5.9 -- -- -- 14.0 5-17 24.3 24.6 17.3 22.3 17.2 20.7 10.3 -- -- 8.3 11.8 -- -- -- 19.6 18-59 51.7 50.9 55.3 51.7 55.2 53.6 67.2 100.0 72.7 68.8 66.4 100.0 100.0 80.0 55.4 60+ 10.0 5.3 10.7 10.3 13.8 11.1 13.8 -- 18.2 10.4 16.0 -- -- 20.0 11.0 Mean 28.3 24.6 29.5 28.2 31.1 29.3 36.9 45 47.1 34.0 36.6 38 38 47.4 30.0 Median 25.0 25.0 30.0 25.0 32.0 29.0 40.0 45 52.0 35.0 36.0 38 38 45.0 30.0
Education of household head
No education 39.9 31.6 47.7 39.4 37.9 41.7 36.2 100.0 63.6 27.7 35.3 -- -- -- 39.9 Incomplete Primary
28.0 33.3 20.3 21.6 34.5 27.4 17.2 -- 9.1 17.0 16.8 100.0 100.0 -- 23.9
Primary 10.4 8.8 11.2 8.9 20.7 8.1 10.3 -- -- 6.4 7.6 -- -- 20.0 9.5 Class VI-IX 13.1 19.3 16.8 20.5 6.9 17.8 27.6 -- -- 27.7 26.1 -- -- 40.0 18.3 SSC 3.0 5.3 1.5 4.8 -- 1.5 1.7 -- 9.1 12.8 7.6 -- -- 40.0 3.8 HSC 2.1 -- 1.5 1.7 -- 0.8 5.2 -- -- 2.1 1.7 -- -- -- 1.6 HSC+ 2.1 -- 0.5 2.7 -- 2.3 -- 9.1 6.4 5.0 -- -- -- 2.3 Madrassa (Qaumi) 1.2 1.8 0.5 0.3 -- 0.4 1.7 -- 9.1 -- -- -- -- -- .7
Religion Islam 86.6 68.4 81.2 81.8 89.7 91.6 77.6 100.0 81.8 91.7 79.0 -- 100.0 40.0 84.0
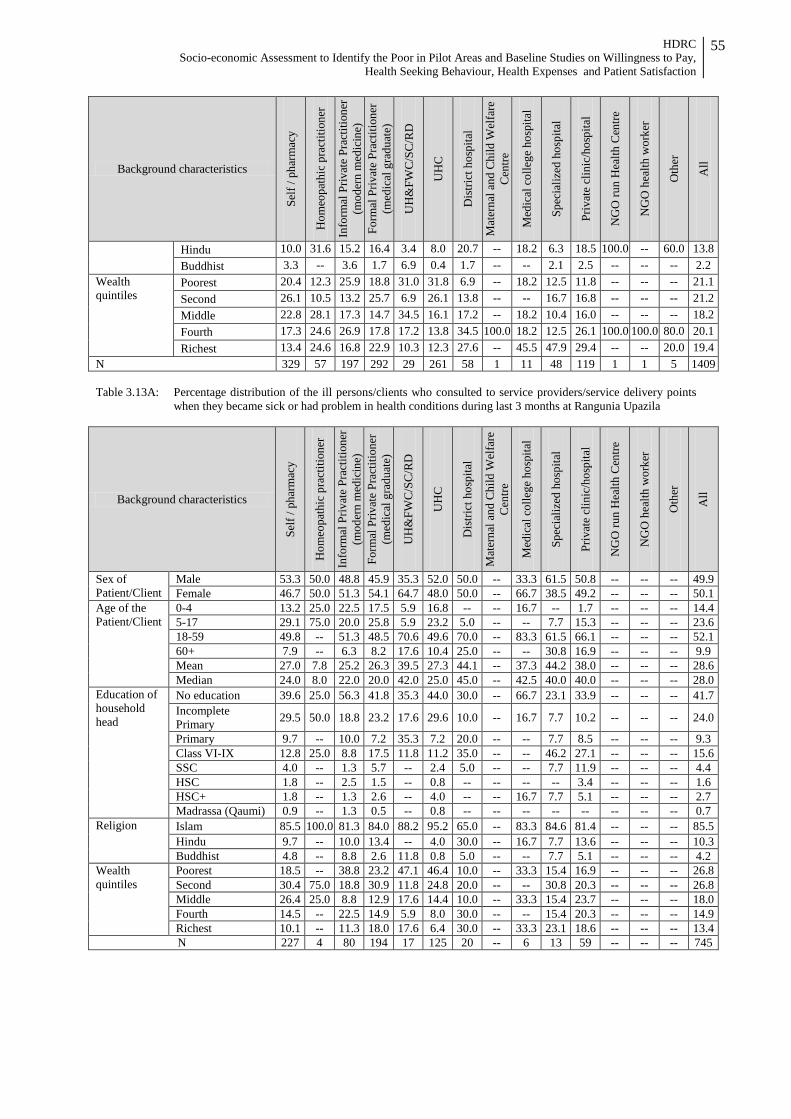
HDRC Socio-economic Assessment to Identify the Poor in Pilot Areas and Baseline Studies on Willingness to Pay,
Health Seeking Behaviour, Health Expenses and Patient Satisfaction
55
Background characteristics
Self
/ pha
rmac
y
Hom
eopa
thic
pra
ctiti
oner
Info
rmal
Priv
ate
Prac
titio
ner
(mod
ern
med
icin
e)
Form
al P
rivat
e Pr
actit
ione
r (m
edic
al g
radu
ate)
UH
&FW
C/S
C/R
D
UH
C
Dis
trict
hos
pita
l
Mat
erna
l and
Chi
ld W
elfa
re
Cen
tre
Med
ical
col
lege
hos
pita
l
Spec
ializ
ed h
ospi
tal
Priv
ate
clin
ic/h
ospi
tal
NG
O ru
n H
ealth
Cen
tre
NG
O h
ealth
wor
ker
Oth
er
All
Hindu 10.0 31.6 15.2 16.4 3.4 8.0 20.7 -- 18.2 6.3 18.5 100.0 -- 60.0 13.8 Buddhist 3.3 -- 3.6 1.7 6.9 0.4 1.7 -- -- 2.1 2.5 -- -- -- 2.2
Wealth quintiles
Poorest 20.4 12.3 25.9 18.8 31.0 31.8 6.9 -- 18.2 12.5 11.8 -- -- -- 21.1 Second 26.1 10.5 13.2 25.7 6.9 26.1 13.8 -- -- 16.7 16.8 -- -- -- 21.2 Middle 22.8 28.1 17.3 14.7 34.5 16.1 17.2 -- 18.2 10.4 16.0 -- -- -- 18.2 Fourth 17.3 24.6 26.9 17.8 17.2 13.8 34.5 100.0 18.2 12.5 26.1 100.0 100.0 80.0 20.1 Richest 13.4 24.6 16.8 22.9 10.3 12.3 27.6 -- 45.5 47.9 29.4 -- -- 20.0 19.4
N 329 57 197 292 29 261 58 1 11 48 119 1 1 5 1409 Table 3.13A: Percentage distribution of the ill persons/clients who consulted to service providers/service delivery points
when they became sick or had problem in health conditions during last 3 months at Rangunia Upazila
Background characteristics
Self
/ pha
rmac
y
Hom
eopa
thic
pra
ctiti
oner
Info
rmal
Priv
ate
Prac
titio
ner
(mod
ern
med
icin
e)
Form
al P
rivat
e Pr
actit
ione
r (m
edic
al g
radu
ate)
UH
&FW
C/S
C/R
D
UH
C
Dis
trict
hos
pita
l
Mat
erna
l and
Chi
ld W
elfa
re
Cen
tre
Med
ical
col
lege
hos
pita
l
Spec
ializ
ed h
ospi
tal
Priv
ate
clin
ic/h
ospi
tal
NG
O ru
n H
ealth
Cen
tre
NG
O h
ealth
wor
ker
Oth
er
All
Sex of Patient/Client
Male 53.3 50.0 48.8 45.9 35.3 52.0 50.0 -- 33.3 61.5 50.8 -- -- -- 49.9 Female 46.7 50.0 51.3 54.1 64.7 48.0 50.0 -- 66.7 38.5 49.2 -- -- -- 50.1
Age of the Patient/Client
0-4 13.2 25.0 22.5 17.5 5.9 16.8 -- -- 16.7 -- 1.7 -- -- -- 14.4 5-17 29.1 75.0 20.0 25.8 5.9 23.2 5.0 -- -- 7.7 15.3 -- -- -- 23.6 18-59 49.8 -- 51.3 48.5 70.6 49.6 70.0 -- 83.3 61.5 66.1 -- -- -- 52.1 60+ 7.9 -- 6.3 8.2 17.6 10.4 25.0 -- -- 30.8 16.9 -- -- -- 9.9 Mean 27.0 7.8 25.2 26.3 39.5 27.3 44.1 -- 37.3 44.2 38.0 -- -- -- 28.6 Median 24.0 8.0 22.0 20.0 42.0 25.0 45.0 -- 42.5 40.0 40.0 -- -- -- 28.0
Education of household head
No education 39.6 25.0 56.3 41.8 35.3 44.0 30.0 -- 66.7 23.1 33.9 -- -- -- 41.7 Incomplete Primary 29.5 50.0 18.8 23.2 17.6 29.6 10.0 -- 16.7 7.7 10.2 -- -- -- 24.0
Primary 9.7 -- 10.0 7.2 35.3 7.2 20.0 -- -- 7.7 8.5 -- -- -- 9.3 Class VI-IX 12.8 25.0 8.8 17.5 11.8 11.2 35.0 -- -- 46.2 27.1 -- -- -- 15.6 SSC 4.0 -- 1.3 5.7 -- 2.4 5.0 -- -- 7.7 11.9 -- -- -- 4.4 HSC 1.8 -- 2.5 1.5 -- 0.8 -- -- -- -- 3.4 -- -- -- 1.6 HSC+ 1.8 -- 1.3 2.6 -- 4.0 -- -- 16.7 7.7 5.1 -- -- -- 2.7 Madrassa (Qaumi) 0.9 -- 1.3 0.5 -- 0.8 -- -- -- -- -- -- -- -- 0.7
Religion Islam 85.5 100.0 81.3 84.0 88.2 95.2 65.0 -- 83.3 84.6 81.4 -- -- -- 85.5 Hindu 9.7 -- 10.0 13.4 -- 4.0 30.0 -- 16.7 7.7 13.6 -- -- -- 10.3 Buddhist 4.8 -- 8.8 2.6 11.8 0.8 5.0 -- -- 7.7 5.1 -- -- -- 4.2
Wealth quintiles
Poorest 18.5 -- 38.8 23.2 47.1 46.4 10.0 -- 33.3 15.4 16.9 -- -- -- 26.8 Second 30.4 75.0 18.8 30.9 11.8 24.8 20.0 -- -- 30.8 20.3 -- -- -- 26.8 Middle 26.4 25.0 8.8 12.9 17.6 14.4 10.0 -- 33.3 15.4 23.7 -- -- -- 18.0 Fourth 14.5 -- 22.5 14.9 5.9 8.0 30.0 -- -- 15.4 20.3 -- -- -- 14.9 Richest 10.1 -- 11.3 18.0 17.6 6.4 30.0 -- 33.3 23.1 18.6 -- -- -- 13.4 N 227 4 80 194 17 125 20 -- 6 13 59 -- -- -- 745
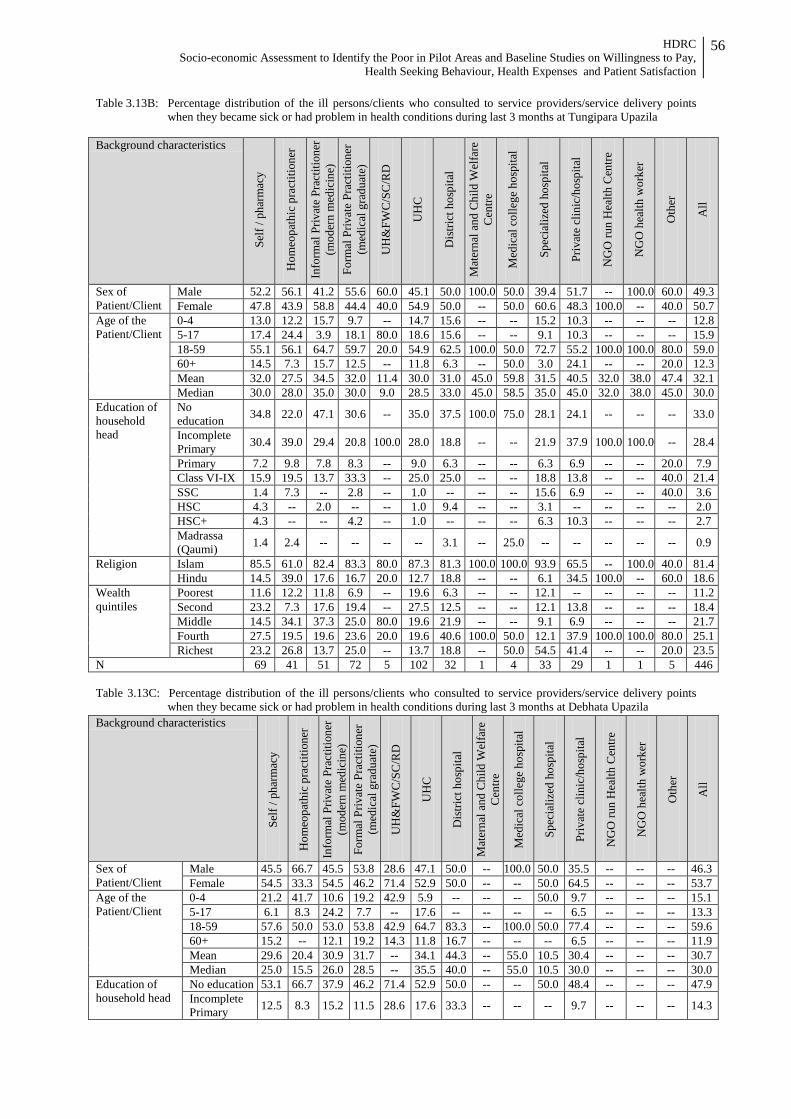
HDRC Socio-economic Assessment to Identify the Poor in Pilot Areas and Baseline Studies on Willingness to Pay,
Health Seeking Behaviour, Health Expenses and Patient Satisfaction
56
Table 3.13B: Percentage distribution of the ill persons/clients who consulted to service providers/service delivery points when they became sick or had problem in health conditions during last 3 months at Tungipara Upazila
Background characteristics
Self
/ pha
rmac
y
Hom
eopa
thic
pra
ctiti
oner
Info
rmal
Priv
ate
Prac
titio
ner
(mod
ern
med
icin
e)
Form
al P
rivat
e Pr
actit
ione
r (m
edic
al g
radu
ate)
UH
&FW
C/S
C/R
D
UH
C
Dis
trict
hos
pita
l
Mat
erna
l and
Chi
ld W
elfa
re
Cen
tre
Med
ical
col
lege
hos
pita
l
Spec
ializ
ed h
ospi
tal
Priv
ate
clin
ic/h
ospi
tal
NG
O ru
n H
ealth
Cen
tre
NG
O h
ealth
wor
ker
Oth
er
All
Sex of Patient/Client
Male 52.2 56.1 41.2 55.6 60.0 45.1 50.0 100.0 50.0 39.4 51.7 -- 100.0 60.0 49.3 Female 47.8 43.9 58.8 44.4 40.0 54.9 50.0 -- 50.0 60.6 48.3 100.0 -- 40.0 50.7
Age of the Patient/Client
0-4 13.0 12.2 15.7 9.7 -- 14.7 15.6 -- -- 15.2 10.3 -- -- -- 12.8 5-17 17.4 24.4 3.9 18.1 80.0 18.6 15.6 -- -- 9.1 10.3 -- -- -- 15.9 18-59 55.1 56.1 64.7 59.7 20.0 54.9 62.5 100.0 50.0 72.7 55.2 100.0 100.0 80.0 59.0 60+ 14.5 7.3 15.7 12.5 -- 11.8 6.3 -- 50.0 3.0 24.1 -- -- 20.0 12.3 Mean 32.0 27.5 34.5 32.0 11.4 30.0 31.0 45.0 59.8 31.5 40.5 32.0 38.0 47.4 32.1 Median 30.0 28.0 35.0 30.0 9.0 28.5 33.0 45.0 58.5 35.0 45.0 32.0 38.0 45.0 30.0
Education of household head
No education 34.8 22.0 47.1 30.6 -- 35.0 37.5 100.0 75.0 28.1 24.1 -- -- -- 33.0
Incomplete Primary 30.4 39.0 29.4 20.8 100.0 28.0 18.8 -- -- 21.9 37.9 100.0 100.0 -- 28.4
Primary 7.2 9.8 7.8 8.3 -- 9.0 6.3 -- -- 6.3 6.9 -- -- 20.0 7.9 Class VI-IX 15.9 19.5 13.7 33.3 -- 25.0 25.0 -- -- 18.8 13.8 -- -- 40.0 21.4 SSC 1.4 7.3 -- 2.8 -- 1.0 -- -- -- 15.6 6.9 -- -- 40.0 3.6 HSC 4.3 -- 2.0 -- -- 1.0 9.4 -- -- 3.1 -- -- -- -- 2.0 HSC+ 4.3 -- -- 4.2 -- 1.0 -- -- -- 6.3 10.3 -- -- -- 2.7 Madrassa (Qaumi) 1.4 2.4 -- -- -- -- 3.1 -- 25.0 -- -- -- -- -- 0.9
Religion Islam 85.5 61.0 82.4 83.3 80.0 87.3 81.3 100.0 100.0 93.9 65.5 -- 100.0 40.0 81.4 Hindu 14.5 39.0 17.6 16.7 20.0 12.7 18.8 -- -- 6.1 34.5 100.0 -- 60.0 18.6
Wealth quintiles
Poorest 11.6 12.2 11.8 6.9 -- 19.6 6.3 -- -- 12.1 -- -- -- -- 11.2 Second 23.2 7.3 17.6 19.4 -- 27.5 12.5 -- -- 12.1 13.8 -- -- -- 18.4 Middle 14.5 34.1 37.3 25.0 80.0 19.6 21.9 -- -- 9.1 6.9 -- -- -- 21.7 Fourth 27.5 19.5 19.6 23.6 20.0 19.6 40.6 100.0 50.0 12.1 37.9 100.0 100.0 80.0 25.1 Richest 23.2 26.8 13.7 25.0 -- 13.7 18.8 -- 50.0 54.5 41.4 -- -- 20.0 23.5
N 69 41 51 72 5 102 32 1 4 33 29 1 1 5 446 Table 3.13C: Percentage distribution of the ill persons/clients who consulted to service providers/service delivery points
when they became sick or had problem in health conditions during last 3 months at Debhata Upazila
Background characteristics
Self
/ pha
rmac
y
Hom
eopa
thic
pra
ctiti
oner
Info
rmal
Priv
ate
Prac
titio
ner
(mod
ern
med
icin
e)
Form
al P
rivat
e Pr
actit
ione
r (m
edic
al g
radu
ate)
UH
&FW
C/S
C/R
D
UH
C
Dis
trict
hos
pita
l
Mat
erna
l and
Chi
ld W
elfa
re
Cen
tre
Med
ical
col
lege
hos
pita
l
Spec
ializ
ed h
ospi
tal
Priv
ate
clin
ic/h
ospi
tal
NG
O ru
n H
ealth
Cen
tre
NG
O h
ealth
wor
ker
Oth
er
All
Sex of Patient/Client
Male 45.5 66.7 45.5 53.8 28.6 47.1 50.0 -- 100.0 50.0 35.5 -- -- -- 46.3 Female 54.5 33.3 54.5 46.2 71.4 52.9 50.0 -- -- 50.0 64.5 -- -- -- 53.7
Age of the Patient/Client
0-4 21.2 41.7 10.6 19.2 42.9 5.9 -- -- -- 50.0 9.7 -- -- -- 15.1 5-17 6.1 8.3 24.2 7.7 -- 17.6 -- -- -- -- 6.5 -- -- -- 13.3 18-59 57.6 50.0 53.0 53.8 42.9 64.7 83.3 -- 100.0 50.0 77.4 -- -- -- 59.6 60+ 15.2 -- 12.1 19.2 14.3 11.8 16.7 -- -- -- 6.5 -- -- -- 11.9 Mean 29.6 20.4 30.9 31.7 -- 34.1 44.3 -- 55.0 10.5 30.4 -- -- -- 30.7 Median 25.0 15.5 26.0 28.5 -- 35.5 40.0 -- 55.0 10.5 30.0 -- -- -- 30.0
Education of household head
No education 53.1 66.7 37.9 46.2 71.4 52.9 50.0 -- -- 50.0 48.4 -- -- -- 47.9 Incomplete Primary 12.5 8.3 15.2 11.5 28.6 17.6 33.3 -- -- -- 9.7 -- -- -- 14.3

HDRC Socio-economic Assessment to Identify the Poor in Pilot Areas and Baseline Studies on Willingness to Pay,
Health Seeking Behaviour, Health Expenses and Patient Satisfaction
57
Background characteristics
Self
/ pha
rmac
y
Hom
eopa
thic
pra
ctiti
oner
Info
rmal
Priv
ate
Prac
titio
ner
(mod
ern
med
icin
e)
Form
al P
rivat
e Pr
actit
ione
r (m
edic
al g
radu
ate)
UH
&FW
C/S
C/R
D
UH
C
Dis
trict
hos
pita
l
Mat
erna
l and
Chi
ld W
elfa
re
Cen
tre
Med
ical
col
lege
hos
pita
l
Spec
ializ
ed h
ospi
tal
Priv
ate
clin
ic/h
ospi
tal
NG
O ru
n H
ealth
Cen
tre
NG
O h
ealth
wor
ker
Oth
er
All
Primary 21.9 8.3 15.2 23.1 -- 8.8 -- -- -- -- 6.5 -- -- -- 13.4 Class VI-IX 9.4 16.7 28.8 7.7 -- 20.6 16.7 -- -- 50.0 35.5 -- -- -- 21.2 SSC -- -- 3.0 3.8 -- -- -- -- 100.0 -- -- -- -- -- 1.8 HSC -- -- -- 7.7 -- -- -- -- -- -- -- -- -- -- 0.9 Madrassa (Qaumi) 3.1 -- -- -- -- -- -- -- -- -- -- -- -- -- 0.5
Religion Islam 97.0 83.3 80.3 61.5 100.0 91.2 100.0 -- -- 100.0 87.1 -- -- -- 84.4 Hindu 3.0 16.7 19.7 38.5 -- 8.8 -- -- 100.0 -- 12.9 -- -- -- 15.6
Wealth quintiles Poorest 51.5 16.7 21.2 19.2 -- 14.7 -- -- -- -- 12.9 -- -- -- 22.0 Second 3.0 -- 3.0 3.8 -- 26.5 -- -- -- -- 12.9 -- -- -- 7.8 Middle 15.2 8.3 12.1 -- -- 11.8 16.7 -- -- -- 9.7 -- -- -- 11.5 Fourth 15.2 50.0 37.9 23.1 -- 17.6 16.7 -- -- -- 25.8 -- -- -- 27.5 Richest 15.2 25.0 25.8 53.8 -- 29.4 66.7 -- 100.0 100.0 38.7 -- -- -- 31.2
N 33 12 66 26 7 34 6 -- 1 2 31 -- -- -- 218 Table 3.14: Percentage distribution of the respondents asking about whether some one accompanied with the patient or not
by Upazila
Background characteristics Upazila
Rangunia Tungipara Debhata All % # % # % # % #
Sex of Patients Male 46.8 279 47.1 165 40.0 64 49.2 693 Female 53.2 317 52.9 185 60.0 96 50.8 716
Age 0-4 17.6 105 15.7 55 18.1 29 14.0 197 5-17 27.7 165 19.4 68 13.8 22 19.6 276 18-59 46.3 276 53.7 188 57.5 92 55.4 781 60+ 8.4 50 11.1 39 10.6 17 11.0 155 Mean 25.9 596 29.7 350 28.3 160 27.4 1106 Median 20.0 596 28.0 350 26.0 160 25.0 1106
Education of household head
No education 41.4 247 32.0 111 50.3 80 39.9 561 Incomplete Primary 24.3 145 28.5 99 11.9 19 23.9 336 Primary 9.1 54 8.1 28 14.5 23 9.5 133 Class VI-IX 15.4 92 20.7 72 22.6 36 18.3 257 SSC 5.0 30 4.0 14 0.6 1 3.8 53 HSC 1.3 8 2.3 8 -- -- 1.6 23 HSC+ 2.5 15 3.2 11 -- -- 2.3 32 Madrassa (Qaumi) 0.8 5 1.2 4 -- -- 0.7 10
Religion
Islam 85.1 507 82.0 287 85.6 137 84.0 1184 Hindu 11.4 68 18.0 63 14.4 23 13.8 194 Christian -- -- -- -- -- -- -- -- Buddhist 3.5 21 -- -- -- -- 2.2 31 Others -- -- -- -- -- -- -- --
Wealth quintiles
Poorest 26.7 159 10.9 38 22.5 36 21.1 298 Second 27.5 164 17.1 60 8.1 13 21.2 299 Middle 17.3 103 21.4 75 10.6 17 18.2 256 Fourth 14.9 89 27.4 96 25.0 40 20.1 283 Richest 13.6 81 23.1 81 33.8 54 19.4 273
Total 100.0 596 100.0 350 100.0 160 100.0 1409
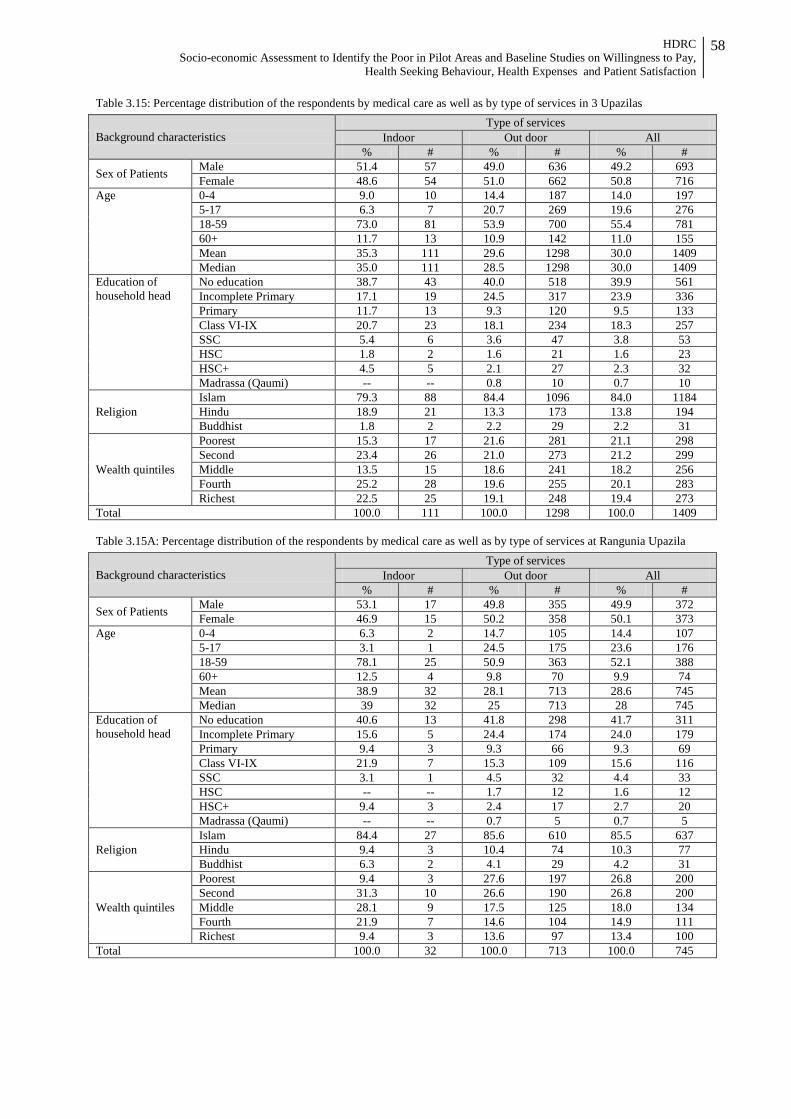
HDRC Socio-economic Assessment to Identify the Poor in Pilot Areas and Baseline Studies on Willingness to Pay,
Health Seeking Behaviour, Health Expenses and Patient Satisfaction
58
Table 3.15: Percentage distribution of the respondents by medical care as well as by type of services in 3 Upazilas
Background characteristics Type of services
Indoor Out door All % # % # % #
Sex of Patients Male 51.4 57 49.0 636 49.2 693 Female 48.6 54 51.0 662 50.8 716
Age 0-4 9.0 10 14.4 187 14.0 197 5-17 6.3 7 20.7 269 19.6 276 18-59 73.0 81 53.9 700 55.4 781 60+ 11.7 13 10.9 142 11.0 155 Mean 35.3 111 29.6 1298 30.0 1409 Median 35.0 111 28.5 1298 30.0 1409
Education of household head
No education 38.7 43 40.0 518 39.9 561 Incomplete Primary 17.1 19 24.5 317 23.9 336 Primary 11.7 13 9.3 120 9.5 133 Class VI-IX 20.7 23 18.1 234 18.3 257 SSC 5.4 6 3.6 47 3.8 53 HSC 1.8 2 1.6 21 1.6 23 HSC+ 4.5 5 2.1 27 2.3 32 Madrassa (Qaumi) -- -- 0.8 10 0.7 10
Religion Islam 79.3 88 84.4 1096 84.0 1184 Hindu 18.9 21 13.3 173 13.8 194 Buddhist 1.8 2 2.2 29 2.2 31
Wealth quintiles
Poorest 15.3 17 21.6 281 21.1 298 Second 23.4 26 21.0 273 21.2 299 Middle 13.5 15 18.6 241 18.2 256 Fourth 25.2 28 19.6 255 20.1 283 Richest 22.5 25 19.1 248 19.4 273
Total 100.0 111 100.0 1298 100.0 1409 Table 3.15A: Percentage distribution of the respondents by medical care as well as by type of services at Rangunia Upazila
Background characteristics Type of services
Indoor Out door All % # % # % #
Sex of Patients Male 53.1 17 49.8 355 49.9 372 Female 46.9 15 50.2 358 50.1 373
Age 0-4 6.3 2 14.7 105 14.4 107 5-17 3.1 1 24.5 175 23.6 176 18-59 78.1 25 50.9 363 52.1 388 60+ 12.5 4 9.8 70 9.9 74 Mean 38.9 32 28.1 713 28.6 745 Median 39 32 25 713 28 745
Education of household head
No education 40.6 13 41.8 298 41.7 311 Incomplete Primary 15.6 5 24.4 174 24.0 179 Primary 9.4 3 9.3 66 9.3 69 Class VI-IX 21.9 7 15.3 109 15.6 116 SSC 3.1 1 4.5 32 4.4 33 HSC -- -- 1.7 12 1.6 12 HSC+ 9.4 3 2.4 17 2.7 20 Madrassa (Qaumi) -- -- 0.7 5 0.7 5
Religion Islam 84.4 27 85.6 610 85.5 637 Hindu 9.4 3 10.4 74 10.3 77 Buddhist 6.3 2 4.1 29 4.2 31
Wealth quintiles
Poorest 9.4 3 27.6 197 26.8 200 Second 31.3 10 26.6 190 26.8 200 Middle 28.1 9 17.5 125 18.0 134 Fourth 21.9 7 14.6 104 14.9 111 Richest 9.4 3 13.6 97 13.4 100
Total 100.0 32 100.0 713 100.0 745
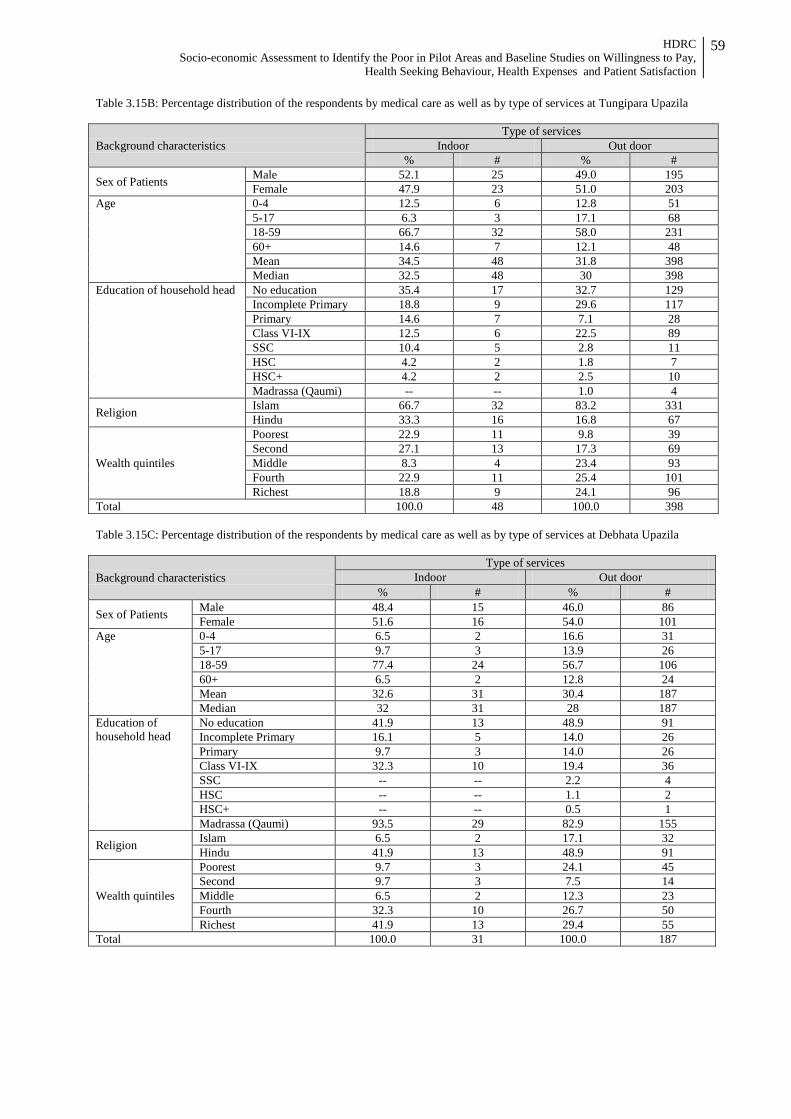
HDRC Socio-economic Assessment to Identify the Poor in Pilot Areas and Baseline Studies on Willingness to Pay,
Health Seeking Behaviour, Health Expenses and Patient Satisfaction
59
Table 3.15B: Percentage distribution of the respondents by medical care as well as by type of services at Tungipara Upazila
Background characteristics Type of services
Indoor Out door % # % #
Sex of Patients Male 52.1 25 49.0 195 Female 47.9 23 51.0 203
Age 0-4 12.5 6 12.8 51 5-17 6.3 3 17.1 68 18-59 66.7 32 58.0 231 60+ 14.6 7 12.1 48 Mean 34.5 48 31.8 398 Median 32.5 48 30 398
Education of household head No education 35.4 17 32.7 129 Incomplete Primary 18.8 9 29.6 117 Primary 14.6 7 7.1 28 Class VI-IX 12.5 6 22.5 89 SSC 10.4 5 2.8 11 HSC 4.2 2 1.8 7 HSC+ 4.2 2 2.5 10 Madrassa (Qaumi) -- -- 1.0 4
Religion Islam 66.7 32 83.2 331 Hindu 33.3 16 16.8 67
Wealth quintiles
Poorest 22.9 11 9.8 39 Second 27.1 13 17.3 69 Middle 8.3 4 23.4 93 Fourth 22.9 11 25.4 101 Richest 18.8 9 24.1 96
Total 100.0 48 100.0 398 Table 3.15C: Percentage distribution of the respondents by medical care as well as by type of services at Debhata Upazila
Background characteristics Type of services
Indoor Out door % # % #
Sex of Patients Male 48.4 15 46.0 86 Female 51.6 16 54.0 101
Age 0-4 6.5 2 16.6 31 5-17 9.7 3 13.9 26 18-59 77.4 24 56.7 106 60+ 6.5 2 12.8 24 Mean 32.6 31 30.4 187 Median 32 31 28 187
Education of household head
No education 41.9 13 48.9 91 Incomplete Primary 16.1 5 14.0 26 Primary 9.7 3 14.0 26 Class VI-IX 32.3 10 19.4 36 SSC -- -- 2.2 4 HSC -- -- 1.1 2 HSC+ -- -- 0.5 1 Madrassa (Qaumi) 93.5 29 82.9 155
Religion Islam 6.5 2 17.1 32 Hindu 41.9 13 48.9 91
Wealth quintiles
Poorest 9.7 3 24.1 45 Second 9.7 3 7.5 14 Middle 6.5 2 12.3 23 Fourth 32.3 10 26.7 50 Richest 41.9 13 29.4 55
Total 100.0 31 100.0 187
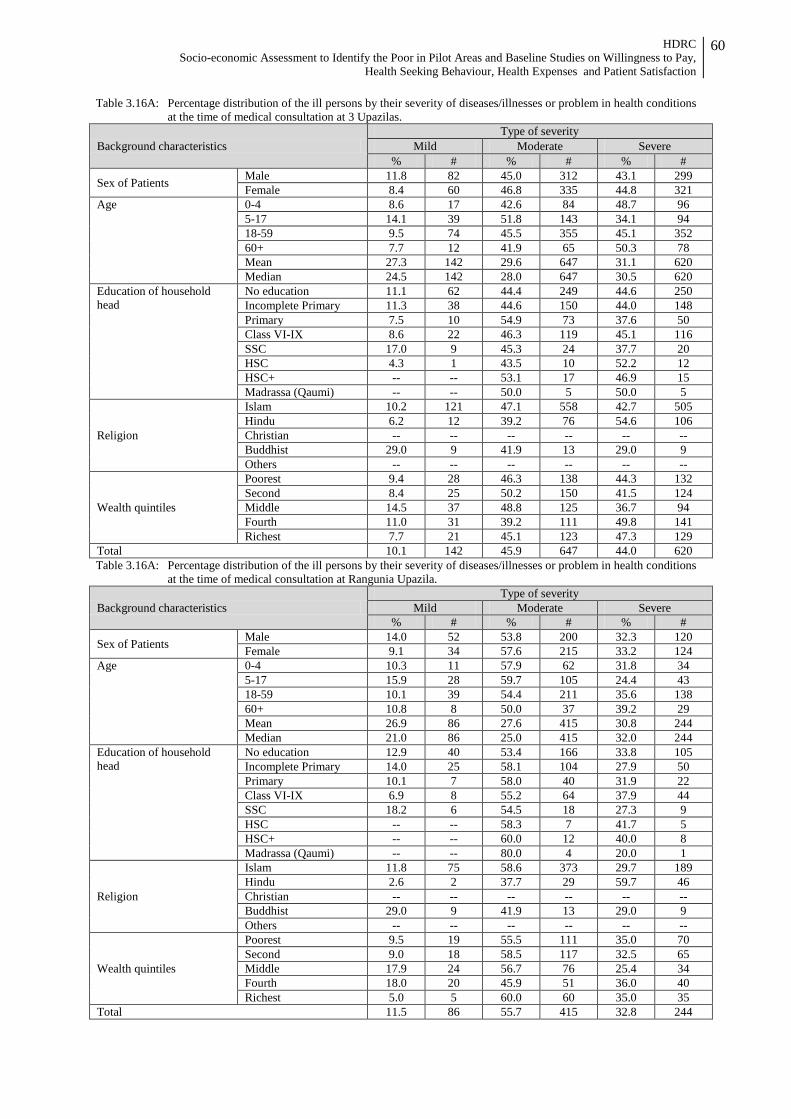
HDRC Socio-economic Assessment to Identify the Poor in Pilot Areas and Baseline Studies on Willingness to Pay,
Health Seeking Behaviour, Health Expenses and Patient Satisfaction
60
Table 3.16A: Percentage distribution of the ill persons by their severity of diseases/illnesses or problem in health conditions at the time of medical consultation at 3 Upazilas.
Background characteristics Type of severity
Mild Moderate Severe % # % # % #
Sex of Patients Male 11.8 82 45.0 312 43.1 299 Female 8.4 60 46.8 335 44.8 321
Age 0-4 8.6 17 42.6 84 48.7 96 5-17 14.1 39 51.8 143 34.1 94 18-59 9.5 74 45.5 355 45.1 352 60+ 7.7 12 41.9 65 50.3 78 Mean 27.3 142 29.6 647 31.1 620 Median 24.5 142 28.0 647 30.5 620
Education of household head
No education 11.1 62 44.4 249 44.6 250 Incomplete Primary 11.3 38 44.6 150 44.0 148 Primary 7.5 10 54.9 73 37.6 50 Class VI-IX 8.6 22 46.3 119 45.1 116 SSC 17.0 9 45.3 24 37.7 20 HSC 4.3 1 43.5 10 52.2 12 HSC+ -- -- 53.1 17 46.9 15 Madrassa (Qaumi) -- -- 50.0 5 50.0 5
Religion
Islam 10.2 121 47.1 558 42.7 505 Hindu 6.2 12 39.2 76 54.6 106 Christian -- -- -- -- -- -- Buddhist 29.0 9 41.9 13 29.0 9 Others -- -- -- -- -- --
Wealth quintiles
Poorest 9.4 28 46.3 138 44.3 132 Second 8.4 25 50.2 150 41.5 124 Middle 14.5 37 48.8 125 36.7 94 Fourth 11.0 31 39.2 111 49.8 141 Richest 7.7 21 45.1 123 47.3 129
Total 10.1 142 45.9 647 44.0 620 Table 3.16A: Percentage distribution of the ill persons by their severity of diseases/illnesses or problem in health conditions
at the time of medical consultation at Rangunia Upazila.
Background characteristics Type of severity
Mild Moderate Severe % # % # % #
Sex of Patients Male 14.0 52 53.8 200 32.3 120 Female 9.1 34 57.6 215 33.2 124
Age 0-4 10.3 11 57.9 62 31.8 34 5-17 15.9 28 59.7 105 24.4 43 18-59 10.1 39 54.4 211 35.6 138 60+ 10.8 8 50.0 37 39.2 29 Mean 26.9 86 27.6 415 30.8 244 Median 21.0 86 25.0 415 32.0 244
Education of household head
No education 12.9 40 53.4 166 33.8 105 Incomplete Primary 14.0 25 58.1 104 27.9 50 Primary 10.1 7 58.0 40 31.9 22 Class VI-IX 6.9 8 55.2 64 37.9 44 SSC 18.2 6 54.5 18 27.3 9 HSC -- -- 58.3 7 41.7 5 HSC+ -- -- 60.0 12 40.0 8 Madrassa (Qaumi) -- -- 80.0 4 20.0 1
Religion
Islam 11.8 75 58.6 373 29.7 189 Hindu 2.6 2 37.7 29 59.7 46 Christian -- -- -- -- -- -- Buddhist 29.0 9 41.9 13 29.0 9 Others -- -- -- -- -- --
Wealth quintiles
Poorest 9.5 19 55.5 111 35.0 70 Second 9.0 18 58.5 117 32.5 65 Middle 17.9 24 56.7 76 25.4 34 Fourth 18.0 20 45.9 51 36.0 40 Richest 5.0 5 60.0 60 35.0 35
Total 11.5 86 55.7 415 32.8 244

HDRC Socio-economic Assessment to Identify the Poor in Pilot Areas and Baseline Studies on Willingness to Pay,
Health Seeking Behaviour, Health Expenses and Patient Satisfaction
61
Table 3.16B: Percentage distribution of the ill persons by their severity of diseases/illnesses or problem in health conditions at the time of medical consultation at Tungipara Upazila
Background characteristics Type of severity
Mild Moderate Severe % # % # % #
Sex of Patients Male 7.3 16 29.1 64 63.6 140 Female 7.1 16 28.8 65 64.2 145
Age 0-4 5.3 3 17.5 10 77.2 44 5-17 5.6 4 36.6 26 57.7 41 18-59 8.7 23 30.4 80 60.8 160 60+ 3.6 2 23.6 13 72.7 40 Mean 30.1 32 32.8 129 32.0 285 Median 29.0 32 32.0 129 30.0 285
Education of household head
No education 9.6 14 26.0 38 64.4 94 Incomplete Primary 4.8 6 26.2 33 69.0 87 Primary 2.9 1 40.0 14 57.1 20 Class VI-IX 9.5 9 34.7 33 55.8 53 SSC 6.3 1 25.0 4 68.8 11 HSC 11.1 1 22.2 2 66.7 6 HSC+ -- -- 41.7 5 58.3 7 Madrassa (Qaumi) -- -- -- -- 100.0 4
Religion Islam 7.2 26 28.7 104 64.2 233 Hindu 7.2 6 30.1 25 62.7 52
Wealth quintiles
Poorest 10.0 5 18.0 9 72.0 36 Second 7.3 6 34.1 28 58.5 48 Middle 13.4 13 32.0 31 54.6 53 Fourth 3.6 4 25.9 29 70.5 79 Richest 3.8 4 30.5 32 65.7 69
Total 7.2 32 28.9 129 63.9 285 Table 3.16C: Percentage distribution of the ill persons by their severity of diseases/illnesses or problem in health conditions
at the time of medical consultation at Debhata Upazila
Background characteristics Type of severity
Mild Moderate Severe % # % # % #
Sex of Patients Male 13.9 14 47.5 48 38.6 39 Female 8.5 10 47.0 55 44.4 52
Age 0-4 9.1 3 36.4 12 54.5 18 5-17 24.1 7 41.4 12 34.5 10 18-59 9.2 12 49.2 64 41.5 54 60+ 7.7 2 57.7 15 34.6 9 Mean 25.2 24 33.4 103 29.2 91 Median 21.5 24 30.0 103 30.0 91
Education of household head
No education 7.7 8 43.3 45 49.0 51 Incomplete Primary 22.6 7 41.9 13 35.5 11 Primary 6.9 2 65.5 19 27.6 8 Class VI-IX 10.9 5 47.8 22 41.3 19 SSC 50.0 2 50.0 2 -- -- HSC -- -- 50.0 1 50.0 1 Madrassa (Qaumi) -- -- 100.0 1 -- --
Religion Islam 10.9 20 44.0 81 45.1 83 Hindu 11.8 4 64.7 22 23.5 8
Wealth quintiles
Poorest 8.3 4 37.5 18 54.2 26 Second 5.9 1 29.4 5 64.7 11 Middle -- -- 72.0 18 28.0 7 Fourth 11.7 7 51.7 31 36.7 22 Richest 17.6 12 45.6 31 36.8 25
Total 11.0 24 47.2 103 41.7 91

HDRC Socio-economic Assessment to Identify the Poor in Pilot Areas and Baseline Studies on Willingness to Pay,
Health Seeking Behaviour, Health Expenses and Patient Satisfaction
62
Table 3.17: Percentage distribution of the households having equal preference of health care irrespective of age of the household members at 3 Upazilas
Background characteristics Rangunia Tungipara Debhata All % # % # % # % #
Education of household head
No education 41.7 145 25.9 67 51.7 74 38.1 286 Incomplete Primary 17.5 61 27.8 72 16.1 23 20.8 156
Primary 7.2 25 10.4 27 9.1 13 8.7 65 Class VI-IX 17.2 60 21.2 55 17.5 25 18.7 140 SSC 7.2 25 7.7 20 3.5 5 6.7 50 HSC 3.4 12 2.3 6 1.4 2 2.7 20 HSC+ 5.5 19 3.5 9 0.7 1 3.9 29 Madrasa (Quomi) -- -- 1.2 3 -- -- 0.5 4
Religion Islam 85.3 297 78.8 204 86.0 123 83.2 624 Hindu 10.3 36 21.2 55 14.0 20 14.8 111 Buddhist 4.3 15 -- -- -- -- 2.0 15
Wealth quintiles
Poorest 24.7 86 10.4 27 20.3 29 18.9 142 Second 26.7 93 20.8 54 9.1 13 21.3 160 Middle 20.1 70 24.3 63 14.7 21 20.5 154 Fourth 15.2 53 22.0 57 25.9 37 19.6 147 Richest 13.2 46 22.4 58 30.1 43 19.6 147
Total 100 348 100 259 100 143 100.0 750 Table 3.18: Percentage distribution of the households having age-specific preference of health care in case of illness of
the household members at Rangunia Upazila
Background characteristics
Age Rangunia Tungipara Debhata
Child Adult Old Child Adult Old Child Adult Old % % % % % % % % %
Education of household head
No education 29.5 -- -- 30.8 -- -- 35.1 -- -- Incomplete Primary 22.7 -- -- 46.2 -- -- 16.2 -- -- Primary 13.6 -- -- 7.7 -- -- 8.1 -- -- Class VI-IX 18.2 -- -- 7.7 -- -- 29.7 -- -- SSC 6.8 -- -- -- -- -- 5.4 -- -- HSC 4.5 -- -- -- -- -- 5.4 -- -- HSC+ 4.5 -- -- -- -- -- -- -- -- Madrassa (Qaumi) -- -- 7.7 -- -- -- -- --
Religion
Islam 93.2 -- -- 69.2 -- -- 86.5 -- -- Hindu 6.8 -- -- 30.8 -- -- 13.5 -- -- Christian -- -- -- -- -- -- -- -- -- Buddhist -- -- -- -- -- -- -- -- -- Others -- -- -- -- -- -- -- -- --
Wealth quintiles
Poorest 31.8 -- -- 23.1 -- -- 24.3 -- -- Second 15.9 -- -- 15.4 -- -- 5.4 -- -- Middle 15.9 -- -- 30.8 -- -- 18.9 -- -- Fourth 15.9 -- -- 15.4 -- -- 21.6 -- -- Richest 20.5 -- -- 15.4 -- -- 29.7 -- --
Total 44 -- -- 13 -- -- -- -- --
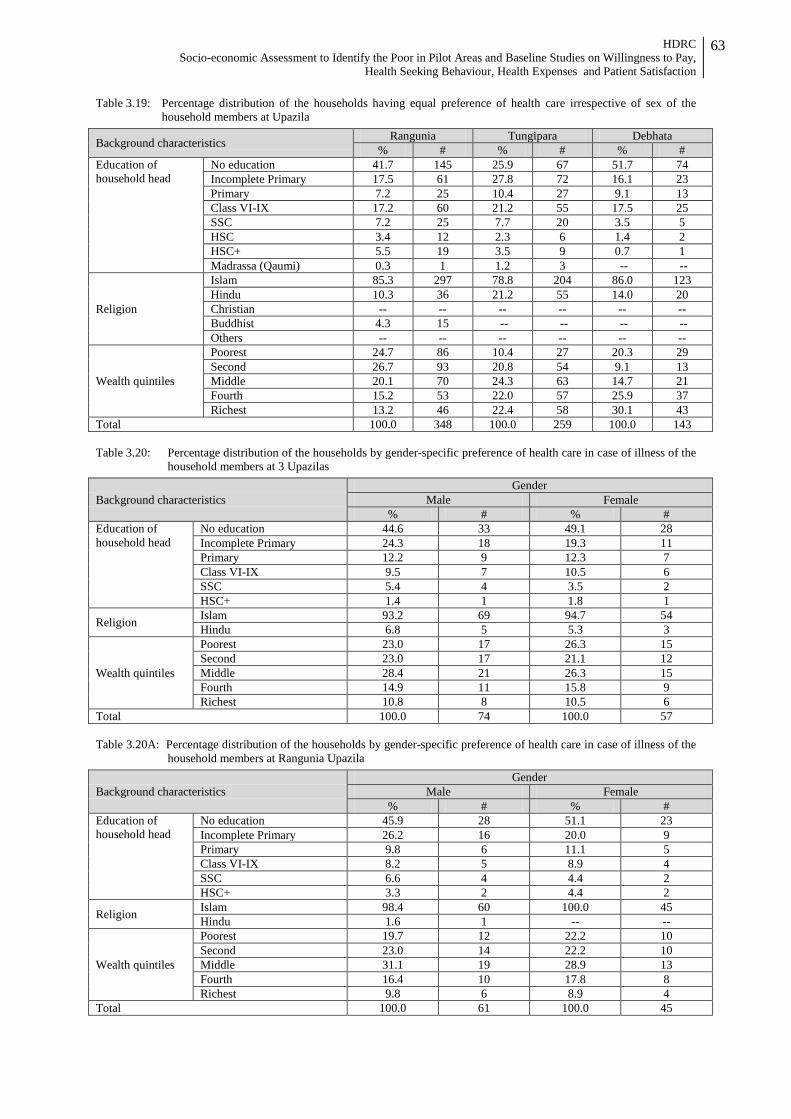
HDRC Socio-economic Assessment to Identify the Poor in Pilot Areas and Baseline Studies on Willingness to Pay,
Health Seeking Behaviour, Health Expenses and Patient Satisfaction
63
Table 3.19: Percentage distribution of the households having equal preference of health care irrespective of sex of the household members at Upazila
Background characteristics Rangunia Tungipara Debhata % # % # % #
Education of household head
No education 41.7 145 25.9 67 51.7 74 Incomplete Primary 17.5 61 27.8 72 16.1 23 Primary 7.2 25 10.4 27 9.1 13 Class VI-IX 17.2 60 21.2 55 17.5 25 SSC 7.2 25 7.7 20 3.5 5 HSC 3.4 12 2.3 6 1.4 2 HSC+ 5.5 19 3.5 9 0.7 1 Madrassa (Qaumi) 0.3 1 1.2 3 -- --
Religion
Islam 85.3 297 78.8 204 86.0 123 Hindu 10.3 36 21.2 55 14.0 20 Christian -- -- -- -- -- -- Buddhist 4.3 15 -- -- -- -- Others -- -- -- -- -- --
Wealth quintiles
Poorest 24.7 86 10.4 27 20.3 29 Second 26.7 93 20.8 54 9.1 13 Middle 20.1 70 24.3 63 14.7 21 Fourth 15.2 53 22.0 57 25.9 37 Richest 13.2 46 22.4 58 30.1 43
Total 100.0 348 100.0 259 100.0 143 Table 3.20: Percentage distribution of the households by gender-specific preference of health care in case of illness of the
household members at 3 Upazilas
Background characteristics Gender
Male Female % # % #
Education of household head
No education 44.6 33 49.1 28 Incomplete Primary 24.3 18 19.3 11 Primary 12.2 9 12.3 7 Class VI-IX 9.5 7 10.5 6 SSC 5.4 4 3.5 2 HSC+ 1.4 1 1.8 1
Religion Islam 93.2 69 94.7 54 Hindu 6.8 5 5.3 3
Wealth quintiles
Poorest 23.0 17 26.3 15 Second 23.0 17 21.1 12 Middle 28.4 21 26.3 15 Fourth 14.9 11 15.8 9 Richest 10.8 8 10.5 6
Total 100.0 74 100.0 57 Table 3.20A: Percentage distribution of the households by gender-specific preference of health care in case of illness of the
household members at Rangunia Upazila
Background characteristics Gender
Male Female % # % #
Education of household head
No education 45.9 28 51.1 23 Incomplete Primary 26.2 16 20.0 9 Primary 9.8 6 11.1 5 Class VI-IX 8.2 5 8.9 4 SSC 6.6 4 4.4 2 HSC+ 3.3 2 4.4 2
Religion Islam 98.4 60 100.0 45 Hindu 1.6 1 -- --
Wealth quintiles
Poorest 19.7 12 22.2 10 Second 23.0 14 22.2 10 Middle 31.1 19 28.9 13 Fourth 16.4 10 17.8 8 Richest 9.8 6 8.9 4
Total 100.0 61 100.0 45
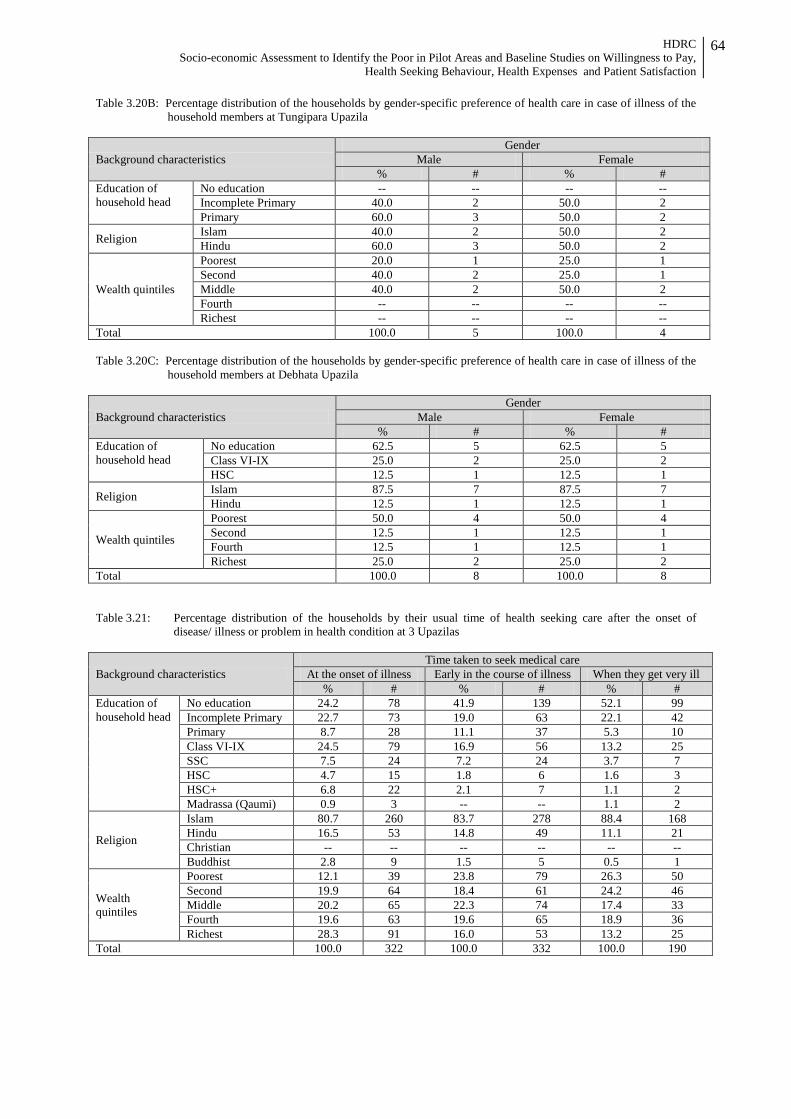
HDRC Socio-economic Assessment to Identify the Poor in Pilot Areas and Baseline Studies on Willingness to Pay,
Health Seeking Behaviour, Health Expenses and Patient Satisfaction
64
Table 3.20B: Percentage distribution of the households by gender-specific preference of health care in case of illness of the household members at Tungipara Upazila
Background characteristics Gender
Male Female % # % #
Education of household head
No education -- -- -- -- Incomplete Primary 40.0 2 50.0 2 Primary 60.0 3 50.0 2
Religion Islam 40.0 2 50.0 2 Hindu 60.0 3 50.0 2
Wealth quintiles
Poorest 20.0 1 25.0 1 Second 40.0 2 25.0 1 Middle 40.0 2 50.0 2 Fourth -- -- -- -- Richest -- -- -- --
Total 100.0 5 100.0 4 Table 3.20C: Percentage distribution of the households by gender-specific preference of health care in case of illness of the
household members at Debhata Upazila
Background characteristics Gender
Male Female % # % #
Education of household head
No education 62.5 5 62.5 5 Class VI-IX 25.0 2 25.0 2 HSC 12.5 1 12.5 1
Religion Islam 87.5 7 87.5 7 Hindu 12.5 1 12.5 1
Wealth quintiles
Poorest 50.0 4 50.0 4 Second 12.5 1 12.5 1 Fourth 12.5 1 12.5 1 Richest 25.0 2 25.0 2
Total 100.0 8 100.0 8 Table 3.21: Percentage distribution of the households by their usual time of health seeking care after the onset of
disease/ illness or problem in health condition at 3 Upazilas
Background characteristics Time taken to seek medical care
At the onset of illness Early in the course of illness When they get very ill % # % # % #
Education of household head
No education 24.2 78 41.9 139 52.1 99 Incomplete Primary 22.7 73 19.0 63 22.1 42 Primary 8.7 28 11.1 37 5.3 10 Class VI-IX 24.5 79 16.9 56 13.2 25 SSC 7.5 24 7.2 24 3.7 7 HSC 4.7 15 1.8 6 1.6 3 HSC+ 6.8 22 2.1 7 1.1 2 Madrassa (Qaumi) 0.9 3 -- -- 1.1 2
Religion
Islam 80.7 260 83.7 278 88.4 168 Hindu 16.5 53 14.8 49 11.1 21 Christian -- -- -- -- -- -- Buddhist 2.8 9 1.5 5 0.5 1
Wealth quintiles
Poorest 12.1 39 23.8 79 26.3 50 Second 19.9 64 18.4 61 24.2 46 Middle 20.2 65 22.3 74 17.4 33 Fourth 19.6 63 19.6 65 18.9 36 Richest 28.3 91 16.0 53 13.2 25
Total 100.0 322 100.0 332 100.0 190
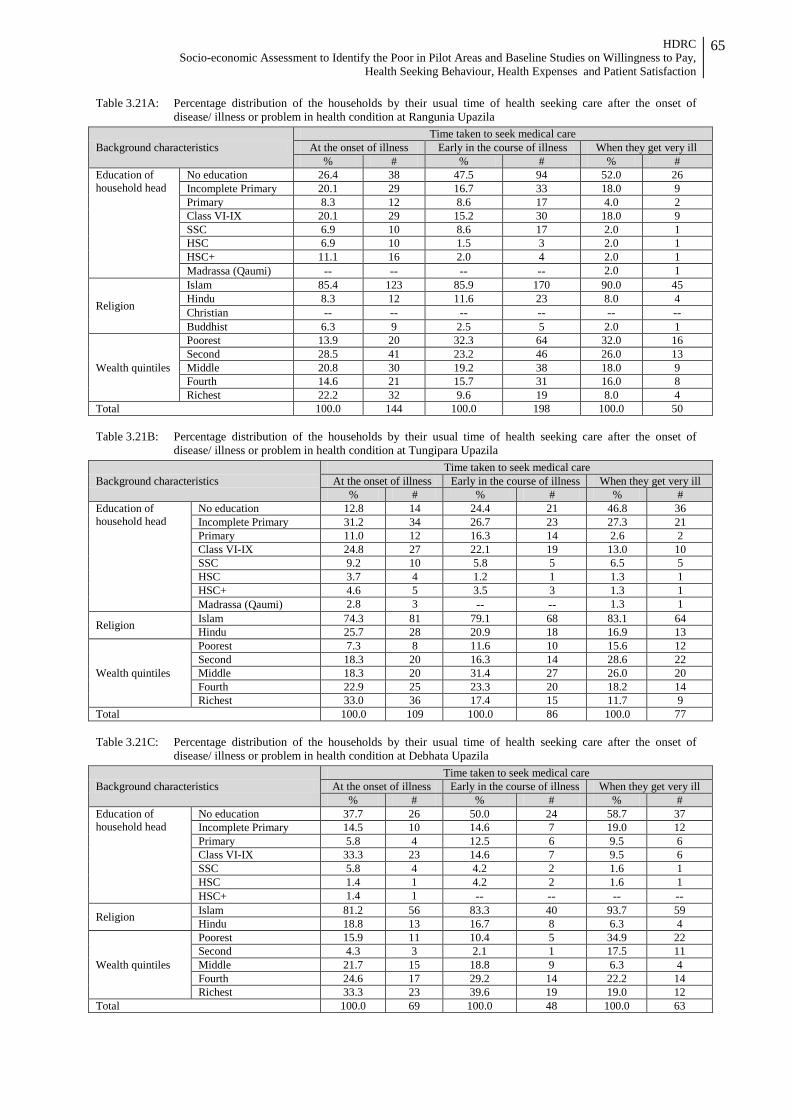
HDRC Socio-economic Assessment to Identify the Poor in Pilot Areas and Baseline Studies on Willingness to Pay,
Health Seeking Behaviour, Health Expenses and Patient Satisfaction
65
Table 3.21A: Percentage distribution of the households by their usual time of health seeking care after the onset of disease/ illness or problem in health condition at Rangunia Upazila
Background characteristics Time taken to seek medical care
At the onset of illness Early in the course of illness When they get very ill % # % # % #
Education of household head
No education 26.4 38 47.5 94 52.0 26 Incomplete Primary 20.1 29 16.7 33 18.0 9 Primary 8.3 12 8.6 17 4.0 2 Class VI-IX 20.1 29 15.2 30 18.0 9 SSC 6.9 10 8.6 17 2.0 1 HSC 6.9 10 1.5 3 2.0 1 HSC+ 11.1 16 2.0 4 2.0 1 Madrassa (Qaumi) -- -- -- -- 2.0 1
Religion
Islam 85.4 123 85.9 170 90.0 45 Hindu 8.3 12 11.6 23 8.0 4 Christian -- -- -- -- -- -- Buddhist 6.3 9 2.5 5 2.0 1
Wealth quintiles
Poorest 13.9 20 32.3 64 32.0 16 Second 28.5 41 23.2 46 26.0 13 Middle 20.8 30 19.2 38 18.0 9 Fourth 14.6 21 15.7 31 16.0 8 Richest 22.2 32 9.6 19 8.0 4
Total 100.0 144 100.0 198 100.0 50 Table 3.21B: Percentage distribution of the households by their usual time of health seeking care after the onset of
disease/ illness or problem in health condition at Tungipara Upazila
Background characteristics Time taken to seek medical care
At the onset of illness Early in the course of illness When they get very ill % # % # % #
Education of household head
No education 12.8 14 24.4 21 46.8 36 Incomplete Primary 31.2 34 26.7 23 27.3 21 Primary 11.0 12 16.3 14 2.6 2 Class VI-IX 24.8 27 22.1 19 13.0 10 SSC 9.2 10 5.8 5 6.5 5 HSC 3.7 4 1.2 1 1.3 1 HSC+ 4.6 5 3.5 3 1.3 1 Madrassa (Qaumi) 2.8 3 -- -- 1.3 1
Religion Islam 74.3 81 79.1 68 83.1 64 Hindu 25.7 28 20.9 18 16.9 13
Wealth quintiles
Poorest 7.3 8 11.6 10 15.6 12 Second 18.3 20 16.3 14 28.6 22 Middle 18.3 20 31.4 27 26.0 20 Fourth 22.9 25 23.3 20 18.2 14 Richest 33.0 36 17.4 15 11.7 9
Total 100.0 109 100.0 86 100.0 77 Table 3.21C: Percentage distribution of the households by their usual time of health seeking care after the onset of
disease/ illness or problem in health condition at Debhata Upazila
Background characteristics Time taken to seek medical care
At the onset of illness Early in the course of illness When they get very ill % # % # % #
Education of household head
No education 37.7 26 50.0 24 58.7 37 Incomplete Primary 14.5 10 14.6 7 19.0 12 Primary 5.8 4 12.5 6 9.5 6 Class VI-IX 33.3 23 14.6 7 9.5 6 SSC 5.8 4 4.2 2 1.6 1 HSC 1.4 1 4.2 2 1.6 1 HSC+ 1.4 1 -- -- -- --
Religion Islam 81.2 56 83.3 40 93.7 59 Hindu 18.8 13 16.7 8 6.3 4
Wealth quintiles
Poorest 15.9 11 10.4 5 34.9 22 Second 4.3 3 2.1 1 17.5 11 Middle 21.7 15 18.8 9 6.3 4 Fourth 24.6 17 29.2 14 22.2 14 Richest 33.3 23 39.6 19 19.0 12
Total 100.0 69 100.0 48 100.0 63
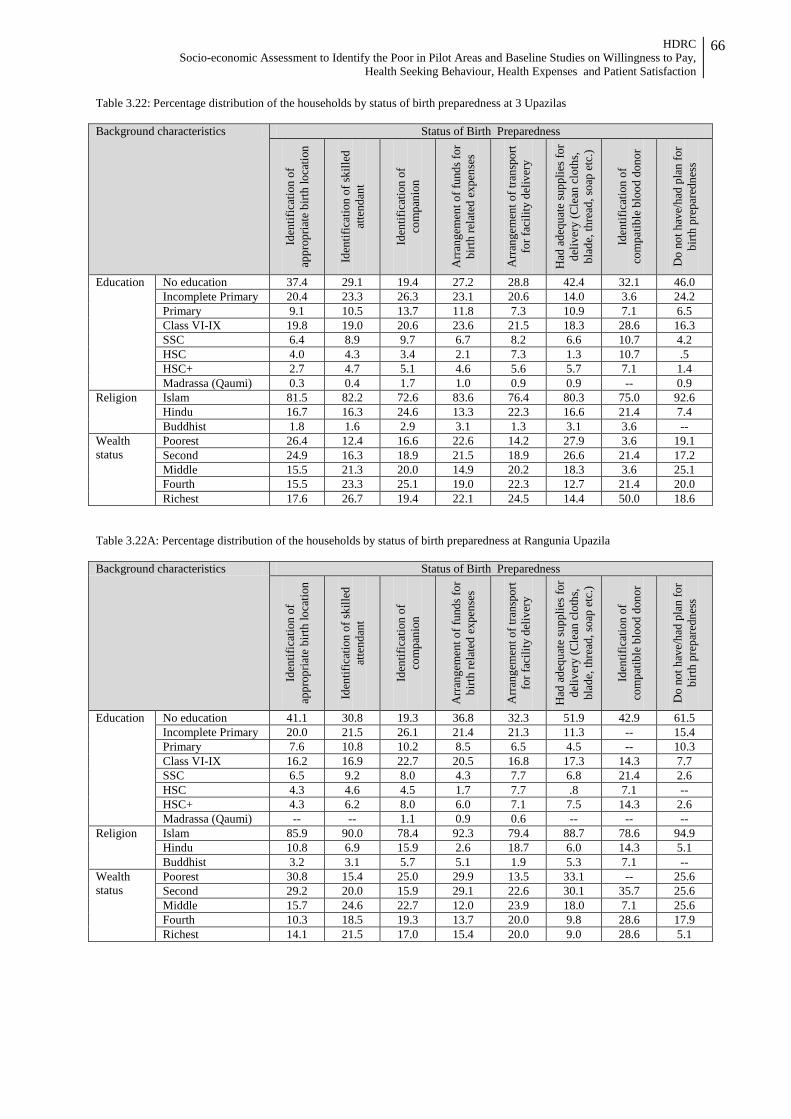
HDRC Socio-economic Assessment to Identify the Poor in Pilot Areas and Baseline Studies on Willingness to Pay,
Health Seeking Behaviour, Health Expenses and Patient Satisfaction
66
Table 3.22: Percentage distribution of the households by status of birth preparedness at 3 Upazilas Background characteristics Status of Birth Preparedness
Iden
tific
atio
n of
ap
prop
riate
birt
h lo
catio
n
Iden
tific
atio
n of
skill
ed
atte
ndan
t
Iden
tific
atio
n of
co
mpa
nion
Arr
ange
men
t of f
unds
for
birth
rela
ted
expe
nses
Arr
ange
men
t of t
rans
port
for f
acili
ty d
eliv
ery
Had
ade
quat
e su
pplie
s for
de
liver
y (C
lean
clo
ths,
bl
ade,
thre
ad, s
oap
etc.
)
Iden
tific
atio
n of
co
mpa
tible
blo
od d
onor
Do
not h
ave/
had
plan
for
birth
pre
pare
dnes
s
Education No education 37.4 29.1 19.4 27.2 28.8 42.4 32.1 46.0 Incomplete Primary 20.4 23.3 26.3 23.1 20.6 14.0 3.6 24.2 Primary 9.1 10.5 13.7 11.8 7.3 10.9 7.1 6.5 Class VI-IX 19.8 19.0 20.6 23.6 21.5 18.3 28.6 16.3 SSC 6.4 8.9 9.7 6.7 8.2 6.6 10.7 4.2 HSC 4.0 4.3 3.4 2.1 7.3 1.3 10.7 .5 HSC+ 2.7 4.7 5.1 4.6 5.6 5.7 7.1 1.4 Madrassa (Qaumi) 0.3 0.4 1.7 1.0 0.9 0.9 -- 0.9
Religion Islam 81.5 82.2 72.6 83.6 76.4 80.3 75.0 92.6 Hindu 16.7 16.3 24.6 13.3 22.3 16.6 21.4 7.4 Buddhist 1.8 1.6 2.9 3.1 1.3 3.1 3.6 --
Wealth status
Poorest 26.4 12.4 16.6 22.6 14.2 27.9 3.6 19.1 Second 24.9 16.3 18.9 21.5 18.9 26.6 21.4 17.2 Middle 15.5 21.3 20.0 14.9 20.2 18.3 3.6 25.1 Fourth 15.5 23.3 25.1 19.0 22.3 12.7 21.4 20.0 Richest 17.6 26.7 19.4 22.1 24.5 14.4 50.0 18.6
Table 3.22A: Percentage distribution of the households by status of birth preparedness at Rangunia Upazila Background characteristics Status of Birth Preparedness
Iden
tific
atio
n of
ap
prop
riate
birt
h lo
catio
n
Iden
tific
atio
n of
skill
ed
atte
ndan
t
Iden
tific
atio
n of
co
mpa
nion
Arr
ange
men
t of f
unds
for
birth
rela
ted
expe
nses
Arr
ange
men
t of t
rans
port
fo
r fac
ility
del
iver
y
Had
ade
quat
e su
pplie
s for
de
liver
y (C
lean
clo
ths,
bl
ade,
thre
ad, s
oap
etc.
)
Iden
tific
atio
n of
co
mpa
tible
blo
od d
onor
Do
not h
ave/
had
plan
for
birth
pre
pare
dnes
s
Education No education 41.1 30.8 19.3 36.8 32.3 51.9 42.9 61.5 Incomplete Primary 20.0 21.5 26.1 21.4 21.3 11.3 -- 15.4 Primary 7.6 10.8 10.2 8.5 6.5 4.5 -- 10.3 Class VI-IX 16.2 16.9 22.7 20.5 16.8 17.3 14.3 7.7 SSC 6.5 9.2 8.0 4.3 7.7 6.8 21.4 2.6 HSC 4.3 4.6 4.5 1.7 7.7 .8 7.1 -- HSC+ 4.3 6.2 8.0 6.0 7.1 7.5 14.3 2.6 Madrassa (Qaumi) -- -- 1.1 0.9 0.6 -- -- --
Religion Islam 85.9 90.0 78.4 92.3 79.4 88.7 78.6 94.9 Hindu 10.8 6.9 15.9 2.6 18.7 6.0 14.3 5.1 Buddhist 3.2 3.1 5.7 5.1 1.9 5.3 7.1 --
Wealth status
Poorest 30.8 15.4 25.0 29.9 13.5 33.1 -- 25.6 Second 29.2 20.0 15.9 29.1 22.6 30.1 35.7 25.6 Middle 15.7 24.6 22.7 12.0 23.9 18.0 7.1 25.6 Fourth 10.3 18.5 19.3 13.7 20.0 9.8 28.6 17.9 Richest 14.1 21.5 17.0 15.4 20.0 9.0 28.6 5.1
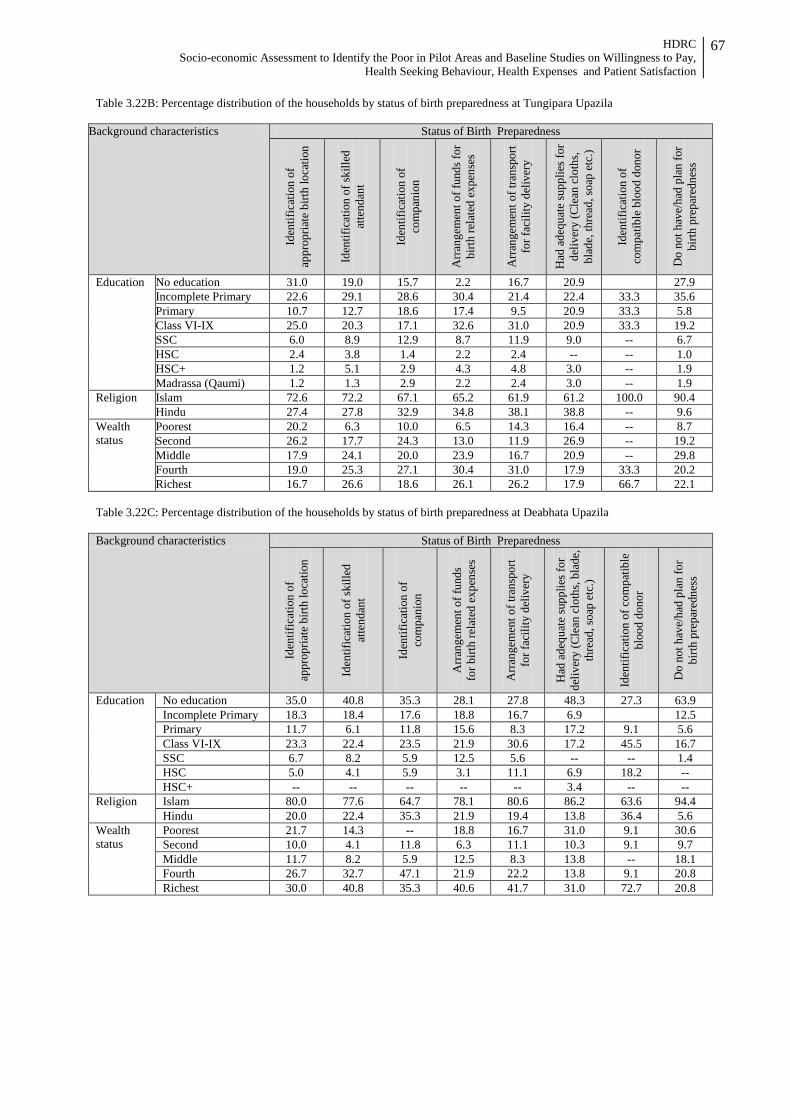
HDRC Socio-economic Assessment to Identify the Poor in Pilot Areas and Baseline Studies on Willingness to Pay,
Health Seeking Behaviour, Health Expenses and Patient Satisfaction
67
Table 3.22B: Percentage distribution of the households by status of birth preparedness at Tungipara Upazila
Background characteristics Status of Birth Preparedness
Iden
tific
atio
n of
ap
prop
riate
birt
h lo
catio
n
Iden
tific
atio
n of
skill
ed
atte
ndan
t
Iden
tific
atio
n of
co
mpa
nion
Arr
ange
men
t of f
unds
for
birth
rela
ted
expe
nses
Arr
ange
men
t of t
rans
port
fo
r fac
ility
del
iver
y
Had
ade
quat
e su
pplie
s for
de
liver
y (C
lean
clo
ths,
bl
ade,
thre
ad, s
oap
etc.
)
Iden
tific
atio
n of
co
mpa
tible
blo
od d
onor
Do
not h
ave/
had
plan
for
birth
pre
pare
dnes
s
Education No education 31.0 19.0 15.7 2.2 16.7 20.9 27.9 Incomplete Primary 22.6 29.1 28.6 30.4 21.4 22.4 33.3 35.6 Primary 10.7 12.7 18.6 17.4 9.5 20.9 33.3 5.8 Class VI-IX 25.0 20.3 17.1 32.6 31.0 20.9 33.3 19.2 SSC 6.0 8.9 12.9 8.7 11.9 9.0 -- 6.7 HSC 2.4 3.8 1.4 2.2 2.4 -- -- 1.0 HSC+ 1.2 5.1 2.9 4.3 4.8 3.0 -- 1.9 Madrassa (Qaumi) 1.2 1.3 2.9 2.2 2.4 3.0 -- 1.9
Religion Islam 72.6 72.2 67.1 65.2 61.9 61.2 100.0 90.4 Hindu 27.4 27.8 32.9 34.8 38.1 38.8 -- 9.6
Wealth status
Poorest 20.2 6.3 10.0 6.5 14.3 16.4 -- 8.7 Second 26.2 17.7 24.3 13.0 11.9 26.9 -- 19.2 Middle 17.9 24.1 20.0 23.9 16.7 20.9 -- 29.8 Fourth 19.0 25.3 27.1 30.4 31.0 17.9 33.3 20.2 Richest 16.7 26.6 18.6 26.1 26.2 17.9 66.7 22.1
Table 3.22C: Percentage distribution of the households by status of birth preparedness at Deabhata Upazila Background characteristics Status of Birth Preparedness
Iden
tific
atio
n of
ap
prop
riate
birt
h lo
catio
n
Iden
tific
atio
n of
skill
ed
atte
ndan
t
Iden
tific
atio
n of
co
mpa
nion
Arr
ange
men
t of f
unds
fo
r birt
h re
late
d ex
pens
es
Arr
ange
men
t of t
rans
port
fo
r fac
ility
del
iver
y
Had
ade
quat
e su
pplie
s for
de
liver
y (C
lean
clo
ths,
blad
e,
thre
ad, s
oap
etc.
)
Iden
tific
atio
n of
com
patib
le
bloo
d do
nor
Do
not h
ave/
had
plan
for
birth
pre
pare
dnes
s Education No education 35.0 40.8 35.3 28.1 27.8 48.3 27.3 63.9
Incomplete Primary 18.3 18.4 17.6 18.8 16.7 6.9 12.5 Primary 11.7 6.1 11.8 15.6 8.3 17.2 9.1 5.6 Class VI-IX 23.3 22.4 23.5 21.9 30.6 17.2 45.5 16.7 SSC 6.7 8.2 5.9 12.5 5.6 -- -- 1.4 HSC 5.0 4.1 5.9 3.1 11.1 6.9 18.2 -- HSC+ -- -- -- -- -- 3.4 -- --
Religion Islam 80.0 77.6 64.7 78.1 80.6 86.2 63.6 94.4 Hindu 20.0 22.4 35.3 21.9 19.4 13.8 36.4 5.6
Wealth status
Poorest 21.7 14.3 -- 18.8 16.7 31.0 9.1 30.6 Second 10.0 4.1 11.8 6.3 11.1 10.3 9.1 9.7 Middle 11.7 8.2 5.9 12.5 8.3 13.8 -- 18.1 Fourth 26.7 32.7 47.1 21.9 22.2 13.8 9.1 20.8 Richest 30.0 40.8 35.3 40.6 41.7 31.0 72.7 20.8
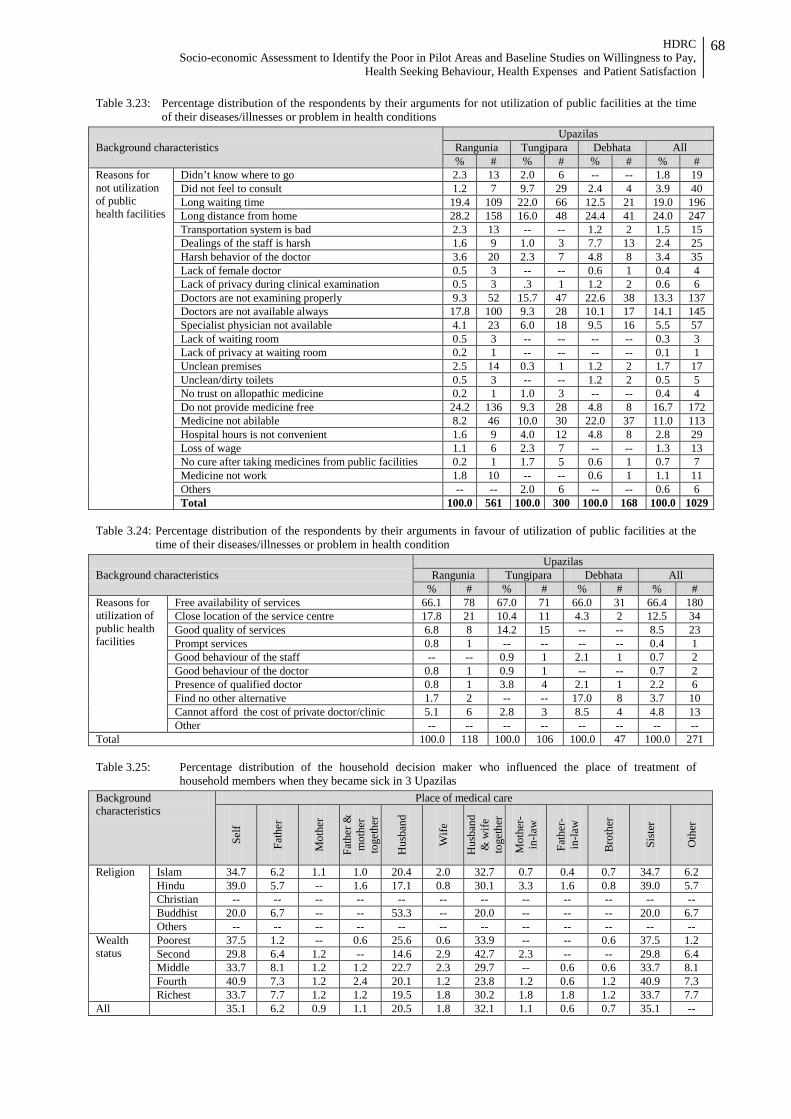
HDRC Socio-economic Assessment to Identify the Poor in Pilot Areas and Baseline Studies on Willingness to Pay,
Health Seeking Behaviour, Health Expenses and Patient Satisfaction
68
Table 3.23: Percentage distribution of the respondents by their arguments for not utilization of public facilities at the time of their diseases/illnesses or problem in health conditions
Background characteristics Upazilas
Rangunia Tungipara Debhata All % # % # % # % #
Reasons for not utilization of public health facilities
Didn’t know where to go 2.3 13 2.0 6 -- -- 1.8 19 Did not feel to consult 1.2 7 9.7 29 2.4 4 3.9 40 Long waiting time 19.4 109 22.0 66 12.5 21 19.0 196 Long distance from home 28.2 158 16.0 48 24.4 41 24.0 247 Transportation system is bad 2.3 13 -- -- 1.2 2 1.5 15 Dealings of the staff is harsh 1.6 9 1.0 3 7.7 13 2.4 25 Harsh behavior of the doctor 3.6 20 2.3 7 4.8 8 3.4 35 Lack of female doctor 0.5 3 -- -- 0.6 1 0.4 4 Lack of privacy during clinical examination 0.5 3 .3 1 1.2 2 0.6 6 Doctors are not examining properly 9.3 52 15.7 47 22.6 38 13.3 137 Doctors are not available always 17.8 100 9.3 28 10.1 17 14.1 145 Specialist physician not available 4.1 23 6.0 18 9.5 16 5.5 57 Lack of waiting room 0.5 3 -- -- -- -- 0.3 3 Lack of privacy at waiting room 0.2 1 -- -- -- -- 0.1 1 Unclean premises 2.5 14 0.3 1 1.2 2 1.7 17 Unclean/dirty toilets 0.5 3 -- -- 1.2 2 0.5 5 No trust on allopathic medicine 0.2 1 1.0 3 -- -- 0.4 4 Do not provide medicine free 24.2 136 9.3 28 4.8 8 16.7 172 Medicine not abilable 8.2 46 10.0 30 22.0 37 11.0 113 Hospital hours is not convenient 1.6 9 4.0 12 4.8 8 2.8 29 Loss of wage 1.1 6 2.3 7 -- -- 1.3 13 No cure after taking medicines from public facilities 0.2 1 1.7 5 0.6 1 0.7 7 Medicine not work 1.8 10 -- -- 0.6 1 1.1 11 Others -- -- 2.0 6 -- -- 0.6 6 Total 100.0 561 100.0 300 100.0 168 100.0 1029
Table 3.24: Percentage distribution of the respondents by their arguments in favour of utilization of public facilities at the
time of their diseases/illnesses or problem in health condition
Background characteristics Upazilas
Rangunia Tungipara Debhata All % # % # % # % #
Reasons for utilization of public health facilities
Free availability of services 66.1 78 67.0 71 66.0 31 66.4 180 Close location of the service centre 17.8 21 10.4 11 4.3 2 12.5 34 Good quality of services 6.8 8 14.2 15 -- -- 8.5 23 Prompt services 0.8 1 -- -- -- -- 0.4 1 Good behaviour of the staff -- -- 0.9 1 2.1 1 0.7 2 Good behaviour of the doctor 0.8 1 0.9 1 -- -- 0.7 2 Presence of qualified doctor 0.8 1 3.8 4 2.1 1 2.2 6 Find no other alternative 1.7 2 -- -- 17.0 8 3.7 10 Cannot afford the cost of private doctor/clinic 5.1 6 2.8 3 8.5 4 4.8 13 Other -- -- -- -- -- -- -- --
Total 100.0 118 100.0 106 100.0 47 100.0 271 Table 3.25: Percentage distribution of the household decision maker who influenced the place of treatment of
household members when they became sick in 3 Upazilas
Background characteristics
Place of medical care
Self
Fath
er
Mot
her
Fath
er &
m
othe
r to
geth
er
Hus
band
Wife
Hus
band
&
wife
to
geth
er
Mot
her-
in-la
w
Fath
er-
in-la
w
Bro
ther
Sist
er
Oth
er
Religion Islam 34.7 6.2 1.1 1.0 20.4 2.0 32.7 0.7 0.4 0.7 34.7 6.2 Hindu 39.0 5.7 -- 1.6 17.1 0.8 30.1 3.3 1.6 0.8 39.0 5.7 Christian -- -- -- -- -- -- -- -- -- -- -- -- Buddhist 20.0 6.7 -- -- 53.3 -- 20.0 -- -- -- 20.0 6.7 Others -- -- -- -- -- -- -- -- -- -- -- --
Wealth status
Poorest 37.5 1.2 -- 0.6 25.6 0.6 33.9 -- -- 0.6 37.5 1.2 Second 29.8 6.4 1.2 -- 14.6 2.9 42.7 2.3 -- -- 29.8 6.4 Middle 33.7 8.1 1.2 1.2 22.7 2.3 29.7 -- 0.6 0.6 33.7 8.1 Fourth 40.9 7.3 1.2 2.4 20.1 1.2 23.8 1.2 0.6 1.2 40.9 7.3 Richest 33.7 7.7 1.2 1.2 19.5 1.8 30.2 1.8 1.8 1.2 33.7 7.7
All 35.1 6.2 0.9 1.1 20.5 1.8 32.1 1.1 0.6 0.7 35.1 --

HDRC Socio-economic Assessment to Identify the Poor in Pilot Areas and Baseline Studies on Willingness to Pay,
Health Seeking Behaviour, Health Expenses and Patient Satisfaction
69
Table 3.25A: Percentage distribution of the household decision maker who influenced the place of treatment of household members when they became sick at Rangunia Upazila
Background characteristics
Place of medical care
Self
Fath
er
Mot
her
Fath
er &
m
othe
r to
geth
er
Hus
band
Wife
Hus
band
&
wife
to
geth
er
Mot
her-
in-
law
Fath
er-in
-la
w
Bro
ther
Sist
er
Oth
er
Religion Islam 28.4 9.8 1.8 0.3 20.1 1.2 36.4 0.6 0.6 0.9 -- -- Hindu 35.9 10.3 -- -- 15.4 -- 30.8 5.1 -- 2.6 -- -- Christian -- -- -- -- -- -- -- -- -- -- -- -- Buddhist 20.0 6.7 -- -- 53.3 -- 20.0 -- -- -- -- -- Others -- -- -- -- -- -- -- -- -- -- -- --
Wealth status
Poorest 33.0 1.0 -- -- 24.0 -- 41.0 -- -- 1.0 -- -- Second 23.0 8.0 2.0 -- 18.0 1.0 45.0 3.0 -- -- -- -- Middle 24.7 15.6 2.6 1.3 19.5 2.6 31.2 -- 1.3 1.3 -- -- Fourth 33.3 16.7 1.7 -- 26.7 -- 18.3 -- -- 3.3 -- -- Richest 32.7 12.7 1.8 -- 16.4 1.8 30.9 1.8 1.8 -- -- --
All 28.8 9.7 1.5 0.3 20.9 1.0 35.2 1.0 0.5 1.0 -- -- Table 3.25B: Percentage distribution of the household decision maker who influenced the place of treatment of
household members when they became sick at Tungipara Upazila ackground characteristics
Place of medical care
Self
Fath
er
Mot
her
Fath
er &
m
othe
r to
geth
er
Hus
band
Wife
Hus
band
&
wife
toge
ther
Mot
her-
in-la
w
Fath
er-in
-law
Bro
ther
Sist
er
Oth
er
Religion Islam 42.7 1.4 -- 2.3 10.3 2.8 38.5 0.9 0.5 0.5 -- -- Hindu 32.2 3.4 -- 3.4 16.9 1.7 40.7 -- 1.7 -- -- -- Christian -- -- -- -- -- -- -- -- -- -- -- -- Buddhist -- -- -- -- -- -- -- -- -- -- -- -- Others -- -- -- -- -- -- -- -- -- -- -- --
Wealth status
Poorest 43.3 -- -- 3.3 10.0 3.3 40.0 -- -- -- -- -- Second 41.1 1.8 -- -- 8.9 1.8 44.6 1.8 -- -- -- -- Middle 43.3 3.0 -- 1.5 16.4 3.0 32.8 -- -- -- -- -- Fourth 47.5 1.7 -- 5.1 8.5 3.4 32.2 1.7 -- -- -- -- Richest 28.3 1.7 -- 3.3 13.3 1.7 46.7 -- 3.3 1.7 -- --
All 40.4 1.8 -- 2.6 11.8 2.6 39.0 0.7 0.7 0.4 -- -- Table 3.25C: Percentage distribution of the household decision maker who influenced the place of treatment of
household members when they became sick at Debhata Upazila Background characteristics
Place of medical care
Self
Fath
er
Mot
her
Fath
er &
m
othe
r to
geth
er
Hus
band
Wife
Hus
band
&
wife
toge
ther
Mot
her-
in-la
w
Fath
er-in
-law
Bro
ther
Sist
er
Oth
er
Religion Islam 37.4 5.2 1.3 0.6 34.8 2.6 16.8 0.6 -- 0.6 -- -- Hindu 60.0 4.0 -- -- 20.0 -- 4.0 8.0 4.0 -- -- -- Christian -- -- -- -- -- -- -- -- -- -- -- -- Buddhist -- -- -- -- -- -- -- -- -- -- -- -- Others -- -- -- -- -- -- -- -- -- -- -- --
Wealth status
Poorest 44.7 2.6 -- -- 42.1 -- 10.5 -- -- -- -- -- Second 33.3 13.3 -- -- 13.3 20.0 20.0 -- -- -- -- -- Middle 35.7 -- -- -- 46.4 -- 17.9 -- -- -- -- -- Fourth 42.2 2.2 2.2 2.2 26.7 -- 20.0 2.2 2.2 -- -- -- Richest 40.7 9.3 1.9 -- 29.6 1.9 11.1 3.7 -- 1.9 -- --
All 40.6 5.0 1.1 0.6 32.8 2.2 15.0 1.7 0.6 0.6 -- --
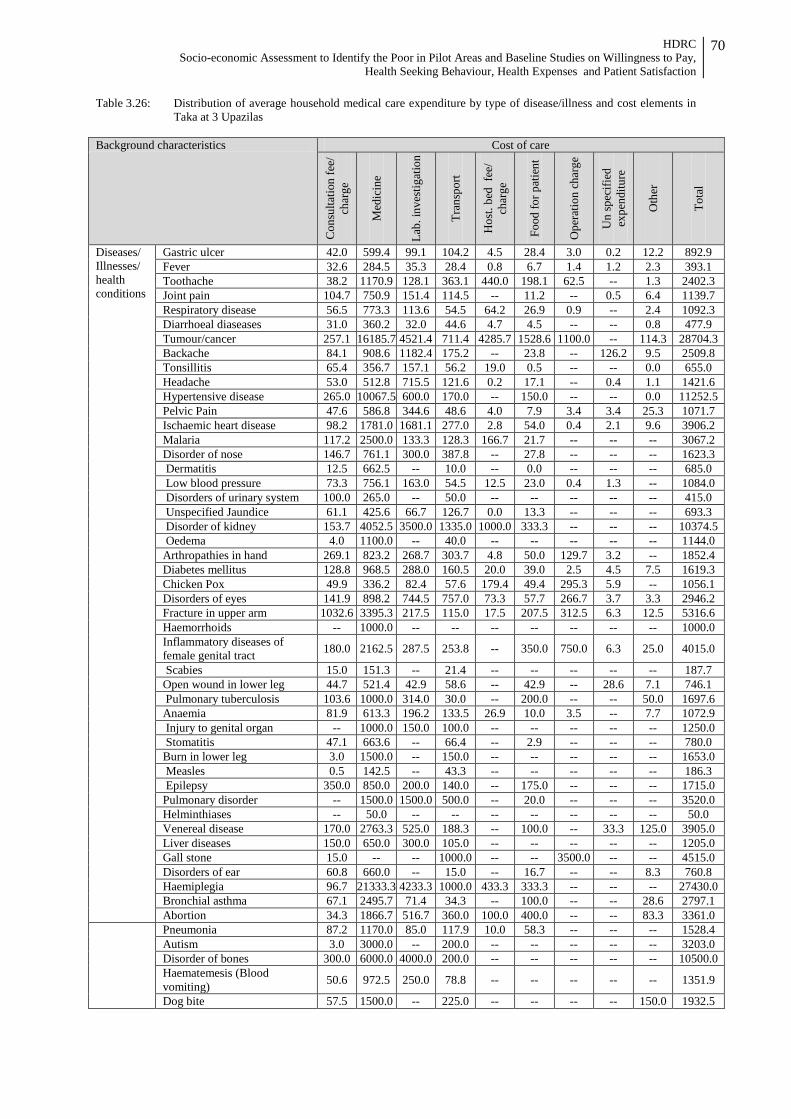
HDRC Socio-economic Assessment to Identify the Poor in Pilot Areas and Baseline Studies on Willingness to Pay,
Health Seeking Behaviour, Health Expenses and Patient Satisfaction
70
Table 3.26: Distribution of average household medical care expenditure by type of disease/illness and cost elements in Taka at 3 Upazilas
Background characteristics Cost of care
Con
sulta
tion
fee/
ch
arge
Med
icin
e
Lab.
inve
stig
atio
n
Tran
spor
t
Hos
t. be
d fe
e/
char
ge
Food
for p
atie
nt
Ope
ratio
n ch
arge
Un
spec
ified
ex
pend
iture
Oth
er
Tota
l
Diseases/ Illnesses/ health conditions
Gastric ulcer 42.0 599.4 99.1 104.2 4.5 28.4 3.0 0.2 12.2 892.9 Fever 32.6 284.5 35.3 28.4 0.8 6.7 1.4 1.2 2.3 393.1 Toothache 38.2 1170.9 128.1 363.1 440.0 198.1 62.5 -- 1.3 2402.3 Joint pain 104.7 750.9 151.4 114.5 -- 11.2 -- 0.5 6.4 1139.7 Respiratory disease 56.5 773.3 113.6 54.5 64.2 26.9 0.9 -- 2.4 1092.3 Diarrhoeal diaseases 31.0 360.2 32.0 44.6 4.7 4.5 -- -- 0.8 477.9 Tumour/cancer 257.1 16185.7 4521.4 711.4 4285.7 1528.6 1100.0 -- 114.3 28704.3 Backache 84.1 908.6 1182.4 175.2 -- 23.8 -- 126.2 9.5 2509.8 Tonsillitis 65.4 356.7 157.1 56.2 19.0 0.5 -- -- 0.0 655.0 Headache 53.0 512.8 715.5 121.6 0.2 17.1 -- 0.4 1.1 1421.6 Hypertensive disease 265.0 10067.5 600.0 170.0 -- 150.0 -- -- 0.0 11252.5 Pelvic Pain 47.6 586.8 344.6 48.6 4.0 7.9 3.4 3.4 25.3 1071.7 Ischaemic heart disease 98.2 1781.0 1681.1 277.0 2.8 54.0 0.4 2.1 9.6 3906.2 Malaria 117.2 2500.0 133.3 128.3 166.7 21.7 -- -- -- 3067.2 Disorder of nose 146.7 761.1 300.0 387.8 -- 27.8 -- -- -- 1623.3 Dermatitis 12.5 662.5 -- 10.0 -- 0.0 -- -- -- 685.0 Low blood pressure 73.3 756.1 163.0 54.5 12.5 23.0 0.4 1.3 -- 1084.0 Disorders of urinary system 100.0 265.0 -- 50.0 -- -- -- -- -- 415.0 Unspecified Jaundice 61.1 425.6 66.7 126.7 0.0 13.3 -- -- -- 693.3 Disorder of kidney 153.7 4052.5 3500.0 1335.0 1000.0 333.3 -- -- -- 10374.5 Oedema 4.0 1100.0 -- 40.0 -- -- -- -- -- 1144.0 Arthropathies in hand 269.1 823.2 268.7 303.7 4.8 50.0 129.7 3.2 -- 1852.4 Diabetes mellitus 128.8 968.5 288.0 160.5 20.0 39.0 2.5 4.5 7.5 1619.3 Chicken Pox 49.9 336.2 82.4 57.6 179.4 49.4 295.3 5.9 -- 1056.1 Disorders of eyes 141.9 898.2 744.5 757.0 73.3 57.7 266.7 3.7 3.3 2946.2 Fracture in upper arm 1032.6 3395.3 217.5 115.0 17.5 207.5 312.5 6.3 12.5 5316.6 Haemorrhoids -- 1000.0 -- -- -- -- -- -- -- 1000.0 Inflammatory diseases of female genital tract 180.0 2162.5 287.5 253.8 -- 350.0 750.0 6.3 25.0 4015.0
Scabies 15.0 151.3 -- 21.4 -- -- -- -- -- 187.7 Open wound in lower leg 44.7 521.4 42.9 58.6 -- 42.9 -- 28.6 7.1 746.1 Pulmonary tuberculosis 103.6 1000.0 314.0 30.0 -- 200.0 -- -- 50.0 1697.6 Anaemia 81.9 613.3 196.2 133.5 26.9 10.0 3.5 -- 7.7 1072.9 Injury to genital organ -- 1000.0 150.0 100.0 -- -- -- -- -- 1250.0 Stomatitis 47.1 663.6 -- 66.4 -- 2.9 -- -- -- 780.0 Burn in lower leg 3.0 1500.0 -- 150.0 -- -- -- -- -- 1653.0 Measles 0.5 142.5 -- 43.3 -- -- -- -- -- 186.3 Epilepsy 350.0 850.0 200.0 140.0 -- 175.0 -- -- -- 1715.0 Pulmonary disorder -- 1500.0 1500.0 500.0 -- 20.0 -- -- -- 3520.0 Helminthiases -- 50.0 -- -- -- -- -- -- -- 50.0 Venereal disease 170.0 2763.3 525.0 188.3 -- 100.0 -- 33.3 125.0 3905.0 Liver diseases 150.0 650.0 300.0 105.0 -- -- -- -- -- 1205.0 Gall stone 15.0 -- -- 1000.0 -- -- 3500.0 -- -- 4515.0 Disorders of ear 60.8 660.0 -- 15.0 -- 16.7 -- -- 8.3 760.8 Haemiplegia 96.7 21333.3 4233.3 1000.0 433.3 333.3 -- -- -- 27430.0 Bronchial asthma 67.1 2495.7 71.4 34.3 -- 100.0 -- -- 28.6 2797.1 Abortion 34.3 1866.7 516.7 360.0 100.0 400.0 -- -- 83.3 3361.0
Pneumonia 87.2 1170.0 85.0 117.9 10.0 58.3 -- -- -- 1528.4 Autism 3.0 3000.0 -- 200.0 -- -- -- -- -- 3203.0 Disorder of bones 300.0 6000.0 4000.0 200.0 -- -- -- -- -- 10500.0 Haematemesis (Blood vomiting) 50.6 972.5 250.0 78.8 -- -- -- -- -- 1351.9
Dog bite 57.5 1500.0 -- 225.0 -- -- -- -- 150.0 1932.5

HDRC Socio-economic Assessment to Identify the Poor in Pilot Areas and Baseline Studies on Willingness to Pay,
Health Seeking Behaviour, Health Expenses and Patient Satisfaction
71
Background characteristics Cost of care
Con
sulta
tion
fee/
ch
arge
Med
icin
e
Lab.
inve
stig
atio
n
Tran
spor
t
Hos
t. be
d fe
e/
char
ge
Food
for p
atie
nt
Ope
ratio
n ch
arge
Un
spec
ified
ex
pend
iture
Oth
er
Tota
l
General weakness -- 700.0 450.0 40.0 -- -- -- -- -- 1190.0 Disorder related to pregnancy 92.2 1233.3 650.0 603.3 133.3 100.0 -- -- -- 2812.2 Anal fissure 600.0 4000.0 3000.0 1000.0 1500.0 300.0 1000.0 -- 300.0 11700.0 Delivery (Child birth) 5.0 4500.0 6033.3 3733.3 833.3 833.3 3433.3 516.7 66.7 19955.0 Disorder of umbilicus -- 500.0 -- -- -- -- -- -- -- 500.0 Hernia 529.2 10700.0 2216.7 2873.3 441.7 866.7 1166.7 50.0 66.7 18910.8 Appendicitis 131.4 2502.2 626.7 224.4 650.0 244.4 1055.6 72.2 44.4 5551.4 Psychological problem 200.0 483.3 -- 196.7 -- 23.3 -- 6.7 66.7 976.7 Hydrocele 4.0 450.0 -- 20.0 -- -- -- -- -- 474.0 Accident 13.3 340.0 50.0 76.7 -- -- -- -- -- 480.0
Sex Male 87.1 913.5 299.4 123.0 43.3 36.6 28.1 8.0 6.0 1545.0 Female 63.8 810.6 292.6 138.2 65.3 48.5 69.7 2.3 7.8 1498.9
Wealth status
Poorest 36.6 403.9 155.0 46.1 2.8 19.1 19.6 1.0 2.0 686.2 Second 45.7 725.5 134.7 85.9 23.4 23.3 60.0 1.3 7.6 1107.5 Middle 47.2 499.1 185.8 85.8 41.2 35.8 40.0 1.2 3.5 939.7 Fourth 139.3 1090.2 418.3 205.2 107.0 71.6 75.6 16.5 12.2 2135.9 Richest 109.6 1611.3 602.9 237.0 102.9 65.9 51.2 5.4 9.5 2795.6 All 75.2 861.2 296.0 130.7 54.5 42.6 49.3 5.1 6.9 1521.5
N 1409 1409 1409 1409 1409 1409 1409 1409 1409 1409 Table 3.26A: Distribution of average household medical care expenditure by type of disease/illness and cost elements in
Taka at Rangunia Upazila
Background characteristics Cost of care
Con
sulta
tion
fee/
ch
arge
Med
icin
e
Lab.
in
vest
igat
ion
Tran
spor
t
Hos
t. be
d fe
e/
char
ge
Food
for
patie
nt
Ope
ratio
n
char
ge
Un
spec
ified
ex
pend
iture
Oth
er
Tota
l
Diseases/ Illnesses/ health conditions
Gastric ulcer 48.2 305.2 14.3 57.6 -- 14.8 -- -- -- 440.1 Fever 31.9 235.4 43.1 29.4 1.2 3.9 0.3 0.8 2.4 348.4 Toothache 41.2 203.0 70.0 38.0 8.0 -- -- -- -- 360.2 Joint pain 68.9 592.9 103.7 81.0 -- 8.0 -- -- 4.0 858.4 Respiratory diseases 53.2 745.4 139.3 51.9 103.4 38.6 1.4 -- 3.4 1136.5 Diarrhoeal diseases 18.2 265.2 46.5 46.4 1.4 2.2 -- -- 1.0 380.7 Tumour/cancer 450.0 400.0 -- 250.0 1500.0 500.0 2600.0 -- -- 5700.0 Backache 51.0 528.3 -- 60.0 -- -- -- -- -- 639.3 Tonsillitis 104.6 328.6 342.9 75.7 57.1 1.4 -- -- -- 910.3 Headache 52.0 281.7 1590.0 71.0 0.4 24.1 -- -- 2.2 2021.4 Hypertensive disease 265.0 10067.5 600.0 170.0 -- 150.0 -- -- -- 11252.5 Pelvic Pain 23.9 448.9 102.4 40.5 6.1 9.5 2.6 -- 17.1 651.0 Ischaemic heart disease 96.2 1364.8 1450.0 149.7 5.1 94.2 0.7 4.0 5.7 3170.4 Malaria 117.2 2500.0 133.3 128.3 166.7 21.7 -- -- -- 3067.2 Disorders of nose 15.0 200.0 -- 25.0 -- 25.0 -- -- -- 265.0 Dermatitis -- 216.7 -- 13.3 -- -- -- -- -- 230.0 Low blood pressure 47.5 678.0 113.3 55.3 33.3 14.7 1.0 -- -- 943.2 Disorders of urinary symptom 200.0 500.0 -- 60.0 -- -- -- -- -- 760.0 Unspecified Jaundice 90.0 278.0 120.0 80.0 -- 24.0 -- -- -- 592.0 Disorders of kidney 300.0 8000.0 5666.7 2666.7 2000.0 666.7 -- -- -- 19300.0 Arthropathies in hand 85.3 943.3 485.6 135.6 16.7 -- 2.2 -- -- 1668.7 Diabetes mellitus 178.3 1215.5 352.7 167.3 18.2 43.6 -- -- 9.1 1984.6 Chicken Pox 27.3 205.0 -- 25.0 -- 35.0 -- -- -- 292.3 Disorder of eyes 74.1 590.8 1292.3 644.6 -- 17.7 384.6 -- -- 3004.1 Fracture in upper arm 55.1 515.7 242.9 57.1 40.0 431.4 714.3 -- 28.6 2085.1 Inflammatory diseases of female genital tract 400.0 2000.0 2000.0 1000.0 -- -- -- -- -- 5400.0
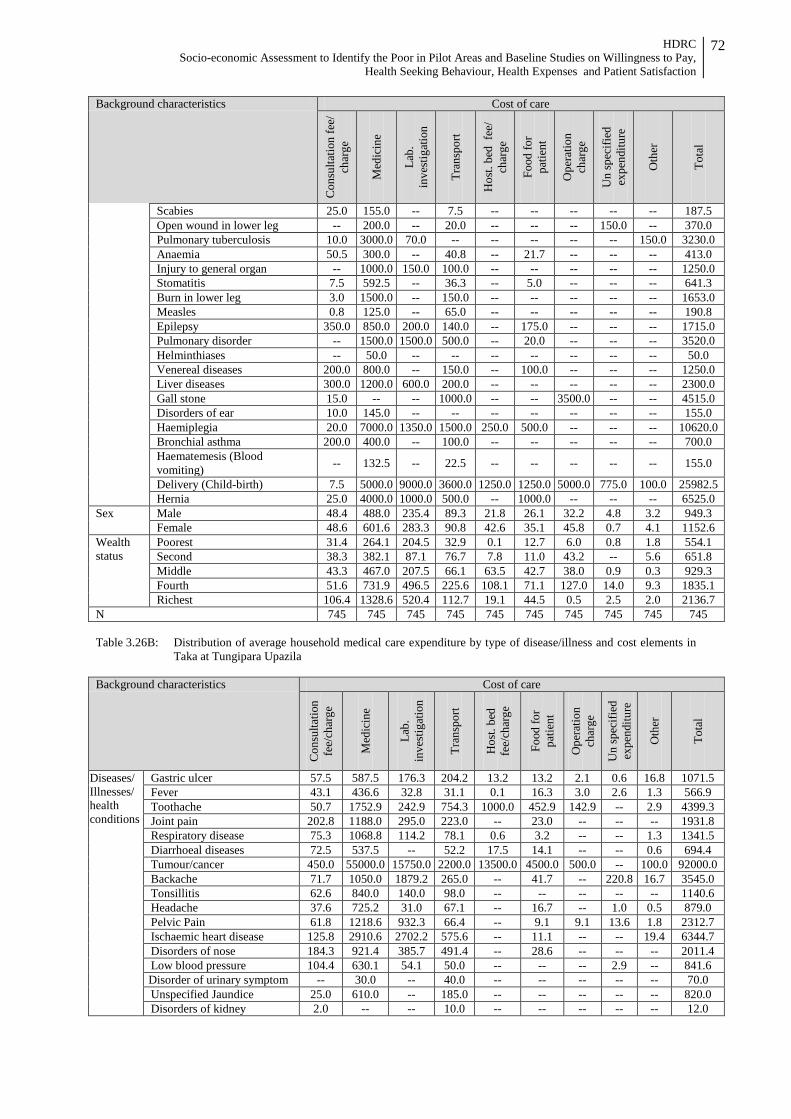
HDRC Socio-economic Assessment to Identify the Poor in Pilot Areas and Baseline Studies on Willingness to Pay,
Health Seeking Behaviour, Health Expenses and Patient Satisfaction
72
Background characteristics Cost of care
Con
sulta
tion
fee/
ch
arge
Med
icin
e
Lab.
in
vest
igat
ion
Tran
spor
t
Hos
t. be
d fe
e/
char
ge
Food
for
patie
nt
Ope
ratio
n
char
ge
Un
spec
ified
ex
pend
iture
Oth
er
Tota
l
Scabies 25.0 155.0 -- 7.5 -- -- -- -- -- 187.5 Open wound in lower leg -- 200.0 -- 20.0 -- -- -- 150.0 -- 370.0 Pulmonary tuberculosis 10.0 3000.0 70.0 -- -- -- -- -- 150.0 3230.0 Anaemia 50.5 300.0 -- 40.8 -- 21.7 -- -- -- 413.0 Injury to general organ -- 1000.0 150.0 100.0 -- -- -- -- -- 1250.0 Stomatitis 7.5 592.5 -- 36.3 -- 5.0 -- -- -- 641.3 Burn in lower leg 3.0 1500.0 -- 150.0 -- -- -- -- -- 1653.0 Measles 0.8 125.0 -- 65.0 -- -- -- -- -- 190.8 Epilepsy 350.0 850.0 200.0 140.0 -- 175.0 -- -- -- 1715.0 Pulmonary disorder -- 1500.0 1500.0 500.0 -- 20.0 -- -- -- 3520.0 Helminthiases -- 50.0 -- -- -- -- -- -- -- 50.0 Venereal diseases 200.0 800.0 -- 150.0 -- 100.0 -- -- -- 1250.0 Liver diseases 300.0 1200.0 600.0 200.0 -- -- -- -- -- 2300.0 Gall stone 15.0 -- -- 1000.0 -- -- 3500.0 -- -- 4515.0 Disorders of ear 10.0 145.0 -- -- -- -- -- -- -- 155.0 Haemiplegia 20.0 7000.0 1350.0 1500.0 250.0 500.0 -- -- -- 10620.0 Bronchial asthma 200.0 400.0 -- 100.0 -- -- -- -- -- 700.0 Haematemesis (Blood vomiting) -- 132.5 -- 22.5 -- -- -- -- -- 155.0
Delivery (Child-birth) 7.5 5000.0 9000.0 3600.0 1250.0 1250.0 5000.0 775.0 100.0 25982.5 Hernia 25.0 4000.0 1000.0 500.0 -- 1000.0 -- -- -- 6525.0
Sex Male 48.4 488.0 235.4 89.3 21.8 26.1 32.2 4.8 3.2 949.3 Female 48.6 601.6 283.3 90.8 42.6 35.1 45.8 0.7 4.1 1152.6
Wealth status
Poorest 31.4 264.1 204.5 32.9 0.1 12.7 6.0 0.8 1.8 554.1 Second 38.3 382.1 87.1 76.7 7.8 11.0 43.2 -- 5.6 651.8 Middle 43.3 467.0 207.5 66.1 63.5 42.7 38.0 0.9 0.3 929.3 Fourth 51.6 731.9 496.5 225.6 108.1 71.1 127.0 14.0 9.3 1835.1 Richest 106.4 1328.6 520.4 112.7 19.1 44.5 0.5 2.5 2.0 2136.7
N 745 745 745 745 745 745 745 745 745 745 Table 3.26B: Distribution of average household medical care expenditure by type of disease/illness and cost elements in
Taka at Tungipara Upazila Background characteristics Cost of care
Con
sulta
tion
fe
e/ch
arge
Med
icin
e
Lab.
in
vest
igat
ion
Tran
spor
t
Hos
t. be
d
fee/
char
ge
Food
for
patie
nt
Ope
ratio
n
char
ge
Un
spec
ified
ex
pend
iture
Oth
er
Tota
l
Diseases/ Illnesses/ health conditions
Gastric ulcer 57.5 587.5 176.3 204.2 13.2 13.2 2.1 0.6 16.8 1071.5 Fever 43.1 436.6 32.8 31.1 0.1 16.3 3.0 2.6 1.3 566.9 Toothache 50.7 1752.9 242.9 754.3 1000.0 452.9 142.9 -- 2.9 4399.3 Joint pain 202.8 1188.0 295.0 223.0 -- 23.0 -- -- -- 1931.8 Respiratory disease 75.3 1068.8 114.2 78.1 0.6 3.2 -- -- 1.3 1341.5 Diarrhoeal diseases 72.5 537.5 -- 52.2 17.5 14.1 -- -- 0.6 694.4 Tumour/cancer 450.0 55000.0 15750.0 2200.0 13500.0 4500.0 500.0 -- 100.0 92000.0 Backache 71.7 1050.0 1879.2 265.0 -- 41.7 -- 220.8 16.7 3545.0 Tonsillitis 62.6 840.0 140.0 98.0 -- -- -- -- -- 1140.6 Headache 37.6 725.2 31.0 67.1 -- 16.7 -- 1.0 0.5 879.0 Pelvic Pain 61.8 1218.6 932.3 66.4 -- 9.1 9.1 13.6 1.8 2312.7 Ischaemic heart disease 125.8 2910.6 2702.2 575.6 -- 11.1 -- -- 19.4 6344.7 Disorders of nose 184.3 921.4 385.7 491.4 -- 28.6 -- -- -- 2011.4 Low blood pressure 104.4 630.1 54.1 50.0 -- -- -- 2.9 -- 841.6 Disorder of urinary symptom -- 30.0 -- 40.0 -- -- -- -- -- 70.0 Unspecified Jaundice 25.0 610.0 -- 185.0 -- -- -- -- -- 820.0 Disorders of kidney 2.0 -- -- 10.0 -- -- -- -- -- 12.0
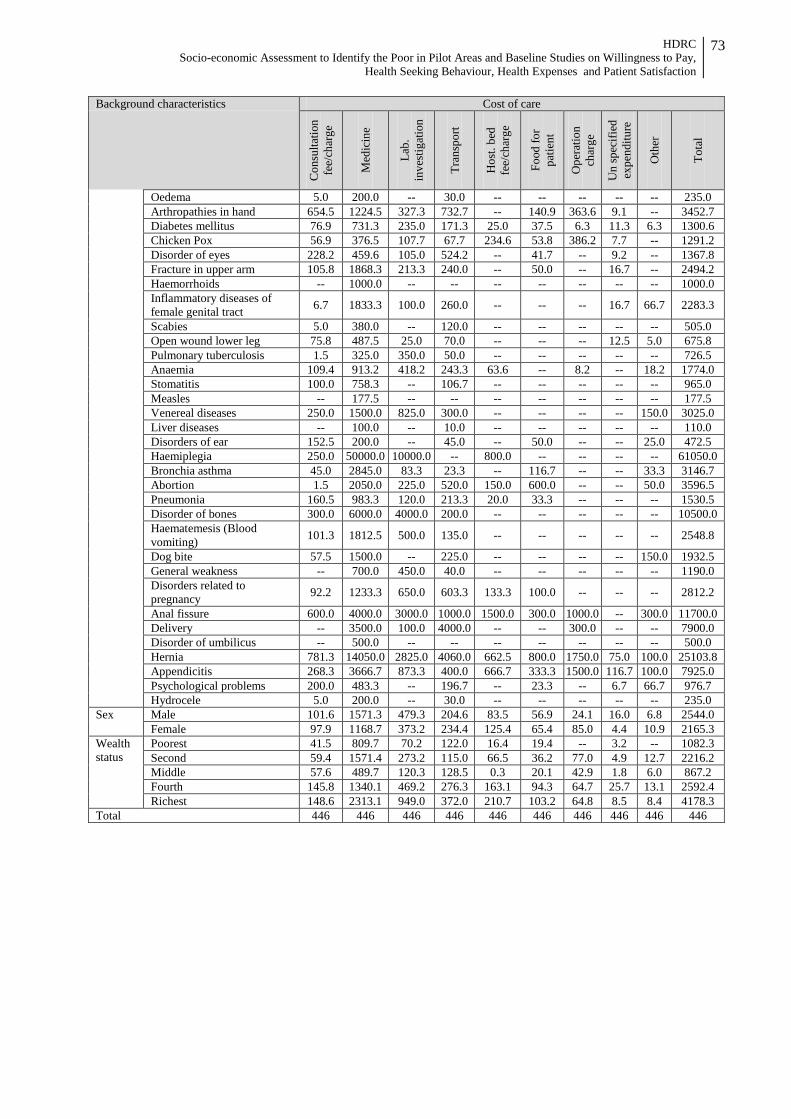
HDRC Socio-economic Assessment to Identify the Poor in Pilot Areas and Baseline Studies on Willingness to Pay,
Health Seeking Behaviour, Health Expenses and Patient Satisfaction
73
Background characteristics Cost of care
Con
sulta
tion
fe
e/ch
arge
Med
icin
e
Lab.
in
vest
igat
ion
Tran
spor
t
Hos
t. be
d
fee/
char
ge
Food
for
patie
nt
Ope
ratio
n
char
ge
Un
spec
ified
ex
pend
iture
Oth
er
Tota
l
Oedema 5.0 200.0 -- 30.0 -- -- -- -- -- 235.0 Arthropathies in hand 654.5 1224.5 327.3 732.7 -- 140.9 363.6 9.1 -- 3452.7 Diabetes mellitus 76.9 731.3 235.0 171.3 25.0 37.5 6.3 11.3 6.3 1300.6 Chicken Pox 56.9 376.5 107.7 67.7 234.6 53.8 386.2 7.7 -- 1291.2 Disorder of eyes 228.2 459.6 105.0 524.2 -- 41.7 -- 9.2 -- 1367.8 Fracture in upper arm 105.8 1868.3 213.3 240.0 -- 50.0 -- 16.7 -- 2494.2 Haemorrhoids -- 1000.0 -- -- -- -- -- -- -- 1000.0 Inflammatory diseases of female genital tract 6.7 1833.3 100.0 260.0 -- -- -- 16.7 66.7 2283.3
Scabies 5.0 380.0 -- 120.0 -- -- -- -- -- 505.0 Open wound lower leg 75.8 487.5 25.0 70.0 -- -- -- 12.5 5.0 675.8 Pulmonary tuberculosis 1.5 325.0 350.0 50.0 -- -- -- -- -- 726.5 Anaemia 109.4 913.2 418.2 243.3 63.6 -- 8.2 -- 18.2 1774.0 Stomatitis 100.0 758.3 -- 106.7 -- -- -- -- -- 965.0 Measles -- 177.5 -- -- -- -- -- -- -- 177.5 Venereal diseases 250.0 1500.0 825.0 300.0 -- -- -- -- 150.0 3025.0 Liver diseases -- 100.0 -- 10.0 -- -- -- -- -- 110.0 Disorders of ear 152.5 200.0 -- 45.0 -- 50.0 -- -- 25.0 472.5 Haemiplegia 250.0 50000.0 10000.0 -- 800.0 -- -- -- -- 61050.0 Bronchia asthma 45.0 2845.0 83.3 23.3 -- 116.7 -- -- 33.3 3146.7 Abortion 1.5 2050.0 225.0 520.0 150.0 600.0 -- -- 50.0 3596.5 Pneumonia 160.5 983.3 120.0 213.3 20.0 33.3 -- -- -- 1530.5 Disorder of bones 300.0 6000.0 4000.0 200.0 -- -- -- -- -- 10500.0 Haematemesis (Blood vomiting) 101.3 1812.5 500.0 135.0 -- -- -- -- -- 2548.8
Dog bite 57.5 1500.0 -- 225.0 -- -- -- -- 150.0 1932.5 General weakness -- 700.0 450.0 40.0 -- -- -- -- -- 1190.0 Disorders related to pregnancy 92.2 1233.3 650.0 603.3 133.3 100.0 -- -- -- 2812.2
Anal fissure 600.0 4000.0 3000.0 1000.0 1500.0 300.0 1000.0 -- 300.0 11700.0 Delivery -- 3500.0 100.0 4000.0 -- -- 300.0 -- -- 7900.0 Disorder of umbilicus -- 500.0 -- -- -- -- -- -- -- 500.0 Hernia 781.3 14050.0 2825.0 4060.0 662.5 800.0 1750.0 75.0 100.0 25103.8 Appendicitis 268.3 3666.7 873.3 400.0 666.7 333.3 1500.0 116.7 100.0 7925.0 Psychological problems 200.0 483.3 -- 196.7 -- 23.3 -- 6.7 66.7 976.7 Hydrocele 5.0 200.0 -- 30.0 -- -- -- -- -- 235.0
Sex Male 101.6 1571.3 479.3 204.6 83.5 56.9 24.1 16.0 6.8 2544.0 Female 97.9 1168.7 373.2 234.4 125.4 65.4 85.0 4.4 10.9 2165.3
Wealth status
Poorest 41.5 809.7 70.2 122.0 16.4 19.4 -- 3.2 -- 1082.3 Second 59.4 1571.4 273.2 115.0 66.5 36.2 77.0 4.9 12.7 2216.2 Middle 57.6 489.7 120.3 128.5 0.3 20.1 42.9 1.8 6.0 867.2 Fourth 145.8 1340.1 469.2 276.3 163.1 94.3 64.7 25.7 13.1 2592.4 Richest 148.6 2313.1 949.0 372.0 210.7 103.2 64.8 8.5 8.4 4178.3
Total 446 446 446 446 446 446 446 446 446 446
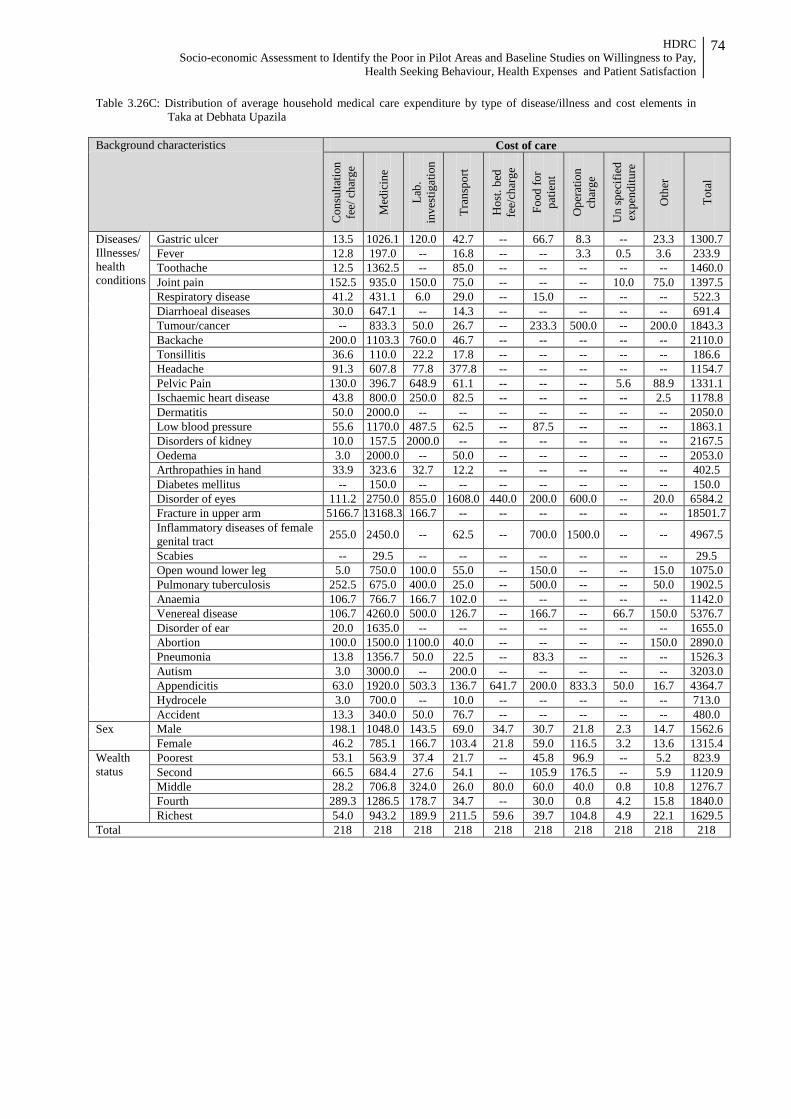
HDRC Socio-economic Assessment to Identify the Poor in Pilot Areas and Baseline Studies on Willingness to Pay,
Health Seeking Behaviour, Health Expenses and Patient Satisfaction
74
Table 3.26C: Distribution of average household medical care expenditure by type of disease/illness and cost elements in Taka at Debhata Upazila
Background characteristics Cost of care
Con
sulta
tion
fee/
cha
rge
Med
icin
e
Lab.
in
vest
igat
ion
Tran
spor
t
Hos
t. be
d fe
e/ch
arge
Food
for
patie
nt
Ope
ratio
n ch
arge
Un
spec
ified
ex
pend
iture
Oth
er
Tota
l
Diseases/ Illnesses/ health conditions
Gastric ulcer 13.5 1026.1 120.0 42.7 -- 66.7 8.3 -- 23.3 1300.7 Fever 12.8 197.0 -- 16.8 -- -- 3.3 0.5 3.6 233.9 Toothache 12.5 1362.5 -- 85.0 -- -- -- -- -- 1460.0 Joint pain 152.5 935.0 150.0 75.0 -- -- -- 10.0 75.0 1397.5 Respiratory disease 41.2 431.1 6.0 29.0 -- 15.0 -- -- -- 522.3 Diarrhoeal diseases 30.0 647.1 -- 14.3 -- -- -- -- -- 691.4 Tumour/cancer -- 833.3 50.0 26.7 -- 233.3 500.0 -- 200.0 1843.3 Backache 200.0 1103.3 760.0 46.7 -- -- -- -- -- 2110.0 Tonsillitis 36.6 110.0 22.2 17.8 -- -- -- -- -- 186.6 Headache 91.3 607.8 77.8 377.8 -- -- -- -- -- 1154.7 Pelvic Pain 130.0 396.7 648.9 61.1 -- -- -- 5.6 88.9 1331.1 Ischaemic heart disease 43.8 800.0 250.0 82.5 -- -- -- -- 2.5 1178.8 Dermatitis 50.0 2000.0 -- -- -- -- -- -- -- 2050.0 Low blood pressure 55.6 1170.0 487.5 62.5 -- 87.5 -- -- -- 1863.1 Disorders of kidney 10.0 157.5 2000.0 -- -- -- -- -- -- 2167.5 Oedema 3.0 2000.0 -- 50.0 -- -- -- -- -- 2053.0 Arthropathies in hand 33.9 323.6 32.7 12.2 -- -- -- -- -- 402.5 Diabetes mellitus -- 150.0 -- -- -- -- -- -- -- 150.0 Disorder of eyes 111.2 2750.0 855.0 1608.0 440.0 200.0 600.0 -- 20.0 6584.2 Fracture in upper arm 5166.7 13168.3 166.7 -- -- -- -- -- -- 18501.7 Inflammatory diseases of female genital tract 255.0 2450.0 -- 62.5 -- 700.0 1500.0 -- -- 4967.5
Scabies -- 29.5 -- -- -- -- -- -- -- 29.5 Open wound lower leg 5.0 750.0 100.0 55.0 -- 150.0 -- -- 15.0 1075.0 Pulmonary tuberculosis 252.5 675.0 400.0 25.0 -- 500.0 -- -- 50.0 1902.5 Anaemia 106.7 766.7 166.7 102.0 -- -- -- -- -- 1142.0 Venereal disease 106.7 4260.0 500.0 126.7 -- 166.7 -- 66.7 150.0 5376.7 Disorder of ear 20.0 1635.0 -- -- -- -- -- -- -- 1655.0 Abortion 100.0 1500.0 1100.0 40.0 -- -- -- -- 150.0 2890.0 Pneumonia 13.8 1356.7 50.0 22.5 -- 83.3 -- -- -- 1526.3 Autism 3.0 3000.0 -- 200.0 -- -- -- -- -- 3203.0 Appendicitis 63.0 1920.0 503.3 136.7 641.7 200.0 833.3 50.0 16.7 4364.7 Hydrocele 3.0 700.0 -- 10.0 -- -- -- -- -- 713.0 Accident 13.3 340.0 50.0 76.7 -- -- -- -- -- 480.0
Sex Male 198.1 1048.0 143.5 69.0 34.7 30.7 21.8 2.3 14.7 1562.6 Female 46.2 785.1 166.7 103.4 21.8 59.0 116.5 3.2 13.6 1315.4
Wealth status
Poorest 53.1 563.9 37.4 21.7 -- 45.8 96.9 -- 5.2 823.9 Second 66.5 684.4 27.6 54.1 -- 105.9 176.5 -- 5.9 1120.9 Middle 28.2 706.8 324.0 26.0 80.0 60.0 40.0 0.8 10.8 1276.7 Fourth 289.3 1286.5 178.7 34.7 -- 30.0 0.8 4.2 15.8 1840.0 Richest 54.0 943.2 189.9 211.5 59.6 39.7 104.8 4.9 22.1 1629.5
Total 218 218 218 218 218 218 218 218 218 218
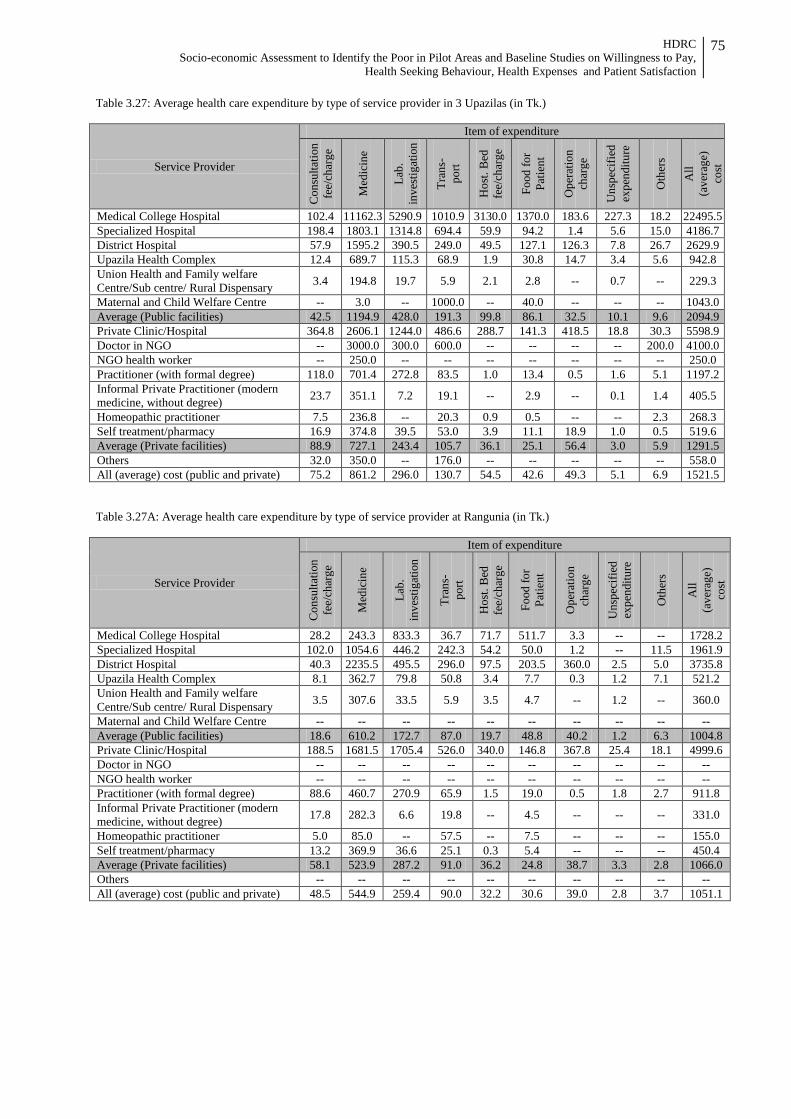
HDRC Socio-economic Assessment to Identify the Poor in Pilot Areas and Baseline Studies on Willingness to Pay,
Health Seeking Behaviour, Health Expenses and Patient Satisfaction
75
Table 3.27: Average health care expenditure by type of service provider in 3 Upazilas (in Tk.)
Service Provider
Item of expenditure
Con
sulta
tion
fe
e/ch
arge
Med
icin
e
Lab.
in
vest
igat
ion
Tran
s-
port
Hos
t. B
ed
fee/
char
ge
Food
for
Patie
nt
Ope
ratio
n
char
ge
Uns
peci
fied
expe
nditu
re
Oth
ers
All
(ave
rage
) co
st
Medical College Hospital 102.4 11162.3 5290.9 1010.9 3130.0 1370.0 183.6 227.3 18.2 22495.5 Specialized Hospital 198.4 1803.1 1314.8 694.4 59.9 94.2 1.4 5.6 15.0 4186.7 District Hospital 57.9 1595.2 390.5 249.0 49.5 127.1 126.3 7.8 26.7 2629.9 Upazila Health Complex 12.4 689.7 115.3 68.9 1.9 30.8 14.7 3.4 5.6 942.8 Union Health and Family welfare Centre/Sub centre/ Rural Dispensary 3.4 194.8 19.7 5.9 2.1 2.8 -- 0.7 -- 229.3
Maternal and Child Welfare Centre -- 3.0 -- 1000.0 -- 40.0 -- -- -- 1043.0 Average (Public facilities) 42.5 1194.9 428.0 191.3 99.8 86.1 32.5 10.1 9.6 2094.9 Private Clinic/Hospital 364.8 2606.1 1244.0 486.6 288.7 141.3 418.5 18.8 30.3 5598.9 Doctor in NGO -- 3000.0 300.0 600.0 -- -- -- -- 200.0 4100.0 NGO health worker -- 250.0 -- -- -- -- -- -- -- 250.0 Practitioner (with formal degree) 118.0 701.4 272.8 83.5 1.0 13.4 0.5 1.6 5.1 1197.2 Informal Private Practitioner (modern medicine, without degree) 23.7 351.1 7.2 19.1 -- 2.9 -- 0.1 1.4 405.5
Homeopathic practitioner 7.5 236.8 -- 20.3 0.9 0.5 -- -- 2.3 268.3 Self treatment/pharmacy 16.9 374.8 39.5 53.0 3.9 11.1 18.9 1.0 0.5 519.6 Average (Private facilities) 88.9 727.1 243.4 105.7 36.1 25.1 56.4 3.0 5.9 1291.5 Others 32.0 350.0 -- 176.0 -- -- -- -- -- 558.0 All (average) cost (public and private) 75.2 861.2 296.0 130.7 54.5 42.6 49.3 5.1 6.9 1521.5 Table 3.27A: Average health care expenditure by type of service provider at Rangunia (in Tk.)
Service Provider
Item of expenditure
Con
sulta
tion
fe
e/ch
arge
Med
icin
e
Lab.
in
vest
igat
ion
Tran
s-
port
Hos
t. B
ed
fee/
char
ge
Food
for
Patie
nt
Ope
ratio
n
char
ge
Uns
peci
fied
expe
nditu
re
Oth
ers
All
(ave
rage
) co
st
Medical College Hospital 28.2 243.3 833.3 36.7 71.7 511.7 3.3 -- -- 1728.2 Specialized Hospital 102.0 1054.6 446.2 242.3 54.2 50.0 1.2 -- 11.5 1961.9 District Hospital 40.3 2235.5 495.5 296.0 97.5 203.5 360.0 2.5 5.0 3735.8 Upazila Health Complex 8.1 362.7 79.8 50.8 3.4 7.7 0.3 1.2 7.1 521.2 Union Health and Family welfare Centre/Sub centre/ Rural Dispensary 3.5 307.6 33.5 5.9 3.5 4.7 -- 1.2 -- 360.0
Maternal and Child Welfare Centre -- -- -- -- -- -- -- -- -- -- Average (Public facilities) 18.6 610.2 172.7 87.0 19.7 48.8 40.2 1.2 6.3 1004.8 Private Clinic/Hospital 188.5 1681.5 1705.4 526.0 340.0 146.8 367.8 25.4 18.1 4999.6 Doctor in NGO -- -- -- -- -- -- -- -- -- -- NGO health worker -- -- -- -- -- -- -- -- -- -- Practitioner (with formal degree) 88.6 460.7 270.9 65.9 1.5 19.0 0.5 1.8 2.7 911.8 Informal Private Practitioner (modern medicine, without degree) 17.8 282.3 6.6 19.8 -- 4.5 -- -- -- 331.0
Homeopathic practitioner 5.0 85.0 -- 57.5 -- 7.5 -- -- -- 155.0 Self treatment/pharmacy 13.2 369.9 36.6 25.1 0.3 5.4 -- -- -- 450.4 Average (Private facilities) 58.1 523.9 287.2 91.0 36.2 24.8 38.7 3.3 2.8 1066.0 Others -- -- -- -- -- -- -- -- -- -- All (average) cost (public and private) 48.5 544.9 259.4 90.0 32.2 30.6 39.0 2.8 3.7 1051.1
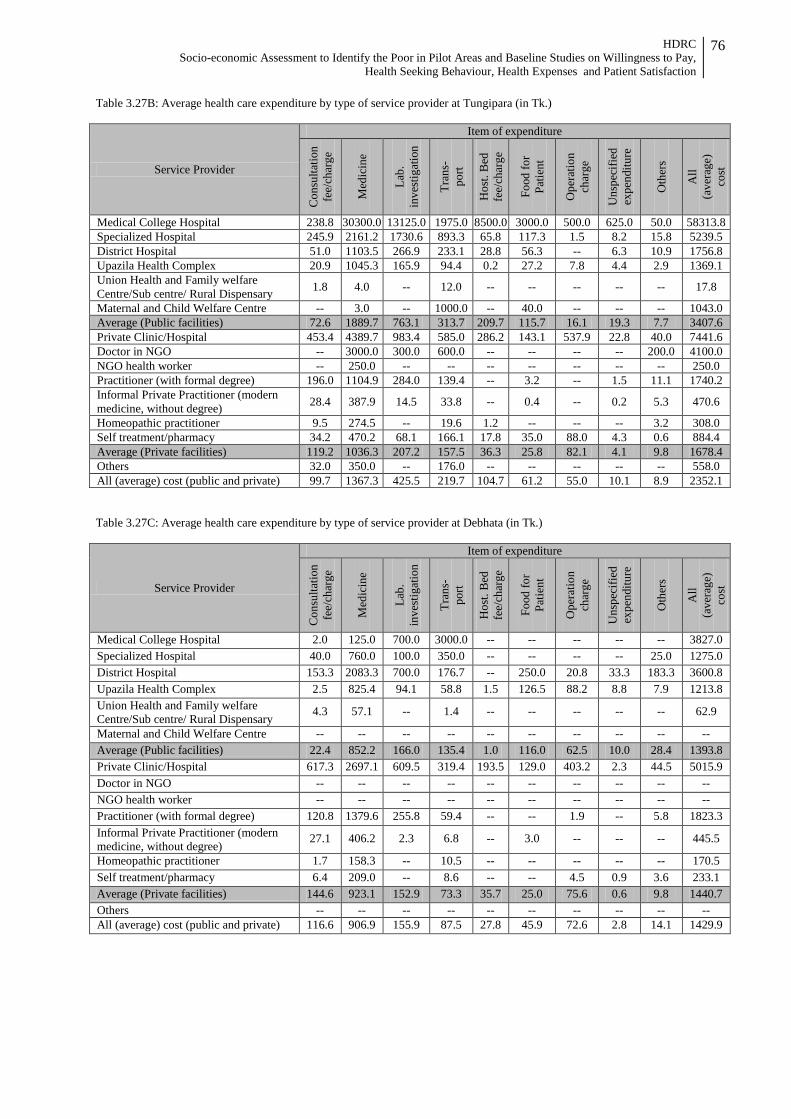
HDRC Socio-economic Assessment to Identify the Poor in Pilot Areas and Baseline Studies on Willingness to Pay,
Health Seeking Behaviour, Health Expenses and Patient Satisfaction
76
Table 3.27B: Average health care expenditure by type of service provider at Tungipara (in Tk.)
Service Provider
Item of expenditure
Con
sulta
tion
fe
e/ch
arge
Med
icin
e
Lab.
in
vest
igat
ion
Tran
s-
port
Hos
t. B
ed
fee/
char
ge
Food
for
Patie
nt
Ope
ratio
n
char
ge
Uns
peci
fied
expe
nditu
re
Oth
ers
All
(ave
rage
) co
st
Medical College Hospital 238.8 30300.0 13125.0 1975.0 8500.0 3000.0 500.0 625.0 50.0 58313.8 Specialized Hospital 245.9 2161.2 1730.6 893.3 65.8 117.3 1.5 8.2 15.8 5239.5 District Hospital 51.0 1103.5 266.9 233.1 28.8 56.3 -- 6.3 10.9 1756.8 Upazila Health Complex 20.9 1045.3 165.9 94.4 0.2 27.2 7.8 4.4 2.9 1369.1 Union Health and Family welfare Centre/Sub centre/ Rural Dispensary 1.8 4.0 -- 12.0 -- -- -- -- -- 17.8
Maternal and Child Welfare Centre -- 3.0 -- 1000.0 -- 40.0 -- -- -- 1043.0 Average (Public facilities) 72.6 1889.7 763.1 313.7 209.7 115.7 16.1 19.3 7.7 3407.6 Private Clinic/Hospital 453.4 4389.7 983.4 585.0 286.2 143.1 537.9 22.8 40.0 7441.6 Doctor in NGO -- 3000.0 300.0 600.0 -- -- -- -- 200.0 4100.0 NGO health worker -- 250.0 -- -- -- -- -- -- -- 250.0 Practitioner (with formal degree) 196.0 1104.9 284.0 139.4 -- 3.2 -- 1.5 11.1 1740.2 Informal Private Practitioner (modern medicine, without degree) 28.4 387.9 14.5 33.8 -- 0.4 -- 0.2 5.3 470.6
Homeopathic practitioner 9.5 274.5 -- 19.6 1.2 -- -- -- 3.2 308.0 Self treatment/pharmacy 34.2 470.2 68.1 166.1 17.8 35.0 88.0 4.3 0.6 884.4 Average (Private facilities) 119.2 1036.3 207.2 157.5 36.3 25.8 82.1 4.1 9.8 1678.4 Others 32.0 350.0 -- 176.0 -- -- -- -- -- 558.0 All (average) cost (public and private) 99.7 1367.3 425.5 219.7 104.7 61.2 55.0 10.1 8.9 2352.1 Table 3.27C: Average health care expenditure by type of service provider at Debhata (in Tk.)
Service Provider
Item of expenditure
Con
sulta
tion
fee/
char
ge
Med
icin
e
Lab.
in
vest
igat
ion
Tran
s-
port
Hos
t. B
ed
fee/
char
ge
Food
for
Patie
nt
Ope
ratio
n ch
arge
Uns
peci
fied
expe
nditu
re
Oth
ers
All
(ave
rage
) co
st
Medical College Hospital 2.0 125.0 700.0 3000.0 -- -- -- -- -- 3827.0 Specialized Hospital 40.0 760.0 100.0 350.0 -- -- -- -- 25.0 1275.0 District Hospital 153.3 2083.3 700.0 176.7 -- 250.0 20.8 33.3 183.3 3600.8 Upazila Health Complex 2.5 825.4 94.1 58.8 1.5 126.5 88.2 8.8 7.9 1213.8 Union Health and Family welfare Centre/Sub centre/ Rural Dispensary 4.3 57.1 -- 1.4 -- -- -- -- -- 62.9
Maternal and Child Welfare Centre -- -- -- -- -- -- -- -- -- -- Average (Public facilities) 22.4 852.2 166.0 135.4 1.0 116.0 62.5 10.0 28.4 1393.8 Private Clinic/Hospital 617.3 2697.1 609.5 319.4 193.5 129.0 403.2 2.3 44.5 5015.9 Doctor in NGO -- -- -- -- -- -- -- -- -- -- NGO health worker -- -- -- -- -- -- -- -- -- -- Practitioner (with formal degree) 120.8 1379.6 255.8 59.4 -- -- 1.9 -- 5.8 1823.3 Informal Private Practitioner (modern medicine, without degree)
27.1 406.2 2.3 6.8 -- 3.0 -- -- -- 445.5
Homeopathic practitioner 1.7 158.3 -- 10.5 -- -- -- -- -- 170.5 Self treatment/pharmacy 6.4 209.0 -- 8.6 -- -- 4.5 0.9 3.6 233.1 Average (Private facilities) 144.6 923.1 152.9 73.3 35.7 25.0 75.6 0.6 9.8 1440.7 Others -- -- -- -- -- -- -- -- -- -- All (average) cost (public and private) 116.6 906.9 155.9 87.5 27.8 45.9 72.6 2.8 14.1 1429.9
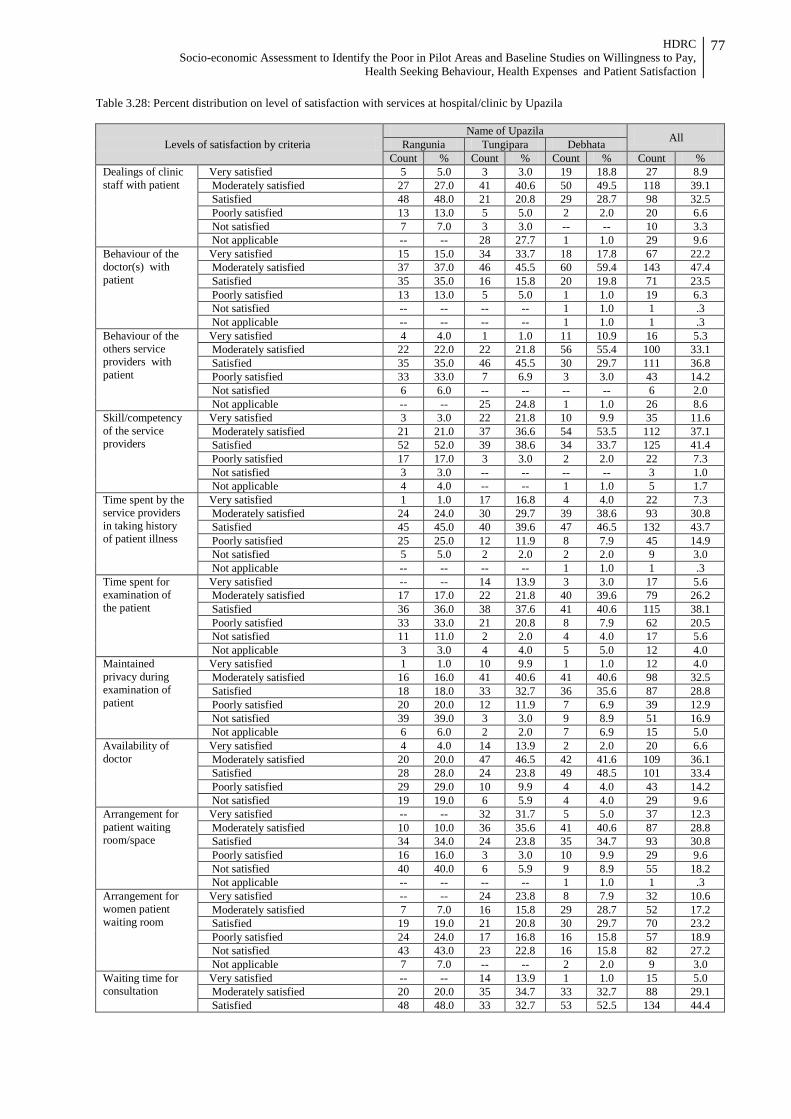
HDRC Socio-economic Assessment to Identify the Poor in Pilot Areas and Baseline Studies on Willingness to Pay,
Health Seeking Behaviour, Health Expenses and Patient Satisfaction
77
Table 3.28: Percent distribution on level of satisfaction with services at hospital/clinic by Upazila
Levels of satisfaction by criteria Name of Upazila All Rangunia Tungipara Debhata
Count % Count % Count % Count % Dealings of clinic staff with patient
Very satisfied 5 5.0 3 3.0 19 18.8 27 8.9 Moderately satisfied 27 27.0 41 40.6 50 49.5 118 39.1 Satisfied 48 48.0 21 20.8 29 28.7 98 32.5 Poorly satisfied 13 13.0 5 5.0 2 2.0 20 6.6 Not satisfied 7 7.0 3 3.0 -- -- 10 3.3 Not applicable -- -- 28 27.7 1 1.0 29 9.6
Behaviour of the doctor(s) with patient
Very satisfied 15 15.0 34 33.7 18 17.8 67 22.2 Moderately satisfied 37 37.0 46 45.5 60 59.4 143 47.4 Satisfied 35 35.0 16 15.8 20 19.8 71 23.5 Poorly satisfied 13 13.0 5 5.0 1 1.0 19 6.3 Not satisfied -- -- -- -- 1 1.0 1 .3 Not applicable -- -- -- -- 1 1.0 1 .3
Behaviour of the others service providers with patient
Very satisfied 4 4.0 1 1.0 11 10.9 16 5.3 Moderately satisfied 22 22.0 22 21.8 56 55.4 100 33.1 Satisfied 35 35.0 46 45.5 30 29.7 111 36.8 Poorly satisfied 33 33.0 7 6.9 3 3.0 43 14.2 Not satisfied 6 6.0 -- -- -- -- 6 2.0 Not applicable -- -- 25 24.8 1 1.0 26 8.6
Skill/competency of the service providers
Very satisfied 3 3.0 22 21.8 10 9.9 35 11.6 Moderately satisfied 21 21.0 37 36.6 54 53.5 112 37.1 Satisfied 52 52.0 39 38.6 34 33.7 125 41.4 Poorly satisfied 17 17.0 3 3.0 2 2.0 22 7.3 Not satisfied 3 3.0 -- -- -- -- 3 1.0 Not applicable 4 4.0 -- -- 1 1.0 5 1.7
Time spent by the service providers in taking history of patient illness
Very satisfied 1 1.0 17 16.8 4 4.0 22 7.3 Moderately satisfied 24 24.0 30 29.7 39 38.6 93 30.8 Satisfied 45 45.0 40 39.6 47 46.5 132 43.7 Poorly satisfied 25 25.0 12 11.9 8 7.9 45 14.9 Not satisfied 5 5.0 2 2.0 2 2.0 9 3.0 Not applicable -- -- -- -- 1 1.0 1 .3
Time spent for examination of the patient
Very satisfied -- -- 14 13.9 3 3.0 17 5.6 Moderately satisfied 17 17.0 22 21.8 40 39.6 79 26.2 Satisfied 36 36.0 38 37.6 41 40.6 115 38.1 Poorly satisfied 33 33.0 21 20.8 8 7.9 62 20.5 Not satisfied 11 11.0 2 2.0 4 4.0 17 5.6 Not applicable 3 3.0 4 4.0 5 5.0 12 4.0
Maintained privacy during examination of patient
Very satisfied 1 1.0 10 9.9 1 1.0 12 4.0 Moderately satisfied 16 16.0 41 40.6 41 40.6 98 32.5 Satisfied 18 18.0 33 32.7 36 35.6 87 28.8 Poorly satisfied 20 20.0 12 11.9 7 6.9 39 12.9 Not satisfied 39 39.0 3 3.0 9 8.9 51 16.9 Not applicable 6 6.0 2 2.0 7 6.9 15 5.0
Availability of doctor
Very satisfied 4 4.0 14 13.9 2 2.0 20 6.6 Moderately satisfied 20 20.0 47 46.5 42 41.6 109 36.1 Satisfied 28 28.0 24 23.8 49 48.5 101 33.4 Poorly satisfied 29 29.0 10 9.9 4 4.0 43 14.2 Not satisfied 19 19.0 6 5.9 4 4.0 29 9.6
Arrangement for patient waiting room/space
Very satisfied -- -- 32 31.7 5 5.0 37 12.3 Moderately satisfied 10 10.0 36 35.6 41 40.6 87 28.8 Satisfied 34 34.0 24 23.8 35 34.7 93 30.8 Poorly satisfied 16 16.0 3 3.0 10 9.9 29 9.6 Not satisfied 40 40.0 6 5.9 9 8.9 55 18.2 Not applicable -- -- -- -- 1 1.0 1 .3
Arrangement for women patient waiting room
Very satisfied -- -- 24 23.8 8 7.9 32 10.6 Moderately satisfied 7 7.0 16 15.8 29 28.7 52 17.2 Satisfied 19 19.0 21 20.8 30 29.7 70 23.2 Poorly satisfied 24 24.0 17 16.8 16 15.8 57 18.9 Not satisfied 43 43.0 23 22.8 16 15.8 82 27.2 Not applicable 7 7.0 -- -- 2 2.0 9 3.0
Waiting time for consultation
Very satisfied -- -- 14 13.9 1 1.0 15 5.0 Moderately satisfied 20 20.0 35 34.7 33 32.7 88 29.1 Satisfied 48 48.0 33 32.7 53 52.5 134 44.4
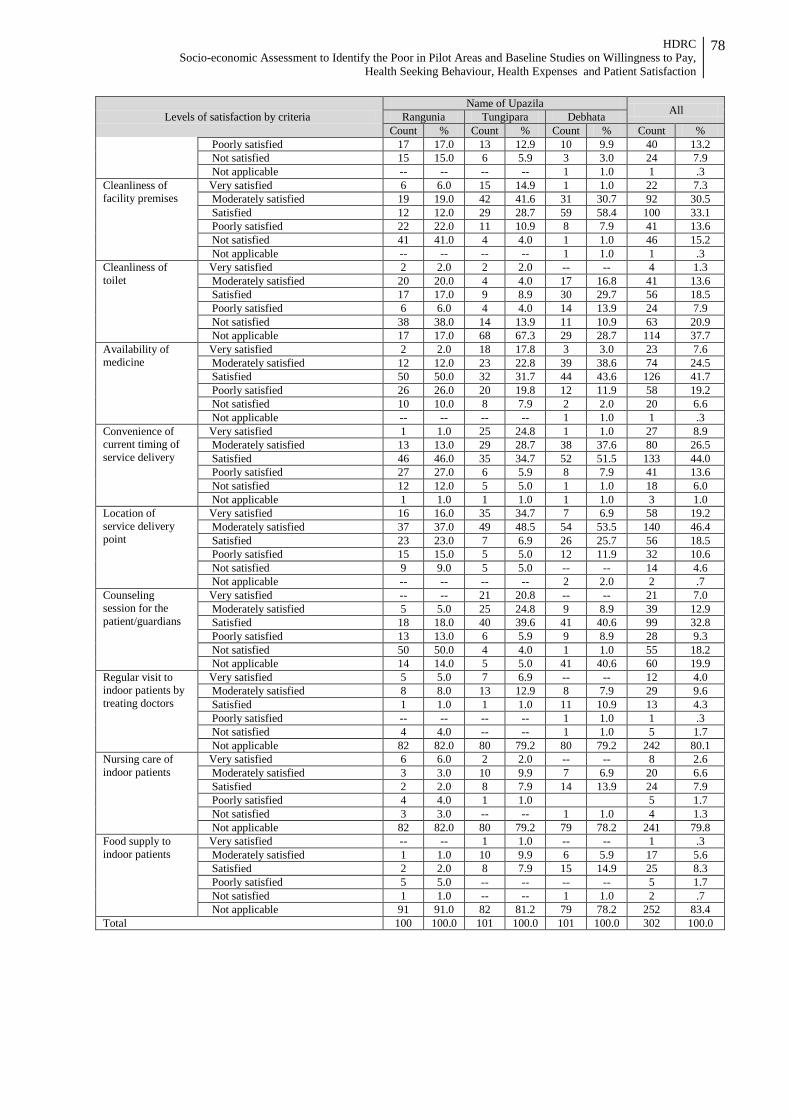
HDRC Socio-economic Assessment to Identify the Poor in Pilot Areas and Baseline Studies on Willingness to Pay,
Health Seeking Behaviour, Health Expenses and Patient Satisfaction
78
Levels of satisfaction by criteria Name of Upazila All Rangunia Tungipara Debhata
Count % Count % Count % Count % Poorly satisfied 17 17.0 13 12.9 10 9.9 40 13.2 Not satisfied 15 15.0 6 5.9 3 3.0 24 7.9 Not applicable -- -- -- -- 1 1.0 1 .3
Cleanliness of facility premises
Very satisfied 6 6.0 15 14.9 1 1.0 22 7.3 Moderately satisfied 19 19.0 42 41.6 31 30.7 92 30.5 Satisfied 12 12.0 29 28.7 59 58.4 100 33.1 Poorly satisfied 22 22.0 11 10.9 8 7.9 41 13.6 Not satisfied 41 41.0 4 4.0 1 1.0 46 15.2 Not applicable -- -- -- -- 1 1.0 1 .3
Cleanliness of toilet
Very satisfied 2 2.0 2 2.0 -- -- 4 1.3 Moderately satisfied 20 20.0 4 4.0 17 16.8 41 13.6 Satisfied 17 17.0 9 8.9 30 29.7 56 18.5 Poorly satisfied 6 6.0 4 4.0 14 13.9 24 7.9 Not satisfied 38 38.0 14 13.9 11 10.9 63 20.9 Not applicable 17 17.0 68 67.3 29 28.7 114 37.7
Availability of medicine
Very satisfied 2 2.0 18 17.8 3 3.0 23 7.6 Moderately satisfied 12 12.0 23 22.8 39 38.6 74 24.5 Satisfied 50 50.0 32 31.7 44 43.6 126 41.7 Poorly satisfied 26 26.0 20 19.8 12 11.9 58 19.2 Not satisfied 10 10.0 8 7.9 2 2.0 20 6.6 Not applicable -- -- -- -- 1 1.0 1 .3
Convenience of current timing of service delivery
Very satisfied 1 1.0 25 24.8 1 1.0 27 8.9 Moderately satisfied 13 13.0 29 28.7 38 37.6 80 26.5 Satisfied 46 46.0 35 34.7 52 51.5 133 44.0 Poorly satisfied 27 27.0 6 5.9 8 7.9 41 13.6 Not satisfied 12 12.0 5 5.0 1 1.0 18 6.0 Not applicable 1 1.0 1 1.0 1 1.0 3 1.0
Location of service delivery point
Very satisfied 16 16.0 35 34.7 7 6.9 58 19.2 Moderately satisfied 37 37.0 49 48.5 54 53.5 140 46.4 Satisfied 23 23.0 7 6.9 26 25.7 56 18.5 Poorly satisfied 15 15.0 5 5.0 12 11.9 32 10.6 Not satisfied 9 9.0 5 5.0 -- -- 14 4.6 Not applicable -- -- -- -- 2 2.0 2 .7
Counseling session for the patient/guardians
Very satisfied -- -- 21 20.8 -- -- 21 7.0 Moderately satisfied 5 5.0 25 24.8 9 8.9 39 12.9 Satisfied 18 18.0 40 39.6 41 40.6 99 32.8 Poorly satisfied 13 13.0 6 5.9 9 8.9 28 9.3 Not satisfied 50 50.0 4 4.0 1 1.0 55 18.2 Not applicable 14 14.0 5 5.0 41 40.6 60 19.9
Regular visit to indoor patients by treating doctors
Very satisfied 5 5.0 7 6.9 -- -- 12 4.0 Moderately satisfied 8 8.0 13 12.9 8 7.9 29 9.6 Satisfied 1 1.0 1 1.0 11 10.9 13 4.3 Poorly satisfied -- -- -- -- 1 1.0 1 .3 Not satisfied 4 4.0 -- -- 1 1.0 5 1.7 Not applicable 82 82.0 80 79.2 80 79.2 242 80.1
Nursing care of indoor patients
Very satisfied 6 6.0 2 2.0 -- -- 8 2.6 Moderately satisfied 3 3.0 10 9.9 7 6.9 20 6.6 Satisfied 2 2.0 8 7.9 14 13.9 24 7.9 Poorly satisfied 4 4.0 1 1.0 5 1.7 Not satisfied 3 3.0 -- -- 1 1.0 4 1.3 Not applicable 82 82.0 80 79.2 79 78.2 241 79.8
Food supply to indoor patients
Very satisfied -- -- 1 1.0 -- -- 1 .3 Moderately satisfied 1 1.0 10 9.9 6 5.9 17 5.6 Satisfied 2 2.0 8 7.9 15 14.9 25 8.3 Poorly satisfied 5 5.0 -- -- -- -- 5 1.7 Not satisfied 1 1.0 -- -- 1 1.0 2 .7 Not applicable 91 91.0 82 81.2 79 78.2 252 83.4
Total 100 100.0 101 100.0 101 100.0 302 100.0
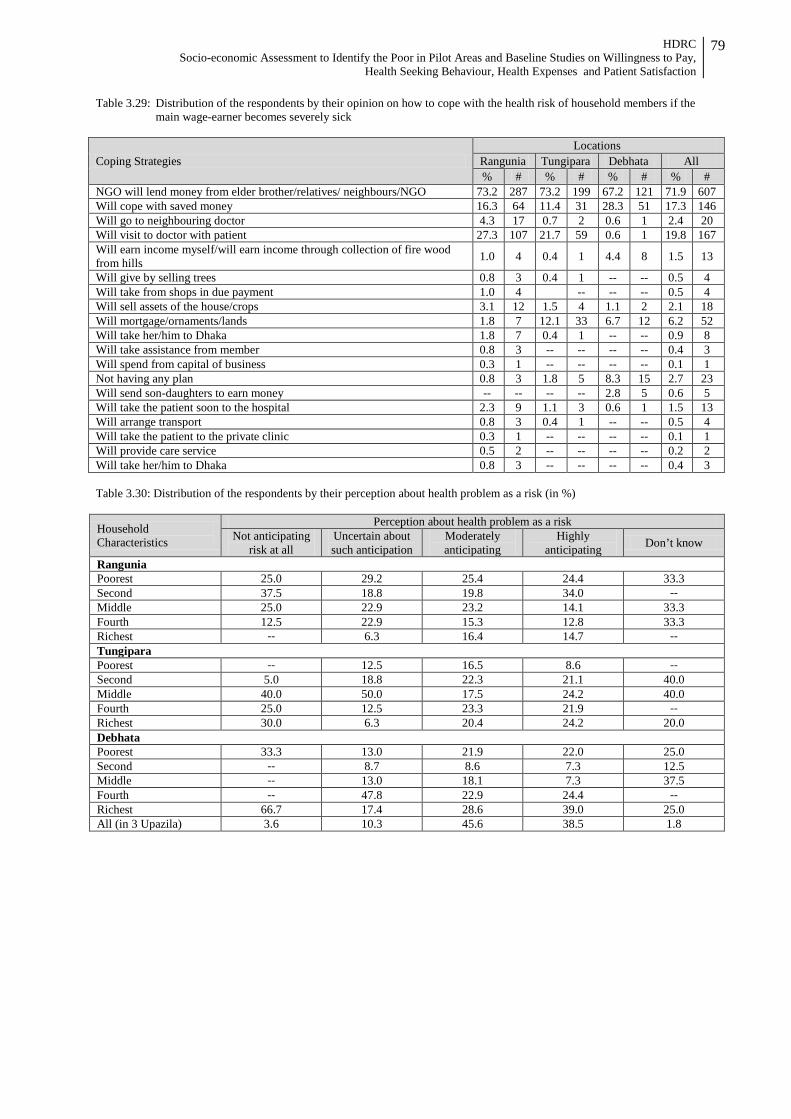
HDRC Socio-economic Assessment to Identify the Poor in Pilot Areas and Baseline Studies on Willingness to Pay,
Health Seeking Behaviour, Health Expenses and Patient Satisfaction
79
Table 3.29: Distribution of the respondents by their opinion on how to cope with the health risk of household members if the main wage-earner becomes severely sick
Coping Strategies Locations
Rangunia Tungipara Debhata All % # % # % # % #
NGO will lend money from elder brother/relatives/ neighbours/NGO 73.2 287 73.2 199 67.2 121 71.9 607 Will cope with saved money 16.3 64 11.4 31 28.3 51 17.3 146 Will go to neighbouring doctor 4.3 17 0.7 2 0.6 1 2.4 20 Will visit to doctor with patient 27.3 107 21.7 59 0.6 1 19.8 167 Will earn income myself/will earn income through collection of fire wood from hills 1.0 4 0.4 1 4.4 8 1.5 13
Will give by selling trees 0.8 3 0.4 1 -- -- 0.5 4 Will take from shops in due payment 1.0 4 -- -- -- 0.5 4 Will sell assets of the house/crops 3.1 12 1.5 4 1.1 2 2.1 18 Will mortgage/ornaments/lands 1.8 7 12.1 33 6.7 12 6.2 52 Will take her/him to Dhaka 1.8 7 0.4 1 -- -- 0.9 8 Will take assistance from member 0.8 3 -- -- -- -- 0.4 3 Will spend from capital of business 0.3 1 -- -- -- -- 0.1 1 Not having any plan 0.8 3 1.8 5 8.3 15 2.7 23 Will send son-daughters to earn money -- -- -- -- 2.8 5 0.6 5 Will take the patient soon to the hospital 2.3 9 1.1 3 0.6 1 1.5 13 Will arrange transport 0.8 3 0.4 1 -- -- 0.5 4 Will take the patient to the private clinic 0.3 1 -- -- -- -- 0.1 1 Will provide care service 0.5 2 -- -- -- -- 0.2 2 Will take her/him to Dhaka 0.8 3 -- -- -- -- 0.4 3 Table 3.30: Distribution of the respondents by their perception about health problem as a risk (in %)
Household Characteristics
Perception about health problem as a risk Not anticipating
risk at all Uncertain about such anticipation
Moderately anticipating
Highly anticipating Don’t know
Rangunia Poorest 25.0 29.2 25.4 24.4 33.3 Second 37.5 18.8 19.8 34.0 -- Middle 25.0 22.9 23.2 14.1 33.3 Fourth 12.5 22.9 15.3 12.8 33.3 Richest -- 6.3 16.4 14.7 -- Tungipara Poorest -- 12.5 16.5 8.6 -- Second 5.0 18.8 22.3 21.1 40.0 Middle 40.0 50.0 17.5 24.2 40.0 Fourth 25.0 12.5 23.3 21.9 -- Richest 30.0 6.3 20.4 24.2 20.0 Debhata Poorest 33.3 13.0 21.9 22.0 25.0 Second -- 8.7 8.6 7.3 12.5 Middle -- 13.0 18.1 7.3 37.5 Fourth -- 47.8 22.9 24.4 -- Richest 66.7 17.4 28.6 39.0 25.0 All (in 3 Upazila) 3.6 10.3 45.6 38.5 1.8
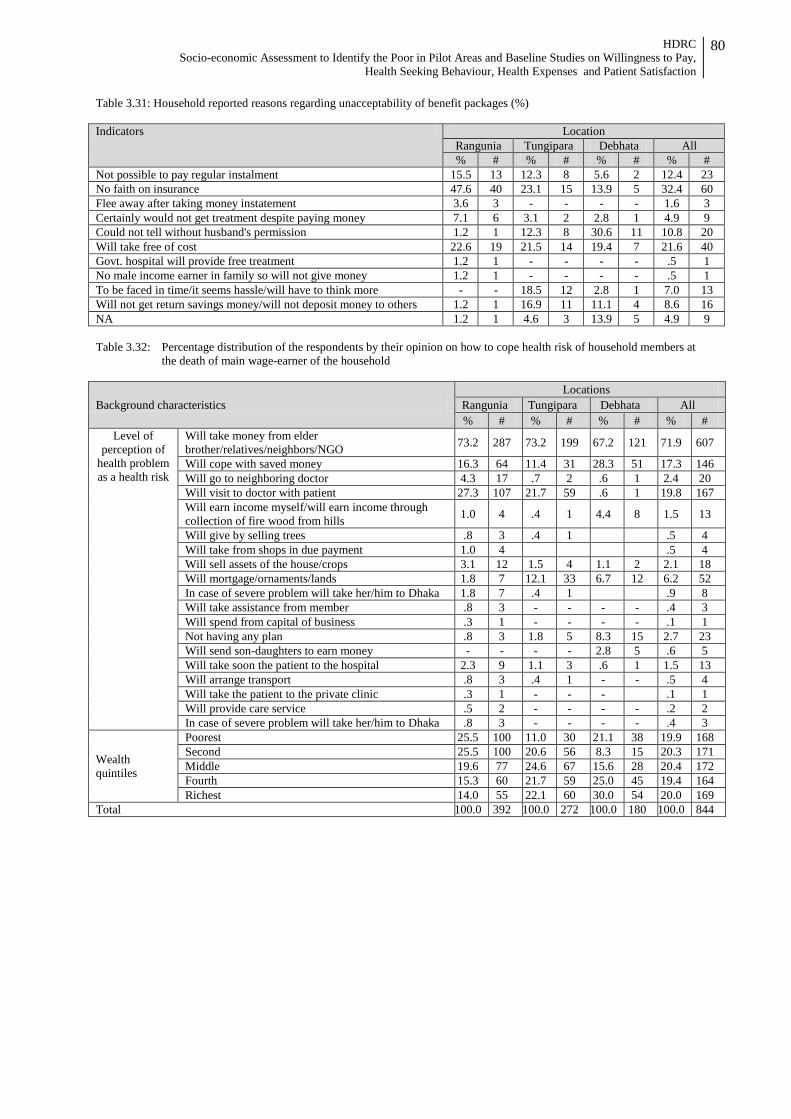
HDRC Socio-economic Assessment to Identify the Poor in Pilot Areas and Baseline Studies on Willingness to Pay,
Health Seeking Behaviour, Health Expenses and Patient Satisfaction
80
Table 3.31: Household reported reasons regarding unacceptability of benefit packages (%) Indicators Location
Rangunia Tungipara Debhata All % # % # % # % #
Not possible to pay regular instalment 15.5 13 12.3 8 5.6 2 12.4 23 No faith on insurance 47.6 40 23.1 15 13.9 5 32.4 60 Flee away after taking money instatement 3.6 3 - - - - 1.6 3 Certainly would not get treatment despite paying money 7.1 6 3.1 2 2.8 1 4.9 9 Could not tell without husband's permission 1.2 1 12.3 8 30.6 11 10.8 20 Will take free of cost 22.6 19 21.5 14 19.4 7 21.6 40 Govt. hospital will provide free treatment 1.2 1 - - - - .5 1 No male income earner in family so will not give money 1.2 1 - - - - .5 1 To be faced in time/it seems hassle/will have to think more - - 18.5 12 2.8 1 7.0 13 Will not get return savings money/will not deposit money to others 1.2 1 16.9 11 11.1 4 8.6 16 NA 1.2 1 4.6 3 13.9 5 4.9 9 Table 3.32: Percentage distribution of the respondents by their opinion on how to cope health risk of household members at
the death of main wage-earner of the household
Background characteristics Locations
Rangunia Tungipara Debhata All % # % # % # % #
Level of perception of
health problem as a health risk
Will take money from elder brother/relatives/neighbors/NGO 73.2 287 73.2 199 67.2 121 71.9 607
Will cope with saved money 16.3 64 11.4 31 28.3 51 17.3 146 Will go to neighboring doctor 4.3 17 .7 2 .6 1 2.4 20 Will visit to doctor with patient 27.3 107 21.7 59 .6 1 19.8 167 Will earn income myself/will earn income through collection of fire wood from hills 1.0 4 .4 1 4.4 8 1.5 13
Will give by selling trees .8 3 .4 1 .5 4 Will take from shops in due payment 1.0 4 .5 4 Will sell assets of the house/crops 3.1 12 1.5 4 1.1 2 2.1 18 Will mortgage/ornaments/lands 1.8 7 12.1 33 6.7 12 6.2 52 In case of severe problem will take her/him to Dhaka 1.8 7 .4 1 .9 8 Will take assistance from member .8 3 - - - - .4 3 Will spend from capital of business .3 1 - - - - .1 1 Not having any plan .8 3 1.8 5 8.3 15 2.7 23 Will send son-daughters to earn money - - - - 2.8 5 .6 5 Will take soon the patient to the hospital 2.3 9 1.1 3 .6 1 1.5 13 Will arrange transport .8 3 .4 1 - - .5 4 Will take the patient to the private clinic .3 1 - - - .1 1 Will provide care service .5 2 - - - - .2 2 In case of severe problem will take her/him to Dhaka .8 3 - - - - .4 3
Wealth quintiles
Poorest 25.5 100 11.0 30 21.1 38 19.9 168 Second 25.5 100 20.6 56 8.3 15 20.3 171 Middle 19.6 77 24.6 67 15.6 28 20.4 172 Fourth 15.3 60 21.7 59 25.0 45 19.4 164 Richest 14.0 55 22.1 60 30.0 54 20.0 169
Total 100.0 392 100.0 272 100.0 180 100.0 844
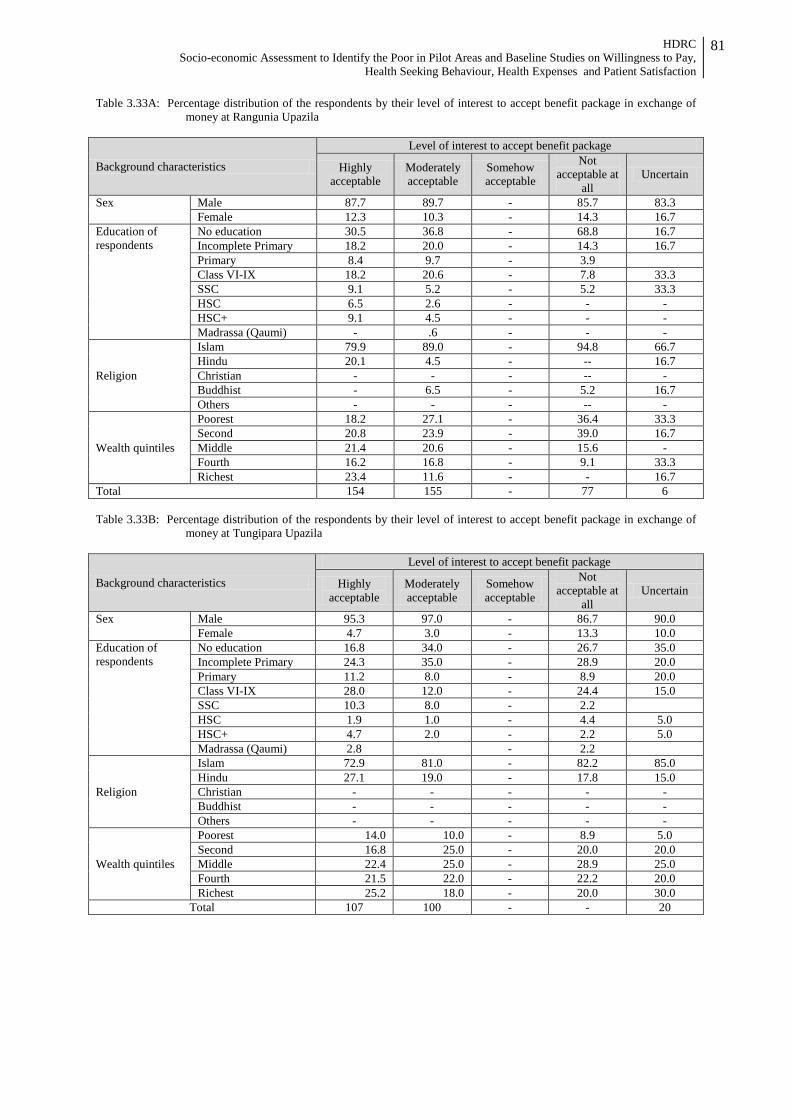
HDRC Socio-economic Assessment to Identify the Poor in Pilot Areas and Baseline Studies on Willingness to Pay,
Health Seeking Behaviour, Health Expenses and Patient Satisfaction
81
Table 3.33A: Percentage distribution of the respondents by their level of interest to accept benefit package in exchange of money at Rangunia Upazila
Background characteristics
Level of interest to accept benefit package
Highly acceptable
Moderately acceptable
Somehow acceptable
Not acceptable at
all Uncertain
Sex Male 87.7 89.7 - 85.7 83.3 Female 12.3 10.3 - 14.3 16.7
Education of respondents
No education 30.5 36.8 - 68.8 16.7 Incomplete Primary 18.2 20.0 - 14.3 16.7 Primary 8.4 9.7 - 3.9 Class VI-IX 18.2 20.6 - 7.8 33.3 SSC 9.1 5.2 - 5.2 33.3 HSC 6.5 2.6 - - - HSC+ 9.1 4.5 - - - Madrassa (Qaumi) - .6 - - -
Religion
Islam 79.9 89.0 - 94.8 66.7 Hindu 20.1 4.5 - -- 16.7 Christian - - - -- - Buddhist - 6.5 - 5.2 16.7 Others - - - -- -
Wealth quintiles
Poorest 18.2 27.1 - 36.4 33.3 Second 20.8 23.9 - 39.0 16.7 Middle 21.4 20.6 - 15.6 - Fourth 16.2 16.8 - 9.1 33.3 Richest 23.4 11.6 - - 16.7
Total 154 155 - 77 6 Table 3.33B: Percentage distribution of the respondents by their level of interest to accept benefit package in exchange of
money at Tungipara Upazila
Background characteristics
Level of interest to accept benefit package
Highly acceptable
Moderately acceptable
Somehow acceptable
Not acceptable at
all Uncertain
Sex Male 95.3 97.0 - 86.7 90.0 Female 4.7 3.0 - 13.3 10.0
Education of respondents
No education 16.8 34.0 - 26.7 35.0 Incomplete Primary 24.3 35.0 - 28.9 20.0 Primary 11.2 8.0 - 8.9 20.0 Class VI-IX 28.0 12.0 - 24.4 15.0 SSC 10.3 8.0 - 2.2 HSC 1.9 1.0 - 4.4 5.0 HSC+ 4.7 2.0 - 2.2 5.0 Madrassa (Qaumi) 2.8 - 2.2
Religion
Islam 72.9 81.0 - 82.2 85.0 Hindu 27.1 19.0 - 17.8 15.0 Christian - - - - - Buddhist - - - - - Others - - - - -
Wealth quintiles
Poorest 14.0 10.0 - 8.9 5.0 Second 16.8 25.0 - 20.0 20.0 Middle 22.4 25.0 - 28.9 25.0 Fourth 21.5 22.0 - 22.2 20.0 Richest 25.2 18.0 - 20.0 30.0
Total 107 100 - - 20
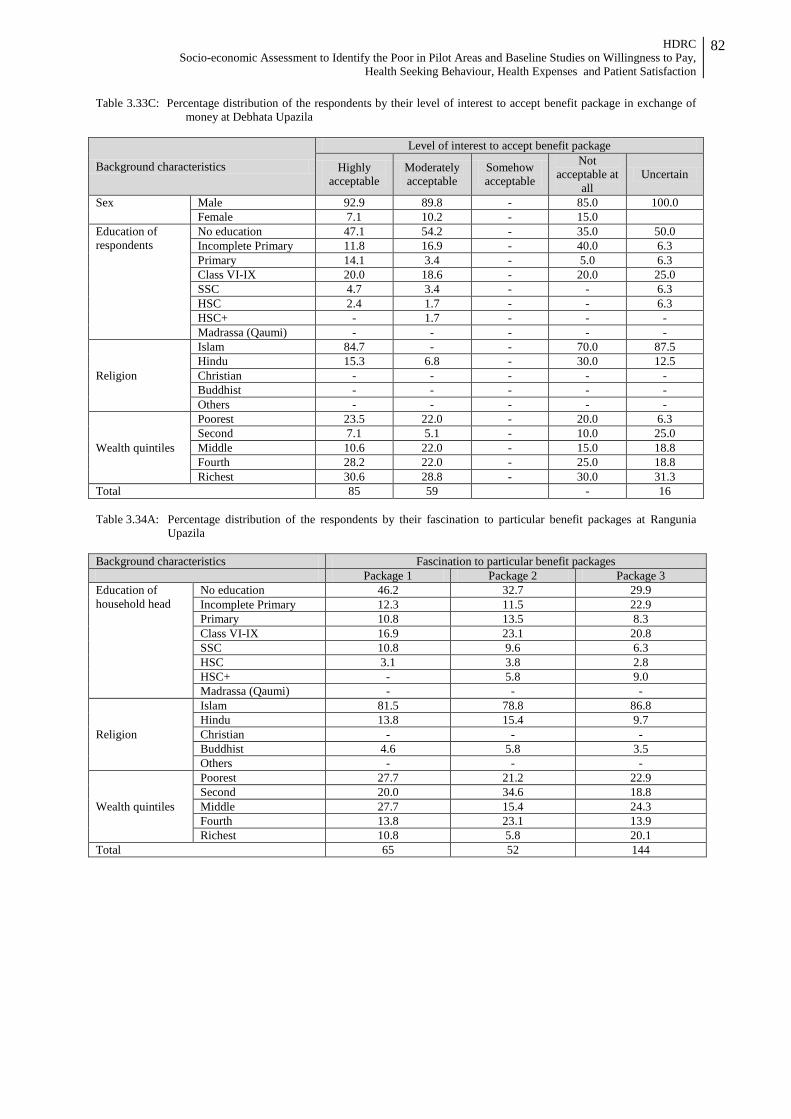
HDRC Socio-economic Assessment to Identify the Poor in Pilot Areas and Baseline Studies on Willingness to Pay,
Health Seeking Behaviour, Health Expenses and Patient Satisfaction
82
Table 3.33C: Percentage distribution of the respondents by their level of interest to accept benefit package in exchange of money at Debhata Upazila
Background characteristics
Level of interest to accept benefit package
Highly acceptable
Moderately acceptable
Somehow acceptable
Not acceptable at
all Uncertain
Sex Male 92.9 89.8 - 85.0 100.0 Female 7.1 10.2 - 15.0
Education of respondents
No education 47.1 54.2 - 35.0 50.0 Incomplete Primary 11.8 16.9 - 40.0 6.3 Primary 14.1 3.4 - 5.0 6.3 Class VI-IX 20.0 18.6 - 20.0 25.0 SSC 4.7 3.4 - - 6.3 HSC 2.4 1.7 - - 6.3 HSC+ - 1.7 - - - Madrassa (Qaumi) - - - - -
Religion
Islam 84.7 - - 70.0 87.5 Hindu 15.3 6.8 - 30.0 12.5 Christian - - - - - Buddhist - - - - - Others - - - - -
Wealth quintiles
Poorest 23.5 22.0 - 20.0 6.3 Second 7.1 5.1 - 10.0 25.0 Middle 10.6 22.0 - 15.0 18.8 Fourth 28.2 22.0 - 25.0 18.8 Richest 30.6 28.8 - 30.0 31.3
Total 85 59 - 16 Table 3.34A: Percentage distribution of the respondents by their fascination to particular benefit packages at Rangunia
Upazila Background characteristics Fascination to particular benefit packages Package 1 Package 2 Package 3 Education of household head
No education 46.2 32.7 29.9 Incomplete Primary 12.3 11.5 22.9 Primary 10.8 13.5 8.3 Class VI-IX 16.9 23.1 20.8 SSC 10.8 9.6 6.3 HSC 3.1 3.8 2.8 HSC+ - 5.8 9.0 Madrassa (Qaumi) - - -
Religion
Islam 81.5 78.8 86.8 Hindu 13.8 15.4 9.7 Christian - - - Buddhist 4.6 5.8 3.5 Others - - -
Wealth quintiles
Poorest 27.7 21.2 22.9 Second 20.0 34.6 18.8 Middle 27.7 15.4 24.3 Fourth 13.8 23.1 13.9 Richest 10.8 5.8 20.1
Total 65 52 144
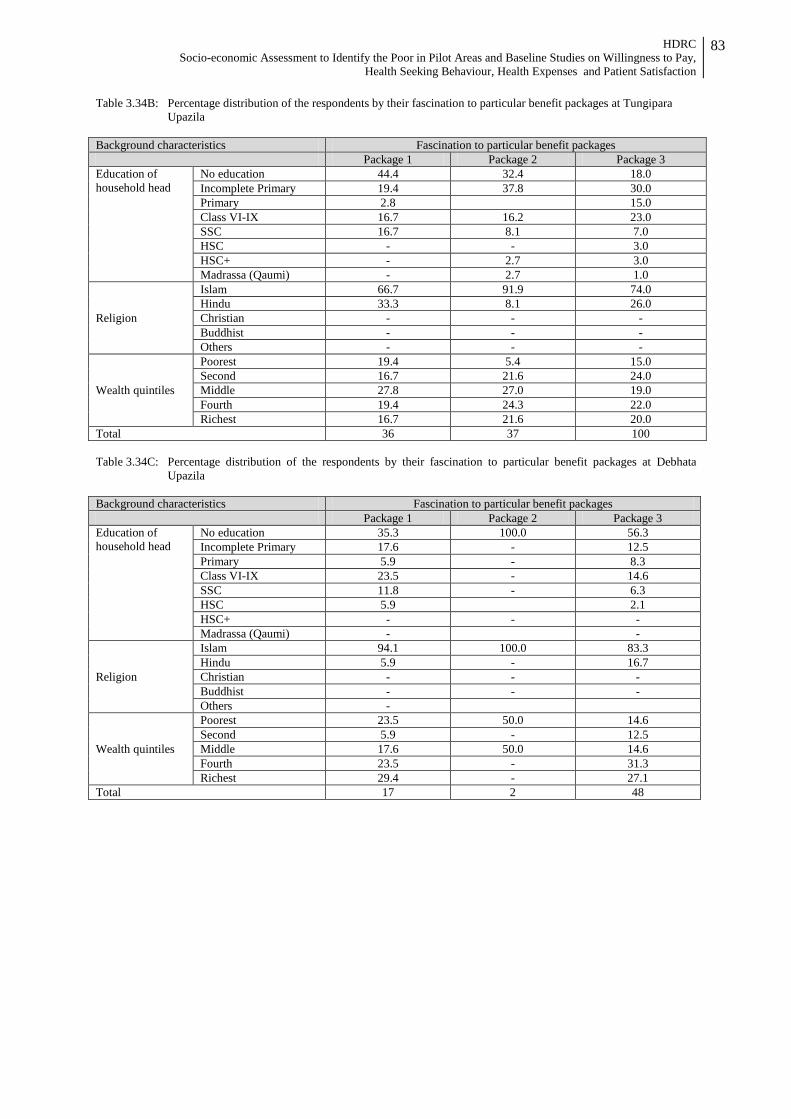
HDRC Socio-economic Assessment to Identify the Poor in Pilot Areas and Baseline Studies on Willingness to Pay,
Health Seeking Behaviour, Health Expenses and Patient Satisfaction
83
Table 3.34B: Percentage distribution of the respondents by their fascination to particular benefit packages at Tungipara Upazila
Background characteristics Fascination to particular benefit packages Package 1 Package 2 Package 3 Education of household head
No education 44.4 32.4 18.0 Incomplete Primary 19.4 37.8 30.0 Primary 2.8 15.0 Class VI-IX 16.7 16.2 23.0 SSC 16.7 8.1 7.0 HSC - - 3.0 HSC+ - 2.7 3.0 Madrassa (Qaumi) - 2.7 1.0
Religion
Islam 66.7 91.9 74.0 Hindu 33.3 8.1 26.0 Christian - - - Buddhist - - - Others - - -
Wealth quintiles
Poorest 19.4 5.4 15.0 Second 16.7 21.6 24.0 Middle 27.8 27.0 19.0 Fourth 19.4 24.3 22.0 Richest 16.7 21.6 20.0
Total 36 37 100
Table 3.34C: Percentage distribution of the respondents by their fascination to particular benefit packages at Debhata Upazila
Background characteristics Fascination to particular benefit packages Package 1 Package 2 Package 3 Education of household head
No education 35.3 100.0 56.3 Incomplete Primary 17.6 - 12.5 Primary 5.9 - 8.3 Class VI-IX 23.5 - 14.6 SSC 11.8 - 6.3 HSC 5.9 2.1 HSC+ - - - Madrassa (Qaumi) - -
Religion
Islam 94.1 100.0 83.3 Hindu 5.9 - 16.7 Christian - - - Buddhist - - - Others -
Wealth quintiles
Poorest 23.5 50.0 14.6 Second 5.9 - 12.5 Middle 17.6 50.0 14.6 Fourth 23.5 - 31.3 Richest 29.4 - 27.1
Total 17 2 48
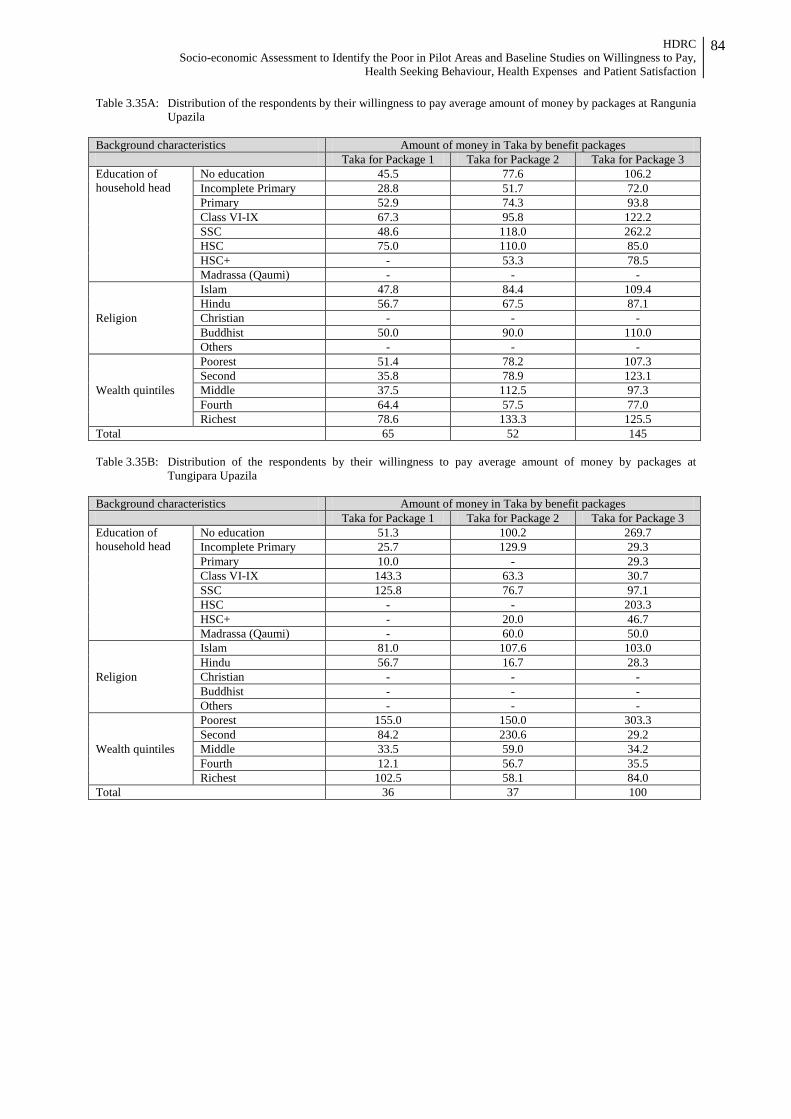
HDRC Socio-economic Assessment to Identify the Poor in Pilot Areas and Baseline Studies on Willingness to Pay,
Health Seeking Behaviour, Health Expenses and Patient Satisfaction
84
Table 3.35A: Distribution of the respondents by their willingness to pay average amount of money by packages at Rangunia Upazila
Background characteristics Amount of money in Taka by benefit packages Taka for Package 1 Taka for Package 2 Taka for Package 3 Education of household head
No education 45.5 77.6 106.2 Incomplete Primary 28.8 51.7 72.0 Primary 52.9 74.3 93.8 Class VI-IX 67.3 95.8 122.2 SSC 48.6 118.0 262.2 HSC 75.0 110.0 85.0 HSC+ - 53.3 78.5 Madrassa (Qaumi) - - -
Religion
Islam 47.8 84.4 109.4 Hindu 56.7 67.5 87.1 Christian - - - Buddhist 50.0 90.0 110.0 Others - - -
Wealth quintiles
Poorest 51.4 78.2 107.3 Second 35.8 78.9 123.1 Middle 37.5 112.5 97.3 Fourth 64.4 57.5 77.0 Richest 78.6 133.3 125.5
Total 65 52 145 Table 3.35B: Distribution of the respondents by their willingness to pay average amount of money by packages at
Tungipara Upazila Background characteristics Amount of money in Taka by benefit packages Taka for Package 1 Taka for Package 2 Taka for Package 3 Education of household head
No education 51.3 100.2 269.7 Incomplete Primary 25.7 129.9 29.3 Primary 10.0 - 29.3 Class VI-IX 143.3 63.3 30.7 SSC 125.8 76.7 97.1 HSC - - 203.3 HSC+ - 20.0 46.7 Madrassa (Qaumi) - 60.0 50.0
Religion
Islam 81.0 107.6 103.0 Hindu 56.7 16.7 28.3 Christian - - - Buddhist - - - Others - - -
Wealth quintiles
Poorest 155.0 150.0 303.3 Second 84.2 230.6 29.2 Middle 33.5 59.0 34.2 Fourth 12.1 56.7 35.5 Richest 102.5 58.1 84.0
Total 36 37 100
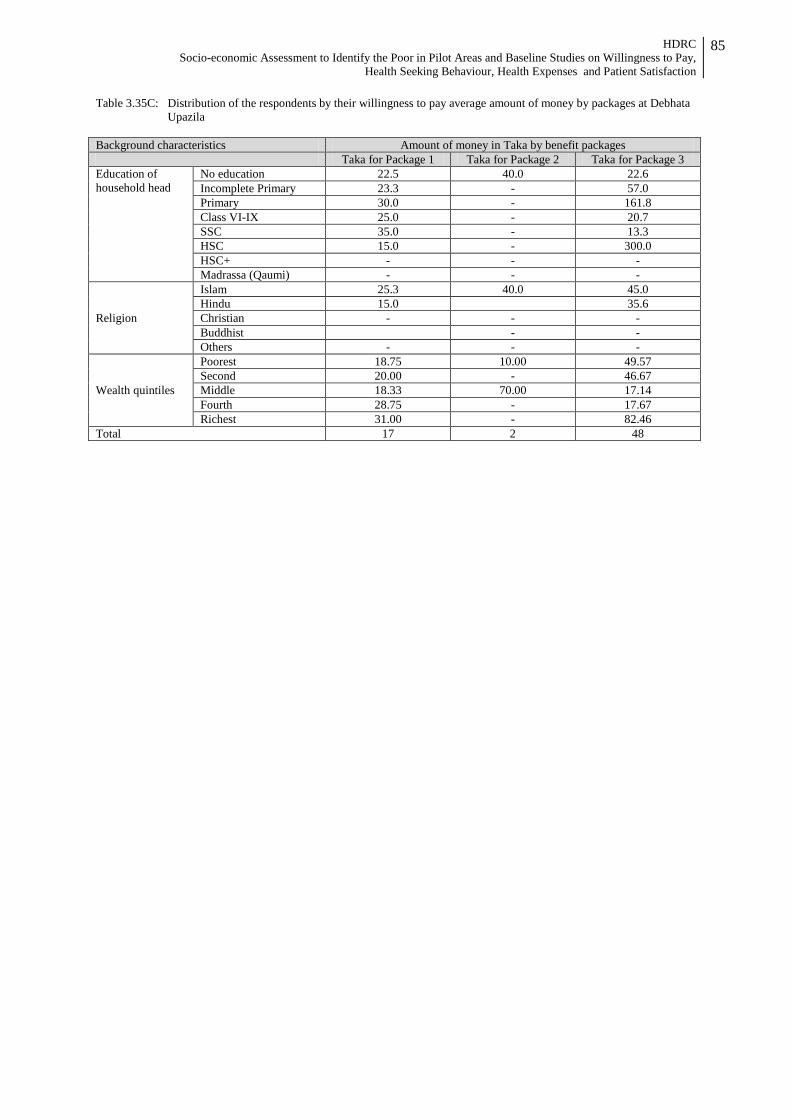
HDRC Socio-economic Assessment to Identify the Poor in Pilot Areas and Baseline Studies on Willingness to Pay,
Health Seeking Behaviour, Health Expenses and Patient Satisfaction
85
Table 3.35C: Distribution of the respondents by their willingness to pay average amount of money by packages at Debhata Upazila
Background characteristics Amount of money in Taka by benefit packages Taka for Package 1 Taka for Package 2 Taka for Package 3 Education of household head
No education 22.5 40.0 22.6 Incomplete Primary 23.3 - 57.0 Primary 30.0 - 161.8 Class VI-IX 25.0 - 20.7 SSC 35.0 - 13.3 HSC 15.0 - 300.0 HSC+ - - - Madrassa (Qaumi) - - -
Religion
Islam 25.3 40.0 45.0 Hindu 15.0 35.6 Christian - - - Buddhist - - Others - - -
Wealth quintiles
Poorest 18.75 10.00 49.57 Second 20.00 - 46.67 Middle 18.33 70.00 17.14 Fourth 28.75 - 17.67 Richest 31.00 - 82.46
Total 17 2 48
HDRC Socio-economic Assessment to Identify the Poor in Pilot Areas and Baseline Studies on Willingness to Pay,
Health Seeking Behaviour, Health Expenses and Patient Satisfaction
86
Annex-2 Data Collection Instruments
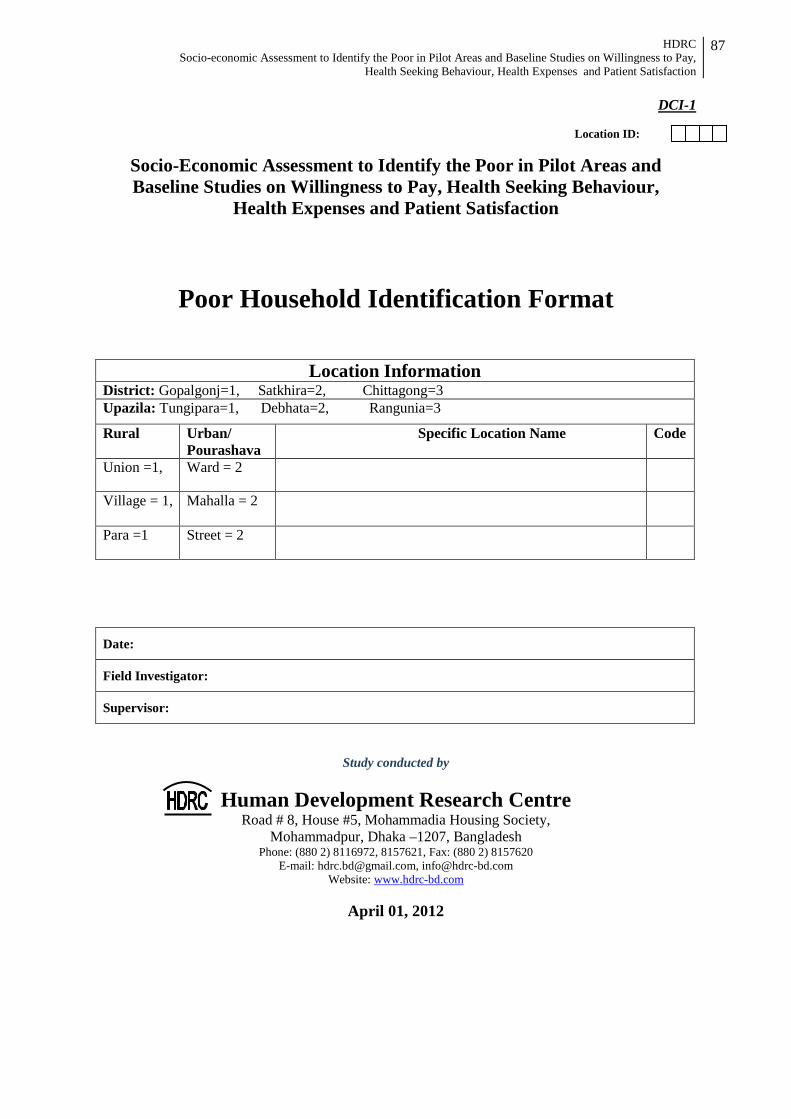
HDRC Socio-economic Assessment to Identify the Poor in Pilot Areas and Baseline Studies on Willingness to Pay,
Health Seeking Behaviour, Health Expenses and Patient Satisfaction
87
DCI-1 Location ID:
Socio-Economic Assessment to Identify the Poor in Pilot Areas and Baseline Studies on Willingness to Pay, Health Seeking Behaviour,
Health Expenses and Patient Satisfaction
Poor Household Identification Format
Location Information District: Gopalgonj=1, Satkhira=2, Chittagong=3 Upazila: Tungipara=1, Debhata=2, Rangunia=3
Rural Urban/ Pourashava
Specific Location Name Code
Union =1, Ward = 2
Village = 1,
Mahalla = 2
Para =1 Street = 2
Date:
Field Investigator:
Supervisor:
Study conducted by
Human Development Research Centre Road # 8, House #5, Mohammadia Housing Society,
Mohammadpur, Dhaka –1207, Bangladesh Phone: (880 2) 8116972, 8157621, Fax: (880 2) 8157620
E-mail: [email protected], [email protected] Website: www.hdrc-bd.com
April 01, 2012
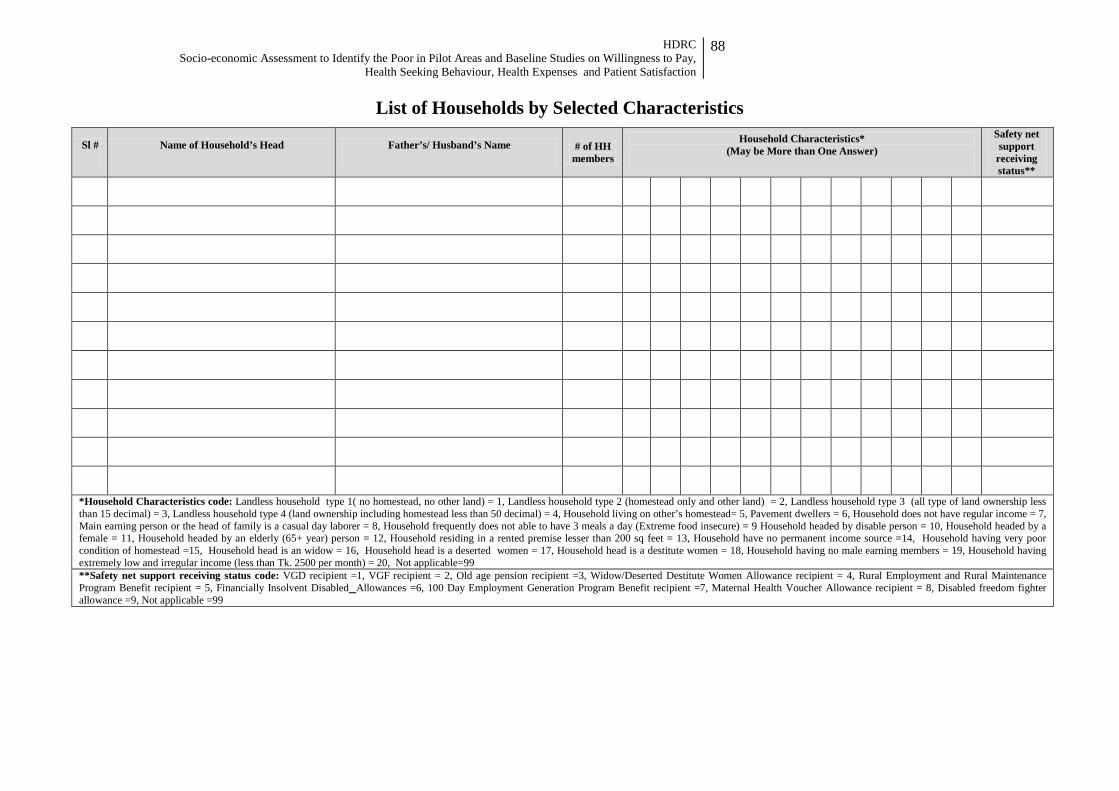
HDRC Socio-economic Assessment to Identify the Poor in Pilot Areas and Baseline Studies on Willingness to Pay,
Health Seeking Behaviour, Health Expenses and Patient Satisfaction
88
List of Households by Selected Characteristics
Sl # Name of Household’s Head Father’s/ Husband’s Name # of HH members
Household Characteristics* (May be More than One Answer)
Safety net support
receiving status**
*Household Characteristics code: Landless household type 1( no homestead, no other land) = 1, Landless household type 2 (homestead only and other land) = 2, Landless household type 3 (all type of land ownership less than 15 decimal) = 3, Landless household type 4 (land ownership including homestead less than 50 decimal) = 4, Household living on other’s homestead= 5, Pavement dwellers = 6, Household does not have regular income = 7, Main earning person or the head of family is a casual day laborer = 8, Household frequently does not able to have 3 meals a day (Extreme food insecure) = 9 Household headed by disable person = 10, Household headed by a female = 11, Household headed by an elderly (65+ year) person = 12, Household residing in a rented premise lesser than 200 sq feet = 13, Household have no permanent income source =14, Household having very poor condition of homestead =15, Household head is an widow = 16, Household head is a deserted women = 17, Household head is a destitute women = 18, Household having no male earning members = 19, Household having extremely low and irregular income (less than Tk. 2500 per month) = 20, Not applicable=99 **Safety net support receiving status code: VGD recipient =1, VGF recipient = 2, Old age pension recipient =3, Widow/Deserted Destitute Women Allowance recipient = 4, Rural Employment and Rural Maintenance Program Benefit recipient = 5, Financially Insolvent Disabled Allowances =6, 100 Day Employment Generation Program Benefit recipient =7, Maternal Health Voucher Allowance recipient = 8, Disabled freedom fighter allowance =9, Not applicable =99
HDRC Socio-economic Assessment to Identify the Poor in Pilot Areas and Baseline Studies on Willingness to Pay,
Health Seeking Behaviour, Health Expenses and Patient Satisfaction
89
Socio-Economic Assessment to Identify the Poor in Pilot Areas and Baseline Studies on Willingness to Pay, Health Seeking Behavior,
Health Expenses and Patient Satisfaction
Household Interview Schedule
Location Information
Name of the Respondent.................................................................................. District Chittagong= 1, Gopalgonj = 2, Satkhira = 3
Upazila Rangunia = 1, Tungipara = 2, Debhata = 3
Union/ Ward Village/ Mahallah
Name of the Enumerator ............................................. Date ........./04/ 2012
Supervisor .............................................
Date ........./04/ 2012
Quality Control Officer .............................................
Date ........./04/ 2012
Start of Interview End of Interview
Hour Minute Hour Minute
Study conducted by
Human Development Research Centre Road # 8, House #5, Mohammadia Housing Society,
Mohammadpur, Dhaka –1207, Bangladesh Phone: (880 2) 8116972, 8157621, Fax: (880 2) 8157620
E-mail: [email protected], [email protected] Website: www.hdrc-bd.com
April, 2012
DCI - 2
Sample ID
Pourashava = 1, Union = 2
Interviewer: Introduce yourself to the respondent. Then tell the main purpose you are there. Take his/her permission before start of interview or to ask question. Don’t forget to thank the respondent both at the start and end of interview.
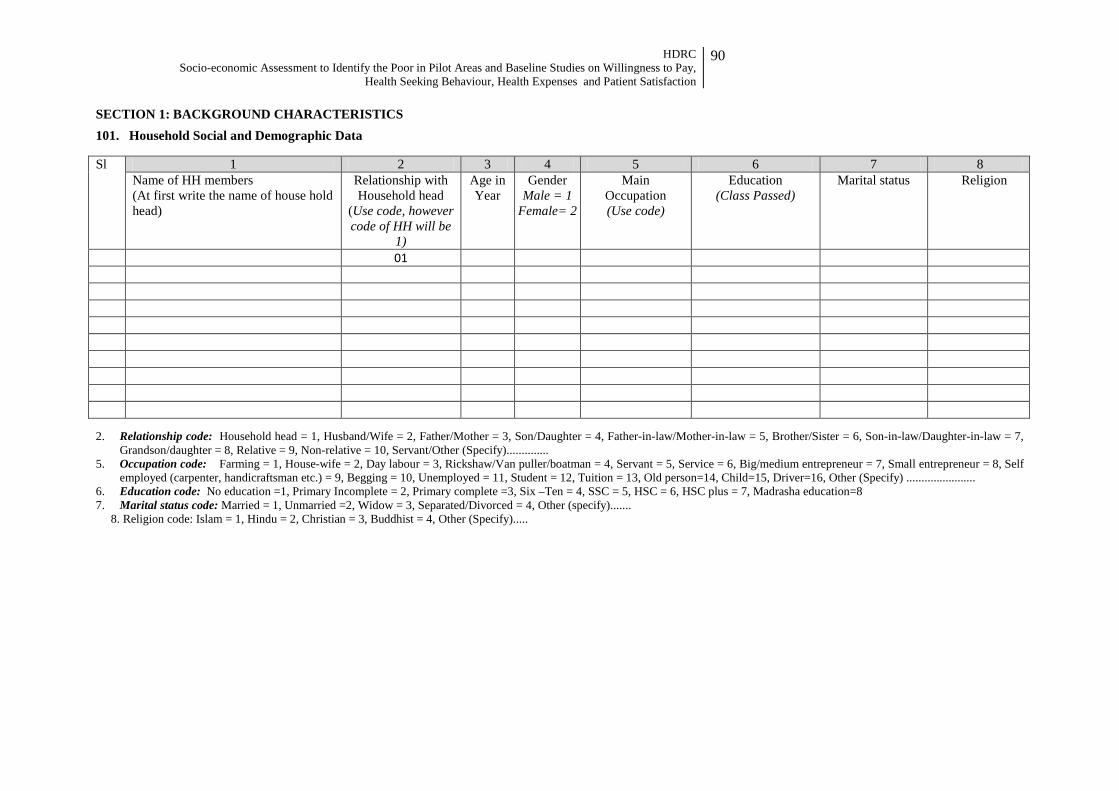
HDRC Socio-economic Assessment to Identify the Poor in Pilot Areas and Baseline Studies on Willingness to Pay,
Health Seeking Behaviour, Health Expenses and Patient Satisfaction
90
SECTION 1: BACKGROUND CHARACTERISTICS
101. Household Social and Demographic Data Sl 1 2 3 4 5 6 7 8
Name of HH members (At first write the name of house hold head)
Relationship with Household head
(Use code, however code of HH will be
1)
Age in Year
Gender Male = 1
Female= 2
Main Occupation (Use code)
Education (Class Passed)
Marital status
Religion
01 2. Relationship code: Household head = 1, Husband/Wife = 2, Father/Mother = 3, Son/Daughter = 4, Father-in-law/Mother-in-law = 5, Brother/Sister = 6, Son-in-law/Daughter-in-law = 7,
Grandson/daughter = 8, Relative = 9, Non-relative = 10, Servant/Other (Specify).............. 5. Occupation code: Farming = 1, House-wife = 2, Day labour = 3, Rickshaw/Van puller/boatman = 4, Servant = 5, Service = 6, Big/medium entrepreneur = 7, Small entrepreneur = 8, Self
employed (carpenter, handicraftsman etc.) = 9, Begging = 10, Unemployed = 11, Student = 12, Tuition = 13, Old person=14, Child=15, Driver=16, Other (Specify) ....................... 6. Education code: No education =1, Primary Incomplete = 2, Primary complete =3, Six –Ten = 4, SSC = 5, HSC = 6, HSC plus = 7, Madrasha education=8 7. Marital status code: Married = 1, Unmarried =2, Widow = 3, Separated/Divorced = 4, Other (specify)....... 8. Religion code: Islam = 1, Hindu = 2, Christian = 3, Buddhist = 4, Other (Specify).....

HDRC Socio-economic Assessment to Identify the Poor in Pilot Areas and Baseline Studies on Willingness to Pay,
Health Seeking Behaviour, Health Expenses and Patient Satisfaction
91
SECTION 2: HOUSING CHARACTERISTICS 201. Do you live in your own dwelling house? Yes = 1, No = 2
202. How many room are there in the household you use for sleeping? ......................number 203. Housing condition (Construction material of wall, floor and roof) (Encircle the right answer)
1 Main material of the roof Concrete = 1, Tin = 2, Tali = 3, Wood = 4, Bamboo = 5, Thatch / jute stick/Palm leaf = 6, Banboo/Polythine = 7, Other (Specify) ................................
2 Main material of the floor Earth/Sand = 1, Wood planks = 2, Palm log/Bamboo = 3, Polished wood = 4, Ceramic tiles/Mosaic = 5, Cement/Brick = 6, Other (Specify) ...............................
3 Main material of the wall Brick = 1, Tin = 2, Earth = 3, Bamboo = 4, Straw/ jute stick/ leaf = 5, Bamboo/Polythine = 6, Wood log = 7, Other (Specify) ...........................................
SECTION 3: POSSESSION OF MATERIALS/ASSETS 301. Do your household have the followings Yes=1 No=2 1 Radio 1 2
2 Television 1 2
3 Mobile phone 1 2
4 Land phone 1 2
5 Refrigerator 1 2
6 Electric fan 1 2
7 Computer 1 2
8 Washing machine 1 2
9 Air conditioner/cooler 1 2
10 Almirah 1 2
11 Sofa 1 2
12 Table/Chair 1 2
13 Bed 1 2
14 Motor cycle 1 2
15 Bicycle 1 2
16 Motor Car 1 2
302. Do your household have own productive assets?
1. Agricultural land Yes=1 No=2
1 2 Amount in..........................decimals 2. Homestead land 1 2 Amount in............................decimals 3. Pond for pisciculture 1 2 Amount in ............................decimals 4. Live stock (cow, goat etc.) 1 2 Amount in ............................Number
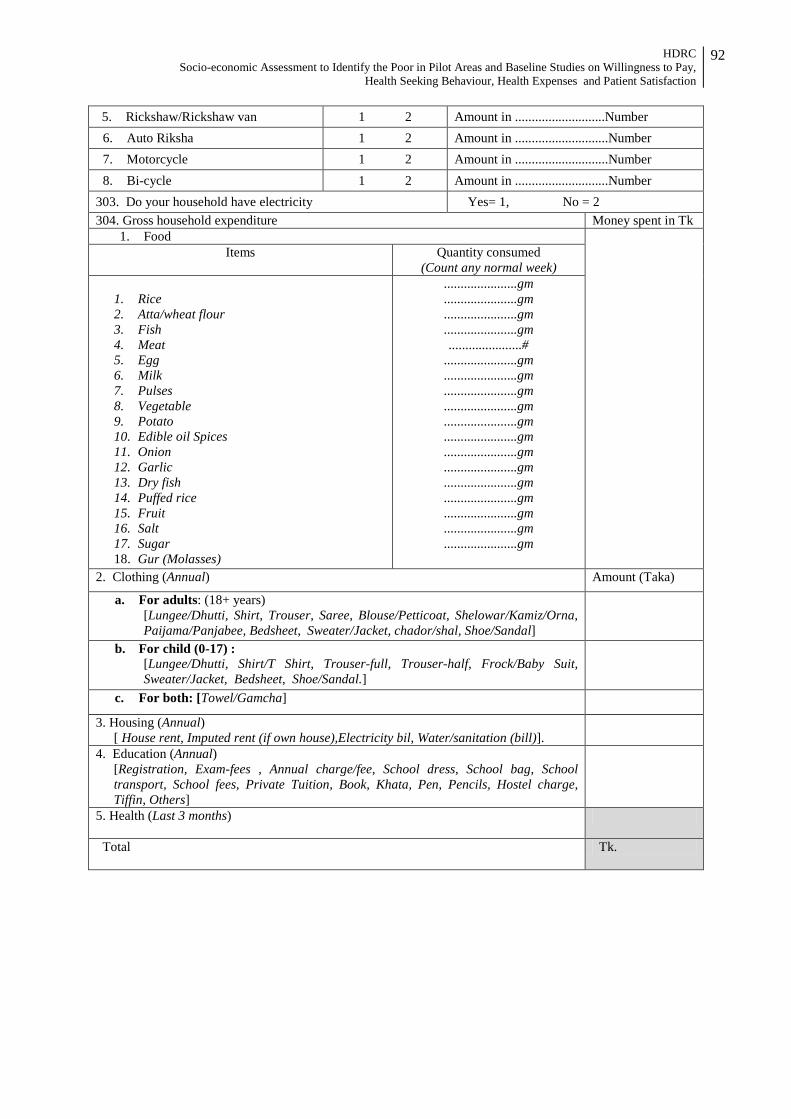
HDRC Socio-economic Assessment to Identify the Poor in Pilot Areas and Baseline Studies on Willingness to Pay,
Health Seeking Behaviour, Health Expenses and Patient Satisfaction
92
5. Rickshaw/Rickshaw van 1 2 Amount in ...........................Number
6. Auto Riksha 1 2 Amount in ............................Number 7. Motorcycle 1 2 Amount in ............................Number 8. Bi-cycle 1 2 Amount in ............................Number
303. Do your household have electricity Yes= 1, No = 2 304. Gross household expenditure Money spent in Tk
1. Food Items Quantity consumed
(Count any normal week) 1. Rice 2. Atta/wheat flour 3. Fish 4. Meat 5. Egg 6. Milk 7. Pulses 8. Vegetable 9. Potato 10. Edible oil Spices 11. Onion 12. Garlic 13. Dry fish 14. Puffed rice 15. Fruit 16. Salt 17. Sugar 18. Gur (Molasses)
......................gm
......................gm
......................gm
......................gm ......................#
......................gm
......................gm
......................gm
......................gm
......................gm
......................gm
......................gm
......................gm
......................gm
......................gm
......................gm
......................gm
......................gm
2. Clothing (Annual) Amount (Taka)
a. For adults: (18+ years) [Lungee/Dhutti, Shirt, Trouser, Saree, Blouse/Petticoat, Shelowar/Kamiz/Orna, Paijama/Panjabee, Bedsheet, Sweater/Jacket, chador/shal, Shoe/Sandal]
b. For child (0-17) : [Lungee/Dhutti, Shirt/T Shirt, Trouser-full, Trouser-half, Frock/Baby Suit, Sweater/Jacket, Bedsheet, Shoe/Sandal.]
c. For both: [Towel/Gamcha]
3. Housing (Annual) [ House rent, Imputed rent (if own house),Electricity bil, Water/sanitation (bill)].
4. Education (Annual) [Registration, Exam-fees , Annual charge/fee, School dress, School bag, School transport, School fees, Private Tuition, Book, Khata, Pen, Pencils, Hostel charge, Tiffin, Others]
5. Health (Last 3 months)
Total Tk.

HDRC Socio-economic Assessment to Identify the Poor in Pilot Areas and Baseline Studies on Willingness to Pay,
Health Seeking Behaviour, Health Expenses and Patient Satisfaction
93
SECTION 4: ILLNESS EPISODE, PRACTICE AND COSTS 401. Illness episodes, related practices and costs during last 3 months
1 2 3 4 5 6 7
Sl. #
Illne
ss e
piso
de (W
hat w
as th
e ill
ness
/con
ditio
ns)
Who
was
or w
here
con
tact
ed fo
r tre
atm
ent/s
ervi
ces
(Use
SP/
SDP
code
)
Acc
ompa
nied
Y
es=1
, N
o =
2
Type
of s
ervi
ce: I
npat
ient
=1,
O
utpa
tient
= 2
Seve
rity
of il
lnes
s: (e
ach
visi
t)
Mild
= 1
, Mod
erat
e =
2, S
ever
e =
3 Cost of care
Rea
sons
for
not
see
king
car
e/
treat
men
t fro
m p
ublic
faci
litie
s (U
se C
ode)
Con
sulta
tion
fee/
char
ge
Med
icin
e
Labo
rato
ry
Tran
spor
tatio
n
Bed
Food
for p
atie
nt
Ope
ratio
n ch
arge
Uno
ffic
ial c
ost
Oth
er
SP/SDP code: Medical College Hospital = 1, Specialized Hospital = 2, District Hospital = 3, Upazila Health Complex = 4, Union Health and Family Welfare Centre/Sub-centre/Rural Dispensary = 5, Maternal and Child Welfare Centre = 6, Private Clinic/Hospital = 7, NGO run Doctor = 8, NGO health worker = 9, Private Practitioner (with formal degree) = 10, Informal Private Practitioner (modern medicine) = 11, Homeopathic practitioner = 12, Self treatment/pharmacy =13, Other (Specify) ...................................................
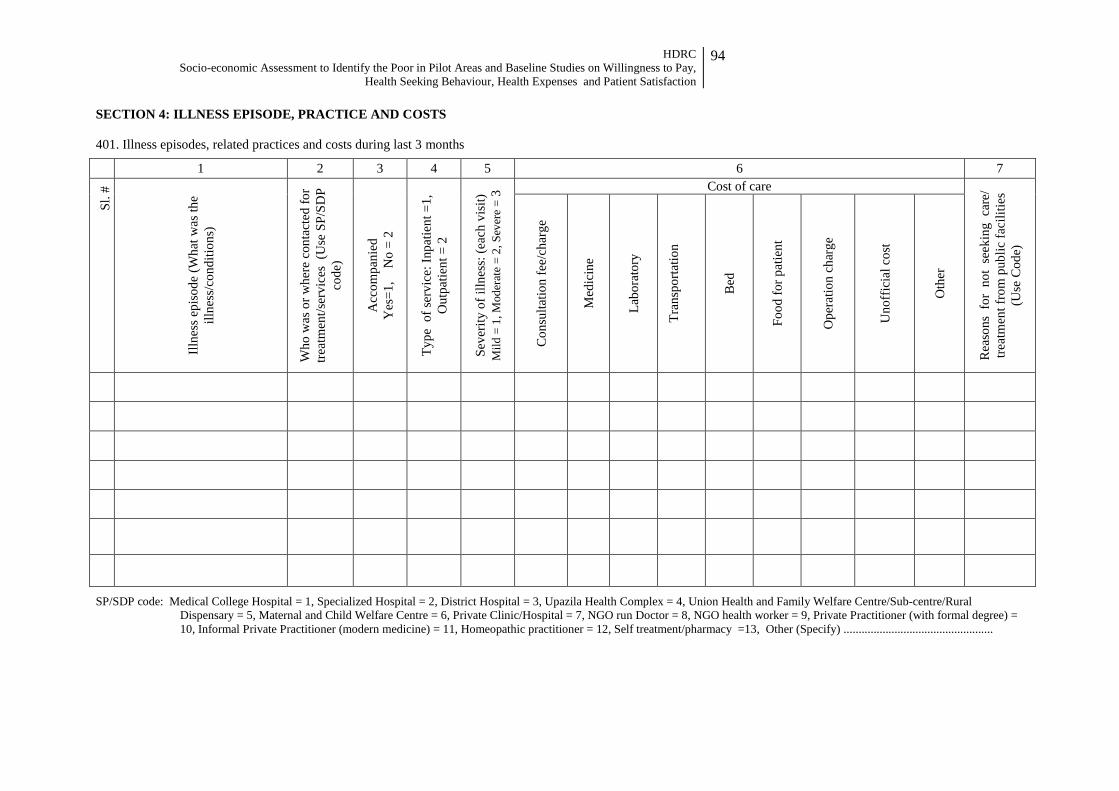
HDRC Socio-economic Assessment to Identify the Poor in Pilot Areas and Baseline Studies on Willingness to Pay,
Health Seeking Behaviour, Health Expenses and Patient Satisfaction
94
SECTION 4: ILLNESS EPISODE, PRACTICE AND COSTS 401. Illness episodes, related practices and costs during last 3 months
1 2 3 4 5 6 7
Sl. #
Illne
ss e
piso
de (W
hat w
as th
e ill
ness
/con
ditio
ns)
Who
was
or w
here
con
tact
ed fo
r tre
atm
ent/s
ervi
ces
(Use
SP/
SDP
code
)
Acc
ompa
nied
Y
es=1
, N
o =
2
Type
of s
ervi
ce: I
npat
ient
=1,
O
utpa
tient
= 2
Seve
rity
of il
lnes
s: (e
ach
visi
t)
Mild
= 1
, Mod
erat
e =
2, S
ever
e =
3 Cost of care
Rea
sons
for
not
see
king
car
e/
treat
men
t fro
m p
ublic
faci
litie
s (U
se C
ode)
Con
sulta
tion
fee/
char
ge
Med
icin
e
Labo
rato
ry
Tran
spor
tatio
n
Bed
Food
for p
atie
nt
Ope
ratio
n ch
arge
Uno
ffic
ial c
ost
Oth
er
SP/SDP code: Medical College Hospital = 1, Specialized Hospital = 2, District Hospital = 3, Upazila Health Complex = 4, Union Health and Family Welfare Centre/Sub-centre/Rural Dispensary = 5, Maternal and Child Welfare Centre = 6, Private Clinic/Hospital = 7, NGO run Doctor = 8, NGO health worker = 9, Private Practitioner (with formal degree) = 10, Informal Private Practitioner (modern medicine) = 11, Homeopathic practitioner = 12, Self treatment/pharmacy =13, Other (Specify) ..................................................
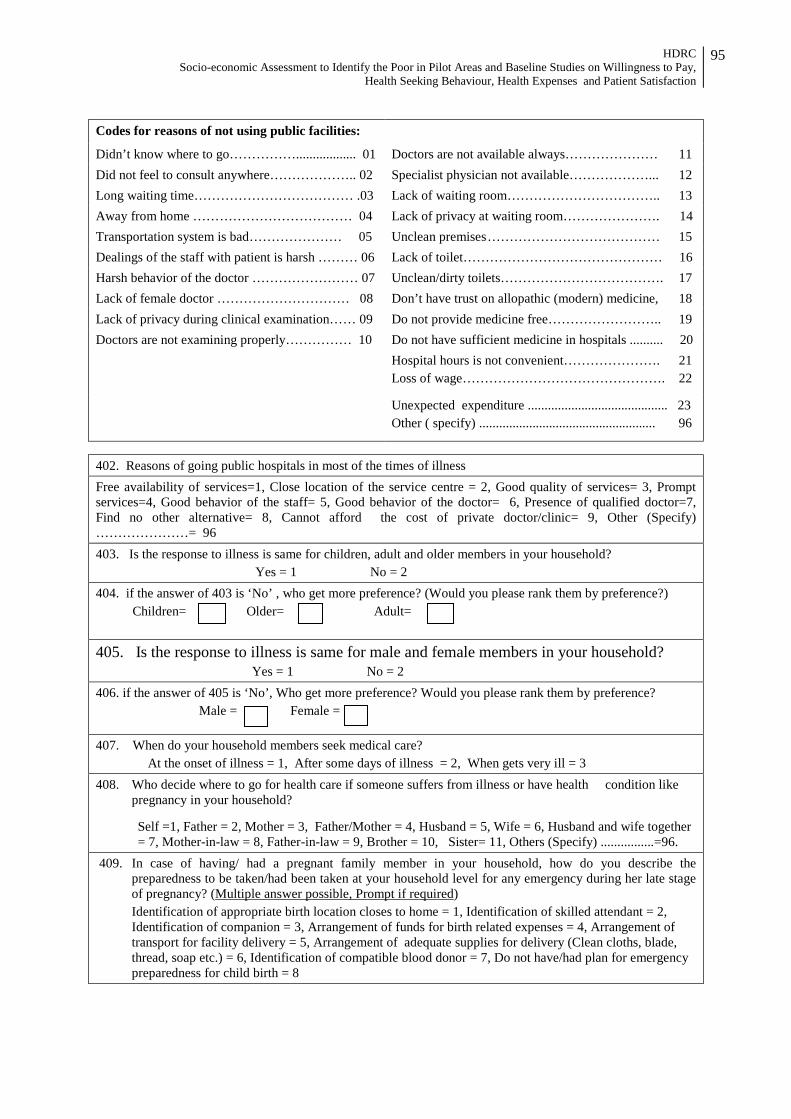
HDRC Socio-economic Assessment to Identify the Poor in Pilot Areas and Baseline Studies on Willingness to Pay,
Health Seeking Behaviour, Health Expenses and Patient Satisfaction
95
Codes for reasons of not using public facilities: Didn’t know where to go…………….................. 01 Doctors are not available always………………… 11 Did not feel to consult anywhere……………….. 02 Specialist physician not available………………... 12 Long waiting time……………………………… .03 Lack of waiting room…………………………….. 13 Away from home ……………………………… 04 Lack of privacy at waiting room…………………. 14 Transportation system is bad………………… 05 Unclean premises ………………………………… 15 Dealings of the staff with patient is harsh ……… 06 Lack of toilet……………………………………… 16 Harsh behavior of the doctor …………………… 07 Unclean/dirty toilets………………………………. 17 Lack of female doctor ………………………… 08 Don’t have trust on allopathic (modern) medicine, 18 Lack of privacy during clinical examination…… 09 Do not provide medicine free…………………….. 19 Doctors are not examining properly…………… 10 Do not have sufficient medicine in hospitals .......... 20 Hospital hours is not convenient…………………. 21
Loss of wage………………………………………. 22
Unexpected expenditure .......................................... 23 Other ( specify) ..................................................... 96
402. Reasons of going public hospitals in most of the times of illness Free availability of services=1, Close location of the service centre = 2, Good quality of services= 3, Prompt services=4, Good behavior of the staff= 5, Good behavior of the doctor= 6, Presence of qualified doctor=7, Find no other alternative= 8, Cannot afford the cost of private doctor/clinic= 9, Other (Specify) …………………= 96 403. Is the response to illness is same for children, adult and older members in your household? Yes = 1 No = 2 404. if the answer of 403 is ‘No’ , who get more preference? (Would you please rank them by preference?) Children= Older= Adult=
405. Is the response to illness is same for male and female members in your household? Yes = 1 No = 2 406. if the answer of 405 is ‘No’, Who get more preference? Would you please rank them by preference? Male = Female =
407. When do your household members seek medical care? At the onset of illness = 1, After some days of illness = 2, When gets very ill = 3
408. Who decide where to go for health care if someone suffers from illness or have health condition like pregnancy in your household?
Self =1, Father = 2, Mother = 3, Father/Mother = 4, Husband = 5, Wife = 6, Husband and wife together = 7, Mother-in-law = 8, Father-in-law = 9, Brother = 10, Sister= 11, Others (Specify) ................=96.
409. In case of having/ had a pregnant family member in your household, how do you describe the preparedness to be taken/had been taken at your household level for any emergency during her late stage of pregnancy? (Multiple answer possible, Prompt if required)
Identification of appropriate birth location closes to home = 1, Identification of skilled attendant = 2, Identification of companion = 3, Arrangement of funds for birth related expenses = 4, Arrangement of transport for facility delivery = 5, Arrangement of adequate supplies for delivery (Clean cloths, blade, thread, soap etc.) = 6, Identification of compatible blood donor = 7, Do not have/had plan for emergency preparedness for child birth = 8

HDRC Socio-economic Assessment to Identify the Poor in Pilot Areas and Baseline Studies on Willingness to Pay,
Health Seeking Behaviour, Health Expenses and Patient Satisfaction
96
SECTION 5: WILLINGNESS TO PAY 501. Anyone can get a serious health problem at any time. Do you also anticipate the risk of so?
Not anticipating at all = 1, Uncertain about such anticipation = 2, Moderately anticipating = 3, Highly anticipating = 4, Don’t know = 88
502. May Allah protect us! If the main wage earner of your family becomes seriously ill, then how would you manage that? What would be the most challenging thing to do that?
------------------------------------------------------------------------------------------------------------------------------------------- -------------------------------------------------------------------------------------------------------------------------------------------- --------------------------------------------------------------------------------------------------------------------------------------------
Are you aware that a segment of people avoid medical consultation due to inability to bear the cost of ever rising modern (allopathic) medical expenses, although that are needed urgent care?
503. Given the situation, do you accept a health system where all of your basic health care will be ensured effectively if you agree to pay small affordable amount of money at regular interval (monthly, quarterly half yearly, etc.) as health premiums irrespective of you suffer from any health problems or not?
Highly acceptable = 1, Moderately acceptable = 2, Not acceptable at all =3, Uncertain, whether to accept or reject = 4 504. If the answer is ‘acceptable’, what type of services do you prefer to be included in the benefit package?
Free Physician’s consultation = 1, Free drugs = 2, Free diagnostic facilities = 3, In-patient care = 4, Surgical facilities = 5, Structured referral to the secondary and tertiary level hospitals = 6, Transportation cost for referral cases = 7, Preventive care = 8, Other (please specify) ......................................... 96
505. If answer is ‘not acceptable’, please explain your answer (why or why not?)
------------------------------------------------------------------------------------------------------------------------------------------
------------------------------------------------------------------------------------------------------------------------------------------
-----------------------------------------------------------------------------------------------------------------------------------------
------------------------------------------------------------------------------------------------------------------------------------------

HDRC Socio-economic Assessment to Identify the Poor in Pilot Areas and Baseline Studies on Willingness to Pay,
Health Seeking Behaviour, Health Expenses and Patient Satisfaction
97
506. Willingness to pay for different services
Sl Signs/symptoms of diseases or condition Public Service Delivery Points Private Service Delivery Points
NGO Service Delivery Points Static SDP Satellite SDP
Existing Charge
Willingness to pay
Existing Charge
Willingness to pay
Existing Charge
Willingness to pay
Existing Charge
Willingness to pay
1 Registration fee 2 Reproductive Health Maternal health
ANC Delivery care Cesarean operation Non-cesarean operation PNC Family Planning Services Short acting contraceptive methods (30 pieces) Condom (12 pieces) Injection (1 pieces) Long acting contraceptive methods-Implant (1 pieces)
Cooper-T Other RH services Abortion, MR & post abortion care RTI management
3 Child health IMCI EPI Vit-A supplementation Treatment of ARI Treatment of diarrohea Spell
4 Limited Curative Care
Treatment of common diseases Fever, pain, common colds & all other general ailments
Anaemia, helminthiasis & malnutrition
Eye infection Common dental diseases Skin diseases Basic first aid of medical and surgical
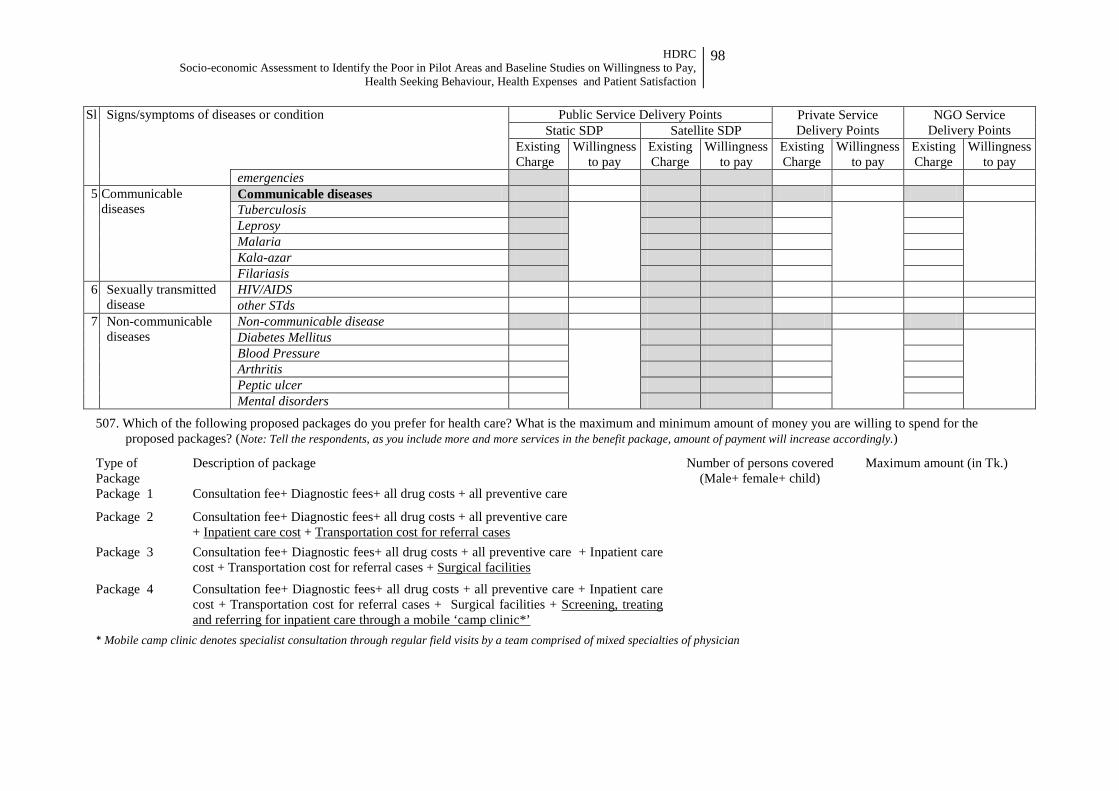
HDRC Socio-economic Assessment to Identify the Poor in Pilot Areas and Baseline Studies on Willingness to Pay,
Health Seeking Behaviour, Health Expenses and Patient Satisfaction
98
Sl Signs/symptoms of diseases or condition Public Service Delivery Points Private Service Delivery Points
NGO Service Delivery Points Static SDP Satellite SDP
Existing Charge
Willingness to pay
Existing Charge
Willingness to pay
Existing Charge
Willingness to pay
Existing Charge
Willingness to pay
emergencies 5 Communicable
diseases Communicable diseases Tuberculosis Leprosy Malaria Kala-azar Filariasis
6 Sexually transmitted disease
HIV/AIDS other STds
7 Non-communicable diseases
Non-communicable disease Diabetes Mellitus Blood Pressure Arthritis Peptic ulcer Mental disorders
507. Which of the following proposed packages do you prefer for health care? What is the maximum and minimum amount of money you are willing to spend for the proposed packages? (Note: Tell the respondents, as you include more and more services in the benefit package, amount of payment will increase accordingly.)
Type of Package
Description of package Number of persons covered (Male+ female+ child)
Maximum amount (in Tk.)
Package 1 Consultation fee+ Diagnostic fees+ all drug costs + all preventive care
Package 2 Consultation fee+ Diagnostic fees+ all drug costs + all preventive care + Inpatient care cost + Transportation cost for referral cases
Package 3 Consultation fee+ Diagnostic fees+ all drug costs + all preventive care + Inpatient care cost + Transportation cost for referral cases + Surgical facilities
Package 4 Consultation fee+ Diagnostic fees+ all drug costs + all preventive care + Inpatient care cost + Transportation cost for referral cases + Surgical facilities + Screening, treating and referring for inpatient care through a mobile ‘camp clinic*’
* Mobile camp clinic denotes specialist consultation through regular field visits by a team comprised of mixed specialties of physician
HDRC Socio-economic Assessment to Identify the Poor in Pilot Areas and Baseline Studies on Willingness to Pay, Health
Seeking Behaviour, Health Expenses and Patient Satisfaction
99
Socio-Economic Assessment to Identify the Poor in Pilot Areas and Baseline Studies on Willingness to Pay, Health Seeking Behaviour,
Health Expenses (OOP) and Patient Satisfaction
Key Informant Interview
Service Providers and Up Members Level: UHC=1 UH&FWC=2 Com. Clinic (CRHCP)=3 Com. Clinic (CCMC)=4 UP (Chair/Mem)=5
Study conducted by
Human Development Research Centre Road # 8, House #5, Mohammadia Housing Society,
Mohammadpur, Dhaka –1207, Bangladesh Phone: (880 2) 8116972, 8157621, Fax: (880 2) 8157620
E-mail: [email protected], [email protected] Website: www.hdrc-bd.com
April, 2012
Profile of Participant:
Name…………………………………………................Designation…………………………
District..............................................................Upazila..............................................................
Union/Pourashava.................................................Village/Para……………………………….
DCI-3
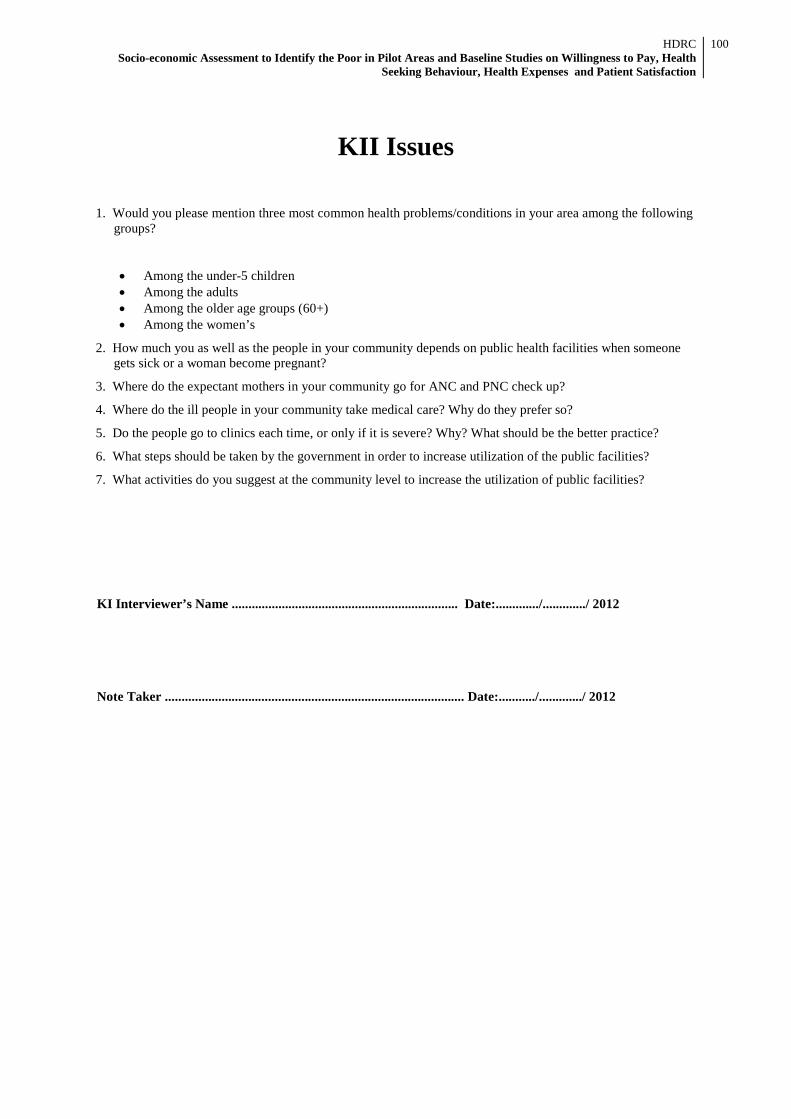
HDRC Socio-economic Assessment to Identify the Poor in Pilot Areas and Baseline Studies on Willingness to Pay, Health
Seeking Behaviour, Health Expenses and Patient Satisfaction
100
KII Issues 1. Would you please mention three most common health problems/conditions in your area among the following
groups?
• Among the under-5 children • Among the adults • Among the older age groups (60+) • Among the women’s
2. How much you as well as the people in your community depends on public health facilities when someone gets sick or a woman become pregnant?
3. Where do the expectant mothers in your community go for ANC and PNC check up?
4. Where do the ill people in your community take medical care? Why do they prefer so?
5. Do the people go to clinics each time, or only if it is severe? Why? What should be the better practice?
6. What steps should be taken by the government in order to increase utilization of the public facilities?
7. What activities do you suggest at the community level to increase the utilization of public facilities?
KI Interviewer’s Name .................................................................... Date:............./............./ 2012
Note Taker .......................................................................................... Date:.........../............./ 2012

HDRC Socio-economic Assessment to Identify the Poor in Pilot Areas and Baseline Studies on Willingness to Pay, Health
Seeking Behaviour, Health Expenses and Patient Satisfaction
101
Socio-Economic Assessment to Identify the Poor in Pilot Areas and Baseline Studies on Willingness to Pay, Health Seeking Behaviour,
Health Expenses (OOP) and Patient Satisfaction
Key Informant Interview
Local Civil Society
Study conducted by
Human Development Research Centre Road # 8, House #5, Mohammadia Housing Society,
Mohammadpur, Dhaka –1207, Bangladesh Phone: (880 2) 8116972, 8157621, Fax: (880 2) 8157620
E-mail: [email protected], [email protected] Website: www.hdrc-bd.com
April, 2012
Profile of Participant:
Name…………………………………………................Designation…………………………
District..............................................................Upazila..............................................................
Union/Pourashava.................................................Village/Para……………………………….
DCI-4
HDRC Socio-economic Assessment to Identify the Poor in Pilot Areas and Baseline Studies on Willingness to Pay, Health
Seeking Behaviour, Health Expenses and Patient Satisfaction
102
[Interviewer: Please start the interview with the fact that, in Bangladesh people especially the poor do not use the public, private or NGO facilities until and unless they become severely ill. Although the services provided by public facilities are free of cost, the out of pocket expenses is still not affordable to the poor. They cannot afford the services as they do not have that much savings or cash may in their pocket to pay for it when they become ill. The quality of services is also in question. In this perspective we would like to ask you about how to overcome the situation.]
1. Do you support some health insurance type of initiative where some authority will bear the expenses of
health care services provided at a better quality in the government health facilities from Community Clinic to District Hospital (i.e, visits to doctors or emergency room, hospital stays, coverage for medicines, complete maternal health services including delivery and Caesarean Section and other medical expenses, as agreed between you and the authority) in exchange of payment of small monthly/quarterly or yearly affordable premiums in advance (regardless of the fact that you experience any illness or health events)?
2. If yes, do you think that poor people will be interested to receive the health care services, if they are
provided some discount in that premium? 3. What steps should be taken by the government in order to increase utilization of the public facilities? 4. What activities do you suggest at the community level to increase the utilization of public facilities?
KI Interviewer’s Name .................................................................... Date:............./............./ 2012
Note Taker .......................................................................................... Date:.........../............./ 2012

HDRC Socio-economic Assessment to Identify the Poor in Pilot Areas and Baseline Studies on Willingness to Pay, Health
Seeking Behaviour, Health Expenses and Patient Satisfaction
103
Socio-Economic Assessment to Identify the Poor in Pilot Areas and Baseline Studies on Willingness to Pay, Health Seeking Behaviour,
Health Expenses (OOP) and Patient Satisfaction
Exit Interview Schedule
Location Information
Name of the Participant: ..................................................................................
Type of Clinic/Hospital
UHC=1 FWC=2 Community Clinic=3
Address of Clinic/Hospital:
District
Upazila
Union/ Pourashava
Name of the Enumerator ............................................. Date ........./04/ 2012
Supervisor ............................................. Date ........./04/ 2012
Quality Control Officer ............................................. Date ........./04/ 2012
Study conducted by
Human Development Research Centre Road # 8, House #5, Mohammadia Housing Society,
Mohammadpur, Dhaka –1207, Bangladesh Phone: (880 2) 8116972, 8157621, Fax: (880 2) 8157620
E-mail: [email protected], [email protected] Website: www.hdrc-bd.com
April 01, 2012
Sample ID DCI-5
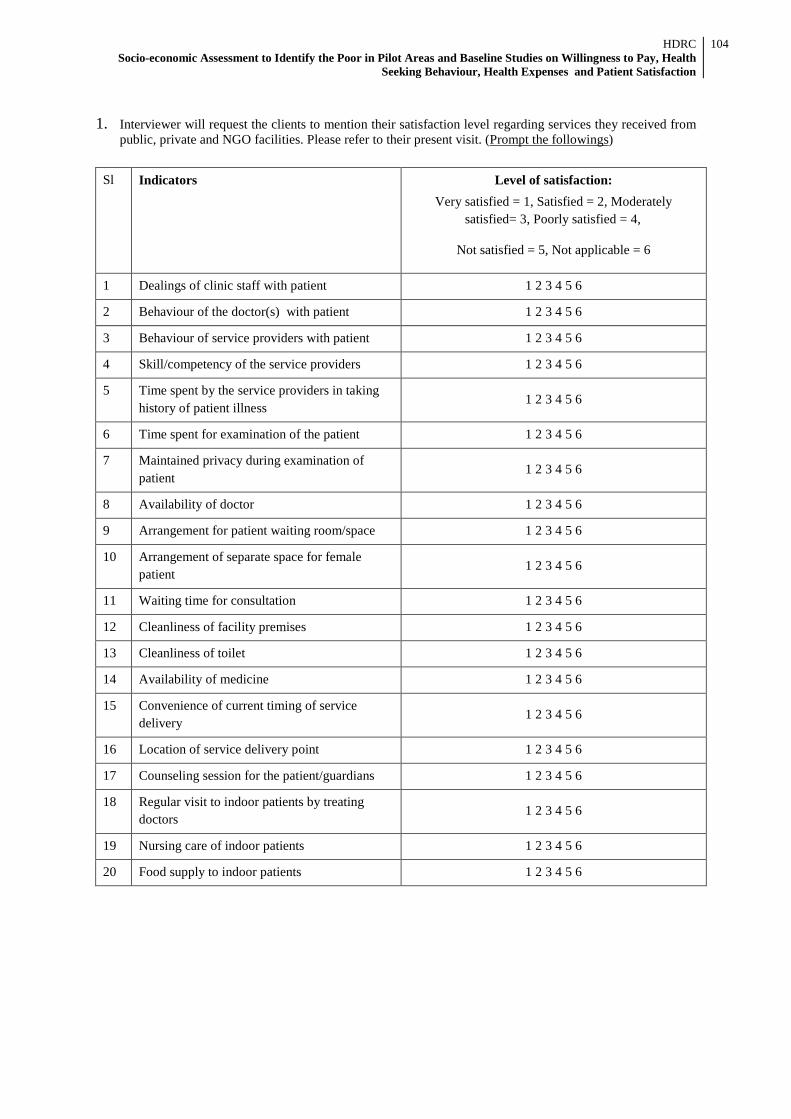
HDRC Socio-economic Assessment to Identify the Poor in Pilot Areas and Baseline Studies on Willingness to Pay, Health
Seeking Behaviour, Health Expenses and Patient Satisfaction
104
1. Interviewer will request the clients to mention their satisfaction level regarding services they received from
public, private and NGO facilities. Please refer to their present visit. (Prompt the followings)
Sl Indicators Level of satisfaction: Very satisfied = 1, Satisfied = 2, Moderately
satisfied= 3, Poorly satisfied = 4,
Not satisfied = 5, Not applicable = 6
1 Dealings of clinic staff with patient 1 2 3 4 5 6
2 Behaviour of the doctor(s) with patient 1 2 3 4 5 6
3 Behaviour of service providers with patient 1 2 3 4 5 6
4 Skill/competency of the service providers 1 2 3 4 5 6
5 Time spent by the service providers in taking history of patient illness
1 2 3 4 5 6
6 Time spent for examination of the patient 1 2 3 4 5 6
7 Maintained privacy during examination of patient
1 2 3 4 5 6
8 Availability of doctor 1 2 3 4 5 6
9 Arrangement for patient waiting room/space 1 2 3 4 5 6
10 Arrangement of separate space for female patient
1 2 3 4 5 6
11 Waiting time for consultation 1 2 3 4 5 6
12 Cleanliness of facility premises 1 2 3 4 5 6
13 Cleanliness of toilet 1 2 3 4 5 6
14 Availability of medicine 1 2 3 4 5 6
15 Convenience of current timing of service delivery
1 2 3 4 5 6
16 Location of service delivery point 1 2 3 4 5 6
17 Counseling session for the patient/guardians 1 2 3 4 5 6
18 Regular visit to indoor patients by treating doctors
1 2 3 4 5 6
19 Nursing care of indoor patients 1 2 3 4 5 6
20 Food supply to indoor patients 1 2 3 4 5 6
HDRC Socio-economic Assessment to Identify the Poor in Pilot Areas and Baseline Studies on Willingness to Pay, Health
Seeking Behaviour, Health Expenses and Patient Satisfaction
105
Socio-Economic Assessment to Identify the Poor in Pilot Areas and Baseline Studies on Willingness to Pay, Health Seeking Behaviour,
Health Expenses (OOP) and Patient Satisfaction
Focus Group Discussion (FGD)
Address District............................................................... Upazila……............................................................ Union/Pourashava.................................................. Place of FGD........................................................ Date………………………………………………
Profile of Participants
Sl # Name Age Education Name of Occupation 01 02 03 04 05 06 07 08 09
Study conducted by
Human Development Research Centre Road # 8, House #5, Mohammadia Housing Society,
Mohammadpur, Dhaka –1207, Bangladesh Phone: (880 2) 8116972, 8157621, Fax: (880 2) 8157620
E-mail: [email protected], [email protected] Website: www.hdrc-bd.com
April 01, 2012
DCI-6

HDRC Socio-economic Assessment to Identify the Poor in Pilot Areas and Baseline Studies on Willingness to Pay, Health
Seeking Behaviour, Health Expenses and Patient Satisfaction
106
1. What are most common concerns of the people in your community? What are the greatest concerns? Would
you please rank the following concerns from greatest to least concerns? 1. Education 2. Financial crisis 3. Health and illness 4. Family/Land dispute 5. Communication (transport) 6. Safety/Crime 7. Water/Sanitation 8. Electricity
Why have you prioritized some concerns above others?
2. What come to your mind when you hear the word ‘health’? How important is health to you? Why? Do you think health is a major concern? If no, why? If yes, why this is a major concern to you?
3. Do you take any measures to prevent this concern for male and female especially pregnant women? If so,
what are those? What measures do the people take when they suffer from illness? What are they? What are the barriers? How the people cope with the barriers?
4. It is seen that a segment of people avoid medical consultation due to inability to bear the cost of ever rising
modern (allopathic) medical expenses, although that are needed urgent care? Given the situation, do you accept a health system where all of your basic health care will be ensured effectively if you agree to pay small affordable amount of money at regular interval (monthly, quarterly half yearly etc.) as health premiums irrespective of you suffer from any health problems or not? If acceptable, why? If no, why?
5. Some people are not health conscious. What is/are their mind set behind this? What obstacles do they face
in taking this? What can motivate them to become health conscious?
6. What are your suggestions regarding an implementable health system that can motivate most of the people to take medical consultation in proper time?
Facilitator's Name ............................................................................ Date:............./............./ 2012
Note Taker ..................................................................................... Date:.........../............./ 2012
HDRC Socio-economic Assessment to Identify the Poor in Pilot Areas and Baseline Studies on Willingness to Pay, Health
Seeking Behaviour, Health Expenses and Patient Satisfaction
107
Annex-3 Study Area
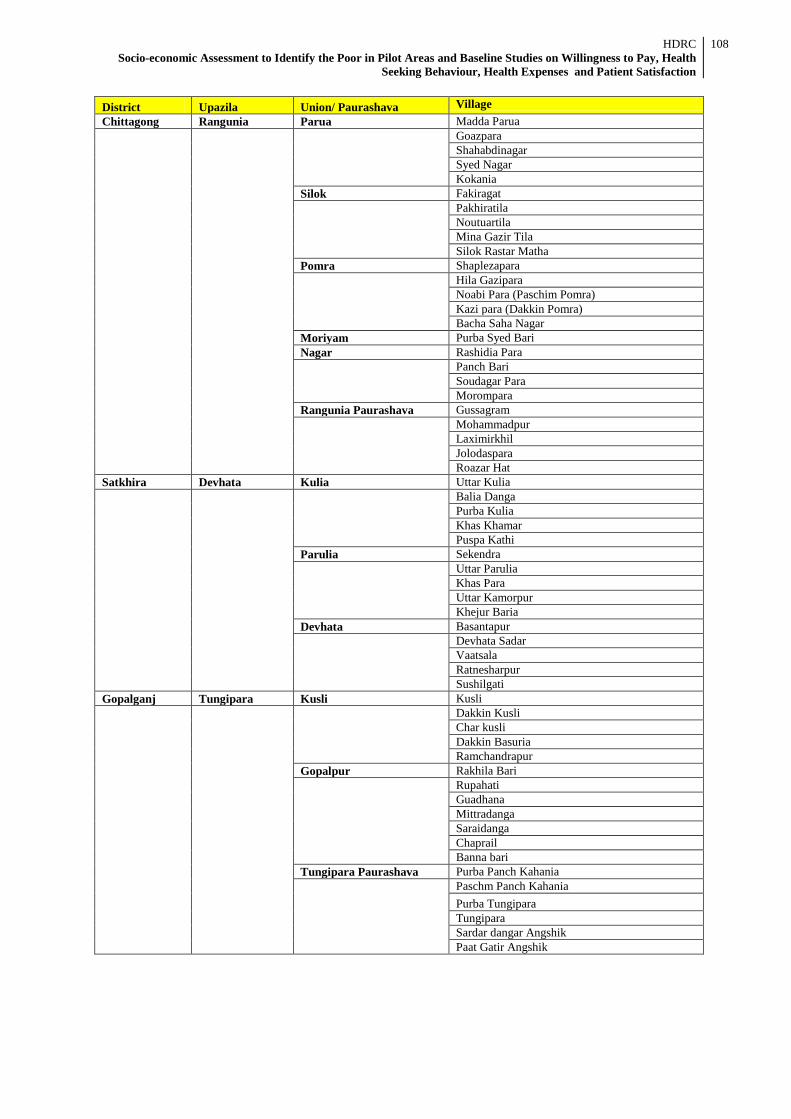
HDRC Socio-economic Assessment to Identify the Poor in Pilot Areas and Baseline Studies on Willingness to Pay, Health
Seeking Behaviour, Health Expenses and Patient Satisfaction
108
District Upazila Union/ Paurashava Village Chittagong Rangunia Parua Madda Parua
Goazpara Shahabdinagar Syed Nagar Kokania
Silok Fakiragat
Pakhiratila Noutuartila Mina Gazir Tila Silok Rastar Matha
Pomra Shaplezapara
Hila Gazipara Noabi Para (Paschim Pomra) Kazi para (Dakkin Pomra) Bacha Saha Nagar
Moriyam Purba Syed Bari Nagar Rashidia Para
Panch Bari Soudagar Para Morompara
Rangunia Paurashava Gussagram
Mohammadpur Laximirkhil Jolodaspara Roazar Hat
Satkhira Devhata Kulia Uttar Kulia
Balia Danga Purba Kulia Khas Khamar Puspa Kathi
Parulia Sekendra
Uttar Parulia Khas Para Uttar Kamorpur Khejur Baria
Devhata Basantapur
Devhata Sadar Vaatsala Ratnesharpur Sushilgati
Gopalganj Tungipara Kusli Kusli
Dakkin Kusli Char kusli Dakkin Basuria Ramchandrapur
Gopalpur Rakhila Bari
Rupahati Guadhana Mittradanga Saraidanga Chaprail Banna bari
Tungipara Paurashava Purba Panch Kahania
Paschm Panch Kahania Purba Tungipara Tungipara Sardar dangar Angshik Paat Gatir Angshik
HDRC Socio-economic Assessment to Identify the Poor in Pilot Areas and Baseline Studies on Willingness to Pay, Health
Seeking Behaviour, Health Expenses and Patient Satisfaction
109
Annex-4 Members of the Study Team
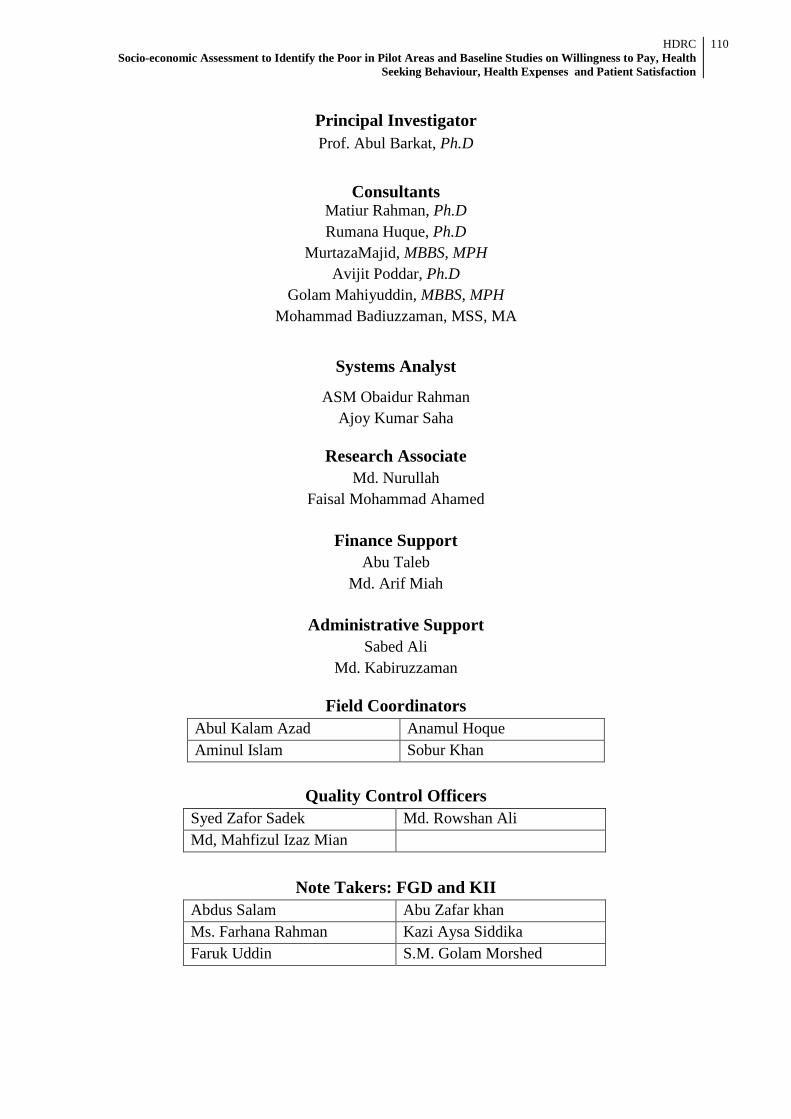
HDRC Socio-economic Assessment to Identify the Poor in Pilot Areas and Baseline Studies on Willingness to Pay, Health
Seeking Behaviour, Health Expenses and Patient Satisfaction
110
Principal Investigator Prof. Abul Barkat, Ph.D
Consultants
Matiur Rahman, Ph.D Rumana Huque, Ph.D
MurtazaMajid, MBBS, MPH Avijit Poddar, Ph.D
Golam Mahiyuddin, MBBS, MPH Mohammad Badiuzzaman, MSS, MA
Systems Analyst
ASM Obaidur Rahman Ajoy Kumar Saha
Research Associate Md. Nurullah
Faisal Mohammad Ahamed
Finance Support Abu Taleb
Md. Arif Miah
Administrative Support Sabed Ali
Md. Kabiruzzaman
Field Coordinators
Abul Kalam Azad Anamul Hoque Aminul Islam Sobur Khan
Quality Control Officers Syed Zafor Sadek Md. Rowshan Ali Md, Mahfizul Izaz Mian
Note Takers: FGD and KII Abdus Salam Abu Zafar khan Ms. Farhana Rahman Kazi Aysa Siddika Faruk Uddin S.M. Golam Morshed
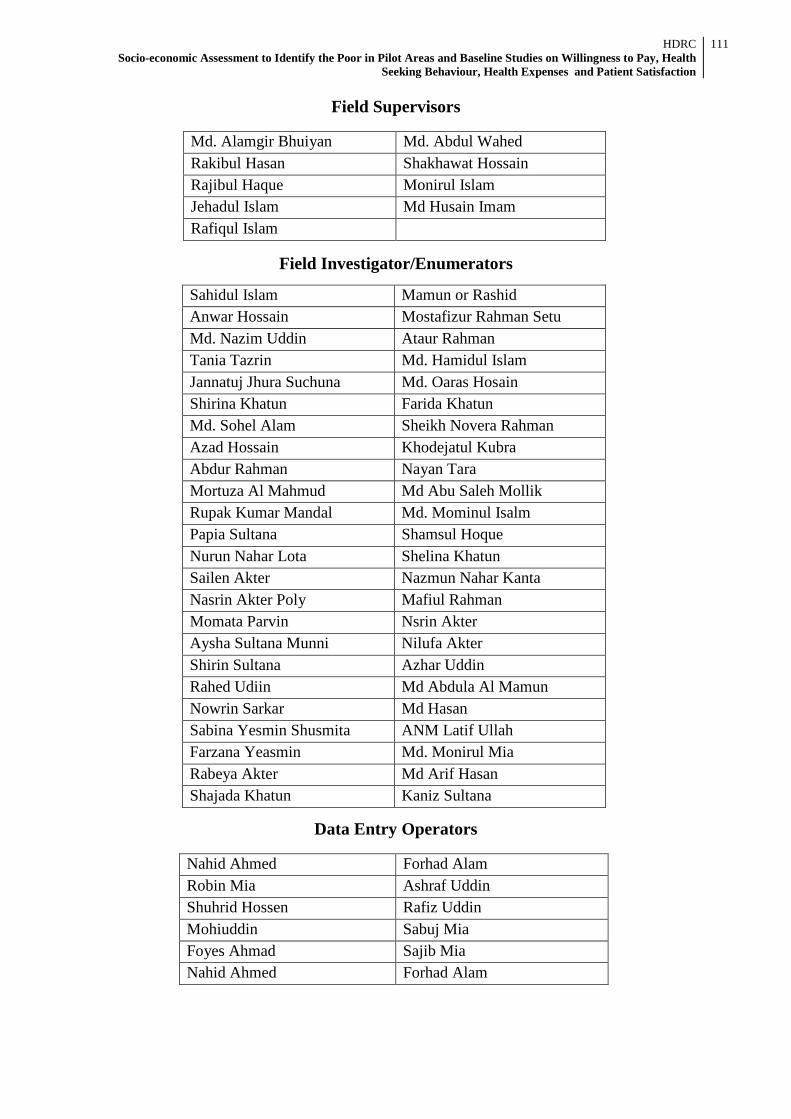
HDRC Socio-economic Assessment to Identify the Poor in Pilot Areas and Baseline Studies on Willingness to Pay, Health
Seeking Behaviour, Health Expenses and Patient Satisfaction
111
Field Supervisors
Md. Alamgir Bhuiyan Md. Abdul Wahed Rakibul Hasan Shakhawat Hossain Rajibul Haque Monirul Islam Jehadul Islam Md Husain Imam Rafiqul Islam
Field Investigator/Enumerators
Sahidul Islam Mamun or Rashid Anwar Hossain Mostafizur Rahman Setu Md. Nazim Uddin Ataur Rahman Tania Tazrin Md. Hamidul Islam Jannatuj Jhura Suchuna Md. Oaras Hosain Shirina Khatun Farida Khatun Md. Sohel Alam Sheikh Novera Rahman Azad Hossain Khodejatul Kubra Abdur Rahman Nayan Tara Mortuza Al Mahmud Md Abu Saleh Mollik Rupak Kumar Mandal Md. Mominul Isalm Papia Sultana Shamsul Hoque Nurun Nahar Lota Shelina Khatun Sailen Akter Nazmun Nahar Kanta Nasrin Akter Poly Mafiul Rahman Momata Parvin Nsrin Akter Aysha Sultana Munni Nilufa Akter Shirin Sultana Azhar Uddin Rahed Udiin Md Abdula Al Mamun Nowrin Sarkar Md Hasan Sabina Yesmin Shusmita ANM Latif Ullah Farzana Yeasmin Md. Monirul Mia Rabeya Akter Md Arif Hasan Shajada Khatun Kaniz Sultana
Data Entry Operators
Nahid Ahmed Forhad Alam Robin Mia Ashraf Uddin Shuhrid Hossen Rafiz Uddin Mohiuddin Sabuj Mia Foyes Ahmad Sajib Mia Nahid Ahmed Forhad Alam