The sustainability of suburban design: the impact of 'green ...
Upload
independentCategory
view
0download
0
This article appeared in a journal published by Elsevier. The attachedcopy is furnished to the author for internal non-commercial researchand education use, including for instruction at the authors institution
and sharing with colleagues.
Other uses, including reproduction and distribution, or selling orlicensing copies, or posting to personal, institutional or third party
websites are prohibited.
In most cases authors are permitted to post their version of thearticle (e.g. in Word or Tex form) to their personal website orinstitutional repository. Authors requiring further information
regarding Elsevier’s archiving and manuscript policies areencouraged to visit:
http://www.elsevier.com/authorsrights

Author's personal copy
Socio-demographic profiles in suburban developments: Implicationsfor water-related attitudes and behaviors along the Mediterraneancoast
Xavier Garcia a,*, Anna Ribas a, Albert Llausàs b, David Saurí c
aDepartment of Geography & Institute of the Environment, University of Girona, Pl. Ferrater i Mora, 1, 17071 Girona, SpainbDepartment of Resource Management and Geography, University of Melbourne, Melbourne, AustraliacDepartment of Geography, Autonomous University of Barcelona, 08193 Bellaterra, Barcelona, Spain
Keywords:Domestic water consumptionSocio-demographic characteristicsWater conservation attitudesLow-density suburban developments
a b s t r a c t
This article examines how the socio-demographic characteristics of residents in low-density suburbandevelopments are important factors in understanding and predicting the attitudes and behaviors ofresidents in relation to residential water use. This paper is based on information obtained from 230surveyed residents in 9 municipalities of Girona (northeast Catalonia, Spain). First, we seek to define thesocio-demographic profiles of the various population groups according to their members’ birthplace.Subsequently, based on the existing literature, we analyze the relationships between social groups, theirsocio-demographic characteristics and their attitudes and behaviors regarding residential water use.Finally, after applying a Generalized Linear Mixed Model with panel data from 77 respondents, weexamine whether the birthplace of the surveyed residents and their attitudes toward the conservation ofwater in homes are relevant factors in determining domestic water consumption. The results demon-strate the significance of birthplace (with its related socio-demographic and urban dynamics) and waterconservation attitudes on residential water use and, therefore, the need to take these factors into accountwhen managing this resource.
� 2013 Elsevier Ltd. All rights reserved.
Introduction
Growing concern about the availability of water in sufficientquantities and quality has made the move toward sustainabilitywhen planning and managing water resources increasingly ur-gent. From this perspective, many international organizations,including the United Nations and the European Union, haveproposed the implementation of comprehensive managementplans that combine actions to guarantee the supply of waterwith actions addressed to control demand (EEA, 2009; UN-Water, 2012). The design of these integrated water manage-ment plans, however, needs to be developed while carefullyassessing target sectors and populations, including the de-mographic, economic, social and cultural characteristics of thesepopulations that are more relevant to water consumption(March & Saurí, 2010).
Regarding urban water in the northern Mediterranean region,social, economic and territorial changes have become importantfactors in understanding the increase in demand, particularly in thedomestic sphere. Of particular relevance is demand from detachedhouses or multi-family residences in low-density areas (Durà, 1997,2003; Nel lo, 2001). The widespread emergence of a new low-density residential model (and the social preference for thismodel) has led to new behavioral patterns with a greater tendencyto consume water for swimming pools, gardens or recreationalhorticulture (Garcia, Llausàs, & Ribas, 2013; Saurí, 2003). These newcityscapes concur with the garden-city model of individual life-styles and transmit social values that often lead to non-prudentbehaviors regarding water use (Askew & McGuirk, 2004; Parés-Franzi, 2005).
It has been demonstrated for different contexts that waterconsumption per capita in low-density urban areas is usuallygreater than consumption per capita in areas of compact housing(Domene & Saurí, 2006; Fox, McIntosh, & Jeffrey, 2009). Otherfactors related to social and urban dynamics may influencethis consumption as well. Some studies have analyzed how socio-demographic differences among water users may become relevant
* Corresponding author. Tel.: þ34 972418777; fax: þ34 972418117.E-mail addresses: [email protected] (X. Garcia), [email protected]
(A. Ribas), [email protected] (A. Llausàs), [email protected] (D. Saurí).
Contents lists available at SciVerse ScienceDirect
Applied Geography
journal homepage: www.elsevier .com/locate/apgeog
0143-6228/$ e see front matter � 2013 Elsevier Ltd. All rights reserved.http://dx.doi.org/10.1016/j.apgeog.2013.03.009
Applied Geography 41 (2013) 46e54

Author's personal copy
factors to explain users’ consumption. Therefore, the socio-demographic characteristics of residents can improve our under-standing of the relationships between dispersed urban forms anddomestic water consumption (March, Perarnau, & Saurí, 2012).One aspect little explored in the literature is the geographicalorigin of residents within the context of the history of urbangrowth in a particular area.
The migration of the rural Spanish population to Barcelona andits metropolitan area in search of better work conditions andquality of life peaked in the period 1950e1975. During this period,Catalonia received one-and-a-half million people from the rest ofSpain, contributing 44% to the overall growth of the Catalan pop-ulation (Miret, 2001). This demographic boost quickly situated theMetropolitan Area of Barcelona (MAB) as one of the largestmetropolitan areas in southern Europe (4,239,000 inhabitants in1981; 4,777,000 in 2011).
In the early 1980s, the first signs of a territorial redistribution ofthe population from compact cities to the suburbs were identified,while at the same time, a new, still incipient, wave of immigrationarrived from developing countries (Durà, 2003). The causes of thisredistribution include increasing population pressure in compactcities as the numerous children of the “baby boom” of the 1960sreached adulthood, lack of land, rising housing prices, and anincreasing demand for more living space coupled with increasinghousehold incomes (Durà, 1997; Durà, 2003; Monclús, 1998; Nel lo,2001). The demographic evolution also witnessed the arrival ofpopulations from rich countries, generally Europeans, who pri-marily settled in mainland or coastal second homes after theirretirement or looked for good investment opportunities (EEA,2006). Because of these changes, between 1987 and 2002,compact residential urban land in Catalonia rose from 379 to409 km2, a 7.92% increase. In contrast, low-density urban land areaincreased from 271 to 581 km2, which represents an increase of114.39% in the same period.
To plan for water supply and sanitation in areas under urbansprawl, it is crucial to know the socio-demographic profiles ofresidents and to incorporate an estimation of their demographicevolution (EEA, 2012). This knowledge, coupled with informationregarding land-use changes related to urbanization (Tong, Sun,Ranatunga, He, & Yang, 2012), is particularly useful within thecontext of increasing climate uncertainties and its connection towater-resource availability (IPCC, 2007). Climatic threats in theform of droughts and floods appear more acute in the coastalMediterranean areas of the Iberian Peninsula and may affect pop-ulations with different socio-demographic characteristics and,therefore, with different vulnerabilities and adaptive capacities.
With all the above considerations in mind, the aim of this paperis to determine whether population and household dynamics thathave occurred in Catalonia, particularly in low-density residentialareas, are important factors in understanding and predicting theattitudes and behaviors of residents regarding water use. In thisstudy, we first explore the profiles of various population groupsbased on their socio-demographic characteristics according to theirbirthplace. Subsequently, and based on the existing literature, theinteraction between these social groups, their socio-demographiccharacteristics, and their attitudes and behaviors regarding resi-dential water use is analyzed. Finally, a Generalized Linear MixedModel (GLMM) is applied using panel data of 77 respondents toexamine whether the birthplace of the household sample and theirattitudes toward residential water use are factors influencing theirwater consumption.
The paper is divided into 6 sections. First, we present the socio-demographic factors that, according to the literature, most influ-ence the residential water demand. Subsequently, we present themain urban dynamics and demographic changes that occurred in
the study area. The following section briefly introduces the mostdeterminant characteristics in relation towater management in thesame area, such as the main water-supply sources, managementand service rates, and water prices. The fourth section is devoted toexplaining the survey design used to obtain data, the data treat-ment, and statistical analyses. The results are presented and dis-cussed in the fifth section. The last section is dedicated toconclusions and closes with a brief reflection on the relevance thaturban and demographic dynamics have for water consumption andthe implications for the management of the resource.
Socio-demographic characteristics and residential waterconsumption
The main socio-demographic factors shown to influence do-mestic water use include household size, the age of residents,household income, and the residents’ birthplace.
Household size
Most studies addressing the effects of socio-demographic vari-ables on domestic water demand usually include a variable thattakes household size into account (Agthe & Billings, 1987; Arbués,Barberán, & Villanúa, 2008; Dandy, Nguyen, & Davies, 1997;Höglund, 1999; Martínez-Espiñeira, 2002; Nieswiadomy & Cobb,1993). With household water consumption as a dependent vari-able, increasing household size should produce an increase in thedemanded water. However, due to household-scale economies, anincrease in the demand for water may be proportionately less thanthe increase in household size (Höglund, 1999). Still, as shown byArbués et al. (2008), there is a size threshold beyond whichhousehold economies of scale vanish and the rising demand forwater is proportional to the increase in the number of people perhousehold.
Age of residents
The age of the residents is also a considerably powerfulexplanatory variable for modeling domestic water consumption,but it is not always used in studies that address this subject. Naugesand Thomas (2000), in their study conducted in eastern France,found that residential areas with a higher proportion of a youngpopulation are likely to be greater water consumers due to a higherfrequency of laundering and outdoor water use for recreationalpurposes. The opposite behavior occurs in the case of residentialdevelopments designed predominantly for an elderly population,whom the authors identified as much thriftier water consumers.Similar results were shown by Martínez-Espiñeira (2003) in thecase of municipalities in Galicia (Spain), who concluded that theresidential population over 64 years of age had a more austerewater consumption compared with the younger population. Incontrast, municipalities with a higher proportion of the populationless than 19 years old observed higher domestic water consump-tion. After this general trend, however, some caveats are in order.Mayer et al. (1999) found in different cities of the USA and Canadathat children consume less tap water than teenagers and adults.Moreover, older people tend to spend more time at home andengage in gardening practices, as shown by Lyman (1992), whichmay lead to greater water consumption.
In their research in Shoalhaven (Australia), Gregory and Di Leo(2003) found that residents with below the minimum billablewater consumption were older, had a lower educational level andwere prone to have habits related to water conservation. The au-thors argued that this generation of elderly people did not usuallyenjoy a high purchasing power and, therefore, were forced to save
X. Garcia et al. / Applied Geography 41 (2013) 46e54 47

Author's personal copy
water. The authors also argued that older people grew up in rural orsemi-rural areas, where awareness about water scarcity and theneed to save water from tanks or reservoirs was a part of theirroutine. Gilg and Barr (2006) also support this argument because,in their study conducted in the city of Devon (UK), the populationgroup more prone to perform actions conserving domestic waterand energy was the older group, which was also the group lesslikely to have received any formal education.
Household income and education level
The demand of many consumer goods, such as water, tends toincrease proportionally with the income of households. Even today,the water bill represents a very small portion of the family budget.Therefore, it is important to know the real magnitude of the effectof income on water consumption (Arbués, García-Valiñas, &Martínez-Espiñeira, 2003; Chicoine & Ramamurthy, 1986). Inmost studies, the variable income is expressed as a net amount ofmoney that an individual or household receives per unit of time.Other studies have used the property value of a house as a proxy ofthe economic status of its residents (Arbués et al., 2008; Dandyet al., 1997).
Income elasticity appears to be positive (Agthe & Billings, 1987;Chicoine & Ramamurthy, 1986; Garcia & Reynaud, 2003; Höglund,1999; Nieswiadomy & Cobb, 1993; Renwick & Archibald, 1998).The coefficient of income elasticity is inelastic, with values rangingbetween 0.7 and 0.005. Worthington and Hoffman (2008) arguethat the lack of income elasticity may be a consequence of aspecification error or a lack of socio-economic variability in thesampled households. The income elasticity may be greater indeveloping countries than in rich countries, as observed by Flörkeand Alcamo (2004) for several European cases. According to theseauthors, there is a stage of increase in the average householdconsumption proportional to the average household income. Astabilization stage would follow, and finally, a maximum level ofincome would be reached, where consumption is maintaineddespite an increase in wealth. Worthington and Hoffman (2008)also concluded that either increasing or decreasing block-ratepricing would assimilate, and therefore reduce, the magnitudeand significance of an income effect on the residential waterdemand.
The estimated effect of income elasticity on water consumptionmust be considered a short-term effect. Income is also an indicatorof household wealth and, thus, of the capability to purchase luxuryitems that may consume more water, such as pools, spas or largerhouses with lawns. This “second” effect of income on demand isusually long-term and therefore difficult tomodel. For example, in astudy conducted in Phoenix (USA), Larsen and Harlan (2006)described landscaping as a measure by which a society identifiesthe status of its individuals, just as type of housing is used.
Moreover, income can have a positive indirect effect on watersavings as a result of its relationship with education. Flack andGreenberg (1987) studied the attitudes of residents toward waterconservation in 7 cities in the state of Colorado (USA), finding thatthe likelihood of installing mechanisms to conserve water for toi-lets and showers increased with income and education level. Berk,Schulman, McKeever, and Freeman (1993), in the case of the LosAngeles area and the Bay Area of San Francisco, also showed thatthere was a positive relationship between income and water-conservation behaviors. Hines, Hungerford, and Tomera (1987),according to the results of their meta-analysis, argued that, actionstaken to save water are more likely to be associated with the groupof people with higher incomes. However, De Oliver (1999), in hisstudy conducted in the city of San Antonio (USA), reported con-tradictory results, observing that the group with a higher income
and education level performed less water saving during a voluntaryconservation campaign.
Birthplace
Studies such as those of Griffin and Chang (1990) and Gaudin,Griffin, and Sickles (2001) used the percentage of the Hispanicpopulation as an explanatory variable of water consumption invarious regions of Texas, with conflicting results. The first studyshowed that this variable did not have a significant and positiverelationship, while the second demonstrated a significant andnegative relationship. Nauges and Reynaud (2001) argued in theircase study (in the areas of Moselle and the Gironde, France) thatimmigrants from developing countries are characterized by moreaustere water behaviors. In a study conducted in the MetropolitanArea of Barcelona, March et al. (2012) found that the proportion ofpeople from developing or developed countries is inversely relatedto domestic water consumption.
The origin of residents can also influence, for example, the typeof landscaping. People who come frommore humid climate regionsor those who come from communities where it is customary toplant a certain type of vegetation will continue to favor the sametype of landscape in their new location, regardless of different cli-matic conditions (Wentz & Gober, 2007). Water savings gainedthrough educational campaigns may vary significantly amongethnic groups (De Oliver, 1999). Smith and Ali (2006) also found, inthe case of 17 urban areas in the UK, that factors such as ethnicityand religion influenced the daily and seasonal water-use patterns ofhouseholds.
Urban and social dynamics in the study area
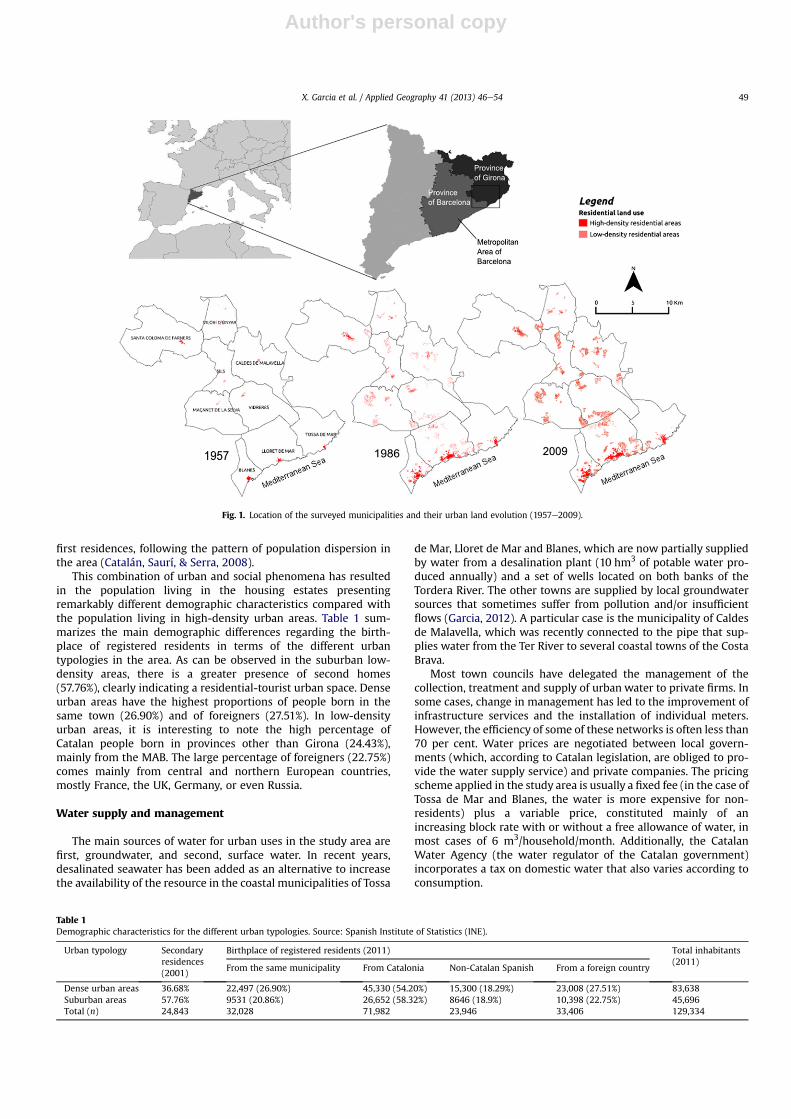
The study area included low-density suburban developmentsfrom 9 municipalities of Girona Province (northeast Catalonia,Spain). Three of these municipalities are located along the coastalarea of the Costa Brava, and the remaining six are located inland(Fig. 1). The total population of these municipalities was approxi-mately 129,000 in 2011. The area is known for being a touristdestination of international fame, which contributes to an equiva-lent annual population of 192,000. Tourism in recent decades hasled to an unprecedented development of urban land, mainly forhotels and recreational residences.
Urban development in the early 1960s led to the creation of so-called ‘urbanitzacions’ (low-density residential estates), profoundlymarking the urban structure of these municipalities (Observatoridel Paisatge, 2010; Valdunciel, 2011). In a first stage, these estateswere developed on coastal and forest areas, often on steep slopes.The estates on the coast, often near coves and cliffs, take the form ofluxury homes owned or rented by European upper-class tourists.Conversely, inland housing estates appearing a little later wereoften built chaotically with elements of the urban landscape (e.g.,sidewalks, power and sanitation facilities, paved streets) present inpoor conditions or even absent for many years. These urban con-centrations in the middle of the countryside responded to thegrowing demand by many different social segments in the Metro-politan Area of Barcelona (MAB) but also in the major cities ofGirona province with extremely dense neighborhoods (Valdunciel,2011). The first wave of owners of these inland housing estates wasconstituted by low- and middle-income people with rural rootswho had migrated to Barcelona and its metropolitan area duringthe period 1950e1975. Significantly, many of the older houses inthese new urban pockets were built by the same owners duringweekends and holidays. Gradually, houses in urbanitzacionsswitched from being almost exclusively second homes to becoming
X. Garcia et al. / Applied Geography 41 (2013) 46e5448
Author's personal copy
first residences, following the pattern of population dispersion inthe area (Catalán, Saurí, & Serra, 2008).
This combination of urban and social phenomena has resultedin the population living in the housing estates presentingremarkably different demographic characteristics compared withthe population living in high-density urban areas. Table 1 sum-marizes the main demographic differences regarding the birth-place of registered residents in terms of the different urbantypologies in the area. As can be observed in the suburban low-density areas, there is a greater presence of second homes(57.76%), clearly indicating a residential-tourist urban space. Denseurban areas have the highest proportions of people born in thesame town (26.90%) and of foreigners (27.51%). In low-densityurban areas, it is interesting to note the high percentage ofCatalan people born in provinces other than Girona (24.43%),mainly from the MAB. The large percentage of foreigners (22.75%)comes mainly from central and northern European countries,mostly France, the UK, Germany, or even Russia.
Water supply and management
The main sources of water for urban uses in the study area arefirst, groundwater, and second, surface water. In recent years,desalinated seawater has been added as an alternative to increasethe availability of the resource in the coastal municipalities of Tossa
de Mar, Lloret de Mar and Blanes, which are now partially suppliedby water from a desalination plant (10 hm3 of potable water pro-duced annually) and a set of wells located on both banks of theTordera River. The other towns are supplied by local groundwatersources that sometimes suffer from pollution and/or insufficientflows (Garcia, 2012). A particular case is the municipality of Caldesde Malavella, which was recently connected to the pipe that sup-plies water from the Ter River to several coastal towns of the CostaBrava.
Most town councils have delegated the management of thecollection, treatment and supply of urban water to private firms. Insome cases, change in management has led to the improvement ofinfrastructure services and the installation of individual meters.However, the efficiency of some of these networks is often less than70 per cent. Water prices are negotiated between local govern-ments (which, according to Catalan legislation, are obliged to pro-vide the water supply service) and private companies. The pricingscheme applied in the study area is usually a fixed fee (in the case ofTossa de Mar and Blanes, the water is more expensive for non-residents) plus a variable price, constituted mainly of anincreasing block rate with or without a free allowance of water, inmost cases of 6 m3/household/month. Additionally, the CatalanWater Agency (the water regulator of the Catalan government)incorporates a tax on domestic water that also varies according toconsumption.
Table 1Demographic characteristics for the different urban typologies. Source: Spanish Institute of Statistics (INE).
Urban typology Secondaryresidences(2001)
Birthplace of registered residents (2011) Total inhabitants(2011)
From the same municipality From Catalonia Non-Catalan Spanish From a foreign country
Dense urban areas 36.68% 22,497 (26.90%) 45,330 (54.20%) 15,300 (18.29%) 23,008 (27.51%) 83,638Suburban areas 57.76% 9531 (20.86%) 26,652 (58.32%) 8646 (18.9%) 10,398 (22.75%) 45,696Total (n) 24,843 32,028 71,982 23,946 33,406 129,334
Fig. 1. Location of the surveyed municipalities and their urban land evolution (1957e2009).
X. Garcia et al. / Applied Geography 41 (2013) 46e54 49
Author's personal copy
In 2011, the average water consumption in the urbanitzacionsof the study area was 304.6 L/household/day (lowest:195.46 L/household/day; highest: 394.17 L/household/day). Most ofthese municipalities have experienced a decrease in water con-sumption during the last five years. Although the economic crisiscould be partially responsible for this, some local and regionalwater authorities (such as the Catalan Water Agency) identify thewater-saving campaign launched after the last drought (2007e2008) as the main reason for this reduction. Another candidate forexplaining the decrease in consumption is the rise in water prices.In the Girona Province in 2008, the average water price for 1 m3 permonth was 1.003V. In 2012, the same average water price hadjumped to 1.244V (both prices without taxes) (ACA, 2012).
Methods
Sampling and instrumentation
This paper analyses the results of a survey of 236 residents insingle-family houses in the study area. Approximately 18,600 single-family houses were located in the area and were distributed within1577 cadastral (property information, used as a basis of taxation)tracts. From this population, a sample of 172 cadastral census tractswas randomly selected to provide a total sample of 1650 households.Because of the high number of second homes, many of which werenotoccupiedat the timeofdata collection,weselecteda large samplesize to compensate for a likely low response rate. Of the 236 surveys,only 230were used in this analysis because 6 of the houses surveyeddid not possess any type of garden, as part of the study concernswater use in the garden. A sample size calculation based on a Poissondistribution confirmed that the sample included a proportion of thepopulation large enough to be representative. To facilitate the pres-ence of secondary residents in the survey, data collection began onJune 23, 2010 and was completed on September 9, 2010, that is,during the summer-vacation period. Secondary residents were spe-cifically asked to refer to their second home rather than their mainresidence when responding to the survey questions.
The survey questionnaire was organized into 4 sections: (i)socio-demographic information of the individuals; (ii) physicalcharacteristics of the dwelling and outside space, including thegarden; (iii) a series of questions concerning water-relatedbehavior and attitudes toward water conservation and gardening;and (iv) consumption data from water bills. The questionnaireitems addressing behavior and attitudes were designed as Likert-type statements that were rated on a five-point scale rangingfrom 1 (“completely disagree”) to 5 (“completely agree”). Fouritems were used to measure water-conservation attitudes: “Savingwater takes more effort than it is worth” (AT1); “Tap water is aresource too valuable to be wasted” (AT2); “I would not change mylifestyle to save a bit of water” (AT3); and “Saving water is a dutythat even has to be fulfilled when we are not in a situation ofdrought” (AT4). Four items were also used to elicit information onrespondents’ landscaping and in-house water use and conservationhabits: “When I have to buy plants for my garden, I always buythose that do not have to bewatered so often” (SRB1); “When I havea shower, I close the tap while I soap” (SRB2); “I water the gardenearly in the morning or late in the evening” (SRB3); and “I usuallyuse the washing machine when is not completely full” (SRB4). ItemAT3 was removed from the scale to achieve unidimensionality andto validate the water-conservation attitude (WCA) variable. Withthe remaining 3 scales, this variable has a Cronbach’s alpha of 0.65.The scale variable “water-conservation habits” could not be calcu-lated due to a lack of internal consistency (a ¼ 0.46); thus, eachhabit item (SRB1, SRB2, SRB4 and SRB3) was compared with thesocio-demographic variables independently.
In the first section of the survey, which collected themain socio-demographic data, eight variables were chosen for analysis: sex,type of residence, age, educational level, plot area, household size,value of the property and length of residence (years the residentsresided permanently or seasonally in the house). Informationregarding the water consumption of households was drawn fromthe last part of the survey. Regarding birthplace, we worked withthe following 3 groups. 1) Catalonia: Catalonia-born residents; 2)RSpain: Spanish residents not born in Catalonia; and 3) Rworld:residents born outside of Spain.
Analysis
First, we descriptively explored a set of socio-demographicvariables regarding the birthplace of the surveyed residents (Cat-alonia, RSpain and Rworld). The WCA and habit scales in relation toresidential water use (SRB1, SRB2, SRB3 and SRB4) were alsocompared. A univariate analysis of variance was applied using aKruskaleWallis non-parametric test. This test was chosen due tosuspicion that the data did not meet the assumptions of normalityand homoscedasticity (Higgins, 2005). The chi-squared test wasused for comparison among the groups with regard to the otherdiscrete variables.
Once this part was completed, a Principal Components Analysis(PCA) with varimax rotation was conducted with the set of socio-demographic variables (minus the variables birthplace, sex andplot surface). This step allowed the identification of linear combi-nations of the original variables, which helped with the interpre-tation of the data. Factors with eigenvalues greater than 1 and itemswith a load factor above 0.4 formed the basis for the interpretationof the results (Hair, Anderson, Tatham, & Black, 1999). At the end ofthe PCA, 3 factors were extracted from the 6 original variables,explaining approximately 86% of the variance (Table 3). The KMOindex above 0.5 (0.53) indicated that the intercorrelation amongthe variables was considerable, and it was therefore appropriate toconduct a PCA. Bartlett’s test of sphericity (Chi-square ¼ 148.84,df ¼ 15, p < 0.01) confirmed that the correlation matrix was not anidentity matrix, and therefore, significant correlations existedamong the variables, indicating that the model factor was relevant.With the 3 factors, a factorial analysis of variance using univariateANOVAwas conducted. Because our purpose was to identify whichfactors better defined each group by birthplace (based on averagedifferences between each pair), a post-hoc Bonferroni test wasconducted. This test was used to compare the averages of multiplevariables according to the respective birthplace groups. Any sig-nificant result regarding the multiple comparison tests amongbirthplace groups for the 3 socio-demographic factors obtainedindicates that the average with respect to a particular group differssignificantly from the other groups compared.
Although it is a debated issue (see Willis, Stewart,Panuwatwanich, Williams, & Hollingsworth, 2011), positive envi-ronmental attitudes may not consistently explain actual environ-mental behavior (De Oliver, 1999; Diamantopoulos, Schlegelmilch,Sinkovics, & Bohlen, 2003). The second part of the study soughtto further elucidate the actual interaction of the local suburbangroups and the metered water-use data (liters per person per day,or LPD). Unbalanced data from 77 surveyed households (thoseproviding information from their water bills) were used to test thestatistical interaction between the groups and the recorded do-mestic water consumption. Each surveyed household in the samplecould have contributed from 1 to 6 records of water consumption tothe database. Therefore, a panel data set with a sample of 226 casesin total was obtained. Because there observations were generatedfrom the same subject, it is possible that the error terms within asubject were correlated. To take into account this inherent
X. Garcia et al. / Applied Geography 41 (2013) 46e5450

Author's personal copy
autocorrelation as if it were a random effect within a subject, therandom effect was fixed using a GLMM. GLMMs combine theproperties of two statistical frameworks, linear mixed models(which incorporate random effects) and generalized linear models(which handle non-normal data by using link functions andexponential family probability distributions). These features makeGLMMs the best tool for analyzing non-normal data that involverandom effects (Bolker et al., 2008).
The fixed effects tested in this model were the group factor(Catalonia, RSpain or Rworld) and the scaled variable WCA. Thevariable WCA is a combination of multiple items. Therefore, it canbe treated as interval data and be included in parametric statisticaltests (Brown, 2011). The WCA and the dependent variable werelogarithmically transformed to upgrade the robustness of themodel, stabilizing variance and improving normal approximation,with the resulting variables renamed as Ln_WCA and Ln_LPD.Square root transformation on both variables was also tested, butthe former method performed a better goodness of fit, as indicatedby the Akaike’s Information Criteria (AIC). Consumption data camefrom water bills provided by different water companies, and someof the companies charged their customers for different numbers ofmonths (either 3 or 2) and years (2008 or 2009). It is well knownthat temperature is related to household water consumptionbecause, among other reasons, the evapotranspiration of the plantsin the garden increases with increasing temperature (Billings &Agthe, 1980; Martínez-Espiñeira, 2003). The average monthlytemperature for the recorded water bills from a close meteoro-logical station (in the municipality of Vilobí d’Onyar) was assignedto each case. The average temperature variable (�C) was thereforeused as another random effect included in the GLMMmodel as wellas the subject. Therefore, the subject effect was taken into accountby the variable “Id”, and the intra-subject effect was included in thevariable “average temperature of billed months”. The strategyadopted to select the proper covariance structure was, in this case,the information criterion (AIC) given by several trials (Kincaid,2005). The optimal solution in this case (AIC ¼ 434.56) was toselect for unstructured covariance.
Results and discussion
Socio-demographic features of the groups of residents based on theirplace of birth
Table 2 presents the average values (or frequencies) of thedifferent socio-demographic variables in each group of residentsaccording to their birthplace (Catalonia, RSpain and Rworld),together with the results of different statistical tests applied. Thisdescriptive exploration of a set of socio-demographic variablesregarding the birthplace of the surveyed residents unravels sig-nificant patterns among groups. According to the results, residentsfrom other regions of Spain (RSpain) frequently owned a secondaryresidence (50.98%), especially when compared with the groupCatalonia (31.48%). Regarding age, the group RSpain showed asignificantly older average (approximately 61 years), especiallycompared with the group Catalonia (47.1 years). Regarding theeducational level, the group Catalonia had a larger number of in-dividuals with records in the second and third educational levels(41.67 and 24.07%, respectively) compared with the RSpain group(13.73% and 9.8%, respectively), but it was behind the group Rworld.With reference to the variable “length of residence”, the groupRSpain appeared to have lived in the study area longer, (64.71% ofthe total in this group for more than 10 years).
The exploration of the socio-demographic profiles character-izing the different groups living in the suburban developments wasmade clear with the implementation of the principal componentanalysis. Table 3 shows the resulting rotated factor matrix. Based onthe outlined Rotated Factor Loadings (RFLs), the factors werelabeled as follows. Factor 1, which represented 25.05% of the totalvariance, was called “Residential characteristics”. The high negativeand positive correlation with the variables type of residence (withRFL ranging to �0.818) and length of residence (RFL of 0.758) pro-vided evidence that the positive values of this factor could repre-sent those residents who had invested in buying or renting asecond home a long time ago, with the home remaining a secondhome. Factor 2, which represented 24.44% of the total variance, was
Table 2Socio-demographic characteristics and water-conservation attitudes according to place of birth.
Variable Total Place of birth Test statistic and significance
Catalonia RSpain Rworld
Gender 1 ¼ Female (%) 53.02 47.22 59.8 50 Chi-square ¼ 3.423(p > 0.05)0 ¼ Male (%) 46.98 52.78 40.2 50
Type of residence 1 ¼ Main residence (%) 59.91 68.52 49.02 68.28 Chi-square ¼ 9.000(p < 0.05)0 ¼ Secondary residence (%) 40.09 31.48 50.98 31.82
Average Age Years 53.35 47.1 60.93 48.86 KruskaleWallis H ¼ 51.589 (p < 0.05)Education 1 ¼ No formal education (%) 8.62 3.7 14.71 4.55 Chi-square ¼ 46.151
(p < 0.05)2 ¼ First grade (%) 43.53 30.56 61.76 22.733 ¼ Second grade (%) 28.88 41.67 13.73 36.364 ¼ Third grade (%) 18.97 24.07 9.8 36.36
Average plot size m2 873.07 837.26 932.31 774.23 KruskaleWallis H ¼ 4.023 (p > 0.05)Length of residence 1 ¼ < 2 years 7.76 8.33 2.94 27.27 Chi-square ¼ 24.380
(p < 0.05)2 ¼ 2e4 years 11.64 14.81 6.86 18.183 ¼ 5e9 years 27.16 29.63 25.49 22.734 ¼ 10e14 years 12.50 9.26 16.67 9.095 ¼ 15e20 years 11.21 9.26 13.73 9.096 ¼ > 20 years 29.74 28.70 34.31 13.64
Property value V 75,224.03 75,209.48 71,179.73 94,046.3 KruskaleWallis H ¼ 4.498 (p > 0.05)Household size n� residents 3.091 3.194 2.951 3.227 KruskaleWallis H ¼ 4.399 (p > 0.05)Water-conservation attitudes Score 4.508 4.424 4.627 4.364 KruskaleWallis H ¼ 8.168 (p < 0.05)Habit_1 Score 3.763 3.713 3.863 3.545 KruskaleWallis H ¼ 2.838 (p > 0.05)Habit_2 Score 4.19 4.12 4.363 3.727 KruskaleWallis H ¼ 5.484 (p < 0.1)Habit_3 Score 4.586 4.537 4.608 4.727 KruskaleWallis H ¼ 1.205 (p > 0.05)Habit_4 Score 4.496 4.509 4.529 4.273 KruskaleWallis H ¼ 1.187 (p > 0.05)Total n 232 108 102 22 e
% 100 46.55 43.97 9.48
X. Garcia et al. / Applied Geography 41 (2013) 46e54 51

Author's personal copy
called “Household characteristics”. The high negative correlationwith the variable household size (the RFL was �0.733), and positivecorrelation with the variable age (RFL of 0.702) suggested thatpositive values of this component fit with those retired householdsin which the children have left home as well as households with alower educational level (with an RFL for this variable of �0.503),suggesting a more rural origin. The last factor, 3, representing18.62% of the total variance, was called the “Socio-economical level”.The high negative correlation with the value of the property (RFL of0.821) seemed to assign positive values of this component to all ofthe households with higher economic status, which is corroboratedby the positive correlation with the variable education (the RFL wasalso positive, with a value of 0.615).
A post hoc Bonferroni test was conducted to discernwhat hiddendifferences existed between birthplace groups in relation to thesocio-demographic factors previously identified through the prin-cipal component analysis. Table 4 presents these results. Note thatin all 3 of the socio-demographic factors (“Residential characteris-tics,” “Household characteristics” and “Socio-economical level”), thegroup RSpain always scored significantly differently, on average,compared with the other groups. Moreover, the Rworld and Cata-lonia groups, on average, did not score significantly different whencomparing the 3 factors. Regarding the factor “Residential charac-teristics”, this analysis confirmed that the group RSpain scoredsignificantly higher than the others, with an average difference of0.535 from the group Catalonia and 0.734 from the group Rworld.Because the test was rated so highly toward the factorial factor“Residential characteristics”, the result describes this group as acluster of urban individuals (particularly from the MetropolitanArea of Barcelona) but with a rural origin who, since the estab-lishment of these residential estates, had invested in a second home
and had kept it until the present (Valdunciel, 2011). The groupRSpain also scored significantly higher regarding the factor“Household characteristics”, with an average difference of approxi-mately 0.640 and 0.672 compared with the Catalonia and Rworldgroups. It can be deduced from this result that this group comprisedmany elderly households without children and with a rural back-ground, as indicated by the low opportunity to access advancededucation. Finally, the Catalonia and Rworld groups scored signifi-cantly higher relative to the RSpain group with respect to the factor“Socio-economic level”, with average scores of �0.464 and �0.723,highlighting a higher educational level (due to their urban roots)and a higher property value.
Water attitudes and behavior regarding the different groups
After analyzing the most relevant socio-demographic featuresthat characterized each group according to their birthplace, werefer now to the univariate analyses of variance conductedregarding the different scales of water-use attitudes and behaviorsin the study area (Table 2). The resulting scale of attitudes (WCA)showed significant differences among group averages (H ¼ 8.168,p < 0.05), with the RSpain group obtaining the highest score.Regarding the scales corresponding to the behavior of the re-spondents in relation to residential water use, every KruskaleWallis test conducted showed non-significant results, with theexception of the scale SRB2 “When I have a shower, I close the tapwhile I soap”, although this test had a very low significance level(H ¼ 5.484, p < 0.1). In this case, the group RSpain scored higher aswell.
The results of the GLMM are shown in Table 5. This exploratorymodel highlights the existence of an interaction between domesticwater consumption and the socio-demographic features of the in-dividuals, conditioned significantly and particularly by theirbirthplace, as has been stated previously. The inclusion of the var-iable water-conservation attitudes and its interaction effects(birthplace andWCA on LPD) allowed the model to test the relevantimplication of this variable on water consumption without beingdistorted by the socio-demographic effects of the birthplace factoror the other way around. The significant interaction of both thebirthplace factor and WCA has been previously found.
Specifically, the model shows that if RSpainwas maintained as areference group, the members of this group consumed significantlyless water per capita compared to the group Rworld. Despite asignificance level of 0.1, the RSpain group also presented moreaustere consumption compared with the group Catalonia. Thevariable indicating water-conservation attitude (Ln_WCA) was also,according to the model, a significant factor in reduced residential
Table 3Rotated component matrix of principal component analysis (PCA; varimax rotationwith Kaiser normalization).
Variable Components
1 2 3
Age 0.479 0.702Education �0.503 0.615Length of residence 0.758Household size �0.733Property value 0.821Type of residence �0.818
Table 4Multiple comparisons with the Bonferroni test.
Dependentvariable
(I) Placeof birth
(J) Placeof birth
Averagedifferences (I-J)
Std.error
Residentialcharacteristics
Catalonia RSpain �0.535* 0.133Rworld 0.199 0.225
RSpain Catalonia 0.535* 0.133Rworld 0.734* 0.226
Rworld Catalonia �0.199 0.225RSpain �0.734* 0.226
Householdcharacteristics
Catalonia RSpain �0.640* 0.131Rworld 0.032 0.222
RSpain Catalonia 0.640* 0.131Rworld 0.672* 0.224
Rworld Catalonia �0.032 0.222RSpain �0.672* 0.224
Socio-economiclevel
Catalonia RSpain 0.464* 0.134Rworld �0.259 0.227
RSpain Catalonia �0.464* 0.134Rworld �0.723* 0.228
Rworld Catalonia 0.259 0.227RSpain 0.723* 0.228
*The average difference was significant at the 0.05 level.
Table 5Summary of the GLMM results.
Parametersa,b Estimation Std.error
df t Sig.
Intersection 9.257* 1.629 60.417 5.681 0.000Ln_WCA �3.046* 1.078 61.430 �2.825 0.006Place of birth
(RSpain is thereferencecategory)
Catalonia �3.224y 1.861 58.722 �1.732 0.088RWorld �6.356* 2.688 61.770 �2.364 0.021Ln_WCA(Catalonia)
2.182y 1.244 59.453 1.755 0.084
Ln_WCA(RWorld)
4.315* 1.822 62.003 2.369 0.021
*Significant at the 0.05 level. ySignificant at the 0.1 level.a Ln_LPD (liters per person per day transformed logarithmically); Ln_WCA (water-
conservation attitudes additive scale transformed logarithmically); Catalonia:Catalonia-born residents; RSpain: Spanish residents not born in Catalonia; Rworld:residents born outside of Spain.
b LPD: mean ¼ 150.58; std. ¼ 89.32.
X. Garcia et al. / Applied Geography 41 (2013) 46e5452

Author's personal copy
water consumption. The interaction of both variables also gener-ated a significant effect onwater consumption. At least in our studyarea, these results contradict the assumption that a foreign-bornpopulation presents lower average domestic water consumption(March et al., 2012). The results also show how groups that may beclassified as similar according to nationality (in this case, RSpainand Catalonia) had dissimilar behavior in relation to water uses fordifferent reasons. The higher average age of the group RSpain,mostly retirees without children at home, as explained by the highfactor score of the “Household characteristics” factor (Table 3), mayexplain this more austere use of water in the home (Gilg & Barr,2006; Gregory & Di Leo, 2003; Martínez-Espiñeira, 2003; Nauges& Thomas, 2000). It is also possible that the greater proportion ofindividuals with second homes that belong to RSpain lowered per-capita consumption (Martínez-Espiñeira, 2002). Smaller householdsize did not seem to have a significant influence on the results(Höglund, 1999). Moreover, a group’s lower purchasing power,measured using the value of the property, can also lead to lowerwater consumption (Agthe & Billings, 1987; Chicoine &Ramamurthy, 1986; Garcia & Reynaud, 2003; Höglund, 1999;Nieswiadomy & Cobb, 1993; Renwick & Archibald, 1998) underconditions of increasing block pricing and taking into account theincrease in water prices experienced in recent years. In connectionwith this group’s lower educational levels, the results agree withthose observed by other authors, such as De Oliver (1999), Gregoryand Di Leo (2003) and Gilg and Barr (2006), who showed that userswith a more austere behavior toward water use were also thosewith lower educational levels.
It should be borne in mind that RSpain was also the group ofresidents who had been living for a longer time in these suburbanareas (expressed as the highest score of the factor “Residentialcharacteristics”). It is very common that each suburban develop-ment has its own system for the collection, treatment and supply ofwater. This peculiarity could explain why this group of residentswas more aware of the limits of each particular water system andacted more responsibly than newcomers in the groups Rworld andCatalonia.
Because variables such as water-conservation attitudes are notavailable for the whole region and were mostly generated from thesurvey, this model cannot be used to spatially predict water use.However, themodel may have succeeded in proving how urban anddemographic dynamics influence domestic water consumptionand, therefore, water management at the local scale. From our re-sults, it can be concluded that monitoring areas with changingdemographic and urban dynamics could be important forcomprehensive urbanwater planning. To achieve this objective, theapplication of GIS tools for monitoring past and present urban anddemographic dynamics, for instance at the census track level, maybe very useful, especially if integrated with other physical infor-mation relevant for urban water management at different scales(Martin & Bracken, 1993). In the Mediterranean region, the suc-cessful strategic planning of urban water must consider physicaland socio-demographic aspects (Kent, Newnham, & Essex, 2002),acknowledging both negative (i.e., water as a criterion to limit theurban growth) and positive (i.e., urban entities as water producersafter the mobilization of new resources) interactions.
Conclusions
The results presented in this paper show that the environmentalattitudes and behaviors related to domestic water uses in low-density suburban developments near the city of Girona dependon a set of socio-demographic characteristics, such as a resident’sbirthplace, a family’s lifecycle stage, the length of residence in aspecific place, economic status and educational level. However, and
here lies perhaps the main finding of our study, the demographic(both inter- and intra-scale migration) and urban history of thestudy area also play a very important role because they conditionthe population structure of residents. Although domestic wateruses in these areas can be larger than in dense urban areas, thepopulation structure of our suburban developments, obeyingcertain urban and demographic dynamics, could compensate forthe differences in the consumption patterns of the two urbanmodels.
To the extent that the decentralization of the compact cores ofMAB and other cities of Girona progresses (especially with regard toCatalonia-born residents), the area could experience future in-creases in total and per capitawater consumption and thus increasepressure on local and regional water resources. However, the newsocio-economic scenarios caused by the current economic crisis areproducing a range of socio-demographic changes that may alsohave effects on residential water consumption. One of the mostnegative effects is the increase in household size as a result of theloss of purchasing power of the descendants and other relatives ofcurrent residents and, therefore, the reduction in consumption percapita due to the formation of economies of scale. In fact, the drasticreduction in the purchasing power of householdsmay reducewaterconsumption, at least for non-essential uses, which is very commonin low-density urban areas. Therefore, higher randomness and therecurrence of periods of water stress coupled with a progressiveincrease in the price of water and the aforementioned reduction inhousehold incomes would all contribute to a decrease in con-sumption per capita in forthcoming years; this is a subject forfuture research.
The settlement of new residents from central and northernEurope in these low-density suburban developments, especially inthe Costa Brava, could stimulate the growth of consumption percapita. This hypothesis, however, assumes that the habits of thenew residents in suburban developments will be the same as thecurrent population for each group of residents, although this maynot necessarily be the case. It is possible, for example, that theseforeign residents will adapt their behavior towardwater use as theybecome aware of the environmental characteristics of Mediterra-nean areas. Over time, their gradual integration with the commu-nity may favor the adaptation of their behavior to that of their localneighbors.
From this research, it may become clear that the designers offuture urban water policies and management measures affectingareas with similar urban and demographic dynamics have the re-sponsibility to take a more holistic view and be sensitive to urbanand social realities, together, of course, with economic andecological perspectives.
Acknowledgments
We would like to thank all the participants who agreed tocomplete the survey. We also acknowledge the support of the citycouncils of Lloret de Mar and Blanes as well as the cadastral man-agement section of the La Selva regional council for providing usthe urban cadastral information needed.
References
Askew, L. E., & McGuirk, P. M. (2004). Watering the suburbs: distinction, conformityand the suburban garden. Australian Geographer, 35, 17e37.
Agència Catalana de l’Aigua. (2012). Observatori del preu de l’aigua a Catalunya 2012.Departament de Medi Ambient i Habitatge. Retrieved September 30, 2012,from. http://aca-web.gencat.cat/aca/appmanager/aca/aca/.
Agthe, D., & Billings, R. (1987). Equity, price elasticity, and household income underincreasing block rates for water. American Journal of Economics and Sociology, 46,273e286.
X. Garcia et al. / Applied Geography 41 (2013) 46e54 53
Author's personal copy
Arbués, F., García-Valiñas, M. A., & Martínez-Espiñeira, R. (2003). Estimation ofresidential water demand: a state-of-the-art review. The Journal of Socio-Eco-nomics, 32, 81e102.
Arbués, F., Barberán, R., & Villanúa, I. (2008). Tamaño de los hogares y demanda deagua residencial: una aproximación empírica. In Paper presented at the IIICongreso de AERNA, Palma de Mallorca.
Berk, R. A., Schulman, D., McKeever, M., & Freeman, H. E. (1993). Measuring theimpact of water conservation campaigns in California. Climatic Change, 24,233e248.
Billings, R. B., & Agthe, D. E. (1980). Price elasticities for water: a case of increasingblock rates. Land Economics, 56, 73e84.
Bolker, B. M., Brooks, M. E., Clark, C. J., Geange, S. W., Poulsen, J. R., Stevens, M. H.,et al. (2008). Generalized linear mixed models: a practical guide for ecology andevolution. Trends in Ecology and Evolution, 24(3), 127e135.
Brown, J. D. (2011, March). Likert items and scales of measurement? SHIKEN: JALTTesting & Evaluation SIG Newsletter, 15(1), 10e14. Retrieved Frebrary 23, 2013,from. http://jalt.org/test/PDF/Brown34.pdf.
Catalán, B., Saurí, D., & Serra, P. (2008). Urban sprawl in the Mediterranean? Pat-terns of growth and change in the Barcelona Metropolitan Region 1993e2000.Landscape and Urban Planning, 85, 174e184.
Chicoine, D., & Ramamurthy, G. (1986). Evidence on the specification of price in thestudy of domestic water demand. Land Economics, 62, 26e32.
Dandy, G., Nguyen, T., & Davies, C. (1997). Estimating residential water demand inthe presence of free allowances. Land Economics, 73, 125e139.
De Oliver, M. (1999). Attitudes and inaction: a case study of the manifest de-mographics of urbanwater conservation. Environment and Behavior, 31, 372e394.
Diamantopoulos, A., Schlegelmilch, B. B., Sinkovics, R. R., & Bohlen, G. M. (2003).Can socio-demographics still play a role in profiling green consumers? A reviewof the evidence and an empirical investigation. Journal of Business Research, 56,465e480.
Domene, E., & Saurí, D. (2006). Urbanisation and water consumption: influencingfactors in the Metropolitan Region of Barcelona. Urban Studies, 43, 1605e1623.
Durà, A. (1997). Desconcentración residencial y nueva fragmentación socioespacialen la región de Barcelona. Anales de geografía de la Universidad Complutense, 17,113e129.
Durà, A. (2003). Population deconcentration and social restructuring in Barcelona, aEuropean Mediterranean City. Cities, 20, 387e394.
EEA - European Environment Agency. (2006) Urban sprawl in Europe: The ignoredchallenge. Report Number 10/2006). Copenhagen: EEA. Retrieved September 10,2009, form. http://www.eea.europa.eu/publications/eea_report_2006_10.
EEA - European Environment Agency. (2009) Water resources across Europe-confronting water scarcity and drought. EEA Report 2/2009). Copenhagen: EEA.Retrieved August 20, 2010, from. http://www.eea.europa.eu/publications/water-resources-across-europe.
EEA - European Environment Agency. (2012) Territorial cohesion and water man-agement in Europe: the spatial perspective. Report Number 4/2012). Copenhagen:EEA. Retrieved September 15, 2012, from. http://www.eea.europa.eu/highlights/publications/territorial-cohesion-and-water-management.
Flack, J. E., & Greenberg, J. (1987). Public attitudes toward water conservation.Journal of the American Water Works Association, 79, 46e51.
Flörke, M., & Alcamo, J. (2004). European outlook on water use. Final report. Center forenvironmental systems research. Kassel: University of Kassel. Retrieved February10, 2011, from. http://scenarios.ew.eea.europa.eu/reports/fol949029/fol040583/Water_stress_final_report.pdf/download.
Fox, C., McIntosh, B. S., & Jeffrey, P. (2009). Classifying households for water demandforecasting using physical property characteristics. Land Use Policy, 26, 558e568.
Garcia, S., & Reynaud, A. (2003). Estimating the benefits of efficient water pricing inFrance. Journal of Resource and Energy Economics, 26, 1e25.
Garcia, X. (2012). New urbanization processes and domestic water consumption. Anexploration of relationships in Girona [in Catalan]. PhD Thesis. Girona: Universityof Girona.
Garcia, X., Llausàs, A., & Ribas, A. (2013). Landscaping patterns and sociodemo-graphic profiles in suburban areas: Implications for water conservation alongthe Mediterranean coast. Urban Water Journal, 1e11. http://dx.doi.org/10.1080/1573062X.2012.758296.
Gaudin, S., Griffin, R. C., & Sickles, R. C. (2001). Demand specification for municipalwater management: evaluation of the Stone-Geary form. Land Economics, 77,399e422.
Gilg, A., & Barr, S. (2006). Behavioural attitudes towards water saving? Evidencefrom a study of environmental actions. Ecological Economics, 57, 400e414.
Gregory, G. D., & Di Leo, M. (2003). Repeated behavior and environmental psy-chology: the role of personal involvement and habit formation in explainingwater consumption. Journal of Applied Social Psychology, 33, 1261e1296.
Griffin, R. C., & Chang, C. (1990). Pretest analysis of water demand in thirty com-munities. Water Resources Research, 26, 2251e2255.
Hair, J. F., Anderson, R. E., Tatham, R. L., & Black, W. C. (1999). Análisis multivariante.Madrid: Prentice Hall.
Higgins, J. J. (2005). An introduction to modern nonparametric statistics. Belmont:Thomson Brooks/Cole.
Hines, J. M., Hungerford, H. R., & Tomera, A. N. (1987). Analysis and synthesis ofresearch on responsible environmental behavior: a meta-analysis. Journal ofEnvironmental Education, 18, 1e18.
Höglund, L. (1999). Household demand for water in Sweden with implications of apotential tax on water use. Water Resources Research, 35, 3853e3863.
IPCC e Intergovernmental panel on climate change. (2007). Climate change 2007:Synthesis report. Contribution of working groups I, II and III to the fourth assess-ment report of the intergovernmental panel on climate change. Geneva: IPCC.Retrieved January 15, 2011, from. http://www.ipcc.ch/publications_and_data/publications_ipcc_fourth_assessment_report_synthesis_report.htm.
Kent, M., Newnham, R., & Essex, S. (2002). Tourism and sustainable water supply inMallorca: a geographical analysis. Applied Geography, 22(4), 351e374.
Kincaid, C. (2005). Guidelines for selecting the covariance structure in mixed modelanalysis. In SUGI 30 Proceedings, 198e30.
Larsen, L., & Harlan, S. L. (2006). Desert dreamscapes. Residential landscape pref-erence and behavior. Landscape and Urban Planning, 78, 85e100.
Lyman, R. A. (1992). Peak and off-peak residential water demand. Water ResourcesResearch, 28, 2159e2167.
March, H., & Saurí, D. (2010). The Suburbanization of water scarcity in the Barcelonametropolitan region: sociodemographic and urban changes influencing do-mestic water consumption. The Professional Geographer, 62, 32e45.
March, H., Perarnau, J., & Saurí, D. (2012). Exploring the links between immigration,ageing and domestic water consumption: the case of the Metropolitan Area ofBarcelona. Regional Studies, 46(2), 229e244.
Martin, D., & Bracken, I. (1993). The integration of socioeconomic and physicalresource data for applied land management information systems. AppliedGeography, 13(1), 45e53.
Martínez-Espiñeira, R. (2002). Residential water demand in the Northwest of Spain.Environmental and Resource Economics, 21, 161e187.
Martínez-Espiñeira, R. (2003). Estimating water demand under increasing-blocktariffs using aggregate data and proportions of users per block. Environmentaland Resource Economics, 26, 5e23.
Mayer, P. W., DeOreo, W. B., Opitz, E., Kiefer, J., Dziegielewski, B., Davis, W., et al.(1999). Residential end uses of water. Denver: American water works Associationresearch Foundation.
Miret, N. (2001). Las aportaciones de la inmigración al proceso de metropolización:el caso de Barcelona. In Scripta Nova 94.
Monclús, F. (1998). Suburbanización y nuevas periférias. Perspectivas geográficourbanísticas. In F. Monclús (Ed.), La ciudad dispersa. Suburbanización y nuevasperiferias (pp. 5e15). Barcelona: CCCB.
Nauges, C., & Thomas, A. (2000). Privately-operated water utilities, municipal pricenegotiation, and estimation of residential water demand: the case of France.Land Economics, 76, 68e85.
Nauges, C., & Reynaud, A. (2001). Estimation de la demande domestique d’eaupotable en France. Revue économique, 52, 167e185.
Nel lo, O. (2001). Ciutat de ciutats: reflexions sobre el procés d’urbanització a Cata-lunya. Barcelona: Empúries.
Nieswiadomy, M., & Cobb, S. (1993). Impact of pricing structure selectivity on urbanwater demand. Contemporary Policy Issues, 11, 101e113.
OP - Observatori del Paisatge. (2010). Catàleg de paisatge de les comarques gironines.Retrieved March 07, 2011, from. http://www.catpaisatge.net/cat/cataleg_presentats_cg.php.
Parés-Franzi, M. (2005). Espai públic enjardinat: impactes ambientals, model urbà iindividualització a la Regió Metropolitana de Barcelona. Documents d’anàlisigeogràfica, 45, 91e110.
Renwick, M., & Archibald, S. (1998). Demand side management policies for resi-dential water use: who bears the conservation burden? Land Economics, 74,343e359.
Saurí, D. (2003). Lights and shadows of urban water demand management: the caseof the metropolitan region of Barcelona. European Planning Studies, 3, 229e243.
Smith, A., & Ali, M. (2006). Understanding the impact of cultural and religious wateruse. Water and Environment Journal, 20, 203e209.
Tong, S. T., Sun, Y., Ranatunga, T., He, J., & Yang, Y. J. (2012). Predicting plausibleimpacts of sets of climate and land use change scenarios on water resources.Applied Geography, 32(2), 477e489.
UN-Water. (2012). Status report on the application of integrated approaches towater resources management. Retrieved March 07, 2011, from. http://www.unwater.org/downloads/UNW_status_report_Rio2012.pdf.
Valdunciel, J. (2011). Paisatge i models urbans contemporanis. Les ComarquesGironines (1979e2006): del desarrollismo a la globalització. PhD Thesis. Girona:University of Girona.
Wentz, E., & Gober, P. (2007). Determinants of small-area water consumption forthe city of Phoenix, Arizona. Water Resources Management, 21, 1849e1863.
Willis, R. M., Stewart, R. A., Panuwatwanich, K., Williams, P. R., & Hollingsworth, A. L.(2011). Quantifying the influence of environmental and water conservationattitudes on household end use water consumption. Journal of EnvironmentalManagement, 92(8), 1996e2009.
Worthington, A. C., & Hoffman, M. (2008). An empirical survey of residential waterdemand modelling. Journal of Economic Surveys, 5, 842e871.
X. Garcia et al. / Applied Geography 41 (2013) 46e5454
Copyright © 2022 FDOKUMEN