Does Social Media Addiction Differ by Personality Traits? A ...
Upload
independentCategory
view
6download
0
RESEARCH ARTICLE
Socio-Cultural Disparities in GDM BurdenDiffer by Maternal Age at First DeliveryMarion Abouzeid1,2, Vincent L. Versace1, Edward D. Janus1,3, Mary-Ann Davey4,5,Benjamin Philpot1, Jeremy Oats4,6, James A. Dunbar1*
1 Greater Green Triangle University Department of Rural Health, Flinders and Deakin Universities,Warrnambool, Victoria, Australia, 2 Department of Epidemiology and Preventive Medicine, MonashUniversity, Victoria, Australia, 3 Department of Medicine, Northwest Academic Centre, The University ofMelbourne andWestern Health, Victoria, Australia, 4 Consultative Council on Obstetric and PaediatricMortality and Morbidity, Clinical Councils Unit, Department of Health, Victoria, Australia, 5 Mother and ChildHealth Research, La Trobe University, Victoria, Australia, 6 Melbourne School of Population and GlobalHealth, The University of Melbourne, Victoria, Australia
Abstract
Aims
Several socio-cultural and biomedical risk factors for gestational diabetes mellitus (GDM)
are modifiable. However, few studies globally have examined socio-cultural associations.
To eliminate confounding of increased risk of diabetes in subsequent pregnancies, elucidat-
ing socio-cultural associations requires examination only of first pregnancies.
Methods
Data for all women who delivered their first child in Victoria, Australia between 1999 and
2008 were extracted from the Victorian Perinatal Data Collection. Crude and adjusted GDM
rates were calculated. Multivariate logistic regression was used to examine odds of GDM
within and between socio-cultural groups.
Results
From 1999 to 2008, 269,682 women delivered their first child in Victoria. GDM complicated
11,763 (4.4%) pregnancies and burden increased with maternal age, from 2.1% among
women aged below 25 years at delivery to 7.0% among those aged 35 years or more. Among
younger women, GDM rates were relatively stable across socioeconomic levels. Amongst
older women GDM rates were highest in those living in most deprived areas, with a strong so-
cial gradient. Asian-born mothers had highest GDM rates. All migrant groups except women
born in North-West Europe had higher odds of GDM than Australian-born non-Indigenous
women. In all ethnic groups, these differences were not pronounced among younger mothers,
but became increasingly apparent amongst older women.
PLOS ONE | DOI:10.1371/journal.pone.0117085 February 13, 2015 1 / 11
OPEN ACCESS
Citation: Abouzeid M, Versace VL, Janus ED, DaveyM-A, Philpot B, Oats J, et al. (2015) Socio-CulturalDisparities in GDM Burden Differ by Maternal Age atFirst Delivery. PLoS ONE 10(2): e0117085.doi:10.1371/journal.pone.0117085
Academic Editor: Patricia Iozzo, National ResearchCouncil (CNR), ITALY
Received: July 28, 2014
Accepted: November 27, 2014
Published: February 13, 2015
Copyright: © 2015 Abouzeid et al. This is an openaccess article distributed under the terms of theCreative Commons Attribution License, which permitsunrestricted use, distribution, and reproduction in anymedium, provided the original author and source arecredited.
Data Availability Statement: The statistical codeused to generate the results in this article is availablefrom Figshare and may be accessed with the DOIhttp://dx.doi.org/10.6084/m9.figshare.1274027. Thecustodian of the dataset used in this paper is theConsultative Council on Obstetric and PaediatricMortality and Morbidity (CCOPMM). All requests toaccess this dataset should be directed to Dr. Mary-Ann Davey (Epidemiologist, Consultative Council onObstetric and Paediatric Mortality and Morbidity,Clinical Councils Unit, Department of Health, 50Lonsdale Street, Melbourne, Victoria, 3000. Phone:

Conclusions
Socio-cultural disparities in GDM burden differ by maternal age at first delivery. Socio-cul-
tural gradients were not evident among younger women. Health and social programs should
seek to reduce the risk amongst all older women to that of the least deprived older mothers.
INTRODUCTIONGestational diabetes mellitus (GDM) begets diabetes. Following a GDM pregnancy, recurrencerates in subsequent pregnancies range from 30% to 84% [1]. GDM also increases the risk of de-velopment of type 2 diabetes in both mother [2] and infant [3].
For many conditions and in many settings, associations of socioeconomic forces with healthstatus are increasingly being described. Despite recognition of the associations of social factorswith deranged glucose metabolism and its sequelae, there has been little attention to the socio-cultural factors associated with GDM [4–14]. Some aspects of reproductive history that are asso-ciated with GDM vary between socio-cultural groups. For example, family size and parity maydiffer between women from different socio-cultural backgrounds and this may differentially in-fluence GDM risk due to issues of GDM recurrence and effects of inter-pregnancy weight gain.When examining socio-economic associations with GDM, considering only women giving birthfor the first time may remove the potential for confounding by some such factors and for residualconfounding by reproductive influences that cannot easily be measured.
GDM is associated with a range of potential adverse outcomes [15]. Several risk factors forGDM are potentially modifiable. So too are many of the social determinants of health, and it isimportant that deprivation does not beget deprivation that begets diabetes. From an epidemio-logical and equity perspective, given that the intrauterine environment influences an infant’sfuture disease risk, identifying and addressing any socio-cultural differences in GDM burdenmay help reduce intergenerational health inequities and modulate future socio-culturaldisease gradients.
We examined the rates of GDM among primiparous women who delivered in the state ofVictoria, Australia over a ten-year period and the associations between socio-cultural factorsand GDM burden.
METHODSUnder Victoria’s public health legislation, all births occurring in the state that are over 20weeks’ gestation or if birthweight is unknown, those with a birthweight greater than 400g, arenotified to the Victorian Perinatal Data Collection (VPDC). Birth report notification forms arecompleted by clinicians. Information collected includes maternal demographic characteristics,reproductive history, and details of ante-, peri- and post-partum progress and complications.
De-identified data for all births to primiparous women who delivered in Victoria between 1January 1999 and 31 December 2008 were extracted from the VPDC. Primiparous women arethose giving birth for the first time. For multiple gestations (i.e. twins, triplets etc.), only thebirth record for the first-born infant was included; each record therefore denotes one pregnantwoman. Datafields obtained for use in this analysis were maternal age at delivery (categorisedas< = 24 years, 25–29, 30–34,> = 35 years), maternal country of birth, maternal Aboriginaland Torres Strait Islander status, residential area postcode, marital status at the time of delivery(married/de facto or single/separated/divorced/widowed), birth plurality (singleton or multiple
Socio-Cultural Disparities in GDM Burden
PLOS ONE | DOI:10.1371/journal.pone.0117085 February 13, 2015 2 / 11
+613 9096 2728, Fax: +613 9096 2700; Email: [email protected]).
Funding: These authors have no support or fundingto report.
Competing Interests: The authors have declaredthat no competing interests exist.

gestation) and GDM status in the index pregnancy (yes/no). GDM status was assigned basedon whether the ‘gestational diabetes’ box on the birth report form was ticked by the cliniciannotifying the birth; accuracy of reporting of GDM in the VPDC is near complete [16] andscreening and diagnostic criteria for GDM in Australia were consistent over the study period[17]. We did not consider gravidity, and so did not exclude women who gave birth to their firstchild but may have had a previous pregnancy that was not carried to 20 weeks gestation.
Maternal country of birth was reclassified into geographic regions, using the Australian Bu-reau of Statistics’ Standard Australian Classification of Countries. We recategorised the ‘Ocea-nia and Antarctica’ group used in this classification system into three distinct categories:Australia (non-Indigenous), Australia (Indigenous), and Oceania. Residential area postcode atthe time of delivery was used to assign a residential area socio-economic status (SES) score,using the Australian Bureau of Statistics’ Index of Relative Socio-Economic Disadvantage(IRSD). This 17-item composite measure incorporates area-based markers of socio-economicdisadvantage, such as the proportion of residents who are unemployed, on low incomes, havelow educational attainment, lack access to a car and so on [18]. Low scores represent relativelyhigh levels of disadvantage in an area, whereas high scores represent a relative lack of disadvan-tage. In this study, each woman was assigned an IRSD score according to that of her residentialpostal area. SES quartiles were then generated by dividing women into four groups, such thatquartile 1 comprised the 25% of women living in the most deprived areas and quartile 4 con-tained the 25% of women living in the least deprived areas. IRSD scores used to define quartileswere 765-, 969–970, 1017–1018 and 1055–1056. These values generally approximated thoseobtained if quartiles were generated based on postcodes, with quartile 1 containing the mostdeprived postcodes and so on.
Statistical analysisData for the ten-year period were analysed collectively, using Stata 12.0. Descriptive statisticswere used to profile demographic characteristics of all primiparous women and those whosepregnancies were complicated by GDM. Characteristics of women with and without GDMwere compared using t-tests for continuous measures and chi-square tests for categorical vari-ables. Crude GDM rates were calculated using the proportions function, and logistic regressionand the margins command yielded adjusted incidence rates. Logistic regression was used to ex-amine univariate associations between GDM and each variable. Multivariate logistic regressionwas used to compare odds of GDM by SES, adjusting for maternal age group and additionally,each of maternal region of birth, marital status and plurality. Similar regression analyses wereused to examine associations between GDM and region of birth, using maternal age group andeach of SES, marital status and plurality as explanatory variables.
The Consultative Council on Obstetric and Paediatric Mortality and Morbidity, VictorianDepartment of Health, granted permission to access and analyse the data. The Flinders Univer-sity Social and Behavioural Research Ethics Committee exempted this study from ethics ap-proval as it involved analysis of existing de-identified data.
RESULTS
Demographic characteristics of all primiparous women who gave birth inVictoria between 1999 and 2008In the decade to December 2008, 269,682 women gave birth to their first child in Victoria andwere registered with the VPDC. All but 922 (0.3%) could be assigned to an SES group and re-gion of birth was known for all but 1153 (0.4%). Women with pre-existing diabetes comprised
Socio-Cultural Disparities in GDM Burden
PLOS ONE | DOI:10.1371/journal.pone.0117085 February 13, 2015 3 / 11

0.4% of all primiparous women who delivered during this period; these women were retainedin the denominator but not considered separately.
Demographic characteristics varied by SES (Table 1). Overall, women living in the most de-prived areas were on average younger than women residing in less deprived areas. Those in themost deprived areas also had lower rates of multiple gestation pregnancies and were less likelyto have a partner (data not shown). Demographic characteristics also varied by maternal regionof birth (Table 1).
Demographic characteristics of women whose pregnancies werecomplicated by GDMGDM complicated 11,763 pregnancies (4.4%). Women who developed GDM were on averagesomewhat older than those without GDM (30.8 years vs. 28.7 years) and resided in areas oflower SES (mean IRSD score 1004 vs. 1010); significantly more of those with GDM had a mul-tiple pregnancy (2.8% vs. 1.9%, p<0.001 for all).
GDM rates increased with rising maternal age, from 2.1% among women aged below 25years at delivery to 7.0% among those aged 35 years or more. GDM was less likely in womenwithout a partner compared with women who were married or de facto (11.5% vs. 16.7%, OR0.65, 95% CI 0.61–0.69). Odds of GDM were 1.52 times higher in women with multiple gesta-tion compared with singleton pregnancies (OR 1.52, 95% CI 1.36–1.70).
Distribution of GDM by socio-economic statusGDM rates varied by SES (Table 2) and were highest among women living in the most disad-vantaged areas. A social gradient was evident, with adjusted odds of GDM decreasing with de-creasing deprivation; incidence did not differ significantly between women in the middle twoSES quartiles.
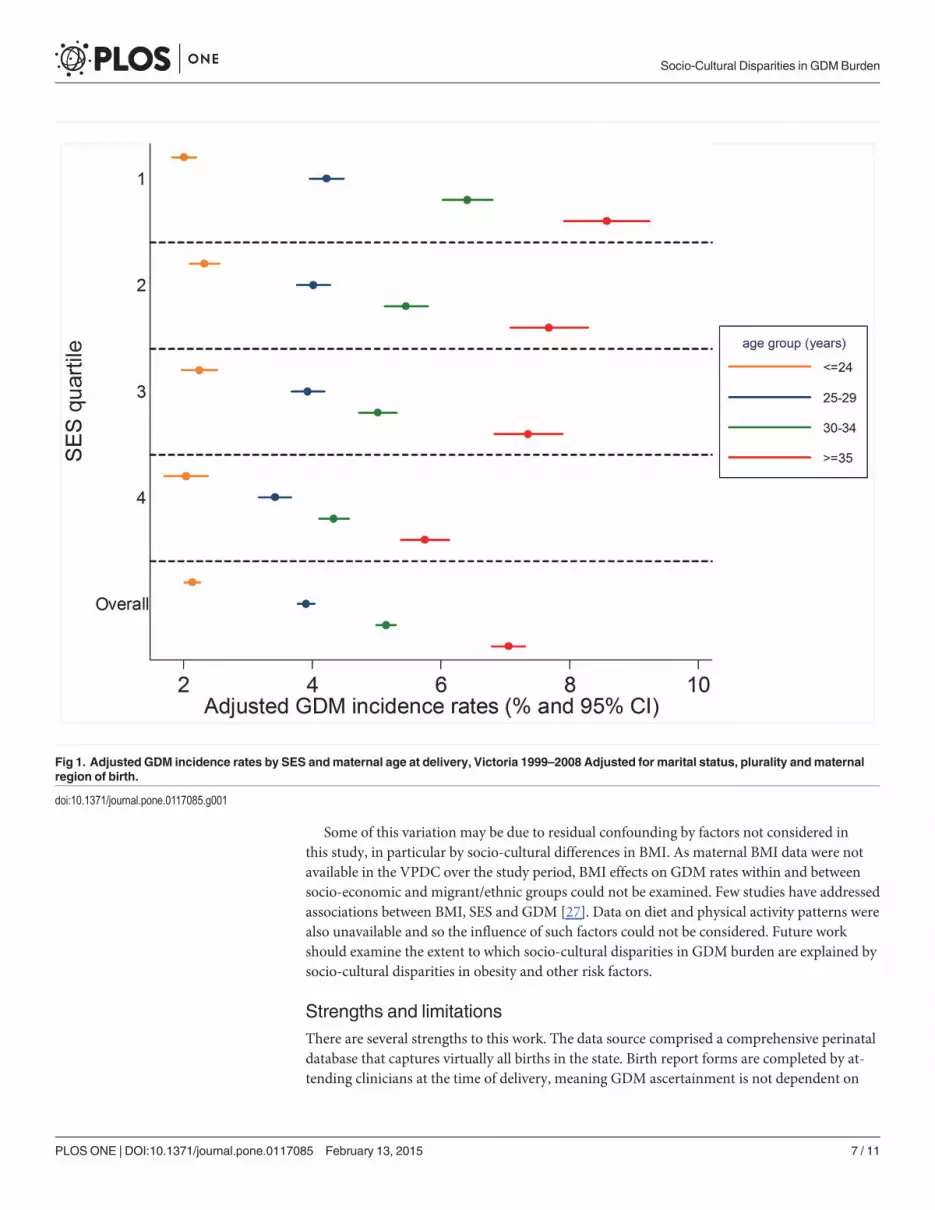
Fig. 1 presents adjusted GDM incidence rates stratified by SES and maternal age group.Within each SES stratum, odds of GDM increased with advancing maternal age. Within eachmaternal age group, SES associations varied – among younger women, GDM incidence was rel-atively stable across SES but a strong social gradient was apparent amongst older women. Pat-terns were similar for crude rates (data not shown).
Distribution of GDM by maternal region of birthGDM rates were highest for women born in the three Asian regions, even after age adjusting(Table 3). Crude odds of GDM were significantly higher in all migrant groups compared withnon-Indigenous Australian-born women; adjusting for age had a pronounced effect for womenborn in North-West Europe and North-East Asia (the migrant groups with the oldest averageage) and North Africa and the Middle East and Southern and Central Asia (the migrant groupswith the youngest average age). For women born in North-West Europe, adjusting for age fullyexplained crude differences with the Australian-born non-Indigenous group. For all migrantgroups, additionally adjusting for marital status, birth plurality and SES, either individually orcollectively, had little effect.
Fig. 2 presents adjusted GDM incidence rates stratified by maternal region of birth and agegroup. Differences in GDM rates were not pronounced among younger mothers, but becameincreasingly apparent amongst older women. Crude patterns were similar (data not shown).
Socio-Cultural Disparities in GDM Burden
PLOS ONE | DOI:10.1371/journal.pone.0117085 February 13, 2015 4 / 11

DISCUSSIONPronounced socio-cultural differences in GDM burden exist among primiparous women inVictoria. These disparities vary by maternal age at delivery—among the youngest women,GDM rates were generally similar across socio-economic strata; however, amongst olderwomen, a strong social gradient was evident. As reported by others [19], migrant and ethnicdisparities were also particularly evident with advancing maternal age.
To our knowledge, this is the first study to report socio-economic gradients in GDM burdenby maternal age and one of few that examines associations between area-based SES measuresand GDM among pregnant women overall [7–9,12–14]. Such associations were last reportedfor Victoria for 1996 [13]. At that time, adjusted GDM incidence differed only between themost and least deprived women. Conversely, in our study for the decade to 2008, a strong over-all social gradient existed for primiparous mothers after multivariate adjustment (Table 2) andthis was due to a social gradient predominantly amongst older women (Fig. 1). There are somemethodological differences between the two studies, but these are unlikely to account for theemergent gradient. Notably, maternal age structure has changed –mean age at delivery amongprimiparous women in Victoria increased from 27.2 years in 1995 to 29.1 years in 2008;women aged over 35 years comprised 14.6% of all women giving birth in Victoria in 1995, and26.5% in 2008 [20].
Associations between maternal age and GDM are well documented (for example, [12–14,19,21]). This study adds to the literature by demonstrating that older women living in less
Table 1. Demographic characteristics of primiparous women delivering in Victoria by residential area socioeconomic status* and maternalregion of birth, Victoria 1999–2008.
RESIDENTIAL AREA SES * n (%) Maternal age at deliveryMean (SD)
SES Mean (SD)
All women GDM All women GDM All women GDM
1 (most deprived) 62578 (23.2) 3040 (25.8) 26.9 (5.7) 29.9 (5.3) 918 (40) 911 (41)
2 66934 (24.8) 2800 (23.8) 27.9 (5.5) 30.1 (5.2) 993 (13) 993 (12)
3 67120 (24.9) 2913 (24.8) 29.1 (5.1) 31.0 (4.9) 1034 (11) 1034 (11)
4 (least deprived) 72128 (26.7) 2975 (25.3) 30.8 (4.8) 32.0 (4.6) 1081 (20) 1080 (19)
REGION OF BIRTH
Australia (non-Indigenous) 202374 (75.0) 6970 (59.3) 28.7 (5.5) 30.5 (5.1) 1013 (59) 1012 (60)
Oceania 6197 (2.3) 267 (2.3) 28.4 (6.1) 30.8 (5.7) 1007 (67) 1000 (69)
North-West Europe 9352 (3.5) 371 (3.2) 31.6 (4.8) 33.1 (4.6) 1033 (54) 1032 (54)
Southern & Eastern Europe 6443 (2.4) 371 (3.2) 29.4 (5.5) 31.8 (5.4) 997 (73) 995 (72)
North Africa & Middle East 5204 (1.9) 266 (2.3) 26.0 (5.6) 29.6 (6.0) 956 (82) 951 (85)
South-East Asia 15585 (5.8) 1438 (12.2) 28.8 (5.0) 31.0 (4.9) 976 (81) 974 (80)
North-East Asia 6573 (2.4) 733 (6.2) 30.7 (4.6) 32.5 (4.3) 1023 (66) 1021 (66)
Southern & Central Asia 8435 (3.1) 903 (7.7) 28.1 (4.4) 29.9 (4.3) 993 (72) 989 (72)
Americas 3322 (1.2) 150 (1.3) 30.2 (5.3) 32.0 (4.9) 1020 (67) 1017 (64)
Sub-Saharan Africa 3489 (1.3) 206 (1.8) 28.9 (5.2) 30.3 (4.6) 1005 (72) 988 (73)
Australia (Indigenous) 1555 (0.6) 41 (0.3) 22.6 (5.9) 25.9 (6.0) 966 (58) 991 (58)
Region unknown 1153 (0.4) 47 (0.4) 27.1 (5.5) 29.2 (4.8) 983 (74) 975 (61)
OVERALL 269682 (100) 11763 (100) 28.7 (5.5) 30.8 (5.1) 1009 (64) 1004 (67)
Note that column totals will vary as they exclude women for whom the variable of interest is not known *Excludes 922 women for whom residential area
SES quartile not known.
doi:10.1371/journal.pone.0117085.t001
Socio-Cultural Disparities in GDM Burden
PLOS ONE | DOI:10.1371/journal.pone.0117085 February 13, 2015 5 / 11

deprived areas have considerably lower GDM rates than older mothers living in more deprivedareas; it would seem that some factor embedded within the SES construct may modulate the es-tablished association between GDM and advancing maternal age. Alternatively, as GDM ratesdid not vary markedly by SES among younger women, it may be that younger age is protectiveagainst neighbourhood characteristics that confer risk. It is not possible to infer causation ordirectionality, or to discern the individual SES components contributing to this gradient. Somecomponents of the neighbourhood SES construct are potentially modifiable. Therefore, futureresearch should seek to identify the specific aspects of residential area SES that are associatedwith GDM risk. This work has important implications: efforts should be directed to reduce therisk amongst all older women to that of the least deprived older group.
The finding that GDM complicated 4.4% of primiparous pregnancies in Victoria overall dur-ing the study period is in the range expected, and consistent with national reports that GDMwasdiagnosed in 4.6% of all pregnancies among women aged 15–49 years in 2005–2006 [22].
Our findings are also consistent with reports from New South Wales, Australia of an inverseassociation between area-based SES and GDM burden for the period 1995 to 2005 [12]. How-ever, independent associations between area-based SES measures and GDM are not reporteduniversally [8,9].
Migrant differences in GDM burden are well established and our results are consistent withAustralian findings from the last four decades [12,13,19,21–26]. Our finding of no significantdifference in GDM burden between Australian-born Indigenous and non-Indigenous womendiffers from national reports [22] and may be due to the small number of Indigenous womenrendering this study underpowered to detect any such effects.
Migrant disparities in GDM in Victoria are particularly pronounced amongst older mothers[19]. In our study, even after considering where a woman was born, amongst older mothers,where she lives was still strongly associated with risk of GDM. Similarly, particularly amongthe oldest women, ethnic differences persisted even after SES adjustment. Together, these re-sults would suggest that with advancing maternal age, both where a woman was born andwhere she lives independently influence GDM risk.
Table 2. Crude and adjusted incidence rates and incidence odds ratios of GDM by residential area socio-economic status, Victoria 1999–2008.
INCIDENCE RATES(%)
INCIDENCE ODDS RATIOS (95% CI)
SES Quartile Crude Age-adjusted Crude Adjusted forage group
Adjusted forage groupand maritalstatus
Adjusted for agegroup and plurality
Adjusted for agegroup andregion of birth
Fully adjustedmodel**
1 4.86 5.52 REF REF REF REF REF REF
(most deprived) (5.33–5.71)
2 4.18 4.45 0.86 0.8 0.79 0.79 0.93 0.93
(4.29–4.61) (0.81–0.90) (0.75–0.84) (0.75–0.83) (0.75–0.84) (0.88–0.98) (0.88–0.98)
3 4.34 4.24 0.89 0.76 0.75 0.76 0.88 0.88
(4.09–4.39) (0.84–0.94) (0.72–0.80) (0.71–0.79) (0.72–0.80) (0.83–0.93) (0.83–0.93)
4 4.12 3.62 0.84 0.64 0.64 0.64 0.73 0.73
(least deprived) (3.49–3.75) (0.80–0.89) (0.61–0.68) (0.60–0.67) (0.61–0.68) (0.69–0.77) (0.69–0.77)
unknown 3.8 4.06 0.77 0.72 0.72 0.72 0.84 0.84
(2.75–5.37) (0.55–1.09) (0.51–1.02) (0.51–1.01) (0.51–1.01) (0.60–1.19) (0.60–1.19)
** adjusted for age group, marital status, plurality, region of birth. Excludes those for whom SES quartile not known.
doi:10.1371/journal.pone.0117085.t002
Socio-Cultural Disparities in GDM Burden
PLOS ONE | DOI:10.1371/journal.pone.0117085 February 13, 2015 6 / 11
Some of this variation may be due to residual confounding by factors not considered inthis study, in particular by socio-cultural differences in BMI. As maternal BMI data were notavailable in the VPDC over the study period, BMI effects on GDM rates within and betweensocio-economic and migrant/ethnic groups could not be examined. Few studies have addressedassociations between BMI, SES and GDM [27]. Data on diet and physical activity patterns werealso unavailable and so the influence of such factors could not be considered. Future workshould examine the extent to which socio-cultural disparities in GDM burden are explained bysocio-cultural disparities in obesity and other risk factors.
Strengths and limitationsThere are several strengths to this work. The data source comprised a comprehensive perinataldatabase that captures virtually all births in the state. Birth report forms are completed by at-tending clinicians at the time of delivery, meaning GDM ascertainment is not dependent on
Fig 1. Adjusted GDM incidence rates by SES andmaternal age at delivery, Victoria 1999–2008 Adjusted for marital status, plurality andmaternalregion of birth.
doi:10.1371/journal.pone.0117085.g001
Socio-Cultural Disparities in GDM Burden
PLOS ONE | DOI:10.1371/journal.pone.0117085 February 13, 2015 7 / 11

maternal recall. Victorian birth report forms were consistent over the study period, as wereGDM screening criteria and diagnostic thresholds. This is one of few studies to consider onlywomen in their first pregnancy. Restricting our focus to primiparous women enabled examina-tion of socio-cultural associations with GDM independent of the effects of parity, interpreg-nancy weight gain and GDM recurrence in subsequent pregnancies. It also means that womenare only represented in the data set once. This ensures statistical rigour, as regression analysesassume that observations are independent – socio-cultural differences in screening rates mayinfluence such assumptions are violated if the same woman is included in a data-set multipletimes, as may occur when the study base comprises all pregnancies over a given time period,during which a woman may have given birth more than once.
Table 3. Incidence rates and incidence odds of GDM by maternal region of birth, Victoria 1999–2008.
Incidence rates (%) Incidence Odds Ratios (95% CI)
REGION OF BIRTH Crude Age-adjusted Crude Adjustedfor age
Adjusted forage, marital
Adjustedfor age,plurality
Adjusted forage, SES
Fully adjusted*
Australia (non-Indigenous) 3.4 3.5 REF REF REF REF REF REF
(3.4–3.5)
Oceania 4.3 4.4 1.26 1.28 1.28 1.28 1.28 1.28
(3.9–4.9) (1.11–1.43) (1.13–1.45) (1.13–1.46) (1.13–1.46) (1.13–1.45) (1.13–1.45)
North-West Europe 4 3.4 1.16 0.97 0.97 0.97 0.99 0.99
(3.0–3.7) (1.04–1.29) (0.87–1.08) (0.87–1.08) (0.87–1.08) (0.89–1.10) (0.89–1.10)
Southern & Eastern Europe 5.8 5.6 1.71 1.65 1.65 1.65 1.64 1.63
(5.0–6.1) (1.54–1.91) (1.49–1.84) (1.48–1.84) (1.49–1.84) (1.47–1.82) (1.47–1.82)
North Africa & Middle East 5.1 6.2 1.51 1.86 1.86 1.86 1.8 1.79
(5.5–7.0) (1.33–1.71) (1.64–2.11) (1.64–2.11) (1.64–2.12) (1.58–2.04) (1.57–2.03)
South-East Asia 9.2 9.3 2.85 2.88 2.88 2.89 2.78 2.79
(8.8–9.7) (2.69–3.02) (2.71–3.06) (2.71–3.06) (2.73–3.07) (2.62–2.95) (2.63–2.96)
North-East Asia 11.2 10 3.52 3.13 3.12 3.14 3.2 3.2
(9.3–10.7) (3.25–3.81) (2.89–3.39) (2.88–3.39) (2.90–3.41) (2.95–3.47) (2.95–3.47)
Southern & Central Asia 10.7 11.3 3.36 3.6 3.59 3.6 3.52 3.51
(10.6–12.0) (3.12–3.62) (3.34–3.87) (3.33–3.86) (3.35–3.88) (3.27–3.79) (3.25–3.78)
Americas 4.5 4.1 1.33 1.2 1.2 1.21 1.22 1.23
(3.5–4.8) (1.12–1.56) (1.02–1.42) (1.02–1.42) (1.02–1.42) (1.04–1.45) (1.04–1.45)
Sub-Saharan Africa 5.9 5.9 1.76 1.74 1.74 1.75 1.74 1.74
(5.1–6.6) (1.53–2.03) (1.51–2.01) (1.51–2.01) (1.51–2.02) (1.50–2.00) (1.51–2.01)
Australia (Indigenous) 2.6 3.9 0.76 1.15 1.15 1.15 1.1 1.11
(2.8–5.1) (0.56–1.04) (0.84–1.57) (0.84–1.58) (0.84–1.58) (0.80–1.50) (0.81–1.52)
Unknown 4.1 4.6 1.19 1.34 1.36 1.34 1.3 1.32
(3.3–5.8) (0.89–1.60) (1.00–1.80) (0.99–1.87) (1.00–1.80) (0.97–1.74) (0.97–1.82)
Overall 4.4 4.4 n/a n/a n/a n/a n/a n/a
(4.3–4.4)
*adjusted for age group, marital status, plurality and SES.
doi:10.1371/journal.pone.0117085.t003
Socio-Cultural Disparities in GDM Burden
PLOS ONE | DOI:10.1371/journal.pone.0117085 February 13, 2015 8 / 11

There are some limitations. The region of birth classification used was broad. The compositeresidential area SES measure is based on 2006 census data and this study assumes that the SESscore for a given postcode was consistent over the study period. Use of an area-level constructrenders this work susceptible to the ecological fallacy, if an individual woman’s SES differsfrom that assigned based on her residential area. Individual-level SES data were not available.There are discrepant reports in the literature about associations between GDM and some indi-vidual-level SES measures, such as income [6,10] and education [4,5,26].
Our findings are not necessarily generalisable to multiparous women. For example, familysize may influence choice of residential area and thus the neighbourhood SES score assigned. Itwas not possible to ascertain if women were screened for GDM – socio-cultural differences inscreening rates may influence case ascertainment and estimates of GDM rates. The high GDMburden among low SES women and in some migrant groups may represent pre-existing butundiagnosed diabetes management guidelines as postpartum oral glucose tolerance test results
Fig 2. Adjusted GDM incidence rates bymaternal region of birth and age at delivery, Victoria 1999–2008 adjusted for plurality, marital status andSES.
doi:10.1371/journal.pone.0117085.g002
Socio-Cultural Disparities in GDM Burden
PLOS ONE | DOI:10.1371/journal.pone.0117085 February 13, 2015 9 / 11

were not available, this cannot be quantified in our data set. Finally, it is possible that somewomen may have had a prior pregnancy that was not carried to at least 20 weeks and thereforehave been included in this study due to being primiparous despite being multigravid. It hasbeen reported that in predominantly primiparous women in China, a history of spontaneousabortion was significantly associated with increased GDM risk [28]. We did not consider histo-ry of terminations or spontaneous abortions, so it is unclear to what extent this may have influ-enced our results.
ConclusionsThat ethnic disparities are particularly pronounced amongst older mothers has been previouslydocumented. This study demonstrates that in addition to older Asian mothers, older womenliving in deprived areas are at greatest risk of GDM, but socio-economic variation is not partic-ularly evident among the youngest first-time mothers. As the average age at first delivery con-tinues to increase [20] and the proportion of older mothers grows, there is an urgent need toidentify and address the elements of the area-based SES construct that are associated with thisincreased risk. This is especially important because some such factors may be modifiable.Given the health risks to the infant of a GDM pregnancy, if GDM and its sequelae are dispro-portionately high among women in deprived areas, the future burden of obesity and type 2 dia-betes may also be concentrated in disadvantaged groups. Addressing the disparity is a matterof intergenerational equity: the intrauterine environment confers increased risk to a child. Wecannot allow neighbourhood environments to magnify this risk.
Author ContributionsConceived and designed the experiments: MA EJ MAD BP JD. Analyzed the data: MAD VVBPMA. Contributed reagents/materials/analysis tools: VV EJ MAD BP JO JD. Wrote thepaper: MA. Supervised the study: JD.
REFERENCES1. Kim C, Berger DK, Chamany S (2007) Recurrence of gestational diabetes mellitus. A systematic re-
view. Diabetes Care 30: 1314–1319. PMID: 17290037
2. Bellamy L, Casas JP, Hingorani AD, Williams D (2009) Type 2 diabetes mellitus after gestational diabe-tes: a systematic review and meta-analysis. Lancet 373: 1773–1779. doi: 10.1016/S0140-6736(09)60731-5 PMID: 19465232
3. Clausen TD, Mathiesen ER, Hansen T, Pedersen O, Jensen DM, et al. (2008) High Prevalence of Type2 Diabetes and Pre-Diabetes in Adult Offspring of WomenWith Gestational Diabetes Mellitus or Type 1Diabetes. Diabetes Care 31: 340–346. PMID: 18000174
4. Bo S, Menato G, Bardelli C, Lezo A, Signorile A, et al. (2002) Low socioeconomic status as a risk factorfor gestational diabetes. Diabetes Metab. 28: 139–140. PMID: 11976566
5. Bertolotto A, Corfini M, Ghio A, Resi V, Lencioni C, et al. (2012) Is maternal educational level a risk fac-tor for gestational diabetes in Caucasian women? Diabet Med. 29: 416–417. doi: 10.1111/j.1464-5491.2011.03484.x PMID: 21992482
6. Joseph KS, Liston RM, Doods L, Dahlgren L, Allen AC (2007) Socioeconomic status and perinatal out-comes in a setting with universal access to essential health care services. CMAJ 177: 583–590. PMID:17846440
7. Jonas O, Roder D, Chan A (1992) The association of maternal and socioeconomic characteristics inmetropolitan Adelaide with medical, obstetric and labour complications and pregnancy outcomes. Aus-tralian and New Zealand Journal of Obstetrics and Gynaecology 32: 1–5. PMID: 1586324
8. Janghorbani M, Stenhouse EA, Jones RB, Millward BA (2006) Is neighbourhood deprivation a risk fac-tor for gestational diabetes mellitus? Diabetic Medicine 23: 313–317. PMID: 16492216
9. Clausen T, Oyen N, Henriksen T (2006) Pregnancy complications by overweight and residential area.A prospective study of an urban Norweigan cohort. Acta Obstetrica et Gynecologica 85: 526–533.PMID: 16752229
Socio-Cultural Disparities in GDM Burden
PLOS ONE | DOI:10.1371/journal.pone.0117085 February 13, 2015 10 / 11

10. Bombard J, Dietz PM, Galavotti C, England LJ, Tong VT, et al. (2012) Chronic Diseases and RelatedRisk Factors among Low-Income Mothers. Maternal and Child Health Journal 16: 60–71. doi: 10.1007/s10995-010-0717-1 PMID: 21153761
11. Devlin HM, Deasai J, Holzman GS, Gilbertson DT (2008) Trends and disparities among diabetes-com-plicated births in Minnesota, 1993–2003. American Journal of Public Health 98: 59–62. PMID:18048797
12. Anna V, van der Ploeg HP, Wah Cheung N, Huxley RR, Bauman AE (2008) Sociodemographic corre-lates of the increasing trend in prevalence of gestational diabetes mellitus in a large population ofwomen between 1995 and 2005. Diabetes Care 31: 2288–2293. doi: 10.2337/dc08-1038 PMID:18809630
13. Stone CA, McLachlan KA, Halliday JL, Wein P, Tippett C (2002) Gestational diabetes in Victoria in1996: incidence, risk factors and outcomes. Medical Journal of Australia 177: 486–491. PMID:12405890
14. Feig DS, Zinman B, Wang X, Hux JE (2008) Risk of development of diabetes mellitus after diagnosis ofgestational diabetes. CMAJ 179: 229–234. doi: 10.1503/cmaj.080012 PMID: 18663202
15. Shand AW, Bell JC, McElduff A, Morris J, Roberts CL (2008) Outcomes of pregnancies in women withpre-gestational diabetes mellitus and gestational diabetes mellitus; a population-based study in NewSouth Wales, Australia, 1998–2002. Diabetic Medicine 25: 708–715. doi: 10.1111/j.1464-5491.2008.02431.x PMID: 18544109
16. Davey M-A, Sloan M-L, Palma S, Riley M, King J (2013) Methodological processes in validating andanalysing the quality of population-based data: a case study using the Victorian Perinatal Data Collec-tion. Health Information Management Journal 42: 12–19. PMID: 24067237
17. Hoffman L, Nolan C, Wilson JD, Oats JJN, Simmons D (1998): Gestational diabetes mellitus –manage-ment guidelines. Medical Journal of Australia 169: 93–97 PMID: 9700346
18. Australian Bureau of Statistics (2008) Information Paper. An introduction to Socio-Economic Indexesfor Areas (SEIFA) 2006. ABS Catalogue No. 2039.0. Canberra: ABS.
19. Carolan M, Davey M-A, Biro MA, Kealy M (2012) Maternal age, ethnicity and gestational diabetes melli-tus. Midwifery 28: 778–783. doi: 10.1016/j.midw.2011.08.014 PMID: 22000676
20. Consultative Council on Obstetric and Paediatric Mortality and Morbidity (2011) Births in Victoria 2007and 2008. Melbourne: Department of Health. doi: 10.1080/17437199.2011.587961 PMID: 25473706
21. TehWT, Teede HJ, Paul E, Harrison CL, Wallace EM et al (2011) Risk factors for gestational diabetesmellitus: Implications for the application of screening guidelines. Australian and New Zealand Journalof Obstetrics and Gynaecology 51: 26–30. doi: 10.1111/j.1479-828X.2011.01292.x PMID: 21299505
22. Templeton M, Pieris-Caldwell I (2008) Gestational diabetes mellitus in Australia, 2005–06. Diabetes se-ries no. 10. Cat. no. CVD 44. Canberra: Australian Institute of Health andWelfare.
23. Von Katterfeld B, Li J, McNamara B, Langridge AT (2011) Obstetric profiles of foreign-born women inWestern Australia using data linkage, 1998–2006. Australian and New Zealand Journal of Obstetricsand Gynaecology 51: 225–232. doi: 10.1111/j.1479-828X.2010.01282.x PMID: 21631441
24. Ma J, Bauman A (1996) Obstetric profiles and pregnancy outcomes of immigrant women in New SouthWales, 1990–1992. Australian and New Zealand Journal of Obstetrics and Gynaecology 36: 119–125.PMID: 8798294
25. Beischer NA, Oats JN, Henry OA, Sheedy MT, Walstab JE (1991) Incidence and severity of gestationaldiabetes mellitus according to country of birth in women living in Australia. Diabetes. 40:35–38. PMID:1748263
26. van der Ploeg HP, van Poppel MNM, Chey T, Bauman AE, BrownWJ (2011) The role of pre-pregnancyphysical activity and sedentary behaviour in the development of gestational diabetes mellitus. Journalof Science and Medicine in Sport 14: 149–152. doi: 10.1016/j.jsams.2010.09.002 PMID: 21030304
27. Park JH, Lee BE, Park HS, Ha EH, Lee SW, Kim YJ (2011) Association between pre-pregnancy bodymass index and socioeconomic status and impact on pregnancy outcomes in Korea. The Journal of Ob-stetrics and Gynaecology Research 37: 138–145. doi: 10.1111/j.1447-0756.2010.01332.x PMID:21159038
28. Yang H, Wei Y, Gao X, Xu X, Fan L, et al. (2009) Risk factors for gestational diabetes mellitus in Chi-nese women—a prospective study of 16 286 pregnant women in China.
Socio-Cultural Disparities in GDM Burden
PLOS ONE | DOI:10.1371/journal.pone.0117085 February 13, 2015 11 / 11
Copyright © 2022 FDOKUMEN