Reducing the Global Burden of Tuberculosis
66
A Technical Supplement: Reducing the Global Burden of Tuberculosis The Contribution of Improved Diagnostics EMMETT B. KEELER AND MARIA E. RAFAEL WR-422-HLTH December 2006 This is supporting material to Keeler E, Mark D Perkins, Peter Small et al. Reducing the Global Burden of Tuberculosis. Nature. S1 49-57 (2006). WORKING P A P E R This product is part of the RAND Health working paper series. RAND working papers are intended to share researchers’ latest findings and to solicit informal peer review. They have been approved for circulation by RAND Health but have not been formally edited or peer reviewed. Unless otherwise indicated, working papers can be quoted and cited without permission of the author, provided the source is clearly referred to as a working paper. RAND’s publications do not necessarily reflect the opinions of its research clients and sponsors. is a registered trademark.
-
Upload
khangminh22 -
Category
Documents
-
view
0 -
download
0
Transcript of Reducing the Global Burden of Tuberculosis

A Technical Supplement: Reducing the Global Burden of Tuberculosis The Contribution of Improved Diagnostics
EMMETT B. KEELER AND MARIA E. RAFAEL
WR-422-HLTH
December 2006
This is supporting material to Keeler E, Mark D Perkins, Peter Small et al. Reducing the Global Burden of Tuberculosis. Nature. S1 49-57 (2006).
WORK ING P A P E R
This product is part of the RAND Health working paper series. RAND working papers are intended to share researchers’ latest findings and to solicit informal peer review. They have been approved for circulation by RAND Health but have not been formally edited or peer reviewed. Unless otherwise indicated, working papers can be quoted and cited without permission of the author, provided the source is clearly referred to as a working paper. RAND’s publications do not necessarily reflect the opinions of its research clients and sponsors.
is a registered trademark.

iiiPreface:
This working paper contains technical material supporting the article by Keeler et al.
“Reducing the global burden of tuberculosis: the contribution of improved diagnostics,”
Nature S1 49-57 2006. It should be read in conjunction with that article. It includes
additional discussion referred to in the published article as well as supplementary
analyses and tables, in particular, some preliminary analyses of tests for Multi-Drug
Resistant Tuberculosis (MDR TB) that were not included in the published paper.
Although this technical supplement in its current form has not been formally peer-
reviewed, an earlier version of this paper, which also contained material that appears in
the corresponding Nature paper, was reviewed by two outside experts and was revised in
response to their comments. The work was funded by the Bill and Melinda Gates
Foundation to support the Global Health Diagnostics Forum.
Acknowledgements:
We would like to thank the Forum Tuberculosis Working Group for their guidance and
data, Milton Weinstein for comments on an earlier draft, and Matteo Zignol for his
extensive guidance and data in the MDR TB analysis.
ivTable of Contents
Introduction
Other Current Diagnostic Tests………………………………………………1
Methods:
Other TB diagnostic indications thought to have less promise……………..1
Other modeling assumptions………………………………………………….2
Further notes on Model Parameters…………………………………………3
Results
Model validation details……………………………………………………....4
Output by Region…………………………………………………………..…4
Discussion
Other limitations…………………………………………………………..… 5
References ……………………………………………………………………………6
Tables for Drug-susceptible TB...…………………………………………………...9
Appendix A: Parameter Derivations………………………………………….. ….20
Appendix B: Preliminary Analysis for MDR-TB tests……………………...……36
Introduction……………………………………………………………………….…36
Modeling MDR-TB……………………………………………………………...…..39
Tree description……………………………………………………..39
Additional assumptions……………………………………………..41
Model parameters…………………………………….……………..43
Results: Impact of new tests on MDR TB…………………………………..……..46
Figures for MDR TB ………………………………………………….……………49
Tables for MDR-TB ……………………………………………………………53

1
The additional text and tables are organized by section of the paper.
Introduction
Other Current diagnostic tests
In addition to the tests discussed in the paper, there are:
Drug susceptibility testing for MDR-TB is discussed in Appendix C.
The tuberculin skin test can detect latent tuberculosis in immuno-competent patients.
However, because so many people in developing countries harbor latent TB (estimates of
up to 2 billion) and so few progress to active tuberculosis, this knowledge is not useful in
controlling the spread of disease.
Methods
Other diagnosis indications thought to have less promise
Here we give other indications and the reasons we did not consider them.
Prognostic indicator for latent infection (i.e. asymptomatic adults) in HIV- adults
Successful treatment for people with latent TB who will develop active TB would
dramatically reduce the incidence of active TB. Such a test would allow stratification for
preventive therapy, because treatment is prolonged and onerous and only a relatively
small proportion of individuals with latent disease progress to active infection. This
would permit targeted preventive therapy to stress the importance of continuing on a
prescribed regimen (e.g., INH) in the absence of active disease. We know some risk
factors: HIV+, malnutrition, smoking, air quality, living with person with active TB.
Unfortunately, we do not know what might be an additional independent prognostic
indicator for active TB that would have a high enough positive predictive value (PPV)
and would be sufficiently common for screening to be cost-effective. (The efficacy
would also depend on how the probability of completing treatment depends on the
probability that the person would develop TB.)
Prognostic indicator for latent infection (i.e. asymptomatic adults) in HIV+ adults
Currently, HIV+ status is the best predictor of development of active TB in patients with
latent TB. It was argued that this group does not need to be tested, but should simply be
treated with (one course of) Isoniazid.
2A test for determining when treated patients are free of disease. A test here would permit
therapy to be discontinued sooner for many patients. While patients now receive a
prescribed course of therapy, many are likely treated longer than they need to be because
no test currently exists that indicates when treatment can safely be stopped. The potential
resource savings from this test seemed less important than a proper assignment of
treatment to patients in the first place.
Screening or active case-finding for pulmonary TB could shorten the infective period and
improve treatment outcomes, but the major benefit would be in detecting cases that
otherwise would not be treated. (Murray, ( in Borghoff)). Because most cases eventually
do present, we agreed with current WHO recommendations that the highest priority is
passive case finding.
Tests for children and for extra-pulmonary TB was considered to be of lower value,
because of the low transmission from such cases.
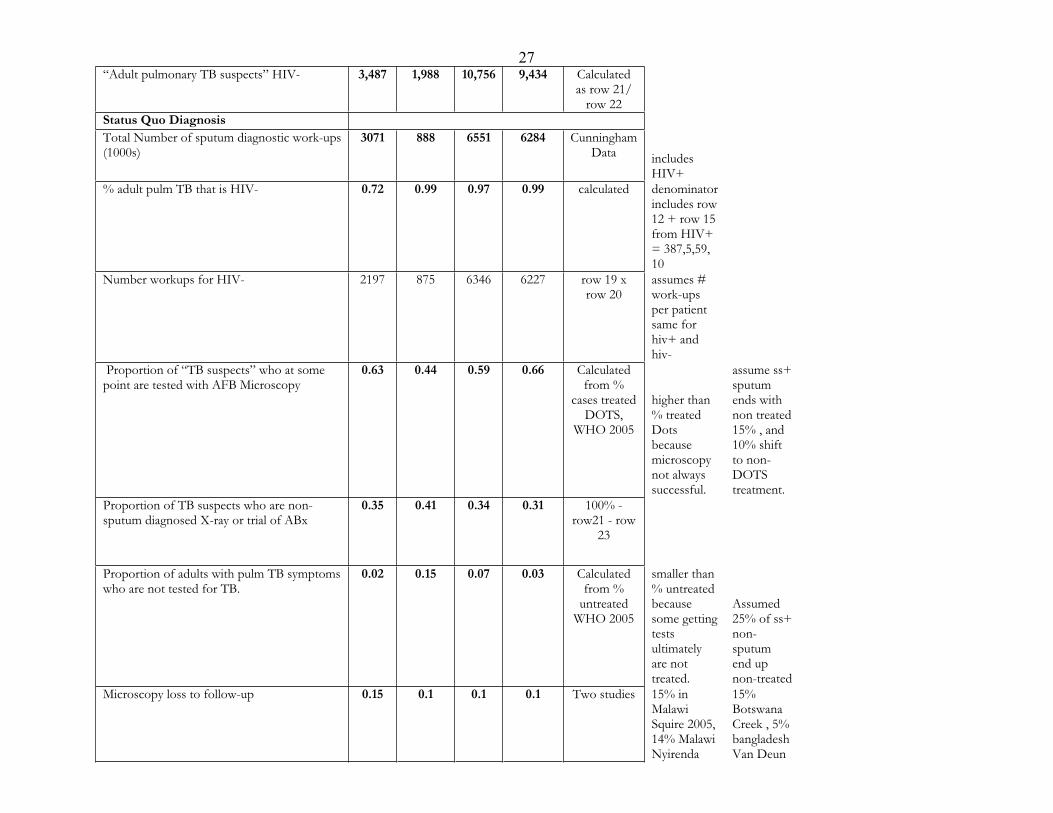
Other modeling assumptions for adults presenting with persistent cough
In each of the 4 regions, the estimated number of smear diagnostic work-ups for
suspected TB is smaller than the incidence of suspects. We assume each TB suspect gets
at most one full work-up through the year. With a fixed number of work-ups, multiple
work-ups for some patients increase the number of TB suspects not getting any work-ups.
However, if previous false negatives have the same probabilities of the second test results
as untested TB suspects, the assumption of at most one full work-ups is conservative. If
instead, some people got several tests and some get none, not so many people with TB
get discovered. So this assumption makes detection a little better in status quo world and
also in new world. Because estimates of % getting sputum test come from estimates on
DOTS treatment, we put people who have failed say a trial of antibiotics, and
subsequently get sputum test onto the sputum branch – classified by the best test they get
in the episode. So, the modeled episode is assumed to be the last chance for diagnosis and
false negatives of the episode are considered untreated for the consequences in mortality
and transmission.

3With highly sensitive new tests, there are few true cases who are called negative. As
a result, follow-up of those cases can be counter productive, and the model calculates
results with and without follow-up, picking the better option.
Further notes on Model Parameters and parameters for all regions.
The parameters for the model are given in Table 1 of the paper for South East Asia
HIV- and Africa HIV+ patents. In Table 1 here and in Appendix A1 and A2 of this
report, we give the parameters for all regions analyzed. They are discussed briefly below
along with the assumptions needed to transform estimates from the literature to fit our
model. Details of the calculations and additional references are given in Appendix A.
We multiplied the ss+ cases by the % adult ss+ cases and the ss- cases by the % adult
ss- cases regional proportion to get the adult cases. For the adult ss- cases, we calculated
pulmonary adult ss- from estimates of the % EP in the region (Who 2005, p22) assuming
the probability of EP in ss- patients is half as high in adult HIV- as in children or in adult
HIV+ in that region. We assume false positives in the WHO treatment estimates are
negligible.
The recommended sputum microscopy procedure uses 3 samples and loss to follow-
up includes those who fail to come back to give all their samples, or to obtain the
microscopy results. (Squire, 2005). The x-ray branches on the tree assume a trial of
antibiotics is usually given following a suspicious x-ray as recommended in WHO
treatment guidelines 2003 so we use the more sensitive point on the ROC curve (Van
Cleef 2003; Harries 1997), relying on the trial of antibiotics to improve specificity.
Studies on symptomatic relief of active TB by antibiotics show that 40% get relief.
(O’Brien 2003). In a trial of antibiotics, patients will be asked to return if there is no
relief but some will not so we need to assume a loss to follow-up as with microscopy.
Putting the symptomatic relief and return rates together we can calculate the sensitivity of
x-ray + a possible trial of antibiotics = 76% (suspicious x-ray) x [25% immediate
treatment + 75%(trial of antibiotics) x 60% (no relief) x 85% (return) = 48%, and the
specificity is calculated similarly.
DALYs per fatality are calculated from regional averages data in the Global Burden
of Disease report. Averted Transmission is calculated as a simple multiplier assuming
the TB epidemic is in steady state. (Details are given in Appendix A) The DALYs saved
also represent only the index cases, not averted future cases, and are proportional to lives

4saved within each region. They and the cases averted from interrupted transmission are
roughly proportional to adjusted lives saved so that results on adjusted lives saved
suffices to show where the opportunities for better tests lie. Transmission estimates were
not reported in the published paper, but are given here in Table 3.
Results
Model Validation back-up
To validate the model, we compared our status quo mortality and proportion treated
results with the related WHO estimates. Our calculated numbers of deaths of adults with
pulmonary TB by region, assuming the status quo, varied from 70% of the total WHO-
estimated deaths (which include the overlapping categories of children and
extrapulmonary TB) in the eastern Mediterranean region to 81% in Africa. If we add in
the children and extra pulmonary cases, mortality estimates are close except in west Asia,
where they are sill low. The calculated status quo detection rates were 66% for adult ss+
cases (with ~51% starting with SSM and the other 15% being diagnosed by other
methods) and 45% for adult pulmonary ss– cases. These detection estimates seem a little
high – this may be due to the assumption of at most one work-up per suspect. Multiple
work-ups for some imply that more people are not getting any, which would lead to lower
detection. These rates make the modelled status quo slightly better than the current WHO
detection estimates, which reduces the estimated gains of new tests. However the
assumption is maintained in both the status quo and new world branches of the tree, so
changes in detection may not be greatly affected by the assumption. (See Table 2 for the
calculations underlying these numbers).
Output by Region:
In the paper, we only presented world totals. The regional output of the main TB model is
given in Table 3. This also gives additional detail on how the increase in lives saved is
achieved by breaking out changes in adjusted lives into changes in true positive smear-
positives, true positive smear-negatives and true negatives with new tests. It also
includes estimated incremental transmission based on the multipliers for untreated smear
positive and smear negative TB, discussed in Appendix A.

5Discussion
Other Limitations of the modeling approach:
We calculated the annual impact of the hypothetical new diagnostic on
outcomes, and did not try to project gains up to some future data such as 2020.
We did not consider the financial cost of diagnosis or treatment explicitly.
The model is static: Changes in DALYs and Transmission were estimated
using a simple multiplier of changes in correct treatments.
We did not consider other behavioral changes that might follow from the
availability of better diagnosis.
Data are lacking on several key parameters.
The unit of analysis is the WHO region, so that adjustments in diagnostic
protocols for unusual local circumstances are not modeled.

6
References including those for Multi-drug Resistant Tuberculosis
1. Anti-Tuberculosis Drug Resistance in the World Third Global Report. 2004, World Health Organization: Geneva.
2. The Global Burden of Disease: A comprehensive assessment of mortality and disability from diseases, injuries and risk factors in 1990 and projected to 2020,ed. C.J.L. Murray and A.D. Lopez. 1996, Cambridge: Harvard University Press on behalf of the World Health Organization and the World Bank.
3. Global Tuberculosis Control, in WHO Report 2001, W.H. Organization, Editor. 2001, World Health Organization.
4. Global Tuberculosis Control: Surveillance, Planning, Financing. 2005, World Health Organization: Geneva.
5. Guidelines for the programmatic management of drug-resistant tuberculosis.2006, World Health Organization: Geneva.
6. Respiratory Care in Primary Care Services--A Survey in 9 Countries. 2004, World Health Organization: Geneva. p. 1-121.
7. Toman's Tuberculosis. Case Detection, Treatment and Monitoring. 2nd ed. 2003, Geneva: World Health Organization.
8. al., Z.e., Presentation at the CDC Late Breaker session, UNION Conference 2005. 2005, CDC.
9. Apers, L., et al., A comparison of direct microscopy, the concentration method and the Mycobacteria Growth Indicator Tube for the examination of sputum for acid-fast bacilli. Int J Tuberc Lung Dis, 2003. 7(4): p. 376-81.
10. Bah, B., et al., Useful clues to the presence of smear-negative pulmonary tuberculosis in a West African city. Int J Tuberc Lung Dis, 2002. 6(7): p. 592-8.
11. Behr, M.A., et al., Transmission of Mycobacterium tuberculosis from patients smear-negative for acid-fast bacilli. Lancet, 1999. 353(9151): p. 444-9.
12. Blower, S.M. and T. Chou, Modeling the emergence of the 'hot zones': tuberculosis and the amplification dynamics of drug resistance. Nat Med, 2004. 10(10): p. 1111-6.
13. Blower, S.M., et al., The intrinsic transmission dynamics of tuberculosis epidemics. Nat Med, 1995. 1(8): p. 815-21.
14. Bonnet, M., et al., Does one size fit all? Drug resistance and standard treatments: results of six tuberculosis programmes in former Soviet countries. Int J Tuberc Lung Dis, 2005. 9(10): p. 1147-54.
15. Borgdorff, M.W., K. Floyd, and J.F. Broekmans, Interventions to reduce tuberculosis mortality and transmission in low- and middle-income countries.Bull World Health Organ, 2002. 80(3): p. 217-27.
16. Bruchfeld, J., et al., Evaluation of outpatients with suspected pulmonary tuberculosis in a high HIV prevalence setting in Ethiopia: clinical, diagnostic and epidemiological characteristics. Scand J Infect Dis, 2002. 34(5): p. 331-7.
17. Cohen, T. and M. Murray, Modeling epidemics of multidrug-resistant M. tuberculosis of heterogeneous fitness. Nat Med, 2004. 10(10): p. 1117-21.
18. Coker, R.J., Review: multidrug-resistant tuberculosis: public health challenges.Trop Med Int Health, 2004. 9(1): p. 25-40.
19. Crampin, A.C., et al., Comparison of two versus three smears in identifying culture-positive tuberculosis patients in a rural African setting with high HIV prevalence. Int J Tuberc Lung Dis, 2001. 5(11): p. 994-9.

720. Creek, T.L., et al., Completeness and timeliness of treatment initiation after
laboratory diagnosis of tuberculosis in Gaborone, Botswana. Int J Tuberc Lung Dis, 2000. 4(10): p. 956-61.
21. Cunningham, J.A., Winfrey, W., Perkins, M.D., Global survey of tuberculosis laboratory services. Int J Tuberc Lung Dis, 2004. 8(11): p. S178.
22. Dye, C., Floyd, K., Tuberculosis, in Disease Control Priorities In Developing Countries, D.T. Jamison, Evans, D.B., Alleyne, G., Jha, P., Breman, J., Measham, A.R., Claeson, M., Mills, A., Musgrove, P.R., Editor, Disease Control Priorities Project (DCPP) Fogarty International Center, National Institutes of Health: Bethesda, MD.
23. Dye, C., et al., Worldwide incidence of multidrug-resistant tuberculosis. J Infect Dis, 2002. 185(8): p. 1197-202.
24. Dye, C., et al., Prospects for worldwide tuberculosis control under the WHO DOTS strategy. Directly observed short-course therapy. Lancet, 1998. 352(9144):p. 1886-91.
25. Dye, C., et al., Evolution of tuberculosis control and prospects for reducing tuberculosis incidence, prevalence, and deaths globally. Jama, 2005. 293(22): p. 2767-75.
26. Espinal, M.A., et al., Standard short-course chemotherapy for drug-resistant tuberculosis: treatment outcomes in 6 countries. Jama, 2000. 283(19): p. 2537-45.
27. Godfrey-Faussett, P., et al., How human immunodeficiency virus voluntary testing can contribute to tuberculosis control. Bull World Health Organ, 2002. 80(12): p. 939-45.
28. Harries, A.D., F. Gausi, and F.M. Salaniponi, When are follow-up sputum smears actually examined in patients treated for new smear-positive pulmonary tuberculosis? Int J Tuberc Lung Dis, 2004. 8(4): p. 440-4.
29. Harries, A.D., et al., Screening pulmonary tuberculosis suspects in Malawi: testing different strategies. Trans R Soc Trop Med Hyg, 1997. 91(4): p. 416-9.
30. Hawken, M.P., et al., Under-diagnosis of smear-positive pulmonary tuberculosis in Nairobi, Kenya. Int J Tuberc Lung Dis, 2001. 5(4): p. 360-3.
31. Ipuge, Y.A., H.L. Rieder, and D.A. Enarson, The yield of acid-fast bacilli from serial smears in routine microscopy laboratories in rural Tanzania. Trans R Soc Trop Med Hyg, 1996. 90(3): p. 258-61.
32. Kivihya-Ndugga, L., et al., Comparison of PCR with the routine procedure for diagnosis of tuberculosis in a population with high prevalences of tuberculosis and human immunodeficiency virus. J Clin Microbiol, 2004. 42(3): p. 1012-5.
33. Leimane, V., et al., Clinical outcome of individualised treatment of multidrug-resistant tuberculosis in Latvia: a retrospective cohort study. Lancet, 2005. 365(9456): p. 318-26.
34. Martinez, A., et al., Evaluation of new external quality assessment guidelines involving random blinded rechecking of acid-fast bacilli smears in a pilot project setting in Mexico. Int J Tuberc Lung Dis, 2005. 9(3): p. 301-5.
35. Mukherjee, J.S., et al., Programmes and principles in treatment of multidrug-resistant tuberculosis. Lancet, 2004. 363(9407): p. 474-81.
36. Mundy, C.J., et al., Quality assessment of sputum transportation, smear preparation and AFB microscopy in a rural district in Malawi. Int J Tuberc Lung Dis, 2002. 6(1): p. 47-54.
37. Murray, C.J., et al., Cost effectiveness of chemotherapy for pulmonary tuberculosis in three sub-Saharan African countries. Lancet, 1991. 338(8778): p. 1305-8.

838. Murray, C.J. and J.A. Salomon, Modeling the impact of global tuberculosis
control strategies. Proc Natl Acad Sci U S A, 1998. 95(23): p. 13881-6. 39. Nagpaul, D.R., Naganathan, N., Prakash, M. Diagnostic photofluorography and
sputum microscopy in tuberculosis case-findings. in Proceedings of the 9th Eastern Region Tuberculosis Conference and 29th National Conference on Tuberculosis and Chest Diseases, Delhi, November 1974. 1975. Delhi: The Tuberculosis Association of India/International Union Against Tuberculosis.
40. Nagpaul, D.R., M.K. Vishwanath, and G. Dwarakanath, A socio-epidemiological study of out-patients attending a city tuberculosis clinic in India to judge the place of specialized centres in a tuberculosis control programme. Bull World Health Organ, 1970. 43(1): p. 17-34.
41. Nyirenda, T., et al., Registration and treatment of patients with smear-positive pulmonary tuberculosis. Int J Tuberc Lung Dis, 1998. 2(11): p. 944-5.
42. O'Brien, R.J. and E.A. Talbot, The utility of an antibiotic trial for diagnosis of AFB-negative tuberculosis. Int J Tuberc Lung Dis, 2003. 7(2): p. 198.
43. Oyewo, T.A., E.A. Talbot, and T.L.e.a. Moeti, Non-response to antibiotics predicts tuberculosis in AFB-smear-negative TB suspects, Botswana, 1997-1999.Int J Tuberc Lung Dis, 2001. 5(Suppl 1): p. S126.
44. Resch, S.C., et al., Cost-effectiveness of treating multdrug-resistant tuberculosis.2006, Center for Risk Analysis, Harvard School of Public Health.
45. Salaniponi, F.M., et al., Care seeking behaviour and diagnostic processes in patients with smear-positive pulmonary tuberculosis in Malawi. Int J Tuberc Lung Dis, 2000. 4(4): p. 327-32.
46. Sharma, S.K. and A. Mohan, Multidrug-resistant tuberculosis. Indian J Med Res, 2004. 120(4): p. 354-76.
47. Somi, G.R., et al., Evaluation of the MycoDot test in patients with suspected tuberculosis in a field setting in Tanzania. Int J Tuberc Lung Dis, 1999. 3(3): p. 231-8.
48. Squire, S.B., et al., 'Lost' smear-positive pulmonary tuberculosis cases: where are they and why did we lose them? Int J Tuberc Lung Dis, 2005. 9(1): p. 25-31.
49. Sterling, T.R., H.P. Lehmann, and T.R. Frieden, Impact of DOTS compared with DOTS-plus on multidrug resistant tuberculosis and tuberculosis deaths: decision analysis. Bmj, 2003. 326(7389): p. 574.
50. Suarez, P.G., et al., Feasibility and cost-effectiveness of standardised second-line drug treatment for chronic tuberculosis patients: a national cohort study in Peru.Lancet, 2002. 359(9322): p. 1980-9.
51. van Cleeff, M.R., et al., A comprehensive study of the efficiency of the routine pulmonary tuberculosis diagnostic process in Nairobi. Int J Tuberc Lung Dis, 2003. 7(2): p. 186-9.
52. Wilkinson, D., et al., Trial-of-antibiotic algorithm for the diagnosis of tuberculosis in a district hospital in a developing country with high HIV prevalence. Int J Tuberc Lung Dis, 2000. 4(6): p. 513-8.
53. Wright, A., Abigail Wright personal communication, E. Keeler, Editor. 2006: Santa Monica.

9Table 1: Parameters for Cast Detection of Active (pulmonary) TB in all Patients:
Base Case Clinical Values HIV - PULMONARY TB CASES HIV+ Cases
Africa Eastern Medit.
SouthAsia
Western Asia
AfricaHIV+
SouthAsia
HIV+ Natural History Population (millions) 687* 518 1615* 1732 Incidence cases of ss+ TB (1000s)
820 281 1344 863 192 26
Incidence cases of ss- TB (1000s)
1003 344 1642 1055 357 49
Adult cases/all cases In ss+
0.8 0.72 0.72 0.62
Adult cases/all cases in ss-
0.6 0.55 0.64 0.59
Incidence adult SS+(1000s)
618 202 960 533 192 26
Pulmonary ss-/all ss- 0.62 0.56 0.78 0.84 0.62 0.78 Pulmonary ss-/all ss- in Adult
0.77 0.7 0.84 0.89 0.54 0.68
Incidence adult pulm SS- (1000s)
355 130 869 550 195 33
Prob (active TB in suspects)
0.28 0.17 0.17 0.11 0.28 1.25
“Adult pulmonary TB suspects”
3,487 1,988 10,756 9,434 1,387 47
Status Quo Diagnosis Total Number of sputum diagnostic work-ups (1000s)
3071 888 6551 6284
% of adult pulm TB by HIV status
0.72 0.99 0.97 0.99 0.28 0.03
Number workups by HIV status
2197 875 6346 6227 874 28
Proportion of “TB suspects” who at some point are tested with AFB Microscopy
0.63 0.44 0.59 0.66 0.63 0.59
Proportion of TB suspects who only get X-ray or trial of ABx
0.35 0.41 0.34 0.31 0.35 0.34
Proportion of adults with pulm TB symptoms who are not tested for TB.
0.02 0.15 0.07 0.03 0.02 0.07
Microscopy loss to follow-up
0.15 0.1 0.1 0.1 0.15 0.1
trial of antibiotics loss to follow-up
0.15 0.1 0.1 0.1 0.15 0.1
Proportion of those who return for negative smear result who are then X-
0.3 0.6 0.9 0.6 0.3 0.9

10rayed
Proportion of those with non-sputum work-up who are X-rayed
0.3 0.6 0.9 0.6 0.3 0.9
proportion of those with x-ray but no subsequent trial of Antibiotics
0.075 0.15 0.225 0.15 0.075 0.225
Sensitivity of field microscopy for "ss+"
0.85**
Sensitivity of microscopy for ss-
0
Specificity ofmicroscopy
0.97
Sensitivity of x-ray for active TB
0.76
Specificity of x-ray for active TB
0.68
Symptom relief with antibiotic if Active TB
0.4
symptom relief with antibiotics if no TB
0.85
Sensitivity of x-ray + Trial of Antibiotics
0.48
Specificity of x-ray + trial of antibiotics
0.94
Outcomes cf Rate for Dots SSC treated ss+ TB
0.1 0.1 0.1 0.1 0.1 0.1
cfRate for Dots SSC treated ss- TB
0.05 0.05 0.05 0.05 0.1 0.1
cf Rate for noDots SSC treated ss+ TB
0.3 0.3 0.3 0.2 0.38 0.38
cfRate for no dotsSSC treated ss- TB
0.15 0.15 0.15 0.1 0.5 0.5
Mortality Rate for untreated ss+ TB
0.7 0.7 0.7 0.7 0.83 0.83
Mortality Rate for untreated ss- TB
0.2 0.2 0.2 0.2 0.74 0.74
cost of a treatment in mortality terms
0.05
DALYS lost per adult TB mortality
23 19 16 12 23 16
Transmission multiplier for untreated ss+ TB
6.6 6.6 6.6 6.6 2 2
Transmission multiplier for untreated ss- TB
1.45 1.45 1.45 1.45 0.44 0.44
Discount rate 0.03
* if HIV+ columns are empty, estimates are for all patients, not just HIV-. ** When only one column is filled, parameter applies to all regions.

11
Table 2: Validating status quo model outputs against WHO 2003 estimates of mortality and % detected
Model Data
Deaths Suspects Correctly
Treated
Trans-mission
TP_SS+ TP_SS- TN Adult ss+ Adult pulm ss-
detect ss+ detect ss-
Africa 259 2,778 1,530 415 158 2,206 618 355 67% 44%West-Asia 230 7,938 1,358 379 256 7,303 533 550 71% 47%
Easter-Medit 101 1,647 633 117 54 1,476 202 130 58% 41%South-Asia 455 8,925 2,679 636 380 7,910 960 869 66% 44%
Africa-HIV+ 177 1,093 540 129 87 878 192 195 67% 44%South-Asia-HIV+ 28 287 80 17 14 255 26 33 66% 44%
Other data GBD %
2003 WHO TB
mortality
Model estimates
(000s)
Model % of world estimate
Children’s TB Deaths
in 1990
Total TB deaths in
1990
% children deaths in
1990
ExtraPulmonary
TBAfrica 538 436 81% 65 386 17% 19%
West-Asia 327 230 70% 9 278 3% 9%Easter-Medit 144 101 70% 13 169 8% 20%
South-Asia 617 483 78% 42 752 6% 12%
Comments: We used data from the Global Burden of disease study (reference 2) to estimate % of TB deaths by children. Extra-pulmonary TB mortality comes from Global Health 2005 WHO report estimates of percent of notifications that are EP by region. Children and EP overlap. Detection rates seem slightly high, but reasonable.

12
Table 3: Results by WHO Region
World Totals
Test sens.SS+ sens.SS- specificity 1 - loss to follow-up
IndividualLives
AdjustedLives
AvertedTransmission TP_SS+ TP_SS-
TrueNeg.
Advanced Infrastructure (20% access) 1 1 1 1 1 104 118 -890 92 235 589
TB clinics and Hospitals (44-66% access) 2 0.85 0 0.97 0.85 0 0 0 0 0 0 3 1 0 0.97 0.85 -33 46 278 49 -426 1206 4 0.85 0 0.97 1 117 95 -1128 165 75 -217 5 0.85 0.85 0.97 0.85 15 60 147 -103 363 1145 6 0.85 0.85 0.97 1 169 195 -1290 87 547 1121 7 1 1 1 0.85 137 200 -1017 49 521 1801 8 1 1 1 1 318 359 -2708 280 717 1801
No infrastructure (100% access) 9 0.85 0 0.97 0.85 98 133 -1324 288 -336 646
10 0.85 0 0.97 1 258 263 -3459 602 -200 497 12 0.85 0.85 0.97 1 383 392 -4469 521 908 1587 13 1 1 1 0.85 337 407 -4029 459 865 2708 14 1 1 1 1 591 625 -6820 838 1183 2708
Notes: All outcomes are given in thousands Individual lives represent mortality of index cases Adjusted lives include a .05 penalty for each treatment Cases averted from interrupted transmission based on untreated ss+.ss- multipliers Differences from paper: test 1 has 20% access, test 7,13 has 15% LTFU TP_SS+, TP_SS-, True Neg. represents differences in these categories from status quo

13
Africa HIV-
Test sens.SS+ sens.SS- specificity
1 - loss to follow-up
IndividualLives
AdjustedLives
AvertedTrans-mission DALYs TP_SS+ TP_SS- T Neg.
Advanced Infrastructure (20% access) 1 1 1 1 1 22 22 -219 564 26 41 64
TB clinics and Hospitals (44-66% access) 2 0.85 0 0.97 0.85 0 0 0 0 0 0 03 1 0 0.97 0.85 15 14 -153 321 25 0 04 0.85 0 0.97 1 35 30 -358 687 54 17 -355 0.85 0.85 0.97 0.85 12 8 -110 183 0 81 06 0.85 0.85 0.97 1 49 39 -487 893 54 112 -357 1 1 1 0.85 29 33 -283 256 25 95 2008 1 1 1 1 69 69 -691 1580 83 128 200
No infrastructure (100% access) 9 0.85 0 0.97 0.85 20 24 -267 550 57 -62 84
10 0.85 0 0.97 1 76 64 -991 1466 156 17 -6012 0.85 0.85 0.97 1 93 74 -1201 1695 156 170 -6013 1 1 1 0.85 66 69 -883 1580 111 144 30814 1 1 1 1 121 116 -1530 2656 203 197 308
Notes: All outcomes are given in thousands Individual lives represent mortality of index cases Adjusted lives include a .05 penalty for each treatment Cases averted from interrupted transmission based on untreated ss+.ss- multipliers Differences from paper: test 1 has 20% access, test 7,13 has 15% LTFU TP_SS+, TP_SS-, True Neg. represents differences in these categories from status quo

14
Eastern Mediterranean
Test sens.SS+ sens.SS- specificity
1 - loss to follow-up
IndividualLives
AdjustedLives
AvertedTrans-mission TP_SS+ TP_SS-
TrueNeg.
Advanced Infrastructure (20% access) 1 1 1 1 1 6 7 -61 7 14 44
TB clinics and Hospitals (44-66% access) 2 0.85 0 0.97 0.85 0 0 0 0 0 03 1 0 0.97 0.85 -3 2 28 1 -26 784 0.85 0 0.97 1 5 4 -55 8 3 -115 0.85 0.85 0.97 0.85 0 0 0 0 0 06 0.85 0.85 0.97 1 4 7 -39 1 22 757 1 1 1 0.85 4 8 -39 1 22 978 1 1 1 1 13 16 -133 15 31 97
No infrastructure (100% access) 9 0.85 0 0.97 0.85 14 17 -205 39 -27 59
10 0.85 0 0.97 1 29 24 -427 68 3 -3612 0.85 0.85 0.97 1 27 28 -418 55 57 13013 1 1 1 0.85 27 31 -418 55 57 17914 1 1 1 1 44 45 -633 85 76 179
Notes: All outcomes are given in thousands Individual lives represent mortality of index cases Adjusted lives include a .05 penalty for each treatment Cases averted from interrupted transmission based on untreated ss+.ss- multipliers Differences from paper: test 1 has 20% access, test 7,13 has 15% LTFU TP_SS+, TP_SS-, True Neg. represents differences in these categories from status quo

15
Southeast Asia
Test sens.SS+ sens.SS- specificity
1 - loss tofollow-up
IndividualLives
AdjustedLives
AvertedTrans-mission TP_SS+ TP_SS-
TrueNeg.
Advanced Infrastructure (20% access) 1 1 1 1 1 34 39 -329 32 95 227
TB clinics and Hospitals (44-66% access) 2 0.85 0 0.97 0.85 0 0 0 0 0 03 1 0 0.97 0.85 -29 9 255 10 -232 5354 0.85 0 0.97 1 35 28 -360 52 26 -745 0.85 0.85 0.97 0.85 -17 6 198 -62 139 5356 0.85 0.85 0.97 1 36 51 -339 10 204 5117 1 1 1 0.85 36 59 -339 10 204 6698 1 1 1 1 99 114 -971 95 281 669
No infrastructure (100% access) 9 0.85 0 0.97 0.85 41 55 -545 121 -148 255
10 0.85 0 0.97 1 113 91 -1571 248 26 -17412 0.85 0.85 0.97 1 112 123 -1608 180 359 75013 1 1 1 0.85 112 136 -1608 180 359 101714 1 1 1 1 201 211 -2679 324 489 1017
Notes: All outcomes are given in thousands Individual lives represent mortality of index cases Adjusted lives include a .05 penalty for each treatment Cases averted from interrupted transmission based on untreated ss+.ss- multipliers Differences from paper: test 1 has 20% access, test 7,13 has 15% LTFU TP_SS+, TP_SS-, True Neg. represents differences in these categories from status quo
16
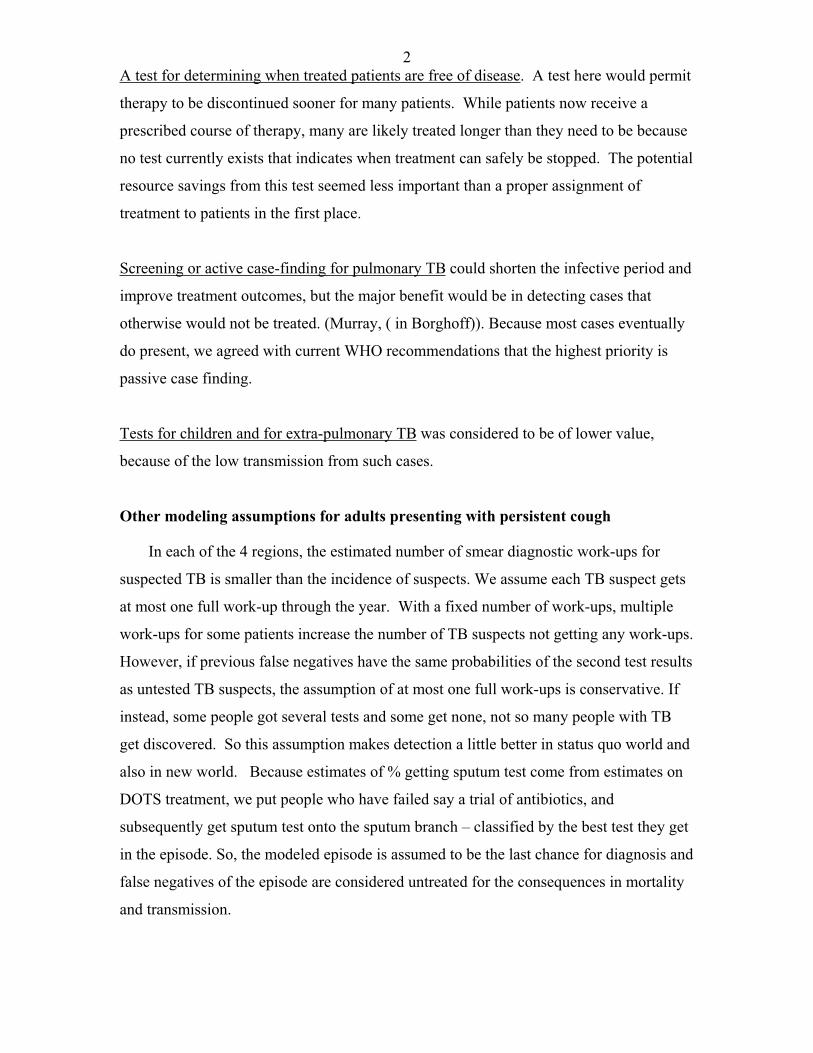
West Asia and Pacific
Test sens.SS+ sens.SS-
specificity
1 - losstofollow-up
IndividualLives
AdjustedLives
AvertedTrans-mission TP_SS+ TP_SS-
TrueNeg.
Advanced Infrastructure (20% access) 1 1 1 1 1 19 27 -190 18 59 222
TB clinics and Hospitals (44-66% access) 2 0.85 0 0.97 0.85 0 0 0 0 0 0 3 1 0 0.97 0.85 -22 16 196 5 -168 593 4 0.85 0 0.97 1 22 16 -228 33 19 -81 5 0.85 0.85 0.97 0.85 -10 17 116 -39 94 593 6 0.85 0.85 0.97 1 24 45 -225 5 140 568 7 1 1 1 0.85 24 54 -225 5 140 733 8 1 1 1 1 64 88 -627 58 195 733
No infrastructure (100% access) 9 0.85 0 0.97 0.85 14 28 -165 46 -88 242
10 0.85 0 0.97 1 4 53 -113 74 -256 797 12 0.85 0.85 0.97 1 66 92 -750 74 212 797 13 1 1 1 0.85 66 104 -750 74 212 1048 14 1 1 1 1 122 152 -1358 154 294 1048
Notes: All outcomes are given in thousands Individual lives represent mortality of index cases Adjusted lives include a .05 penalty for each treatment Cases averted from interrupted transmission based on untreated ss+.ss- multipliers Differences from paper: test 1 has 20% access, test 7,13 has 15% LTFU TP_SS+, TP_SS-, True Neg. represents differences in these categories from status quo

17
Africa HIV+
Test sens.SS+ sens.SS- specificity
1 - loss to follow-up
IndividualLives
AdjustedLives
AvertedTrans-mission TP_SS+ TP_SS-
TrueNeg.
Advanced Infrastructure (20% access) 1 1 1 1 1 20 20 -81 8 22 25
TB clinics and Hospitals (44-66% access) 2 0.85 0 0.97 0.85 0 0 0 0 0 03 1 0 0.97 0.85 6 5 -48 8 0 04 0.85 0 0.97 1 18 16 -117 17 9 -145 0.85 0.85 0.97 0.85 28 26 -60 0 44 06 0.85 0.85 0.97 1 51 47 -188 17 61 -147 1 1 1 0.85 39 40 -119 8 52 808 1 1 1 1 64 63 -256 26 71 80
No infrastructure (100% access) 9 0.85 0 0.97 0.85 9 8 -129 22 -5 -2
10 0.85 0 0.97 1 32 28 -314 49 9 -2412 0.85 0.85 0.97 1 74 65 -429 49 94 -2413 1 1 1 0.85 57 58 -321 34 79 12314 1 1 1 1 90 87 -540 63 108 123
Notes: All outcomes are given in thousands Individual lives represent mortality of index cases Adjusted lives include a .05 penalty for each treatment Cases averted from interrupted transmission based on untreated ss+.ss- multipliers Differences from paper: test 1 has 20% access, test 7,13 has 15% LTFU TP_SS+, TP_SS-, True Neg. represents differences in these categories from status quo

18
Southeast Asia HIV+
Testsens.SS+ sens.SS-
specificity
1 - loss to follow-up
IndividualLives
AdjustedLives
AvertedTrans-mission TP_SS+ TP_SS-
TrueNeg.
Advanced Infrastructure (20% access) 1 1 1 1 1 3 3 -10 1 4 7
TB clinics and Hospitals (44-66% access) 2 0.85 0 0.97 0.85 0 0 0 0 0 03 1 0 0.97 0.85 0 0 0 0 0 04 0.85 0 0.97 1 2 1 -10 1 1 -25 0.85 0.85 0.97 0.85 2 3 3 -2 5 176 0.85 0.85 0.97 1 5 6 -12 0 8 167 1 1 1 0.85 5 6 -12 0 8 228 1 1 1 1 9 9 -30 3 11 22
No infrastructure (100% access) 9 0.85 0 0.97 0.85 0 1 -13 3 -6 8
10 0.85 0 0.97 1 4 3 -43 7 1 -612 0.85 0.85 0.97 1 11 10 -63 7 16 -613 1 1 1 0.85 9 9 -49 5 14 3314 1 1 1 1 13 14 -80 9 19 33
Notes: All outcomes are given in thousands Individual lives represent mortality of index cases Adjusted lives include a .05 penalty for each treatment Cases averted from interrupted ransmission based on untreated ss+.ss- multipliers Differences from paper: test 1 has 20% access, test 7,13 has 15% LTFU TP_SS+, TP_SS-, True Neg. represents differences in these categories from status quo

19
Appendix A: Detailed parameter calculations
These contain detailed instructions for how to get from data to the parameters in the tables.
Below, we will refer to three spreadsheets:
The 2003 worksheet (Rows 217-222, the regional totals) in the 2005 WHO report estimates
workbook: link to Just2003.xls…
Jcunningham (version 2).xls EP calcs.xls has our own calculations used in deriving some
parameters.
The tables at the end show the references used for the parameters for status quo behavior and test
performance.
Rows 7-9: come directly from 2003 spreadsheet estimates (column G ,ej,ek). We assume false
positives in the WHO treatment statistics are negligible.
Rows 10-11: The % adult for both ss+ and ss- come from 2003 columns K and L. We multiplied
the ss+ cases by the % adult ss+ cases and the ss- cases by the % adult ss- cases regional
proportion to get the adult cases.
Row 12: All the HIV+ are assumed adult, so the adult HIV- ss+ cases are calculated to make
row 10 correct (= row9*row 10 - (1-row 10 )* HIV+)
Row 13: I calculated the % Pulmonary of the total ss- TB in each region using the estimates from
WHO 2005 report p 22 and put them in Epcalcs.xls. For the adult ss- cases, we calculated
pulmonary adult ss- from estimates of the % EP in the region (Who 2005, p22) assuming the
probability of EP in ss- patients is half as high in adult HIV- as in children or in adult HIV+ in
that region. We assume false positives in the WHO treatment estimates are negligible.
Row 15: For the adult ss- cases, we calculated pulmonary adult ss- from estimates on the % EP
in the region (Who 2005 report, p22) assuming the probability of EP in ss- patients is half as

20
high in adult HIV- as in children or in adult HIV+ in that region. Again we need to make row
11 correct overall, but all HIV+ are assumed adult. See spreadsheet EPcalcs for formulae.
Prop (sputum test| TB suspect): (Row 22)
Only TB suspects get into the tree – those with persistent cough, maybe with some other clinical
findings. They are the people who would be given a sputum test if one were available. We have
estimates from WHO on p(DOTS treatment | ss+) (2003, Column O) , where the definition of
DOTS includes getting a sputum test prior to treatment. So p(DOTS & sputum) = p(DOTS). To
get p(sputum) we must add p(sputum & non-DOTS) and p(sputum & untreated). We assume
10% of those who start with a sputum test are non-DOTS treated. Some of the ss+ given a
sputum test would not end up being treated, either because they don’t return for test results or the
test is a false negative and they are not recaptured in follow-up testing. From other estimates in
the literature, this loss to treatment is about 15% (the number of false negatives after return for
sputum results is small). So,
p (sputum) = p(DOTS) + (10% +15%) p(sputum).
We condition the above formula on ss+ to get p(sputum|ss+) = p(DOTS|ss+) / (1-.25).
Finally, we assume the proportion of TB suspects who are tested with AFB microscopy,
p(sputum test| TB suspect) = p(sputum test| ss+) = p(DOTS|ss+) / (1-.25).
(Row 24) Again, we assume the % not given any tests is the same for ss+ and other suspects.
We assume 25% of those ss+ started with non-sputum diagnosis are not treated.
Now, patients are untreated ss+ TB if they have ss+ TB and either don’t get test or if they are
False Negatives on the test branches. So, the ss+ that are tested but not treated are subtracted
from those untreated, (2003, Column Q) to get p(not tested). So p (not tested|)= p(untreated|) –
p(loss to treatment) p(sputum test) - p(loss to treatment)*p(non sputum test). Fortunately, this
estimate was never less than zero in any region.
(Row 23) Finally the % non-sputum tested = 1- p(sputum test) – p( untested).

21
(Row 19-21) We have estimates of the number N of diagnostic AFB microscopy workups given
in each region in the Global Survey of TB Lab Services by Cunningham Winfrey Perkins
(GS),2004.
Following Cunningham et al. 2004, we assume diagnostic smears = 75% of total smears and
divide the number of estimated diagnostic smears per ss+ incident case by 2.5 smears per workup
to get the number of patients getting diagnostic workups = P = Total smears/3.333. (Row 19).
We calculate the % adult pulmonary TB that is HIV- (Row 20) from rows 12 and 15. We assume
the workups are split according to those percentages. (Row 21).
(Row 17 and 16) The number of TB suspects and p(active TB | suspect).
If 60% of suspects get a workup, then N/60% suspects enter the tree. We can then divide the
incidence of Active TB by the number of suspects to get prob (active TB in suspects). It is
inversely related to the prevalence of TB around the world, perhaps because non-TB causes of
TB symptoms are more evenly distributed. The probabilities are similar to the responses in the
Respiratory Symptoms Survey, except in Nigeria, where the sample appears to have come
entirely from DOTS clinics.
These calculations result in about 2/3 as many active pulmonary suspects as given in the
Cunningham data. One possible explanation is that there is heterogeneity in her active suspects
plus some correlation between who gets a smear and who has TB, so the sample entering the tree
is more likely to have TB than the suspects in her reported data. I.e. there might be some
judgment about who gets a sputum test If so p(TB| sputum test) is probably higher than p(TB|
persistent cough + arrives at clinic.) Another explanation is that we have grouped people by the
most stringent test in the episode, so that people who come in with TB symptoms, get an initial
trial of antibiotics and come back for a sputum or x-ray are counted twice in her data, but only
once in our model. In the tree, we only consider people who would have been given a sputum
test if one were available). For example, in the African region, there are 3,071,000 sputum
diagnostic workups, and 72% of adult pulmonary TB is HIV-, so we assume 72%x 3.071
million= 2.197 million are diagnostic work-ups for HIV- suspects. We assume 63% of these
start with AFB microscopy (because .48 of ss+ are DOTS treated, and we assume that 25% of
those starting with sputum end up non-dots treated or untreated, so .48/(1-.25) = .63, leading to
2197/.63 = 3,487,000 adult pulmonary HIV- suspects. Of the incident active cases 17% are

22
untreated (Global 2005), including 15% that can be calculated to be false negatives leaving 2%
(of ss+) who are given no test. This leaves 35% for non-sputum diagnosis, the other possibility.
(Row 25,26) The recommended sputum microscopy procedure uses 3 samples and loss to
follow-up includes those who fail to come back to give all their samples, or to obtain the
microscopy results (15% in Squire, 2005). We assume this same percentage holds for those not
obtaining relief from a trial of antibiotics.
Rows 27-29. We use the Cunningham regional data on number of x-rays given to TB suspects to
guide subjective estimates of the proportion of those who do not get a sputum test who are x-
rayed. The proportion of those going immediately from a positive x-ray to treatment varies
depending on background prevalence and severity but is estimated to be small. The recent WHO
guidelines recommend a trial of antibiotics before initiating Category I TB therapy.
(Row 30) estimate is based on two EQA studies and expert opinion. Row 32 is based on many
studies.
(Row 33,34) The x-ray branches on the tree assume that a trial of antibiotics will often be given
as recommended in WHO treatment guidelines 2003, so we pick the more sensitive point on the
ROC curve (Van Cleef 2003; Harries 1997), relying on the trial of antibiotics to improve
specificity.
Row 35,36 Studies on symptomatic relief of active TB by antibiotics show that 40% get relief,
and 60% do not (papers in O’Brien 2003), as do 85% of those suspects without TB (Wilkinson,
Bah,Somi). In a trial of antibiotics, patients will be asked to return if there is no relief but some
will not so we need to assume a loss to follow-up as with microscopy. Putting the symptomatic
relief and return rates together we can calculate the sensitivity of x-ray + a possible trial of
antibiotics = 76% (suspicious x-ray) x [25% immediate treatment + 75%(trial of antibiotics) x
60% (no relief) x 85% (return) = 48%, and the 94% specificity is calculated similarly.
Access to new diagnostic tests:
For our advanced infrastructure category we used estimates of the % access to urban hospitals.
Using the methods discussed in Girosi reference 20 of paper these were estimated to be 16% in
Africa, 19% in Asia. For the TB clinics and hospital category we assumed the proportion with
access would be the same as those currently going (row 22 of the table).

23
Outcomes:
Case fatality rates come from WHO estimates. (Rows 40-45) The treatment for those starting
with the sputum test is assumed to be DOTS SCC, and treatment for the others is assumed to be
non-DOTS. Because of our emphasis on diagnosis this assumption is maintained in the new
world.
(Row 48,49) The estimate of additional transmission due to a case of untreated TB relies on TB
being roughly in steady state in each region. TB epidemics are very slow (Blower, 1995) and
the number of incident TB cases has not changed much by region in recent years, as population
growth offsets slowly declining rates (Global 2005). So, each smear-positive case leads to
another smear-positive case on average in each cycle of transmission. However, if the number of
new smear-positive cases from an untreated case is 4 times that for treated cases (Borgdorff,MW
Floyd K and Broekmans,JF). Interventions to reduce tuberculosis mortality and transmission in
low and middle-income countries (Bulletin of the WHO 2002; 80:217-227), and 40% of cases
are untreated, we can solve to show an untreated case infects 1.36 additional cases compared to a
treated case. For a cycle of 4.5 years (DCP2, Dye and Floyd, 2005), and an annual discount rate
of 3%, the cycle discount factor is 1/ (1.03 4.5) = 0.875. Assuming the 1.36 additional cases
receive average treatment, each will lead to another case each cycle. For an assumed horizon of
2030, there are 6 cycles, and so each initial untreated case will lead to an additional (1- .8757)/(1-
.875) x 1.36 = 6.6 discounted cases. Smear-negative cases are 22% as infectious. (Behr MA,
Warren SA Salamon H, et al. Transmission of Mycobacterium Tuberculosis from patients smear-
negative for acid-fast bacilli Lancet 1999 353 444-449.)
The overall costs of treatment (Row 46) (primarily opportunity costs). The bounds on the costs
of treatment C compared to the benefits of treatment of a smear-positive case VSP, can be
obtained by comparing sputum testing + treatment with the two alternatives of treating no-one
and treating everyone. Let VSP be the value of treating a smear-positive. From the case fatality
rates, estimating that two thirds of ss+ cases get DOTS SSC, and one third gets non-DOTS
treatment, the mortality gain from treatment for smear-positive is 0.7 – 2/3 (.1) - 1/3 (.3) = .53,
and for smear-negative, where about 50% gets DOTS SSC it is .2 – 1/2(.05) – 1/2 (.15) = .10.
So, 0.10/ .53 = .19 and we assume the value of treating a smear-negative = .19 VSP1. Let p =
the probability of TB among suspects. Assume 60% of adult pulmonary cases are smear-positive.
1 Alternately, based on transmission, the value of treating a smear-negative = .22 VSP.

24
With our parameters, testing sputum and treating those with a positive test leads to .85 x .6 x p +
.03 (1-p) C treatment costs per suspect with health gains of .51p VSP. Treating no one has 0
costs and 0 gains, and treating everyone has costs C and gains (.6 VSP + .4 x .19 VSP) p = .676p
VSP per suspect. Now if testing is better than doing nothing, even when p = .05, we can solve to
get .0255 VSP > 0.0546 C or C<.467 VSP. And if testing is better than treating everyone, even
if p =.3, then .153 VSP – (.153 + .021) C > .3 (0.676) VSP - C, which implies .845 C> .0498
VSP, or C> .059 VSP.
This leads to .059 VSP < C < .47 VSP. In case fatality terms, VSP = .53 deaths, so this means
.031 deaths < C < .25 deaths. In addition, we surveyed a convenience sample of experts on the
disutility of over-treatment compared to under-treatment, with the median answer being that
over-treatment was just as bad as under-treatment. If we set the costs of treatment = to the net
average gains (mortality gains - the cost of treatment) from treating smear-negative patients, the
answer .10/2 = .05 is within the bounds of the comparative exercise. Ultimately, we used C =
.05, but this important number will be varied in sensitivity analysis. We did not include the
impact of delay from slower tests on outcomes: each week of delay leads to about .2 discounted
transmissions overall and a .004 additional chance of death. Jane Cunningham notes if the
number of infections goes down over time as uninfected family and friends are used up, then
early treatment might have a bigger impact than I assumed (See Girosi ref 20 of paper).
(Row 51): Our results represent one year totals, so the discount rate is used only to calculate
ultimate changes in transmission, as done above. The standard for developed economies is 3%
(Gold et al.), but due to capital market imperfections, but personal discount rates and possibly
social discount rates would be higher in Africa.
(Row 47) (DALYs gained per TB mortality) Based on tables from www.DCP2.org we divided
adult YLL discounted at 3% by Region in 2001 for TB/ adult deaths from TB in 2001. There
should also be some morbidity benefit from treatment, so using WHO estimates that DOTS
treatment shortens duration by a year, the Murray and Lopez GBD disability weight of about .27
for TB, and the estimate that 60% of treatment is DOTS treatment, we get a benefit of .16 per
treatment. Perfect treatment in our model leads to 591,000 fewer deaths, and 1,993,000 more
correct treatments so disability benefit per death = 1993 x .16/591 = .54 disability years. These
were added to YLL/death, but this is a minor adjustment for YLL per death, which worldwide is
22. In an early CE article, the Murray group used a value of 22 DALYS gained per death for

25
high HIV Sub Saharan Africa (Murray, 1991). We assume HAART is available for treated
HIV+ patients, and so have the same DALYs gained for them.

26 Table A1. Case Detection of Active (pulmonary, symptomatic) TB in HIV-Patients:
Base Case Clinical Values by Region
Africa Eastern Medit.
SouthAsia
WesternAsia
Reference:References and additional comments
Natural History Population (millions) 687 518 1615 1732 WHO 2005 Incidence cases of HIV- ss+ TB (1000s) 820 281 1344 863 WHO 2005
Incidence cases of HIV- ss- TB (1000s) 1003 344 1642 1055 WHO 2005
Adult cases/all cases In ss+ 0.8 0.72 0.72 0.62 WHO2005 includes
HIV+Adult cases/all cases in ss- 0.6 0.55 0.64 0.59 WHO 2005 includes
HIV+Incidence adult SS+ HIV- (1000s) 6.18 202 960 533 calculated so
row10works for all
HIV Pulmonary ss-/all ss- 0.62 0.56 0.78 0.84 WHO 2005
p22 Pulmonary ss-/all ss- in Adult HIV- 0.77 0.7 0.84 0.89 calculated
assuming EP twicd as common in kids, Adult
HIV+
assumes prob(EP|ss-) is half as high in adults HIV - as in childrenChauhan2004
Incidence adult pulm SS- HIV- (1000s) 355 130 869 550 Calculatedso row 11
works for all HIV
Prob (active TB in suspects) 0.28 0.17 0.17 0.11 calculated from # of workups
RSS WHO 2004 has similar but smallernumbers for ss+
p(ss+)=19% in tanzania, Ipuge,1996;43% in SA Wilkinson2000
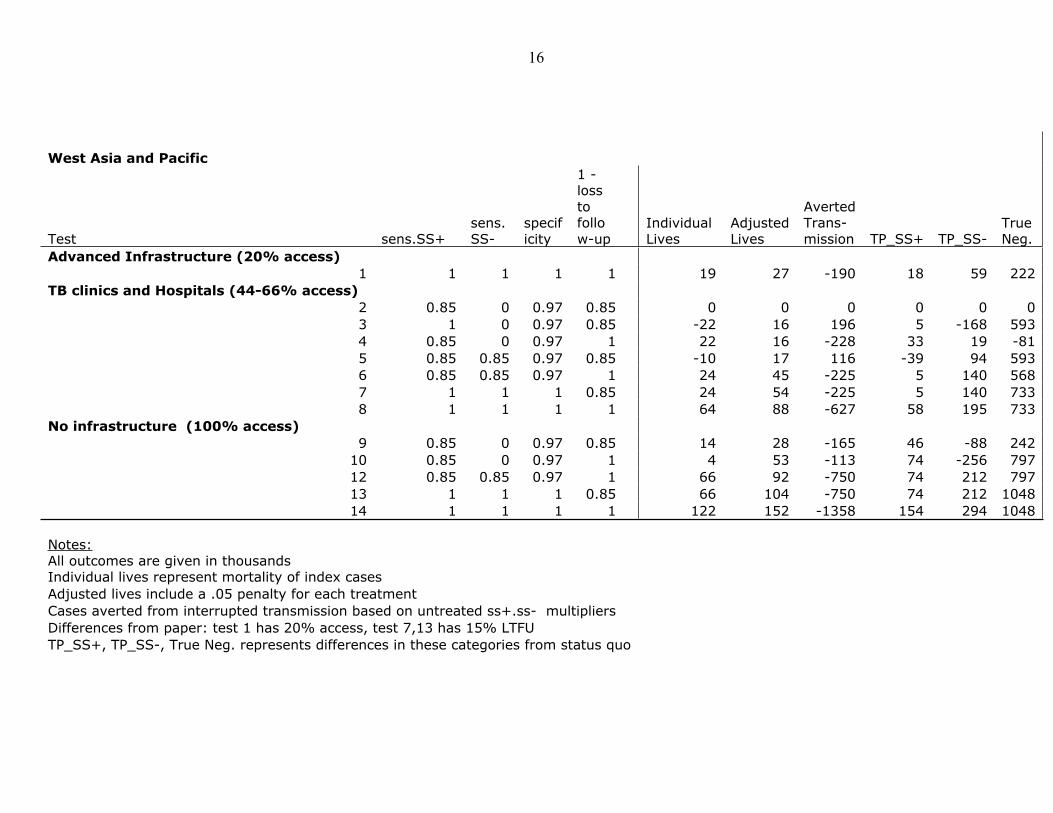
27“Adult pulmonary TB suspects” HIV- 3,487 1,988 10,756 9,434 Calculated
as row 21/ row 22
Status Quo Diagnosis Total Number of sputum diagnostic work-ups (1000s)
3071 888 6551 6284 CunninghamData includes
HIV+ % adult pulm TB that is HIV- 0.72 0.99 0.97 0.99 calculated denominator
includes row 12 + row 15 from HIV+ = 387,5,59, 10
Number workups for HIV- 2197 875 6346 6227 row 19 x row 20
assumes # work-upsper patient same for hiv+ and hiv-
Proportion of “TB suspects” who at some point are tested with AFB Microscopy
0.63 0.44 0.59 0.66 Calculatedfrom %
cases treated DOTS,
WHO 2005
higher than % treated Dotsbecause microscopy not always successful.
assume ss+ sputum ends with non treated 15% , and 10% shift to non-DOTStreatment.
Proportion of TB suspects who are non-sputum diagnosed X-ray or trial of ABx
0.35 0.41 0.34 0.31 100% - row21 - row
23
Proportion of adults with pulm TB symptoms who are not tested for TB.
0.02 0.15 0.07 0.03 Calculatedfrom %
untreated WHO 2005
smaller than % untreated because some getting tests ultimately are not treated.
Assumed25% of ss+ non-sputum end up non-treated
Microscopy loss to follow-up 0.15 0.1 0.1 0.1 Two studies 15% in MalawiSquire 2005, 14% Malawi Nyirenda
15%Botswana Creek , 5% bangladeshVan Deun

281998 opinon
trial of antibiotics loss to follow-up 0.15 0.1 0.1 0.1 assumed same as
microscopy LTFU
Proportion of those who return for negative smear result who are then X-rayed
0.3 0.6 0.9 0.6 Cunninghamdata on x-
rays, calculation
Proportion of those with non-sputum work-up who are X-rayed
0.3 0.6 0.9 0.6 Cunninghamdata on x-
rays proportion of those with x-ray but no subsequent trial of Antibiotics
0.075 0.2 0.225 0.15 expert opinion, rest get trail of antibiotics
this is 25% of those getting x-ray
Sensitivity of field microscopy for "ss+" 0.85* here "ss+" means
would be detected by a good lab
.86 martinez 2005 mexico EQA program
Hawkennairobi2001 26% of "ss-" were ss+ --> .15 of ss+ missed
If we pick up 50- 60% of TB as ss+, can't be missing
many
Sensitivity of microscopy for ss- 0 Mundy Malawi 2002 had 98% concordance on good slides.
Specificity of microscopy 0.97 Manystudies
Sensitivity of x-ray for active TB 0.76 one point on ROC curve
Harries 1997 in Toman Malawi71%
Van Cleef 2003 76% in Nairobi, or 49%
nagpaul 88% 1970 national Indian lab
Specificity of x-ray for active TB 0.68 one point on ROC
curve Harries 1997 in Toman Malawi72%
Van Cleef 2003 67% inNairobi,or 90%
Bruchfeld Ethiopia67%,nagpaul 96%
No Symptomatic relief w antibiotic if Active TB
0.6 Bah, Somi 8,9% of ss- improvers
oyewo 44% improve,Salanoponi
wilkinson2000SA40%,willkinson

29had TB 2000 29%
of big Malawistudy
1997 50%,
specificity of trial of antibiotics 0.85
Wilkinson90%
too high numberwould not jibe with Bah, Somi results
Sensitivity of x-ray + Trial of Antibiotics 0.48 calculated 33,35
assume each step is independent
Specificity of x-ray + trial of antibiotics 0.94 Calculated 34 36
Outcomes cf Rate for Dots SSC treated ss+ TB 0.1 WHO 2005 includes
incompletetreatment
cfRate for dotsSSC treated ss- TB 0.05 WHO 2005
cf Rate for noDots SSC treated ss+ TB 0.3 0.3 0.3 0.2 WHO 2005 according to
text, this higherbecause of delay and dots always givesrifampicin
cfRate for no dotsSSC treated ss- TB 0.15 0.2 0.15 0.1 WHO 2005 we can get it right on average by using these numbers on the non-sputum test branch.
Mortality Rate for untreated ss+ TB 0.7 WHO 2005
Mortality Rate for untreated ss- TB 0.2 WHO 2005

30cost of a treatment in mortality terms 0.05 Calculated
in light of row 52
Marginal net value of treatment calculated as average value of ss- treatment/2.
DALYS lost per TB mortality 24 20 22 20 Murray Lopez GBD
Transmission multiplier for untreated ss+ TB Calculatedfrom disc.
rate
assumes transmission =1 per cycle, 4.5 year cycleup to 2050, so 10 cycles
Transmission multiplier for untreated ss- TB 22% of row 46
Discount rate 0.03 standard maybe should be higher in poorercountries
* When the other three columns are blank, same value assumed for all regions.

31
Table A2. Case Detection of Active (pulmonary, symptomatic) TB in HIV+Patients:
Base Case Clinical Values*
Africa South Asia Reference: References and additional comments Natural History Population (millions) 687 1615 WHO 2005 Incidence cases of HIV+ ss+ TB (1000s)
192 26 WHO 2005 93% of cases are in these two regions
Incidence cases of HIV+ ss- TB (1000s)
357 49 WHO 2005
% cases adult in ss+ 100 100 WHO data assumption HIV+ data in worksheet restricted to adults
% cases adult in ss- 100 100 WHO data assumption
Incidence cases of HIV+ ss+ TB (1000s)
192 26 row 8
Pulmonary ss-/all ss- 0.62 0.78 WHO 2005 p22 Pulmonary ss-/all ss- in HIV+ 0.54 0.68 Calculated assumes EP is twice as
likely in HIV+ as HIV- adults
Incidence cases of pulm HIV+ ss- TB (1000s)
195 33 row9*row12 note ss- bigger than ss+ in contrast to HIv- case, but …
...Apers had 54% TBss+ in sample 86% HIV + Zimbabwe 2004
Prob (active TB in suspects) 0.28 0.17 calculated from # of workups
RSS WHO 2004 has similar but smaller numbers for ss+ 43% in SA Wilkinson 2000
“Adult pulmonary TB suspects” HIV+
1,387 347 Calculated as row 18/ row 19
Status Quo Diagnosis Number of sputum diagnostic work-ups (1000s)
3071 6551 Cunningham Data
% adult pulm TB that is HIV+ 0.28 0.03 WHO data denominator includes row 12 + row 15 from HIV- = 973, 1829
Number workups for HIV+ 874 205 row 19 x row 20 assumes # work-ups per patient same for hiv+ and hiv- suspects

32 Proportion of “TB suspects” who at some point are tested with AFB Microscopy
0.63 0.59 Calculated from % cases treated DOTS,
WHO 2005
higher than % treated Dots because microscopy not always successful.
assumed same as HIV- breakdown
Proportion of TB suspects who are non-sputum diagnosed X-ray or trial of ABx
0.35 0.35 100% - row21 - row 23
Proportion of adults with pulm TB symptoms who are not tested for TB.
0.02 0.07 Calculated from % untreated WHO
2005
smaller than % untreated because some getting tests ultimately are not treated.
Microscopy loss to follow-up 0.15 0.1 Two studies 15% in Malawi Squire 2005 14% Malawi Nyirenda 1998
15% Botswana Creek , 5% bangladesh Van Deun opinon
Proportion of those who return for negative smear result who are then X-rayed
0.3 0.9 Cunningham data on x-rays, calculation
trial of antibiotics loss to follow-up
0.15 0.1 assumed same as microscopy LTFU
Proportion of those with non-sputum work-up who are X-rayed
0.3 0.9 Cunningham data on x-rays
proportion of those with x-ray but no subsequent trial of Antibiotics
0.075 0.225 expert opinion, rest get trail of antibiotics
subtracted from 27 and 28
Sensitivity of field microscopy for "ss+"
0.85 here "ss+" means would be detected by
a good lab
Apers, 66% ss+ in HIV +, 73% in just 38 HIV- patients Zimbabwe2003
Crampin 2001 Malawi 66% HIV+ and 89% HIV- were
ss+
Sensitivity of microscopy for ss-
0 Bruchfeld 2002 Ethiopia says all kinds of diagnostic performace degraded in HIV+
Specificity of microscopy for ss-
0.97 However, most of the refs parameters for test performance coming from SS Africa ...
do not differentiate by HIV status -- and come from countries where 30-80% of cases of HIV+
Sensitivity of x-ray for active TB
0.76 one point on ROC curve
Specificity of x-ray for active TB
0.68 one point on ROC curve
No Symptomatic relief w antibiotic if Active TB
0.6

33specificity of trial of antibiotics 0.85
Sensitivity of x-ray + Trial of Antibiotics
0.45 calculated 31,33
Specificity of x-ray + trial of antibiotics
0.95 Calculated 32 34
Outcomes CFRate for DOTS SSC treated ss+ TB
0.1 WHO 2005 marginal deaths due to TB -- HIV+ die of a lot of other diseases.
CFRate for DOTS SSC treated ss- TB
0.1 WHO 2005
CFRate for noDOTS SSC treated ss+ TB
0.38 WHO 2005
CFRate for noDOTS SSC treated ss- TB
0.5 WHO 2005
Mortality Rate for untreated ss+ TB
0.83 WHO 2005
Mortality Rate for untreated ss- TB
0.74 WHO 2005
cost of a treatment in mortality terms
0.05 Calculated Marginal net value of treatment calculated as average value of HIV- ss- treatment/2.
opportunity cost does not depend on current patient
16. DALYS lost per TB mortality
23 16 assumes ARV therapy available
Transmission multiplier for untreated ss+ TB
2 Calculated from disc. rate these numbers = HIV-
rates/3.1 to make HIV + transmission = 1/4 that HIV-.
they were not divided by 4 because some of difference due to more ss- in HIV+.
Transmission multiplier for untreated ss- TB
0.44 22% of row 46 assumes transmission =1 per cycle, 4.5 year cycle to 2050
duration of untreated TB = .5 for HIV+, 2 for Hiv-
Discount rate 0.03 standardmaybe should be higher in poorer countries

34False positive disutility ratio compared to False Negative
2 Median of survey .5 to 1
Survey showed disutility to overtreatment, but not as much for HIV+, and some interest in prevention of TB in HIV+ Godfrey Faussett
FP did badly in HIV+ (because MD missed something else?) Crampin

35
APPENDIX B: PRELIMINARY ANALYSIS FOR MDR TB
B.1. INTRODUCTION
The WHO Stop TB Department estimated that there were 321,000-689,000 new multi-
drug resistant tuberculosis (MDR TB) cases in 2003 (WHO, 2006) Historically, MDR TB
was widely believed to be an effect of poor patient compliance with standard TB
therapies. The solution to controlling the MDR TB epidemic was to improve patient
compliance with first line therapies and strengthen DOTS programs. Because of the
initially low incidence of MDR TB and the prohibitively high cost of second line
therapies, many countries offered few or no options for patients suspected of or known to
have MDR TB. Recently, MDR TB has received more attention and there is a greater
impetus to diagnose MDR TB, secure second line therapies and treat MDR TB patients.
MDR TB is now widely recognized to derive from several national TB program
shortcomings: inadequate treatment regimens, limited drug supply, poor drug quality and
limited patient compliance. (WHO,2006) Recent WHO guidelines offer a systematic
approach to addressing the increasing incidence of MDR TB. (WHO,2006)
Drug Susceptibility Testing (DST) is the primary means for diagnosing MDR TB. DST
can be performed directly on the sputum sample or, more commonly, it can be performed
indirectly on a culture specimen. Following culture, DST requires additional time and
laboratory sophistication. Direct DST is more difficult, requires greater laboratory
sophistication, and has lower sensitivity than indirect DST methods. (WHO, 2006) To
perform indirect DST technicians must first culture the sputum sample. Where culture is
accessible, it can take up to six weeks and it is prone to error. WHO recommends taking
several sputum samples to address this problem, performing DST on the sample cultured
best (WHO, 2006). While the accuracy of DST can vary with the particular drug tested,
it is most accurate for the drugs associated with MDR: Isoniazid and Rifampicin. WHO
strongly recommends DST testing as a pre-requisite for MDR TB control programs
arguing that empiric therapy with second-line drugs is dangerous in the long run (WHO,
2006). Empiric use of second-line drugs for first-line drug failures is accepted, but
mainly during transition as countries build their laboratory and testing infrastructure.

36
Empiric therapy with second-line drugs is, in the long run, dangerous and is therefore not
an acceptable long term method for distributing second line drugs.
Presently there are several DST methods for detecting MDR TB. The most commonly
used are the proportion, absolute concentration, and resistance ratio methods done on
solid media. DST on solid media can take an additional 2-4 weeks after culture.
Sensitivity and specificity are relatively consistent across these three methods. Where
culture and DST are performed, they are relatively sensitive and specific. Proficiency
testing and training are increasingly common and usually result in sensitivity and
specificity above 90%. (Abigail Wright, unpublished data).
Culture and Drug Susceptibility Testing (DST) tend to occur at the regional or national
laboratory level. Some countries have only one laboratory capable of performing DST.
In the former Soviet bloc countries, nearly everyone has access to culture and DST. In
India and China, access to DST is considerably more limited (Cunningham, 2004). The
public healthcare network does not even offer culture; only those who can afford to pay
for culture and DST have access to these tests if recommended by their care providers.
In the context of lengthy and difficult culture and DST, a rapid test for detecting MDR
TB could improve access in several regions, identify MDR TB patients more quickly and
lead to reductions in mortality and transmission. (WHO, 2006) The TB Working Group
of the Bill and Melinda Gates Foundation Global Diagnostics Forum considered several
intervention points for improved MDR TB diagnostics.
The diagnostic situation picked for study was a test for suspected MDR TB. Such a test
would be beneficial in all new cases in high-burden areas (e.g., Eastern Europe) and in
treatment failures irrespective of location. Although the proportion of MDR TB cases is
relatively low, the catastrophic consequences of a major MDR TB epidemic imply that
MDR TB carries more weight for TB control than the absolute number of cases might

37
suggest. Also, Category IV2 treatment is very expensive and onerous, so that most
developing countries would want to avoid any unnecessary treatments. Currently the
DST tests for MDR TB have to follow culture and are therefore hampered by both the
speed with which culture can occur and limitations on where testing can be properly
performed.
The group discussed the value of a diagnostic test for MDR TB in areas of high MDR TB
prevalence. Two scenarios were thought to be of value: testing all new cases in areas
with high MDR TB prevalence and testing those who failed initial treatment with first
line drugs in all locations. In both scenarios we would assume that all patients entering
the model were suspected of having TB and would receive some form of treatment
irrespective of the availability of DST. The new diagnostic would focus on determining
whether or not the patient had MDR TB and should therefore receive second line drugs.
The new diagnostic would be provided only to those patients who are currently treated.
We assume a positive test result will be followed by appropriate treatment for MDR TB
in all cases.
The group selected the diagnostic scenario of highest yield for MDR TB, testing
confirmed TB cases that have been previously treated for TB in Eastern Europe and Asia.3 Due to resource constraints and the delay of current diagnosis, in many settings DST
testing is limited to patients thought to have a high probability of have drug resistant TB.
At the country and regional levels, those most at risk for drug resistant TB are confirmed
TB cases that have been previously treated for TB. Because we model at the regional
level, we limit our model to those individuals with the greatest risk of MDR TB—
patients previously treated for TB. We go on to discuss the implications of testing people
earlier in the course of disease.
2 Category IV treatment refers to second-line drugs and treatment regimens used to treat MDR TB and should not include Isoniazid and Rifampicin (WHO, 2006) 3 Previously treated cases are defined as patients receiving one or more months of continuous treatment for TB sometime in the past. (WHO,2006)

38
Better diagnostic technology offers the potential to improve management of patients with
active tuberculosis in many ways by lowering the overall cost of testing, and increasing
the speed, sensitivity and specificity of diagnosis. In particular, drug susceptibility testing
for Isoniazid and Rifampicin resistance to detect MDR TB that does not depend on
culture or is less technically demanding could reduce transmission of MDR TB and
improve index case outcomes.
B,2, THE MODELING APPROACH FOR MDR TB
The general modeling approached used by Keeler et al (2006) to model the impact of
improved TB diagnostics is here applied to MDR TB. We developed a static decision
analytic model using decision trees. We characterize the status quo in current diagnosis
and treatment of MDR TB and then model the introduction of an improved diagnostic for
MDR TB. The diagnostic is chosen over the status quo when it produces improvements
in health outcomes.
MDR TB TREE DESCRIPTION
The tree begins with a previously treated (i.e. one who reports one or more months of
previous TB treatment) confirmed TB case. The ultimate treatment decision is whether
to use first- or second-line drugs. Initially, there are two options: test with culture and
DST or try a Category II regimen—an extended course of first-line drugs. The
alternative treatment is a Category IV regimen—a course of second-line drugs where
particular drugs selection is based on local resistance patterns. We assume Category IV
regimens will always exclude Isoniazid and Rifampicin.
Figure B.1 depicts our standardized model of the status quo in MDR TB diagnosis and
treatment. A certain percentage of the population has access to culture and DST. We
assume that patients are initiated on Category II treatment while awaiting DST results.
For those who test positive, because culture and DST are a lengthy process, some patients
will default from treatment before they receive test results. We assume that the
probability of defaulting is independent of underlying disease status. Those who default
are assigned outcomes associated with untreated MDR-TB or untreated drug susceptible

39
(DS) TB, depending on the underlying disease status of the patient. This is noted at “do
nothing” in Figure B.1. We assume culture and DST results will take approximately two
months and that two months of treatment with Category II drugs will not clear DS TB or
MDR TB. Those who test positive and do not default will be swapped to Category IV
regimens. We do not consider individualized treatments; but, rather, assume that
standardized treatment regimens are derived from local drug-resistance surveillance
(DRS) data. For those with MDR-TB, we assume this is appropriate treatment and
assign outcomes accordingly. For those with DS TB mistakenly treated with a Category
IV regimen we assign outcomes associated with Category IV treatment.
Those who test negative will remain on a Category II regimen. We consider this
appropriate treatment for those who have DS TB and assign outcomes for DOTS treated
TB from the TB tree. For those who have MDR-TB we track their response to re-
treatment: failed, defaulted/transferred, died, cured/successful treatment. Note that the
coding of outcomes for MDR TB patients explicitly considers the possibility of default
and we assume that the cumulative case fatality rate for DS TB patients appropriately
treated also includes the possibility of default. From Espinal et al (2000) we know that
the death rate for DS TB patients while receiving re-treatment averaged 3% across six
sites with failure and default rates of 7% and 15%, respectively.
Patients who remain on Category II treatment and then fail are subsequently treated with
a Category IV regimen. The mortality outcomes for this group are the same as those
initially treated with Category IV drugs. Those who default or transfer out are listed as
not completing treatment and are counted as untreated (Suarez, 2002). We define
successful treatment to mean zero mortality.
When DST is not available, we assume previously treated patients are given a trial of
Category II drugs. The possible outcomes for this group mimic those described above for
MDR TB patients who test negative with DST, but the probability the patient is MDR is
different than that following a negative test result.
40
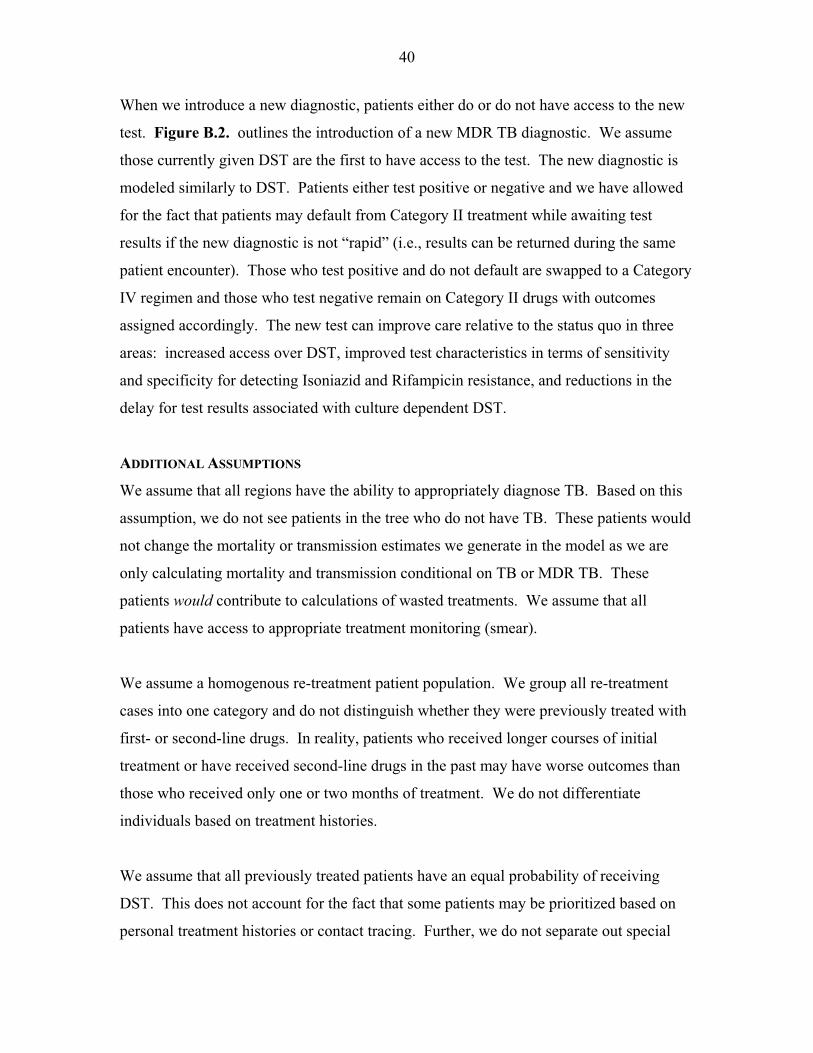
When we introduce a new diagnostic, patients either do or do not have access to the new
test. Figure B.2. outlines the introduction of a new MDR TB diagnostic. We assume
those currently given DST are the first to have access to the test. The new diagnostic is
modeled similarly to DST. Patients either test positive or negative and we have allowed
for the fact that patients may default from Category II treatment while awaiting test
results if the new diagnostic is not “rapid” (i.e., results can be returned during the same
patient encounter). Those who test positive and do not default are swapped to a Category
IV regimen and those who test negative remain on Category II drugs with outcomes
assigned accordingly. The new test can improve care relative to the status quo in three
areas: increased access over DST, improved test characteristics in terms of sensitivity
and specificity for detecting Isoniazid and Rifampicin resistance, and reductions in the
delay for test results associated with culture dependent DST.
ADDITIONAL ASSUMPTIONS
We assume that all regions have the ability to appropriately diagnose TB. Based on this
assumption, we do not see patients in the tree who do not have TB. These patients would
not change the mortality or transmission estimates we generate in the model as we are
only calculating mortality and transmission conditional on TB or MDR TB. These
patients would contribute to calculations of wasted treatments. We assume that all
patients have access to appropriate treatment monitoring (smear).
We assume a homogenous re-treatment patient population. We group all re-treatment
cases into one category and do not distinguish whether they were previously treated with
first- or second-line drugs. In reality, patients who received longer courses of initial
treatment or have received second-line drugs in the past may have worse outcomes than
those who received only one or two months of treatment. We do not differentiate
individuals based on treatment histories.
We assume that all previously treated patients have an equal probability of receiving
DST. This does not account for the fact that some patients may be prioritized based on
personal treatment histories or contact tracing. Further, we do not separate out special

41
populations such as children, pregnant women, HIV positive, elderly, or drug-dependent
patients when estimating the effects of testing and treatment.
We assume that no one is given Category IV treatment without a DST result or before
failing a trial regimen of Category II drugs. This is in line with WHO recommendations
(WHO, 2006).4 We assume that all previously treated patients have an equal probability
of receiving DST. This does not account for the fact that some patients may be
prioritized based on personal treatment histories or contact tracing. For all patients given
Category IV treatment regimens, we do not consider individualized treatments; but,
rather, assume that standardized treatment regimens are derived from local drug-
resistance surveillance (DRS) data.
We only consider resistance to Isoniazid and Rifampicin. A new diagnostic will simply
indicate whether or not a person has MDR TB—resistance to both Isoniazid and
Rifampicin. We do not assume that the new diagnostic will differentiate between
Isoniazid and Rifampicin resistance in reporting to allow for detection of mono-
resistance.
To isolate the impact of a new diagnostic under optimal treatment conditions, we assume
that all patients can access the appropriate treatment. Specifically, all patients can access
DOTS and appropriate Category IV drugs for local resistance patterns through a program
such as DOTS-Plus. Implicit in this strategy is the assumption that all settings can access
appropriate DRS data. We assume that patients are given standardized treatment
regimens consisting of 5-6 Category IV drugs. This is because we are evaluating the
benefit of a binary test for MDR TB. We do not assume that all patients will have access
to drug resistance testing for all first and second line drugs within the country. This
would be necessary to implement individualized treatment regimens.
4 Despite these recommendations some patients are empirically treated with Category IV drugs. This problem is particularly acute in former Soviet Union countries where up to 50 percent of previously treated patients may be initiated on Category IV regimens while awaiting DST results. Despite these occurrences, we chose to model the recommended treatment protocols.

42
B.3. MDR TB MODEL PARAMETERS
Table B.1. outlines the input parameters used in the MDR TB model for three regions:
Eastern Europe, Western Pacific and Southeast Asia. Calculations for particular
parameters are noted in the calculation column of table B.1 when appropriate. Further
discussion of particular parameters follows.
Percent receiving DST:
We calculate the percent of patients receiving DST in the status quo as the number of
DSTs given within a given region divided by the total number of previously treated cases
within that country. We use data on the number of DSTs given by region (Cunningham
et al., 2004). These data do not isolate DSTs given to previously treated and new cases.
Neither do the data separate out DSTs given for DRS. Thus, our calculation assumes that
very few new cases receive DST, very few are done for DRS and that patients do not
receive multiple tests.
Weekly default rate:
We assume the default rate is independent of underlying disease status. There is scant
data to inform this parameter, particularly by underlying disease status. It is not clear
whether MDR TB or DS TB patients are more likely to default from treatment with
Category II drugs while awaiting DST results. MDR TB patients may be more likely to
default as they are receiving ineffective treatment and will continue to feel ill.
Conversely, it may be that BD TB patients are more likely to default because they are
receiving appropriate treatment and beginning to feel better.
We base our estimate of a weekly default rate on the 3 month cumulative default rate
reported in Suarez et al. (2002). We use the reported 2 percent 3 month default rate
reported for all cases and assume a linear model to compute a weekly default rate of
0.25%.
OUTCOME PARAMETERS

43
We track two primary outcomes: mortality—both due to MDR TB and DS TB—and
transmission of MDR TB. Because we have a static model of MDR TB testing and
treatment, we track transmission through static multipliers depending on the numbers of
weeks a patient transmits.
Mortality:
We do not explicitly track ss+/ss- in the MDR TB model. Instead, we assume an initial
distribution of smear positive patients among previously treated cases of 60%. We use
this proportion to calculate case fatalities for DS TB as a weighted average of ss+ and ss-
case fatalities from the coughers TB model presented in Keeler et al. (2006). We do not
take HIV status into consideration.
Due to scarce data, we rely on expert opinion to determine MDR TB case fatality rates.
We assume the case fatality rate for DS TB patients treated with a Category II regimen is
equal to that for TB patients treated with DOTS. Based on expert consultations we
assume DS TB patients mistakenly treated with second line drugs will fare worse that
those treated with first-line drugs, but better than TB patients treated with non-DOTS
therapy, because Category IV regimens will not contain Isoniazid and Rifampicin. We
assume that the case fatality of DS TB patients treated with a Category IV regimen is
higher than the ss+/- weighted case fatality of DOTS treated TB, but lower than the ss+/-
weighted case fatality for non-DOTS treated TB, where the case fatalities are those
calculated in the cougher’s model in Keeler et al. (2006). We set the case fatality equal
to the midpoint—16%--of this range [8%,24%].
Transmission multipliers:
We track transmission of MDR TB as this highlights a prime driver of the increased
attention given to treating patients for MDR TB. Category IV drugs are far more
expensive and difficult to manage than standard DOTS treatment. The value of treating
MDR TB patients is, in part, in quelling the epidemic and averting further MDR TB
cases, along with the future costs associated with treating those cases.

44
There is thought that the MDR TB epidemic is expanding; in some areas the first stage
transmission coefficient may be greater than one (Coker, 2004). However, there is no
consensus on the overall state of the epidemic and so we assume a steady-state
transmission of MDR TB in calculating the weekly transmission rate for a single case of
untreated MDR TB. We assume no fitness cost to MDR TB. We assume patients are
infectious for two years (Borgdorff, 2002) and that a single transmission cycle is 4.5
years (Murray, 1991; Dye and Floyd, 2005). We assume patients are infectious for an
average of six months before entering the model. Some MDR TB patients will be cured
by Category II treatments (Espinal, 2000). We only consider transmission by MDR TB
patients on Category II who eventually die, fail, default, or transfer off treatment. In the
status quo, MDR TB patients fall into five transmission categories :
Those initiated on Category II and who would be cured by Category II treatment
(transmit 0 weeks)
Those testing positive with DST and for whom Category II treatment would not
have been successful (transmit 14 weeks awaiting results and assuming no
transmission once patient initiated on Category IV treatment)
Those given a trial of Category II treatment who die while on treatment (transmit
an average of 16 weeks assuming deaths uniformly distributed throughout
treatment period of eight months)
Those who fail a trial of Category II treatment and are given a Category IV
regimen (transmit 32 weeks assuming an eight months treatment period and no
transmission following initiation of Category IV treatment)
Those who default or transfer off Category II treatment (transmit 78 weeks)
Using the status quo decision tree we calculate the number of people in each category.
With the assumption that each case will generate one new MDR TB case each
transmission cycle we solve for the weekly transmission rate of 0.0186. The weekly
transmission rate times the weeks a patient will transmit gives the number of new cases
generated in a single transmission cycle by a patient in each of the above five categories.
Assuming a transmission cycle of 4.5 years and using a three percent discount rate give a
cycle discount factor of 0.875. Out to the year 2030 we have 6 transmission cycles. So,

45
each current MDR TB case will generate a*4.4096 new MDR TB cases out to the year
2030, where a is the number of new MDR TB cases generated in a single cycle for the
appropriate transmission category.
B.4. MDR TB RESULTS
Table B.2 shows the impact of hypothetical new diagnostics for MDR TB for all three
regions modeled. Tables B.3.-B.5. give the regional breakdowns of these results. We
first consider new diagnostics accessible to those currently receiving DST—status quo
access. Second, we consider access to a new diagnostic requiring moderate, minimal and
no infrastructure as defined in Olmsted et al. (2006). We modeled a rapid test to reflect
the recent FIND and Biotec (UK) announcement of a drug susceptibility test capable of
producing results within two days.
Table B.2. is split into sections by access categories defined by the infrastructure
requirements of the new diagnostic: requirements equivalent to current culture followed
by DST, moderate infrastructure, minimal infrastructure and no infrastructure. For the
regions we consider, most people can physically access technologies requiring minimal to
moderate infrastructure. Refer to Olmsted et al (2006) for more information on how we
assess the percent of a given population with access to diagnostics requiring moderate,
minimal or no infrastructure.
Within each infrastructure section, the rows represent hypothetical new tests described by
three characteristics: sensitivity, specificity and weeks until results are available to the
patient (which could be reduced by a faster test). The last four columns represent
outcomes relative to the status quo, so for example, a new diagnostic requiring moderate
infrastructure that is rapid and with sensitivity and specificity both equal to 90 percent
will save 4,533 lives. Reducing infrastructure requirements of the same test to minimal
infrastructure requirements will save 8,605 lives. Lives saved refers only to the index
cases. MDR TB cases averted refers to cumulative transmission out to the year 2030.
Wasted Category IV treatment is a measure of over-treatment and tracks DS TB patients
mistakenly initiated on a Category IV regimen. Because Category IV drugs are much

46
more expensive than standard TB treatment it is important that these medications go to
patients truly ill with MDR TB. Furthermore, inappropriate and excessive use of
Category IV treatments has the potential to lead to increased resistance to second line
therapies. The percent of total TB deaths averted refers to the percent of total annual TB
deaths prevented by the new diagnostic. Because previously treated cases are only a
small fraction of the total number of annual TB cases, this percentage will always be
small.
Much of the mortality reduction could come from increasing access.. The first test
shown—a slow test that is perfect and accessible to all who currently receive DST—
saves only 1,542 lives. Compare these gains to increasing access to current DST—a 95%
specific, 95% sensitive test with a 14 week delay and no infrastructure requirements--
which saves 9,370 lives. This same test prevents 68,299 MDR TB cases out to the year
2030 and increases unnecessary Category IV treatments by 18,292. This and other
imperfect but more accessible tests would increase unnecessary treatments with second
line drugs.
The final column gives the lives saved as a percent of total annual TB deaths. So a perfect
rapid test available to the entire population would save 17,464 lives each year (last row),
1% of the 1,750,000 total TB lives lost annually. Many have commented that if we did a
better job of initial treatment, MDR would be an even smaller concern.
The largest gains in reducing mortality are from improvements in access. Improvements
in DST test accuracy have a smaller yield because the test is already quite accurate.
Alternatively, the largest gains in reducing transmission are from shortening the delay for
test results. At all levels of access, for any test sensitivity and specificity combination,
we only see notable changes in future MDR TB cases by reducing the delay from 14
weeks to a few days.
Reduced delay or increased access, in principle, might be done with current methods for
DST. Investing in systems to track and follow-up people once they enter the system to

47
reduce defaulters would reduce the harm associated with delays in accessing test results.
Improved infrastructure in Asia would increase the number of people with access to
culture and DST. However, it might be more efficient to develop faster and less
demanding tests that would not require those investments.
Our model depends heavily on four parameters that are not well documented in the
scientific literature: Use of DST by previously treated patients, field sensitivity and
specificity of DST, and the mortality rate of DS TB patients treated with second line
drugs. In the next few years, as experience with MDR testing and treatment in the
DOTS- plus programs becomes available, modelers should be able to improve these
estimates.
B.5. MDR TB SENSITIVITY ANALYSES
The tornado diagram in Figure B.3 highlights the percent change in lives saved for a one
percent change in each input parameter listed for Southeast Asia. This one-way
sensitivity analysis is presented for the scenario in which the new diagnostic is 97 percent
sensitive, 97 percent specific, takes 14 weeks to produce results and requires minimal
infrastructure. Figure B.4 shows a two-way sensitivity analysis for a new rapid
diagnostic that requires minimal infrastructure. These lines show the tradeoffs between
sensitivity and specificity performance for a test that is widely available and convenient.
Tables B.2 and B.3.-B.5 also present the results of a Monte-Carlo simulation in which we
vary each input parameter within the ranges reported in Table B.1. These standard
deviations are indicative of the uncertainty underlying each of the parameters used in the
model. Standard deviations are reported in parentheses beneath the point estimates for
health outcomes associated with each row. Given the standard deviations, it will be
uncertain whether very minor improvements in the test specifications will lead to
noticeable improvements.

48
Figure B.1. Decision tree for status quo management of previously treated TB (MDR TB suspects)
MDR TBMDR_CatIV
No MDR TBTB_CatIV
Doesn't default / Treat with Category IV
MRD TBMDR_no_tx
No MDR TBTB_no_tx
Default
DST +
Treatment failure/Treat with Category IV
MDR_CatIV
Doesn't complete treatmentMDR_no_tx
Diev_die
Curedv_cure
MDR TB
No MDR TBTB_CatII
DST -
Culture & DST
Emprical Treatment with Category II
EMPIRIC_CATEGORY_II
Status Quo
EMPIRIC TREATMENT WITH CATEGORY II REGIMEN

49
Figure B.2. Introduction of a New Diagnostic for MDR TB
Give DSTDST
MDR TBMDR_CatIV
No MDR TBTB_CatIV
Doesn't default / Treat with Category IV
MRD TBMDR_no_tx
No MDR TBTB_no_tx
Default
New Dx +
New Dx -EMPIRIC_CATEGORY_II
Give New Dx
Formerly Culture & DST
Empirically Treat with Category II
EMPIRIC_CATEGORY_II
Give New DxNEW_DX
Formerly Empirically Treated with Category II
Access to New Dx
Culture & DSTDST
Empirical Treatment with Category II
EMPIRIC_CATEGORY_II
No Access toNew Dx
New Dx
NEW DIAGNOSTIC

50
Figure B.3. Tornado diagram for Southeast Asia for a new diagnostic requiring minimal infrastructure with a 14 week delay.
This figure outlines the percentage change for an equivalent percent change in each of the input parameters. The base scenario is a new diagnostic requiring minimal infrastructure that is 97 percent sensitive, 97 percent specific and has a 14 week delay to produce results. Consider the proportion of MDR patients dying on Cat II treatment (5th
line up from the bottom). This says that a 10 percent increase in that parameter means results in the proposed test saving 10 percent more lives. The test characteristics for DST are not important for this scenario because the proposed diagnostic beats DST on both sensitivity and specificity.

51
Figure B.4. Two-way sensitivity analysis of new diagnostic sensitivity versus specificity for a rapid test requiring minimal infrastructure.
This figure shows the trade-off between sensitivity and specificity of a new diagnostic that is rapid and requires only minimal infrastructure. For instance, a new diagnostic that is 80 percent sensitive and 80 percent specific will save 4,500 lives. Increasing sensitivity to 90 percent saves an additional 1,500 lives. Alternatively, increase specificity to 90 percent, and keeping sensitivity at 80 percent, saves an additional 2000 lives. This is due, in part, to the morality cost of mistreating a patient with H/R susceptible TB. When specificity is low more H/R susceptible patients are mistakenly given Category IV drugs.By the slope of the above lines we see that this cost of low specificity is slightly higher than the cost of low sensitivity—delaying treatment with Category IV drugs for MDR TB patients an additional 8 months or so. The true cost of low sensitivity may not be realized in examining lives saved, but, rather, is most apparent in examining changes in future cases of MDR TB.

52
Table B.1. Input Parameters for MDR TB Model Parameter Name Parameter Value* Calculation Source/Comment
Region Eastern Europe South-East Asia Western Pacific
Epidemiological Data
Population of Interest = Previously treated TB cases 75,000 332,000 362,000
Zignol et al. Presentation at the CDC Late Breaker session, UNION Conference 2005
Prevalence of MDR TB amongst previously treated TB patients
39%[32%,45%]
23%[15%,30%]
26%[20%,33%]
Zignol et al. Presentation at the CDC Late Breaker session, UNION Conference 2005
Weekly default rate on Category II treatment
0.25%[0.05%,0.5%] (3% cumulative default
rate)/(12 weeks) = 0.25%
This assumes that the default rate is independent of underlying disease status.This assumes a linear default model. 3% is the 3 month default rate for patients undergoing re-treatment with second line drugs (Suarez et al.,2002)
Access (by region)
Percent of TB patients currently given culture + DST
95%[80%,100%]
27%[15%,35%]
29%[20%,40%]
number of DSTs given/number of previously treated cases
Cunningham data, for Eastern Europe use Russian Federation
Percent of previously treated TB patients given Category II drugs 5% 73% 71%
Assume all previously treated cases not given DST are given a trial of category II drugs

53
Status Quo Test Characteristics Sensitivity of DST for I & R resistance
95%[80%,100%] Abigail Wright, unpublished data
expert opinionSpecificity of DST for I & R resistance
95%[80%,100%] Abigail Wright, unpublished data
expert opinion
Time delay for DST results (in weeks) 14[12,24]
This will be used to compute additional transmission due to delay in treatment. 3-4 month delay reported in Espinal et al (2000)
Responses to Category II regiment -- MDR TB patients
Failed 34%[8%,50%] Espinal et al. (2000) JAMA
Not completed 26% Taken to be defaulters
and transfers = 1 - failures - deaths - cures
Espinal et al. (2000) JAMA.
Die 11%[2%,18%] Espinal et al. (2000) JAMA
Cure 29%[14%,25%] Taken to be "treatment
success" Espinal et al. (2000) JAMA
New Diagnostic Characteristics Sensitivity varied Specificity varied
Time delay for results (weeks) varied[0,16] Consider discrete scenarios of 0 and 16
(fast and slow tests) Time delay for New Diagnostic results (in weeks) varied
Outcomes

54
Case fatality Case fatality for MDR patients treated with Category IV drugs
7%[5%,10%] Leimane et al. (2005) Lancet
Case fatality for MDR patients treated with Category II drugs who transfer or default
21%[18,35%]
expert opinion,, assume partial Category II treatment for defaulters and transfers equivalent to no treatment
Case fatality for DS TB patients treated with Category IV drugs
16%[8%,24%]
midpoint of case fatality of DOTS treated DS TB and non-DOTS treated
DS TB
Assume DS TB equivalent to standard TB. Assume that, because Cat IV regimens lack H and R, they are not as successful at clearing TB.
Case fatality for DS TB patients treated with Category II drugs
8%[5%,10%]
(% ss+)*(cf DOTs treated ss+ TB) + (1-
%ss+)*(cf DOTs treated ss- TB)
weighted average of ss+/- TB parameter for treated TB
Case fatality for DS TB defaulting or transferring off Category II
54%[30%,60%]
(% ss+)*(cf untreated ss+ TB) + (1-%ss+)*(cf
untreated ss- TB)
weighted average of ss+/- TB parameter for untreated TB. Applied to defaulters as well.
MDR TB Transmission to year 2030 (including all generations)
Weekly transmission rate 0.0186[0.012, 0.022] Calculated, see text
Weeks transmitting for MDR patients destined to be cured by Cat II 0 assumption
Weeks transmitting for MDR TB patients destined to fail/default/transfer off Category II who test positive with DST
14 Espinal et al., 2000

55
Weeks transmitting for MDR TB patients given a trial of Category II drugs who then die
16
Assume deaths uniformly distributed across an 8 month Category II treatment regimen
Espinal et al., 2000
Weeks transmitting for MDR TB patients failing a trial of Category II drugs
32 Espinal et al., 2000
Weeks transmitting for those who default or transfer off of Category II regimen
78 Borgdorff, 2002; assumes a 6 month lag before patients enter the model
Harm of Treatment
The "harm" of treatment: How many Category IV treatments of non-MDR TB will you accept to treat one more case of MDR TB properly?
1
From mortality data above, giving category IV drugs to non-MDR TB is just as dangerous as giving category II drugs to MDR TB. As C decreases, the number of false positives we will accept increases. A false positive rate of 1 corresponds to a C of approximately 0. Use a range of C = [0,0.02]
* Parameters listed in only the first column are constant across all regions. Ranges are given below the parameter where applicable.

56
Table B.2. The attributable benefit of a new diagnostic for MDR-TB --All Regions (SD)
Test Sensitivity Specificity
Delay for results (weeks)
TotalLives
Saved*
MDR-TBCases
Averted
Wasted Category
IVTreatments
Averted
Percent of PotentialTotal TB
Lives Lost Saved†
Status Quo: Culture and DST 95% 95% 14 0 0 0 0.00%
New Diagnostic with Status Quo Access‡
SlowTest
Perfect Test 100% 100% 14 1,542 -4,052 9,176 0.09% (669) (11,634) (2,873)
Rapid Test
Performance of DST 95% 95% 0 1,570 143,682 -333 0.09% (832) (30,656) (3,831) Perfect Test 100% 100% 0 2,778 153,926 9,176 0.16% (603) (24,559) (3,805)
New Diagnostic requiring Moderate Infrastructure§
Slow Test Performance of DST 95% 95% 14 3,837 27,809 -7,572 0.22% (1,206) (17,358) (3,293) Perfect Test 100% 100% 14 6,593 18,853 9,072 0.38% (1,906) (25,446) (4,379) Rapid Test Moderate Test 90% 90% 0 4,533 255,452 -25,423 0.26% (950) (48,254) (3,920) Performance of DST 95% 95% 0 6,655 272,407 -8,176 0.38% (1,447) (44,380) (4,648) Perfect Test 100% 100% 0 8,777 289,361 9,072 0.50% (1,094) (29,357) (4,967)
New Diagnostic requiring Minimal Infrastructure§
Slow Test Performance of DST 95% 95% 14 7,581 55,027 -14,911 0.43% (2,317) (44,890) (5,903) Perfect Test 100% 100% 14 11,551 41,397 9,176 0.66% (1,822) (46,122) (4,161) Rapid Test Moderate Test 90% 90% 0 8,605 378,433 -40,744 0.49% (2,194) (63,677) (3,846) Performance of DST 95% 95% 0 11,646 402,288 -15,784 0.67% (2,682) (59,264) (3,412) Perfect Test 100% 100% 0 14,687 426,142 9,176 0.84% (3,164) (68,831) (4,471)
New Diagnostic with No Infrastructure Requirements§

57
Slow Test Performance of DST 95% 95% 14 9,370 68,299 -18,292 0.54% (2,760) (40,118) (2,708) Perfect Test 100% 100% 14 13,894 52,585 9,176 0.79% (3,315) (53,163) (3,799) Rapid Test Moderate Test 90% 90% 0 10,543 435,551 -47,751 0.60% (2,821) (67,845) (4,694) Performance of DST 95% 95% 0 14,003 462,579 -19,288 0.80% (3,062) (47,345) (3,856) Perfect Test 100% 100% 0 17,463 489,606 9,176 1.00% (2,693) (75,518) (3,901)
* Refers to the index case only † The denominator used in this column is the total number of annual reported TB deaths: 1.75 million in 2003. The absolute best we ever achieve with respect to mortality is slightly under 1 percent of the total mortality burden, highlighting the relative importance of MDR TB diagnostics to other improvements in TB diagnostics ‡ Status Quo access for each region is defined as the percent of the population in the given region who currently receives DST: 95% for Eastern Europe, 27% for South-east Asia, and 29% for the Western Pacific Region. Table B.1 provides further information on the source and ranges for current access to DST. § For information on calculations of the percent of the population with access to minimal and no infrastructure requirements refer to Olmsted et al. (2006) SD, standard errors

58
Table B.3. The attributable benefit of a new diagnostic for MDR-TB in Eastern Europe (SD)
Test Sensitivity Specificity
Delay for results (weeks)
TotalLives
Saved*
MDR-TBCases
Averted
Wasted Category
IVTreatments
Averted
Percent of PotentialTotal TB
Lives Lost Saved†
Status Quo: Culture and DST 95% 95% 14 0 0 0 0.00%
New Diagnostic with Status Quo Access‡
SlowTest
Perfect Test 100% 100% 14 389 464 2,097 0.02% (204) (4,800) (1,814)
Rapid Test
Performance of DST 95% 95% 0 385 46,810 -76 0.02% (376) (16,907) (1,741) Perfect Test 100% 100% 0 723 50,570 2,097 0.04% (210) (10,271) (1,676)
New Diagnostic requiring Moderate Infrastructure§
Slow Test Performance of DST 95% 95% 14 0 0 0 0.00% (235) (6,411) (1,214) Perfect Test 100% 100% 14 370 441 1,993 0.02% (174) (4,626) (1,182) Rapid Test Moderate Test 90% 90% 0 44 40,920 -2,138 0.00% (136) (23,617) (1,373) Performance of DST 95% 95% 0 366 44,494 -72 0.02% (450) (22,244) (2,106) Perfect Test 100% 100% 0 687 48,068 1,993 0.04% (173) (9,128) (1,038)
New Diagnostic requiring Minimal Infrastructure§ Slow Test Performance of DST 95% 95% 14 16 156 -13 0.00% (97) (4,941) (988) Perfect Test 100% 100% 14 408 622 2,097 0.02% (187) (5,669) (976) Rapid Test Moderate Test 90% 90% 0 63 43,477 -2,277 0.00% (226) (22,866) (945) Performance of DST 95% 95% 0 403 47,261 -90 0.02% (361) (16,207) (1,919) Perfect Test 100% 100% 0 744 51,045 2,097 0.04% (329) (11,500) (2,027)
New Diagnostic with No Infrastructure Requirements§

59
Slow Test Performance of DST 95% 95% 14 135 1,297 -110 0.01% (191) (8,867) (1,080) Perfect Test 100% 100% 14 545 1,785 2,097 0.03% (246) (5,683) (1,497) Rapid Test Moderate Test 90% 90% 0 184 46,612 -2,478 0.01% (184) (25,430) (1,350) Performance of DST 95% 95% 0 540 50,570 -190 0.03% (213) (8,829) (882) Perfect Test 100% 100% 0 896 54,528 2,097 0.05% (288) (11,533) (1,917)
* Refers to the index case only † The denominator used in this column is the total number of annual reported TB deaths: 1.75 million in 2003. The absolute best we ever achieve with respect to mortality is slightly under 1 percent of the total mortality burden, highlighting the relative importance of MDR TB diagnostics to other improvements in TB diagnostics ‡ Status Quo access for each region is defined as the percent of the population in the given region who currently receives DST: 95% for Eastern Europe, 27% for South-east Asia, and 29% for the Western Pacific Region. Table B.1 provides further information on the source and ranges for current access to DST. § For information on calculations of the percent of the population with access to minimal and no infrastructure requirements refer to Olmsted et al. (2006) SD, standard errors

60
Table B.4 The attributable benefit of a new diagnostic for MDR-TB Southeast Asia (SD)
Test Sensitivity Specificity
Delay for results (weeks)
TotalLives
Saved*
MDR-TBCases
Averted
Wasted Category
IVTreatments
Averted
Percent of PotentialTotal TB
Lives Lost Saved†
Status Quo: Culture and DST 95% 95% 14 0 0 0 0.00%
New Diagnostic with Status Quo Access‡
SlowTest
Perfect Test 100% 100% 14 539 -2,471 3,330 0.03% (458) (9,149) (1,107)
Rapid Test
Performance of DST 95% 95% 0 556 42,921 -121 0.03% (398) (20,332) (1,652) Perfect Test 100% 100% 0 954 45,711 3,330 0.05% (424) (12,318) (1,224)
New Diagnostic requiring Moderate Infrastructure§
Slow Test Performance of DST 95% 95% 14 1,707 11,583 -3,824 0.10% (815) (13,033) (2,027) Perfect Test 100% 100% 14 2,865 6,274 3,330 0.16% (1,260) (14,096) (959) Rapid Test Moderate Test 90% 90% 0 2,046 97,790 -11,497 0.12% (732) (23,675) (2,691) Performance of DST 95% 95% 0 2,902 103,783 -4,083 0.17% (807) (33,194) (3,261) Perfect Test 100% 100% 0 3,757 109,776 3,330 0.21% (695) (20,371) (3,185)
New Diagnostic requiring Minimal Infrastructure§
Slow Test Performance of DST 95% 95% 14 1,707 11,583 -3,824 0.10% (815) (13,033) (2,027) Perfect Test 100% 100% 14 2,865 6,274 3,330 0.16% (1,260) (14,096) (959) Rapid Test Moderate Test 90% 90% 0 2,046 97,790 -11,497 0.12% (732) (23,675) (2,691) Performance of DST 95% 95% 0 2,902 103,783 -4,083 0.17% (807) (33,194) (3,261) Perfect Test 100% 100% 0 3,757 109,776 3,330 0.21% (695) (20,371) (3,185)

61
New Diagnostic with No Infrastructure Requirements§
Slow Test Performance of DST 95% 95% 14 4,019 27,276 -9,004 0.23% (2,097) (33,019) (1,451) Perfect Test 100% 100% 14 6,017 18,123 3,330 0.34% (2,494) (38,428) (2,480) Rapid Test Moderate Test 90% 90% 0 4,605 175,909 -22,234 0.26% (1,559) (41,696) (2,657) Performance of DST 95% 95% 0 6,079 186,242 -9,452 0.35% (2,483) (33,316) (2,585) Perfect Test 100% 100% 0 7,554 196,575 3,330 0.43% (1,938) (60,246) (2,786)
* Refers to the index case only † The denominator used in this column is the total number of annual reported TB deaths: 1.75 million in 2003. The absolute best we ever achieve with respect to mortality is slightly under 1 percent of the total mortality burden, highlighting the relative importance of MDR TB diagnostics to other improvements in TB diagnostics ‡ Status Quo access for each region is defined as the percent of the population in the given region who currently receives DST: 95% for Eastern Europe, 27% for South-east Asia, and 29% for the Western Pacific Region. Table B.1 provides further information on the source and ranges for current access to DST. § For information on calculations of the percent of the population with access to minimal and no infrastructure requirements refer to Olmsted et al. (2006) SD, standard errors

62
Table B.5. The attributable benefit of a new diagnostic for MDR-TB in the Western Pacific Region (SD)
Test Sensitivity Specificity
Delay for results (weeks)
TotalLives
Saved*
MDR-TBCases
Averted
Wasted Category
IVTreatments
Averted
Percent of PotentialTotal TB
Lives Lost Saved†
Status Quo: Culture and DST 95% 95% 14 0 0 0 0.00%
New Diagnostic with Status Quo Access‡
SlowTest
Perfect Test 100% 100% 14 614 -2,044 3,748 0.04% (443) (5,349) (1,933)
Rapid Test
Performance of DST 95% 95% 0 629 53,952 -136 0.04% (626) (15,511) (2,985) Perfect Test 100% 100% 0 1,101 57,645 3,748 0.06% (373) (18,599) (3,190)
New Diagnostic requiring Moderate Infrastructure§
Slow Test Performance of DST 95% 95% 14 2,131 16,226 -3,748 0.12% (857) (9,506) (2,293) Perfect Test 100% 100% 14 3,358 12,138 3,748 0.19% (1,419) (20,674) (4,106) Rapid Test Moderate Test 90% 90% 0 2,443 116,743 -11,789 0.14% (591) (34,788) (2,499) Performance of DST 95% 95% 0 3,388 124,130 -4,020 0.19% (1,113) (19,311) (2,557) Perfect Test 100% 100% 0 4,333 131,517 3,748 0.25% (827) (19,067) (3,667)
New Diagnostic requiring Minimal Infrastructure§ Slow Test Performance of DST 95% 95% 14 2,131 16,226 -3,748 0.12% (857) (9,506) (2,293) Perfect Test 100% 100% 14 3,358 12,138 3,748 0.19% (1,419) (20,674) (4,106) Rapid Test Moderate Test 90% 90% 0 2,443 116,743 -11,789 0.14% (591) (34,788) (2,499) Performance of DST 95% 95% 0 3,388 124,130 -4,020 0.19% (1,113) (19,311) (2,557) Perfect Test 100% 100% 0 4,333 131,517 3,748 0.25% (827) (19,067) (3,667)
New Diagnostic with No Infrastructure Requirements§

63
Slow Test Performance of DST 95% 95% 14 5,216 39,726 -9,177 0.30% (1,784) (20,990) (2,015) Perfect Test 100% 100% 14 7,333 32,677 3,748 0.42% (2,170) (36,294) (2,458) Rapid Test Moderate Test 90% 90% 0 5,755 213,030 -23,040 0.33% (2,344) (47,093) (3,627) Performance of DST 95% 95% 0 7,384 225,767 -9,646 0.42% (1,778) (32,460) (2,723) Perfect Test 100% 100% 0 9,013 238,503 3,748 0.52% (1,847) (44,050) (1,943)
* Refers to the index case only † The denominator used in this column is the total number of annual reported TB deaths: 1.75 million in 2003. The absolute best we ever achieve with respect to mortality is slightly under 1 percent of the total mortality burden, highlighting the relative importance of MDR TB diagnostics to other improvements in TB diagnostics ‡ Status Quo access for each region is defined as the percent of the population in the given region who currently receives DST: 95% for Eastern Europe, 27% for South-east Asia, and 29% for the Western Pacific Region. Table B.1 provides further information on the source and ranges for current access to DST. § For information on calculations of the percent of the population with access to minimal and no infrastructure requirements refer to Olmsted et al. (2006) SD, standard errors