a global burden of disease syste - PLOS
15
RESEARCH ARTICLE The global, regional, and national burden and quality of care index (QCI) of colorectal cancer; a global burden of disease systematic analysis 1990–2019 Seyed Aria Nejadghaderi ID 1☯ , Shahin Roshani 1☯ , Esmaeil Mohammadi 1,2 , Moein Yoosefi 1 , Negar Rezaei 1,3 , Zahra Esfahani 1,4 , Sina Azadnajafabad 1 , Naser Ahmadi 1 , Sarvenaz Shahin 1 , Ameneh Kazemi 1,3 , Alireza Namazi Shabestari 5 , Ardeshir Khosravi 6 , Ali H. Mokdad 7 , Bagher Larijani 3 , Farshad Farzadfar ID 1,3 * 1 Non-Communicable Diseases Research Center, Endocrinology and Metabolism Population Sciences Institute, Tehran University of Medical Sciences, Tehran, Iran, 2 Sina Trauma and Surgery Research Center, Tehran University of Medical Sciences (TUMS), Tehran, Iran, 3 Endocrinology and Metabolism Research Center, Endocrinology and Metabolism Clinical Sciences Institute, Tehran University of Medical Sciences, Tehran, Iran, 4 Department of Biostatistics, University of Social Welfare and Rehabilitation Sciences, Tehran, Iran, 5 Department of Geriatric Medicine, School of Medicine, Tehran University of Medical Sciences, Tehran, Iran, 6 Iranian Ministry of Health and Medical Education, Tehran, Iran, 7 Institute for Health Metrics and Evaluation, University of Washington, Seattle, WA, United States of America ☯ These authors contributed equally to this work. * [email protected], [email protected] Abstract Background Colorectal cancer (CRC) is among the five most incident and lethal cancers in world and its burden varies between countries and sexes. We aimed to present a comprehensive mea- sure called the quality of care index (QCI) to evaluate the inequity and healthcare quality of care regarding CRC by sex and location. Methods Data on the burden of CRC were extracted from the Global Burden of Disease study 2019. It was transformed to four ratios, including mortality-to-incidence, disability-adjusted life years (DALYs)-to-prevalence, prevalence-to-incidence, and years of life lost (YLLs)-to-years lived with disability (YLDs). Principal component analysis was implemented on the four ratios and the most influential component was considered as QCI with a score ranging from zero to 100, for which higher scores represented better quality of care. Gender Disparity Ratio (GDR) was calculated by dividing QCI for females by males. Results The global incidence and death numbers of CRC were 2,166,168 (95% uncertainty interval: 1,996,298–2,342,842) and 1,085,797 (1,002,795–1,149,679) in 2019, respectively. Glob- ally, QCI and GDR values were 77.6 and 1.0 respectively in 2019. There was a positive PLOS ONE PLOS ONE | https://doi.org/10.1371/journal.pone.0263403 April 21, 2022 1 / 15 a1111111111 a1111111111 a1111111111 a1111111111 a1111111111 OPEN ACCESS Citation: Nejadghaderi SA, Roshani S, Mohammadi E, Yoosefi M, Rezaei N, Esfahani Z, et al. (2022) The global, regional, and national burden and quality of care index (QCI) of colorectal cancer; a global burden of disease systematic analysis 1990–2019. PLoS ONE 17(4): e0263403. https:// doi.org/10.1371/journal.pone.0263403 Editor: Amir Radfar, University of Central Florida, UNITED STATES Received: July 12, 2021 Accepted: January 18, 2022 Published: April 21, 2022 Copyright: © 2022 Nejadghaderi et al. This is an open access article distributed under the terms of the Creative Commons Attribution License, which permits unrestricted use, distribution, and reproduction in any medium, provided the original author and source are credited. Data Availability Statement: No individual data were reported in this paper and the information is based on aggregated pre-existing online data (available on https://vizhub.healthdata.org/gbd- compare/). Funding: The author(s) received no specific funding for this work. Competing interests: The authors have declared that no competing interests exist.
-
Upload
khangminh22 -
Category
Documents
-
view
0 -
download
0
Transcript of a global burden of disease syste - PLOS
RESEARCH ARTICLE
The global, regional, and national burden and
quality of care index (QCI) of colorectal cancer;
a global burden of disease systematic analysis
1990–2019
Seyed Aria NejadghaderiID1☯, Shahin Roshani1☯, Esmaeil Mohammadi1,2, Moein Yoosefi1,
Negar Rezaei1,3, Zahra Esfahani1,4, Sina Azadnajafabad1, Naser Ahmadi1,
Sarvenaz Shahin1, Ameneh Kazemi1,3, Alireza Namazi Shabestari5, Ardeshir Khosravi6, Ali
H. Mokdad7, Bagher Larijani3, Farshad FarzadfarID1,3*
1 Non-Communicable Diseases Research Center, Endocrinology and Metabolism Population Sciences
Institute, Tehran University of Medical Sciences, Tehran, Iran, 2 Sina Trauma and Surgery Research Center,
Tehran University of Medical Sciences (TUMS), Tehran, Iran, 3 Endocrinology and Metabolism Research
Center, Endocrinology and Metabolism Clinical Sciences Institute, Tehran University of Medical Sciences,
Tehran, Iran, 4 Department of Biostatistics, University of Social Welfare and Rehabilitation Sciences, Tehran,
Iran, 5 Department of Geriatric Medicine, School of Medicine, Tehran University of Medical Sciences,
Tehran, Iran, 6 Iranian Ministry of Health and Medical Education, Tehran, Iran, 7 Institute for Health Metrics
and Evaluation, University of Washington, Seattle, WA, United States of America
☯ These authors contributed equally to this work.
* [email protected], [email protected]
Abstract
Background
Colorectal cancer (CRC) is among the five most incident and lethal cancers in world and its
burden varies between countries and sexes. We aimed to present a comprehensive mea-
sure called the quality of care index (QCI) to evaluate the inequity and healthcare quality of
care regarding CRC by sex and location.
Methods
Data on the burden of CRC were extracted from the Global Burden of Disease study 2019. It
was transformed to four ratios, including mortality-to-incidence, disability-adjusted life years
(DALYs)-to-prevalence, prevalence-to-incidence, and years of life lost (YLLs)-to-years lived
with disability (YLDs). Principal component analysis was implemented on the four ratios and
the most influential component was considered as QCI with a score ranging from zero to
100, for which higher scores represented better quality of care. Gender Disparity Ratio
(GDR) was calculated by dividing QCI for females by males.
Results
The global incidence and death numbers of CRC were 2,166,168 (95% uncertainty interval:
1,996,298–2,342,842) and 1,085,797 (1,002,795–1,149,679) in 2019, respectively. Glob-
ally, QCI and GDR values were 77.6 and 1.0 respectively in 2019. There was a positive
PLOS ONE
PLOS ONE | https://doi.org/10.1371/journal.pone.0263403 April 21, 2022 1 / 15
a1111111111
a1111111111
a1111111111
a1111111111
a1111111111
OPEN ACCESS
Citation: Nejadghaderi SA, Roshani S, Mohammadi
E, Yoosefi M, Rezaei N, Esfahani Z, et al. (2022)
The global, regional, and national burden and
quality of care index (QCI) of colorectal cancer; a
global burden of disease systematic analysis
1990–2019. PLoS ONE 17(4): e0263403. https://
doi.org/10.1371/journal.pone.0263403
Editor: Amir Radfar, University of Central Florida,
UNITED STATES
Received: July 12, 2021
Accepted: January 18, 2022
Published: April 21, 2022
Copyright: © 2022 Nejadghaderi et al. This is an
open access article distributed under the terms of
the Creative Commons Attribution License, which
permits unrestricted use, distribution, and
reproduction in any medium, provided the original
author and source are credited.
Data Availability Statement: No individual data
were reported in this paper and the information is
based on aggregated pre-existing online data
(available on https://vizhub.healthdata.org/gbd-
compare/).
Funding: The author(s) received no specific
funding for this work.
Competing interests: The authors have declared
that no competing interests exist.

association between the level of quality of care and socio-demographic index (SDI) quin-
tiles. Region of the Americas and African Region had the highest and lowest QCI values,
respectively (84.4 vs. 23.6). The QCI values started decreasing beyond the age of 75 in
2019 worldwide.
Conclusion
There is heterogeneity in QCI between SDI quintiles. More attention should be paid to peo-
ple aged more than 75 years old because of the lower quality of care in this group.
Introduction
Colorectal cancer (CRC) was the second cause of death and the third one in incidence among
cancers which constituted 9.4% and 10.0% of deaths and incidence of all cancers, respectively,
among both sexes and around the world in 2020 [1]. Disability-adjusted life years (DALYs) for
CRC out of total DALYs attributable to all causes has increased from 0.48% in 1990 to 0.96%
in 2019 [2].
The quality of care according to the World Health Organization (WHO) definition is “the
extent of which healthcare services are provided to individuals and populations to improve
desired health outcomes”. To achieve this, healthcare must be “safe, effective, timely, equitable
and patient-centered” [3, 4]. Generally, the quality of healthcare has increased between 2000
and 2015 but it was not equal [5]. Sex, race, and socioeconomic disparities in incidence and
mortality of CRC might be attributable to various risk factors like unhealthy diet and physical
inactivity, or lack of easy access to screening and early diagnostic modalities or effective treat-
ment resources, which need to be determined and be addressed around the world properly [6–
8]. Also, evaluating the inequity in different countries would provide some insights for policy-
makers to be used in countries with low-quality care. There are indicators such as the socio-
demographic index (SDI) to assess the range of development based on the five above-men-
tioned WHO healthcare criteria. Some initiatives like the World Bank Delivery Indicators and
the WHO Global Health Observatory are trying to identify indices to assess the improvements
in the quality of care; while, they have not been introduced as comprehensive indices yet [9,
10].
Some indices like the concentration index and horizontal inequity have been introduced to
compare inequities in health systems; however, there is not any comprehensive and unbiased
index to make the quality of care and inequities comparable [11, 12]. Herein, a new compre-
hensive index called the quality of care index (QCI) is used to compare the inequities in the
quality of care for CRC globally, regionally, and nationally in both sexes and different age
groups from 1990 to 2019.
Methods
Overview
The methodological details of the Global Burden of Disease (GBD) data have been expressed
elsewhere [13–15]. Briefly, the Institute for Health Metrics and Evaluation (IHME) coordi-
nates the GBD study that provides the mortality, incidence, prevalence, years of life lost
(YLLs), years lived with disability (YLDs), DALYs, and other measures of 369 diseases and
injuries and 87 risk factors in 204 countries and territories from 1990 to 2019 [13, 14]. This
PLOS ONE QCI for colorectal cancer
PLOS ONE | https://doi.org/10.1371/journal.pone.0263403 April 21, 2022 2 / 15
Abbreviations: CRC, Colorectal cancer; DALYs,
Disability-adjusted life years; WHO, World Health
Organization; SDI, Socio-demographic index; QCI,
Quality of care index; GBD, Global Burden of
Disease; IHME, Institute for Health Metrics and
Evaluation; YLLs, Years of life lost; YLDs, Years
lived with disability; GATHER, Guidelines for
Accurate and Transparent Health Estimates
Reporting; ICD, International Classification of
Diseases; MIR, Mortality-to-incidence ratio; PCA,
Principal component analysis; UHC, Universal
health coverage; GDR, Gender disparity ratio; UI,
Uncertainty interval; USPSTF, US Preventive
Service Task Force; FOBT, Fecal occult blood test;
FIT, Fecal immunochemical test; HR, Hazard ratio;
CI, Confidence interval; OR, Odds ratio.

study is in accordance with the Guidelines for Accurate and Transparent Health Estimates
Reporting (GATHER) [16].
Data sources
According to the 10th revision of the International Classification of Diseases (ICD),
C18-C21.9 (C18: Malignant neoplasm of the colon; C19: Malignant neoplasm of rectosigmoid
junction; C20: Malignant neoplasm of the rectum; C21: Malignant neoplasm of anus and anal
canal), D01.0-D01.3 (D01.0: Carcinoma in situ: Colon; D01.1: Carcinoma in situ: Rectosig-
moid junction; D01.2: Carcinoma in situ: Rectum; D01.3: Carcinoma in situ: Anus and anal
canal), D12-D12.9 (Benign neoplasm of colon, rectum, anus and anal canal), and D37.3-D37.5
(D37.3: Neoplasm of uncertain or unknown behavior: Appendix; D37.4: Neoplasm of uncer-
tain or unknown behavior: Colon; D37.5: Neoplasm of uncertain or unknown behavior: Rec-
tum) codes were selected as CRC death, which was mapped to B.1.6 GBD code as CRC [13,
17]. In addition, ICD-10 codes of C18-C19.0, C20, C21-C21.8, Z12.1-Z12.13 (Z12.1: Special
screening examination for neoplasm of the intestinal tract), Z85.03-Z85.048 (Z85.0: Personal
history of malignant neoplasm of digestive organs), and Z86.010 (Z86.0: Personal history of
other neoplasms) were mapped to define CRC new cases [18].
Here, we focus on the QCI to show the inequity in the quality of CRC care by using GBD
1990–2019 data [19]. The details of utilized methods have been explained somewhere else [20].
In brief, we used four stages in order to compute QCI, which were data acquisition (e.g.
retrieving data from GBD, retrieving primary measures like DALY, YLL, YLD, death, inci-
dence, prevalence, and manually inspection of each measure for zero estimates), data curation
(this step was optional and aimed to reduce the size of the retrieved data), data analysis (i.e.
secondary measures calculation and implementation of the principal component analysis
(PCA)), and data visualization.
QCI
The incidence, mortality, prevalence, YLL, YLD, and DALY age-standardized rates were
extracted from the GBD study. The mentioned rates and indices were transformed to four
ratios, including mortality-to-incidence (MIR), prevalence-to-incidence, DALY-to-prevalence,
and YLL-to-YLD. The MIR represents that with considering a stable incidence of CRC, a
higher number of mortality represents worse conditions. The prevalence-to-incidence ratio
represents that with a similar number of incidence, a higher prevalence shows better manage-
ment which prevents death. The DALY-to-prevalence ratio indicates that with the same preva-
lence between regions, higher DALY is representative of the worse quality of care. Finally, the
YLL-to-YLD ratio shows the role of the health system in postponing deaths, and higher values
shows worse conditions. Then, these measures were combined by the PCA method to create a
comprehensive index called QCI that represents the overall quality of care as diagnostic and
therapeutic services. PCA is a statistical technique that represents the linear correlation of mul-
tiple variables as orthogonal components [21]. The first component of PCA, which had the
highest score, was chosen as QCI. The score of QCI was then transformed to a range from zero
to 100 using the following formula:
QCI xð Þ ¼½PCAscore ðxÞ � min PCAscore�
½max PCAscore � min PCAscoreÞ
Where x is the data point. Higher amounts of QCI represent higher levels of quality of care.
Further details on the PCA statistical technique and QCI calculation are provided in S1
Appendix.
PLOS ONE QCI for colorectal cancer
PLOS ONE | https://doi.org/10.1371/journal.pone.0263403 April 21, 2022 3 / 15

Validation of QCI
The article by Lozano et al. [22] introduced an index called the universal health coverage
(UHC) to evaluate the quality of healthcare and to measure the health profiles of countries
across the world. The GBD 2019 mapped 23 effective coverage indicators based on types of
health services and population age groups for each combination of location and year to mea-
sure UHC. Compared with UHC, QCI can be estimated by sex and age and is more convenient
for calculation since it only uses basic epidemiological measures, including mortality, inci-
dence, prevalence, YLL, YLD, and DALY instead of using 23 effective coverage indicators and
could be estimated for all causes included in the GBD study.
Assessing the results of our developed index showed that it is comparable with UHC. We
performed a mixed-effect model analysis on age-standardized values to estimate the correla-
tion between UHC index for CRC treatment and QCI. We considered inpatient admissions
and outpatient visits per capita, in addition to attributable burden to CRC risk factors, deaths,
and prevalence of CRC as independent variables with fixed effects and considering countries
as a random effect, and QCI as a dependent variable [23]. The Pearson correlation coefficient
between the predicted QCI obtained from a mixed-effect regression model for CRC and UHC
index for CRC treatment was 0.87, representing a significant association between UHC and
QCI, which proved the validation of QCI for measurement of quality of care in patients with
CRC. The utilized formula for this correlation is provided in S1 Appendix.
Gender disparity ratio (GDR)
The QCI scores in females were divided by the scores in males and the result was called GDR.
The values that were closer to one show less inequity between males and females. Values more
than one represented the better quality of care for females, and values less than one indicated
better quality of care in males with CRC.
SDI stratification
Measures of income per capita, total fertility rate, and educational access are included in the
SDI definition [24]. Countries and regions are comparable for income and educational levels
by SDI. Regions were divided into five quintiles, including high, high-middle, middle, low-
middle, and low based on the estimated SDI values [25].
Statistical analysis
Analyses were conducted and tables and figures were drawn using the R version 3.6.0 and R-
studio statistical software for Windows software package (http://www.r-project.org/, RRID:
SCR_001905, Vienna, Austria) [26]. Primary measures, including incidence, death, prevalence,
YLL, YLD, and DALY rates were reported in 95% uncertainty intervals (UIs) to provide both
the interval and point estimations. Uncertainty was determined by sampling 1000 draws at
each computational step. Then, uncertainty from multiple sources such as input data, correc-
tions of measurement error, and estimates of residual non-sampling error was combined. UIs
were defined as the 25th and 975th values of the ordered draws. The age-standardizing tech-
nique was used to make the primary measures results comparable between different locations.
Results
Overview
There were 2,166,168 (95% UI: 1,996,298–2,342,842) new cases of CRC in 2019 and it was the
cause of death in 1,085,797 (1,002,795–1,149,679) individuals in the same year, globally. The
PLOS ONE QCI for colorectal cancer
PLOS ONE | https://doi.org/10.1371/journal.pone.0263403 April 21, 2022 4 / 15

CRC led to 24,284,087 (22,614,920–25,723,221) DALYs in 2019 in comparison with
12,408,147 (11,858,132–12,924,930) in 1990 around the world (Table 1).
The age-standardized incidence rate (ASIR) of CRC has increased in all SDI quintiles over
1990–2019, but it barely increased in the highest quintile. The high and low SDI quintiles with
42.8 (38.7–46.6) and 7.3 (6.5–8.1) had the highest and lowest ASIR in 2019, respectively. The
age-standardized mortality rate (ASMR) increased in all SDI countries except for the high SDI
quintile which decreased from 21.2 (20.1–21.7) in 1990 to 16.3 (14.9–17.1) in 2019. Of note, it
barely increased in the high-middle SDI quintile (S1 Table).
In 2019, the European Region and African Region with DALY rates of 386.2 (363.4–407.7)
and 190.5 (167.3–215) had the highest and lowest values among WHO regions in both sexes,
respectively (S2 Table). Among the 21 GBD regions, Central Europe with 512.6 (448.7–577.9)
age-standardized DALYs and 23.6 (20.8–26.4) age-standardized deaths per 100,000 had the
highest rates of these measures of CRC among both sexes combined in 2019 (S3 Table).
QCI
The QCI score increased from 63.6 in 1990 to 77.6 in 2019 globally (S4 Table). In 2019, the
QCI values had a higher difference between females and males in comparison with QCI values
in 1990 (78.6 vs. 76.2 in 2019 and 63.9 vs. 63.5 in 1990 in males vs. females, respectively) (S5
Table). QCI values elevated with an increase in age up to 75 years old and started decreasing
after this age (Fig 1).
The QCI scores increased in all WHO regions over 1990–2019 and Western Pacific Region
had the greatest increase within this period. In 2019, the African Region with a QCI value
equal to 23.6 had the lowest QCI value among WHO regions, while the Region of the Americas
(84.4) and Western Pacific Region (84.3) had the highest QCI values (S4 Table).
Similar to WHO regions, QCI values in all SDI quintiles had an increase in 2019 compared
to 1990, except for the high SDI quintile which had a fairly substantial decrease and the high-
middle SDI quintile which had a slight decrease in this regard. Also, there was a positive associ-
ation between SDI quintiles and QCI values in which more developed countries had higher
QCI values. In the low and low-middle SDI quintile, there was a peak in QCI in the 15–19 age
group, whereas high and high-middle SDI countries showed a remarkable decrease in this age
group in 2019 (Fig 1).
Table 1. The all-ages numbers and age-standardized rates of incidence, death, and disability-adjusted life years (DALYs) in males, females, and both sexes globally
in 1990 and 2019.
1990 2019
Incidence Deaths DALYs Incidence Deaths DALYs
Sex Number Rate Number Rate Number Rate Number Rate Number Rate Number Rate
Both 842098
(810408 to
868574)
22.2
(21.3 to
23)
518126
(493682 to
537877)
14.3
(13.5 to
14.9)
12408147
(11858132 to
12924930)
308.5
(294.7 to
320.8)
2166168
(1996298 to
2342842)
26.7
(24.6 to
28.9)
1085797
(1002795 to
1149679)
13.7
(12.6 to
14.5)
24284087
(22614920 to
25723221)
295.5
(275.2 to
313)
Female 413893
(393399 to
432693)
19.9
(18.8 to
20.8)
260816
(244563 to
275303)
12.9 (12
to 13.6)
5934541
(5614690 to
6295856)
276.8
(262 to
293.2)
926433
(831857 to
1011626)
21.2 (19
to 23.2)
491622
(437555 to
532378)
11.2 (10
to 12.2)
10324496
(9494907 to
11149967)
237.9
(218.7 to
257.1)
Male 428206
(413478 to
444287)
25.2
(24.2 to
26.1)
257310
(246262 to
271018)
16.2
(15.4 to
16.9)
6473606
(6165745 to
6879920)
346.6
(330.9 to
366.7)
1239735
(1133166 to
1359150)
33.1
(30.2 to
36.2)
594176
(550959 to
638031)
16.6
(15.4 to
17.9)
13959591
(12895721 to
15045718)
360.1
(333.1 to
387.8)
Data in parentheses are 95% uncertainty intervals.
Abbreviation: DALYs = disability-adjusted life years.
https://doi.org/10.1371/journal.pone.0263403.t001
PLOS ONE QCI for colorectal cancer
PLOS ONE | https://doi.org/10.1371/journal.pone.0263403 April 21, 2022 5 / 15

In 1990, Eritrea and the United States of America with QCI values of 0.9 and 87.3 had the
lowest and highest quality of care among both sexes, respectively (Fig 2 and S4 Table). In 2019,
Japan (98.2), Australia (97.8), and Canada (97.5) had the greatest quality of care in the world,
while the Central African Republic (4.6), Somalia (7.3), and South Sudan (9.6) had the lowest
QCI values (Fig 2 and S4 Table). By sex, Japan (87.8) and Eritrea (0.0) had the highest and low-
est QCI values in males and Switzerland (89.5) and Afghanistan (0.3) had the highest and low-
est QCI in females in 1990, respectively (S5 Table and S1 Fig). In 2019, the highest quality of
care for males was in Japan (98.7) and Canada (97.7), whereas the Central African Republic
(5.2) and Somalia (8.9) had the lowest quality of care. For females, Switzerland (99.1) and Aus-
tralia (97.7) had the highest, while Afghanistan (5.3) and the Central African Republic (6.3)
had the lowest QCI values in 2019 (S5 Table and S2 Fig).
Gender and age disparity
The GDR values were 1.0 in 1990 and 2019 worldwide. In 2019, all WHO regions had GDR
equal to one other than the Eastern Mediterranean Region and African Region. Also, Eastern
Mediterranean Region had the lowest GDR in 1990 and 2019 (0.6 and 0.7 in 1990 and 2019,
respectively) (S5 Table). Globally, the GDR had the highest values in 10–14 years old and was
Fig 1. The quality of care index (QCI) of colorectal cancer in both sexes by age and socio-demographic index (SDI) quintiles, 2019.
https://doi.org/10.1371/journal.pone.0263403.g001
PLOS ONE QCI for colorectal cancer
PLOS ONE | https://doi.org/10.1371/journal.pone.0263403 April 21, 2022 6 / 15

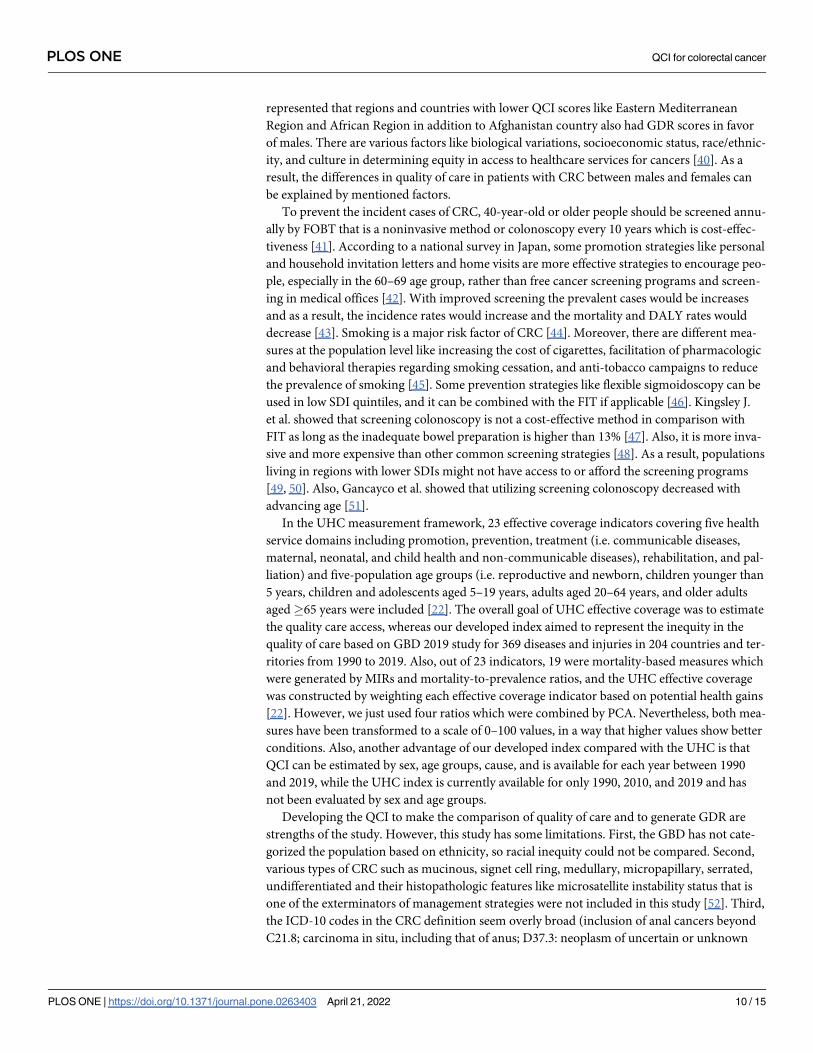
higher than one up to 20 years old, while it had the lowest value in 25–29 age group and was
lower than one then after, which represented a better quality of care for males in 2019 (Fig 3).
The GDR values in high and high-middle SDI quintiles were 1.0 in 1990 and 2019. Middle
and low SDI quintiles had a GDR of 0.9 in 1990 and 1.0 in 2019. The low-middle SDI quintile
had GDR values of 0.9 in both 1990 and 2019. The GDR in low and middle SDI quintiles
increased from 0.9 to 1.0 from 1990 to 2019 (S5 Table). The age trend of GDR among SDI
quintiles in 2019 was almost similar to the global trend except for the low SDI quintile that
peaked at 35–39 years old and had the lowest values in 55–59 age group and low-middle SDI
that the lowest GDR values were noted in 50–54 years old (Fig 3).
In 1990, Central African Republic (2.5), Equatorial Guinea (2.1), and Burundi (1.4) had the
highest GDR values, however, Afghanistan (0.0), Saudi Arabia (0.2), Yemen (0.5), and Sudan
(0.5) had the lowest values (Fig 4 and S5 Table). In 2019, the Central African Republic (1.2), Rus-
sian Federation (1.2), and Ukraine (1.2) had the highest, while Afghanistan (0.3), Yemen (0.6),
Morocco (0.6), Sudan (0.6), and Egypt (0.6) had the lowest GDR values (Fig 4 and S5 Table).
Discussion
In the QCI estimation for different causes, we provided the quality of care for CRC in the pres-
ent study. Previous works provided QCI for hematologic malignancies, thyroid cancer,
Fig 2. The quality of care index (QCI) of colorectal cancer in both sexes by country in 1990 and 2019. Contains information from OpenStreetMap and
OpenStreetMap Foundation, which is made available under the Open Database License.
https://doi.org/10.1371/journal.pone.0263403.g002
PLOS ONE QCI for colorectal cancer
PLOS ONE | https://doi.org/10.1371/journal.pone.0263403 April 21, 2022 7 / 15
pancreatic cancer, brain and other central nervous system cancers, and ischemic heart disease
[27–31]. Findings of our developed index showed that the QCI values have increased within
the last three decades. However, there is still a major gap between high and low SDI quintiles.
Also, the quality of care in African and South-East Asia Regions was at the lowest levels and
there was still gender inequity in some WHO regions, especially in Eastern Mediterranean
Region. The global trend of QCI in most age groups was almost increased for up to the age of
75, and it had a high level of inequities in different SDI quintiles. Comparing the gender ineq-
uity showed that the global GDR for above 20-year-old individuals was in favor of males.
The reduction in QCI values was initiated in individuals below 70 years old in all SDI quin-
tiles except for the high SDI quintile which started in individuals 75 years old. This finding
might be due to the recommended screening strategies by the United States Preventive Service
Task Force (USPSTF). The USPSTF recommends screening strategies like fecal occult blood
test (FOBT) and total colonoscopy for up to 75-year-old individuals and it does not recom-
mend for 85 or older people, so it might explain the reason of the decreasing QCI scores in
older age groups [32]. Moreover, in some other high SDI countries like Germany, Switzerland,
Norway, Sweden, Canada, and the Netherlands, the screening interventions, especially fecal
immunochemical test (FIT) are recommended for people between 50 and 75 years old [33].
The mentioned reduction was steeper in middle and high-middle SDI quintiles. The
Fig 3. The gender disparity ratio (GDR) of colorectal cancer in both sexes by age and socio-demographic index (SDI) quintiles, 2019.
https://doi.org/10.1371/journal.pone.0263403.g003
PLOS ONE QCI for colorectal cancer
PLOS ONE | https://doi.org/10.1371/journal.pone.0263403 April 21, 2022 8 / 15

prevention strategies implemented in Japan, the first rank of QCI, was immunochemical-
FOBT in individuals aged 40 years old [34]. As the incidence rate of CRC in high SDI countries
is higher, the screening programs and diagnostic and treatment methods are more accessible.
Therefore, the QCI values were higher than the values in the low SDI quintile [35, 36].
A cross-sectional study conducted in five Spanish regions aimed to investigate the age dispari-
ties in presentations, diagnosis, and treatment strategies for patients with CRC in<65, 65–79,
and�80 years old age groups, showed prominent differences in help-seeking behaviors and
treatment characteristics between the age groups, while no variation was revealed in primary
and secondary healthcare investigations [37]. In this regard, a study by Serra-Rexach et al. on
503 patients with CRC divided into two groups, young group and older group (�75 years old),
showed that young patients were more likely to receive surgery (P-value = 0.005), radiotherapy
(P-value = 0.0001), and chemotherapy (P-value = 0.001), while older individuals received higher
levels of palliative cares (P-value = 0.004). Also, tumor-specific mortality rate of young group
was lower (hazard ratio (HR) = 0.66; 95% confidence interval (CI): 0.45–0.97) [38]. Our results
also showed a slight decrease in QCI values from the age of 75 which might be due to the under-
treatment in this age group according to the previously mentioned studies.
A prospective cohort study on 403 patients with CRC showed that males had an increased
probability of readmission to hospitals than females (HR = 1.52; 95% CI: 1.17–1.96) [39]. We
Fig 4. The gender disparity ratio (GDR) of colorectal cancer in both sexes by country in 1990 and 2019. Contains information from OpenStreetMap and
OpenStreetMap Foundation, which is made available under the Open Database License.
https://doi.org/10.1371/journal.pone.0263403.g004
PLOS ONE QCI for colorectal cancer
PLOS ONE | https://doi.org/10.1371/journal.pone.0263403 April 21, 2022 9 / 15
represented that regions and countries with lower QCI scores like Eastern Mediterranean
Region and African Region in addition to Afghanistan country also had GDR scores in favor
of males. There are various factors like biological variations, socioeconomic status, race/ethnic-
ity, and culture in determining equity in access to healthcare services for cancers [40]. As a
result, the differences in quality of care in patients with CRC between males and females can
be explained by mentioned factors.
To prevent the incident cases of CRC, 40-year-old or older people should be screened annu-
ally by FOBT that is a noninvasive method or colonoscopy every 10 years which is cost-effec-
tiveness [41]. According to a national survey in Japan, some promotion strategies like personal
and household invitation letters and home visits are more effective strategies to encourage peo-
ple, especially in the 60–69 age group, rather than free cancer screening programs and screen-
ing in medical offices [42]. With improved screening the prevalent cases would be increases
and as a result, the incidence rates would increase and the mortality and DALY rates would
decrease [43]. Smoking is a major risk factor of CRC [44]. Moreover, there are different mea-
sures at the population level like increasing the cost of cigarettes, facilitation of pharmacologic
and behavioral therapies regarding smoking cessation, and anti-tobacco campaigns to reduce
the prevalence of smoking [45]. Some prevention strategies like flexible sigmoidoscopy can be
used in low SDI quintiles, and it can be combined with the FIT if applicable [46]. Kingsley J.
et al. showed that screening colonoscopy is not a cost-effective method in comparison with
FIT as long as the inadequate bowel preparation is higher than 13% [47]. Also, it is more inva-
sive and more expensive than other common screening strategies [48]. As a result, populations
living in regions with lower SDIs might not have access to or afford the screening programs
[49, 50]. Also, Gancayco et al. showed that utilizing screening colonoscopy decreased with
advancing age [51].
In the UHC measurement framework, 23 effective coverage indicators covering five health
service domains including promotion, prevention, treatment (i.e. communicable diseases,
maternal, neonatal, and child health and non-communicable diseases), rehabilitation, and pal-
liation) and five-population age groups (i.e. reproductive and newborn, children younger than
5 years, children and adolescents aged 5–19 years, adults aged 20–64 years, and older adults
aged�65 years were included [22]. The overall goal of UHC effective coverage was to estimate
the quality care access, whereas our developed index aimed to represent the inequity in the
quality of care based on GBD 2019 study for 369 diseases and injuries in 204 countries and ter-
ritories from 1990 to 2019. Also, out of 23 indicators, 19 were mortality-based measures which
were generated by MIRs and mortality-to-prevalence ratios, and the UHC effective coverage
was constructed by weighting each effective coverage indicator based on potential health gains
[22]. However, we just used four ratios which were combined by PCA. Nevertheless, both mea-
sures have been transformed to a scale of 0–100 values, in a way that higher values show better
conditions. Also, another advantage of our developed index compared with the UHC is that
QCI can be estimated by sex, age groups, cause, and is available for each year between 1990
and 2019, while the UHC index is currently available for only 1990, 2010, and 2019 and has
not been evaluated by sex and age groups.
Developing the QCI to make the comparison of quality of care and to generate GDR are
strengths of the study. However, this study has some limitations. First, the GBD has not cate-
gorized the population based on ethnicity, so racial inequity could not be compared. Second,
various types of CRC such as mucinous, signet cell ring, medullary, micropapillary, serrated,
undifferentiated and their histopathologic features like microsatellite instability status that is
one of the exterminators of management strategies were not included in this study [52]. Third,
the ICD-10 codes in the CRC definition seem overly broad (inclusion of anal cancers beyond
C21.8; carcinoma in situ, including that of anus; D37.3: neoplasm of uncertain or unknown
PLOS ONE QCI for colorectal cancer
PLOS ONE | https://doi.org/10.1371/journal.pone.0263403 April 21, 2022 10 / 15
behavior; and Z codes for healthcare exams), so it might lead to overestimation of the results.
It should be taken into consideration that most of the limitations were due to GBD methods
for data gathering and reporting, so we could not manipulate them. Despite these limitations,
the GBD study is one of the most comprehensive and up-to-date projects that meter and evalu-
ate the burden of diseases.
Conclusion
The ASIR trend of CRC despite its ASMR was increasing, which can represent that therapeutic
interventions regarding CRC have been more effective or more available than preventive mea-
sures. The low and low-middle SDI quintiles and African Region shall make efficient policies
to improve the quality of care, especially for women. Our findings on the interpretation of
QCI and GDR could be used by global, regional, and national health policymakers to prepare
equitable care for patients suffering from CRC worldwide. Further studies might be needed to
evaluate the implementation of this quality measure and to develop quality measurement sys-
tems to improve and effectively monitor cancer care.
Supporting information
S1 Table. The incidence, death, and disability-adjusted life years (DALYs) numbers and
age-standardized rates in socio-demographic index (SDI) quintile in males, females, and
both sexes in 1990 and 2019.
(DOCX)
S2 Table. The incidence, death, and disability-adjusted life years (DALYs) numbers and
age-standardized rates in the World Health Organization Regions in males, females, and
both sexes in 1990 and 2019.
(DOCX)
S3 Table. The incidence, death, and disability-adjusted life years (DALYs) numbers and
age-standardized rates in 21 Global Burden of Disease (GBD) regions in males, females,
and both sexes in 1990 and 2019.
(DOCX)
S4 Table. Quality of care index (QCI) in the world, World Health Organization Regions,
socio-demographic index (SDI) quintiles, and countries in both sexes in 1990 and 2019.
(DOCX)
S5 Table. Gender disparity ratio (GDR) values in the world, World Health Organization
Regions, socio-demographic index (SDI) quintiles, and countries by sex in 1990 and 2019.
(DOCX)
S1 Fig. The quality of care index (QCI) of colorectal cancer in females and males by coun-
try in 1990.
(PDF)
S2 Fig. The quality of care index (QCI) of colorectal cancer in females and males by coun-
try in 2019.
(PDF)
S1 Appendix. Details of mathematical calculation of quality of care index.
(DOCX)
PLOS ONE QCI for colorectal cancer
PLOS ONE | https://doi.org/10.1371/journal.pone.0263403 April 21, 2022 11 / 15

Acknowledgments
The authors would like to acknowledge the Institute for Health Metrics and Evaluation for
providing the GBD data. Also, we appreciate staff members of the Non-communicable Dis-
eases Research Center (NCDRC) and Endocrinology and Metabolism Research Institute
(EMRI) at Tehran University of Medical Sciences, especially Sahar Saeedi Moghaddam and
Erfan Ghasemi for their kind technical supports.
Ethical statement
No individual data were reported in this paper and the information is based on aggregated
pre-existing online data (available on https://vizhub.healthdata.org/gbd-compare/).
The ethical committee of Endocrinology and Metabolism Research Institute of Tehran Uni-
versity of Medical Sciences has approved this study by the code IR.TUMS.EMRI.
REC.1400.017.
Author Contributions
Conceptualization: Esmaeil Mohammadi, Naser Ahmadi, Ameneh Kazemi, Ali H. Mokdad,
Bagher Larijani, Farshad Farzadfar.
Data curation: Shahin Roshani, Moein Yoosefi, Negar Rezaei, Zahra Esfahani, Sina Azadnaja-
fabad, Naser Ahmadi, Sarvenaz Shahin, Alireza Namazi Shabestari, Ardeshir Khosravi, Ali
H. Mokdad.
Formal analysis: Seyed Aria Nejadghaderi, Shahin Roshani, Moein Yoosefi, Negar Rezaei,
Alireza Namazi Shabestari.
Investigation: Seyed Aria Nejadghaderi, Esmaeil Mohammadi, Negar Rezaei, Zahra Esfahani,
Alireza Namazi Shabestari, Ardeshir Khosravi, Ali H. Mokdad, Bagher Larijani.
Methodology: Seyed Aria Nejadghaderi, Bagher Larijani, Farshad Farzadfar.
Supervision: Farshad Farzadfar.
Validation: Sina Azadnajafabad, Naser Ahmadi, Sarvenaz Shahin, Ameneh Kazemi.
Visualization: Shahin Roshani.
Writing – original draft: Seyed Aria Nejadghaderi, Shahin Roshani.
Writing – review & editing: Seyed Aria Nejadghaderi, Esmaeil Mohammadi, Moein Yoosefi,
Negar Rezaei, Sina Azadnajafabad, Naser Ahmadi, Sarvenaz Shahin, Ameneh Kazemi, Alir-
eza Namazi Shabestari, Ardeshir Khosravi, Ali H. Mokdad, Bagher Larijani, Farshad
Farzadfar.
References1. Sung H, Ferlay J, Siegel RL, Laversanne M, Soerjomataram I, Jemal A, et al. Global cancer statistics
2020: GLOBOCAN estimates of incidence and mortality worldwide for 36 cancers in 185 countries. CA:
A Cancer Journal for Clinicians. 2021;n/a(n/a).
2. Institute for Health Metrics and Evaluation (IHME). GBD Compare. Seattle, WA: IHME, University of
Washington, 2015. Available from http://vizhub.healthdata.org/gbd-compare. (Accessed 28 September
2021).
3. Doshmangir L, Bazyar M, Rashidian A, Gordeev VS. Iran health insurance system in transition: equity
concerns and steps to achieve universal health coverage. International Journal for Equity in Health.
2021; 20(1):1–14. https://doi.org/10.1186/s12939-020-01327-9 PMID: 33386078
4. What is Quality of Care and why is it important? Geneva: World Health Organization; [Available from:
https://www.who.int/maternal_child_adolescent/topics/quality-of-care/definition.
PLOS ONE QCI for colorectal cancer
PLOS ONE | https://doi.org/10.1371/journal.pone.0263403 April 21, 2022 12 / 15
5. Delivering quality health services: a global imperative for universal health coverage. Geneva: World
Health Organization, Organisation for Economic Co-operation and Development, and The World Bank;
2018. Licence: CC BY-NC-SA 3.0 IGO.
6. Kim S-E, Paik HY, Yoon H, Lee JE, Kim N, Sung M-K. Sex- and gender-specific disparities in colorectal
cancer risk. World J Gastroenterol. 2015; 21(17):5167–75. https://doi.org/10.3748/wjg.v21.i17.5167
PMID: 25954090
7. Daniel CL, Gilreath K, Keyes D. Colorectal cancer disparities beyond biology: Screening, treatment,
access. Frontiers in bioscience (Landmark edition). 2017; 22:465–78.
8. Carethers JM, Doubeni CA. Causes of Socioeconomic Disparities in Colorectal Cancer and Intervention
Framework and Strategies. Gastroenterology. 2020; 158(2):354–67. https://doi.org/10.1053/j.gastro.
2019.10.029 PMID: 31682851
9. Global Health Observatory data Geneva: World Health Organization; [Available from: http://www.who.
int/gho.
10. DataBank: Service Delivery Indicators Washington (DC): World Bank; [Available from: https://
databank.worldbank.org.
11. Wagstaff A, van Doorslaer E, Paci P. On the measurement of horizontal inequity in the delivery of health
care. Journal of Health Economics. 1991; 10(2):169–205. https://doi.org/10.1016/0167-6296(91)
90003-6 PMID: 10113709
12. Koolman X, van Doorslaer E. On the interpretation of a concentration index of inequality. Health Eco-
nomics. 2004; 13(7):649–56. https://doi.org/10.1002/hec.884 PMID: 15259044
13. Vos T, Lim SS, Abbafati C, Abbas KM, Abbasi M, Abbasifard M, et al. Global burden of 369 diseases
and injuries in 204 countries and territories, 1990–2019: a systematic analysis for the Global Burden of
Disease Study 2019. The Lancet. 2020; 396(10258):1204–22. https://doi.org/10.1016/S0140-6736(20)
30925-9 PMID: 33069326
14. Murray CJL, Aravkin AY, Zheng P, Abbafati C, Abbas KM, Abbasi-Kangevari M, et al. Global burden of
87 risk factors in 204 countries and territories, 1990–2019: a systematic analysis for the Global Burden
of Disease Study 2019. The Lancet. 2020; 396(10258):1223–49. https://doi.org/10.1016/S0140-6736
(20)30752-2 PMID: 33069327
15. Wang H, Abbas KM, Abbasifard M, Abbasi-Kangevari M, Abbastabar H, Abd-Allah F, et al. Global age-
sex-specific fertility, mortality, healthy life expectancy (HALE), and population estimates in 204 coun-
tries and territories, 1950–2019: a comprehensive demographic analysis for the Global Burden of Dis-
ease Study 2019. The Lancet. 2020; 396(10258):1160–203. https://doi.org/10.1016/S0140-6736(20)
30977-6 PMID: 33069325
16. Stevens GA, Alkema L, Black RE, Boerma JT, Collins GS, Ezzati M, et al. Guidelines for Accurate and
Transparent Health Estimates Reporting: the GATHER statement. The Lancet. 2016; 388(10062):e19–
e23.
17. World Health Organization (WHO). ICD-10 Version:2019 2019 [Available from: https://icd.who.int/
browse10/2019/en.
18. Global Burden of Disease Collaborative Network. Institute for Health Metrics and Evaluation (IHME).
Global Burden of Disease Study 2019 (GBD 2019) Cause List Mapped to ICD Codes. 2020 [Available
from: http://ghdx.healthdata.org/record/ihme-data/gbd-2019-cause-icd-code-mappings.
19. Global Burden of Disease Cancer C. Global, Regional, and National Cancer Incidence, Mortality, Years
of Life Lost, Years Lived With Disability, and Disability-Adjusted Life-Years for 29 Cancer Groups, 1990
to 2017: A Systematic Analysis for the Global Burden of Disease Study. JAMA Oncology. 2019.
20. Mohammadi E, Ghasemi E, Moghaddam SS, Yoosefi M, Ghanbari A, Ahmadi N, et al. Quality of Care
Index (QCI) 2020 [updated 2020]. Available from: https://dx.doi.org/10.17504/protocols.io.bprjmm4n.
21. Rencher AC. Methods of Multivariate Analysis: Wiley; 2002.
22. Lozano R, Fullman N, Mumford JE, Knight M, Barthelemy CM, Abbafati C, et al. Measuring universal
health coverage based on an index of effective coverage of health services in 204 countries and territo-
ries, 1990–2019: a systematic analysis for the Global Burden of Disease Study 2019. The Lancet.
2020; 396(10258):1250–84.
23. Institute for Health Metrics and Evaluation (IHME). GBD Compare 2019 [Available from: https://vizhub.
healthdata.org/gbd-compare.
24. Global, regional, and national life expectancy, all-cause mortality, and cause-specific mortality for 249
causes of death, 1980–2015: a systematic analysis for the Global Burden of Disease Study 2015. Lan-
cet (London, England). 2016; 388(10053):1459–544.
25. Population GBD, Fertility C. Population and fertility by age and sex for 195 countries and territories,
1950–2017: a systematic analysis for the Global Burden of Disease Study 2017. Lancet (London,
PLOS ONE QCI for colorectal cancer
PLOS ONE | https://doi.org/10.1371/journal.pone.0263403 April 21, 2022 13 / 15

England). 2018; 392(10159):1995–2051. https://doi.org/10.1016/S0140-6736(18)32278-5 PMID:
30496106
26. GBD 2017 Risk Factor Collaborators. Global, regional, and national comparative risk assessment of 84
behavioural, environmental and occupational, and metabolic risks or clusters of risks for 195 countries
and territories, 1990–2017: a systematic analysis for the Global Burden of Disease Study 2017. Lancet
(London, England). 2018; 392(10159):1923–94. https://doi.org/10.1016/S0140-6736(18)32225-6
PMID: 30496105
27. Keykhaei M, Masinaei M, Mohammadi E, Azadnajafabad S, Rezaei N, Saeedi Moghaddam S, et al. A
global, regional, and national survey on burden and Quality of Care Index (QCI) of hematologic malig-
nancies; global burden of disease systematic analysis 1990–2017. Experimental Hematology & Oncol-
ogy. 2021; 10(1):11.
28. Aryannejad A, Tabary M, Ebrahimi N, Mohammadi E, Fattahi N, Roshani S, et al. Global, regional, and
national survey on the burden and quality of care of pancreatic cancer: a systematic analysis for the
Global Burden of Disease study 1990–2017. Pancreatology. 2021.
29. Mohammadi E, Ghasemi E, Azadnajafabad S, Rezaei N, Saeedi Moghaddam S, Ebrahimi Meimand S,
et al. A global, regional, and national survey on burden and Quality of Care Index (QCI) of brain and
other central nervous system cancers; global burden of disease systematic analysis 1990–2017. PloS
one. 2021; 16(2):e0247120. https://doi.org/10.1371/journal.pone.0247120 PMID: 33617563
30. Azadnajafabad S, Saeedi Moghaddam S, Mohammadi E, Rezaei N, Ghasemi E, Fattahi N, et al.
Global, regional, and national burden and quality of care index (QCI) of thyroid cancer: A systematic
analysis of the Global Burden of Disease Study 1990–2017. Cancer Medicine. 2021; 10(7):2496–508.
https://doi.org/10.1002/cam4.3823 PMID: 33665966
31. Aminorroaya A, Yoosefi M, Rezaei N, Shabani M, Mohammadi E, Fattahi N, et al. Global, regional, and
national quality of care of ischaemic heart disease from 1990 to 2017: a systematic analysis for the
Global Burden of Disease Study 2017. European Journal of Preventive Cardiology. 2021.
32. Force USPST. Screening for Colorectal Cancer: US Preventive Services Task Force Recommendation
Statement. JAMA. 2016; 315(23):2564–75. https://doi.org/10.1001/jama.2016.5989 PMID: 27304597
33. Ebell MH, Thai TN, Royalty KJ. Cancer screening recommendations: an international comparison of
high income countries. Public health reviews. 2018; 39:7. https://doi.org/10.1186/s40985-018-0080-0
PMID: 29507820
34. Sano Y, Byeon J-S, Li X-B, Wong MCS, Chiu H-M, Rerknimitr R, et al. Colorectal cancer screening of
the general population in East Asia. Digestive Endoscopy. 2016; 28(3):243–9. https://doi.org/10.1111/
den.12579 PMID: 26595883
35. Fullman N, Yearwood J, Abay SM, Abbafati C, Abd-Allah F, Abdela J, et al. Measuring performance on
the Healthcare Access and Quality Index for 195 countries and territories and selected subnational loca-
tions: a systematic analysis from the Global Burden of Disease Study 2016. The Lancet. 2018; 391
(10136):2236–71. https://doi.org/10.1016/S0140-6736(18)30994-2 PMID: 29893224
36. Safiri S, Sepanlou SG, Ikuta KS, Bisignano C, Salimzadeh H, Delavari A, et al. The global, regional, and
national burden of colorectal cancer and its attributable risk factors in 195 countries and territories,
1990–2017: a systematic analysis for the Global Burden of Disease Study 2017. The Lancet Gastroen-
terology & Hepatology. 2019; 4(12):913–33.
37. Esteva M, Ruiz A, Ramos M, Casamitjana M, Sanchez-Calavera MA, Gonzalez-Lujan L, et al. Age dif-
ferences in presentation, diagnosis pathway and management of colorectal cancer. Cancer Epidemiol-
ogy. 2014; 38(4):346–53. https://doi.org/10.1016/j.canep.2014.05.002 PMID: 24912967
38. Serra-Rexach JA, Jimenez AB, Garcıa-Alhambra MA, Pla R, Vidan M, Rodrıguez P, et al. Differences
in the Therapeutic Approach to Colorectal Cancer in Young and Elderly Patients. The Oncologist. 2012;
17(10):1277–85. https://doi.org/10.1634/theoncologist.2012-0060 PMID: 22923453
39. Gonzalez JR, Fernandez E, Moreno V, Ribes J, Peris M, Navarro M, et al. Sex differences in hospital
readmission among colorectal cancer patients. Journal of Epidemiology and Community Health. 2005;
59(6):506. https://doi.org/10.1136/jech.2004.028902 PMID: 15911648
40. Kagawa-Singer M, Valdez Dadia A, Yu MC, Surbone A. Cancer, Culture, and Health Disparities: Time
to Chart a New Course? CA: A Cancer Journal for Clinicians. 2010; 60(1):12–39.
41. Melnitchouk N, Soeteman DI, Davids JS, Fields A, Cohen J, Noubary F, et al. Cost-effectiveness of
colorectal cancer screening in Ukraine. Cost effectiveness and resource allocation: C/E. 2018; 16:20.
https://doi.org/10.1186/s12962-018-0104-0 PMID: 29977160
42. Hamashima C, Sano H. Association between age factors and strategies for promoting participation in
gastric and colorectal cancer screenings. BMC Cancer. 2018; 18(1):345. https://doi.org/10.1186/
s12885-018-4244-6 PMID: 29587681
PLOS ONE QCI for colorectal cancer
PLOS ONE | https://doi.org/10.1371/journal.pone.0263403 April 21, 2022 14 / 15

43. Araghi M, Soerjomataram I, Jenkins M, Brierley J, Morris E, Bray F, et al. Global trends in colorectal
cancer mortality: projections to the year 2035. International Journal of Cancer. 2019; 144(12):2992–
3000. https://doi.org/10.1002/ijc.32055 PMID: 30536395
44. Johnson CM, Wei C, Ensor JE, Smolenski DJ, Amos CI, Levin B, et al. Meta-analyses of colorectal can-
cer risk factors. Cancer Causes & Control. 2013; 24(6):1207–22. https://doi.org/10.1007/s10552-013-
0201-5 PMID: 23563998
45. West R. Tobacco smoking: Health impact, prevalence, correlates and interventions. Psychology &
Health. 2017; 32(8):1018–36.
46. Holme O, Loberg M, Kalager M, Bretthauer M, Hernan MA, Aas E, et al. Long-Term Effectiveness of
Sigmoidoscopy Screening on Colorectal Cancer Incidence and Mortality in Women and Men: A Ran-
domized Trial. Annals of internal medicine. 2018; 168(11):775–82. https://doi.org/10.7326/M17-1441
PMID: 29710125
47. Kingsley J, Karanth S, Revere FL, Agrawal D. Cost Effectiveness of Screening Colonoscopy Depends
on Adequate Bowel Preparation Rates—A Modeling Study. PloS one. 2016; 11(12):e0167452. https://
doi.org/10.1371/journal.pone.0167452 PMID: 27936028
48. Larsen S, Kalloo A, Hutfless S. The hidden cost of colonoscopy including cost of reprocessing and infec-
tion rate: the implications for disposable colonoscopes. Gut. 2019:gutjnl-2019-319108. https://doi.org/
10.1136/gutjnl-2019-319108 PMID: 31413166
49. Wee LE, Koh GC-H, Chin RT, Yeo WX, Seow B, Chua D. Socioeconomic factors affecting colorectal,
breast and cervical cancer screening in an Asian urban low-income setting at baseline and post-inter-
vention. Preventive Medicine. 2012; 55(1):61–7. https://doi.org/10.1016/j.ypmed.2012.04.011 PMID:
22561028
50. Yager SS, Chen L, Cheung WY. Sex-based Disparities in Colorectal Cancer Screening. American Jour-
nal of Clinical Oncology. 2014; 37(6). https://doi.org/10.1097/COC.0b013e318282a830 PMID:
23466582
51. Gancayco J, Soulos PR, Khiani V, Cramer LD, Ross JS, Genao I, et al. Age-based and Sex-based Dis-
parities in Screening Colonoscopy Use Among Medicare Beneficiaries. Journal of Clinical Gastroenter-
ology. 2013; 47(7). https://doi.org/10.1097/MCG.0b013e31828345c8 PMID: 23619827
52. Fleming M, Ravula S, Tatishchev SF, Wang HL. Colorectal carcinoma: Pathologic aspects. J Gastroint-
est Oncol. 2012; 3(3):153–73. https://doi.org/10.3978/j.issn.2078-6891.2012.030 PMID: 22943008
PLOS ONE QCI for colorectal cancer
PLOS ONE | https://doi.org/10.1371/journal.pone.0263403 April 21, 2022 15 / 15