Social Exclusion: Residential Segregation in Bolivian Cities
31
Inter-American Development Bank Banco Interamericano de Desarrollo Latin American Research Network Red de Centros de Investigación Research Network Working paper #R-440 Social Exclusion: Residential Segregation in Social Exclusion: Residential Segregation in Social Exclusion: Residential Segregation in Social Exclusion: Residential Segregation in Bolivian Cities Bolivian Cities Bolivian Cities Bolivian Cities by George Gray Molina Ernesto Pérez de Rada Wilson Jiménez Fundación Fundación Fundación Fundación Diálogo Diálogo Diálogo Diálogo January 2002
-
Upload
independent -
Category
Documents
-
view
1 -
download
0
Transcript of Social Exclusion: Residential Segregation in Bolivian Cities

Inter-American Development BankBanco Interamericano de Desarrollo
Latin American Research NetworkRed de Centros de Investigación
Research Network Working paper #R-440
Social Exclusion: Residential Segregation in Social Exclusion: Residential Segregation in Social Exclusion: Residential Segregation in Social Exclusion: Residential Segregation inBolivian CitiesBolivian CitiesBolivian CitiesBolivian Cities
by
George Gray MolinaErnesto Pérez de Rada
Wilson Jiménez
Fundación Fundación Fundación Fundación DiálogoDiálogoDiálogoDiálogo
January 2002

2
Cataloging-in-Publication data provided by theInter-American Development BankFelipe Herrera Library
Gray Molina, George.
Social exclusion : residential segregation in Bolivian cities / by George Gray Molina,Ernesto Pérez de Rada, Wilson Jiménez.
p. cm. (Research Network working papers ; R-440) Includes bibliographical references.
1. Marginality, Social--Bolivia. 2. Segregation in education--Bolivia. 3. Discriminationin housing--Bolivia. I. Pérez de Rada, Ernesto. II. Jiménez, W. (Wilson). III. Inter-American Development Bank. Research Dept. IV. Latin American Research Network.V. Title. VI. Series.
305.56 G482--dc21
�2002Inter-American Development Bank1300 New York Avenue, N.W.Washington, D.C. 20577
The views and interpretations in this document are those of the authors and should not beattributed to the Inter-American Development Bank, or to any individual acting on itsbehalf.
The Research Department (RES) produces the Latin American Economic PoliciesNewsletter, as well as working papers and books, on diverse economic issues. To obtain acomplete list of RES publications, and read or download them please visit our web site at:http://www.iadb.org/res

3
Abstract∗∗∗∗
This study analyzes the impact of ethnic-based residential segregation on income and
education outcomes in Bolivian cities. Three results stand out in the analysis. First, we
find significant and negative segregation effects on income generation in both across-city
and intra-city comparisons. Second, we find individual and neighborhood-level
interactions between ethnicity and segregation to be significantly and negatively
correlated with income and schooling attainment. Finally, we find positive social capital
effects for recent migrants and young workers and negative human capital effects for
non-migrants and older workers. We attempt to control for selection biases with three
instruments for residential segregation. We also include potential intergenerational
determinants of income and schooling through expanded measures of parental human and
social capital.
Key words: Exclusion, segregation, poverty, income, schooling.
∗ The authors would like to thank the Fundación Diálogo and Maestrías para el Desarrollo, UniversidadCatólica Boliviana for their support.
4
Contents
1. Introduction……………………………………………………………. 5
2. Analytical Framework……………………………………………….… 6
Basic Model……….………………………………..…………. 7
Addressing Self-Selection Bias….…………………..………… 8
Controlling for Omitted Variables…….………………………… 8
Controlling for Geographic Mobility…………………………… 8
Key Hypotheses…………………………………………………. 8
3. Residential Segregation in Ten Cities……………………………..……. 12
Data (MECOVI 1999)…………………………………………… 12
Results……………………………………………………..…….. 13
Hypothesis Testing……………………………………………… 15
4. Residential Segregation in La Paz and El Alto……………...…………….16
Data ……………..……………………………………………… 16
Measures of Intra-City Segregation……………………………… 16
Income Outcomes……………………………………………… 17
Education Outcomes…………………………………………… 19
Hypothesis Testing……..………………………………………. 20
5. Research and PolicyImplications…………………………………………………………….… 22
References……………………………………………………………….. 25
Annexes…………………………………………………………………. 28

5
1. Introduction
Rapid demographic growth and urbanization are changing Bolivia’s poverty profile.
Between 1992 and 2000, an estimated 1.7 million people moved from rural to urban
areas, causing the number of poor households living in urban areas to exceed that in rural
areas.1 A side-effect of rapid urbanization, often neglected by current research on
poverty in Bolivia, is a measurable increase in residential segregation by income,
ethnicity and other social and cultural identifiers.2 Neighborhoods that link first and
second-generation migrants though economic as well as cultural ties also increase
pressure on available labor markets, housing, and other public services.
Qualitative evidence on rural-to-urban migration in La Paz and El Alto suggests
that, like middle-class residential segregation, much of the new segregation is self-
selected (see Albó, 1998; Sandóval 1996). Migrants seek out neighborhoods and social
networks established by relatives and peers. Established networks are then used to get a
foothold in formal and informal labor markets. Although qualitative studies largely skirt
identification issues, they do raise concerns regarding current analyses of urban poverty
in Bolivia. By describing the social context of demographic change, they point to
neighborhood effects, both positive and negative, on income generation, labor and
educational achievement. Beyond the disadvantages of interpersonal discrimination,
residential segregation poses a secondary tier of potential social exclusion.
This study attempts to measure the impact of residential segregation on the
opportunities and resources of the poor. We focus on three questions. First, we consider
the across-city effects of residential segregation on an array of outcomes using a
nationally representative MECOVI 1999 household survey. We proxy residential
segregation with alternative measures of residential sorting, measuring the ratio of
indigenous residents in each neighborhood to the overall proportion of indigenous
residents in a given city. Second, we consider the impact of intra-city residential
segregation on income and educational attainment, using a new survey covering 800
households and 43 neighborhoods of La Paz and El Alto. In both cases, we address
1 See UDAPE (2000) and INE (2000).2 Recent studies of urban poverty based on household surveys include Jiménez and Yañez (1997); Pérez deRada (1997); Fields et al. (1997); Vos, Lee and Mejía (1998) and Gray-Molina, Jiménez, Pérez de Radaand Yañez (1999).
6
potential self-selection problems by instrumenting for segregation with historical,
demographic and geographic proxies. We also address potential omitted variable biases
by including intergenerational controls on paternal migration, human and social capital.
Third, we consider mechanisms that might explain the effects of residential
segregation on selected outcomes. In theory, residential segregation could have a positive
or negative effect on an array of outcomes. We posit positive social capital effects related
to extended access to informal labor and credit markets, and negative human capital and
labor market effects, accruing from intergenerational and public goods externalities in
segregated neighborhoods. The recent literature on neighborhood and peer group effects
considers an array of hypotheses concerning the analysis of urban decline and renewal in
the United States (Case and Katz, 1991; Borjas, 1995; Cutler and Glaeser, 1997; Glaeser,
Kahn and Rappaport, 2000; Borjas, 1997). We select key hypotheses from the literature
and add additional questions that might be relevant to the analysis of residential
segregation in Latin America.
Finally, we consider the policy and research implications of residential
segregation. On the research side, we hope to provide an accurate measurement of the
effects and dynamics of residential segregation that corrects for biases emerging from
omitted variables and self-selection. Such a focus aims to make an original contribution
to the Bolivian literature on poverty and exclusion, complementing studies of segregation
conducted from a sociological and anthropological perspective. On the policy side we
hope to provide a policy handle to the assessment of urban poverty and exclusion. While
ethnic and class segregation are likely to affect multiple channels of access to economic
resources and opportunities, residential segregation might be particularly amenable to
policy intervention through urban development, planning and schooling policies.
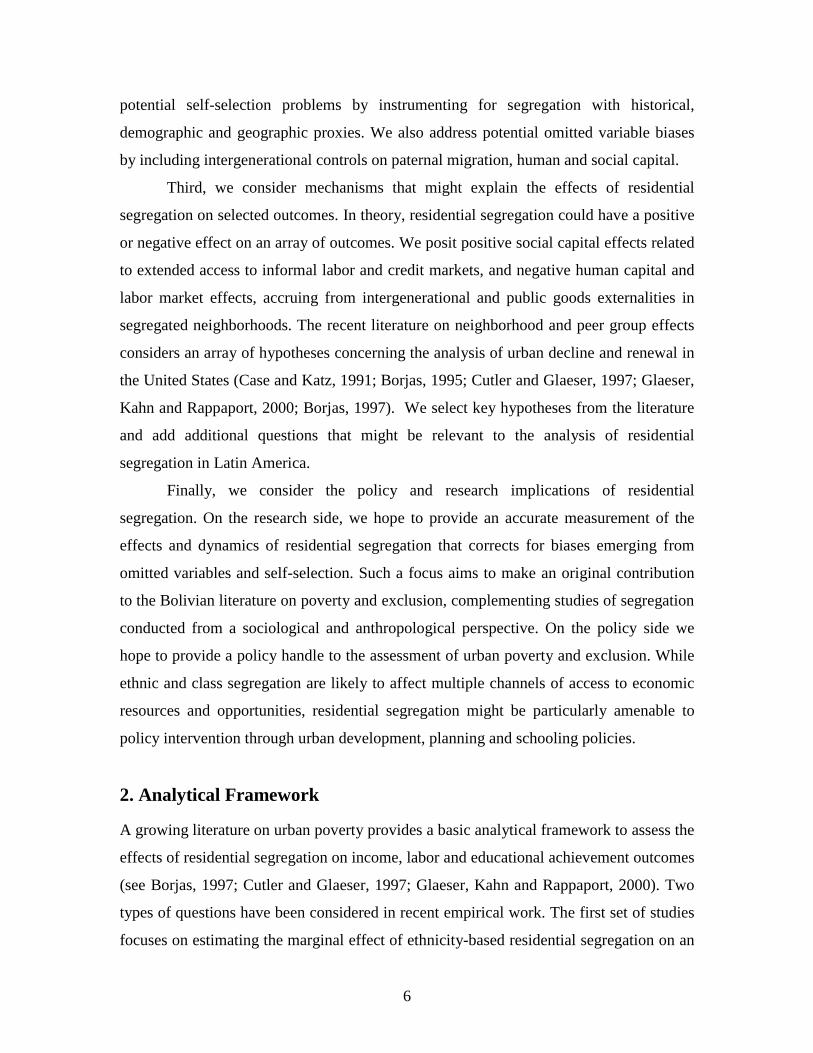
2. Analytical Framework
A growing literature on urban poverty provides a basic analytical framework to assess the
effects of residential segregation on income, labor and educational achievement outcomes
(see Borjas, 1997; Cutler and Glaeser, 1997; Glaeser, Kahn and Rappaport, 2000). Two
types of questions have been considered in recent empirical work. The first set of studies
focuses on estimating the marginal effect of ethnicity-based residential segregation on an

7
array of outcomes (see Holzer, 1991; Kain, 1992). Most studies use intra-city
comparisons that consider whether minorities living in predominantly minority
neighborhoods have worse outcomes than those who live in mixed neighborhoods. A
serious identification problem hinders intra-city comparisons. To the extent that residence
is self-selected, any direct measure of segregation is likely to be biased. Instruments
correlated with segregation but unrelated to outcomes are required to disentangle dual
causality.
The second question considered by recent work is whether outcomes for
minorities as a whole are better or worse in cities that are more racially segregated
compared with cities that are less segregated (Cutler and Glaeser, 1997; Glaeser, Kahn
and Rappaport, 2000). This approach avoids intra-city selection problems, but faces other
problems linked to the potential for reverse causality—where poor outcomes lead to
increased segregation—and the potential bias from sorting of more or less successful
minorities across a city. As with intra-city comparisons, across-city comparisons require
instruments to address selection problems. In this study we focus on both intra-city and
across-city comparisons of residential segregation by collecting new data that correct for
potential self-selection and omitted variable biases.
Basic Model
We begin with a spatial equilibrium model developed by Cutler and Glaeser (1997) to
analyze the effects of residential segregation across and within cities. The Cutler-Glaeser
model, adapted to the analysis of segregation in Bolivian cities takes the form:
(1) Outcome = X’β + β1 segregation + β2 segregation*indigenous + e
Where outcomes are measured at the individual level, X’β represents an array of
individual and household controls, and segregation is a neighborhood measure of the
separation of ethnic groups. The coefficient β1 measures the effect of segregation on non-
indigenous, and β2 is the differential effect for indigenous relative to non-indigenous.
We measure segregation at the level of census section tracts, contiguous groups of
households settled in an area equivalent to 8-10 city blocks. Indexing tracts by i, we
define residential segregation within a city as:

8
(2) Segregation = ½ � i=1|indigenousi /indigenous – nonindigenousi/nonindigenous|
Where indigenous i is the number of people speaking an indigenous language (Aymara,
Quechua or other) in tract i, and indigenous is the total number of indigenous-speaking
people in each city. If indigenous-speaking residents are evenly distributed throughout
metropolitan areas, the term in absolute value brackets will be zero for each census tract
and zero for the metropolitan area as a whole. If indigenous and non-indigenous speakers
never reside in the same census tract, the measure of residential segregation will be one.
This measure estimates the share of the indigenous population that would need to change
census tracks to even the spatial distribution of ethnic groups within a metropolitan area.
Addressing Self-Selection Bias
The Cutler-Glaeser model requires three adjustments to account for self-selection,
omitted variable bias and mobility across neighborhoods. The first adjustment concerns
self-selection bias. Residential segregation might be the result rather than the cause of
poor economic outcomes. In this case, successful indigenous-speaking residents will
choose to live in richer and non-indigenous neighborhoods, rather than settle randomly.
We propose to instrument for segregation with three sets of variables. The first
instrument uses historical data on residential settlements 25 years ago. While historical
segregation is likely to be partially correlated to income-based selection, we are
interested in testing whether pre-migration settlement patterns vary systematically from
post-migration settlements that today make up half of the population in capital cities. The
second instrument uses information on residential sorting before and after a drought-
induced migratory shock. The residential sorting of rural migrants from the 1982-1985
highland drought tends to be evenly distributed among high and low-income
neighborhoods. The third instrument uses historical figures for population density to
approximate geographic features that account for natural occurrences of segregation in
the cities of La Paz and El Alto—neighborhoods separated by geographic fault lines,
rivers and gorges.
9
Addressing Omitted Variable Bias
The second adjustment leads to a reformulated model controlling for omitted parental and
community characteristics correlated with segregation. In this case, the measure of
success for indigenous-speaking residents might overstate the effect of individual-level
characteristics. We propose to introduce questions on parental and community-level
human and social capital to avert this bias. Omitted variables that account for
intergenerational and peer advantages and disadvantages are likely to play a key role in
explaining proposed segregation effects.
Controlling for Geographic Mobility
A third adjustment concerns intra-city mobility. If we assume mobility, then even if
segregation does lead to poor outcomes, intra-city comparisons may not pick up the
negative effect. With intra-city mobility we expect outcomes for similar people to be the
same regardless of place of residence. One way to control for mobility is to contrast
young age cohorts, who presumably have not made their residential decision yet, with
older ones. Another is to control for migrant versus non-migrant households. We propose
to control for both age cohorts and migration in our intra-city analysis.
Key Hypotheses
In theory, residential segregation might lead to positive or negative effects on an array of
outcomes. Recent research on peer and neighborhood effects suggests that the
mechanisms that link segregation to outcomes might include human capital, social capital
and ethnic capital externalities. In this section we posit a set of positive- and negative-
effect hypotheses that might explain observed outcomes. We consider positive social
capital and political effects and negative human capital and public goods effects.
Positive Effects
Recent economic and sociological work on social capital (Glaeser, Laibson and
Sacerdote, 2000; Alesina and LaFerrara, 2000; Portes, 1998; Portes and Landolt, 2000),
is converging toward individual-based models of social capital formation. The new
approach contrasts with the earlier wave of group-based research led by James Coleman

10
(Coleman 1988; 1990) and Robert Putnam (Putnam 1993; Putnam 2000) which focused
on networks and communities. Two consequences of the shift are a more careful account
of causality and clearer linkages with household and individual decision-making models.
Among positive social capital effects, we identify three transmission mechanisms
that link residential segregation and individual-level outcomes. First, we posit positive
intergenerational effects accruing from parental social capital, in the form of expanded
social networks and access to an array of intergenerational “weak ties.” Parental social
capital is likely to be most valuable for second or third-generation migrants who have
cultivated a network of neighborhood and extra-neighborhood contacts. Labor, credit and
political ties are mobilized by neighborhood contacts.
Second we posit income and labor effects accruing from individual membership
in local groups, associations and networks. Personal membership captures unobserved
characteristics that proxy for mobility, thrift and outward-orientation. Not all membership
affiliations will be outward-looking however. We propose to discriminate between
outward and inward-riented groups to capture positive “weak tie” effects rather than
potentially negative “strong tie” effects. Sports, political and labor affiliations might
proxy outward-looking ties; ethnic, cultural and religious ties might proxy inward-
looking ties (see Gray-Molina, Jiménenz, Pérez de Rada and Yañez, 1999).
Third, we posit positive political effects through more effective neighborhood
voice. Segregated neighborhoods might initiate collective action easier than non-
segregated neighborhoods by mobilizing ethnic or cultural ties. Under decentralized
decision-making, neighborhood associations have a significant impact on public
investment and public services decisions (see Gray-Molina, 2000). Over the past five
years, annual participatory planning rounds have mobilized over 17,000 territorial
grassroots organizations, 1,200 of which are from the La Paz/El Alto Metropolitan area
alone. Although political effects might be indirect and lagged, we propose to include
them to account for neighborhood voice since 1995 (see Gray-Molina, Pérez de Rada and
Yañez, 1999a).
11
Negative Effects
The recent literature on urban poverty (Borjas, 1995; Borjas, 1997; Cutler and Glaeser,
1997; Glaeser, Kahn and Rappaport, 2000) suggests a number of negative effects through
peer or neighborhood interactions. Places of residence are important arenas for learning
valuable individual and social skills. Residential segregation tends to restrict the social
and labor interactions to restricted pools of human capital and public goods.
We identify two main negative transmission mechanisms. First, we posit negative
peer and intergenerational human capital effects from residential segregation. Human
capital endowments among poor and first or second-generation rural migrants are likely
to be significantly lower than in non-segregated neighborhoods. The spatial mismatch
between indigenous and non-indigenous neighborhoods hurts both present and future
outcomes through intergenerational effects. The aggregation of intergenerational effects
might also result in damaging externalities on individuals and households in segregated
areas. Recent research suggests a great deal of persistence of ethnic segregation (see
Borjas, 1997).
Second, we posit negative neighborhood-wide effects through public goods
externalities. Residential segregation is likely to hurt outcomes of the poor if the quality
of neighborhood-specific public goods, such as schools or health centers, varies along
segregated lines. Heterogeneous public goods and services will influence human capital
formation and reinforce peer and parental effects. We propose to use available school and
health district-level data on service performance to account for neighborhood differences.
Our hypotheses focus on individual, parental and neighborhood-wide mechanisms
for human capital and labor market exclusion. Alternative specifications of the rural
segregation measure and interactions with selected variables described above should
provide a reliable estimate of the effects of residential segregation on income, labor and
educational achievement outcomes. A shortcoming of our framework is that across-city
estimates are likely to omit key parental and community characteristics. Intra-city
comparisons will attempt to correct for these but will also fall short in capturing the
externality effects of ethnicity-based segregation in non-segregated areas. Segregation is
likely to hurt indigenous citizens regardless of their place of residence. We assume
observed and unobserved individual characteristics of indigenous residents in mixed

12
neighborhoods will pick up citywide externalities, but we cannot establish the extent of
this effect.
3. Residential Segregation in Ten Bolivian Cities
This section considers the effect of residential segregation on income across ten Bolivian
cities. We use available data from the MECOVI 1999 survey and construct residential
segregation variables from 1976 and 1992 census-tract data. We attempt to control for
self-selection and omitted variable bias with available data on labor insertion and parental
ethnicity and schooling. We measure individual-level ethnicity in terms of self-
identification and neighborhood-level ethnicity through language spoken.
Data
The MECOVI (Mejoramiento de Encuestas de Condiciones de Vida) survey includes
data from 3,800 households and 13,131 individuals collected in November/December
1999. The survey is nationally representative and also representative of highland, valley
and lowland subregions. The survey includes expanded sections on ethnicity (language
and self-identification) and demographic indicators. It also includes modules on health
and morbidity, education, labor characteristics, labor and non-labor income, food and
non-food expenditures, housing conditions, durable and non-durable assets as well as
special modules on agricultural production and consumption in rural areas. The survey is
designed to collect panel data on a yearly basis.
Table 1 shows the distribution of residential segregation across Bolivian cities in
1992. The Duncan index presented in the last column measures the proportion of the
population that would have to move from a segregated to a non-segregated neighborhood,
for the population to be equally distributed within cities. The most segregated cities,
according to the index, include the cities of La Paz, El Alto, Santa Cruz and
Cochabamba, also the largest urban settlements in the country.

13
Table 1. Duncan Index, Residential Segregation 1992
(a) See Cutler and Glaeser (1997).Source: 1992 Census
Results
The data used in this section focus on urban households in nine departmental capitals and
the city of El Alto. The analysis is based on 2,059 urban heads of household. Table 2
shows two OLS and one IV regressions. The first regression presents basic OLS results
for a human capital specification. We find expected signs for education, experience,
experience squared and sex. The second specification shows OLS results for an
augmented human capital specification that includes the 1992 residential sorting proxy
for segregation. We find that indigenous-language speakers are significantly worse off
than non-indigenous speakers and that living in an indigenous neighborhood is negatively
correlated with income. A third specification instruments for segregation with a measure
of drought-induced settlement and adds an interaction term for individual and
neighborhood-level ethnicity. Indigenous-speakers who live in predominantly
indigenous-speaking neighborhoods (language*segregation) are worse off then those who
live in less-segregated neighborhoods. This result coincides with much of the literature
on residential segregation. The third specification includes an expanded measure of
ethnicity to test whether language or self-identification ethnicity measures have a
Population age 5 orolder
%
Speaks Spanish%
Speaks NativeLanguage
(monolingual andbilingual)
%
DuncanIndex
(a)
Sucre 110327 39.0 61.0 0.203La Paz 614529 55.1 44.9 0.225Cochabamba 319730 28.7 71.3 0.584Oruro 155415 49.5 50.5 0.141Potosí 92638 30.6 69.4 0.198Tarija 75603 84.7 15.3 0.251Santa Cruz 572235 84.9 15.1 0.239Trinidad 46656 91.4 8.6 0.163Cobija 8299 88.7 11.3 0.065El Alto 332065 36.0 64.0 0.214
14
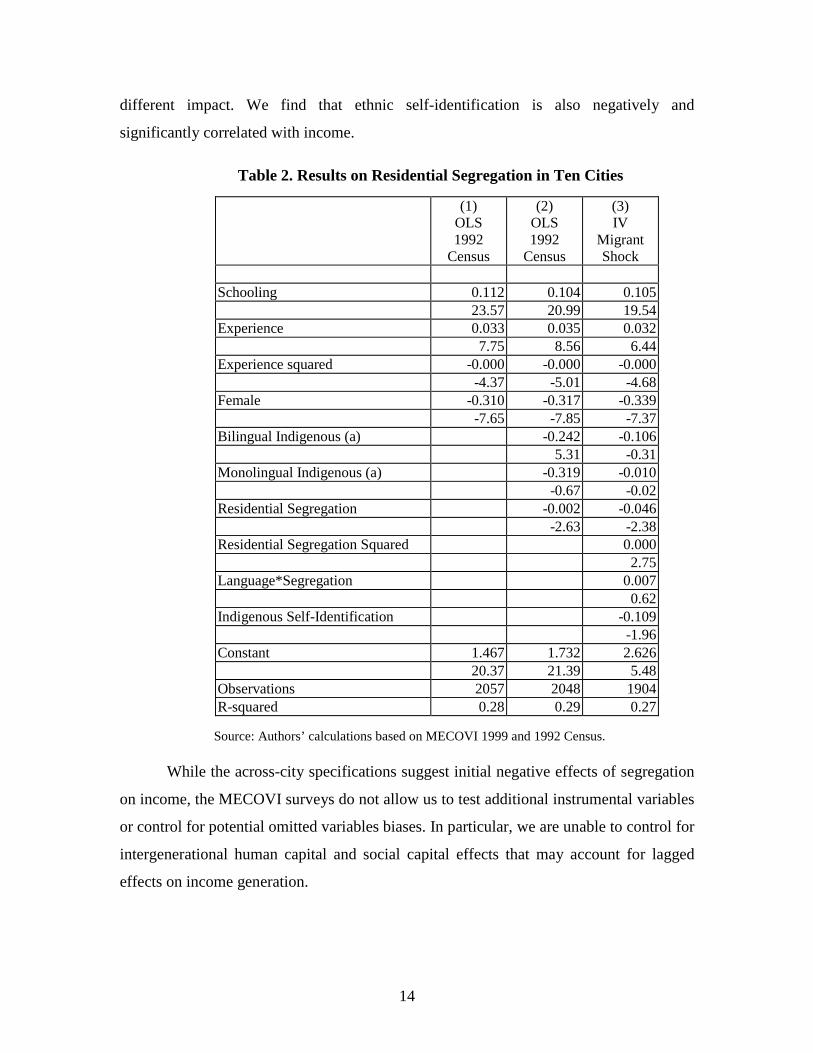
different impact. We find that ethnic self-identification is also negatively and
significantly correlated with income.
Table 2. Results on Residential Segregation in Ten Cities
(1)OLS1992
Census
(2)OLS1992
Census
(3)IV
MigrantShock
Schooling 0.112 0.104 0.10523.57 20.99 19.54
Experience 0.033 0.035 0.0327.75 8.56 6.44
Experience squared -0.000 -0.000 -0.000-4.37 -5.01 -4.68
Female -0.310 -0.317 -0.339-7.65 -7.85 -7.37
Bilingual Indigenous (a) -0.242 -0.1065.31 -0.31
Monolingual Indigenous (a) -0.319 -0.010-0.67 -0.02
Residential Segregation -0.002 -0.046-2.63 -2.38
Residential Segregation Squared 0.0002.75
Language*Segregation 0.0070.62
Indigenous Self-Identification -0.109-1.96
Constant 1.467 1.732 2.62620.37 21.39 5.48
Observations 2057 2048 1904R-squared 0.28 0.29 0.27
Source: Authors’ calculations based on MECOVI 1999 and 1992 Census.
While the across-city specifications suggest initial negative effects of segregation
on income, the MECOVI surveys do not allow us to test additional instrumental variables
or control for potential omitted variables biases. In particular, we are unable to control for
intergenerational human capital and social capital effects that may account for lagged
effects on income generation.
15
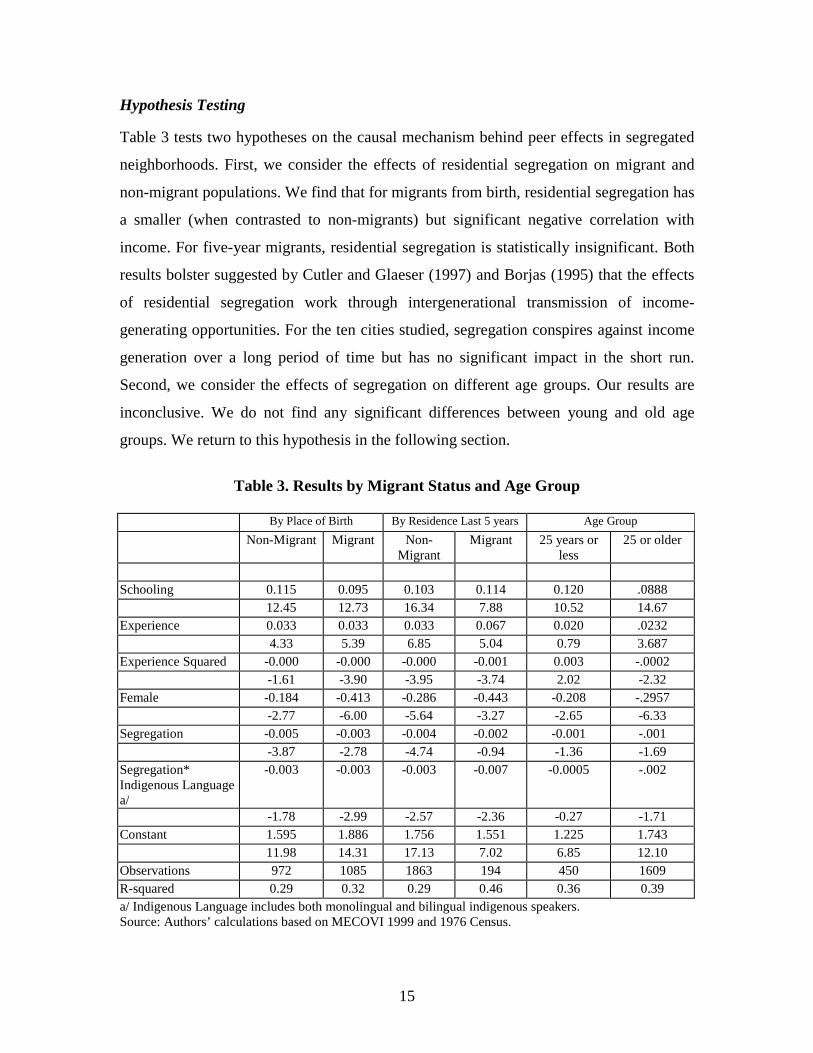
Hypothesis Testing
Table 3 tests two hypotheses on the causal mechanism behind peer effects in segregated
neighborhoods. First, we consider the effects of residential segregation on migrant and
non-migrant populations. We find that for migrants from birth, residential segregation has
a smaller (when contrasted to non-migrants) but significant negative correlation with
income. For five-year migrants, residential segregation is statistically insignificant. Both
results bolster suggested by Cutler and Glaeser (1997) and Borjas (1995) that the effects
of residential segregation work through intergenerational transmission of income-
generating opportunities. For the ten cities studied, segregation conspires against income
generation over a long period of time but has no significant impact in the short run.
Second, we consider the effects of segregation on different age groups. Our results are
inconclusive. We do not find any significant differences between young and old age
groups. We return to this hypothesis in the following section.
Table 3. Results by Migrant Status and Age Group
By Place of Birth By Residence Last 5 years Age GroupNon-Migrant Migrant Non-
MigrantMigrant 25 years or
less25 or older
Schooling 0.115 0.095 0.103 0.114 0.120 .088812.45 12.73 16.34 7.88 10.52 14.67
Experience 0.033 0.033 0.033 0.067 0.020 .02324.33 5.39 6.85 5.04 0.79 3.687
Experience Squared -0.000 -0.000 -0.000 -0.001 0.003 -.0002-1.61 -3.90 -3.95 -3.74 2.02 -2.32
Female -0.184 -0.413 -0.286 -0.443 -0.208 -.2957-2.77 -6.00 -5.64 -3.27 -2.65 -6.33
Segregation -0.005 -0.003 -0.004 -0.002 -0.001 -.001-3.87 -2.78 -4.74 -0.94 -1.36 -1.69
Segregation*Indigenous Languagea/
-0.003 -0.003 -0.003 -0.007 -0.0005 -.002
-1.78 -2.99 -2.57 -2.36 -0.27 -1.71Constant 1.595 1.886 1.756 1.551 1.225 1.743
11.98 14.31 17.13 7.02 6.85 12.10Observations 972 1085 1863 194 450 1609R-squared 0.29 0.32 0.29 0.46 0.36 0.39a/ Indigenous Language includes both monolingual and bilingual indigenous speakers.Source: Authors’ calculations based on MECOVI 1999 and 1976 Census.

16
4. Residential Segregation in La Paz and El Alto
This section considers the effects of intra-city residential segregation on income and
educational achievement. In addition to self-selection and omitted variables biases faced
in across-city analysis of residential segregation, intra-city estimates face the added
problem of geographic mobility within a bounded metropolitan area. In order to control
for all three problems we collect new data and focus on relatively young and non-mobile
cohorts of the population.
Data
Our survey collects income, labor, human and social capital data from 801 households in
43 neighborhoods in the cities of La Paz (24 neighborhoods) and El Alto (19
neighborhoods). The sample is representative of the entire metropolitan area and is
further stratified by high, average and low levels of ethnic-based residential segregation.
Together, sampled neighborhoods (zonas censales) hold a population of close to 200,000
(in a metropolitan area of approximately 1.4 million), with an average of approximately
4,000 citizens per neighborhood.
The contents of the survey largely draw from the 1999 MECOVI household
survey. Questions on demographic characteristics, educational achievement, labor
insertion and income are identical to those on the MECOVI survey. The survey also
collects detailed information on parental ethnic, language, human and social capital
information and includes expanded questions on social capital and perceptions of
segregation from heads of household and spouses.
Measures of Intra-City Segregation
Four measures of intra-city of segregation are used in the regressions. First, we use 1976
census residential sorting patterns, as described in Section 2 above. The 1976 data show a
photograph of La Paz/El Alto previous to the wave of rural to urban migration that
doubled the population in the intercensal period. The pre-migration data allow us to test
whether longstanding residential segregation is systematically different from migration-
induced segregation. The 1976 data show a wide variation between neighborhoods. The
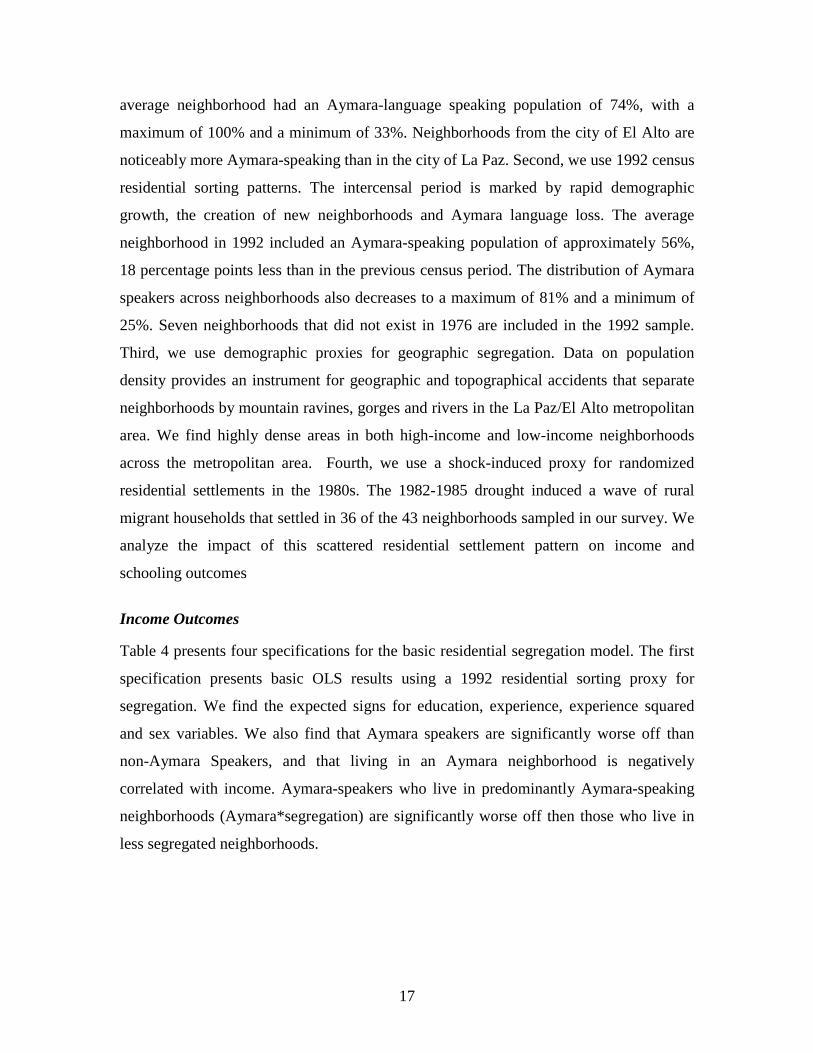
17
average neighborhood had an Aymara-language speaking population of 74%, with a
maximum of 100% and a minimum of 33%. Neighborhoods from the city of El Alto are
noticeably more Aymara-speaking than in the city of La Paz. Second, we use 1992 census
residential sorting patterns. The intercensal period is marked by rapid demographic
growth, the creation of new neighborhoods and Aymara language loss. The average
neighborhood in 1992 included an Aymara-speaking population of approximately 56%,
18 percentage points less than in the previous census period. The distribution of Aymara
speakers across neighborhoods also decreases to a maximum of 81% and a minimum of
25%. Seven neighborhoods that did not exist in 1976 are included in the 1992 sample.
Third, we use demographic proxies for geographic segregation. Data on population
density provides an instrument for geographic and topographical accidents that separate
neighborhoods by mountain ravines, gorges and rivers in the La Paz/El Alto metropolitan
area. We find highly dense areas in both high-income and low-income neighborhoods
across the metropolitan area. Fourth, we use a shock-induced proxy for randomized
residential settlements in the 1980s. The 1982-1985 drought induced a wave of rural
migrant households that settled in 36 of the 43 neighborhoods sampled in our survey. We
analyze the impact of this scattered residential settlement pattern on income and
schooling outcomes
Income Outcomes
Table 4 presents four specifications for the basic residential segregation model. The first
specification presents basic OLS results using a 1992 residential sorting proxy for
segregation. We find the expected signs for education, experience, experience squared
and sex variables. We also find that Aymara speakers are significantly worse off than
non-Aymara Speakers, and that living in an Aymara neighborhood is negatively
correlated with income. Aymara-speakers who live in predominantly Aymara-speaking
neighborhoods (Aymara*segregation) are significantly worse off then those who live in
less segregated neighborhoods.

18
Table 4. Income OLS and IV results
(1) (2) (3) (4)
OLS1992 Segregation
Pattern
IV11976 Segregation
Pattern
IV2Geographic
Segregation Proxy
IV3Randomized Settlement
Proxy
Var dep. lny lny lny lnySchooling 0.063 0.130 0.089 0.124t-stat 4.966 8.217 3.25 2.884Experience 0.033 0.073 0.020 0.085t-stat 1.905 2.407 1.93 2.271Experience Sq -0.000 -0.001 -0.000 -0.001t-stat -1.568 -1.369 -2.01 -1.102Female 0.015 0.025 -0.401 0.048t-stat 1.59 2.014 -3.24 3.663Aymara -0.009 -0.037 -0.041 -0.078t-stat -9.247 -2.146 -2.691 -5.618Aymara*Segreg -0.001 -0.046 -0.002 -0.040t-stat -2.146 -5.418 -1.67 -2.975Segregation -0.024 -0.008 -0.034 -0.029t-stat -1.874 -3.096 -2.09 -1.978Parental SocialCapital
0.011
t-stat 1.269ParentalSchooling
0.148
t-stat 0.256OwnSocial Capital
0.269
t-stat 2.780Constant 1.246 0.003 3.569 0.591t-stat 6.899 0.022 (2.76) 0.735Number of obs 488 488 546 489F 154.09 21.73 30.43 30.01Prob > F 0 0 0 0R-squared 0.2258 0.1937 0.305 0.289Root MSE 0.636 0.934 0.960 0.932
Source: Authors’ survey, 2001.
The second specification partially controls for self-selection by instrumenting
segregation with a historical measure of segregation from 1976. We find that the
historical measure is even more significant than the present-day measure and exhibits the
same signs. Individuals living in what was a highly segregated neighborhood in 1976 are
significantly worse off than those living in a historically non-segregated neighborhood.

19
Aymara-speakers living in a 1976 segregated neighborhood are also significantly worse-
off than those living in a historically non-segregated neighborhood. The 1976 segregation
data provide a useful but limited instrument for present-day segregation. Historical
segregation is likely to be correlated to historical income distribution that is behind the
present-day self-selection problem. We test, therefore, for additional instruments of
residential segregation.
The third specification instruments segregation with neighborhood level
population density, a proxy of geographic segregation. In the La Paz/El Alto metropolitan
area, population density is relatively spread out across high and low-income
neighborhoods. We find that geographical segregation is negatively and significantly
related to income. The fourth specification instruments segregation with a proxy for
random residential settlement. Drought-induced migrants resided in 36 of 43
neighborhoods in the La Paz/El Alto metropolitan area. To the extent that drought
migrants settled equally in high and low-income neighborhoods they provide an
interesting control group against non-migrants. We find that migrants’ residence in
segregated neighborhoods is negatively and significantly correlated with income. We also
include own and parental human and social capital variables that control for
intergenerational endowments of income-generating skills and networks. We find that
controlling for omitted variables confirms previous findings: residential segregation has a
negative and significant effect on income.
Education Outcomes
Table 5 shows results for three specifications on determinants of schooling. The first
regression is a standard OLS specification. We find that income, parental education and
being female are significantly and negatively correlated with schooling attainment. We
further find that speaking Aymara and living in a segregated neighborhood are also
significantly and negatively correlated to schooling attainment. The second specification
instruments segregation with a historical measure of segregation. The significance of
language segregation and historical segregation are slightly lower than in the OLS
specification, but they are also negative and significant. Finally, a third specification
instruments segregation with a proxy for randomized settlement. This specification also
20
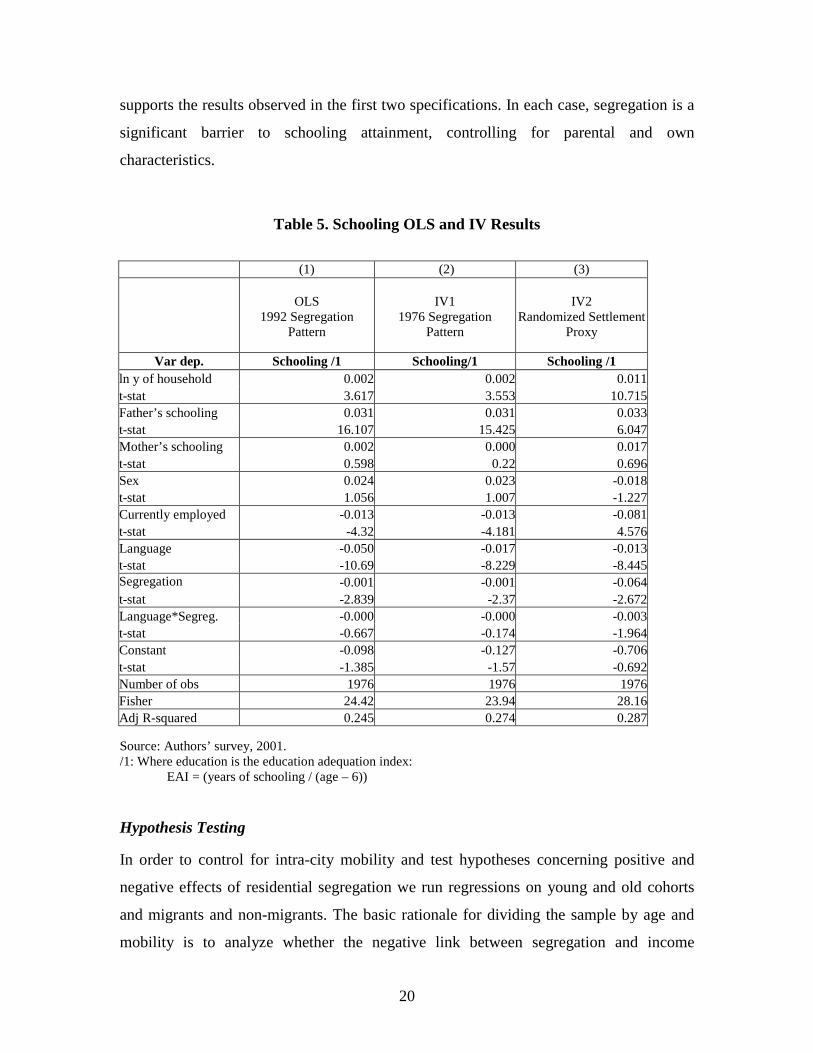
supports the results observed in the first two specifications. In each case, segregation is a
significant barrier to schooling attainment, controlling for parental and own
characteristics.
Table 5. Schooling OLS and IV Results
(1) (2) (3)
OLS1992 Segregation
Pattern
IV11976 Segregation
Pattern
IV2Randomized Settlement
Proxy
Var dep. Schooling /1 Schooling/1 Schooling /1ln y of household 0.002 0.002 0.011t-stat 3.617 3.553 10.715Father’s schooling 0.031 0.031 0.033t-stat 16.107 15.425 6.047Mother’s schooling 0.002 0.000 0.017t-stat 0.598 0.22 0.696Sex 0.024 0.023 -0.018t-stat 1.056 1.007 -1.227Currently employed -0.013 -0.013 -0.081t-stat -4.32 -4.181 4.576Language -0.050 -0.017 -0.013t-stat -10.69 -8.229 -8.445Segregation -0.001 -0.001 -0.064t-stat -2.839 -2.37 -2.672Language*Segreg. -0.000 -0.000 -0.003t-stat -0.667 -0.174 -1.964Constant -0.098 -0.127 -0.706t-stat -1.385 -1.57 -0.692Number of obs 1976 1976 1976Fisher 24.42 23.94 28.16Adj R-squared 0.245 0.274 0.287
Source: Authors’ survey, 2001./1: Where education is the education adequation index:
EAI = (years of schooling / (age – 6))
Hypothesis Testing
In order to control for intra-city mobility and test hypotheses concerning positive and
negative effects of residential segregation we run regressions on young and old cohorts
and migrants and non-migrants. The basic rationale for dividing the sample by age and
mobility is to analyze whether the negative link between segregation and income

21
generation holds across different subgroups of the population, particularly those who
have not yet made the decision to reside in a certain neighborhood. We find two
surprising results presented in Table 6.
First, we find that residential segregation has a positive and significant effect on
migrant income. The relationship reverses for second generation migrants and non-
migrants. We hypothesize that positive effect works through social capital networks
established by recent migrants, which provide access to informal labor markets. As
migrants settle, and the positive effects of informal networks wear out, the negative peer
effects identified by Cutler and Glaeser, low levels of human capital and social networks
linked to lower skilled labor markets, may reverse the impact of residential segregation
over time.
Second, we find that ethnic-based residential segregation also has a positive effect
on younger age groups (younger than 25 years old). The sign switches once we run the
regression on older groups. As with the previous specification, we hypothesize that
residential segregation might provide young workers with ethnic-based peer advantages
over young workers from non-segregated neighborhoods. In addition, we find that
parental schooling is strongly and positively correlated with young workers’ income. By
controlling for intergenerational human capital effects, we hope to isolate the net effect of
residential segregation on the income-generating capacity of younger age groups.

22
Table 6. Effects of Residential Segregation by Age and Migrant Status
Migrant Status Age GroupsNon-Migrant Migrant 25 Years and
YoungerOlder than 25 Years
dep. Var Lny lny lny LnySchooling 0.134 0.088 0.137 0.097t-stat 4.232 3.976 3.535 5.098Experience 0.032 0.045 0.406 0.069t-stat -2.223 1.801 2.074 2.374Experience Sq -0.002 -0.006 -0.006 -0.000t-stat -1.226 -1.232 -1.082 -1.424Female 0.019 0.017 0.027 0.0138t-stat 3.878 2.026 1.682 4.961Aymara -0.207 -0.052 -2.892 -0.041t-stat -1.905 -4.157 -3.041 -5.389Aymara*Segreg -0.034 0.064 -0.216 -0.054t-stat -2.643 2.083 -2.637 -4.108Segregation -0.059 0.045 -0.018 -0.031t-stat -3.167 2.057 -1.237 -3.34ParentalSocial Capital
-0.005 0.011 0.012 -.0909
t-stat -1.009 5.207 0.995 -3.206ParentalSchooling
0.107 0.121 0.146 0.116
t-stat 2.917 2.148 3.28 3.401OwnSocial Capital
0.0743 0.128 -0.054 0.115
t-stat 4.132 1.677 -1.449 2.056_cons -0.604 -0.147 -0.558 -0.285t-stat -1.454 -0.554 -0.381 -1.32Number of obs 249 191 120 320F 7.96 18.29 170.33 29Prob > F 0 0 0 0R-squared 0.317 0.227 0.135 0.238Root MSE 0.877 1.023 0.871 0.969
Source: Authors’ survey, 2001.
5. Research and Policy Implications
Although research on poverty and income distribution in Bolivia has reported differential
wage effects between indigenous and non-indigenous households (see Chiswick, Patrinos
and Hurst, 2000; Rivero and Jiménez 1999; Vos, Lee and Mejía, 1998; Pérez de Rada
1997; Fields et al., 1997; Jiménez and Yañez, 1997), few studies have focused on the

23
effects of residential or neighborhood segregation. In this study we consider the marginal
effects of living in a segregated indigenous neighborhood for urban indigenous residents.
Three results stand out in the analysis. First, we find significant and negative effects on
income generation in both across-city and intra-city comparisons. Second, we find
individual and neighborhood-level interactions between ethnicity and segregation by
ethnicity to be significantly and negatively correlated with income. Finally, we find
positive “social capital effects” for migrants and young workers and “negative human
capital effects” for second-generation migrants, non-migrants and older workers living in
segregated neighborhoods.
Our analysis has aimed to test whether residential segregation has any measurable
effect on income outcomes and to explore alternative causal mechanisms on how
segregation results in costs and benefits for urban households. First, we find that
residential ethnic segregation has a negative and significant effect on personal income.
To control for potential self-selection biases, we test this relationship with three types of
instruments: a measure for historical residential sorting patterns, a proxy for geographic
segregation and a proxy for randomized residential patterns. We find the three
instruments to be significantly and negatively related to personal income. Second, we run
three additional specifications on schooling attainment. We find parental education,
household income and being female to be significant determinants of schooling
attainment. We also find segregation, as measured by the OLS and IV specifications, to
correlate negatively and significantly with schooling. In addition, we test the effect of
potential omitted variables such as intergenerational human and social capital
endowments and find significant positive effects of both on income and schooling
attainment.
Second, we consider alternative explanations to account for these results. We find
that residential segregation has a positive and significant effect on income for recent
migrants and a negative and significant effect on second-generation migrants or non-
migrants. We posit a positive social capital effect to explain the beneficial effects of
ethnic segregation for first-generation migrants who gain a foothold by moving to
Aymara neighborhoods close to relatives and migrant peers. This advantage disappears
over time as first-generation migrants either leave the neighborhood or stay and face

24
negative peer effects. We also find that residential segregation has a positive and
significant effect on younger age cohorts, particularly workers under the age of 25. We
hypothesize that this might be explained by differences in labor force participation
between poor and non-poor groups. Labor participation tends to be high for the poor,
which might explain why the income gap lessens for young and older workers as a whole.
Both of these findings are premised on the possibility of controlling for self-selection,
omitted variable bias and identification problems that might emerge from intra-city and
across-city mobility. We believe a careful examination of the available data have allowed
us to correct for the most important omitted variable and self-selection biases. From a
research perspective, we believe the quantitative analysis reported in this study makes a
substantial addition to a literature that has almost exclusively depended on sociological
and anthropological evidence in the past.
From a policy perspective, the analysis of residential segregation provides insights
into the current debate on Bolivia’s shifting poverty profile. First, because the urban poor
now outnumber the rural poor. As urbanization accelerates and the demographic profile
changes, a window of opportunity arises to achieve gains in savings and productivity.
However, a growing and younger population requires complementary opportunities to
insure productive insertion into labor markets. Among these, human capital, training and
public services are key. Residential segregation may decrease opportunities for human
capital development and lower the quality of public service access. The measurement of
segregation effects will provide a yardstick to assess the costs of policy-induced
segregation. Second, the analysis of residential segregation provides a policy handle on
the more general problem of exclusion and discrimination. While social and political
discrimination has been hard to identify, let alone address, residential segregation is
amenable to an array of policy interventions including urban planning and development
norms and school and health district mapping. Although this study aims primarily at
getting the analysis right, we hope to contribute to a more informed policy debate through
accurate and useful empirical work.

25
References
Alesina, A., and E. LaFerrara, 2000. “Participation in Heterogeneous Communities.”
Quarterly Journal of Economics 115(3): 847-904.
Albo, X., and M. Preiswerk 1986. Cabalgando entre dos mundos: Aymaras migrantes en
la ciudad de La Paz. La Paz, Bolivia: Centro de Investigación y Promoción del
Campesinado (CIPCA).
Borjas, G. 1997. “To Ghetto or Not to Ghetto: Ethnicity and Residential Segregation.”
NBER Working Paper 6176. Cambridge, United States: National Bureau of
Economic Research.
----. 1995. “Ethnicity, Neighborhoods and Human Capital Externalities.” American
Economic Review 85(3): 365-390.
Case, A., and L. Katz, 1991. “The Company You Keep: The Effects of Family and
Neighborhood on Disadvantaged Youths.” NBER Working Paper 3705.
Cambridge, United States: National Bureau of Economic Research.
Chiswick, B., H.A. Patrinos and M. Hurst. 2000. “Indigenous Language Skills and the
Labor Market in a Developing Economy: Bolivia.” Economic Development and
Cultural Change 48(2): 349-368.
Coleman, J., 1990. Foundations of Social Theory. Cambridge, United States: Harvard
University Press.
Cutler, D., and E. Glaeser, 1997. “Are Ghettos Good or Bad?” Quarterly Journal of
Economics 112(3): 827-872.
Glaeser, E., M. Kahn and J. Rappaport. 2000. “Why Do the Poor Live in Cities?” NBER
Working Paper 7636. Cambridge, United States: National Bureau of Economic
Research.
Glaeser, E., D. Laibson and B. Sacerdote. 2000. “The Economic Approach to Social
Capital.” NBER Working Paper 7728. Cambridge: National Bureau of Economic
Research.
Gray-Molina, G. 2000. The Politics of Popular Participation in Bolivia, 1994-1999.
Oxford, United Kingdom: Oxford University, Nuffield College. Unpublished
dissertation.

26
Gray-Molina, G., W. Jiménez, E. Pérez de Rada and E. Yañez. 1999. “Activos y recursos
de los pobres: Que rol desempeña el capital social?” Trimestre Economico
66(3/263): 365-418.
Gray-Molina, G., E. Pérez de Rada and E. Yañez. 1999a. “La economía política de las
reformas institucionales en Bolivia.” Research Network Working Paper R-350.
Washington, DC, United States: Inter-American Development Bank, Research
Department.
----. 1999b. “Transparency and Accountability in Bolivia: Does Voice Matter?” Research
Network Working Paper R-381. Washington, DC, United States: Inter-American
Development Bank, Research Department.
Holzer, H. 1991. “The Spatial Mismatch Hypothesis: What Has the Evidence Shown?”
Urban Studies 28: 105-122.
HAM-La Paz. 1972. “Levantamiento y mapa catastral de La Paz.” La Paz: Honorable
Alcaldía Municipal de La Paz.
IGM. 1998. “Cartografía para la ciudad de La Paz.” La Paz, Bolivia: Instituto Geográfico
Militar.
INE. 2000. “Proyecciones poblacionales 1990-2000.” La Paz, Bolivia: Instituto Nacional
de Estadísticas (INE).
Jiménez, W. and E. Yañez, 1997. “Ingresos familiares en un contexto de crecimiento: Un
modelo de hogares en pseudo-panel.” La Paz, Bolivia: Unidad de Análisis de
Políticas Sociales (UDAPSO).
Kain, J. 1992. “The Spatial Mismatch Hypothesis: Three Decades Together.” Housing
Policy Debate 3: 371-462.
Pérez de Rada, E., 1997. “Discriminación salarial por género y etnia en ciudades
principales de Bolivia.” La Paz, Bolivia: Unidad de Análisis de Políticas Sociales
(UDAPSO).
Portes, A., and P. Landolt. 2000. “Social Capital: Promise and Pitfalls of its Role in
Development” Journal of Latin American Studies 32(2): 529-547.
Portes, A. 1998. “Social Capital: Its Origins and Applications in Modern Sociology.”
Annual Review of Sociology 24: 1-24.

27
Putnam, R. 2000. Bowling Alone: The Collapse and Revival of American Community,
London, United Kingdom: Simon and Schuster.
----. 1993. Making Democracy Work: Civic Traditions in Modern Italy. Princeton, United
States: Princeton University Press.
Rivero, R., and W. Jiménez, 1999. “Diferencias salariales en el mercado de trabajo
urbano en Bolivia, 1981-1997.” La Paz: Unidad de Análisis de Políticas
Económicas (UDAPE).
UDAPE. 2000. “Estrategia Boliviana de Reducción de la Pobreza.” La Paz, Bolivia:
Unidad de Análisis de Políticas Económicas (UDAPE).
Vos, R, H. Lee and J.A. Mejía, 1998. “Structural Adjustment and Poverty in Bolivia.”
INDES Working Paper I-3. Washington, DC: Inter-American Development Bank,
Social Development Institute.

28
ANNEX 1
CIUDAD DE EL ALTOPOBLACION DE 5 Y MAS AÑOS 1976-1992
1976 1992 Diferencia var% anual
290 Ciudad Satélite Sur 5,342 7,166 1,824 1.9%300-301 Ciudad Satélite Sur 4,596 6,881 2,285 2.6%310-311 Ciudad Satélite Sur 5,267 8,337 3,070 2.9%270-281 V. Santiago 1ro. 5,821 16,648 10,827 6.7%170-172 Villa Dolores 6,555 11,097 4,542 3.4%261 / 190 V. 12 De Octubre - Villa Boliv 6,263 6,996 733 0.7%240-242 A. Puerto - Villa Adela - Vill 5,994 14,457 8,463 5.7%150-151 Villa 16 De Julio 5,685 7,317 1,632 1.6%
152 Villa 16 De Julio 7,369 8,921 1,552 1.2%101/140 Villa Los Andes - Villa Espera 2,894 11,310 8,416 8.7%
91 Villa Ballivian 3,371 9,468 6,097 6.6%81 Villa Ballivian 4,736 6,905 2,169 2.4%
070-071 A. Lima - H. Potosi - T. Katary 6,365 6,520 155 0.2%60 Villa Alto Lima 6,455 22,886 16,431 8.1%10 V. Ingenio 1ra. Sección - 3,894 3,894 --11 V. Ingenio 2da. Sección - 3,781 3,781 --20 V. Huayna Potosi - 4,814 4,814 --21 V. Huayna Potosi - 4,921 4,921 --30 V. Germán Busch V Ingavi - 2,736 2,736 --31 V. Busch Mercurio E Ingavi - 3,225 3,225 --
100 V. Tupac Katari - 3,545 3,545 --110 V. Tahuantinsuyo - V. Ingenio - 4,502 4,502 --111 Villa Tahuantinsuyo - 4,094 4,094 --120 V. Yunguyo-V.Oriental-Rio Seco - 4,754 4,754 --130 Villa Tunari - 6,137 6,137 --131 Villa Tunari - 3,928 3,928 --132 Villa Tunari - 3,976 3,976 --161 Barrio Petrolero - 5,154 5,154 --180 Centro 12 De Octubre - 3,764 3,764 --181 Centro 12 De Octubre - 3,031 3,031 --200 V. 6 De Agosto V Murillo Marca - 3,629 3,629 --210 V. Tamayo 23 De Marzo - 5,173 5,173 --220 Vivienda Conavi - Rio Seco - 3,768 3,768 --221 Vivienda Conavi - Rio Seco - 3,288 3,288 --222 Vivienda Conavi - Rio Seco - 2,971 2,971 --230 Sud Yungas -25 De Julio-16 De Febrero - 3,987 3,987 --250 V. Antofagasta-V. Illimani-V. Dolores F - 4,126 4,126 --251 V. Bolívar - V. San Pedro - 3,585 3,585 --252 Vill Bolívar "C" - 3,932 3,932 --260 Villa Bolívar - 3,024 3,024 --320 V. Exaltación - 4,895 4,895 --321 V. Santa Rosa - 3,675 3,675 --

29
1976 1992 Diferencia var% anual
330 Villa Rosas Pampa - 3,704 3,704 --331 Nuevos Horizontes "1" V. 21 De
Diciembre- 5,458 5,458 --
340 Villa Santiago 2do. - 5,845 5,845 --341 Villa Santiago 2do. - 5,436 5,436 --350 V. Nuevos Horizontes "3" - 4,504 4,504 --351 V. Nuevos Horizontes "3" - V. El Carmen - 5,378 5,378 --360 V. Pacajes-V. San Luis Tasa - 3,844 3,844 --361 V. Juliana - V. Primavera - 3,487 3,487 --362 Cosmos 77 - 3,618 3,618 --370 Villa Paraíso - 3,374 3,374 --371 Cosmos 79 A Y B - 3,625 3,625 --372 Cosmos 79 C. Quishuaras - 2,189 2,189 --380 Villa 1ro. De Mayo - 4,149 4,149 --381 V. San Luis Pampa - 3,649 3,649 --382 V. Romero Pampa - 3,094 3,094 --390 El Kenko - 4,864 4,864 --391 V. Las Delicias- V. Oro Negro - 5,004 5,004 --
76,713 332,522 255,809 9.4%
Nota: (--) indica que la zona no existía en 1976
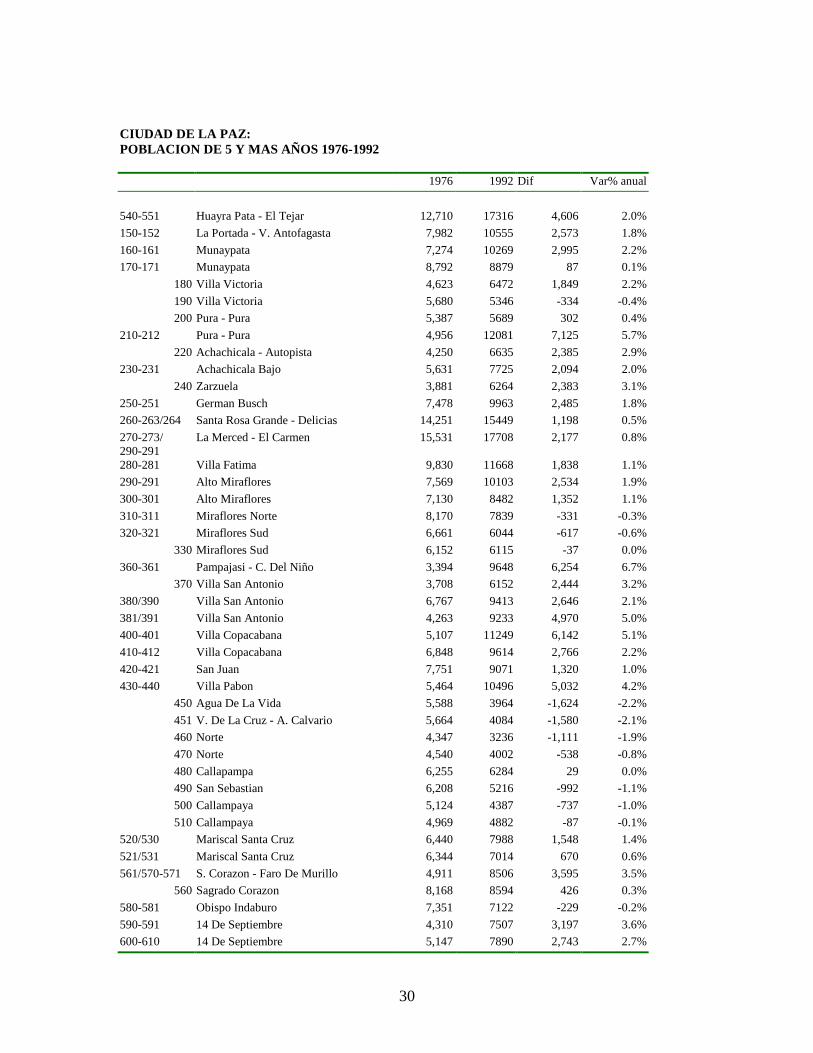
30
CIUDAD DE LA PAZ:POBLACION DE 5 Y MAS AÑOS 1976-1992
1976 1992 Dif Var% anual
540-551 Huayra Pata - El Tejar 12,710 17316 4,606 2.0%150-152 La Portada - V. Antofagasta 7,982 10555 2,573 1.8%160-161 Munaypata 7,274 10269 2,995 2.2%170-171 Munaypata 8,792 8879 87 0.1%
180 Villa Victoria 4,623 6472 1,849 2.2%190 Villa Victoria 5,680 5346 -334 -0.4%200 Pura - Pura 5,387 5689 302 0.4%
210-212 Pura - Pura 4,956 12081 7,125 5.7%220 Achachicala - Autopista 4,250 6635 2,385 2.9%
230-231 Achachicala Bajo 5,631 7725 2,094 2.0%240 Zarzuela 3,881 6264 2,383 3.1%
250-251 German Busch 7,478 9963 2,485 1.8%260-263/264 Santa Rosa Grande - Delicias 14,251 15449 1,198 0.5%270-273/290-291
La Merced - El Carmen 15,531 17708 2,177 0.8%
280-281 Villa Fatima 9,830 11668 1,838 1.1%290-291 Alto Miraflores 7,569 10103 2,534 1.9%300-301 Alto Miraflores 7,130 8482 1,352 1.1%310-311 Miraflores Norte 8,170 7839 -331 -0.3%320-321 Miraflores Sud 6,661 6044 -617 -0.6%
330 Miraflores Sud 6,152 6115 -37 0.0%360-361 Pampajasi - C. Del Niño 3,394 9648 6,254 6.7%
370 Villa San Antonio 3,708 6152 2,444 3.2%380/390 Villa San Antonio 6,767 9413 2,646 2.1%381/391 Villa San Antonio 4,263 9233 4,970 5.0%400-401 Villa Copacabana 5,107 11249 6,142 5.1%410-412 Villa Copacabana 6,848 9614 2,766 2.2%420-421 San Juan 7,751 9071 1,320 1.0%430-440 Villa Pabon 5,464 10496 5,032 4.2%
450 Agua De La Vida 5,588 3964 -1,624 -2.2%451 V. De La Cruz - A. Calvario 5,664 4084 -1,580 -2.1%460 Norte 4,347 3236 -1,111 -1.9%470 Norte 4,540 4002 -538 -0.8%480 Callapampa 6,255 6284 29 0.0%490 San Sebastian 6,208 5216 -992 -1.1%500 Callampaya 5,124 4387 -737 -1.0%510 Callampaya 4,969 4882 -87 -0.1%
520/530 Mariscal Santa Cruz 6,440 7988 1,548 1.4%521/531 Mariscal Santa Cruz 6,344 7014 670 0.6%561/570-571 S. Corazon - Faro De Murillo 4,911 8506 3,595 3.5%
560 Sagrado Corazon 8,168 8594 426 0.3%580-581 Obispo Indaburo 7,351 7122 -229 -0.2%590-591 14 De Septiembre 4,310 7507 3,197 3.6%600-610 14 De Septiembre 5,147 7890 2,743 2.7%

31
1976 1992 Dif Var% anual620 Rosario 6,219 4865 -1,354 -1.6%630 Santa Barbara 7,736 6367 -1,369 -1.3%640 Belen 4,218 3058 -1,160 -2.1%650 Belen 4,454 3518 -936 -1.5%660 Gran Poder 5,952 5389 -563 -0.6%670 Villa Nueva Potosi 4,796 4366 -430 -0.6%680 Villa Nueva Potosi 4,327 4165 -162 -0.2%690 Villa Nueva Potosi 6,126 6226 100 0.1%700 Villa Nueva Potosi 3,597 4991 1,394 2.1%
710-711 Villa Nueva Potosi 6,293 6999 706 0.7%720 San Pedro Alto 3,841 3467 -374 -0.7%730 San Pedro Alto 4,564 4152 -412 -0.6%
740-741 San Pedro Alto 6,142 6664 522 0.5%750 Bello Horizonte 4,811 3770 -1,041 -1.6%760 Bello Horizonte 4,399 4856 457 0.6%770 Tembladerani 5,451 6080 629 0.7%
780-781 Tembladerani 6,648 8067 1,419 1.2%790-793 Tembladerani - Las Lomas - Pasanke 6,804 14510 7,706 4.9%800-802 Tacagua 6,937 12133 5,196 3.6%
810 Sopocachi Alto 6,841 7623 782 0.7%812-821 Sopocachi Alto 6,380 11817 5,437 4.0%830-831 Sopocahi Bajo 5,756 5801 45 0.0%840-841 Sopocachi Bajo 6,029 5435 -594 -0.7%850-851 Kantutani 5,984 6655 671 0.7%341/860-863 Obrajes - Alto Obrajes 9,159 19190 10,031 4.7%870-873 B. Vista - Seguencoma Alto - B 8,797 17883 9,086 4.6%880-883 Irpavi - Bolognia - Achumani 5,816 19969 14,153 7.9%890-891 Calacoto - Florida - Aranjuez 5,782 9117 3,335 2.9%900-905 San Miguel - Cota-Cota 5,837 21062 15,225 8.2%
340 Villa Armonia 0 4479 4,479350 Villa Armonia 0 3788 3,788351 Villa Armonia-San Isidro 0 4823 4,823362 Kupini Callapa 0 4839 4,839363 Chinchaya-Chicani-Pampahasi-Ci 0 4318 4,318
0Total 452302 616596 164,294 2.0%