Hemoglobin concentration of high‐altitude Tibetans and Bolivian Aymara
16
Hemoglobin Concentration of High-Altitude Tibetans and Bolivian Aymara CYNTHIA M. BEALL, 1 * GARY M. BRITTENHAM, 1 KINGMAN P. STROHL, 1 JOHN BLANGERO, 2 SARAH WILLIAMS-BLANGERO, 2 MELVYN C. GOLDSTEIN, 1 MICHAEL J. DECKER, 1 ENRIQUE VARGAS, 3 MERCEDES VILLENA, 3 RUDY SORIA, 3 ANA MARIA ALARCON, 3 AND CRISTINA GONZALES 3 1 Case Western Reserve University, Cleveland, Ohio 44106 2 Southwest Foundation for Biomedical Research, San Antonio, Texas 78227 3 Instituto Boliviano de Biologia de Altura, La Paz, Bolivia KEY WORDS high-altitude hypoxia; heritability; high-altitude natives; National Health and Nutrition Examination Survey ABSTRACT Elevated hemoglobin concentrations have been reported for high-altitude sojourners and Andean high-altitude natives since early in the 20th century. Thus, reports that have appeared since the 1970s describing relatively low hemoglobin concentration among Tibetan high-altitude natives were unexpected. These suggested a hypothesis of population differences in hematological response to high-altitude hypoxia. A case of quantitatively different responses to one environmental stress would offer an opportunity to study the broad evolutionary question of the origin of adaptations. However, many factors may confound population comparisons. The present study was designed to test the null hypothesis of no difference in mean hemoglobin concentration of Tibetan and Aymara native residents at 3,800–4,065 meters by using healthy samples that were screened for iron deficiency, abnormal hemoglobins, and thalassemias, recruited and assessed using the same techniques. The hypothesis was rejected, because Tibetan males had a significantly lower mean hemoglobin concentration of 15.6 gm/dl compared with 19.2 gm/dl for Aymara males, and Tibetan females had a mean hemoglobin concentration of 14.2 gm/dl compared with 17.8 gm/dl for Aymara females. The Tibetan hemoglobin distribution closely resembled that from a comparable, sea-level sample from the United States, whereas the Aymara distribution was shifted toward 3–4 gm/dl higher values. Genetic factors accounted for a very high proportion of the phenotypic variance in hemoglobin concentration in both samples (0.86 in the Tibetan sample and 0.87 in the Aymara sample). The presence of significant genetic variance means that there is the potential for natural selection and genetic adaptation of hemoglo- bin concentration in Tibetan and Aymara high-altitude populations. Am J Phys Anthropol 106:385–400, 1998. r 1998 Wiley-Liss, Inc. Many studies of adaptation to high-alti- tude hypoxia have focused on the blood because of its role in oxygen transport. The French physician Viault reported in 1890 that European sojourners and Andean high- landers had an ‘‘. . .increase in the respira- tory, oxygenating element. . .’’ of the blood (West, 1981, p. 334), and a 1913 publication reported that the total quantity of hemoglo- *Correspondence to: Cynthia M Beall, Ph.D., Department of Anthropology, 238 Mather Memorial Building, Case Western Reserve University, Cleveland, OH 44106–7125. E-mail: [email protected] Received 28 June 1996; accepted 29 April 1998. AMERICAN JOURNAL OF PHYSICAL ANTHROPOLOGY 106:385–400 (1998) r 1998 WILEY-LISS, INC.
Transcript of Hemoglobin concentration of high‐altitude Tibetans and Bolivian Aymara

Hemoglobin Concentration of High-Altitude Tibetansand Bolivian Aymara
CYNTHIA M. BEALL,1* GARY M. BRITTENHAM,1KINGMAN P. STROHL,1 JOHN BLANGERO,2SARAH WILLIAMS-BLANGERO,2 MELVYN C. GOLDSTEIN,1MICHAEL J. DECKER,1 ENRIQUE VARGAS,3 MERCEDES VILLENA,3RUDY SORIA,3 ANA MARIA ALARCON,3 AND CRISTINA GONZALES3
1Case Western Reserve University, Cleveland, Ohio 441062Southwest Foundation for Biomedical Research,San Antonio, Texas 782273Instituto Boliviano de Biologia de Altura, La Paz, Bolivia
KEY WORDS high-altitude hypoxia; heritability; high-altitudenatives; National Health and Nutrition Examination Survey
ABSTRACT Elevated hemoglobin concentrations have been reported forhigh-altitude sojourners and Andean high-altitude natives since early in the20th century. Thus, reports that have appeared since the 1970s describingrelatively low hemoglobin concentration among Tibetan high-altitude nativeswere unexpected. These suggested a hypothesis of population differences inhematological response to high-altitude hypoxia. A case of quantitativelydifferent responses to one environmental stress would offer an opportunity tostudy the broad evolutionary question of the origin of adaptations. However,many factors may confound population comparisons. The present study wasdesigned to test the null hypothesis of no difference in mean hemoglobinconcentration of Tibetan and Aymara native residents at 3,800–4,065 metersby using healthy samples that were screened for iron deficiency, abnormalhemoglobins, and thalassemias, recruited and assessed using the sametechniques. The hypothesis was rejected, because Tibetan males had asignificantly lower mean hemoglobin concentration of 15.6 gm/dl comparedwith 19.2 gm/dl for Aymara males, and Tibetan females had a meanhemoglobin concentration of 14.2 gm/dl compared with 17.8 gm/dl for Aymarafemales. The Tibetan hemoglobin distribution closely resembled that from acomparable, sea-level sample from the United States, whereas the Aymaradistribution was shifted toward 3–4 gm/dl higher values. Genetic factorsaccounted for a very high proportion of the phenotypic variance in hemoglobinconcentration in both samples (0.86 in the Tibetan sample and 0.87 in theAymara sample). The presence of significant genetic variance means thatthere is the potential for natural selection and genetic adaptation of hemoglo-bin concentration in Tibetan and Aymara high-altitude populations. Am JPhys Anthropol 106:385–400, 1998. r 1998 Wiley-Liss, Inc.
Many studies of adaptation to high-alti-tude hypoxia have focused on the bloodbecause of its role in oxygen transport. TheFrench physician Viault reported in 1890that European sojourners and Andean high-landers had an ‘‘. . .increase in the respira-tory, oxygenating element. . .’’ of the blood
(West, 1981, p. 334), and a 1913 publicationreported that the total quantity of hemoglo-
*Correspondence to: Cynthia M Beall, Ph.D., Department ofAnthropology, 238 Mather Memorial Building, Case WesternReserve University, Cleveland, OH 44106–7125.E-mail: [email protected]
Received 28 June 1996; accepted 29 April 1998.
AMERICAN JOURNAL OF PHYSICAL ANTHROPOLOGY 106:385–400 (1998)
r 1998 WILEY-LISS, INC.

bin was increased in sojourners to Pike’s Peak(Douglas et al., 1913). Subsequently, manystudies of hemoglobin concentration con-firmed those findings in sojourners and An-deanhigh-altitudenatives (for review, seeWins-low and Monge, 1987). The inference wasthat this was the universal human adaptivehematological response to high-altitude hyp-oxia, because it was exhibited by Europeanswith brief exposure to the stress and byAndean high-altitude natives with millen-nia of exposure. However, since the 1970s,numerous reports of relatively low hemoglo-bin concentration among Tibetan high-altitude natives suggested a hypothesis ofTibetan-Andean population differences inhematological response to high-altitude hyp-oxia. Generally, samples of Tibetan highland-ers averaged 1.4 gm/dl less hemoglobin thantheir Andean counterparts at comparable(3,400–5,000 meters) altitude (Beall et al.,1990), and, in some cases, the hemoglobinconcentration did not differ from sea level(Beall and Reichsman, 1984). These findingsappeared to illustrate quantitatively differ-ent adaptations in two populations thathave been exposed to the same stress and,presumably, to the same selective pressuresfor millennia. If a new model of two popula-tion-specific responses to life-long hypoxiareplaces the old model of one universalresponse, then this raises important, broad,evolutionary questions about the origins anduniversality of human adaptations.
Although the existing body of data stronglysuggested a hypothesis of Tibetan-Andeanpopulation differences in hematological re-sponse to high-altitude hypoxia, the possibleconfounding effect of widespread iron defi-ciency limiting hemoglobin synthesis hadnot been excluded firmly as an explanationfor the lower Tibetan values. The presentstudy was designed to test the null hypoth-esis of no difference in mean hemoglobinconcentration of samples of Tibetan andBolivian Aymara native residents at 3,800–4,065 meters who were recruited into thestudy, screened for iron-deficiency, and as-sayed by using the same procedures.
MATERIALS AND METHODSPopulation and sample
The study was conducted in rural sites at3,800–4,065 meters in the Tibet Autono-
mous Region (TAR) of China and in Bolivia.The Tibetan study site was Pen-Dri, tworural, agropastoral villages with a popula-tion of 773 ethnic Tibetans living at 3,800–4,065 meters in Lhasa Municipal District,TAR. The average barometric pressure was479 Torr. Each household was contacted inMay-June or October-November 1993 in or-der to invite household members and theirbiological relatives 9 years of age and olderto participate in a study collecting interview,genealogical, anthropometric, and physi-ological data. Ninety-six percent of the house-holds contributed one or more participants.Sixty-eight percent of those who were eli-gible by age participated and yielded a totalsample of 428 people who ranged in age from9 years to 82 years. Age was verified withreference to reported animal year of birth,which was then translated into the equiva-lent Western calendar year. Nearly all wereresidents of these two communities, whichwere traditionally inhabited only by Tibet-ans and where Tibetan is the everydaylanguage. All were life-long, high-altitude,native residents at 3,600 meters or higher(with the exception of one low-altitude na-tive who had lived in the village since 1950).Venipuncture blood samples were requestedfrom volunteers 14 years of age and older.
The Bolivian study site was composed offour dispersed communities in Provincia Mu-rillo, Departamento La Paz, Bolivia with apopulation of 1,175 ethnic Aymara living at3900–4000 meters. The average barometricpressure was 478 Torr. Each household wascontacted between May and August 1994 inorder to invite household members and theirbiological relatives 14 years of age and olderto participate in the study. Age was verifiedby birth certificates, by identity cards, andby reference to historical events for a fewelderly people. Sixty-four percent provided abirth certificate or an identity card issuedupon presentation of a birth certificate. Sev-enty-seven percent of all households partici-pated. Fifty-seven percent of the residentswho were eligible by age participated andyielded a total sample of 608 people 13–94years of age. Seventy percent of the sampleresided in the four communities, and therest were relatives residing elsewhere (oneat low altitude). All were Aymara (except forone Quechua) natives of this or nearby high-
386 C.M. BEALL ET AL.

altitude communities that were tradition-ally inhabited by Aymara and where Aymarais the everyday language. Venipuncture bloodsamples were requested from all study par-ticipants.
Methods
Following standard phlebotomy proce-dures, a venous blood sample was obtainedin a 3-ml draw, EDTA-containing Vacu-tainer and then thoroughly mixed. Two 10-µlsamples of whole blood were removedpromptly, and each was mixed with Uni-Heme reagent in a Unopette microcollectionsystem (Becton-Dickinson, Rutherford, NJ).The transmittances of the resulting cyanmet-hemoglobin solutions were read twice at 540nm with a Milton Roy Mini 20 spectropho-tometer (Milton Roy, Rochester, NY). Hemo-globin concentration was calculated fromthe average of the four transmittance val-ues. The calculation used an equation relat-ing the hemoglobin concentration of low,medium, and high Coulter hemoglobinom-eter controls/calibrator solutions (CoulterDiagnostics, Hialeah, FL) to their transmit-tance measured with a Beckman DU8 Spec-trophotometer in our laboratory in Cleve-land, Ohio, and confirmed with the MiltonRoy Mini 20 at the time of data collection inthe field. To ensure that the accuracy ofhemoglobin measurement under field condi-tions did not differ significantly from thosein a laboratory certified by the College ofAmerican Pathologists, hemoglobin concen-trations were determined in the followingmanner: 1) The calibration of the field spec-trophotometer was verified by comparisonwith a Beckman DU-8 spectrophotometerbefore and after visits to each field site. 2)On each day when measurements of hemo-globin were made in the field, the transmit-tances of the low, medium, and high Coulterhemoglobinometer controls/calibrator solu-tions were measured in association with themeasurements of hemoglobin concentrationin the study participants. Hemoglobin mea-surements were considered suitable foranalysis when the field spectrophotometerreadings of the low, medium, and high cali-brating solutions yielded transmittance val-ues within 2% of the known transmittanceobtained for the three calibrating solutionsand the cyanmethemoglobin standard solu-
tions by a Beckman DU8 spectrophotometerin our laboratory in Cleveland. This avoidedpossible measurement noise due to daily orannual machine drift by using only datacollected when the portable field instrumentmeasured within the stated tolerance rangedefined on the basis of a reference laboratoryinstrument. On those days, the averagedifference between hemoglobin concentra-tion estimated by the equation generatedfrom the field instrument and that esti-mated by the equation generated from thereference laboratory instrument differed by0.04 6 0.06 (standard error of the mean)gm/dl, n 5 305.
The remaining sample was allowed toseparate, and the plasma and cells werepipetted into separate microtubules and fro-zen in liquid nitrogen for transport to Cleve-land. Iron status was evaluated by radioim-munoassay of plasma ferritin (RAMCO,Houston, TX) and assay of zinc erythrocyteprotoporphyrin (Aviv model 206D, ZP hema-tofluoremeter, Aviv Biomedical, Lakewood,NJ). Hemoglobin A2 was measured by mini-column chromatography (Isolab Quik-SEPA2 columns, Isolab, Akron, OH), and hemo-globin electrophoresis was performed by us-ing cellulose acetate (Helena Labs, Beau-mont, TX). The percent oxygen saturation(SaO2) of arterial hemoglobin was measuredby using a Criticare 501 1 finger pulse oxim-eter (Criticare Systems, Inc., Waukeshau, WI),as described elsewhere (Beall et al., 1997; Bealland Goldstein, 1990). Anthropometry was per-formed following standard protocols. Body massindex (BMI) was calculated as weight in kgdivided by the square of height in meters. Allmeasurements were conducted with awake,quietly resting study participants during asingle visit to a field laboratory established in acentral location in the study community.
Socioeconomic and lifestyle data were ob-tained by a questionnaire that was adminis-tered in Tibetan, Spanish, or Aymara. Itelicited information on occupation, work his-tory, education, smoking, alcohol consump-tion, and coca chewing. Occupation was cat-egorized as full-time farmer or other. Workhistory was categorized according to whetheror not an individual was currently workingin a nearby urban area (La Paz in Bolivia orLhasa in the TAR), had previously worked inthat urban area, or had spent his entire life
387TIBETAN AND AYMARA HEMOGLOBIN CONCENTRATION

in the rural sector. Student status was as-sessed in terms of whether or not the indi-vidual was currently enrolled in school. Edu-cational experience was measured in termsof the number of years of school attendanceand was categorized as no years versus anyyears. Cigarette smoking behavior was as-sessed by a question asking whether theindividual used tobacco products, includingcigarettes, cigars, pipes, or snuff. Answerswere categorized as presence or absence ofcigarette smoking (irrespective of the fre-quency). Alcohol use was assessed by aquestion asking whether the individualdrank alcoholic beverages, including tradi-tional, locally brewed beverages and commer-cially produced ones: Answers were catego-rized as no use or some use (irrespective ofthe frequency). Coca chewing was assessedin Bolivia by a question asking whether theindividual chewed coca leaves:Answers werecategorized as no use or some use (irrespec-tive of the frequency).
Analysis
The total sample consisted of 349 Tibetans14–90 years of age and 607 Bolivian Aymara13–94 years of age. To control for severalpotential sources of confounding, the analy-sis is based on subsamples of healthy (by selfreport) individuals who were not iron defi-cient and who had a normal hemoglobinelectrophoretic pattern in cellulose acetateand less than 3.5% hemoglobin A2 (to ex-clude abnormal hemoglobin variants andthalassemias, respectively). The absence ofiron deficiency was defined as having nor-mal values on two laboratory tests of ironstatus. Those were plasma ferritin levelgreater than 12 ng/ml and zinc erythrocyteprotoporphyrin level less than or equal to 70µg/dl red blood cells (Expert Scientific Work-ing Group, 1985; Looker et al., 1995). Inaddition, women who were pregnant or whohad given birth in the past year were ex-cluded. Individuals reporting symptoms con-sistent with illnesses, such as tuberculosisor frequent nose bleeds, that might influ-ence hemoglobin concentration were alsoexcluded from analysis. Table 1 describesthe number of individuals in the variousexclusion categories, resulting in a potentialsample for analysis of 219 Tibetans and 492
Aymara. Technically acceptable measure-ments were available for 136 Tibetans and174 Aymara and formed the basis of thisreport.
Tables 2 and 3 demonstrate that thesamples of healthy people who were not irondeficient and the subsamples for hemoglobinconcentration analysis did not differ in physi-cal, socioeconomic, and lifestyle characteris-tics among the Tibetans or the Aymara. Thetables demonstrate the representativenessof the hemoglobin concentration subsamplesthat were 39% and 29% of the healthyTibetan and Aymara samples of people whowere not iron deficient, respectively. Theaverage age, BMI, plasma ferritin, plasmazinc erythrocyte protoporphyrin, and SaO2of the healthy people who were not irondeficient and the hemoglobin concentrationsubsamples did not differ. The healthy, notiron-deficient samples and the hemoglobinconcentration subsamples also resembledone another closely in socioeconomic charac-teristics, such as the percent of full-timefarmers and the percent of individuals whowere living or working outside the ruralcommunity, currently enrolled in school, anduneducated. They had similar lifestyle char-acteristics, such as the percent of people who
TABLE 1. Exclusion criteria applied to total samplewith available hemoglobin concentration to identifya subsample that was not iron deficient, had normal
electrophoretic pattern, was not pregnant,had not recently delivered an infant, was healthy,
and had technically acceptable hemoglobinconcentration determination
Criteria
Tibetansample
(n)
BolivianAymarasample
(n)
Total with hemoglobin concentra-tion determinations 349 607
Iron deficiency 9 19No iron status determination 61 20Abnormal electrophoretic pattern 6 0Pregnant and not excluded by the
above criteria 5 14Delivered an infant in past year
and not excluded by the above 15 37Self-reported symptoms consistent
with illness influencing hemo-globin concentration and notexcluded by the above 29 19
Healthy, not iron deficient, normalelectrophoresis, not pregnant,no recent delivery subsample 219 492
Technically acceptable subsample 136 174
388 C.M. BEALL ET AL.

did not smoke cigarettes, drink alcohol, orchew coca leaves. Thus, the hemoglobinconcentration subsample accurately reflectedthe sample of healthy people in both sites.
The repeatability of height, weight, andSaO2 was determined by calculating themean and standard deviation of the differ-ence between measurements of the sameindividual on different days (Bland and Alt-man, 1986). The repeatability of height was11 6 2 mm (n 5 22) in the Tibetan sampleand 19 6 22 mm (n 5 22) in the Aymara
sample. The repeatability of weight was10.1 6 2 pounds (n 5 22) in the Tibetansample and 21.3 6 5 pounds (n 5 22) in theAymara sample. The repeatability of SaO2was 11.3 6 2.7% (n 5 22) in the Tibetansample and 10.3 6 2.9% (n 5 22) in theAymara sample. Study participants werenot asked for a second venous blood sampleto determine repeatability of hemoglobinconcentration.
The normality of the distribution of thevariables involved in the statistical analyses
TABLE 2. Biological, socioeconomic, and lifestyle characteristics of the Tibetan sample1
Characteristic
Tibetan males Tibetan females
Healthy, notiron-deficient
sample
Subsample forhemoglobin
analyses
Healthy, notiron-deficient
sample
Subsample forhemoglobin
analyses
Number 110 75 109 61Biological characteristics (mean 6 SEM)
Age (years) 32 6 1.5 34 6 1.8 36 6 1.7 35 6 2.3BMI (kg/m2) 18.3 6 0.18 18.4 6 0.20 18.6 6 0.22 18.5 6 0.30Plasma ferritin (ng/ml) 106.3 6 10.57 111.6 6 12.39 42.2 6 5.40 40.8 6 3.47Plasma zinc erythrocyte protoporphyrin
(µg/dl red blood cells) 23.9 6 1.18 25.2 6 1.53 31.4 6 1.86 29.6 6 2.71SaO2 (%) 89 6 0.3 89 6 0.3 89 6 0.3 90 6 0.4
Socioeconomic and lifestyle characteristics(% of total)
Full-time farmers (%) 86.4 90.7 90.8 91.8Presently working in urban area or did so in the
past (%) 8.2 9.3 4.6 3.3Presently enrolled as a student 5.5 0 4.6 4.9Had no formal education (%) 40.0 48.0 66.1 70.5Does not smoke cigarettes (%) 26.2 27.8 100 100Does not drink alcoholic beverages (%) 39.1 38.7 57.8 54.1
1 BMI, body mass index; SaO2, percent of oxygen saturation of arterial hemoglobin.
TABLE 3. Biological, socioeconomic, and lifestyle characteristics of the Aymara sample1
Characteristic
Aymara males Aymara females
Healthy, notiron-deficient
sample
Subsample forhemoglobin
analyses
Healthy, notiron-deficient
sample
Subsample forhemoglobin
analyses
Number 283 91 209 83Biological characteristics (mean 6 SEM)
Age (years) 36 6 1.0 37 6 1.9 36 6 1.2 38 6 2.0BMI (kg/m2) 22.2 6 0.19 22.3 6 0.35 23.1 6 0.29 23.4 6 0.43Plasma ferritin (ng/ml) 58.5 6 2.25 61.8 6 4.33 40.3 6 2.60 47.0 6 4.06Plasma zinc erythrocyte protoporphyrin
(µg/dl red blood cells) 38.0 6 0.98 36.8 6 2.07 51.8 6 1.70 53.0 6 2.29SaO2 (%) 92 6 0.2 92 6 0.4 91 6 0.3 90 6 0.4
Socioeconomic and lifestyle characteristics (% of total)Full-time farmers (%) 27.2 36.3 85.2 84.3Presently working in urban area or did so in the
past (%) 52.3 53.8 82.8 86.7Presently enrolled as a student (%) 17.0 22.0 9.6 10.8Had no formal education (%) 7.4 8.8 21.5 26.5Does not smoke cigarettes (%) 37.8 37.4 57.9 66.3Does not drink alcoholic beverages (%) 0 0 0 0Does not chew coca leaves (%) 39.2 38.5 46.4 54.2
1 BMI, body mass index; SaO2, percent of oxygen saturation of arterial hemoglobin.
389TIBETAN AND AYMARA HEMOGLOBIN CONCENTRATION

(age, BMI, SaO2, and hemoglobin concentra-tion) was evaluated by the inspection ofprobability plots displaying the observedcumulative proportions of each variable plot-ted on the y-axis against the expected cumu-lative proportions under the assumption of anormal distribution of that variable plottedon the x-axis. The data points clusteredabout the straight line y 5 x, and no valuesdeviated markedly from that line. There-fore, it was concluded that they were distrib-uted normally in the males and femalesfrom both study sites.
Means and standard errors of the meanare reported. The t-tests address the hypoth-esis of population differences, and correla-tion-regression analyses describe thestrength of association between hemoglobinconcentration and other physical character-
istics. Maximum likelihood variance decom-position methods that are available in thecomputer program PAP (Hasstedt, 1989), asmodified by Blangero (1993), provide infor-mation regarding the relative importance ofcovariates, additive genetic, shared house-hold environment, and random environmen-tal effects on phenotypic variation in hemo-globin concentration. This approach usesmaximum likelihood estimation techniquesto partition the variance in a trait intocomponents that are attributable to additivegenetic factors and environmental factorswhile allowing for the systematic influenceof known covariate effects. The heritability,h2, is determined as the proportion of addi-tive genetic variance relative to the totalphenotypic variance. The Tibetan samplewas composed of eight pedigrees ranging in
Fig. 1. Scatter plot of Tibetan and Bolivian Aymara hemoglobin concentration with age. A: Males. B:Females.
390 C.M. BEALL ET AL.

size from 2 to 67 people and 13 unrelatedindividuals who were retained in the analy-sis to improve parameter estimation. TheBolivian sample consisted of 13 pedigreeswith between 2 and 90 individuals and anadditional 18 independent individuals whowere included in the analysis. Pedigreeswere constructed by using all available infor-mation on relationships between individu-als obtained from the genealogies providedby the study participants. Individuals weredefined as belonging to a pedigree if theywere biologically related to anyone else inthe pedigree.
RESULTS
The Tibetan male sample had a meanhemoglobin concentration of 15.6 6 0.17gm/dl, with a range of 11.9–20.0 (n 5 75).
The Aymara male sample had a 3.5 gm/dlhigher mean of 19.1 6 0.18 gm/dl, with arange of 15.0–25.1 (n 5 91; t 5 213.8; P ,0.05). The Tibetan female sample had amean hemoglobin concentration of 14.2 60.14 gm/dl, with a range of 12.4–17.6 (n 561). The Aymara female sample had a 3.6gm/dl higher mean of 17.8 6 0.23 gm/dl,with a range of 11.8–23.6 (n 5 83; t 5 213.0;P , 0.05) for Aymara. By study design, thedifference was not explained by differencesin the prevalence of iron deficiency.
Additional analyses evaluated the poten-tial influence of biological factors contribut-ing to the lower Tibetan hemoglobin concen-tration. Figure 1 presents scatter plots ofhemoglobin concentration with age and illus-trates that Tibetans had lower hemoglobinconcentration at all ages. Both male samples
Fig. 1.
391TIBETAN AND AYMARA HEMOGLOBIN CONCENTRATION

and Tibetan females had stable hemoglobinconcentration across the reported age span,whereas Aymara females exhibited a small,significant, positive correlation between he-moglobin concentration and age (Table 4).Figure 2 presents scatter plots of hemoglo-bin concentration with BMI and illustratesthat Tibetans had lower hemoglobin concen-trations in the BMI ranges where there was
overlap. Aymara had significantly higherhemoglobin concentration at higher BMI,whereas Tibetans did not. Figure 3 showsthat Tibetans had lower hemoglobin concen-tration at all SaO2. Tibetan males had asmall, significant, negative correlation, andAymara females had a moderate, signifi-cant, negative correlation of hemoglobin con-centration with SaO2. The three Aymara
TABLE 4. Bivariate correlations of hemoglobin concentration with age, BMI,and SaO2 in the Tibetan and Bolivian Aymara samples1
Group Age BMI SaO2
Tibetan males r 5 0.06, n 5 75 r 5 0.07, n 5 75 r 5 20.26,* n 5 68Tibetan females r 5 20.08, n 5 61 r 5 0.02, n 5 60 r 5 20.08, n 5 58Aymara males r 5 0.15, n 5 91 r 5 0.24,* n 5 90 r 5 20.14, n 5 62Aymara females r 5 0.29,* n 5 83 r 5 0.39,* n 5 78 r 5 0.63,* n 5 461 BMI, body mass index; SaO2, percent of oxygen saturation of arterial hemoglobin.* P , 0.05.
Fig. 2. Scatter plot of Tibetan and Bolivian Aymara hemoglobin concentration with body mass index(BMI). A: Males. B: Females.
392 C.M. BEALL ET AL.
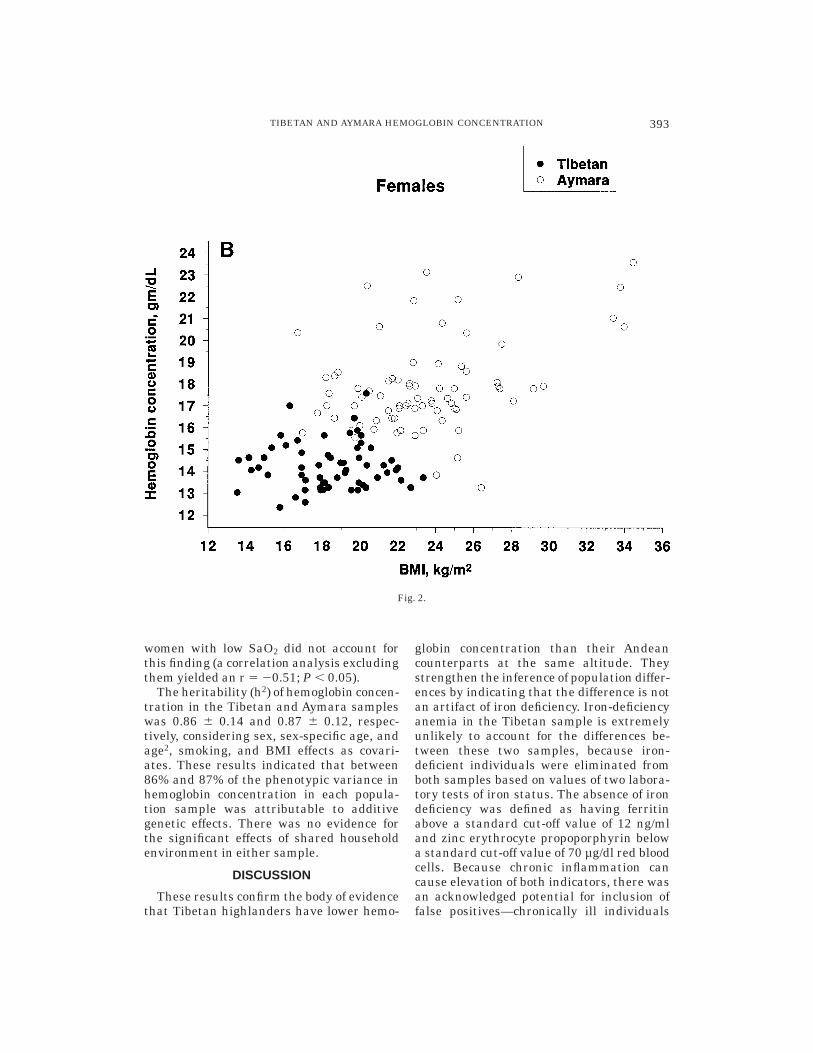
women with low SaO2 did not account forthis finding (a correlation analysis excludingthem yielded an r 5 20.51; P , 0.05).
The heritability (h2) of hemoglobin concen-tration in the Tibetan and Aymara sampleswas 0.86 6 0.14 and 0.87 6 0.12, respec-tively, considering sex, sex-specific age, andage2, smoking, and BMI effects as covari-ates. These results indicated that between86% and 87% of the phenotypic variance inhemoglobin concentration in each popula-tion sample was attributable to additivegenetic effects. There was no evidence forthe significant effects of shared householdenvironment in either sample.
DISCUSSION
These results confirm the body of evidencethat Tibetan highlanders have lower hemo-
globin concentration than their Andeancounterparts at the same altitude. Theystrengthen the inference of population differ-ences by indicating that the difference is notan artifact of iron deficiency. Iron-deficiencyanemia in the Tibetan sample is extremelyunlikely to account for the differences be-tween these two samples, because iron-deficient individuals were eliminated fromboth samples based on values of two labora-tory tests of iron status. The absence of irondeficiency was defined as having ferritinabove a standard cut-off value of 12 ng/mland zinc erythrocyte propoporphyrin belowa standard cut-off value of 70 µg/dl red bloodcells. Because chronic inflammation cancause elevation of both indicators, there wasan acknowledged potential for inclusion offalse positives—chronically ill individuals
Fig. 2.
393TIBETAN AND AYMARA HEMOGLOBIN CONCENTRATION

without iron reserves with ferritin that wasnevertheless within the normal range due totheir illness. The high cut-off for zinc eryth-rocyte protoporphyrin countered this by po-tentially eliminating some individuals withhigh zinc erythrocyte protoporphyrin valuesdue to infection alone. Epidemiological orlaboratory data on chronic inflammationwere not available for these two samples.Health was evaluated by self report, andthose reporting chronic illness were not in-cluded in the sample for analysis. Thus, it isunlikely that widespread, chronic inflamma-tion accounts for the lower Tibetan hemoglo-bin concentration. Folate deficiency was ex-tremely unlikely to account for the lowerTibetan hemoglobin concentration, becausethe Tibetan staple food was whole grainbarley, a rich source of folate. Overall, it is
unlikely that hemoglobin synthesis was lim-ited by nutritional constraints in the Ti-betan sample.
It is also improbable that air pollutionfrom cigarette smoking (see, e.g., Ramirez etal., 1991) or burning biomass fuels (woodand dung) for domestic cooking and heating(see, e.g., Norboo et al., 1991) accounts forthe higher Aymara hemoglobin concentra-tion. Both practices could exacerbate hyp-oxia by producing carbon monoxide, whichbinds to hemoglobin to form carboxyhemoglo-bin and thereby reduces the amount ofoxyhemoglobin and may stimulate a com-pensatory increase in erythropoiesis andhemoglobin concentration. However, the Ay-mara sample had substantially lower risk ofthese forms of pollution. Smoking was muchlighter among Aymara than Tibetan males.
Fig. 3. Scatter plot of Tibetan and Bolivian Aymara hemoglobin concentration with percent oxygensaturation (SaO2). A: Males. B: Females.
394 C.M. BEALL ET AL.

Most Aymara males who reported cigarettesmoking claimed only occasional smoking atparties. Just 6% of theAymara males smokeddaily compared with 69% of Tibetan males.Similarly, just 1% of the Aymara femalesreported smoking cigarettes daily, whereasthe rest of the female smokers reported onlyoccasional smoking at parties. Exposure toindoor air pollution from biomass fuels wasevaluated by using answers to interviewquestions about the location of the kitchen(attached to the house or in a separatestructure) and the type of fuel used (wood,dung, or propane). Only 20% of Aymaramales and 17% of Aymara females reportedhaving kitchens in the house, and only 6% ofAymara males and 10% of Aymara femalesreported using wood fuel only (another 69%of males and 71% of females reported usingboth wood and propane gas). In contrast, the
Tibetans all had kitchens attached to thehouse and burned both wood and dung.[Alternatives were not available in the vil-lages. After one of the investigators (C.M.B.)walked through them to confirm that therewere no detached kitchens and talked withseveral informants to ascertain that thereported kitchen and fuel-use pattern wasuniform, those questions were dropped fromthe questionnaire shortly after the begin-ning of the study.] The lighter smoking ofAymara males and the lower proportion ofpeople exposed to daily biomass fuel burningin the house both argue against the possibil-ity that indoor air pollution accounts fortheir higher hemoglobin concentration.
The substantially lower (nearly 20%) Ti-betan than Aymara hemoglobin concentra-tion in the present study was unlikely toreflect systematic differences in recruitment
Fig. 3.
395TIBETAN AND AYMARA HEMOGLOBIN CONCENTRATION

or measurement technique, because bothwere controlled by study design and imple-mentation. The process of subject recruit-ment was the same in both sites, and similarproportions of households and individualsparticipated. Ethnicity was established onthe basis of birth in a traditional Tibetan orAymara rural area and use of the nativelanguage. Although more Aymara than Ti-betan participants had been exposed to ur-ban life, and more Aymara lived outside thestudy community, this did not explain thesample differences. There was an insignifi-cant trend toward lower hemoglobin concen-tration in the Aymara with urban exposure(defined as past or current work or residencein La Paz), and there was an insignificanttrend toward higher hemoglobin concentra-tion in the few Tibetans with urban expo-sure (Lhasa). The analytic procedures werethe same in the two sites. Only data ob-tained on days when the field spectrophotom-eter provided transmittance readings of thecontrol/calibrating solutions within 2% ofthe expected values were used. Thus, asystematic or time-dependent assay biaswas avoided.
The population differences were not due tothe higher SaO2 and BMI of the Aymara.This was evaluated by analyses of covari-ance, which are summarized in Table 5. Theestimated mean hemoglobin concentration,adjusted for age, BMI, and SaO2, differedfrom the observed sample means by only 0.1gm/dl.
The findings of the present study werebroadly consistent with previous reports ofsimilar samples. The Aymara male samplemean hemoglobin concentration was higherthan that reported for other rural Aymarasamples and resembled that for urbansamples near the same altitude (for review,see Beall et al., 1990). The Aymara femalemean was higher (by 1.5–2.0 gm/dl) thanpreviously reported at 3,600–4,000 meters(see, e.g., Moreno-Black et al., 1984; Beall etal., 1990). The Tibetan male mean hemoglo-bin concentration was 1–2.5 gm/dl lowerthan that previously reported at 3,600–4,000 meters altitude in rural Nepal andurban TAR (see, e.g., Adams and Shrestha,1974; Adams and Strang, 1975; Groves etal., 1993; Sun et al., 1990; Zhuang et al.,1993).
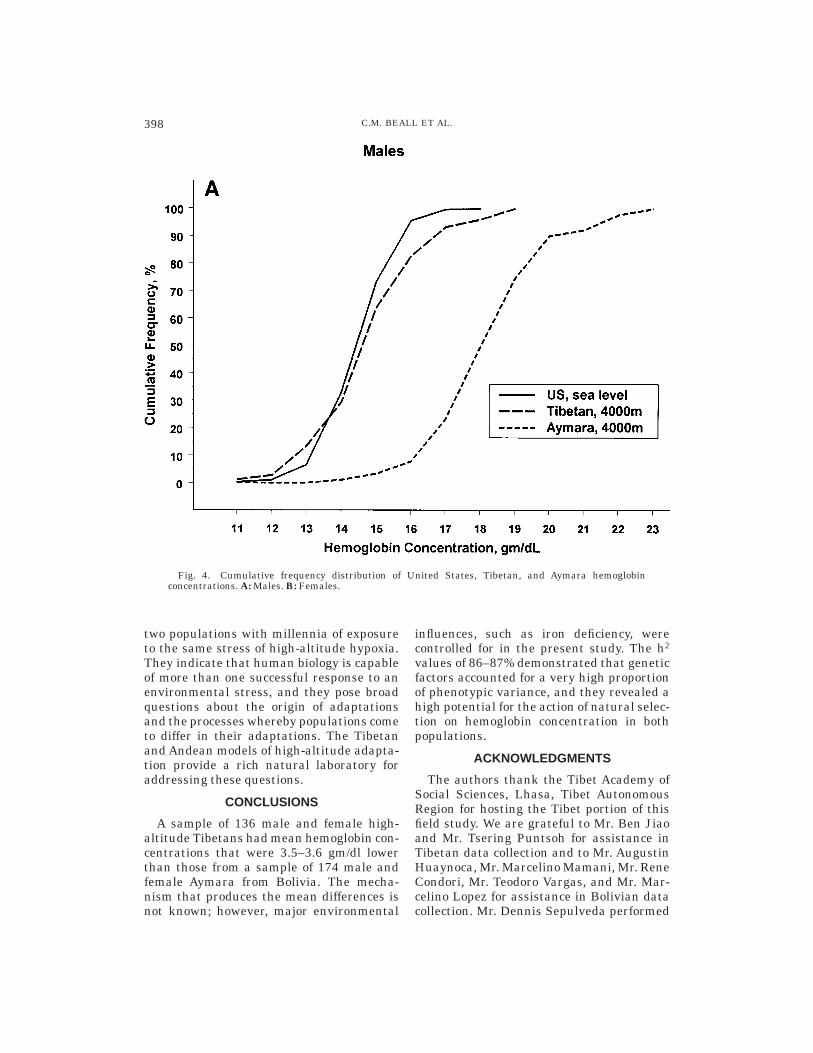
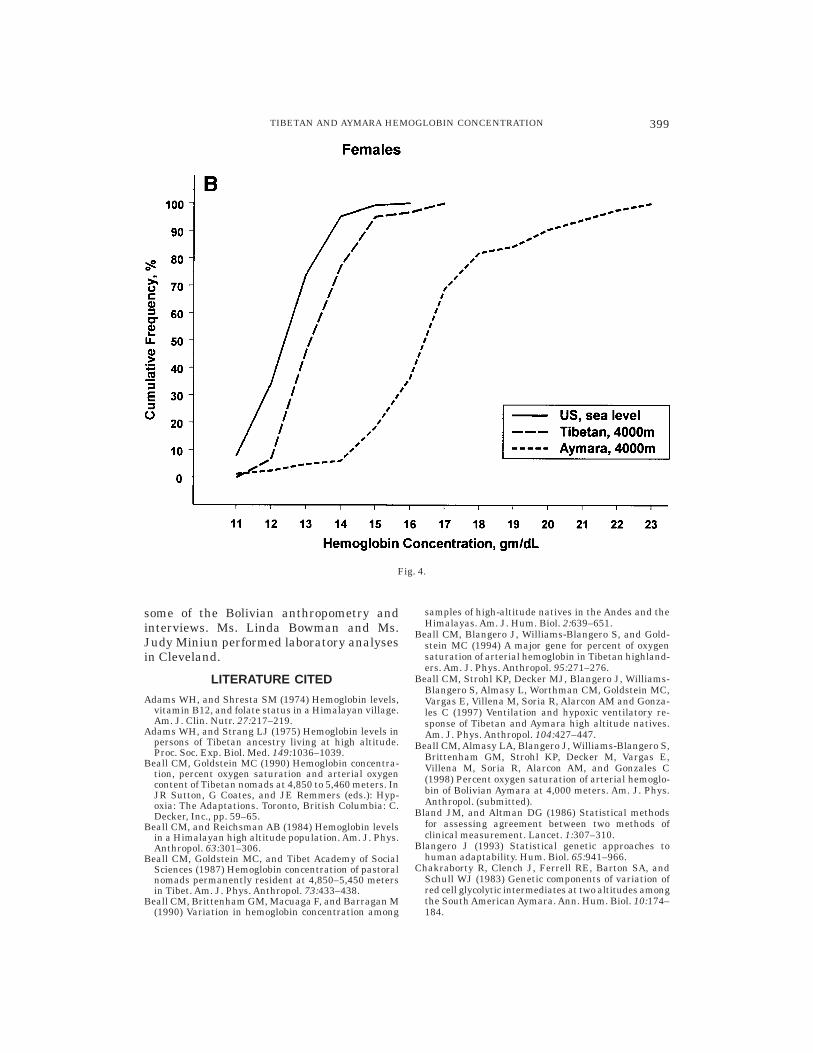
The Tibetan mean and distribution ofhemoglobin concentration closely resembledthose of a United States sea-level sampledrawn from the third National Health andNutrition Examination Survey, 1988–1994(NHANES III). The NHANES III was de-signed to represent the civilian, noninstitu-tionalized population of the United Statesaged 2 months and older (U.S. Departmentof Health and Human Services, 1996a–c). Asea-level sample comparable to the presentsamples was drawn from the publishedNHANES III data set by selecting ‘‘whites’’20–49 years of age residing in the UnitedStates but outside of the ‘‘West’’ (to excludehigh-altitude residents of the mountainstates) whose self-reported health was good,very good, or excellent and who were notiron deficient, as defined by the same twocriteria employed in the present study. TheUnited States sea-level male mean hemoglo-bin concentration was 15.3 6 0.02 gm/dl,with a range of 10.4–18.7 (n 5 1703), andthe United States sea-level female meanhemoglobin concentration was 13.4 6 0.02gm/dl, with a range of 5.2–16.9 (n 5 1797).These means were only 0.3 gm/dl and 0.8gm/dl lower than Tibetan males and fe-males, respectively, whereas they were 3.8gm/dl and 3.4 gm/dl lower than Aymara.Figure 4 illustrates the similar cumulativefrequency distributions of hemoglobin con-centration for the United States and Tibetansamples in contrast to the Aymara curve,
TABLE 5. Summary of analyses of covariance of sitedifferences in hemoglobin concentration using age,
BMI, and SaO2 as covariates1
Source SS df MS F ratio
Adjusted meanhemoglobin
concentration(adjusted for
age, BMI, SaO2)
Tibetan Aymara
MaleModel 428.44 4 107.11 47.83* 15.6 19.0Error 279.92 125 2.24Total 708.36 129
FemaleModel 417.00 4 104.25 47.03* 14.3 17.8Error 210.57 95 2.22Total 627.57 99
1 BMI, body mass index; SaO2, percent of oxygen saturation ofarterial hemoglobin; df, Degrees of freedom.* P , 0.05.
396 C.M. BEALL ET AL.
which is shifted to the right by 3–4 gm/dl.The Tibetans in the present study lived ataltitudes of 3,800–4,065 meters without sig-nificant erythrocytosis. This was also re-ported for a rural Tibetan sample at 3,250–3,560 meters (Beall and Reichsman, 1984).However, another Tibetan sample at theextremely high altitude of 4,850–5,450 me-ters had mean male and female hemoglobinconcentrations of 18.2 gm/dl and 16.7 gm/dl,respectively (Beall et al., 1987). That findingindicated that Tibetans can respond to high-altitude hypoxia with erythrocytosis; how-ever, the hypoxic stimulus must be strongerthan that encountered at the 3,800–4,065meters of the present study. In contrast,Aymara had a marked erythrocytosis atthese altitudes. These findings confirm ear-lier ones and strengthen the hypothesis thatthere are population genetic differences inthe size of the hematological response tohigh-altitude hypoxia.
Identifying population differences in ge-netic factors that determine quantitativetraits, such as hemoglobin concentration,requires several steps. A necessary first stepis determining that genetic factors influencehemoglobin concentration in one or bothsamples. The present study estimated theproportion of phenotypic variance in hemo-globin concentration that was attributableto genetic factors (i.e., the heritability ofhemoglobin concentration) in each popula-tion. Genetic factors accounted for 86% ofthe total variation in hemoglobin concentra-tion in the Tibetan and 87% of the totalvariation in the Aymara sample. These h2
values are higher than the 66% for anotherhigh-altitude Tibetan sample (Beall et al.,1994), 59% for a sea-level Australian twinsample (Whitfield and Martin, 1985), and48% for a sea-level sample of Canadiannuclear families (Perusse et al., 1987). An h2
of only 22% was reported for a sample thatincluded two Chilean ethnic groups at threealtitudes (Chakraborty et al., 1983). Thatfinding was weakened by including differentpopulations in different environments in asingle calculation—h2 values, by definition,are specific to a single population in a singleenvironment. Overall, the present and previ-ous studies indicate that genetic factorsaccount for a large proportion of phenotypic
variance in hemoglobin concentration in awide range of altitudes and samples. Thepresence of significant genetic variance is anecessary prerequisite for natural selection.The high h2 values in the present studymean that both populations have a highpotential for response to natural selection.
To determine whether the genetic factorsthat influence hemoglobin concentration inthe Tibetan and Aymara populations aredifferent requires additional information onthe specific loci and alleles involved. Thisinformation is not presently available. How-ever, the design and analysis of the presentstudy suggest that the genetic factors aredifferent. The present study sought to com-pare two populations in a single environ-ment with respect to relevance for hemoglo-bin concentration by controlling for the majorknown environmental influences. The combi-nation of the existence of variation in hemo-globin concentration, the common findingthat 86–87% of the variation in hemoglobinconcentration is attributable to genetic fac-tors, and the large differences in populationmeans suggest that different alleles influ-ence the hematological response to high-altitude hypoxia in the two populations.These data do not identify the specific ge-netic factors underlying intrapopulation orinterpopulation variation in response or pro-vide insight into the mechanism. Possibili-ties include factors that attenuate or en-hance hemoglobin concentration itself andpleiotropic or epistatic effects of alleles forother traits.
The Pen-Dri Tibetan and Ventilla Aymarasamples described in this report differ inother oxygen-transport traits that are rel-evant to high-altitude adaptation. For ex-ample, the Tibetans had 2–3% lower SaO2than the Aymara, indicating that the sameambient hypobaric hypoxia results in greaterTibetan arterial hypoxia (Beall et al., 1998).At the same time, Tibetans had 1.5 timeshigher resting ventilation and roughly doublethe hypoxic ventilatory response (increasein ventilation upon exposure to further ex-perimental hypoxia) of the Aymara (Beall etal., 1997). These findings, together with thelower Tibetan hemoglobin concentration,suggest that different combinations of quan-titative traits have been selected for in these
397TIBETAN AND AYMARA HEMOGLOBIN CONCENTRATION
two populations with millennia of exposureto the same stress of high-altitude hypoxia.They indicate that human biology is capableof more than one successful response to anenvironmental stress, and they pose broadquestions about the origin of adaptationsand the processes whereby populations cometo differ in their adaptations. The Tibetanand Andean models of high-altitude adapta-tion provide a rich natural laboratory foraddressing these questions.
CONCLUSIONS
A sample of 136 male and female high-altitude Tibetans had mean hemoglobin con-centrations that were 3.5–3.6 gm/dl lowerthan those from a sample of 174 male andfemale Aymara from Bolivia. The mecha-nism that produces the mean differences isnot known; however, major environmental
influences, such as iron deficiency, werecontrolled for in the present study. The h2
values of 86–87% demonstrated that geneticfactors accounted for a very high proportionof phenotypic variance, and they revealed ahigh potential for the action of natural selec-tion on hemoglobin concentration in bothpopulations.
ACKNOWLEDGMENTS
The authors thank the Tibet Academy ofSocial Sciences, Lhasa, Tibet AutonomousRegion for hosting the Tibet portion of thisfield study. We are grateful to Mr. Ben Jiaoand Mr. Tsering Puntsoh for assistance inTibetan data collection and to Mr. AugustinHuaynoca, Mr. Marcelino Mamani, Mr. ReneCondori, Mr. Teodoro Vargas, and Mr. Mar-celino Lopez for assistance in Bolivian datacollection. Mr. Dennis Sepulveda performed
Fig. 4. Cumulative frequency distribution of United States, Tibetan, and Aymara hemoglobinconcentrations. A: Males. B: Females.
398 C.M. BEALL ET AL.
some of the Bolivian anthropometry andinterviews. Ms. Linda Bowman and Ms.Judy Miniun performed laboratory analysesin Cleveland.
LITERATURE CITED
Adams WH, and Shresta SM (1974) Hemoglobin levels,vitamin B12, and folate status in a Himalayan village.Am. J. Clin. Nutr. 27:217–219.
Adams WH, and Strang LJ (1975) Hemoglobin levels inpersons of Tibetan ancestry living at high altitude.Proc. Soc. Exp. Biol. Med. 149:1036–1039.
Beall CM, Goldstein MC (1990) Hemoglobin concentra-tion, percent oxygen saturation and arterial oxygencontent of Tibetan nomads at 4,850 to 5,460 meters. InJR Sutton, G Coates, and JE Remmers (eds.): Hyp-oxia: The Adaptations. Toronto, British Columbia: C.Decker, Inc., pp. 59–65.
Beall CM, and Reichsman AB (1984) Hemoglobin levelsin a Himalayan high altitude population. Am. J. Phys.Anthropol. 63:301–306.
Beall CM, Goldstein MC, and Tibet Academy of SocialSciences (1987) Hemoglobin concentration of pastoralnomads permanently resident at 4,850–5,450 metersin Tibet. Am. J. Phys. Anthropol. 73:433–438.
Beall CM, Brittenham GM, Macuaga F, and Barragan M(1990) Variation in hemoglobin concentration among
samples of high-altitude natives in the Andes and theHimalayas. Am. J. Hum. Biol. 2:639–651.
Beall CM, Blangero J, Williams-Blangero S, and Gold-stein MC (1994) A major gene for percent of oxygensaturation of arterial hemoglobin in Tibetan highland-ers. Am. J. Phys. Anthropol. 95:271–276.
Beall CM, Strohl KP, Decker MJ, Blangero J, Williams-Blangero S, Almasy L, Worthman CM, Goldstein MC,Vargas E, Villena M, Soria R, Alarcon AM and Gonza-les C (1997) Ventilation and hypoxic ventilatory re-sponse of Tibetan and Aymara high altitude natives.Am. J. Phys. Anthropol. 104:427–447.
Beall CM, Almasy LA, Blangero J, Williams-Blangero S,Brittenham GM, Strohl KP, Decker M, Vargas E,Villena M, Soria R, Alarcon AM, and Gonzales C(1998) Percent oxygen saturation of arterial hemoglo-bin of Bolivian Aymara at 4,000 meters. Am. J. Phys.Anthropol. (submitted).
Bland JM, and Altman DG (1986) Statistical methodsfor assessing agreement between two methods ofclinical measurement. Lancet. 1:307–310.
Blangero J (1993) Statistical genetic approaches tohuman adaptability. Hum. Biol. 65:941–966.
Chakraborty R, Clench J, Ferrell RE, Barton SA, andSchull WJ (1983) Genetic components of variation ofred cell glycolytic intermediates at two altitudes amongthe South American Aymara. Ann. Hum. Biol. 10:174–184.
Fig. 4.
399TIBETAN AND AYMARA HEMOGLOBIN CONCENTRATION

Douglas CG, S. HJ, Henderson Y, and Schneider EC(1913) Physiological observations made on Pike’s Peak,Colorado with special reference to adaptation to lowbarometric pressures. Phil. Trans. R. Soc. London B203:185–318.
Expert Scientific Working Group (1985) Summary of areport on assessment of the iron nutritional status ofthe United States population. Am. J. Clin. Nutr.42:1318–1330.
Groves BM, Droma T, Sutton JR, McCullough RG,Cullough RE, Zhuang J, Rapmun G, Sun S, Janes C,and Moore LG (1993) Minimal hypoxic pulmonaryhypertension in normal Tibetans at 3,658 m. J. Appl.Physiol. 74:312–318.
Hasstedt SJ (1989) Pedigree Analysis Package. SaltLake City: Department of Human Genetics, Univer-sity of Utah.
Looker AC, Gunter EW, and Johnson CL (1995) Methodsto assess iron status in various NHANES surveys.Nutr. Rev. 53:246–254.
Moreno-Black G, Quinn V, Haas J, Franklin J, andBeard J (1984) The distribution of haemoglobin concen-tration in a sample of native high-altitude women.Ann. Hum. Biol. 11:317–325.
Norboo T, Yahya M, Bruce NG, Heady JA, and Ball KP(1991) Domestic pollution and respiratory illness in aHimalayan village. Int. J. Epidemiol. 20:749–757.
Perusse L, Leblanc C, Tremblay A, Allard C, TheriaultG, Landry F, Talbot J, and Bouchard C (1987) Familialaggregation in physical fitness, coronary heart dis-ease risk factors, and pulmonary function measure-ments. Prev. Med. 16:607–615.
Ramirez G, Bittle PA, Colice GL, Herrera R, Agosti SJ,and Foulis PR (1991) The effect of cigarette smokingupon hematological adaptations to moderately highaltitude living. J. Wilderness Med. 2:274–286.
Sun SF, Droma TS, Zhuang JG, Tao JX, Huang SY,
McCullough RG, McCullough RE, Reeves CS, ReevesJR, and Moore LG (1990) Greater maximal O2 up-takes and vital capacities in Tibetan than Han resi-dents of Lhasa. Resp. Physiol. 79:151–162.
U.S. Department of Health and Human Services (DHHS)(1996a) Third National Health and Nutrition Exami-nation Survey, 1988–1994, NHANES III ExaminationData File (CD-ROM). Public Use Data File Documen-tation Number 76200. Hyattsville, MD: Centers forDisease Control and Prevention.
U.S. Department of Health and Human Services (1996b)Third National Health and Nutrition ExaminationSurvey, 1988–1994, NHANES III Household AdultData File (CD-ROM). Public Use Data File Documen-tation Number 76200. Hyattsville, MD: Centers forDisease Control and Prevention.
U.S. Department of Health and Human Services (1996c)Third National Health and Nutrition ExaminationSurvey, 1988–1994, NHANES III Laboratory DataFile (CD-ROM). Public Use Data File DocumentationNumber 76200. Hyattsville, MD: Centers for DiseaseControl and Prevention.
West JB (ed.). (1981). High Altitude Physiology: Bench-mark Papers in Human Physiology. Stroudsburg, PA:Hutchinson Ross Publishers.
Whitfield JB, and Martin NG (1985) Genetic and environ-mental influences on the size and number of cells inthe blood. Gen. Epidemiol. 2:133–144.
Winslow RM, and Monge C (1987) Hypoxia, Polycythe-mia, and Chronic Mountain Sickness. Baltimore: TheJohns Hopkins University Press.
Zhuang J, Droma T, Sun S, Janes C, McCullough RE,McCullough RG, Cymerman A, Huang SY, Reeves JT,and Moore LG (1993) Hypoxic ventilatory responsive-ness in Tibetan compared with Han residents of 3,658m. J. Appl. Physiol. 74:303–311.
400 C.M. BEALL ET AL.