Short but catching up: Statural growth among native Amazonian Bolivian children
12
Original Research Article Short but Catching Up: Statural Growth Among Native Amazonian Bolivian Children RICARDO GODOY, 1 * COLLEEN NYBERG, 2 DAN T.A. EISENBERG, 2 OYUNBILEG MAGVANJAV, 1 ELIEZER SHINNAR, 1 WILLIAM R. LEONARD, 2 CLARENCE GRAVLEE, 3 VICTORIA REYES-GARCI ´ A, 1,4 THOMAS W. MCDADE, 2 TOMA ´ S HUANCA, 5 AND SUSAN TANNER 6 ; AND BOLIVIAN TAPS STUDY TEAM 7 1 Heller School, Brandeis University, Waltham, Massachusetts 2 Department of Anthropology, Northwestern University, Evanston, Illinois 3 Department of Anthropology, University of Florida, Gainesville, Florida 4 ICREA and Institut de Cie `ncia i Tecnologia Ambientals, Universitat Auto `noma de Barcelona, Bellatera, Barcelona, Spain 5 CBIDSI-Centro Boliviano de Investigacio ´n y Desarrollo Socio Integral, Correo Central, San Borja, Beni, Bolivia 6 Department of Anthropology, University of Georgia, Athens, Georgia 7 Tsimane’ Amazonian Panel Study, Correo Central, San Borja, Beni, Bolivia ABSTRACT The ubiquity and consequences of childhood growth stunting (<22 SD in height-for-age Z score, HAZ) in rural areas of low-income nations has galvanized research into the reversibility of stunting, but the shortage of panel data has hindered progress. Using panel data from a native Amazonian society of foragers-farmers in Bolivia (Tsi- mane’), we estimate rates of catch-up growth for stunted children. One hundred forty-six girls and 158 boys 2 age 7 were measured annually during 2002–2006. Annual D height in cm and in HAZ were regressed separately against base- line stunting and control variables related to attributes of the child, mother, household, and village. Children stunted at baseline had catch-up growth rates 0.11 SD/year higher than their nonstunted age and sex peers, with a higher rate among children farther from towns. The rate of catch up did not differ by the child’s sex. A 10% rise in household income and an additional younger sibling lowered by 0.16 SD/year and 0.53 SD/year the rate of growth. Results were weaker when measuring D height in cm rather than in HAZ. Possible reasons for catch-up growth include (a) omitted variable bias, (b) parental reallocation of resources to redress growth faltering, particularly if parents perceive the benefits of redressing growth faltering for child school achievement, and (c) developmental plasticity during this period when growth rates are most rapid and linear growth trajectories have not yet canalized. Am. J. Hum. Biol. 22:336–347, 2010. ' 2009 Wiley-Liss, Inc. Childhood growth stunting—or being two standard deviations (SD) below the median height of one’s age and sex peers in the USA—is widespread in rural areas of low- income nations, with recent estimates suggesting that as many as 147 million children are growth stunted (de Onis et al., 2000; Engle et al., 2007; Grantham-McGregor et al., 2007; Ricci et al., 2006; Walker et al., 2007a). Childhood growth stunting is a concern in public health because childhood growth stunting is associated with poorer cogni- tive performance (Pollitt et al., 1995) and with higher morbidity (Fernald and Neufeld, 2007; Hoffman et al., 2000, 2007; Schroeder et al., 1999; Victora et al., 2001; Walker et al., 2001) and because stunted children might end up as stunted adults (Coly et al., 2006; Haas et al., 1995; Liu et al., 2000). Because adult height bears a posi- tive association with many indictors of adult well-being, such as occupation, income, wages, and longevity (Bogin and Keep, 1999; Case and Paxson, 2006; Komlos, 1994; Pollitt et al., 1995; Steckel and Rose, 2002), estimating rates of catch-up growth and identifying their determi- nants matter not just for the well-being of children, but also for their well-being in adulthood and old age. As several researchers have noted (Baker et al., 2009; Lampl and Thompson, 2007; Simondon et al., 1998; Walker et al., 2007b), empirical studies of catch-up growth in rural areas of low-income nations are rare owing to the paucity of panel data (Adair, 1999; Cameron et al., 2005a; Martorell et al., 1994a). So far, researchers have found mixed evidence for catch-up growth. Some researchers have found that stunting (particularly among children age 2) is irreversible (Cameron et al., 2005b; Gray et al., 2008; Kalanda et al., 2005; Leonard et al., 1995; Martorell et al., 1994b); once short, always short. However, other researchers have found evidence for catch-up growth (Adair, 1999; Cameron et al., 2005a; Khatun et al., 2004; Simondon et al., 1998). In a recent article in this journal, Cameron et al. (2005a) argued that the use of year-to-year D in height- for-age Z score (hereafter height Z score or simply Z score) provides more precise and meaningful estimates of catch- up growth rates than do estimates based on year-to-year D in raw values of physical stature (e.g., cm). Estimates of height D based on raw measures vary with age and depend on the ratio of height SD at baseline and follow up. The use of raw measures makes it hard to separate growth rate proper from regression to the mean. Z scores allow one to control for large differences in absolute growth rates over different ages (Baumgartner et al., 1986; Tanner and Davies, 1985). Further, estimates of growth rates based on raw measures leave unanswered how growth rates in one locality compare with the growth rate of a control group. Cameron et al. go on to argue that Grant sponsor: The Cultural and Physical Anthropology Programs of NSF *Correspondence to: Ricardo Godoy, Heller School for Social Policy and Management, Brandeis University, Waltham, MA 02454-9110, USA. E-mail: [email protected] Received 10 March 2009; Revision received 7 August 2009; Accepted 8 August 2009 DOI 10.1002/ajhb.20996 Published online 20 October 2009 in Wiley InterScience (www. interscience.wiley.com). AMERICAN JOURNAL OF HUMAN BIOLOGY 22:336–347 (2010) V V C 2009 Wiley-Liss, Inc.
Transcript of Short but catching up: Statural growth among native Amazonian Bolivian children
Original Research Article
Short but Catching Up: Statural Growth Among Native Amazonian BolivianChildren
RICARDO GODOY,1* COLLEEN NYBERG,2 DAN T.A. EISENBERG,2 OYUNBILEGMAGVANJAV,1 ELIEZER SHINNAR,1
WILLIAM R. LEONARD,2 CLARENCE GRAVLEE,3 VICTORIA REYES-GARCIA,1,4 THOMASW. MCDADE,2 TOMAS HUANCA,5
AND SUSAN TANNER6; AND BOLIVIAN TAPS STUDY TEAM7
1Heller School, Brandeis University, Waltham, Massachusetts2Department of Anthropology, Northwestern University, Evanston, Illinois3Department of Anthropology, University of Florida, Gainesville, Florida4ICREA and Institut de Ciencia i Tecnologia Ambientals, Universitat Autonoma de Barcelona, Bellatera, Barcelona, Spain5CBIDSI-Centro Boliviano de Investigacion y Desarrollo Socio Integral, Correo Central, San Borja, Beni, Bolivia6Department of Anthropology, University of Georgia, Athens, Georgia7Tsimane’ Amazonian Panel Study, Correo Central, San Borja, Beni, Bolivia
ABSTRACT The ubiquity and consequences of childhood growth stunting (<22 SD in height-for-age Z score, HAZ)in rural areas of low-income nations has galvanized research into the reversibility of stunting, but the shortage of paneldata has hindered progress. Using panel data from a native Amazonian society of foragers-farmers in Bolivia (Tsi-mane’), we estimate rates of catch-up growth for stunted children. One hundred forty-six girls and 158 boys 2 � age � 7were measured annually during 2002–2006. Annual D height in cm and in HAZ were regressed separately against base-line stunting and control variables related to attributes of the child, mother, household, and village. Children stunted atbaseline had catch-up growth rates 0.11 SD/year higher than their nonstunted age and sex peers, with a higher rateamong children farther from towns. The rate of catch up did not differ by the child’s sex. A 10% rise in household incomeand an additional younger sibling lowered by 0.16 SD/year and 0.53 SD/year the rate of growth. Results were weakerwhen measuring D height in cm rather than in HAZ. Possible reasons for catch-up growth include (a) omitted variablebias, (b) parental reallocation of resources to redress growth faltering, particularly if parents perceive the benefits ofredressing growth faltering for child school achievement, and (c) developmental plasticity during this period whengrowth rates are most rapid and linear growth trajectories have not yet canalized. Am. J. Hum. Biol. 22:336–347,2010. ' 2009 Wiley-Liss, Inc.
Childhood growth stunting—or being two standarddeviations (SD) below the median height of one’s age andsex peers in the USA—is widespread in rural areas of low-income nations, with recent estimates suggesting that asmany as 147 million children are growth stunted (de Oniset al., 2000; Engle et al., 2007; Grantham-McGregor et al.,2007; Ricci et al., 2006; Walker et al., 2007a). Childhoodgrowth stunting is a concern in public health becausechildhood growth stunting is associated with poorer cogni-tive performance (Pollitt et al., 1995) and with highermorbidity (Fernald and Neufeld, 2007; Hoffman et al.,2000, 2007; Schroeder et al., 1999; Victora et al., 2001;Walker et al., 2001) and because stunted children mightend up as stunted adults (Coly et al., 2006; Haas et al.,1995; Liu et al., 2000). Because adult height bears a posi-tive association with many indictors of adult well-being,such as occupation, income, wages, and longevity (Boginand Keep, 1999; Case and Paxson, 2006; Komlos, 1994;Pollitt et al., 1995; Steckel and Rose, 2002), estimatingrates of catch-up growth and identifying their determi-nants matter not just for the well-being of children, butalso for their well-being in adulthood and old age.As several researchers have noted (Baker et al., 2009;
Lampl and Thompson, 2007; Simondon et al., 1998;Walker et al., 2007b), empirical studies of catch-up growthin rural areas of low-income nations are rare owing to thepaucity of panel data (Adair, 1999; Cameron et al., 2005a;Martorell et al., 1994a). So far, researchers have foundmixed evidence for catch-up growth. Some researchershave found that stunting (particularly among children �age 2) is irreversible (Cameron et al., 2005b; Gray et al.,
2008; Kalanda et al., 2005; Leonard et al., 1995; Martorellet al., 1994b); once short, always short. However, otherresearchers have found evidence for catch-up growth(Adair, 1999; Cameron et al., 2005a; Khatun et al., 2004;Simondon et al., 1998).In a recent article in this journal, Cameron et al.
(2005a) argued that the use of year-to-year D in height-for-age Z score (hereafter height Z score or simply Z score)provides more precise and meaningful estimates of catch-up growth rates than do estimates based on year-to-year Din raw values of physical stature (e.g., cm). Estimates ofheight D based on raw measures vary with age anddepend on the ratio of height SD at baseline and followup. The use of raw measures makes it hard to separategrowth rate proper from regression to the mean. Z scoresallow one to control for large differences in absolutegrowth rates over different ages (Baumgartner et al.,1986; Tanner and Davies, 1985). Further, estimates ofgrowth rates based on raw measures leave unansweredhow growth rates in one locality compare with the growthrate of a control group. Cameron et al. go on to argue that
Grant sponsor: The Cultural and Physical Anthropology Programs ofNSF
*Correspondence to: Ricardo Godoy, Heller School for Social Policy andManagement, Brandeis University, Waltham, MA 02454-9110, USA.E-mail: [email protected]
Received 10 March 2009; Revision received 7 August 2009; Accepted 8August 2009
DOI 10.1002/ajhb.20996
Published online 20 October 2009 in Wiley InterScience (www.interscience.wiley.com).
AMERICAN JOURNAL OF HUMAN BIOLOGY 22:336–347 (2010)
VVC 2009 Wiley-Liss, Inc.
one possible reason for the weak evidence of catch-upgrowth might reflect the use of raw measures of height toestimate growth rates. For instance, the study in the Phil-ippines (Adair, 1999) used Z scores and found evidence ofcatch up growth, but the study in rural Guatemala (Mar-torell et al., 1994b) used raw measures of height and didnot find evidence of catch-up growth. The existence ofcatch-up growth likely reflects not just how one measuresthe rate of change in height, but also the easing of socioe-conomic constraints that initially restricted child growth(Martorell et al., 1994b).
The purpose of this study is to contribute to the empiri-cal literature on the existence and possible causes ofcatch-up growth in rural areas of low-income nations byusing a new panel dataset consisting of five consecutiveannual anthropometric measures and socioeconomic sur-veys done during 2002–2006 in a society of foragers andfarmers in the Bolivian Amazon (Tsimane’). We aim toachieve three goals.
First, we estimate year-to-year D in the standing physi-cal stature of children who were 2 � age � 7 at baseline(2002) and who were followed annually over the next fiveconsecutive years. Second, we estimate growth rates usingboth raw measures of height and height Z scores to ensurethat the main conclusions about catch-up growth do nothinge on how one defines growth. Third, we test hypothe-ses (described later) about determinants and patterns ofcatch-up growth.
In particular, we test the hypothesis that in a tradi-tional, highly endogamous rural society with high rates oftime preference or impatience (Godoy et al., 2004; Kirbyet al., 2002) in which adult height confers few advantagesand in which adult stunting imposes few private costs oncanonical indicators of socioeconomic well-being, weshould see little evidence of catch-up growth. In such asetting, parents will not likely perceive now the futurebenefits of currently redressing growth faltering for theirchildren. Studies have shown cross-cultural variability inhow parents view child growth and appropriate size, andwhether stunting might be a problem worth correcting(Jahn and Aslam, 1995; Reifsnider et al., 2000; for areview, see Lucas et al., 2007); in some cases, parents mayperceive stunting as hereditary and therefore beyondtheir control (Reifsnider et al., 2000). As societies andeconomies modernize, people will likely perceive theheight premium and stunting penalties as more importantin part because in industrial societies height correlatespositively with many desirable indicators of adult wellbeing.
Thus, modernization should be associated with lessgrowth faltering chiefly because it will do one or more ofthe following: (a) change parental values about childgrowth, (b) result in better dietary intake and reduce theburden of infectious disease, and (c) enhance parentalunderstanding of the link between diet, health, and childgrowth from public health campaigns in industrial soci-eties. The hypothesis is consistent with the prevailingview in public health that child growth faltering reflectspoor socioeconomic conditions (Engle et al., 2007), butadds parental values and expectations about the future asa mediating path.
We define ‘‘catch-up growth’’ as the difference in theyear-to-year D in height or growth rate in height betweenchildren who were stunted at baseline and children whowere not stunted at baseline. If stunted children exhibit a
higher growth velocity, then they should be catching up tothe reference group, though it is an open question howmany years would have to elapse before stunted childrencould catch up; it is possible that with a low rate ofgrowth, stunted children might never catch up by the endof the growth period. The improvements in growth statusevaluated in this study do not reach the clinical definitionof significant catch up growth, defined as a change in Z-score of 0.67 within the first 2 years of life (Ong et al.,2000). Nor do these conditions meet the designation ofCameron’s (2007) ‘‘unexpectedly rapid catch-up growth,’’which implies a mismatch between exhibited growth andgenetic potential. Rather, here we explore the potential forrecovery from stunting under conditions of chronic infec-tion and marginal nutrition, a situation that is less easilyinterpreted, but may represent more common scenario inlow-income nations or in those populations at the earlieststages of transition to a market economy.
HYPOTHESES AND THEIR RATIONALE
Hypothesis 1
Catch-up growth until the age of 10 will not likely takeplace in this population because prior research among theTsimane’ using cross-sectional data suggests that stuntingis widespread throughout the lifecycle (Foster et al., 2005;Godoy et al., 2005) and that it affects 45% of children 2- to10-years-old (McDade et al., 2007). This hypothesis is inline with our thinking that catch-up growth will mostlikely take place only when traditional rural societiesmodernize, a transition that is just beginning to take placeamong the Tsimane’. Also, the hypothesis fits with thecase studies cited in the previous section documenting anabsence of catch up growth in rural areas of low-incomenations such as Guatemala.
Hypothesis 2
If catch-up growth takes place, it will be more likely totake place in communities nearer to market townsbecause these communities will be most likely to haveaccess to modern health facilities and to be modernizing.
Hypothesis 3
Catch-up growth rates will be similar for girls and forboys because prior research based on a short panel (�4–5consecutive quarters, 2002–2003) among the Tsimane’suggests little evidence of girl-boy disparities in a widerange of well-being indicators (Godoy et al., 2006b,2007b), including parasite infections (Tanner, 2005) andanthropometric measures of short-run and long-run nutri-tional status (Godoy et al., 2006b).
THE TSIMANE’: SETTING AND PRELIMINARY FINDINGS
Setting
The Tsimane’ are a native Amazonian society of farmersand foragers in the department of Beni, Bolivia. Theynumber �8,000 people and have been in sporadic expo-sure to Westerners since the early 1950s (Huanca, 2008).Like many native Amazonian societies, Tsimane’ practicehunting, fishing, plant collection, and slash-and-burnagriculture (Vadez et al., 2004). Tsimane’ live in small vil-lages of �20 households (�6 people/household) and prac-tice preferential cross-cousin marriage. The last five dec-
337SHORT BUT CATCHING UP
American Journal of Human Biology
ades have seen the spread of modern health care facilitiesand a secular decline in adult mortality (Gurven et al.,2007), but no secular change in adult standing physicalstature (Godoy et al., 2006a) or in infant and child mortal-ity (Gurven et al., 2007).In a recent article, we show that during 2002–2006 Tsi-
mane’ adults experienced significant improvements inmany indicators of well-being (Godoy et al., 2009b). Forexample, during 2002–2006 Tsimane’ adults experiencedan annual growth in BMI of 0.71% after controlling formany covariates. During the last year of observation(2006), men and nonpregnant women in the sample hadan average BMI of 23.56 and 23.69, respectively. Giventhese BMI values, higher levels of BMI indicated bettershort-run nutritional status. The annual growth rate inBMI of 0.71% implies that, if continued and if all elseremains constant, in a decade, on average, Tsimane’ menwill have a BMI of 25.29 and Tsimane’ women will have aBMI of 25.43, near the upper limit of the range of recentrecommendations of a healthy BMI (Brabec et al., 2007).On the negative side, the years 2002–2006 saw anincrease in the self-reported number of ailments duringthe 2 weeks before the day of the interview (17.35%/year).The most common ailments include gastrointestinal andrespiratory infections, particularly parasitic infections(Byron 2003; Tanner, 2005).
Preliminary findings from research in progress
The most important published findings from ourresearch that bear directly on this article include: (a) likeother native Amazonian societies (Blackwell et al., 2009;Godoy et al., 2005). Tsimane’ have high rates of childhoodgrowth stunting (Foster et al., 2005; McDade et al., 2007),owing partly to the pervasiveness of parasite infectionsand immune activation (McDade et al., 2005; Tanner,2005), (b) no strong evidence of disparities in anthropo-metric indicators of short-run or long-run nutritional sta-tus, perceived health, or modern human capital betweengirls and boys 2–13 years of age (Godoy et al., 2006b), (c)positive but weak associations between local knowledge ofplants and the health of children or adults (McDade et al.,2007; Reyes-Garcıa et al., 2007b), (d) high levels of eco-nomic self-sufficiency (Godoy et al., 2007a) yet some varia-tion in market exposure, and (e) responsiveness of adultand child height to weather perturbations that took placeduring gestation or during the first years of life (Godoyet al., 2008a,b).
MATERIALS AND VARIABLES
Materials
We use a panel composed of five consecutive years of an-nual observations (2002–2006). The panel follows 962females and 1,033 males of all ages from all households(n 5 331) in 13 Tsimane’ villages (Leonard and Godoy,2008) (The complete data and its documentation, alongwith publications from the Tsimane’ Amazonian PanelStudy (TAPS) project, are available for public use at thefollowing address: http://people.brandeis.edu/�rgodoy/).We spent 1995–2001 doing background studies among theTsimane’ to identify villages for the panel study, to gainthe trust of study participants, and to refine methods ofdata collection.
We selected the 13 villages to capture geographic varia-tion in closeness to the market town of San Borja (mean 525.96 km; SD 5 16.70), the only town along the ManiquiRiver. In capturing variation in distance to the markettown we tried to capture variation in market exposure ormodernization, which likely affects the growth rate ofchild height (Hypothesis no. 2).The 13 villages of the panel study are representative of
other Tsimane’ villages in child height. In 2000, as part ofthe background studies, we conducted research in 59 Tsi-mane’ villages and took anthropometric measures of chil-dren; the 13 villages of the current panel study formedpart of the 59 villages surveyed in 2000. Using data fromthe 2000 survey, we computed the height Z score using thenorms from the National Center for Health Statistics(NCHS), USA (Hamill et al., 1979), for children in the 13villages of the panel study (n 5 88) and for children in theother 46 villages (n 5 377). Children in the 13 villages ofthe panel study had an average height Z score of 21.79(SD 5 1.53), compared with the children in the other vil-lages, who had a height Z score of 21.63 (SD 5 1.78). Atwo-sided t-test for the equality of the two means pro-duced a t-statistic of 0.79 (P 5 0.42).The panel includes 1,995 people, but the sample used
here contains individual and household-level data for 146girls and 158 boys 2 � age � 7 during the baseline year(2002). When tracked over five consecutive years, thesechildren were between 7 and 12 years old at the end of thestudy period (2006). We limit the analysis to children whowere at least 2 years of age at the start of the study and nomore than 12 years of age by the end of the 5 years of ob-servation to ensure that puberty did not affect the esti-mates of growth rates in height. Byron (2003) found thatTsimane’ girls reach menarche by 12–13 years of age, solimiting the study to children before they reached pubertyallows us to obtain more precise estimates of catch-upgrowth for these young children. One problem with theupper age bracket chosen has to do with the timing of pre-menarche height velocity. If Tsimane’ girls reach men-arche by the age of 12–13, then their peak height velocitywill likely take between 10–12 and 11–13 years of age.Furthermore, in additional analysis, we show that exclud-ing girls aged 10–12 years affects the estimates of annualgrowth rates. Thus, to address these concerns, we alsoestimate catch-up growth rates for children below 10years of age.Of the 304 children 2 � age � 7 measured at baseline,
72.37% were present during all five surveys. About 7%(6.25%) were present during only the first survey, 6.25%were present during only two surveys, 2.63% were presentduring only three surveys, and 12.50% were present dur-ing four surveys. In the sensitivity analysis, we control forattrition bias by adding the variable count or the numberof surveys in which the child was present to the mainregressions. If attrition is systematic and related to boththe growth rate and to baseline stunting, then the addi-tion of the count variable should change the parameterestimate of the variable for baseline stunting.We collected annual data during visits to the village
lasting 5–7 consecutive days. We reserved most of thosedays for interviews, but we also set aside 1 day to take an-thropometric measures from all study participants in thevillage school. Interviews lasted about 1 h/adult and usu-ally took place in the home of the participant. Reported in-formation about children came from the child’s principal
338 R. GODOY ET AL.
American Journal of Human Biology

caretaker (typically the mother). Four Bolivian universitygraduates conducted the surveys and took anthropometricmeasures and four Tsimane’ who worked in the panelstudy from its inception served as translators.
Variables: height and age
We used the protocol of Lohman et al. (1988) to measureheight. We recorded standing physical stature (cm) to thenearest millimeter using a portable stadiometer.
We found evidence of rounding error or digit heaping inheight measures. Rounding error is a type of random mea-surement error because some measures will be roundedup and other measures will be rounded down. If measuredaccurately, the last digits of measured height should havebeen evenly distributed among the 10 digits. That is,�10% of the last digits should have been zeros, another10% should have been ones, and so on. Instead, measuresof height ending in the digit zero accounted for 20.44% ofobservations among girls and for 17.80% of observationsamong boys. We did not correct for digit heaping to retainfidelity to the raw data, but later discuss the consequencesof random measurement error for the inferences madeabout the rate of growth.
We asked the child’s principal caretaker to report theage of the child each year of the survey. Some parents hadbirth certificates or reported the exact child’s birth date,but other parents did not know the exact birth date andestimated (or guessed) the age in years.
We used the age and height data to estimate age andsex-standardized height Z scores following NCHS stand-ards (Hamill et al., 1979; WHO, 1995). We use NCHSstandards rather than the WHO growth standard becausethe latter apply only to children <5 years of age; beyond 5years of age, the recommendations are to continue to relyon the NCHS data that we use.
Control variables
Multivariable models of child statural growth controlfor three broad related vectors of variables: (1) childattributes, (2) maternal attributes, including conditionsbefore and during pregnancy, and (3) household and com-munity socioeconomic and demographic attributes atbaseline and during the period of child growth. In theregression analysis we condition for these three vectors ofvariables, described next.
Child attributes. These include variables such as sex, age,birth date (Fernald and Neufeld, 2007), birth season(Kalanda et al., 2005; Prentice and Cole, 1994), birth order(Adair, 1999; Baker et al., 2009), morbidity (Martorellet al., 1995; Stein et al., 2004), and lagged weight (Eck-hardt et al., 2005; Maleta et al., 2003). We do not havedata on birth order proper. Rather, we estimate the child’sage rank among the children living in the household.
Maternal attributes. These include variables such as cur-rent age (Baker et al., 2009; Eckhardt et al., 2005; Fernaldand Neufeld, 2007), schooling (Fernald and Neufeld, 2007;Grantham-McGregor et al., 2007; Kalanda et al., 2005;McDade et al., 2007), morbidity (Kalanda et al., 2005),and frequency of stress and stress-related behaviors(Grantham-McGregor et al., 2007; Gray et al., 2008).
Households and communities. Child growth responds tohousehold demographics (e.g., number of children oryounger children (Adair, 1999) and total household size(Fernald and Neufeld, 2007)), levels and changes of house-hold income and wealth (Adair, 1999; Grantham-McGregor et al., 2007), price of food and medicines, and di-etary intake (particularly proteins and energy-rich foods)(Baker et al., 2009; Eckhardt et al., 2005; Grantham-McGregor et al., 2007; Kain et al., 2005; Leonard et al.,1995, 2000; Stein et al., 2004). We control for community-level variables (e.g., prices) by using a full set of dummyvariables for villages (n 5 13 2 1 5 12). The appendix con-tains a description of the control variables.
ANALYSIS
The analysis unfolds in two sequential, linked phases.To set the stage, we first provide descriptive and visualanalysis of growth in height for each sex separately. Sec-ond, we estimate the effects of baseline stunting ongrowth rates using panel linear multiple regressions withindividual random effects, clustering by child, and withrobust standard errors. The regression includes year-to-year D in HAZ as an outcome; as explanatory variables weinclude baseline stunting measured as a dichotomousvariable and all the covariates described in the previoussection. We ran five different types of regressions, eachwith and without a full set of village dummy variables: (I)only baseline stunting, (II) child attributes added to (I),(III) mother’s attributes added to (I), (IV) household socio-economic attributes added to (I), and (V) a full model withbaseline stunting and attributes of the child, mother, andhousehold (II–IV). For the statistical analysis we usedStata for Windows, version 10 (Stata Corporation, CollegeStation, TX).
RESULTS
Descriptive analysis
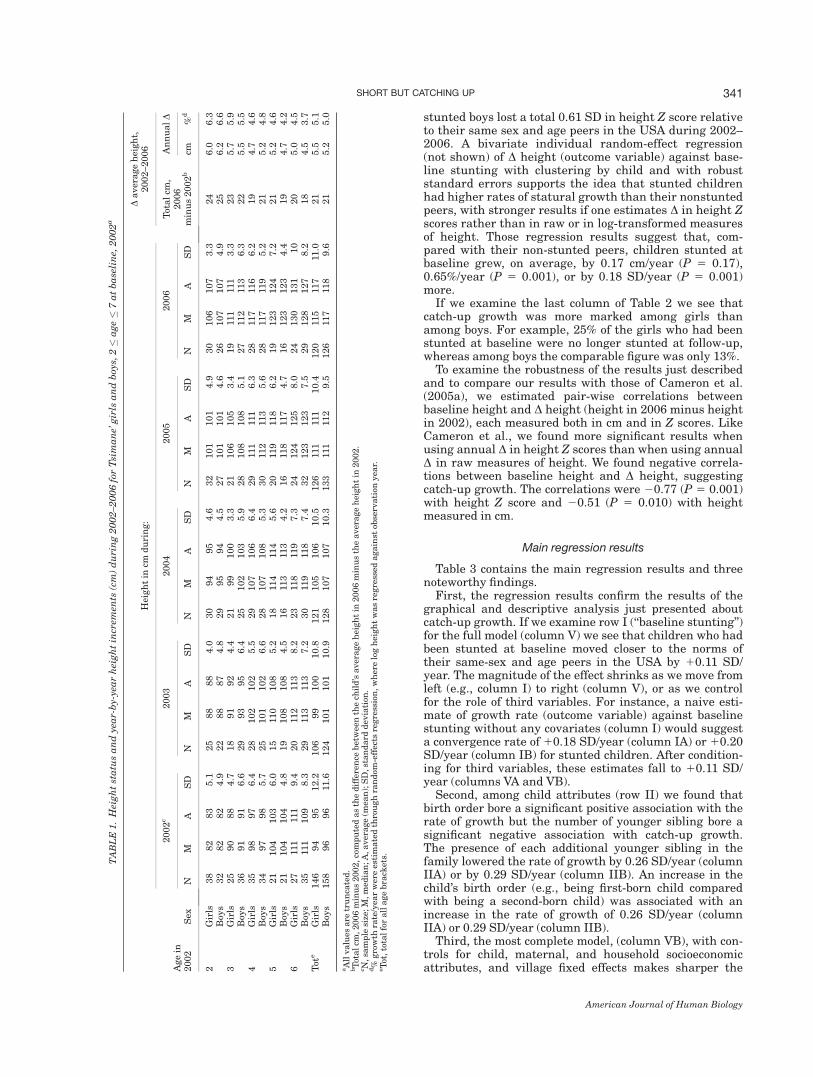
Figure 1 and Table 1 suggest three points: (a) girls andboys resembled each other in height at baseline, (b) girlsgrew at slightly higher rates than boys, and (c) girls andboys by 2006 had gained about the same height.At baseline (Table 1, column ‘‘2002, A’’), girls and boys of
the same age had similar heights. The last two columns ofTable 1 suggest that during 2002–2006, girls had slightlyhigher annual growth rates in height than boys. Two-sided t-test of growth rates by the child’s sex suggests thatgirls grew by 5.51 cm/year in height (SD 5 2.26) whileboys grew by 5.13 cm/year in height (SD 5 2.26); the dif-ference in favor of girls (0.37 cm/year), though small, wasstatistically significant (t 5 2.53, P 5 0.011). Expressed asa %D/year, girls grew by 5.24%/year (SD 5 0.23) whileboys grew by 4.85%/year (SD 5 0.23; t 5 2.48, P 5 0.013).(The growth rates in cm/year and %/year reported in thisparagraph differ slightly from the growth rates in Table 1because the growth rates reported in the paragraph arebased on the pooled sample in a two-sided t-test).In Table 1, the column ‘‘total cm’’ suggests that by the
end of the 5 years, girls and boys had gained, on average,about the same height. Depending on the age at baseline,during 2002–2006 girls had gained a total of 21.4 cm(range: 19–24, SD 5 3.7) when compared with boys whohad gained 21.0 cm (range: 18–25, SD 5 3.6).
339SHORT BUT CATCHING UP
American Journal of Human Biology

Figure 2 and the last two columns of Table 1 (‘‘AnnualD’’) suggest that growth rates were highest for the young-est (and also shortest) children. Growth rates declinedwith baseline age, from 6.0–6.2 cm/year or 6.3–6.6%/yearamong children who were 2 years of age at baseline to 4.5–5.0 cm/year or 3.7–4.5%/year among children who were 6years of age at baseline. A random-effect linear panelregression (not shown) with D cm in height as an outcomeand age as an explanatory variable suggests that over the5 years of observations, each additional year of age wasassociated with a decline in the growth rate of height of0.06 cm/year (z 5 1.71, P 5 0.088), equivalent to 0.33%/year. The velocities at this stage of development are age-dependent, but compare well with reference data from theUSA (Baumgartner et al., 1986; Tanner and Davies, 1985)Table 2 and Figure 3 show year-by-year D in height Z
scores for the entire sample and for stunted and for non-stunted girls and boys separately. Relative to their peers
in the USA, Tsimane’ girls and boys converged to the USAnorm, but, at least for the pooled sample, the rate of catch-up was low. The column ‘‘Total HAZ’’ suggests that thetotal change in height Z score between 2002 and 2006 forgirls and for boys was for the most part positive, but small.Between 2002 and 2006, the average Tsimane’ girl gotcloser in height to her same-age and same-sex peers in theUSA by 0.02 SD in height Z score, while the average boygot closer to his same-age peers in the USA by 0.03 SD inheight Z score.The change in height Z score between 2002 and 2006
was larger among stunted children than among non-stunted children. Table 2 (column ‘‘Total HAZ’’) suggeststhat whereas stunted girls and boys converged to theUSA norms or gained, on average, a total of 0.49 SD(girls) and 0.45 SD (boys) in height Z score during 2002–2006, nonstunted girls and boys diverged from USAnorms. Nonstunted girls lost a total of 0.35 SD and non-
Fig. 2. Annual change in height during 2002–2006 for Tsimane’ children, 2 � age � 7, at baseline, 2002, measured annually during 2002–2006. [Color figure can be viewed in the online issue, which is available at www.interscience.wiley.com.]
Fig. 1. Mean height (cm) for Tsimane’ girls and boys, 2 � age � 7 at baseline, 2002, measured annually during 2002–2006. [Color figure canbe viewed in the online issue, which is available at www.interscience.wiley.com.]
340 R. GODOY ET AL.
American Journal of Human Biology
stunted boys lost a total 0.61 SD in height Z score relativeto their same sex and age peers in the USA during 2002–2006. A bivariate individual random-effect regression(not shown) of D height (outcome variable) against base-line stunting with clustering by child and with robuststandard errors supports the idea that stunted childrenhad higher rates of statural growth than their nonstuntedpeers, with stronger results if one estimates D in height Zscores rather than in raw or in log-transformed measuresof height. Those regression results suggest that, com-pared with their non-stunted peers, children stunted atbaseline grew, on average, by 0.17 cm/year (P 5 0.17),0.65%/year (P 5 0.001), or by 0.18 SD/year (P 5 0.001)more.If we examine the last column of Table 2 we see that
catch-up growth was more marked among girls thanamong boys. For example, 25% of the girls who had beenstunted at baseline were no longer stunted at follow-up,whereas among boys the comparable figure was only 13%.To examine the robustness of the results just described
and to compare our results with those of Cameron et al.(2005a), we estimated pair-wise correlations betweenbaseline height and D height (height in 2006 minus heightin 2002), each measured both in cm and in Z scores. LikeCameron et al., we found more significant results whenusing annual D in height Z scores than when using annualD in raw measures of height. We found negative correla-tions between baseline height and D height, suggestingcatch-up growth. The correlations were 20.77 (P 5 0.001)with height Z score and 20.51 (P 5 0.010) with heightmeasured in cm.
Main regression results
Table 3 contains the main regression results and threenoteworthy findings.First, the regression results confirm the results of the
graphical and descriptive analysis just presented aboutcatch-up growth. If we examine row I (‘‘baseline stunting’’)for the full model (column V) we see that children who hadbeen stunted at baseline moved closer to the norms oftheir same-sex and age peers in the USA by 10.11 SD/year. The magnitude of the effect shrinks as we move fromleft (e.g., column I) to right (column V), or as we controlfor the role of third variables. For instance, a naive esti-mate of growth rate (outcome variable) against baselinestunting without any covariates (column I) would suggesta convergence rate of 10.18 SD/year (column IA) or 10.20SD/year (column IB) for stunted children. After condition-ing for third variables, these estimates fall to 10.11 SD/year (columns VA and VB).Second, among child attributes (row II) we found that
birth order bore a significant positive association with therate of growth but the number of younger sibling bore asignificant negative association with catch-up growth.The presence of each additional younger sibling in thefamily lowered the rate of growth by 0.26 SD/year (columnIIA) or by 0.29 SD/year (column IIB). An increase in thechild’s birth order (e.g., being first-born child comparedwith being a second-born child) was associated with anincrease in the rate of growth of 0.26 SD/year (columnIIA) or 0.29 SD/year (column IIB).Third, the most complete model, (column VB), with con-
trols for child, maternal, and household socioeconomicattributes, and village fixed effects makes sharper the
TABLE1.Heightstatusandyear-by-yearheightincrem
ents
(cm)during2002–2
006forTsimane’girls
andboy
s,2�
age�
7atbaseline,2002a
Agein
2002
Sex
Heightin
cmduring:
Daverageheight,
2002–2006
Totalcm
,2006
minus2002b
AnnualD
2002c
2003
2004
2005
2006
NM
ASD
NM
ASD
NM
ASD
NM
ASD
NM
ASD
cm%
d
2Girls
38
82
83
5.1
25
88
88
4.0
30
94
95
4.6
32
101
101
4.9
30
106
107
3.3
24
6.0
6.3
Boy
s32
82
82
4.9
22
88
87
4.8
29
95
94
4.5
27
101
101
4.6
26
107
107
4.9
25
6.2
6.6
3Girls
25
90
88
4.7
18
91
92
4.4
21
99
100
3.3
21
106
105
3.4
19
111
111
3.3
23
5.7
5.9
Boy
s36
91
91
6.6
29
93
95
6.4
25
102
103
5.9
28
108
108
5.1
27
112
113
6.3
22
5.5
5.5
4Girls
35
98
97
6.4
28
102
102
5.5
29
107
106
6.4
29
111
111
6.3
28
117
116
6.2
19
4.7
4.6
Boy
s34
97
98
5.7
25
101
102
6.6
28
107
108
5.3
30
112
113
5.6
28
117
119
5.2
21
5.2
4.8
5Girls
21
104
103
6.0
15
110
108
5.2
18
114
114
5.6
20
119
118
6.2
19
123
124
7.2
21
5.2
4.6
Boy
s21
104
104
4.8
19
108
108
4.5
16
113
113
4.2
16
118
117
4.7
16
123
123
4.4
19
4.7
4.2
6Girls
27
111
111
9.4
20
112
113
8.2
23
118
119
7.3
24
124
125
8.0
24
130
131
10
20
5.0
4.5
Boy
s35
111
109
8.3
29
113
113
7.2
30
119
118
7.4
32
123
123
7.5
29
128
127
8.2
18
4.5
3.7
Tot
eGirls
146
94
95
12.2
106
99
100
10.8
121
105
106
10.5
126
111
111
10.4
120
115
117
11.0
21
5.5
5.1
Boy
s158
96
96
11.6
124
101
101
10.9
128
107
107
10.3
133
111
112
9.5
126
117
118
9.6
21
5.2
5.0
aAllvalues
are
truncated.
bTotalcm
,2006minus2002,computedasthedifference
betwee
nthech
ild’saverageheightin
2006minustheaverageheightin
2002.
c N,sa
mple
size;M,med
ian;A,average(m
ean);SD,standard
dev
iation
.d%
growth
rate/yea
rwereestimatedthroughrandom
-effects
regression,wherelogheightwasregressed
against
observation
yea
r.eTot,totalforallagebrack
ets.
341SHORT BUT CATCHING UP
American Journal of Human Biology

results discussed so far but also suggests that householdmonetary income is associated with a lower rate ofgrowth. In the most complete model, we find that stuntedchildren had a growth rate 0.11 SD/year higher than thegrowth rate of nonstunted children. Higher birth ordercontinued to be positively associated with growth rate,with 0.30–0.55 SD/year higher growth rates for each stepup in birth order. Each additional younger child in ahousehold continued to suppress the growth rate in heightby 0.27 SD/year (column VA) or by 0.53 SD/year (columnVB). Monetary income bore a negative association withchild growth rate. Because we express income in naturallogarithms, the coefficients of column V imply that a 10%increase in monetary income is associated with a 0.10 SD/year reduction in the growth rate of height. The findingthat monetary income bears a negative association withstatural growth can probably be explained by changes inmonetary expenditures. Elsewhere (Godoy et al., 2007b)we show that as monetary income increases, Tsimane’allocate a greater share of their monetary income tohighly visible luxury items that signal individual prosper-ity and fitness to others in the community. If so, then it ispossible that with higher monetary income the share ofincome allocated to expenditures in nutritious fooddeclines because these expenditures are not visible toothers and do not bring prestige.
Sensitivity analysis
To test the robustness of the main results of the mostcomplex model, column VB, we did additional analysis,summarized in Table 4 and discussed next. Unless indi-cated otherwise, the regressions in Table 4 are identical tothe regression of column VB. For ease of comparison, inrow 1 of Table 4 we include the estimate of the growthrate of children stunted at baseline from regression VB(Table 3).We first added a variable (count) that captured the num-
ber of annual measures taken for a child (range: 1–5) (row2). We added the variable to assess whether attritionmight bias estimates of catch-up growth. The estimate forcatch-up growth did not change (0.11 SD/year) after condi-tioning for the frequency of survey participation. A two-sided t-test of height Z score in 2002 between those whoremained for at least two rounds and those who left per-manently after the first survey suggest no significant dif-ference in height. During 2002, (pre)-permanent attritershad a height Z score of 21.65 (SD 5 1.75) and childrenwho remained for at least two or more surveys had aheight Z score of21.73 (SD5 1.48; t5 0.324, P 5 0.745).In row 3, we show the results of a regression excluding
girls 10 years of age or older at the end of the study (2006)because they may have entered the premenarche growthacceleration phase during the period under study. Exclud-ing these girls lowered the rate of growth to 0.08 SD/year(P 5 0.042), still positive though slightly lower than theoriginal estimate of 0.11 SD/year.It is possible that catch-up growth might have reflected
favorable but idiosyncratic conditions of particular years.For instance, suppose that some years had enjoyed unusu-ally favorable weather, making it possible to forage andfarm more, and to suffer from less sickness. Then, the rateof growth would be affected by idiosyncratic events of par-ticular years. To condition for this confounder, we added afull set of dummy variables for all the years of the panel
TABLE2.Mea
nheight-for-ageZscore(H
AZ)andDHAZduring2002–2
006forTsimane’girls
andboy
s,2�
age�
7atbaseline,mea
suredannuallyduring2002–2
006,
bybaselinestuntinga
Agein
2002:
Sex
Mea
nheight-for-ageZscore(H
AZ)during:
Din
mea
nHAZ,2002-2006
TotalHAZ,2006
minus2002b
%stunted
atbaseline,
butnot
in2006
2002c
2003
2004
2005
2006
TS
NS
TS
NS
TS
NS
TS
NS
TS
NS
TS
NS
%
2Girls
21.65
22.62
20.59
21.52
22.42
21.18
21.93
22.53
21.29
21.83
22.27
21.34
21.64
22.08
21.04
0.01
0.54
20.45
21
Boy
s22.01
22.92
20.84
22.28
22.74
21.72
22.07
22.49
21.43
22.00
22.40
21.45
22.04
22.43
21.54
20.03
0.49
20.70
28
3Girls
22.13
22.92
21.12
22.33
22.82
21.34
21.92
22.30
21.29
21.88
22.22
21.32
21.75
22.06
21.32
0.38
0.86
20.20
45
Boy
s21.73
23.13
20.48
21.80
22.86
20.81
21.67
22.71
20.98
21.79
22.57
21.20
21.74
22.71
20.96
20.01
0.42
20.48
04
Girls
21.67
22.79
20.73
21.68
22.45
20.83
21.89
22.59
21.11
21.87
22.43
21.25
21.81
22.47
21.14
20.14
0.32
20.41
28
Boy
s21.71
22.94
20.73
21.95
23.13
20.97
21.82
22.70
21.04
21.75
22.62
20.99
21.64
22.47
20.94
0.07
0.47
20.21
75
Girls
21.35
22.92
20.57
21.23
22.68
20.76
21.10
22.33
20.67
21.26
22.40
20.71
21.19
22.31
20.59
0.16
0.61
20.02
28
Boy
s21.75
22.74
20.86
21.92
22.71
21.05
21.84
22.57
21.22
21.94
22.63
21.25
21.57
22.39
21.24
0.18
0.35
20.38
28
6Girls
21.15
22.83
20.16
21.46
22.55
20.78
21.28
22.53
20.83
21.22
22.40
20.67
21.19
22.6
20.39
20.04
0.23
20.23
0Boy
s21.97
23.48
20.84
22.01
23.12
21.22
21.91
23.13
21.09
21.97
23.09
21.20
21.90
22.97
21.03
20.07
0.51
20.19
7Tot
dGirls
21.60
22.78
20.60
21.71
22.57
20.95
21.71
22.48
21.03
21.66
22.34
21.05
21.58
22.29
20.95
0.02
0.49
20.35
25
Boy
s21.84
23.06
20.73
21.99
22.92
21.12
21.85
22.71
21.13
21.88
22.66
21.20
21.81
22.61
21.12
0.03
0.45
20.61
13
aAllvalues
are
truncated
bTotalHAZ,2006minus2002,is
thedifference
betwee
ntheaverageHAZfor2006minustheaverageHAZfor2002.
c T,total(stunted1
not
stunted);S,stunted(H
AZ<
–2)atbaseline;
NS,not
stuntedatbaseline(�
22HAZ).
dTot,totalforallagebrack
ets.
342 R. GODOY ET AL.
American Journal of Human Biology

study (with years 2002 and 2003 as the excluded catego-ries) (row 4) and found that the baseline estimate of catch-up growth did not change.
Given the heterogeneity of prices, weather, and ecologi-cal conditions across villages and years, we also used a vil-lage-year fixed effect model (instead of a simpler villagefixed-effect model) and found that the growth rateincreased to 0.12 SD/year (row 5).
In row 6, we added a measure of total household practi-cal ethnobotanical knowledge because previous researchsuggests that parental ethnobotanical knowledge might
be associated with better child health (McDade et al.,2007). We found that the growth increased from 0.11SD/year to 0.13 SD/year.Last, we reestimated catch-up growth using year-to-
year D of height measured in cm rather than in Z scoresand still found positive but statistically nonsignificantresults (row 7). When defining growth rate in height asthe annual D of height measured in cm, we found thatchildren who had been stunted at baseline grew by 0.16cm/year (P 5 0.233) more than their nonstunted peers, aresult consistent with the earlier discussion about less sig-
Fig. 3. Total change in HAZ (z-score) for Tsimane’ girls and boys, 2 � age � 7 at baseline, 2002, measured annually during 2002–2006. [Colorfigure can be viewed in the online issue, which is available at www.interscience.wiley.com.]
TABLE 3. Random-effect panel linear regressions results for growth rate in height 2002–2006 in relation to baseline stunting (2002), adjustedfor child, mother, and household and community attributes among Tsimane’ children 2–7 years of age at baselinea
Explanatory variables
Dependent variable: year-to-year D in height Z score (HAZ)
I II III IV V
A B A B A B A B A B
I. Baseline stunting 0.189** 0.202** 0.094** 0.105** 0.190** 0.190** 0.189** 0.203** 0.116** 0.116**II. Child:
Birth order b b 0.268** 0.295** b b b b 0.308** 0.558**No. of younger siblings b b 20.254** 20.290* b b b b 20.273* 20.531**Lagged weight b b 20.015* 20.012 b b b b 20.012 20.007Age b b 0.028 0.027 b b b b 0.019 0.011Male b b 20.042 20.081** b b b b 20.031 20.072**Current illness b b 20.011 20.024 b b b b 20.022 20.029Dry-season birth b b 0.004 0.014 b b b b 0.036 0.041
III. Mother:Age b b b b 20.001 20.001 b b 0.001 0.001Schooling b b b b 0.015 0.015 b b 20.003 20.004Current height b b b b 0.003 0.001 b b 0.006* 0.002Current weight b b b b 0.002 0.001 b b 20.000 20.000Current illness b b b b 0.028 0.020 b b 0.010 0.002Laughter b b b b 0.053 0.074* b b 0.003 0.030
IV. Household:No. of children b b b b b b 20.006 20.008 20.021 20.016Current income b b b b b b 20.003 20.005 20.011** 20.016**Current wealth b b b b b b 0.001 20.003 0.005 0.007Forest clearance b b b b b b 0.016 20.007 0.044 0.036
V. Constant 20.081** 20.594** 20.187 20.222 20.800* 20.346 20.092 20.597** 21.256** 20.991**Village fixed effect: present No Yes No Yes No Yes No Yes No YesR2 overall 0.038 0.071 0.028 0.067 0.051 0.075 0.039 0.074 0.057 0.086
N 915 704 869 914 673
For definition of variables, see appendix.aRegressions include clustering by subject and robust standard errors. *P � 0.05, **P � 0.01.bVariable intentionally excluded.
343SHORT BUT CATCHING UP
American Journal of Human Biology

nificant evidence for catch-up growth when using rawmeasures of height rather than Z scores of height.
Hypotheses
To test hypothesis no. 1 about the absence of catch-upgrowth in a traditional society, we examine the row‘‘baseline stunting’’ in Table 3 and reject the hypothesisbecause both the main results and the additional analysispresented in Table 4 all suggest positive and significantcatch-up growth rates for children stunted at baseline.To test hypothesis no. 2 about higher rates of catch-up
growth among children in communities nearer to markettowns, we split the sample into two groups: children whoresided in villages in the lowest 25% of the village-to-towndistance (i.e., nearer to towns) (row 8a) and children whoresided in the top 25% of the village-to-town distance (i.e.,farther away from towns) (row 8b). In bivariate analysisnot shown we found no significant different in the share ofchildren stunted at baseline between children living inremote and nearby communities (v2 5 1.34, P 5 0.246).Contrary to expectations, we found that children stuntedat baseline who lived in more remote locations had highergrowth rates (0.21 SD/year, P 5 0.001) (row 8b) than didchildren residing in villages nearer to town (0.008 SD/year, P 5 0.891) (row 8a). A pooled regression (results notshown) for all children with an additional interactionterm, near * baseline stunting, showed that stunted chil-dren nearer to towns had a rate of growth that was 0.31SD/year (P 5 0.018) lower than the rate of growth of chil-dren in communities farther away.Because we control for village fixed effects, the dichoto-
mous dummy variable for proximity to market town likelypicks up attributes of the community that change acrossyears, such as incidence of epidemics, changes in prices offood and medicines, and pests and diseases of crops andanimals. Unfortunately, we lack the data to identify theaspect of town propinquity that might be implicated in thelower rate of stature growth.To test hypotheses no. 3 about the absence of a differen-
tial effect in catch-up growth between girls and boys, weran separate regression for girls (row 9a) and for boys(row 9b) and found that boys had higher catch-up growth
rates (0.14 SD/year, P 5 0.002) than girls (0.09 SD/year,P 5 0.019). Nevertheless, a pooled regression (not shown)similar to the regression in VB (Table 3), but with an addi-tional interaction term, male * baseline stunting, showedthat the marginal difference in growth rate in favor ofboys was statistically nonsignificant (P 5 0.425).These results provide limited support for the widely
documented finding that compared with females, maleshave greater linear growth responses to early improve-ments in nutrition (Gray and Wolfe, 1980; Greulich, 1951;Kuzawa, 2005, 2007). Fetal restriction models in ratshave also demonstrated that males experience greatergrowth deficits in response to in utero nutritional scarcitythan female rodents (Kuzawa and Adair, 2003; Oyhenartet al., 1998). Although these findings suggest that sex-spe-cific differences in Tsimane’ catch-up growth may betraced to events occurring during fetal development, wehave no measure of events (nutritional status, maternalillness, traumatic events) occurring in utero nor accurateestimations of birth weight in this study to evaluate thispathway.Finally, among child attributes, we found that birth
order bore a significant positive association with the rateof growth but the number of younger sibling bore a signifi-cant negative association with catch-up growth. Theresult is consistent with the findings of Adair (1999)among children in the Philippines. She found that first-borns were also more likely to have catch-up growth. Wehave no satisfactory answer for the finding. As far as weknow, Tsimane’ culture does not value first-borns overchildren born later. However, given the prevalence of eat-ing out of a common pot, it is possible that first-born chil-dren get first picks at the food and perhaps get more foodthan younger sibling. Another possible explanation is thatfirst-borns will have higher growth rate if they had beenmore likely to be stunted at baseline. We tested for thispossibility and did not find supportive evidence. At base-line, each step up in the birth order (e.g., being a first-born rather than being a second-born) was associated wasa 13% (P 5 0.001) lower probability of being stunted atbaseline. Another possibility for why the elder childrenmight have higher rates of growth relates to the weaken-ing of maternal health with each subsequent pregnancyand birth. Unfortunately, we do not have data to test thisexplanation.
LIMITATIONS
Besides omitted variable bias, discussed in the next sec-tion, a limitation of this study has to do with insufficientcultural information to explain why and how catch-upgrowth occurs. For example, we do not have informationabout parental expectations regarding the benefits or pen-alties of adult height for their children, nor do we have in-formation on cultural valuation of first-born children ver-sus children born later. Nor do we have information aboutcultural expectations for the allocation of monetary expen-ditures, and how culturally constructed patterns of mone-tary expenditures might influence child nutrition orrates of child growth. We have no data on how parentsallocate resources among their stunted and nonstuntedchildren. In short, we lack fine-grained data on the cul-tural mechanisms that might explain catch-up growth inthis population.
TABLE 4. Sensitivity analysis of main regression results from Table 3,column VB, and test of hypotheses
Coefficient ofbaseline stunting Description of modification of column VB
1 0.11** Benchmark regression (Table 3, column VB). H1Sensitivity analysis of hypothesis #1:2 0.11** Control for # times child present in the study3 0.08* Excludes girls 10 more or years of age who may
have entered premenarche growth acceleration4 0.11** Control for full set of dummy variables for years5 0.12** [4]1 full set of dummy variables for community-
years6 0.13** Control for total household practical ethnobotanical
skills7 0.16 cm/year Outcome 5 height D cm/year
Hypotheses:8a 0.008 Regression VB only for children living nearer to
towns. H28b 0.21** Regression VB only for children living far from
towns. H29a 0.09* Regression VB only for girls. H39b 0.14** Regression VB only for boys. H3
*P � 0.05, **P � 0.01.
344 R. GODOY ET AL.
American Journal of Human Biology

DISCUSSION AND CONCLUSIONS
Contrary to expectation, we found evidence of catch-upgrowth among children who had been stunted at baselinefor the pooled sample and among children living in vil-lages farther from market towns. We next try to explainwhy there might be catch-up growth during prepubertyyears; none of the explanations are entirely satisfactory.
Omitted-variable bias
Although we control for a range of covariates that havebecome standard in studies of catch-up growth, we couldnot control for other variables that affect both the likeli-hood of childhood stunting at baseline and the rate ofgrowth. For example, unmeasured attributes of householddeprivation or scarcity at baseline would likely be posi-tively associated with baseline stunting and negativelyassociated with statural growth. The problem with thisline of thinking is that the omission of these types of varia-bles produces a negative indirect effect, thereby attenuat-ing rather than increasing the estimated rates of catch-upgrowth. Conditioning for these types of omitted variableswould produce even higher rates of catch-up growth,though other unmeasured variables could positively affectgrowth rates.
Socioeconomic explanation: parental reallocationof resources
Few studies document whether parents in low-to-mid-dle income countries perceive growth faltering in theirchildren and consequently take steps to redress it. Onesuch study of mothers in Nepal found that they were fairlyaccurate to recognize stunting and wasting in childrenless than 3 years old but were less accurate for childrenaged 3–5 years (Moffat, 2000). This study does not investi-gate whether the mothers reallocated resources to address‘‘smallness’’ in their children. In ethnographic open-endedinterviews, Tsimane’ parents in our study reported usingmedicinal plants and wild foods to redress growth falter-ing (reference unavailable; unpublished work in progress).Elsewhere, we show that maternal traditional ecologicalknowledge is associated with improvements in multiplemeasures of child health (McDade et al., 2007). Parents’reallocation of resources may also explain the steep rate ofgrowth in more remote communities where presumablyone might find a greater abundance of wild and semi-domesticated plants and perhaps a more nutritious diet.
Nevertheless, these explanations face several problems.First, in the regression results shown in rows [5] and [6] ofTable 4, we condition for community-year and for commu-nity fixed effects and for ethnobotanical knowledge. Com-munity-year and community fixed effects would sweepaway the role of variables such as abundance of wildlifeand farm resources in the community and the measure ofethnobotanical skills should remove the confounding roleof this important form of human capital. Second, takingsteps to redress growth faltering is inconsistent with veryhigh rates of time preference, impatience, or myopia wehave documented for this population (Godoy et al., 2004;Kirby et al., 2002; Reyes-Garcıa et al., 2007a). That is,people who discount the future heavily should be lesslikely to make long-run investments in their own or intheir offspring’s growth.
Growing recognition of the costs of growth faltering inacademic achievement
Another possible explanation has to do with parents rec-ognizing the importance of formal schooling and withtheir realization that redressing growth faltering mighthave academic pay offs for their children. To explore thistopic, we examined the academic achievement of children6 � age � 11 stunted at baseline. We set the lower agelimit at 6 years because that is the age when most Tsi-mane’ children enter school. Children stunted at baselinewere 10.12% (P 5 0.02) less likely to be enrolled in schoolduring the survey year and had 0.34 less schooling thantheir same sex and age peers (P 5 0.017). The problemwith this interpretation is that, if true then we shouldhave found a higher rate of growth in communities nearerto market towns, which presumably have a greaterdemand for schooling, though it is also possible that therate of growth would have been lower in communitiescloser to town without the countervailing effect of formalschooling.In sum, we found evidence of catch-up growth among
children in this traditional society. The higher rates ofcatch-up among children < 5 are consistent with ourexpectations, given that the linear growth rate is highestfrom fetal development through 2–3 years of age, com-pared with childhood and adolescence (Martorell et al.,1995). During this window, the metabolic allotment forgrowth accounts for the greatest proportion of a child’soverall energy budget at this age (Butte 2005). Therefore,this age group is particularly sensitive to changes innutrition and insults from infectious disease that mayimpose constraints on energy available for growth(Gluckman and Pinal, 2003; Scrimshaw, 2003). For theTsimane’, the competing energy demands from immuneactivation in response to pathogen exposure have beenassociated with reduced linear growth over the following 3months in children 2–4 years. This disparity in height ismost evident for those children with low energy stores ofsubcutaneous fat at the time of immunostimulation(McDade et al., 2007). In addition, this age is when posi-tive centile crossing is most plausible, because growthrates are most rapid and linear growth trajectories havenot yet canalized. Although recovery from early insultsand perturbations in this population underscores thedynamic plasticity of this critical developmental period,the long-term costs associated with catch-up growth haveyet to be explored as these individuals reach adulthood(Cameron, 2007, West-Eberhard, 2003).The panel study in progress with the Tsimane’ should
allow us to explore these topics in the future, and willfacilitate a more nuanced understanding of the down-stream health correlates of population facing chronic chal-lenges to growth (Ong et al., 2000). This study also under-scores the point that transitions in cultural and economiccontexts are not uniform or monolithic, even within agiven population. While Tsimane’ children exhibit a highprevalence of stunting characteristic of other Amazonianpopulations, our analyses demonstrates significant indi-vidual variation in potential for catch-up growth.
ACKNOWLEDGMENT
C. Nyberg and D. Eisenberg were supported by NSFGraduate Research Fellowships. The IRB for research
345SHORT BUT CATCHING UP
American Journal of Human Biology
with human subjects of Northwestern University andBrandeis University, and the Great Tsimane’ Councilapproved the study. Before enrollment in the study weobtained assent from participants. Special thanks go totwo anonymous reviewers.
LITERATURE CITED
Adair LS. 1999. Filipino children exhibit catch-up growth from age 2 to 12years. J Nutr 129:1140–1148.
Baker J, Hurtado AM, Pearson OM, Hill KR, Jones T, Frey MA. 2009. De-velopmental plasticity in fat patterning of Ache children in response tovariation in interbirth intervals: a preliminary test of the roles of exter-nal environment and maternal reproductive strategies. Am J Hum Biol21:77–83.
Baumgartner RN, Roche AF, Himes JH. 1986. Incremental growth tables:supplementary to previously published charts. Am J Clin Nutr 43:711–722
Blackwell AD, Pryor G, Pozo J, Tiwia W, Sugiyama LS. 2009. Growth andmarket integration in Amazonia: a comparison of growth indictorsbetween Shuar, Shiwiar, and non-indigenous school children. Am J HumBiol 21:161–171.
Bogin B, Keep R. 1999. Eight thousand years of economic and political his-tory in Latin America revealed by anthropometry. Ann Hum Biol26:333–351.
Brabec M, Godoy RA, Reyes-Garcia V, LeonardWR. 2007. BMI, income, andsocial capital in a pre-industrial society of the Bolivian Amazon: inter-action between relative and community effects. Am J Hum Biol 19:459–474.
Butte NF. 2005. Energy requirements of infants. PublHealthNutr 8:953–967.Byron E. 2003. Markets and health: the impact of markets on the nutri-
tional status, morbidity, and diet of the Tsimane’ Amerindians ofLowland Bolivia. Department of Anthropology, University of Florida:Gainesville, Florida.
Cameron N. 2007. Growth patterns in adverse environments. Am J HumBiol 19:615–621.
Cameron N, Preece MA, Cole TJ. 2005a. Catch-up growth or regression tothe mean? Recovery from stunting revisited. Am J Hum Biol 17:412–417.
Cameron N, Wright MM, Griffiths PL, Norris SA, Pettifor JM. 2005b.Stunting at 2 years in relation to body composition at 9 years in Africanurban children. Obes Res 13:131–136.
Case A, Paxson CH. 2006. Stature and status: height, ability, and labormarket outcomes. Natl Bur Econ Res 12466.
Coly AN, Milet J, Diallo A. 2006. Preschool stunting, adolescent migration,catch-up growth, and adult height in young Senegalese men and womenof rural origin. J Nutr 136:2412–2420.
de Onis M, Frongillo EA, Blossner M. 2000. Is malnutrition declining? Ananalysis of changes in levels of child malnutrition since 1980. BulletinWHO 78:1222–1233.
Eckhardt C, Suchindran C, Gordon-Larsen P, Adair LS. 2005. The asso-ciation between diet and height in the postinfancy period changeswith age and socioeconomic status in Filipino youths. J Nutr 135:2192–2198.
Engle PL, Black MM, Behrman JR, de Mello MC, Gertler PJ, Kapiriri L,Martorell R, Young ME. 2007. Strategies to avoid the loss of develop-mental potential in more than 200 million children in the developingworld. Lancet 369:229–242.
Fernald LC, Neufeld LM. 2007. Overweight with concurrent stunting invery young children from rural Mexico: prevalence and associated fac-tors. Euro J Clin Nutr 61:623–632.
Foster Z, Byron E, Reyes-Garcia V, Huanca T, Vadez V, Apaza L, Perez E,Tanner S, Gutierrez Y, Sandstrom B, Yakhedts A, Osborn C, Godoy RA,Leonard WR. 2005. Physical growth and nutritional status of Tsimane’Amerindian children of lowland Bolivia. Am J Phys Anthropol 126:343–351.
Gluckman PD, Pinal CC. 2003. Regulation of fetal growth by the somato-trophic axis. J Nutr 133:1741S–1746S.
Godoy R, Leonard WR, Reyes-Garcia V, Goodman E, McDade TW, HuancaT, Tanner S, Vadez V. 2006a. Physical stature of adult Tsimane’ Amerin-dians, Bolivian Amazon in the 20th century. Econ Hum Biol 4:184–205.
Godoy R, Tanner S, Reyes-Garcia V, Leonard WR, McDade TW, Vento M,Broesch J, Fitzpatrick IC, Giovannini P, Huanca T, Jha N, BolivianTAPS Study Team. 2008a. The effect of rainfall during gestation andearly childhood on adult height in a foraging and horticultural society ofthe Bolivian Amazon. Am J Hum Biol 20:23–34.
Godoy RA, Byron E, Reyes-Garcia V, Leonard WR, Patel K, Apaza L, PerezE, Vadez V. 2004. Patience in a foraging-horticultural society: a test ofcompeting hypotheses. J Anthropol Res 60:179–202.
Godoy RA, Goodman E, Reyes-Garcia V, Eisenberg DTA, Leonard WR,Huanca T, McDade TW, Tanner S, Jha N. 2008b. Rain, temperature, andchild-adolescent height among native Amazonians in Bolivia. Ann HumBiol 35:276–293.
Godoy RA, Reyes-Garcıa V, Byron E, Leonard WR, Vadez V. 2005. Theeffect of market economies on the well-being of indigenous people and ontheir use of renewable natural resources. Ann Rev Anthropol 34:122–138.
Godoy RA, Reyes-Garcıa V, Gravlee L, Huanca T, Leonard WR, McDadeTW, Tanner S. 2009b. Moving beyond a snapshot to understand changesin the well-being of native Amazonians: panel evidence (2002–2006)from Bolivia. Curr Anthrpol.
Godoy RA, Reyes-Garcıa V, Huanca T, Leonard WR, McDade TW, TannerS, Vadez V, Seyfried C;Bolivia TAPS Study Team. 2007b. Signaling byconsumption in a native Amazonian society. Evol Hum Behav 28:124–134.
Godoy RA, Reyes-Garcıa V, Leonard WR, Huanca T, McDade TW, TannerS, Seyfried C, Bolivia TAPS Study Team. 2007a. On the measure ofincome and the economic unimportance of social capital. Evidence froma native Amazonian society of farmers and foragers. J Anthropol Res63:239–260.
Godoy RA, Reyes-Garcıa V, McDade TW, Tanner S, Leonard WR, HuancaT, Vadez V, Patel K. 2006b. Why do mothers favor girls and fathers boys?A hypothesis and a test of intra-household girl-boy investment disparity.Hum Nat 17:169–189.
Godoy RA, Reyes-Garcia V, Vadez V, Leonard WR, Byron E. 2007b. Howwell do foragers protect food consumption? Panel evidence from a nativeAmazonian society in Bolivia. Hum Ecol 35:223–248.
Grantham-McGregor S, Cheung YB, Cueto S, Glewwe P, Richter L, StruppB. 2007. Developmental potential in the first 5 years for children indeveloping countries. Lancet 369:60–70.
Gray S, Akol HA, Sundal M. 2008. Mixed-longitudinal growth of breastfeeding children in Moroto District, Uganda (Karamjoa Subregion). Aloss of biological resilience? Am J Hum Biol 20:499–509.
Gray JP, Wolfe LD. 1980. Height and sexual dimorphism of stature amonghuman societies. Am J Phys Anthropol 53:441–456.
Greulich W. 1951. The growth and developmental status of Guamanianschool children in 1947. Am J Phys Anthropol 9:55–70.
Gurven M, Kaplan H, Supa AZ. 2007. Mortality experience of TsimaneAmerindians of Bolivia. Am J Hum Biol 19:376–396.
Haas JD, Martinez EJ, Murdoch S, Conlisk E, Rivera JA, Martorell R.1995. Nutritional supplementation during the preschool years and phys-ical work capacity in adolescent and young adult Guatemalans. J Nutr125(4 Suppl):1078S–1089S
Hamill PVV, Drizd TA, Johnson CL, Reed RB, Roche AF, Moore WM. 1979.Physical growth: National Center for Health Statistics Percentiles. Am JClin Nutr 32:607–629.
Hoffman DJ, Martins PA, Roberts SB, Sawaya AL. 2007. Body fat distribu-tion in stunted compared with normal-height children from the shanty-towns of Sao Paulo, Brazil. Nutrition 23:640–646.
Hoffman DJ, Sawaya AL, Verreschi I, Tucker KL, Roberts SB. 2000. Whyare nutritionally stunted children at increased risk of obesity? Studies ofmetabolic rate and fat oxidation in shantytown children from Sao Paulo,Brazil. Am J Clin Nutr 72:702–707.
Huanca T. 2008. Tsimane’ oral tradition, landscape, and identity in tropicalforest. Wa-Gui: La Paz.
Jahn A, Aslam A. 1995. Fathers’ perception of child health: a case study ina squatter settlement of Karachi, Pakistan. Health Transition Rev5:191–206.
Kain J, Uauy R, Lera L, Taibo M, Albala C. 2005. Trends in height andBMI of 6-year-old children during the nutrition transition in Chile. ObesRes 13:2178–2186.
Kalanda BF, van Buuren S, Verhoeff FH, Brabin BJ. 2005. Catch-upgrowth in Malawian babies, a longitudinal study of normal and lowbirthweight babies born in a malarious endemic area. Early Hum Dev81:841–850.
Khatun M, Stenlund H, Hornell A. 2004. BRAC initiative towardspromoting gender and social equity in health: a longitudinal studyof child growth in Matlab, Bangladesh. Publ Health Nutr 7:1071–1079.
Kirby K, Godoy RA, Byron E, Leonard W, Wilkie D, Apaza L, Reyes-GarciaV, Vadez V, Perez E. 2002. Correlates of delay-discount rates: evidencefrom Tsimane’ Amerindians of the Bolivian rain forest. J Econ Psychol23:291–316.
Komlos J. 1994. Stature, living standards, and economic development. Chi-cago: The University of Chicago Press.
Kuzawa CW. 2005. Fetal origins of developmental plasticity: are fetal cuesreliable predictors of future nutritional environments? Am J Hum Biol17:5–21.
Kuzawa CW. 2007. Developmental origins of life history: growth, produc-tivity, and reproduction. Am J Hum Biol 19:654–661.
346 R. GODOY ET AL.
American Journal of Human Biology

Kuzawa CW, Adair LS. 2003. Lipid profiles in adolescent Filipinos: relationto birth weight and maternal energy status during pregnancy. Am J ClinNutr 77:960–966.
Lampl M, Thompson A. 2007. Growth charts do not describe individualgrowth biology. Am J Hum Biol 19:643–653.
Leonard WR, DeWalt KM, Stansbury JP, McCaston MK. 1995. Growth dif-ferences between children of highland and coastal Ecuador. Am J PhysAnthropol 98:47–57.
Leonard WR, DeWalt KM, Stansbury JP, McCaston MK. 2000. Influence ofdietary quality on the growth of highland and coastal Ecuadorian chil-dren. Am J Hum Biol 35:837.
Leonard WR, Godoy RA. 2008. Tsimane’ Amazonian Panel Study (TAPS):the first five years (2002–2006) available to the public. Econ Hum Biol6:299–301.
Liu Y, Albertson-Wikland K, Karlberg J. 2000. Long-term consequences ofearly linear growth retardation (stunting) in Swedish children. PediatrRes 47:475–580.
Lohman TG, Roche AF, Martorell R. 1988. Anthropometric standardizationreference manual (Abridged Edition). Windsor, Ontario: HumanKinetics Publishers.
Lucas P, Arai L, Baird J, Kleijnen J, Law C, Roberts H. 2007. A systematicreview of lay views about infant size and growth. Arch Dis Childhood92:120–127.
Maleta K, Virtanen SM, Espo M, Kulmala T, Ashorn P. 2003. Seasonalityof growth and the relationship between weight and height gain in chil-dren under three years of age in rural Malawi. Acta Paediatr 92:491–497.
Moffat T. 2000. Parents’ estimation of their children’s body size comparedto classification of children’s nutritional status using the internationalgrowth reference. Ecol Food Nutr 39:311–329.
Martorell R, Khan LK, Schroeder DG. 1994a. Reversibility of stunting-epi-demiologic findings in children from developing countries. Euro J ClinNutr 48:S45–S57.
Martorell R, Khan LK, Schroeder DG. 1994b. Reversibility of stunting -epidemiologic findings in children from developing countries. Euro JClin Nutr 48:45–57.
Martorell R, Schroeder DG, Rivera JA, Kaplowitz HJ. 1995. Patterns oflinear growth in rural Guatemalan adolescents and children. J Nutr125:1060S–1067S.
McDade TW, Leonard WR, Reyes-Garcia V, Vadez V, Huanca T, Godoy RA.2005. Maintenance vs. growth: modeling the costs of immune activationfor children in lowland Bolivia. Am J Hum Biol 17:254.
McDade TW, Reyes-Garcia V, Blackinton P, Tanner S, Huanca T, LeonardWR. 2007. Maternal ethnobotanical knowledge is associated with multi-ple measures of child health in the Bolivian Amazon. Proc Natl Acad SciUSA 104:6134–6139.
Ong KKL, Ahmed ML, Emmett PM, Preece MA, Dunger DB, The ALSPACStudy Team. 2000. Association between postnatal catch-up growth andobesity in childhood: prospective cohort study. BMJ 320:967–971.
Oyhenart EE, Mune MC, Pucciarelli HM. 1998. Influence of intrauterineblood supply on cranial growth and sexual dimorphism at birth. GrowthDev Aging 62:187–198.
Pollitt E, Gorman K, Engle PL. 1995. Nutrition in early life and fulfillmentof intellectual potential. J Nutr 125:1111S–1118S.
Prentice AM, Cole TJ. 1994. Seasonal changes in growth and energy statusin the Third World. Proc Nutr Soc 53:509–519.
Reifsnider E, Allan J, Percy M. 2000. Mothers’ explanatory models of lackof child growth. Publ Health Nurs 17:434–442.
Reyes-Garcia V, Godoy RA, Leonard WR, McDade TW, Vadez V, Tanner S.2007a. The origins of monetary inequality: the role of patience, humancapital, and the division of labor. Evol Hum Behav 28:37–47.
Reyes-Garcia V, Vadez V, Tanner S, Huanca T, Leonard WR, McDade TW.2007b. Ethnobotanical skills and clearance of tropical rain forest foragriculture: a case study in the lowlands of Bolivia. Ambio 36:406–408.
Ricci KA, Girosi F, Tarr PI, Lim Y-W, Mason C, Miller M, Hughes J. 2006.Reducing stunting among children: the potential contribution of diag-nostics. Nature 444:29–38.
Schroeder D, Martorell R, Flores R. 1999. Infant and child growth and fat-ness and fat distribution in Guatemalan adults. Am J Epidemol149:177–185.
Scrimshaw NS. 2003. Historical concepts of interactions, synergism andantagonism between nutrition and infection. J Nutr 133:316S–321S.
Simondon KB, Simondon F, Imon I, Diallo A, Benefice E, Traissac P, MaireB. 1998. Preschool stunting, age at menarche and adolescent height: alongitudinal study in rural Senegal. Euro J Clin Nutr 52:412–418.
Steckel RH, Rose JC. 2002. The backbone of history: health and nutritionin the western hemisphere. New York: Cambridge University Press.
Stein AD, Barnhart HX, Wang M, Hoshen MB, Ologoudou K, Ramak-rishnan U, Grajeda R, Ramirez-Zea M, Martorell R. 2004. Comparisonof linear growth patterns in the first three years of life across two gener-ations in Guatemala. Pediatrics 113:270–275.
Tanner JM, Davies PSW. 1985. Clinical longitudinal standards for heightand height velocity for North American children. J Pediatr 107:317–329.
Tanner S. 2005. A population in transition: health, culture change, andintestinial parasitism among the Tsimane’ of lowland Bolivia. PhD Dis-sertation, Department of Anthropology, University of Michigan.
Vadez V, Reyes-Garcia V, Godoy RA, Apaza L, Byron E, Huanca T, LeonardWR, Wilkie D, Perez E. 2004. Does integration to the market threatenagricultural diversity? Panel and cross-sectional evidence from a horti-cultural-foraging society in the Bolivian Amazon. Hum Ecol 32:635–646.
Victora CG, Barros FC, Horta BL, Martorell R. 2001. Short-term benefitsof catch-up growth for small-for-gestational-age infants. Int J Epidemol30:1325–1330.
Walker S, Wachs T, Meeks Gardner J. 2007a. Child development: risk fac-tors for adverse outcomes in developing countries. Lancet 369:145–157.
Walker SP, Chang SM, Powell CA. 2007b. The association between earlychildhood stunting and weight status in late adolescence. Int J Obes31:347–352.
Walker SP, Gaskin P, Powell CA, Bennett FI, Forrester TE, Grantham-McGregor S. 2001. The effects of birth weight and postnatal lineargrowth retardation on blood pressure at age 11–12 years. J EpidemolComm Health 55:394–398.
West-Eberhard MJ. 2003. Developmental plasticity and evolution. Oxford:Oxford University Press.
World Health Organization. 1995. Physical status: the use and interpreta-tion of anthropometry. Report of the WHO Expert Committee. WHOTechnical Report Series, no. 854. Geneva: WHO.
APPENDIX
TABLE . Definition of control variables used in regressions,children 2 � age � 7
Control variables Definition
I. Child:Birth order Pseudo birth order; 1 5 youngest, 2 5 next to
youngest, etc. Birth order determined by child’sage in the household, not by asking mother aboutthe exact birth order of the child. This variableonly includes children living in the household atthe time of the survey
No. of youngersiblings
Number of younger siblings living in the household
Lagged weight Weight of subject during previous yearAge Best estimate of child’s age in whole years made by
TAPS teamMale Child’s sex: 1, male, 0, femaleCurrent illness Natural logarithm of total number of self-reported
days in bed due to illness during the 14 daysbefore the day of the interview. 11 added to rawvalues before taking logarithms
Dry-season birth Subject was born during the dry season(December–June); 15 yes, 0 5 no
II. Mother:Age Best estimate of mother’s age in whole years made
by TAPS teamSchooling Mother’s maximum school grade achievementCurrent height Measured standing physical stature of child’s
mother (cm)Current weight Mother’s weight in kgCurrent illness Natural logarithm of total number of self-reported
days in bed due to illness during the 14 daysbefore the day of the interview. 11 added to rawvalues before taking logarithms
Laughter Mother laughed during interview; 1 5 yes, 0 5 noIII. Household:
No. of children Number of children in the householdCurrent income Natural log of household income earned during the
2 weeks before the day of the interview. Incomesources include sales and wage labor
Current wealth Natural log of sum of wealth of traditional andmodern physical assets owned by the household
Forest clearance Natural logarithm of old-growth and fallow forestcleared by the household during the year beforethe interview. Raw variable measured in tareas(10 tareas51 hectare)
IV. CommunityVillage fixed
attributesFull set of dummy variables for villages
(n5 132 15 12)
347SHORT BUT CATCHING UP
American Journal of Human Biology