Mechanisms of Permeation and Selectivity in Calcium Channels
Volume Exclusion in Calcium Selective Channels
Dezs}o Boda,*y Wolfgang Nonner,z Douglas Henderson,§ Bob Eisenberg,* and Dirk Gillespie**Department of Molecular Biophysics and Physiology, Rush University Medical Center, Chicago, Illinois; yDepartment of Physical Chemistry,University of Pannonia, Veszprem, Hungary; zDepartment of Physiology and Biophysics, Miller School of Medicine, University of Miami,Miami, Florida; and §Department of Chemistry and Biochemistry, Brigham Young University, Provo, Utah
ABSTRACT Another research group has proposed an interesting model for calcium channel selectivity. However, on the basis oftheir reported results we find it impossible to assess the merits of their model because their results and claims concerning selectivityare based on an extrapolation over four orders of magnitude to low Ca21 concentration. Their results and claims have beenpresented in several articles and reviews in several journals and, thus, need attention. In this article, we first establish that we obtainresults on electrostatics and channel occupancies similar to the high-concentration simulations they present. We then performgrand canonical ensemble simulations that enable us to study micromolar Ca21 concentrations. We find that their model channel isonly weakly Ca21 selective. A crucial problem with their model appears to be the placement of the negatively charged glutamatestructural elements in fixed positions inside the protein rather than as flexible units inside the filter.
INTRODUCTION
Ion channels are essential for the proper function of cells and
organisms (1). The task of ion channels is to pass ions through
their pore selectively. In particular, calcium (Ca) channels
play an important role in vital physiological functions such as
neurotransmitter release, muscle contraction, cell signaling,
and many others. Ca channels selectively conduct Ca21 ions
when these are present in millimolar or larger concentration
even if other ions (Na1 or K1) are present in a much larger
quantity. On the other hand, Ca21 ions block the current of
monovalent ions when Ca21 is present at a lower concentra-
tion. This Ca21-block occurs in the L-type Ca channel at
micromolar Ca21 concentrations (2–6). Several attempts to
explain the mechanisms of these important selectivity phe-
nomena have been made in the literature. A study of one
model is given in this article with the goal of obtaining a better
understanding of the behavior of Ca21-selective channels.
In the past few years, our understanding of Ca channels has
dramatically improved. Nonner et al. (7,8) have proposed a
simple intuitive model, based on a theory of homogeneous
fluids, in which the selectivity of a particular cation-selective
channel (the Ca channel in this study) is produced by the
competition between the attractive Coulombic interactions of
the cations with the net negatively charged structural ele-
ments of the channel filter and the repulsive excluded volume
of the ions and structural elements in a small volume. In this
competition cations are attracted into the filter but, because of
the restricted geometry of the channel and the excluded
volume of the ions and channel structural elements, divalent
(Ca21) ions are more effective at balancing the �4e negative
charge of the selectivity filter of the Ca channel than are
monovalent (Na1) ions since they deliver twice the charge
while occupying almost the same volume. Thus, the Ca21
ions preferentially occupy the filter even when the concen-
tration of the Ca21 ions in the surrounding reservoir is several
orders-of-magnitude smaller than the concentration of Na1
ions in this reservoir. This model can be extended to sodium
(Na) channels (9,10).
This appealing mechanism for selectivity can be called
charge/space competition (CSC) and is not only intuitively
attractive but is in accord with thermodynamics. In contrast to
a mechanical system, where the stable state is the state with
the lowest energy, a stable thermodynamic system is the state
with the lowest free energy, A ¼ U – TS, where U is the
thermodynamic energy, T is the temperature, and S is the
entropy. The minimum in A is the result of the competition
between U and S. In general, attractive forces contribute to Uand volume exclusion forces, due to particle size, contribute
to S. This division is absolute in the well-known van der
Waals theory that is a useful starting point for a theory of a
liquid and is quite accurate in more refined theories of liquids
(11). In the context of a channel, Coulombic forces contribute
primarily to U while the volume exclusion forces due to the
size of the particles contribute primarily to S.
The CSC mechanism accounts not only for the selectivity
of Ca21 versus Na1 ions in Ca and Na channels but accounts
for the selectivity of cations on the basis of ion diameter. The
CSC mechanism has been applied to the ryanodine receptor
Ca channel, where it reproduces or predicts .50 data curves
(12,13). The intuitive ideas of Nonner et al. (7,8) have been
made rigorous by means of the continuously refined studies
of Boda et al. (14–16). In these studies, we have made Monte
Carlo (MC) simulations that most recently have included the
effects of charge polarization due to dielectric boundaries
(17,18) and, by means of grand canonical (GC) ensemble MC
simulations, have been able to obtain results for exceedingly
low concentrations (10�6 M) of Ca21 ions. The statistical
doi: 10.1529/biophysj.107.122796
Submitted September 25, 2007, and accepted for publication December 18,
2007.
Address reprint requests to Dezs}o Boda, E-mail: [email protected].
Editor: Klaus Schulten.
� 2008 by the Biophysical Society
0006-3495/08/05/3486/11 $2.00
3486 Biophysical Journal Volume 94 May 2008 3486–3496
sampling in the filter is enhanced by means of preferential
sampling (14).
A second approach, due to Corry et al. (19), Krishnamurthy
and Chung (20), Corry and Chung (21), and Corry et al. (22)
(this body of work hereinafter called Chung and co-workers),
also describes the channel using an idealized geometry (the
structure of the Ca channel is not known). The ions move in a
dielectric continuum solvent and the wall of the channel
protein forms a dielectric boundary. Chung and co-workers
used Brownian dynamics (BD) simulations at high (typically
6200 mV) applied voltages to calculate the current flowing
through the channel and extrapolated their results to the low
Ca concentrations that are of physiological interest. Chung
and co-workers state that their model reproduces the micro-
molar Ca21 versus Na1 selectivity of the L-type Ca channel.
These claims have been stated several times in different places
and deserve examination. Their bold extrapolation needs
particular attention.
This article analyzes consequences of two crucial differ-
ences between the approaches of Chung and co-workers and
Boda et al. (14–18).
1. Chung and co-workers performed BD simulations at
rather high Ca21 ion concentrations (.18 mM). Their
claim that their model reproduces micromolar Ca21-
selectivity is based on a large extrapolation (four orders
of magnitude) to the low Ca21 concentrations of interest.
In contrast, we simulate micromolar concentrations di-
rectly using the GC ensemble. In this work, simulating
the micromolar regime directly, we show that the model
of Chung and co-workers does not have the strong Ca21-
selectivity properties that they had extrapolated.
2. Another significant difference between approaches of
Boda et al. (14–18) and Chung and co-workers is that the
latter group places the negative structural charges of the
selectivity filter behind the wall in fixed positions. This
rigid model is in sharp contrast with the flexible environ-
ment in the selectivity filter of our model. In the studies
using the CSC mechanism (7–10, 12–18), the oxygens of
the glutamate side chains are treated as mobile structural
ions that are restricted to the selectivity filter but otherwise
free to move inside the filter. Thus, these ions form a
liquidlike self-adjusting environment for the passing Na1
and Ca21 ions. Chung and co-workers claim that, in their
model, selectivity is due only to Coulomb forces. Quoting
from Corry and Chung’s review (21), ‘‘Indeed, the elec-
trostatic attraction of the protein is all that is required to
account for ion permeation and selectivity in this model.’’
We argue that electrostatics alone is not sufficient to
produce micromolar selectivity in their model and that
excluded volume effects cannot be ignored. By placing the
structural ions inside the selectivity filter, the Ca21 selec-
tivity of the model can be improved.
The simulation results of Chung and co-workers have been
presented without critique in many reviews (6,20–22). The
objective of this article is to report direct simulation results in
the Ca21 concentration range where Chung and co-workers
have extrapolated and where, in experiments, Ca21 block is
observed. Presenting simulation results with a CSC model of
the filter embedded in the channel geometry of Chung and co-
workers permits us to draw conclusions for the possible
mechanism of selectivity as viewed by their group and us.
THE MODELS
We adopt the standard usage in statistical mechanics and
distinguish between a model (which is defined by a Hamil-
tonian that gives the energy of the system in terms of the
particle positions and momenta and their interaction with any
fixed boundaries in the system) and a method (a theory or in
our case a simulation, that permits the study of the conse-
quences of a model).
The model of Chung and co-workers
Geometry
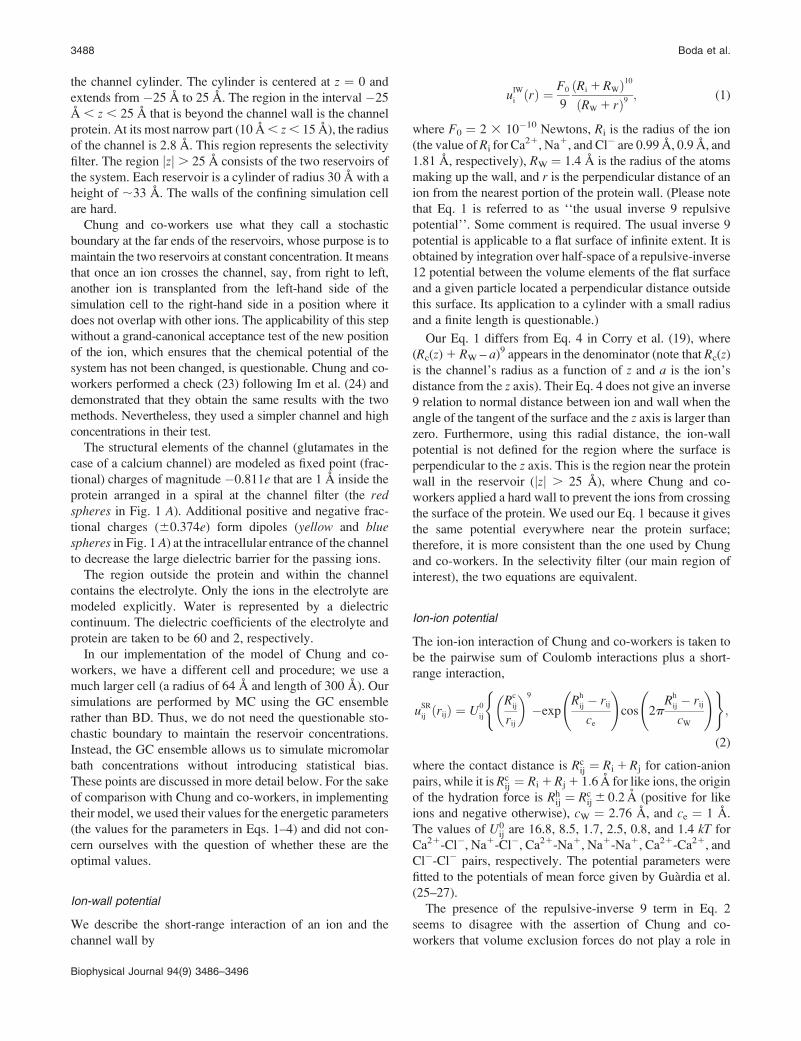
The model of Chung and co-workers is shown in our Fig. 1 Aand consists of a rotationally symmetric channel that is a
cylinder of length 50 A with a variable radius that defines the
boundary of the channel (see Corry et al. (19), their Fig. 1).
The z axis of the coordinate system is along the central axis of
FIGURE 1 Geometries of the Chung and co-workers’ model (A) and the
CSC model (B). Red spheres represent negative structural charges in the
filter. In the Chung and co-workers’ model (A) these four charges are in fixed
positions and embedded in the protein body, whereas in the CSC model (B)
these charges are eight mobile half-charged oxygen ions confined to the filter
lumen but free to move inside. Blue and yellow spheres represent charges
forming dipoles at the intracellular entrance. Gray and green spheres
represent Ca21 and Na1 ions, respectively. The surface grid is that used
in solving the integral equations of the electrostatics.
Volume Exclusion in Calcium Channels 3487
Biophysical Journal 94(9) 3486–3496
the channel cylinder. The cylinder is centered at z ¼ 0 and
extends from �25 A to 25 A. The region in the interval �25
A , z , 25 A that is beyond the channel wall is the channel
protein. At its most narrow part (10 A , z , 15 A), the radius
of the channel is 2.8 A. This region represents the selectivity
filter. The region jzj. 25 A consists of the two reservoirs of
the system. Each reservoir is a cylinder of radius 30 A with a
height of ;33 A. The walls of the confining simulation cell
are hard.
Chung and co-workers use what they call a stochastic
boundary at the far ends of the reservoirs, whose purpose is to
maintain the two reservoirs at constant concentration. It means
that once an ion crosses the channel, say, from right to left,
another ion is transplanted from the left-hand side of the
simulation cell to the right-hand side in a position where it
does not overlap with other ions. The applicability of this step
without a grand-canonical acceptance test of the new position
of the ion, which ensures that the chemical potential of the
system has not been changed, is questionable. Chung and co-
workers performed a check (23) following Im et al. (24) and
demonstrated that they obtain the same results with the two
methods. Nevertheless, they used a simpler channel and high
concentrations in their test.
The structural elements of the channel (glutamates in the
case of a calcium channel) are modeled as fixed point (frac-
tional) charges of magnitude �0.811e that are 1 A inside the
protein arranged in a spiral at the channel filter (the redspheres in Fig. 1 A). Additional positive and negative frac-
tional charges (60.374e) form dipoles (yellow and bluespheres in Fig. 1 A) at the intracellular entrance of the channel
to decrease the large dielectric barrier for the passing ions.
The region outside the protein and within the channel
contains the electrolyte. Only the ions in the electrolyte are
modeled explicitly. Water is represented by a dielectric
continuum. The dielectric coefficients of the electrolyte and
protein are taken to be 60 and 2, respectively.
In our implementation of the model of Chung and co-
workers, we have a different cell and procedure; we use a
much larger cell (a radius of 64 A and length of 300 A). Our
simulations are performed by MC using the GC ensemble
rather than BD. Thus, we do not need the questionable sto-
chastic boundary to maintain the reservoir concentrations.
Instead, the GC ensemble allows us to simulate micromolar
bath concentrations without introducing statistical bias.
These points are discussed in more detail below. For the sake
of comparison with Chung and co-workers, in implementing
their model, we used their values for the energetic parameters
(the values for the parameters in Eqs. 1–4) and did not con-
cern ourselves with the question of whether these are the
optimal values.
Ion-wall potential
We describe the short-range interaction of an ion and the
channel wall by
uIW
i ðrÞ ¼F0
9
ðRi 1 RWÞ10
ðRW 1 rÞ9; (1)
where F0 ¼ 2 3 10�10 Newtons, Ri is the radius of the ion
(the value of Ri for Ca21, Na1, and Cl� are 0.99 A, 0.9 A, and
1.81 A, respectively), RW ¼ 1.4 A is the radius of the atoms
making up the wall, and r is the perpendicular distance of an
ion from the nearest portion of the protein wall. (Please note
that Eq. 1 is referred to as ‘‘the usual inverse 9 repulsive
potential’’. Some comment is required. The usual inverse 9
potential is applicable to a flat surface of infinite extent. It is
obtained by integration over half-space of a repulsive-inverse
12 potential between the volume elements of the flat surface
and a given particle located a perpendicular distance outside
this surface. Its application to a cylinder with a small radius
and a finite length is questionable.)
Our Eq. 1 differs from Eq. 4 in Corry et al. (19), where
(Rc(z) 1 RW – a)9 appears in the denominator (note that Rc(z)
is the channel’s radius as a function of z and a is the ion’s
distance from the z axis). Their Eq. 4 does not give an inverse
9 relation to normal distance between ion and wall when the
angle of the tangent of the surface and the z axis is larger than
zero. Furthermore, using this radial distance, the ion-wall
potential is not defined for the region where the surface is
perpendicular to the z axis. This is the region near the protein
wall in the reservoir (jzj . 25 A), where Chung and co-
workers applied a hard wall to prevent the ions from crossing
the surface of the protein. We used our Eq. 1 because it gives
the same potential everywhere near the protein surface;
therefore, it is more consistent than the one used by Chung
and co-workers. In the selectivity filter (our main region of
interest), the two equations are equivalent.
Ion-ion potential
The ion-ion interaction of Chung and co-workers is taken to
be the pairwise sum of Coulomb interactions plus a short-
range interaction,
uSR
ij ðrijÞ ¼ U0
ij
Rc
ij
rij
� �9
�expR
h
ij � rij
ce
!cos 2p
Rh
ij � rij
cW
!( );
(2)
where the contact distance is Rcij ¼ Ri 1 Rj for cation-anion
pairs, while it is Rcij ¼ Ri 1 Rj 1 1:6 A for like ions, the origin
of the hydration force is Rhij ¼ Rc
ij 6 0:2 A (positive for like
ions and negative otherwise), cW ¼ 2.76 A, and ce ¼ 1 A.
The values of U0ij are 16.8, 8.5, 1.7, 2.5, 0.8, and 1.4 kT for
Ca21-Cl�, Na1-Cl�, Ca21-Na1, Na1-Na1, Ca21-Ca21, and
Cl�-Cl� pairs, respectively. The potential parameters were
fitted to the potentials of mean force given by Guardia et al.
(25–27).
The presence of the repulsive-inverse 9 term in Eq. 2
seems to disagree with the assertion of Chung and co-
workers that volume exclusion forces do not play a role in
3488 Boda et al.
Biophysical Journal 94(9) 3486–3496

their model. If this assertion were valid, the first term would
be unnecessary.
The purpose of the sum of the repulsive 1/r9 potential and
the exponentially decaying oscillating hydration force is to
mimic the results of molecular dynamics (MD) simulations.
Chung and co-workers assert that the radial distribu-
tion functions (RDFs) for NaCl that result from the use of
Eq. 2 are similar to those obtained by Lyubartsev and
Laaksonen (28) by a self-consistent iteration involving an
MD simulation.
Chung and co-workers find that the locations of the
maxima in their RDFs roughly match those of the MD
RDFs. Matching the location of the maxima only requires
that the effective ion diameters be reasonable. The height of
the maximum is a much more important issue that is not
mentioned in the articles by these authors. The maximum of
the Na1-Cl� RDF obtained from the model of Chung and
co-workers significantly underestimates the maximum ob-
tained from the MD simulation. As a matter of fact, it can be
seen in Fig. 2 of Corry et al. (19) that this maximum is lower
than the first maximum of the Na1-Na1 pair. It is a strange
electrolyte, indeed, where like ions attract each other more
strongly than cation-anion pairs. Lyubartsev and Laaksonen
(28) (their Fig. 3) shows the opposite behavior.
Corry et al. (19) claim that ‘‘simpler ion-ion interac-
tions . . . are not suitable for use in calcium channels’’ be-
cause ‘‘they allow cations to pass each other in the selectivity
filter, thus making it impossible to explain the observed
blocking of sodium ions by calcium, and vice versa.’’ It is our
belief that explanation of Ca21-block of Na1-current in Ca
channels does not require single filing (more about this later)
(7,12). Thus, the above reasoning for using Eq. 2 cannot be
accepted. Ions do not enter the narrow channel with their
whole hydration shell, therefore the potential fitted to bulk
simulation results cannot be applied.
Born energy
The ions in the model of Chung and co-workers experience
a change in Born energy at the axial locations where the
pore joins the baths (zc ¼ �22.5 A and zc ¼ 22.5 A). The
Born energy change upon entering the pore is
EB
i ¼q2
i
8pe0RB
i
1
e� 1
80
� �; (3)
where e ¼ 60 is the dielectric constant in the channel and
RBi is the Born radius of the ion species i of charge qi. In
the model of Chung and co-workers, the transition of Born
energy is smoothed over a 3 A interval centered on zc using
the interpolation
uB
i ðsÞ ¼EB
i
16ð3s
5 � 10s31 15s 1 8Þ; (4)
where s ¼ (z – zc)/(1.5 A) for the left boundary, and s ¼ –
(z – zc)/(1.5 A) for the right boundary.
Chung and co-workers refer to their earlier article (29)
for further description on this method, but we found the value
of EBi only for K1 ion. Therefore, we used Born radii fitted
to experimental hydration energies reported in the literature
(30) (�1608.3, �423.7, and �304.0 kJ/mol for Ca21, Na1,
and Cl�, respectively). The corresponding EBi values in kT
(at 298 K) are 2.737, 0.721, and 0.517 for Ca21, Na1, and
Cl�, respectively.
Chung et al. (29) qualify this procedure of accounting for
the difference in the polarization properties of pore and bath
as a ‘‘compromise.’’ In reality, the ions induce charge on the
dielectric boundary between pore and baths. The interaction
of every ion with that charge should be calculated in a self-
consistent treatment. Simulation of ions crossing dielectric
boundaries is difficult, which is the reason of the ‘‘compro-
mise’’ used by their group. With the dielectric boundary
effects described by the Born energy, Chung and co-workers
solve the electrostatics using a dielectric coefficient of 60
for the baths, which might produce unrealistically large
ion-ion interactions in the bath solutions.
The CSC model
We also study a realization of the CSC model. Here the
structural charges of the EEEE locus are placed inside the
FIGURE 2 Convergence of the MC simulation of the Chung and co-
workers’ model toward equilibrium. The average number of Na1 (upper
panel) and Ca21 (lower panel) ions is plotted versus the index of the attempt.
The baths contained 10�5 M CaCl2 plus 150 mM NaCl.
Volume Exclusion in Calcium Channels 3489
Biophysical Journal 94(9) 3486–3496
lumen of the channel rather than into a rigid channel wall
(Fig. 1 B). The channel is otherwise kept identical to that of
Chung and co-workers to focus the comparison on the dif-
ference in the placement of charged groups. The terminal
carboxylate groups of the glutamate residues are represented
in the CSC model as eight half-charged oxygen ions. Each
oxygen ion is a hard sphere with radius 1.4 A. The oxygen
ions are allowed to overlap with the wall of the filter, but their
center cannot approach the wall closer than 0.5 A. These
oxygen ions, that now are part of the electrolyte filling the
filter, are confined by a cylinder with radius 3.7 A and length
9.352 A. They are confined to be within this volume but are
otherwise free to move in this space. The oxygen ions interact
with other charges in the simulation cell through the Cou-
lomb potential. They interact with other ions (including other
oxygen ions and counterions) through the hard sphere po-
tential instead of the soft-core potential in Eq. 2. The hard-
core radii used for Na1, Ca21, and Cl� were 1, 0.99, and
1.81 A (31). (The soft-core potential is still used for pairs of
Na1, Ca21, and Cl� ions because we wish to convert the
model of Chung and co-workers to the CSC type of model
without making other changes.) The oxygen ions are not
subject to the soft interaction potential with the channel wall
in Eq. 1.
In the CSC model the glutamate groups occupy filter space
and they accommodate to the movement of passing cations so
the grand potential of the system is minimized. Note that
these structural charges now are in the dielectric domain of
the solution space, whereas in the model of Chung and co-
workers they are in the dielectric of the pore wall. This has
consequences for the polarization charge produced by these
structural ions on the protein/pore interface.
SIMULATION METHOD
MC simulations were performed in the grand canonical ensemble (32,33)
using the Metropolis sampling. Details of our sampling are described in Boda
et al. (18). In brief, our attempts for moving a particle included:
Step 1. Small changes in position (we use only this movement to dis-
place oxygen ions in the CSC model).
Step 2. Large changes in position.
Step 3. A preferential change between positions in the channel and bath
subvolumes.
Step 4. Insertion/removal of a neutral group of ions (Na1 and Cl�, or
Ca21 and 2Cl�) into/from the simulation cell (32).
Step 5. A GC attempt similar to Step 4, but involving preferred sub-
volumes of the simulation cell (Na1 and Ca21, the pore region; Cl�,
the whole simulation cell).
The acceptance criterion for preferential MC Step 3 considered the vol-
ume ratio of the respective regions. It was shown that this MC step accel-
erates sampling considerably (14).
The preferential GC Step 5 is an additional variety of MC attempt not used
in our previous works (9,17,18). It was included to accelerate convergence
toward equilibrium in these simulations. Without this step, we equilibrated
the bulk region of the simulation cell with an external bath of fixed chemical
potentials (and thus with fixed salt concentrations) and then we equilibrated
the channel region with this bulk region using the preference sampling of
Step 3. The basic idea of the new method is that we can equilibrate the
channel region with the external bath directly without applying the inter-
mediate step of equilibration with the bulk region of the cell. If a system is in
equilibrium with an external bath, any subsystem of it is also in equilibrium
with the external bath. Therefore, we can insert cations directly into the pore
and thus increase the percentage of MC steps occurring between the pore and
the external bath.
An example of convergence is shown in Fig. 2, where the number of Ca21
and Na1 ions in the selectivity filter (10 , z , 15 A) is plotted versus the
index of the attempt. The bath concentration of Ca21 in this test was 10�5 M,
a value important for the purpose of this article. The convergence of the
simulation is much faster when the preferential GC Step 5 is used (note
the logarithmic scale of the abscissa). A production run comprised 6 3 108 to
1.2 3 109 attempts.
In GC simulations, bath concentrations are a computed consequence of
the chemical potentials assigned to the ions in the system. We determined
chemical potentials needed to establish targeted bath concentrations using an
iteration (34). The reported bath concentrations are the average ion con-
centrations in the bulklike regions of our large baths.
In the BD simulations of Chung and co-workers, the charges induced
by ions on the dielectric boundaries were computed using a boundary ele-
ment method (35). The contributions of these charges to the field were
computed by an iterative method and tabulated for a set of ion positions;
during the BD simulation, the field contributions were estimated from
the tabulated values using interpolation considering the actual ion positions.
This method was chosen for computational efficiency.
In our MC simulation, we solve the electrostatics by a boundary element
method (18,36) that we called the induced charge-computation method.
Rather than using an iterative method we generate the LU-decomposition of
the matrix that results from the boundary integral equations. Since bound-
aries are fixed in space during our simulation, this computation can be done
as part of the overhead at the beginning of the simulation. Specific solutions
are obtained for each particle distribution during the MC simulation using
back-substitution. Thus our computation of potential does not involve in-
terpolations like those used by Chung and co-workers. We divide the
boundary surface into 1811 (generally curved) tiles (outlined by the grid
shown in Fig. 1) and use an accurate method to include surface curvature into
the computation of the electrostatics (18). Our simulation cell is considerably
larger (radius 64 A, length 300 A) than that used by Chung and co-workers.
This cell typically contains ;300 Na1. Thus, the baths in our simulations
approximate bulk conditions.
RESULTS AND DISCUSSION
Profiles of potential energy andion concentrations
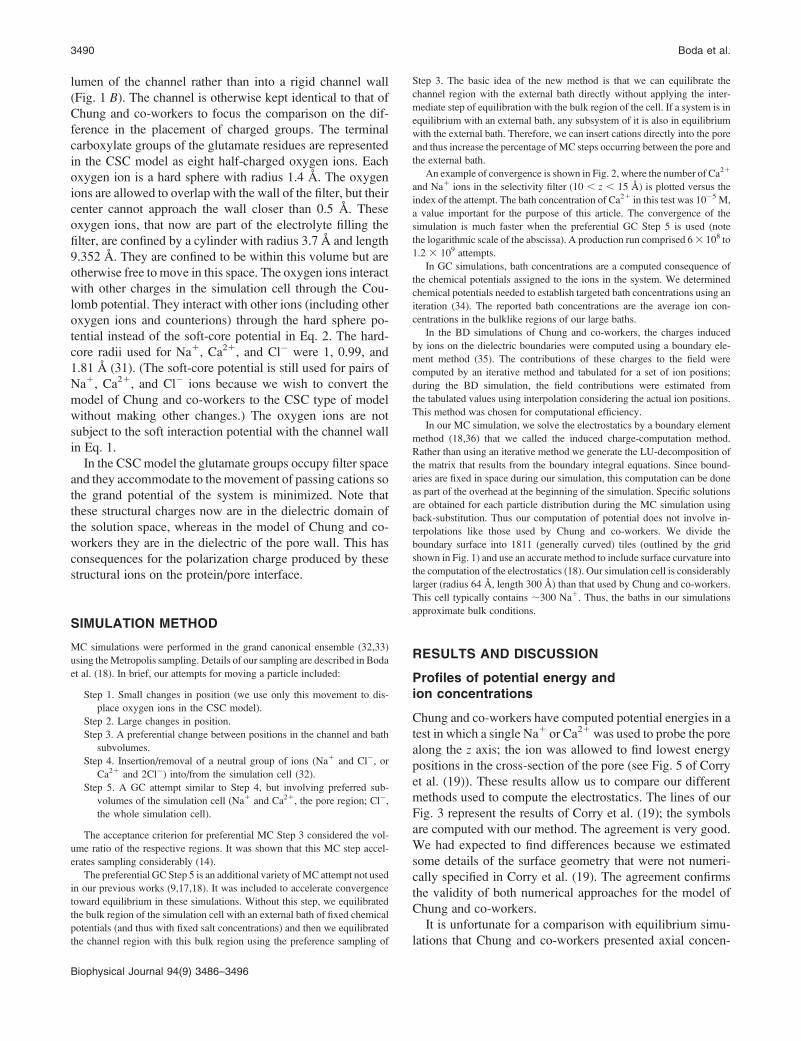
Chung and co-workers have computed potential energies in a
test in which a single Na1 or Ca21 was used to probe the pore
along the z axis; the ion was allowed to find lowest energy
positions in the cross-section of the pore (see Fig. 5 of Corry
et al. (19)). These results allow us to compare our different
methods used to compute the electrostatics. The lines of our
Fig. 3 represent the results of Corry et al. (19); the symbols
are computed with our method. The agreement is very good.
We had expected to find differences because we estimated
some details of the surface geometry that were not numeri-
cally specified in Corry et al. (19). The agreement confirms
the validity of both numerical approaches for the model of
Chung and co-workers.
It is unfortunate for a comparison with equilibrium simu-
lations that Chung and co-workers presented axial concen-
3490 Boda et al.
Biophysical Journal 94(9) 3486–3496
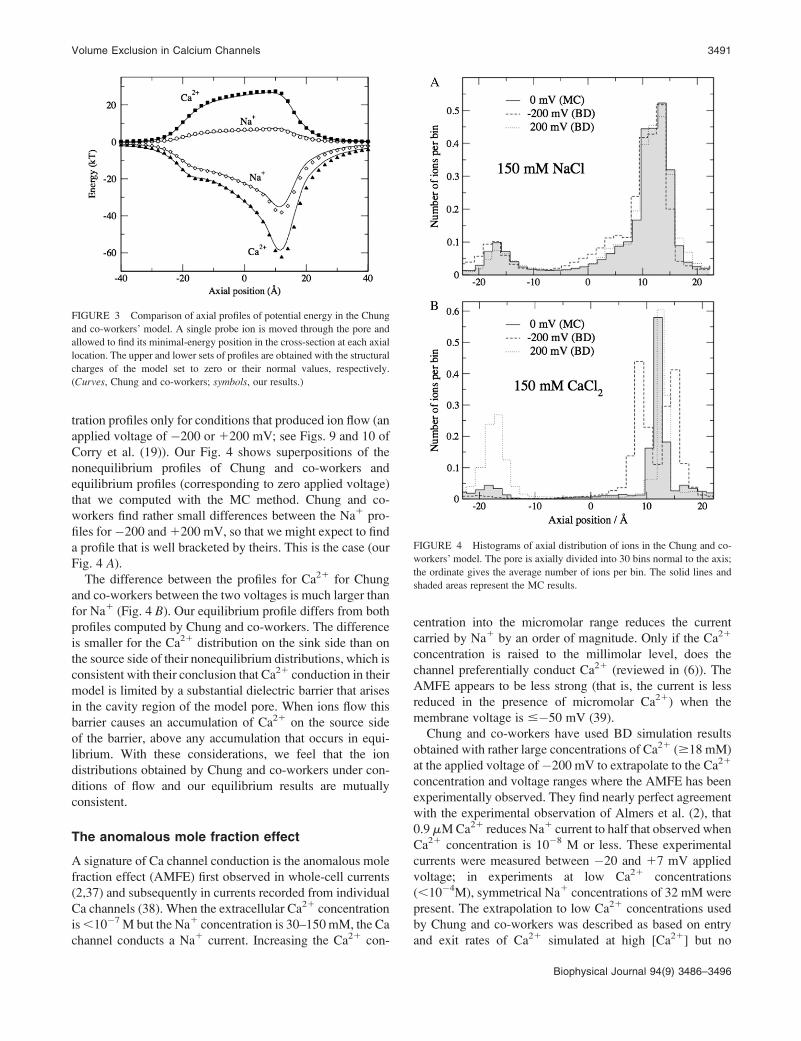
tration profiles only for conditions that produced ion flow (an
applied voltage of �200 or 1200 mV; see Figs. 9 and 10 of
Corry et al. (19)). Our Fig. 4 shows superpositions of the
nonequilibrium profiles of Chung and co-workers and
equilibrium profiles (corresponding to zero applied voltage)
that we computed with the MC method. Chung and co-
workers find rather small differences between the Na1 pro-
files for�200 and 1200 mV, so that we might expect to find
a profile that is well bracketed by theirs. This is the case (our
Fig. 4 A).
The difference between the profiles for Ca21 for Chung
and co-workers between the two voltages is much larger than
for Na1 (Fig. 4 B). Our equilibrium profile differs from both
profiles computed by Chung and co-workers. The difference
is smaller for the Ca21 distribution on the sink side than on
the source side of their nonequilibrium distributions, which is
consistent with their conclusion that Ca21 conduction in their
model is limited by a substantial dielectric barrier that arises
in the cavity region of the model pore. When ions flow this
barrier causes an accumulation of Ca21 on the source side
of the barrier, above any accumulation that occurs in equi-
librium. With these considerations, we feel that the ion
distributions obtained by Chung and co-workers under con-
ditions of flow and our equilibrium results are mutually
consistent.
The anomalous mole fraction effect
A signature of Ca channel conduction is the anomalous mole
fraction effect (AMFE) first observed in whole-cell currents
(2,37) and subsequently in currents recorded from individual
Ca channels (38). When the extracellular Ca21 concentration
is ,10�7 M but the Na1 concentration is 30–150 mM, the Ca
channel conducts a Na1 current. Increasing the Ca21 con-
centration into the micromolar range reduces the current
carried by Na1 by an order of magnitude. Only if the Ca21
concentration is raised to the millimolar level, does the
channel preferentially conduct Ca21 (reviewed in (6)). The
AMFE appears to be less strong (that is, the current is less
reduced in the presence of micromolar Ca21) when the
membrane voltage is #�50 mV (39).
Chung and co-workers have used BD simulation results
obtained with rather large concentrations of Ca21 ($18 mM)
at the applied voltage of�200 mV to extrapolate to the Ca21
concentration and voltage ranges where the AMFE has been
experimentally observed. They find nearly perfect agreement
with the experimental observation of Almers et al. (2), that
0.9 mM Ca21 reduces Na1 current to half that observed when
Ca21 concentration is 10�8 M or less. These experimental
currents were measured between �20 and 17 mV applied
voltage; in experiments at low Ca21 concentrations
(,10�4M), symmetrical Na1 concentrations of 32 mM were
present. The extrapolation to low Ca21 concentrations used
by Chung and co-workers was described as based on entry
and exit rates of Ca21 simulated at high [Ca21] but no
FIGURE 3 Comparison of axial profiles of potential energy in the Chung
and co-workers’ model. A single probe ion is moved through the pore and
allowed to find its minimal-energy position in the cross-section at each axial
location. The upper and lower sets of profiles are obtained with the structural
charges of the model set to zero or their normal values, respectively.
(Curves, Chung and co-workers; symbols, our results.)
FIGURE 4 Histograms of axial distribution of ions in the Chung and co-
workers’ model. The pore is axially divided into 30 bins normal to the axis;
the ordinate gives the average number of ions per bin. The solid lines and
shaded areas represent the MC results.
Volume Exclusion in Calcium Channels 3491
Biophysical Journal 94(9) 3486–3496
mathematical description of the procedure was provided in
their article. The extrapolation to experimental voltages is
questionable, because it is unknown whether the physical
conditions underlying the AMFE arise in a biological channel
tested at �200 mV. Experiments are done at voltages much
smaller in magnitude than�200 mV. Indeed, Fukushima and
Hagiwara (39) found that the AMFE is substantially weak-
ened when the test voltage is #�50 mV.
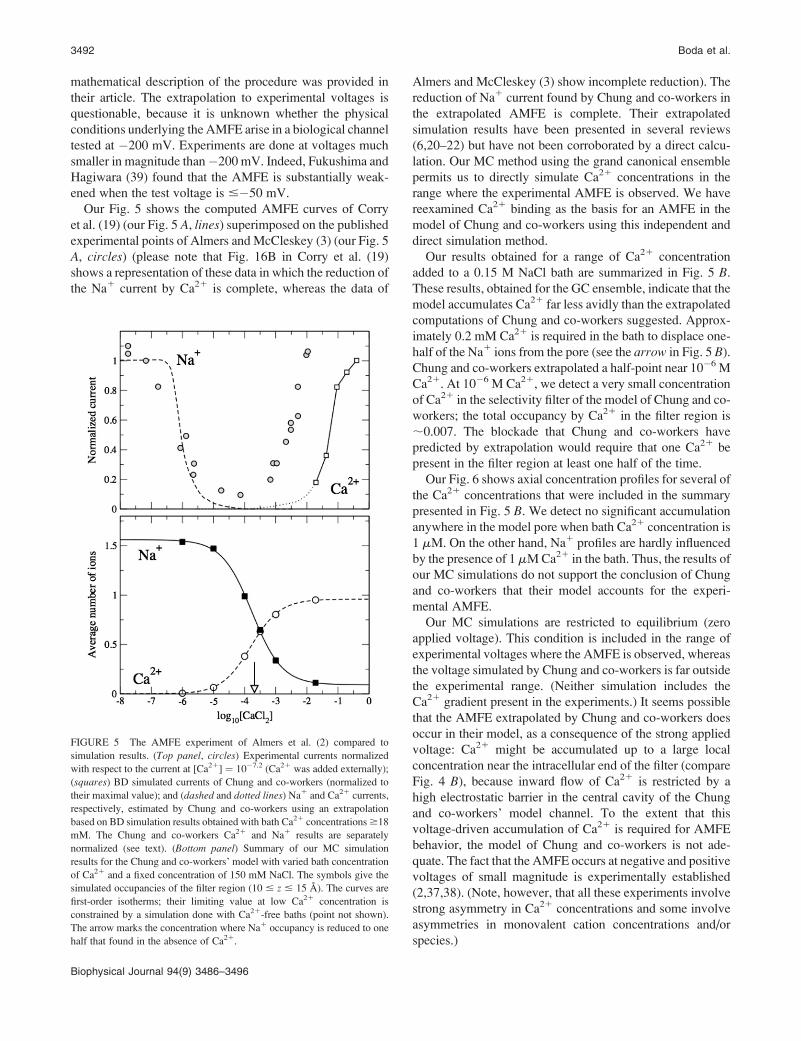
Our Fig. 5 shows the computed AMFE curves of Corry
et al. (19) (our Fig. 5 A, lines) superimposed on the published
experimental points of Almers and McCleskey (3) (our Fig. 5
A, circles) (please note that Fig. 16B in Corry et al. (19)
shows a representation of these data in which the reduction of
the Na1 current by Ca21 is complete, whereas the data of
Almers and McCleskey (3) show incomplete reduction). The
reduction of Na1 current found by Chung and co-workers in
the extrapolated AMFE is complete. Their extrapolated
simulation results have been presented in several reviews
(6,20–22) but have not been corroborated by a direct calcu-
lation. Our MC method using the grand canonical ensemble
permits us to directly simulate Ca21 concentrations in the
range where the experimental AMFE is observed. We have
reexamined Ca21 binding as the basis for an AMFE in the
model of Chung and co-workers using this independent and
direct simulation method.
Our results obtained for a range of Ca21 concentration
added to a 0.15 M NaCl bath are summarized in Fig. 5 B.
These results, obtained for the GC ensemble, indicate that the
model accumulates Ca21 far less avidly than the extrapolated
computations of Chung and co-workers suggested. Approx-
imately 0.2 mM Ca21 is required in the bath to displace one-
half of the Na1 ions from the pore (see the arrow in Fig. 5 B).
Chung and co-workers extrapolated a half-point near 10�6 M
Ca21. At 10�6 M Ca21, we detect a very small concentration
of Ca21 in the selectivity filter of the model of Chung and co-
workers; the total occupancy by Ca21 in the filter region is
;0.007. The blockade that Chung and co-workers have
predicted by extrapolation would require that one Ca21 be
present in the filter region at least one half of the time.
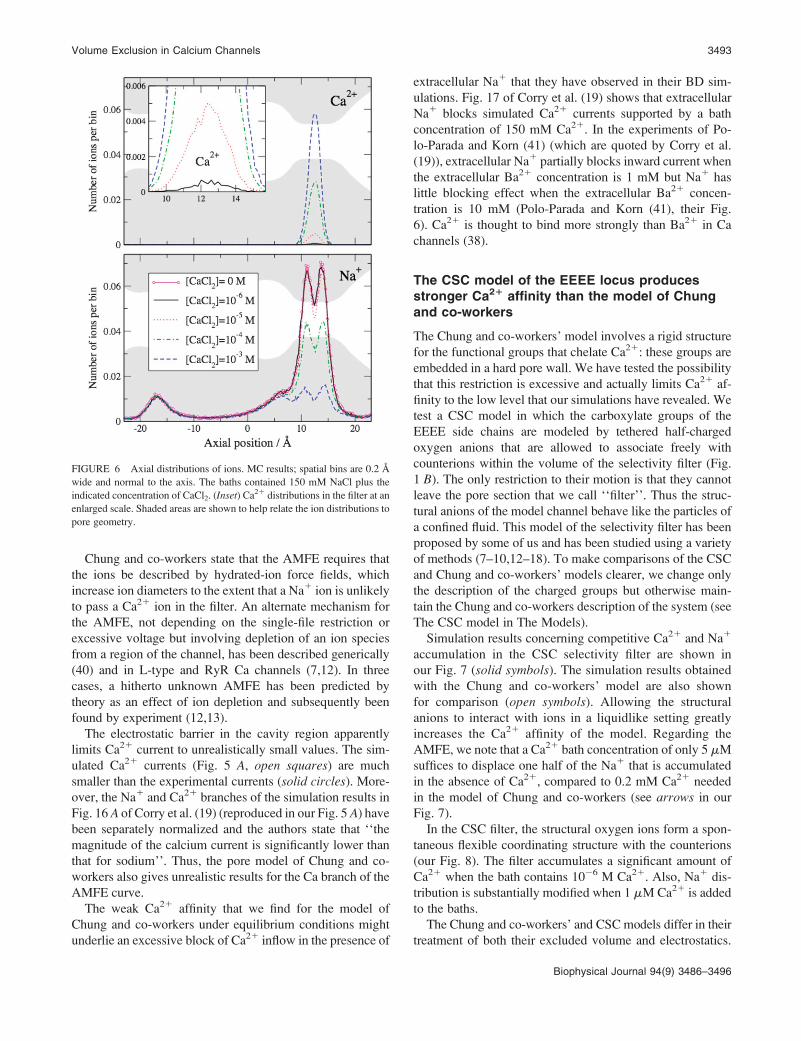
Our Fig. 6 shows axial concentration profiles for several of
the Ca21 concentrations that were included in the summary
presented in Fig. 5 B. We detect no significant accumulation
anywhere in the model pore when bath Ca21 concentration is
1 mM. On the other hand, Na1 profiles are hardly influenced
by the presence of 1 mM Ca21 in the bath. Thus, the results of
our MC simulations do not support the conclusion of Chung
and co-workers that their model accounts for the experi-
mental AMFE.
Our MC simulations are restricted to equilibrium (zero
applied voltage). This condition is included in the range of
experimental voltages where the AMFE is observed, whereas
the voltage simulated by Chung and co-workers is far outside
the experimental range. (Neither simulation includes the
Ca21 gradient present in the experiments.) It seems possible
that the AMFE extrapolated by Chung and co-workers does
occur in their model, as a consequence of the strong applied
voltage: Ca21 might be accumulated up to a large local
concentration near the intracellular end of the filter (compare
Fig. 4 B), because inward flow of Ca21 is restricted by a
high electrostatic barrier in the central cavity of the Chung
and co-workers’ model channel. To the extent that this
voltage-driven accumulation of Ca21 is required for AMFE
behavior, the model of Chung and co-workers is not ade-
quate. The fact that the AMFE occurs at negative and positive
voltages of small magnitude is experimentally established
(2,37,38). (Note, however, that all these experiments involve
strong asymmetry in Ca21 concentrations and some involve
asymmetries in monovalent cation concentrations and/or
species.)
FIGURE 5 The AMFE experiment of Almers et al. (2) compared to
simulation results. (Top panel, circles) Experimental currents normalized
with respect to the current at [Ca21] ¼ 10�7.2 (Ca21 was added externally);
(squares) BD simulated currents of Chung and co-workers (normalized to
their maximal value); and (dashed and dotted lines) Na1 and Ca21 currents,
respectively, estimated by Chung and co-workers using an extrapolation
based on BD simulation results obtained with bath Ca21 concentrations $18
mM. The Chung and co-workers Ca21 and Na1 results are separately
normalized (see text). (Bottom panel) Summary of our MC simulation
results for the Chung and co-workers’ model with varied bath concentration
of Ca21 and a fixed concentration of 150 mM NaCl. The symbols give the
simulated occupancies of the filter region (10 # z # 15 A). The curves are
first-order isotherms; their limiting value at low Ca21 concentration is
constrained by a simulation done with Ca21-free baths (point not shown).
The arrow marks the concentration where Na1 occupancy is reduced to one
half that found in the absence of Ca21.
3492 Boda et al.
Biophysical Journal 94(9) 3486–3496
Chung and co-workers state that the AMFE requires that
the ions be described by hydrated-ion force fields, which
increase ion diameters to the extent that a Na1 ion is unlikely
to pass a Ca21 ion in the filter. An alternate mechanism for
the AMFE, not depending on the single-file restriction or
excessive voltage but involving depletion of an ion species
from a region of the channel, has been described generically
(40) and in L-type and RyR Ca channels (7,12). In three
cases, a hitherto unknown AMFE has been predicted by
theory as an effect of ion depletion and subsequently been
found by experiment (12,13).
The electrostatic barrier in the cavity region apparently
limits Ca21 current to unrealistically small values. The sim-
ulated Ca21 currents (Fig. 5 A, open squares) are much
smaller than the experimental currents (solid circles). More-
over, the Na1 and Ca21 branches of the simulation results in
Fig. 16 A of Corry et al. (19) (reproduced in our Fig. 5 A) have
been separately normalized and the authors state that ‘‘the
magnitude of the calcium current is significantly lower than
that for sodium’’. Thus, the pore model of Chung and co-
workers also gives unrealistic results for the Ca branch of the
AMFE curve.
The weak Ca21 affinity that we find for the model of
Chung and co-workers under equilibrium conditions might
underlie an excessive block of Ca21 inflow in the presence of
extracellular Na1 that they have observed in their BD sim-
ulations. Fig. 17 of Corry et al. (19) shows that extracellular
Na1 blocks simulated Ca21 currents supported by a bath
concentration of 150 mM Ca21. In the experiments of Po-
lo-Parada and Korn (41) (which are quoted by Corry et al.
(19)), extracellular Na1 partially blocks inward current when
the extracellular Ba21 concentration is 1 mM but Na1 has
little blocking effect when the extracellular Ba21 concen-
tration is 10 mM (Polo-Parada and Korn (41), their Fig.
6). Ca21 is thought to bind more strongly than Ba21 in Ca
channels (38).
The CSC model of the EEEE locus producesstronger Ca21 affinity than the model of Chungand co-workers
The Chung and co-workers’ model involves a rigid structure
for the functional groups that chelate Ca21: these groups are
embedded in a hard pore wall. We have tested the possibility
that this restriction is excessive and actually limits Ca21 af-
finity to the low level that our simulations have revealed. We
test a CSC model in which the carboxylate groups of the
EEEE side chains are modeled by tethered half-charged
oxygen anions that are allowed to associate freely with
counterions within the volume of the selectivity filter (Fig.
1 B). The only restriction to their motion is that they cannot
leave the pore section that we call ‘‘filter’’. Thus the struc-
tural anions of the model channel behave like the particles of
a confined fluid. This model of the selectivity filter has been
proposed by some of us and has been studied using a variety
of methods (7–10,12–18). To make comparisons of the CSC
and Chung and co-workers’ models clearer, we change only
the description of the charged groups but otherwise main-
tain the Chung and co-workers description of the system (see
The CSC model in The Models).
Simulation results concerning competitive Ca21 and Na1
accumulation in the CSC selectivity filter are shown in
our Fig. 7 (solid symbols). The simulation results obtained
with the Chung and co-workers’ model are also shown
for comparison (open symbols). Allowing the structural
anions to interact with ions in a liquidlike setting greatly
increases the Ca21 affinity of the model. Regarding the
AMFE, we note that a Ca21 bath concentration of only 5 mM
suffices to displace one half of the Na1 that is accumulated
in the absence of Ca21, compared to 0.2 mM Ca21 needed
in the model of Chung and co-workers (see arrows in our
Fig. 7).
In the CSC filter, the structural oxygen ions form a spon-
taneous flexible coordinating structure with the counterions
(our Fig. 8). The filter accumulates a significant amount of
Ca21 when the bath contains 10�6 M Ca21. Also, Na1 dis-
tribution is substantially modified when 1 mM Ca21 is added
to the baths.
The Chung and co-workers’ and CSC models differ in their
treatment of both their excluded volume and electrostatics.
FIGURE 6 Axial distributions of ions. MC results; spatial bins are 0.2 A
wide and normal to the axis. The baths contained 150 mM NaCl plus the
indicated concentration of CaCl2. (Inset) Ca21 distributions in the filter at an
enlarged scale. Shaded areas are shown to help relate the ion distributions to
pore geometry.
Volume Exclusion in Calcium Channels 3493
Biophysical Journal 94(9) 3486–3496
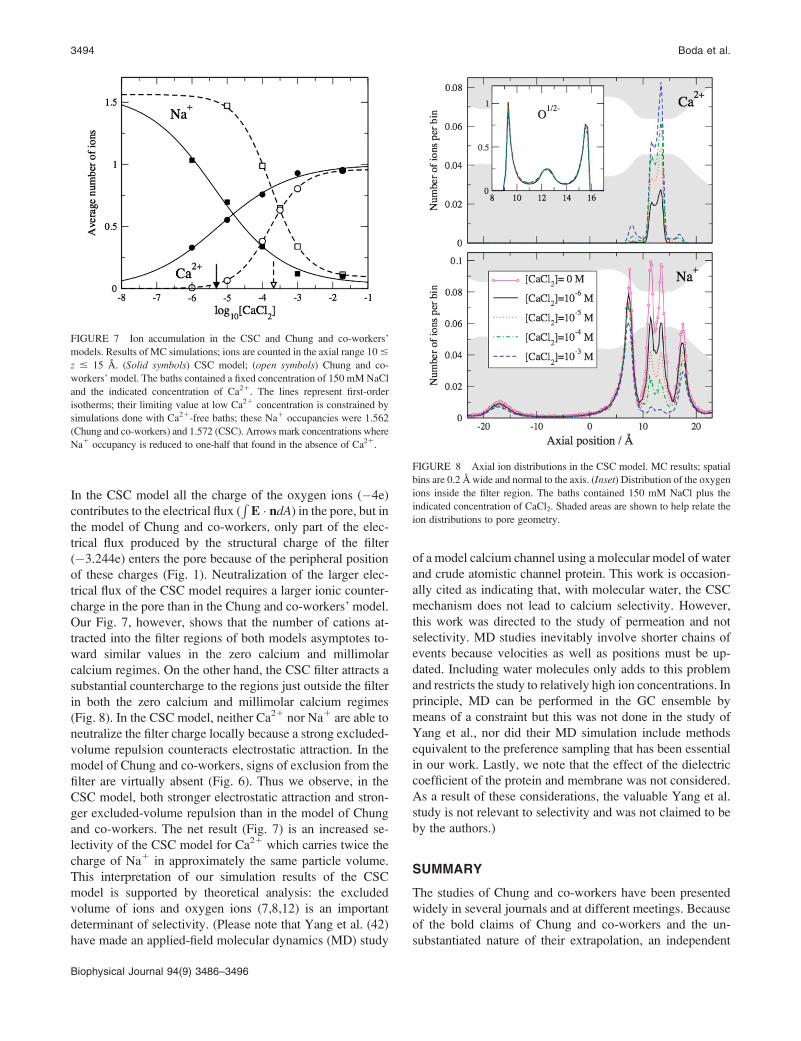
In the CSC model all the charge of the oxygen ions (�4e)
contributes to the electrical flux (R
E � ndA) in the pore, but in
the model of Chung and co-workers, only part of the elec-
trical flux produced by the structural charge of the filter
(�3.244e) enters the pore because of the peripheral position
of these charges (Fig. 1). Neutralization of the larger elec-
trical flux of the CSC model requires a larger ionic counter-
charge in the pore than in the Chung and co-workers’ model.
Our Fig. 7, however, shows that the number of cations at-
tracted into the filter regions of both models asymptotes to-
ward similar values in the zero calcium and millimolar
calcium regimes. On the other hand, the CSC filter attracts a
substantial countercharge to the regions just outside the filter
in both the zero calcium and millimolar calcium regimes
(Fig. 8). In the CSC model, neither Ca21 nor Na1 are able to
neutralize the filter charge locally because a strong excluded-
volume repulsion counteracts electrostatic attraction. In the
model of Chung and co-workers, signs of exclusion from the
filter are virtually absent (Fig. 6). Thus we observe, in the
CSC model, both stronger electrostatic attraction and stron-
ger excluded-volume repulsion than in the model of Chung
and co-workers. The net result (Fig. 7) is an increased se-
lectivity of the CSC model for Ca21 which carries twice the
charge of Na1 in approximately the same particle volume.
This interpretation of our simulation results of the CSC
model is supported by theoretical analysis: the excluded
volume of ions and oxygen ions (7,8,12) is an important
determinant of selectivity. (Please note that Yang et al. (42)
have made an applied-field molecular dynamics (MD) study
of a model calcium channel using a molecular model of water
and crude atomistic channel protein. This work is occasion-
ally cited as indicating that, with molecular water, the CSC
mechanism does not lead to calcium selectivity. However,
this work was directed to the study of permeation and not
selectivity. MD studies inevitably involve shorter chains of
events because velocities as well as positions must be up-
dated. Including water molecules only adds to this problem
and restricts the study to relatively high ion concentrations. In
principle, MD can be performed in the GC ensemble by
means of a constraint but this was not done in the study of
Yang et al., nor did their MD simulation include methods
equivalent to the preference sampling that has been essential
in our work. Lastly, we note that the effect of the dielectric
coefficient of the protein and membrane was not considered.
As a result of these considerations, the valuable Yang et al.
study is not relevant to selectivity and was not claimed to be
by the authors.)
SUMMARY
The studies of Chung and co-workers have been presented
widely in several journals and at different meetings. Because
of the bold claims of Chung and co-workers and the un-
substantiated nature of their extrapolation, an independent
FIGURE 8 Axial ion distributions in the CSC model. MC results; spatial
bins are 0.2 A wide and normal to the axis. (Inset) Distribution of the oxygen
ions inside the filter region. The baths contained 150 mM NaCl plus the
indicated concentration of CaCl2. Shaded areas are shown to help relate the
ion distributions to pore geometry.
FIGURE 7 Ion accumulation in the CSC and Chung and co-workers’
models. Results of MC simulations; ions are counted in the axial range 10 #
z # 15 A. (Solid symbols) CSC model; (open symbols) Chung and co-
workers’ model. The baths contained a fixed concentration of 150 mM NaCl
and the indicated concentration of Ca21. The lines represent first-order
isotherms; their limiting value at low Ca21 concentration is constrained by
simulations done with Ca21-free baths; these Na1 occupancies were 1.562
(Chung and co-workers) and 1.572 (CSC). Arrows mark concentrations where
Na1 occupancy is reduced to one-half that found in the absence of Ca21.
3494 Boda et al.
Biophysical Journal 94(9) 3486–3496

investigation is essential. We have performed MC simula-
tions for the Chung and co-workers’ model channel. We have
constructed an accurate representation of their model and
obtained good agreement in computations of energy and of
channel occupancy with pure bath solutions for which they
report BD results. In addition, we have made GC ensemble
simulations for Ca21 concentrations as low as 10�6 M in the
presence of 150 mM Na1. These simulations reveal a Ca21
affinity that is much weaker than the extrapolation of Chung
and co-workers would suggest, and is much less than the
affinity commonly ascribed to the L-type Ca channel.
Placement of the structural elements of the channel within the
filter (the CSC model of the EEEE locus) improves the cal-
cium selectivity by 40-fold. Reconsideration of other features
of the model of Chung and co-workers including a dielectric
barrier of excessive magnitude may also be warranted. Re-
garding the mechanism for high Ca21 selectivity, volume
exclusion among the ions and the glutamate oxygens is an
integral part of the function of Ca channels that should not be
ignored.
A generous allotment of computer time by the Ira and Marylou Fulton
Supercomputing Center at Brigham Young University is acknowledged
with thanks.
The support of the National Institutes of Health (grant No. GM076013 to
B.E. and grant No. GM067241 to B.E. and D.G.) and the Hungarian
National Research Fund (OTKA No. K63322, to D.B.) are gratefully
acknowledged.
REFERENCES
1. Hille, B. 2001. Ionic Channels of Excitable Membranes. SinauerAssociates, Sunderland, MA.
2. Almers, W., E. McCleskey, and P. Palade. 1984. Non-selective cationconductance in frog muscle membrane blocked by micromolar externalcalcium ions. J. Physiol. 353:565–583.
3. Almers, W., and E. McCleskey. 1984. Non-selective conductance incalcium channels of frog muscle: calcium selectivity in a single-filepore. J. Physiol. 353:585–608.
4. Ellinor, P., J. Yang, W. Sather, J. Zhang, and R. Tsien. 1995. Ca21
channel selectivity at a single locus for high-affinity Ca21 interactions.Neuron. 15:1121–1132.
5. Yang, J., P. Ellinor, W. Sather, J. Zhang, and R. Tsien. 1993. Molec-ular determinants of Ca21 selectivity and ion permeation in L-typeCa21 channels. Nature. 366:158–161.
6. Sather, W., and E. McCleskey. 2003. Permeation and selectivity incalcium channels. Annu. Rev. Physiol. 65:133–159.
7. Nonner, W., L. Catacuzzeno, and B. Eisenberg. 2000. Binding andselectivity in L-type Ca channels: a mean spherical approximation.Biophys. J. 79:1976–1992.
8. Nonner, W., D. Gillespie, D. Henderson, and B. Eisenberg. 2001. Ionaccumulation in a biological calcium channel: effects of solvent andconfining pressure. J. Phys. Chem. B. 105:6427–6436.
9. Boda, D., W. Nonner, M. Valisko, D. Henderson, B. Eisenberg, and D.Gillespie. 2007. Steric selectivity in Na channels arising from proteinpolarization and mobile side chains. Biophys. J. 93:1960–1980.
10. Boda, D., D. Busath, B. Eisenberg, D. Henderson, and W. Nonner.2002. Monte Carlo simulations of ion selectivity in a biological Na1
channel: charge-space competition. Phys. Chem. Chem. Phys. 4:5154–5160.
11. Barker, J., and D. Henderson. 1976. What is ‘‘liquid’’? Understandingthe states of matter. Rev. Mod. Phys. 48:587–671.
12. Gillespie, D. 2008. Energetics of divalent selectivity in a calciumchannel: the ryanodine receptor case study. Biophys. J. 94:1169–1184.
13. Gillespie, D., L. Xu, Y. Wang, and G. Meissner. 2005. (De)construct-ing the ryanodine receptor: modeling ion permeation and selectivity ofthe calcium release channel. J. Phys. Chem. B. 109:15598–15610.
14. Boda, D., D. Henderson, and D. Busath. 2002. Monte Carlo study ofthe selectivity of calcium channels: improved geometrical mode. Mol.Phys. 100:2361–2368.
15. Boda, D., D. Henderson, and D. Busath. 2001. Monte Carlo study ofthe effect of ion and channel size on the selectivity of a model calciumchannel. J. Phys. Chem. B. 105:11574–11577.
16. Boda, D., D. Busath, D. Henderson, and S. Sokolowski. 2000. MonteCarlo simulations of the mechanism of channel selectivity: the com-petition between volume exclusion and charge neutrality. J. Phys.Chem. B. 104:8903–8910.
17. Boda, D., M. Valisko, B. Eisenberg, W. Nonner, D. Henderson, and D.Gillespie. 2007. The combined effect of pore radius and proteindielectric coefficient on the selectivity of a calcium channel. Phys.Rev. Lett. 98:168102.
18. Boda, D., M. Valisko, B. Eisenberg, W. Nonner, D. Henderson, and D.Gillespie. 2006. The effect of protein dielectric coefficient on the ionicselectivity of a calcium channel. J. Chem. Phys. 125:034901.
19. Corry, B., T. Allen, S. Kuyucak, and S. Chung. 2001. Mechanisms ofpermeation and selectivity in calcium channels. Biophys. J. 80:195–214.
20. Krishnamurthy, V., and S. Chung. 2007. Large-scale dynamical modelsand estimation for permeation in biological membrane ion channels.Proc. IEEE. 95:853–880.
21. Corry, B., and S. Chung. 2006. Mechanisms of valence selectivity inbiological ion channels. Cell. Mol. Life Sci. 63:301–315.
22. Corry, B., T. Vora, and S. Chung. 2006. Electrostatic basis of valenceselectivity in cationic channels. Biochim. Biophys. Acta. 1711:72–86.
23. Corry, B., M. Hoyles, T. Allen, M. Walker, S. Kuyucak, and S. Chung.2002. Reservoir boundaries in Brownian dynamics simulations of ionchannels. Biophys. J. 82:1975–1984.
24. Im, W., S. Seefeld, and B. Roux. 2000. A grand canonical Monte Carlo-Brownian dynamics algorithm for simulating ion channels. Biophys. J.79:788–801.
25. Guardia, E., and J. Padro. 1996. On the influence of ionic charge on themean force potential of ion pairs in water. J. Chem. Phys. 104:7219–7222.
26. Guardia, E., R. Rey, and J. Padro. 1991. Na1-Na1 and Cl�-Cl� ionpairs in water: mean force potentials by constrained molecular dynam-ics. J. Chem. Phys. 95:2823–2831.
27. Guardia, E., R. Rey, and J. Padro. 1991. Potential of mean force byconstrained molecular dynamics: a sodium chloride ion-pair in water.Chem. Phys. 155:187–195.
28. Lyubartsev, A., and A. Laaksonen. 1995. Calculation of the effectiveinteraction potentials from radial distribution functions: a reverseMonte Carlo approach. Phys. Rev. E Stat. Phys. Plasmas Fluids Relat.Interdiscip. Topics. 52:3730–3737.
29. Chung, S., T. Allen, M. Hoyles, and S. Kuyucak. 1999. Permeation ofions across the potassium channel: Brownian dynamics studies.Biophys. J. 77:2517–2533.
30. Fawcett, W. 1999. Thermodynamic parameters for the solvation ofmonatomic ions in water. J. Phys. Chem. B. 103:11181–11185.
31. Shannon, R., and C. Previtt. 1969. Effective ionic radii in oxides andfluorides. Acta Crystallogr. B. 25:925–946.
32. Valleau, J., and L. Cohen. 1980. Primitive model electrolytes. I. Grandcanonical Monte Carlo computations. J. Chem. Phys. 72:5935–5941.
33. Gibbs, J. 1948. Elementary Principles of Statistical Mechanics. YaleUniversity Press, New Haven, CT.
34. Malasics, A. D., D. Gillespie, and D. Boda. 2008. Simulating pre-scribed particle densities in the grand canonical ensemble usingiterative algorithms. J. Chem. Phys. In press.
Volume Exclusion in Calcium Channels 3495
Biophysical Journal 94(9) 3486–3496
35. Hoyles, M., S. Kuyucak, and S. Chung. 1998. Solutions of Poisson’sequation in channel-like geometries. Comput. Phys. Commun. 115:45–68.
36. Boda, D., D. Gillespie, W. Nonner, D. Henderson, and B. Eisenberg.2004. Computing induced charges in inhomogeneous dielectric media:application in a Monte Carlo simulation of complex ionic systems.Phys. Rev. E Stat. Nonlin. Soft Matter Phys. 69:046702.
37. Kostyuk, P., S. Mironov, and Y. Shuba. 1983. Two ion-selective filtersin the calcium channel of the somatic membrane of mollusk neurons.J. Membr. Biol. 76:83–93.
38. Lansman, J., P. Hess, and R. Tsien. 1986. Blockade of current through singlecalcium channels by Cd21, Mg21, and Ca21. Voltage and concentrationdependence of calcium entry into the pore. J. Gen. Physiol. 88:321–347.
39. Fukushima, A., and S. Hagiwara. 1985. Currents carried by monova-lent cations through calcium channels in mouse neoplastic B lympho-cytes. J. Physiol. 358:255–284.
40. Nonner, W., D. Chen, and B. Eisenberg. 1998. Anomalous molefraction effect, electrostatics, and binding in ionic channels. Biophys.J. 74:2327–2334.
41. Polo-Parada, L., and S. Korn. 1997. Block of N-type calcium channelsin chick sensory neurons by external sodium. J. Gen. Physiol. 109:693–702.
42. Yang, Y., D. Henderson, and D. Busath. 2003. Applied-field moleculardynamics study of a model calcium channel selectivity filter. J. Chem.Phys. 118:4213–4220.
3496 Boda et al.
Biophysical Journal 94(9) 3486–3496
Copyright © 2022 FDOKUMEN