
“Smart Yoghurt” – Combining innovative technologies towards ...
88
NTNU Norwegian University of Science and Technology Faculty of Natural Sciences Department of Biotechnology and Food Science Master’s thesis Mari Varhaug “Smart Yoghurt” – Combining innovative technologies towards more efficient yoghurt manufacturing The potential of non-thermal combination technology with CO 2 , high-pressure processing and ultrasound to improve the efficiency and sustainability of yoghurt manufacturing while maintaining product quality and storage stability of yoghurt produced with heat treatment Master’s thesis in Biotechnology Supervisor: Kari Helgetun Langfoss
-
Upload
khangminh22 -
Category
Documents
-
view
1 -
download
0
Transcript of “Smart Yoghurt” – Combining innovative technologies towards ...

NTN
UN
orw
egia
n U
nive
rsity
of S
cien
ce a
nd T
echn
olog
yFa
culty
of N
atur
al S
cien
ces
Dep
artm
ent o
f Bio
tech
nolo
gy a
nd F
ood
Scie
nce
Mas
ter’s
thes
is
Mari Varhaug
“Smart Yoghurt” – Combining innovativetechnologies towards more efficientyoghurt manufacturing
The potential of non-thermal combinationtechnology with CO2, high-pressure processing andultrasound to improve the efficiency andsustainability of yoghurt manufacturing whilemaintaining product quality and storage stability ofyoghurt produced with heat treatment
Master’s thesis in Biotechnology
Supervisor: Kari Helgetun Langfoss


I
Abstract
Heat treatment (>80 °C, up to 30 min) can comprise the nutritional and organoleptic
properties of dairy products. To this end, non-thermal technologies have gained attention e.g.
high-pressure processing (HPP), ultrasound (US) and carbon dioxide (CO2), implemented alone
or in combination as an eco-friendly alternative to heat treatment. In this study, reconstituted
skim milk was subjected to either heat treatment (85 C° for 20 min, followed by inoculation
with starter culture) as control or to a sequential process of CO2-HPP-US (combination
technology) according to the 23 full factorial design as follow: the milk sample was packaged
with CO2 in a sous-vide pouch and immediately subjected to HPP (400 or 600 MPa, for 5 or 15
min) prior to the inoculation and US treatment (68 kHz, 300 W, for 5 or 15 min at 42 °C). This
led to eight combinations of HPP pressure, HPP time and US time. All samples were fermented
at 42 °C until the pH reached ~4.6 and the resulting yoghurt gel was stored at 4°C overnight.
The combination technology, especially with the US treatment for 15 min reduced the
total fermentation time compared to the traditional heat treatment. The yoghurt gel produced
with HPP 400 MPa for 15 min exhibited the viscoelastic properties comparable to those of the
control sample, but with a larger standard deviation indicating a variability in the gelation
process. The lower yield strain and stress of the yoghurt gel indicated that the use of the
combination technology in general resulted in more brittle gel with a weaker interconnectivity
within the gel network compared to the control sample. Based on the total fermentation time
and the viscoelastic and textural properties of the yoghurt gel, the combination technology 400
MPa, 15 min, US 15 min, was selected for further characterisation as compared to the heat
treatment, including the microbial dynamics during the fermentation and native- and SDS-
PAGE analysis of the milk proteins. In addition, the storage stability of the sample was assessed
after 1, 7, 14, 21, 28 and 42 days of storage at 4°C with the vial count of the starter culture,
titratable acidity and whey separation. The microbial dynamics during the fermentation were
similar for the samples subjected to the heat treatment and the combination technology 400
MPa, 15 min, US 15 min, indicating the processing conditions did not influence the growth and
metabolic activities of the starter culture. During storage, the yoghurt gel produced with the
heat treatment or the combination technology showed similar viable count of the starter culture,
postacidification and titratable acidity, but different amount of whey separation.

II

III
Sammendrag
Tradisjonell varmebehandling (>80 °C, inntil 30 min) kan påvirke de ernæringsmessige
og organoleptiske egenskapene til meieriprodukter negativt, og påvirker også industriens øko-
fotavtrykk. Teknologier som ikke tar i bruk varme har fått oppmerksomhet, f.eks.
høytrykksprosessering (HPP), ultralyd (US) og bruk av karbondioksid (CO2), enten alene eller
kombinert, som et miljøvennlig alternativ til varmebehandling i meieriindustrien. Rekonstituert
skummetmelk ble enten utsatt for varmebehandling (85 °C i 20 min, etterfulgt av inokulering
med starter kultur) som en kontroll eller en sekvensiell behandling av CO2-HPP-US
(kombinasjonsteknologi) i et 23 fullt faktorialt forsøk som følger: melkeprøven ble pakket med
CO2 i en sous-vide pose og umiddelbart behandlet med HPP (400 eller 600 MPa, 5 eller 15
min), etterfulgt av inokulering og US behandling (68 kHz, 300 W, 42 °C, 5 eller 15 min). Dette
førte til åtte kombinasjoner av HPP trykk, HPP tid og US tid. Alle prøvene ble fermentert ved
42 °C til pH 4.6 og yoghurten ble så lagret ved 4 °C.
Kombinasjonsteknologi, spesielt med US behandling i 15 minutt reduserte den totale
fermenteringstiden sammenlignet med varmebehandlet kontroll. Yoghurtgel produsert ved HPP
400 i 15 minutter hadde viskoelastiske egenskaper sammenlignbare med kontrollen, men med
større standardavvik som indikerer variasjon i geleringsprosessen. Lavere plastisk deformasjon
og deformasjonskraft av yoghurten indikerte at bruk av kombinasjonsteknologi generelt
resulterte i en skjørere gel med svakere bindinger innad i gelnettverket sammenlignet med
varmebehandlet kontroll. Basert på total fermenteringstid, viskoelastiske egenskapene og
teksturegenskaper av yoghurtgelen, ble kombinasjonsteknologien 400 MPa, 15 min, US 15 min
valgt for videre karakterisering, blant annet mikrobiell vekst av startkulturen under
fermentering, native- og SDS-PAGE analyse av melkeprotein og lagringsstabilitet etter 1, 7,
14, 21, 28 og 42 dagers lagring ved 4 °C. Den mikrobielle veksten under fermentering av
lignende i melk behandlet med kombinasjonsteknologi og varme, noe som indikerer at
behandlingsforholdene ikke påvirket veksten og den metabolske aktiviteten av starterkulturen.
Under lagring hadde yoghurt produsert ved bruk av kombinasjonsteknologi og
varmebehandling lignende antall kolonidannende enheter av starterkulturen, ettersyrning og
titrerbar syre.

IV

V
Preface
This master thesis is written as a part of my master’s degree in biotechnology (MBIOT5)
at the Department of Biotechnology and Food Science at NTNU, in collaboration with Nofima
in Stavanger from September 2019 to May 2020.
I want to thank my supervisors and co-supervisors at NTNU and Nofima, Kari Helgetun
Langfoss and Turid Rustad, Izumi Sone, Estefanía Noriega Fernàndez and Bjørn Tore
Rotabakk, for all their feedback and support during this whole process. I would especially like
to thank Izumi for all the support, patience and the countless hours you help me with this master
thesis. I could not have done it without you. I would also like to thank Mette Risa Vaka for her
help in the laboratory and all the others in Nofima who helped with their expertise.
Finally, I want to thank my family and friends for all their support throughout my
master’s degree.
Varhaug, May 2020
Mari Varhaug

VI

VII
List of abbreviations
Abbreviation Full form
BSA Bovine serum albumin
CCP Colloidal calcium phosphate
CFU Colony-forming unit
CO2 Carbon dioxide
CN Casein
EPS Exopolysaccharide
GDL glucono-δ-lactone
HPP High-pressure processing
LA Lactalbumin
LAB Lactic acid bacteria
LB Lactobacillus delbrueckii ssp. bulgaricus
LG Lactoglobulin
MFG Milk fat globule
MFGM Milk fat globule membrane
MRS Man, Rogosa & Sharpe
PAGE Polyacrylamide gel electrophoresis
sCO2 Supercritical carbon dioxide
SD Standard deviation
SDS Sodium dodecyl sulphate
ST Streptococcus thermophilus
US Ultrasound
WHC Water holding capacity

VIII

IX
Table of content
1 Introduction ........................................................................................................................ 1
1.1 Milk proteins ................................................................................................................ 2
1.1.1 Casein ................................................................................................................... 2
1.1.2 Whey proteins ...................................................................................................... 3
1.2 Acidification of casein and gel formation ................................................................... 4
1.3 Yoghurt production ...................................................................................................... 6
1.3.1 Homogenisation ................................................................................................... 7
1.3.2 Heat treatment ...................................................................................................... 7
1.3.3 Fermentation ......................................................................................................... 9
1.3.4 Cooling and storage ............................................................................................ 11
1.4 Use of non-thermal processing technologies in dairy products ................................. 12
1.4.1 Carbon dioxide (CO2) ......................................................................................... 12
1.4.2 High pressure processing ................................................................................... 15
1.4.3 Low frequency ultrasound .................................................................................. 17
1.4.4 Combination technologies .................................................................................. 19
1.5 Objectives .................................................................................................................. 20
2 Materials and methods ..................................................................................................... 21
2.1 Materials .................................................................................................................... 21
2.2 Preparation of reconstituted skim milk ...................................................................... 21
2.3 Milk processing ......................................................................................................... 21
2.3.1 Traditional heat treatment .................................................................................. 22
2.3.2 Inoculation of starter culture .............................................................................. 22
2.3.3 Non-thermal combination technology ................................................................ 23
2.4 Fermentation .............................................................................................................. 26
2.5 Storage ....................................................................................................................... 26

X
2.5.1 42 days storage trial ............................................................................................ 26
2.6 Process and product characterisation ......................................................................... 27
2.6.1 pH and temperature measurement ...................................................................... 27
2.6.2 Gas composition ................................................................................................. 28
2.6.3 Gas volume ......................................................................................................... 28
2.6.4 Microbial dynamics during fermentation and storage ........................................ 29
2.6.5 Native- and sodium dodecyl sulphate polyacrylamide gel electrophoresis (SDS-
PAGE) 29
2.6.6 Rheological measurements ................................................................................. 30
2.6.7 Texture analysis of set gel .................................................................................. 31
2.6.8 Titratable acidity ................................................................................................ 33
2.6.9 Whey separation ................................................................................................. 34
2.7 Replicates and statistical analysis .............................................................................. 34
3 Results and discussion ...................................................................................................... 35
3.1 Process characterisation ............................................................................................. 35
3.1.1 pH change during milk processing ..................................................................... 35
3.1.2 Supercritical CO2 and temperature during HPP ................................................. 36
3.1.3 Gas volume and composition ............................................................................. 38
3.2 Fermentation .............................................................................................................. 38
3.2.1 pH development ................................................................................................. 38
3.2.2 Total fermentation time ...................................................................................... 39
3.3 Product characterisation ............................................................................................ 41
3.3.1 Viscoelastic properties of the yoghurt gel at 42 °C and 4 °C ............................. 41
3.3.2 Yield strain (%) and yield stress (Pa) ................................................................. 43
3.3.3 Penetration .......................................................................................................... 44
3.3.4 Stress-relaxation ................................................................................................. 46
3.4 Selection of processing conditions ............................................................................ 48

XI
3.5 Native- and SDS-PAGE ............................................................................................ 48
3.6 Microbial growth dynamics during fermentation ...................................................... 54
3.7 Storage trial ................................................................................................................ 55
3.7.1 Microbial stability during storage ...................................................................... 56
3.7.2 Titratable acidity and pH .................................................................................... 57
3.7.3 Whey separation ................................................................................................. 58
4 Conclusions and future work ............................................................................................ 60
5 References ........................................................................................................................ 61
6 Appendix .......................................................................................................................... 68
6.1 pH vs process time ..................................................................................................... 68
6.2 pH vs texture analysis ................................................................................................ 69
6.3 Gelation process ........................................................................................................ 70
6.4 Preliminary trials ....................................................................................................... 72

XII
1
1 Introduction
Originally, yoghurt were produced to conserve the nutrient in milk, but it was soon
discovered that yoghurt with different texture, flavours and consistency could be produced
(McKinley, 2005). Yoghurt is a nutrient-dense food, and is a good source of proteins, calcium,
phosphorous as well as vitamins and minerals (McKinley, 2005; Walstra, Wouters, & Geurts,
2006). The consumption of yoghurt is increasing. In 2015 the worldwide production of yoghurt
were 35 529 000 MT, an 20% increase from 2010 ("The World Yoghurt Market Report 2000-
2025," 2016). Yoghurt consumption is also increasing in Norway, from 6.8 kg yoghurt per
person in 2000 to 10 kg per person in 2017 (Utviklingen i norsk kosthold, 2018). Today, milk
from cows are most commonly used in the dairy industry, but milk from goat, sheep and
buffaloes are also used ("Tetra Pak Dairy processing handbook," 2015).
Thermal treatment is extensively used in the dairy industry for preservation/processing
purposes (e.g. thermalization, pasteurization or sterilization) despite its environmental footprint
and undesirable effects on food nutritional (e.g. vitamin/mineral loss) and sensory (e.g. texture,
colour, taste, flavour) attributes (Pardo & Zufía, 2012). Non-thermal processing technologies
have received significant attention in the last decade in respond to the increasing consumer
demand for safe, minimally processed and value-added products, with improved nutritional and
sensory quality (e.g. fresh-like, healthy, long shelf-life) (Langelaan et al., 2013). For instance,
High Pressure Processing (HPP) and Ultrasound (US) are promising non-thermal technologies
for the dairy industry, typically combined with CO2 addition. Non-thermal processing
technologies are also beneficial for the manufacturing process through e.g. faster production
rates, sustainable use of natural resources, energy and water savings and reduced food waste
and green-house-gas emissions leading to reduced production costs and thus representing an
environmentally friendly alternative to traditional heat treatment (Kourkoutas, Chorianopoulos,
Nisiotou, Valdramidis, & Karatzas, 2016; Zhang, Wang, Zeng, Han, & Brennan, 2019).
This introduction will first address the main proteins in milk, which is important for the
gelation of milk during yoghurt production. Furthermore, it will provide an overview of the
different steps in yoghurt production, before a section about the use the non-thermal processing
technologies CO2, HPP and US in dairy processing reviewed. Lastly, the objectives of this
master thesis are presented.

2
1.1 Milk proteins
1.1.1 Casein
Casein is the most abundant protein in bovine milk constituting approximately 80% of
the total protein content. The main casein types include αs1-, αs2-, β- and κ-casein (Dalgleish &
Corredig, 2012; Lucey, 2017). αs1- and αs2-casein make up 40% and 10% of the total casein in
bovine milk and have a molecular weight of 23.6 kDa and 25.2 kDa after phosphorylation,
respectively. αs1-casein contains two centres of phosphorylation, while αs2-casein contains
three. β-casein accounts for 35% of the total casein in bovine milk, has a molecular mass of
24.0 kDa following phosphorylation, and has one centre of phosphorylation. κ-casein, which is
the smallest casein with molecular weight of 19 kDa prior to post-translational modifications,
accounts for 15% of the total casein in bovine milk, with no centres of phosphorylation
(McSweeney & Fox, 2013).
Most of the casein proteins in bovine milk are incorporated in particles called casein
micelles. In addition to casein, casein micelles also contain colloidal calcium phosphate (CCP).
CCP are small granules of 2-3 nm, often called nanoclusters, composed of calcium and
phosphate along with small amounts of magnesium, citrate and other compounds. The micelle
is on average 150 – 200 nm and is highly hydrated. Although it only constitutes 2.5% of the
total milk weight, it represents 10% of the milk volume (Dalgleish & Corredig, 2012; Lucey,
2017).
The micelle structure is important for understanding the properties and behaviour of
milk. There have been several models suggesting how the micelle is built up, but its structure
still has not been fully understood. Available hypothesis on the micelle structure include the
submicelle model (Walstra, 1999), the nanocluster model (Holt, 1992), the dual-bonding model
(Horne, 1998), and the most recent model suggested by Dalgleish (2011). In this master thesis,
theoretical assumptions for the interpretation and discussion of results will be based on the
model suggested by Dalgleish (2011), as described below and illustrated in Figure 1.
Casein interacts with CCP nanoclusters through phosphorylation centres. αs1- and αs2-
casein contains multiple centres of phosphorylation and are therefore able to interact with
several CCP nanoclusters. β-casein with one centre of phosphorylation will bind only to one
CCP nanocluster. Interaction between αs- and β-casein with CCP allows multiple CCP
nanoclusters to be linked to each other, and casein proteins and the nanoclusters can grow into
a micelle. κ-casein does not contain any phosphorylation centre and cannot interact with CCP

3
nanoclusters. Although it can associate with other types of casein through non-covalent
interactions, the growth of the micelle will be restricted since it only contains one hydrophobic
segment to interact through. It is well established that κ-casein is located on the surface of
micelles. Parts of the κ-casein, the caseinomacropeptide (C-terminal region), projects from the
surface of the micelles as a 5-10 nm thick hairy layer around the micelle and prevents micelles
from aggregation with each other through steric repulsion. This hairy layer is not too dense,
since β-casein is able to dissociate and re-associate during cooling and heating, and also due to
the interactions of the micelle with whey proteins. It has been suggested that micelles contain
water channels stabilised by β-casein. This could explain why the micelles are highly hydrated
(Dalgleish & Corredig, 2012). The integrity of the micelle is maintained through hydrophobic
interactions and CCP internally, and through steric repulsion of the κ-casein hairy layer on the
surface (Anema, 2014; Dalgleish & Corredig, 2012; Lucey, 2017).
Figure 1: Structure of casein micelle according to the Dalgleish model. αs1-, αs2- and β-casein (orange)
are linked to CCP (grey). Some β-casein (blue) stabilise the water channels in the micelle. κ-casein on
the outer surface of the casein micelle consisting of two parts; para-κ-casein (green) and
caseinomacropeptide chains (black). Picture adapted from Dalgleish and Corredig (2012).
1.1.2 Whey proteins
20% of the proteins in bovine milk are whey proteins, which remain soluble at pH 4.6
(McSweeney & Fox, 2013). Whey proteins are acid-soluble, highly structured, and heat-
sensitive, the latter resulting in protein unfolding above certain temperatures (McSweeney &
O'Mahony, 2016). There are many different whey proteins, with the main ones being β-
lactoglobulin (β-LG), α-lactalbumin (α-LA), bovine serum albumin (BSA) and

4
immunoglobulins (Ig). Other minor whey proteins include lactoperoxidase, lactoferrin and
serum transferrin (McSweeney & Fox, 2013).
β-LG represents 50% of whey proteins and 12% of total proteins in bovine milk. The
protein is highly structured, compact and globular, with the isoelectric point at pH ~ 5.2. β-LG
monomers are 18.3 kDa, with 162 residues per monomer. Each monomer has two
intramolecular disulphide bridges and one mol cysteine (McSweeney & Fox, 2013). β-LG
normally exist as a dimer at normal milk pH (6.7) (Olsen & Orlien, 2016). Under denaturing
conditions, such as heat treatment above 75 – 80 °C, the dimer dissociate into monomers, and
the cysteine-residues are exposed and can react with other molecules, e.g. κ- (Considine, Patel,
Anema, Singh, & Creamer, 2007).
α-LA makes up 20% of whey proteins and 3.5% of total proteins in bovine milk. The protein is
compact and globular, with ~14.2 kDa, and 123 residues per monomer. Its isoelectric point falls
between 4.2 and 4.5. Each monomer has four intramolecular disulphide bridges. (McSweeney
& Fox, 2013).
BSA is ~ 66 kDa, consists of 583 amino acids with 17 disulphides and 1 sulfhydryl. It
has the ability to interact with α-LA and β-LG upon heat treatment, but due to its low level in
bovine milk (0.1 – 0.4 g/L) is has little effect on the physicochemical properties of milk. Ig is a
group of complex proteins, which also has little effect on physicochemical properties of milk
due to low concentrations (0.6 – 1 g/L) (McSweeney & Fox, 2013).
1.2 Acidification of casein and gel formation
At normal milk pH (pH 6.6 – 6.8) (Walstra et al., 2006) the milk casein micelles are
stabilised by negative charges and steric repulsions. When casein micelles acidify, CCP
dissolves, leading to changes in the internal structure of the casein micelle. At the isoelectric
point of casein (~pH 4.6), protein aggregation occurs (Dalgleish & Corredig, 2012; Lucey,
2014).
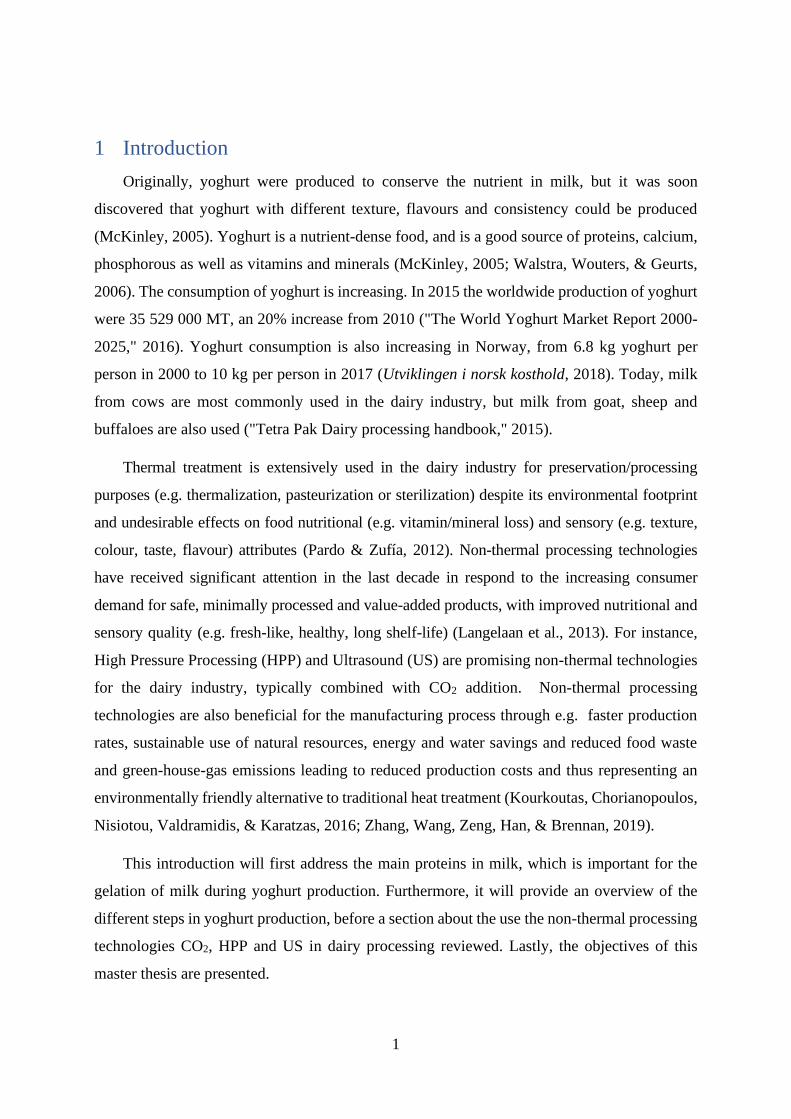
Lucey (2014) describes three pH-regions in the acidification of casein micelles. The first
region range between pH 6.0 and 6.7, illustrated in Figure 2 (a). As the pH decreases there is
less net negative charge on the casein micelle leading to reduced electrostatic repulsion and
solubilisation of CCP. However, in this pH-range the amount of CCP being solubilised is still
relatively small and does not affect the internal structure of the casein micelle much. The next
pH-region falls between pH 5.0 and 6.0, illustrated in Figure 2 (b). As the pH decreases even
more, this leads to a reduction in electrostatic repulsion. Eventually the stabilising hairy layer
5
of κ-casein collapses, so that its steric stabilising effect disappears. This allows casein micelles
to diffuse closer to each other, eventually leading to gel formation. At pH 5.0 all CCP is
dissolved from the casein micelle. The third pH region refers to pH ≤ 5.0, illustrated in Figure 2
(c). The net negative charge of the casein micelle decreases even more and there is an increase
in +/- charge interactions, van der Waals forces and hydrophobic interactions. In presence of
denatured whey proteins, complexes consisting of κ-casein and whey proteins are formed.
Figure 2: Interacting parts of casein micelles. (a) Native micelles steric stabilised by κ-casein hairy
layer. The dashed line represents the zone in which the steric stabilising effect is acting. (b) Acidified
micelles, CCP has solubilised and κ-casein hairy layer has collapsed. (c) Micelle in heated milk with κ-
casein/whey protein complexes (dark blue spheres). These complexes provide interaction points between
micelles during acid gelation. Para-κ-casein is green, the caseinomacropeptide chains are black, α- and
β-caseins are orange, and calcium phosphate nanoclusters are represented by grey spheres. Some β-
casein (blue) stabilise the water channels in the micelle. Picture adapted from Dalgleish and Corredig
(2012).

6
1.3 Yoghurt production
Figure 3: Flow chart for yoghurt production.
Codex Standard for fermented milks (243-2003) defines yoghurt as a fermented milk
product obtained by the lactic fermentation through the action of Streptococcus thermophilus
(ST) and Lactobacillus delbrueckii ssp. bulgaricus (LB). The microorganisms in the final
product must be abundant and viable, and the total protein content in the yoghurt must be
minimum 2.7% (m/m). The building blocks in the acid milk gel are casein micelles and
denatured whey proteins (Lucey, 2014; Peng, Horne, & Lucey, 2009). There are different types
of yoghurt, including set, stirred, drinking and frozen type yoghurts (Karam, Gaiani, Hosri,
Burgain, & Scher, 2013). Set type yoghurt is incubated and cooled in the final package (Kim &
Oh, 2013), and will be the type of yoghurt used in this master thesis. Figure 3 gives an overview
of the different steps in yoghurt production.
Prior to homogenisation and heat treatment, milk is often thermalized and standardised.
Thermalization is typically performed at temperatures from 60 to 69 °C for 20 to 30 s, and its
goal is to inactivate vegetative cells and enzymes. Standardisation includes changes in the fat
content of the milk and its solid-nonfat content. Normally this adjustment will involve a
reduction of the fat content of the milk and an increase in the content of lactose, proteins,
Thermalisation
Standardisation of milk fat content and solid-
nonfat content
Homogenisation
Heat treatment
Incubation
Cooling and storage
Inoculation

7
mineral and vitamins. Standardisation is an important process for the quality of yoghurt, as the
content of fat and solid-nonfat will affect the textural properties of the yoghurt gel (Chandan &
O'Rell, 2013; Karam et al., 2013; Lucey, 2004; Sfakianakis & Tzia, 2014).
1.3.1 Homogenisation
Milk is homogenised to prevent a layer of fat to be formed on the surface of the milk.
During homogenisation, the milk fat globule (MFG) is exposed to conditions which ruptures
the MFG-membrane (MFGM), and when it is rebuilt, proteins from the milk serum will be
incorporated into the MFGM, enhancing emulsion stability of the milk (Sfakianakis & Tzia,
2014). Commonly, homogenisation is applied at temperature between 55 and 80 °C and at
pressures between 10 and 20 MPa, and the diameter of the MFG is reduced from 2-10 µm to
0.1-1µm. (Chandan & O'Rell, 2013; Sfakianakis & Tzia, 2014). Homogenisation reduce
creaming and wheying off during storage, in addition to improves the consistency of yoghurt
(Chandan & O'Rell, 2013).
1.3.2 Heat treatment
Heat treatment can be implemented via different methods, with the most typical one at
industrial settings being through plate heat exchangers according to (Chandan & O'Rell, 2013).
Time and temperature of the heat treatment can vary greatly depending on the goal of the
heating (Anema, 2014). Heat treatment of milk has several important functions. Inactivating
undesirable microorganisms in milk, including pathogenic and spoilage bacteria, and most milk
enzymes is important for the safety of yoghurt as well as creating noncompeting conditions for
the starter culture. Expulsion of oxygen, creating a more beneficial growth environment for
lactic acid bacteria (LAB), and production of protein-cleaved nitrogenous compounds, leading
to more available nutrients for the growth of LAB. Heat treatment also lead to physical changes
in proteins, leading to interaction between denatured whey proteins and casein micelle. This
has beneficial effects on the texture and quality of the yoghurt gel formed, including reduced
whey separation and higher viscosity (Chandan & O'Rell, 2013).
Heat-induced changes in milk proteins
When whey proteins are subjected to heat above 70 °C they both denature and
aggregate. Denaturation leads to dissociation into monomers if the native protein exists in an
oligomeric state, followed by the unfolding of the monomer. Unfolding expose reactive groups
in the protein, which can then react with other molecules. Disulphide bonds are covalent
linkages of two cysteine residues in proteins. Unlike peptide bonds, disulphide bonds are
reversible in nature allowing cleaved bonds to reform. α-LA only contains disulphide bonds,

8
while β-LG contains disulphide bonds as well as a free cysteine residue with a reactive thiol
group. When β-LG denatures the reactive thiol group is exposed and can form disulphide bonds
with other reactive thiol groups (Figure 4 A and B) and through thiol group-disulphide bond
exchange reactions (Figure 4 C). In milk, which contains different proteins, the denaturation
process is not reversible due to thiol group disulphide bond exchange reactions leading to
formation of aggregates (Anema, 2014; Cho, Singh, & Creamer, 2003).
Figure 4: Thiol-disulphide interchange in β-lactoglobulin (β-LG). A and B: possible intermolecular
interchanges. C: disulphide-bond interchange reaction between two β-LG leading to formation of dimer.
Picture borrowed from Considine et al. (2007)
Casein has a random coil structure and is not susceptible to denaturation. When milk is
heated, denatured β-LG will interact with κ-casein, which is present at the surface of the casein
micelle, through thiol group-disulphide bond exchange reaction leading to disulphide bonds.
Since α-LA does not contain reactive thiol groups it will not interact with the casein micelle
directly, but through β-LG. Heat treatment of milk leads to a complex mixture of native whey
proteins, whey protein aggregates and casein micelles coated with whey proteins. Variables
including duration of heat treatment, temperature (see Figure 5), pH of milk, milk composition,
protein concentration and salt concentration in milk will affect the denaturation and the
interaction between whey proteins and casein micelles (Anema, 2014; Cho et al., 2003).

9
Figure 5: Amount of whey protein that remains dissolved after cooling and acidification to pH 4.6 when
milk is heated at different temperatures for 30 min. Borrowed from Walstra et al. (2006)
Unheated milk forms a weak gel around pH 4.8. Heat treated milk, where denatured
whey proteins have interacted with casein micelles, leads to reduced stability of the κ-casein
hairy layer. This leads to a shift of the gelation point to a higher pH, since the isoelectric point
of β-LG is 5.2. Thus, heat treatment of milk affects its gelling properties and leads to a stronger
gel than in unheated milk (Dalgleish & Corredig, 2012; Lucey, 2014).
1.3.3 Fermentation
After milk processing, either thermal or non-thermal, milk should have a temperature
around the optimum growth temperature of the starter culture prior to inoculation, in order to
minimise the impact on bacterial metabolism. Inoculation with the starter culture is followed
by incubation around the optimum growth temperature until the desired pH is reached.
Commonly between pH 4.5 and 4.6. Typical incubation temperatures fall within the range of
31 to 45 °C, but most manufacturers recommend 41 to 42 °C (Chandan & O'Rell, 2013; Lucey,
2014; "Tetra Pak Dairy processing handbook," 2015). Incubations temperatures affect the rate
of acidification, thus affecting rheological properties and whey separation of acid milk gels
(Anema, 2008b), with lower temperatures having lower rate of acidification due to decrease
metabolic activity of LAB, decreasing the rate of lactic acid production (Medeiros, Souza, &
Hoskin, 2015).

10
Starter culture
Commonly used starter cultures are a mixture of two lactic acid LAB; ST and LB
(Johnson & Steele, 2007). Sometimes the starter culture mixture also contains probiotic
cultures. ST and LB produce lactic acid and reduce the pH of milk, leading to formation of a
yoghurt gel (Baglio, 2014).
There are different forms of commercial starter cultures; fresh bulk starters, deep-frozen
concentrated cultured, freeze-dried cultures and highly concentrated cultures (Direct Vat Set or
Direct Vac Inoculation) ("Tetra Pak Dairy processing handbook," 2015). Inoculum level of the
starter culture will depend on the manufacturer’s recommendations. The starter culture strain
chosen as well as their ratio will affect flavour, acidification rate, texture and rheological
properties of yoghurt (Development and Manufacture of Yoghurt and Other Functional Dairy
Products, 2010). Some strains produce exopolysaccharides, which affects the texture and
rheological properties of yoghurt, including firmer body, higher viscosity and low syneresis
(Mende, Rohm, & Jaros, 2016).
ST is a Gram positive, facultative anaerobic, nonmotile bacteria existing as
spherical/ovoid cells (Baglio, 2014). Its optimal growth temperature is 37 °C (Chandan &
O'Rell, 2013). ST produces lactase in substantial levels, which can break down lactose to
glucose and galactose and, through subsequent steps, glucose further into lactic acid (Johnson
& Steele, 2007). During the first stages of the fermentation, ST meets its need for nitrogen from
free amino acids in the milk and during later stages from free amino acids produced by LB
through endogenous peptidases (Johnson & Steele, 2007). Lactic acid concentrations of 1%
inhibits the growth of ST (Chandan & O'Rell, 2013).
LB is also a Gram positive, nonmotile bacteria existing as slender rods with rounded
ends. It is an aerotolerant anaerobe homofermentative and produces lactic acid, similarly to ST,
as well as hydrogen peroxide (Baglio, 2014). Its optimal growth temperature is 45 °C. As
compared to ST, LB tolerates lower pH and higher lactic acid concentration, e.g. up to 1.8%
(Chandan & O'Rell, 2013). LB has cell wall-bound proteases, which are able to hydrolyse
caseins into peptides (Johnson & Steele, 2007). However, it is dependent on ST to break down
the peptides into free amino acids using peptidase, due to its low peptidase activity (Chandan
& O'Rell, 2013).
Thus, LB and ST have a mutually beneficial symbiotic relationship, illustrated in Figure
6. Although ST and LB can survive and produce yoghurt as a single culture, they benefit from

11
each other’s metabolism leading to faster acid production and pH drop (Chandan & O'Rell,
2013). For instance, ST’s urease activity results in CO2 generation, which stimulates the growth
of LB. During the first stages of the fermentation (until pH 5.0), the maximum specific growth
rate of ST is much higher than that for LB and it contributes to most of the lactic acid
production. Later in the co-culture fermentation, LB growth dominates, as ST is affected by the
increasing lactic acid levels in the media, and becomes the major contributor to the lactic acid
production (Chandan & O'Rell, 2013; Walstra et al., 2006).
Figure 6: Overview of the symbiotic relationship between Streptococcus thermophilus and Lactobacillus
delbrueckii ssp. bulgaricus. Picture adapted from Walstra et al. (2006)
1.3.4 Cooling and storage
When the desirable pH value is reached (pH 4.5), the cooling process starts ("Tetra Pak
Dairy processing handbook," 2015). Cooling at this stage is important to stop the growth of the
starter culture and further acidification. Set yoghurt is cooled in the container, either by
transferring to cold storage, or by first blast cooling it in the fermentation chamber or cooling
tunnels (Lucey, 2004). Cooling leads to increased firmness and viscosity of the yoghurt gel
(Lucey, 2004, 2014). Yoghurt is stored at 4 to 5 °C to ensure the shelf life according to
regulation since refrigeration temperatures slow down physical, chemical and microbial activity
(Chandan & O'Rell, 2013; Lucey, 2004). Codex Standard for fermented milks (243-2003)
require that titratable acidity, expressed as% lactic acid, is minimum 0.6%, and that the sum of
viable microorganisms constituting the starter culture is minimum 107 CFU/g. These
requirements have “to be verified through analytical testing of the product through to “the date
of minimum durability” after the product has been stored under the storage conditions specified

12
in the labelling”. In Norway, a storage time between 35 and 40 days is normal ("Naturell
yoghurt,").
1.4 Use of non-thermal processing technologies in dairy products
Thermal treatment is extensively used in the dairy industry for preservation/processing
purposes (e.g. thermalization, pasteurization or sterilization) despite its environmental footprint
and undesirable effects on food nutritional (e.g. vitamin/mineral loss) and sensory (e.g. texture,
colour, taste, flavour) attributes (Pardo & Zufía, 2012). Non-thermal processing technologies
have received significant attention in the last decade in respond to the increasing consumer
demand for safe, minimally processed and value-added products, with improved nutritional and
sensory quality (e.g. fresh-like, healthy, long shelf-life) (Langelaan et al., 2013). For instance,
High Pressure Processing (HPP) and Ultrasound (US) are promising non-thermal technologies
for the dairy industry, typically combined with CO2 addition within the frame of the hurdle
technology. Hurdle technology, i.e. multi-target and mild combination of synergistic preserving
factors (“hurdles”), is typically applied in the food industry to control foodborne pathogenic
and spoilage microorganisms, thus improving food safety, whilst maintaining nutritional and
sensory attributes and extending the product shelf life (Leistner, 2000). Typical hurdles include
increased acidity, reduced water activity (aw) and (high/low) temperature, but also modified
atmosphere and addition of preservatives, with emerging contribution of innovative non-
thermal processing (Singh & Shalini, 2016). Non-thermal processing technologies are also
beneficial for the manufacturing process through e.g. faster production rates, sustainable use
of natural resources, energy and water savings and reduced food waste and green-house-gas
emissions leading to reduced production costs and thus representing an environmentally
friendly alternative to traditional heat treatment (Kourkoutas et al., 2016; Zhang et al., 2019).
1.4.1 Carbon dioxide (CO2)
Addition of CO2 to milk leads to a decrease in pH since CO2 reacts with water, resulting
in formation of carbonic acid (Hotchkiss, Werner, & Lee, 2006), see Equation 1. CO2, HCO3-
and CO32- are in an equilibrium, and their relative amounts will depend on the pH (Pedersen,
Colmer, & Sand-Jensen, 2013), see Figure 7. Lactic acid bacteria used in yoghurt production
are rather tolerant to CO2, and CO2 produced by ST has been found to stimulate the growth of
LB (Driessen, Kingma, & Stadhouders, 1982). Louaileche, Bracquart, Saulnier, Desmazeaud,
and Linden (1993) found that ST has an absolute CO2 metabolic requirement for cell growth.

13
Equation 1
𝐶𝑂2(𝑑𝑖𝑠𝑠𝑜𝑙𝑣𝑒𝑑) + 𝐻2𝑂 ↔ 𝐻2𝐶𝑂3
𝐻2𝐶𝑂3 ↔ 𝐻𝐶𝑂3− + 𝐻+
𝐻𝐶𝑂3− ↔ 𝐶𝑂3
2− + 𝐻+
Figure 7: Relative amounts (%) of carbon dioxide (CO2), bicarbonate (HCO3-) and carbonate (CO3
2-)
in water as a function of pH. Picture borrowed from Pedersen et al. (2013).
Supercritical CO2 (sCO2) is CO2 in a liquid state. This liquid state is reached when CO2
is held above a critical temperature of 31.1 °C and a critical pressure of 7.4 MPa (Cheung,
1999), Figure 8. Benefits by using sCO2 is that low viscosity and absence of surface tension
allows for high diffusivity and solubility into both aqueous and fat phases of complex food
materials (Amaral et al., 2017). Ceni et al. (2016) investigated the use of sCO2 for inactivation
of the enzyme alkaline phosphatase and Escherichia coli in milk, and found that at a CO2: milk
ratio of 0.05, 70 °C, 80 bar and a holding time of 30 min, E.coli and 94.5% of the enzyme were
inactivated.

14
Figure 8: Phase diagram for pressure and temperature of carbon dioxide (CO2). Picture borrowed from
Ni, Song, Wang, and Shen (2016).
Calvo, Montilla, and Cobos (1999) found that skim milk acidified (with CO2 bubbling)
to pH 6.2 and 6.0 prior to yoghurt production (inoculated with LB and ST, incubated at 42 °C
for 4 h) had significant higher (p<0.05) lactic acid production than control (skim milk without
CO2) after seven days storage. The concentration of L-lactic acid and D-lactic acid in pH 6.2,
6.0 and control were 5.5 and 0.85 g/kg, 6.0 and 1.0 g/kg and 5.1 and 0. 69 g/kg, respectively.
Another study conducted by Vinderola, Gueimonde, Delgado, Reinheimer, and Reyes-
Gavilán (2000) found that the fermentation time (incubation at 42 °C until pH 5 was reached)
was significantly shortened in CO2-treated milk (carbonated with food-grade CO2 to pH 6.3)
compared to non-acidified control using two different starter combinations; (1) a combination
of ST and Lactobacillus acidophilus and (2) a combination of ST, L. acidophilus, and
Bifidobacterium bifidium. Fermentation time were reduced from 275.00 min in untreated milk
to 217.50 min in CO2-treated milk and from 235.00 to 177.50 min, for starter combination (1)
and (2), respectively. The reduction in fermentation time was attributed to a lower initial pH
(pH 6.3) as a result of addition of CO2 and enhanced growth and metabolic activity of the starter
cultures.
Peng et al. (2009) studied how preacidification of the milk (using glucono-δ-lactone
(GDL), not CO2) prior to fermentation would modify the amount of solubilised CCP and thus
affect the textural properties of yoghurt. The pH of the milk was controlled using various

15
amounts of GDL to pH values of 6.55, 6.42, 6.10, 5.78, and 5.65. Preacidification of the milk
prior to the fermentation (40 °C until pH 4.6 was reached), showed a linear increase in
solubilisation of CCP with decreasing preacidification pH. Solubilised CCP decreased the
number of cross-links between CCP and casein in the casein micelle, thus the number of CCP
cross-linking during the gelation process leading to weaker gel. Comparing yoghurt made from
preacidified milk, showed lower G’, 139 and 183 Pa, lower yield stress, 16 and 23 Pa, and
higher whey separation, 5.54 and 5.05%, at pH 6.1 compared to 6.55, respectively.
1.4.2 High pressure processing
High pressure processing (HPP) can be implemented either in batch or as a semi-
continuous process. This master thesis focus on the batch process. In batch process food
material is placed in a vessel that is filled with liquid and a pump or piston pressurises the
vessel. When the target pressure is reached, the pressure is held for a certain holding time,
before depressurisation and the food material can be removed. The liquid surrounding the food
material act as a pressure-transmitting medium and could be water or another relevant media.
Normal pressure treatment ranges between 50 and 1000 MPa (Hogan, Kelly, & Sun, 2005).
Example of current implementation of HPP in the yoghurt industry is HPP treatment after
packaging of the final yoghurt product, having the benefits of inactivation of yeast and mold
for up to three months as well as reducing the number of LB, preventing postacidification
("Dairy,").
HPP can be implemented at room temperature or lower temperatures without affecting
covalent bonds, which causes a minimal impact on flavour compounds and vitamins, as
compared to thermal treatment, thus leading to better preservation of the nutritional value and
sensory attributes (Hogan et al., 2005; López-Fandiño, 2006; Olsen & Orlien, 2016). A slight
temperature increase of 3 °C per 100 MPa occurs during HPP treatment, due to adiabatic
heating. Temperature will return to original temperature as soon as the pressure is released
("Everything you ever wanted to know about HPP concepts," 2020). Pressure assisted thermal
sterilisation is a new technique combining heat and pressure to sterilise liquid food. Its goal is
to reduce the sterilisation temperature needed to inactivate bacterial spore, thus minimising the
thermal effect on nutrients (Wimalaratne & Farid, 2008).
The changes induced by HPP in milk proteins depend on several factors including
protein structure and concentration, pressure level, duration of pressure treatment, temperature,
pH, ionic strength and solvent composition (Kelly, Kothari, Voigt, & Huppertz, 2009; López-
Fandiño, 2006). As previously mentioned, β-LG is a compact, globular protein that exists as a
16
dimer at milk’s native pH. β-LG is pressure-sensitive and will denature at pressures > 100 MPa
forming aggregates, as it contains reactive thiol groups and disulphide bonds, similarly to heat-
treated milk. α-LA is more resistant towards pressure as it contains more intramolecular
disulphide bonds and no free thiol groups, but will denature at pressures > 400 MPa (Huppertz,
Fox, & Kelly, 2004; Olsen & Orlien, 2016).
Casein micelles dissociate at pressures > 250 MPa (Huppertz et al., 2004). Hydrophobic
interactions are disrupted, CCP dissolved and calcium and phosphorous are released into the
serum phase, and as a result the micelle dissociate into smaller micelles. When the pressure is
released, dissolved calcium, phosphorous, casein and submicelles will re-associate into new
micelle structures, but these micelles will have different size and structure than the original
micelle (Dalgleish & Corredig, 2012; Olsen & Orlien, 2016).
Harte, Amonte, Luedecke, Swanson, and Barbosa-Cánovas (2002) studied the yield
stress and microstructure of set yoghurt made from heat treated milk (85 °C, 35 min), HPP
processed milk (193 or 676 MPa, for 5 or 30 min) or untreated milk. Milk treated at 193 MPa
or untreated milk did not show any disruptive effect on the casein micelles or any denaturation
of the whey proteins. Milk subjected to 676 MPa presented smaller casein micelles than heat
treated milk, while heat treatment had no significant effect on the size of the casein micelles.
Both 676 MPa and heat treatment denatured whey proteins, which interacted with κ-casein.
Yoghurt made from milk treated at 676 MPa for 30 min had similar yield stress (49.3 Pa) as
yoghurt made from heat treated milk (63.5 Pa), while yoghurt made from milk treated at 193
MPa and untreated milk had lower yield stress (<22.9 Pa). Treatment at 676 MPa for 30 min
gave gels with similar characteristics to heat treated, while 676 MPa for 5 min gave a weaker
gel. Yoghurt gels made from milk treated either with 676 MPa for 5 or 30 min or 85 °C for 35
min showed an average decrease of 0.7% in water holding capacity (WHC) after 20 days
storage.
Anema (2010) adjusted the pH of skim milk to between 6.4 and 7.3 before HPP
treatment (200-600 MPa, 30 min, 20 °C), and acidified the milk to pH 4.5 (30 °C, 3 h) using
GDL (between 2.0 and 2.8% depending on pH of the milk). Acid milk gels made from milk
with lower pH had lower final G’ and yield stress than acid milk gels made from milk with
higher pH. The levels of denatured β-LG increased with the magnitude of the pressure treatment
and with the initial pH of the milk. They proposed that pressure treatment and pH affected the
interaction between β-LG and casein, therefor affecting the properties of the acid milk gel.

17
Tsevdou, Tsevdou, Eleftheriou, and Taoukis (2013) found that HPP treated milk (600
MPa, 10 min at 55 °C) showed an increase in the firmness by texture analysis of the yoghurt
gel (incubated at 42 °C until pH 4.75 was reached) compared to thermally treated milk (85 °C,
30 min). Fermentation time in HPP treated milk was also significantly decreased (by 30 to 40
min) compared to thermally treated milk. Both HPP and heat treatment lead to changes in milk
serum, affecting the activity of enzymes involved in lactose hydrolysis, hence affecting the rate
of acidification. These findings indicate that these changes are larger after HPP treatment than
after heat treatment.
1.4.3 Low frequency ultrasound
The term ultrasound refers to soundwaves with a frequency above 16 kHz, which is
above the normal human hearing frequency. According to Ojha, O’donnell, Kerry, and Tiwari
(2016) there are three categories of ultrasound; low frequency ultrasound between 20 kHz and
100 kHz, high frequency ultrasound between 20 kHz and 2 MHz, and diagnostic ultrasound
which is above 1 MHz, see Figure 9. Low and high frequency ultrasound can be used for food
applications. High frequency ultrasound is used as a non-destructive analytical method, while
low frequency ultrasound is used to change chemical and physical properties of various
biological products as well as to inactivate microorganisms. Ultrasonic transducers convert
electrical energy into vibrational sound energy, which is transmitted to the material either
directly or indirectly through a probe or ultrasonic bath, respectively, see Figure 10. Cavitation
refers to the creation, expansion and implosion of microbubbles in the liquid media when
exposed to ultrasound. Low frequency ultrasound leads to a high rate of cavitation since the
ultrasonic waves produce high acoustic pressure, while high frequency ultrasound has lower
acoustic pressure which leads to a lower rate of cavitation (Ojha et al., 2016).
Figure 9: Overview of ultrasound categories. Picture borrowed from Ojha, Mason, O’donnell, Kerry,
and Tiwari (2017).

18
Figure 10: Ultrasonic setup: (a) ultrasound probe; (b) ultrasound bath. Picture borrowed from
Abesinghe et al. (2019).
Low frequency ultrasound has been used in milk to inactivate undesired pathogenic and
spoilage microorganisms, usually in combination with mild temperature, thus improving the
product safety. Other applications include homogenisation, reduction in fermentation time and
improved rheological properties of yoghurt gel (Marchesini et al., 2015).
Gregersen, Wiking, and Hammershøj (2019) studies effects of US treatment (flow cell)
on the final G’ of gel formed from milk (3.5% fat) acidified by GDL (540 mg GDL for 20 mL
milk). Milk samples were treated in US flow cell, first heated to desired temperature (27, 50 or
70 °C) before US treatment (20 kHz, 10, 30 or 50 W) with a total treatment time of 30 min. The
control samples received the same heat treatment and circulated in the US flow cell without
receiving US treatment. They found that US treatment of milk lead to increased G’ compared
to control samples with the effect being dependent on both the power level and temperature.
The final G’ after 50 W treatment were significantly lower for 27 °C compared to 50 and 70
°C.
Wu, Hulbert, and Mount (2000) found that ultrasound had a homogenisation effect on
the fat globules in milk, leading to reduced size of the fat globules. 90 W (20 kHz) for 10 min
had similar homogenisation effect as conventional homogenisation (12 MPa at 60 °C). Higher
power levels produced smaller fat globules and more uniform dispersion, thus having better
homogenisation effect.Wu et al. (2000) found that ultrasound treatment lead to better WHC due
to the reduced size of fat globules, and thus increased available area for interactions with casein
of the fat globule membrane.
Wu et al. (2000) reported faster acidification (incubated at 43 °C) of inoculated (with
mixture of ST, LB, Bifidobacterium and Lactobacillus acidophilus), sonicated milk (20 kHz,
15 °C, 180, 270 or 450 W, 8 min), which was attributed to modifications in the membrane
permeability of the starter cultures, due to cavitation. Sonoporation lead to increased transport

19
of nutrients into and removal of waste products out of bacterial cells, including release of
intracellular β-galactosidase. Normally lactose is transported into the bacterial cell where β-
galactosidase hydrolyses it into lactic acid, but as an effect of sonoporation lactose can be
hydrolysed in the extracellular environment, resulting in faster acidification of the media
(Abesinghe et al., 2019).
Nguyen and Anema (2010) studied the effect of US treatment (22.5 kHz, 50 W, 30 min)
on the acid gel formation using skimmed milk as compared to heat treatment (80 °C, 30 min),
with and without temperature control. Samples under the temperature control were held at 20,
40, 60 or 70 °C under US, while the sample without temperature control reached 95 °C after 15
min. US treatment without temperature control led to whey protein denaturation, aggregation
of casein micelles (indicated by increased particle size). With temperature control where the
US temperature was held at 20 or 40 °C (below the denaturation temperature of whey proteins),
no whey protein denaturation was observed, indicating that denaturation of whey proteins was
attributed to the heat generated and not an effect of US. The resulting acid gels showed low
final G’ at these temperatures (20 and 40 °C), with a slight increase in G’ (up to 50 Pa) with the
prolonged US treatment of 30 min. With US temperature control held at 60 °C, acid gels would
reach final G’ as high as 260 Pa. Nguyen and Anema (2010) concluded that the only effect of
US on the formation of the acid milk gel was an slight increase in firmness, especially at a
prolonged US treatment, but that most of the effect were due to heat generated as a result of US
treatment. Riener, Noci, Cronin, Morgan, and Lyng (2009) found 2-fold higher WHC and 25%
higher final G’ in yoghurt (incubated at 40 °C) made from US treated milk (24 kHz, 400 W, 45
°C, 10 min) compared to yoghurt made from heat treated milk (90 °C, 10 min).
1.4.4 Combination technologies
To the knowledge of the authors, very limited literature is available on the potential of
combined non-thermal processing technologies in dairy products. Studies have been done on
the combination of heat, HPP and/or US in dairy products. Anema (2008c) found that the
combination of heat (65-100 °C, 30 min) and pressure (100-800 MPa, 30 min, 20 or 70 °C)
gave higher levels of whey protein denaturation than heat or pressure treatment alone. Riener
et al. (2009) found that combining heat treatment (45 °C, 10 min) with US treatment (24 kHz,
400 W, 10 min) led to yoghurt with higher WHC, greater viscosity and higher gelation pH
compared to yoghurt made from heating at 90 °C for 10 min. Nonetheless, several studies have
demonstrated the synergistic effects of combining CO2, HPP and/or US in other foods.
Marchesini et al. (2012) reported that the addition of CO2 before US treatment (400W, 24 kHz)

20
of raw milk reduced the development of burnt off-flavours and the formation of oxidation
products during storage at 4 °C. Abid et al. (2014) studied the effect of US (25 kHz, 70%
amplitude, 20 °C, 60 min) and HPP (250 MPa, 350 MPa or 450 MPa, 10 min, room temperature)
on the enzymes (polyphenolase, peroxidase and pectinmethylesterase), microorganisms (total
viable plate counts, yeasts and molds) and phenolic compounds (total phenols, flavonoids and
flavanols) of apple juice. Such a combination technology inactivated enzymatic and microbial
activity, with the best results obtained at 450 MPa, demonstrating that HPP and US could have
a potential hurdle effect on the safety of apple juice.
1.5 Objectives
The main objective of this thesis was to investigate the potential of non-thermal,
combination technology with CO2, HPP and US to improve the efficiency and the sustainability
of the yoghurt manufacturing while maintaining the product quality and storage stability of the
yoghurt produced with the conventional heat treatment (85 C° for 20 min). The secondary
objectives are:
1. Investigate the effect of HPP pressure, HPP time and US time on the total
fermentation time and the viscoelastic and texture properties of the yoghurt gel.
Choosing an optimal combination of HPP pressure, HPP time and US time for
further characterisation based on these results
2. Investigate the effect of combination technology on microbial dynamics during
fermentation
3. Investigate the effect of heat, CO2, HPP and/or US on protein denaturation
4. Investigate the storage stability during 42 days storage at 4 °C

21
2 Materials and methods
2.1 Materials
Non-fat dried milk powder was obtained from PanReac AppliChem ITW Reagents
(Darmstadt, Germany) and stored under cool, dry conditions. The milk powder contained 35.0
± 1.0% (w/w) protein, ~1.0% (w/w) fat, 52.0 ± 1.0% (w/w) lactose and 8.5 ± 0.5% (w/w) ash,
according to the manufacturer. A yoghurt starter culture (YC-350) containing Lactobacillus
delbrueckii subsp. bulgaricus and Streptococcus thermophilus (50 U) was kindly provided by
Chr. Hansen (Hoersholm, Denmark) and stored at -40 °C upon reception. Vacuum pouches
were supplied by Lietpak UAB (Vilnius, Lithuania). Solid CO2 pellets were acquired from Seal
Weld Pro AS, Norway. Rubber injection ports (A Peel&StickTM Adhesive Rubber Injection
Port) were supplied by Shroom Supply, Florida, USA.
MRS agar (De Man, Rogosa, & Sharpe, 1960) and M 17 agar acc. To TERZAGHI from
Merck (New Jersey, US) were used for microbiological analysis of yoghurt samples, along with
peptone water (CM0009) from Oxoid (Hampshire, UK).
2.2 Preparation of reconstituted skim milk
Reconstituted skim milk was prepared by mixing non-fat dried milk powder with sterile
distilled water to a final concentration of 120 g/L. The milk powder was dissolved with gentle
stirring (350 rpm) at room temperature overnight inside the laminar flow cabinet to ensure
sterile conditions, avoiding the use of carcinogenic sodium azide (NaN3), a bacteriostatic agent
typically used to preserve protein-rich samples such as milk (Upadhyay, Goyal, Kumar, Ghai,
& Singh, 2014). The total solid content of the reconstituted milk was measured after 18 h at
105 °C to 10.8 ± 0.0248% (N=6). The total solid content of the reconstituted milk was measured
after 18 h at 105 °C. The temperature of the milk was standardised at 27 °C in a thermostatic
water bath (Grant Instruments, Cambridge, UK) prior to processing to ensure the supercritical
state of CO2 during the HPP.
2.3 Milk processing
Milk was processed either by traditional heat treatment (85 °C for 20 min) or by a
sequential combination of non-thermal processing technologies (smart processing), including
CO2, HPP and low frequency US treatment (hurdle technology). Figure 11 presents an overview
of the milk processing steps following both smart and traditional schemes.

22
Figure 11: Overview of the milk processing steps according to non-thermal combination technology or
traditional heat treatment.
2.3.1 Traditional heat treatment
500 mL reconstituted milk was heat-treated in a vacuum pouch at 85 °C for 20 min using
a water bath. After the heat treatment, the milk was cooled down to 42 °C in ice water.
2.3.2 Inoculation of starter culture
Prior to inoculation into the processed milk, the freeze-dried starter culture, stored at -
40 °C upon reception, was reactivated by transferring half the content of a pouch (25 U) to 500
mL reconstituted milk at 42 °C under sterile conditions. The freeze-dried starter culture was
allowed to dissolve for 20 min on a magnetic stirrer plate (350 rpm, 42 °C). Then, 10 mL of the
cell suspension was transferred for convenience into a 15 mL sterile Falcon tube under sterile
conditions. 2 mL was sampled into a 3 mL sterile syringe with a sterile needle and aseptically
injected into the headspace of the pouch (Figure 12) containing the processed milk, through a
23
sanitised rubber injection port. The final inoculum size in the milk was adjusted to 0.2 U/L,
according to the manufacturer instructions. The inoculated samples were gently shaken to
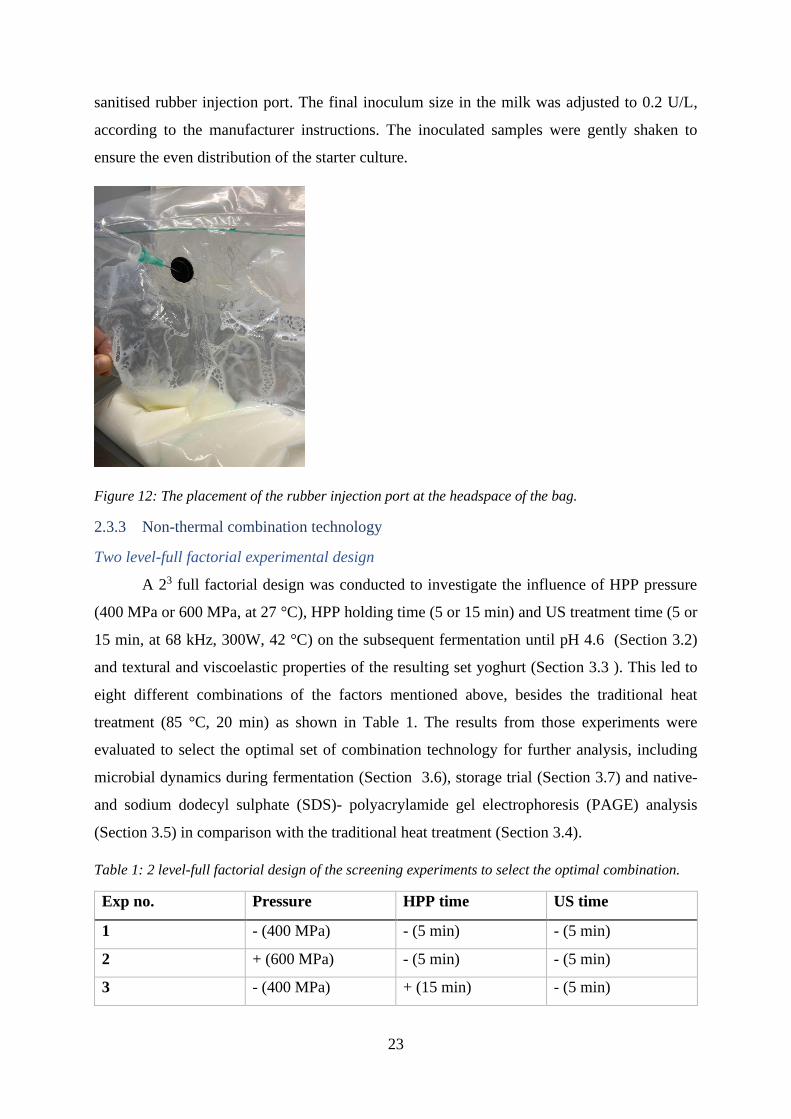
ensure the even distribution of the starter culture.
Figure 12: The placement of the rubber injection port at the headspace of the bag.
2.3.3 Non-thermal combination technology
Two level-full factorial experimental design
A 23 full factorial design was conducted to investigate the influence of HPP pressure
(400 MPa or 600 MPa, at 27 °C), HPP holding time (5 or 15 min) and US treatment time (5 or
15 min, at 68 kHz, 300W, 42 °C) on the subsequent fermentation until pH 4.6 (Section 3.2)
and textural and viscoelastic properties of the resulting set yoghurt (Section 3.3 ). This led to
eight different combinations of the factors mentioned above, besides the traditional heat
treatment (85 °C, 20 min) as shown in Table 1. The results from those experiments were
evaluated to select the optimal set of combination technology for further analysis, including
microbial dynamics during fermentation (Section 3.6), storage trial (Section 3.7) and native-
and sodium dodecyl sulphate (SDS)- polyacrylamide gel electrophoresis (PAGE) analysis
(Section 3.5) in comparison with the traditional heat treatment (Section 3.4).
Table 1: 2 level-full factorial design of the screening experiments to select the optimal combination.
Exp no. Pressure HPP time US time
1 - (400 MPa) - (5 min) - (5 min)
2 + (600 MPa) - (5 min) - (5 min)
3 - (400 MPa) + (15 min) - (5 min)
24
4 + (600 MPa) + (15 min) - (5 min)
5 - (400 MPa) - (5 min) + (15 min)
6 + (600 MPa) - (5 min) + (15 min)
7 - (400 MPa) + (15 min) + (15 min)
8 + (600 MPa) + (15 min) + (15 min)
9 Traditional, 85 °C, 20 min
- is the lowest level for each factor, + is the highest level for each factor.
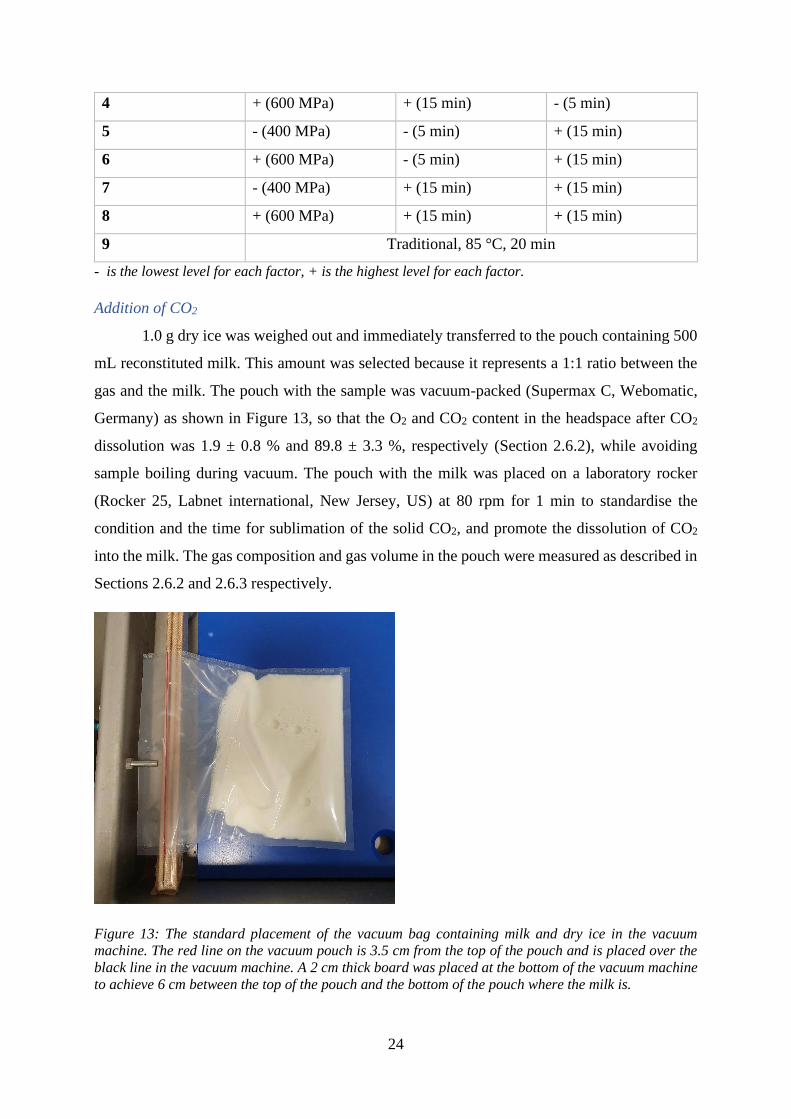
Addition of CO2
1.0 g dry ice was weighed out and immediately transferred to the pouch containing 500
mL reconstituted milk. This amount was selected because it represents a 1:1 ratio between the
gas and the milk. The pouch with the sample was vacuum-packed (Supermax C, Webomatic,
Germany) as shown in Figure 13, so that the O2 and CO2 content in the headspace after CO2
dissolution was 1.9 ± 0.8 % and 89.8 ± 3.3 %, respectively (Section 2.6.2), while avoiding
sample boiling during vacuum. The pouch with the milk was placed on a laboratory rocker
(Rocker 25, Labnet international, New Jersey, US) at 80 rpm for 1 min to standardise the
condition and the time for sublimation of the solid CO2, and promote the dissolution of CO2
into the milk. The gas composition and gas volume in the pouch were measured as described in
Sections 2.6.2 and 2.6.3 respectively.
Figure 13: The standard placement of the vacuum bag containing milk and dry ice in the vacuum
machine. The red line on the vacuum pouch is 3.5 cm from the top of the pouch and is placed over the
black line in the vacuum machine. A 2 cm thick board was placed at the bottom of the vacuum machine
to achieve 6 cm between the top of the pouch and the bottom of the pouch where the milk is.
25
High pressure processing (HPP)
High-pressure processing (HPP) of the milk treated with CO2 was performed at 400 or
600 MPa for 5 or 15 min, temperature ranging between 11 and 38 °C, using a high hydrostatic
pressure machine QFL 2L-700 (Avure Technologies Inc., Columbus, USA). The pressure levels
were pre-programmed at 410 or 610 MPa to ensure actual values above 400 and 600 MPa,
respectively, throughout the holding time. After the addition of CO2, the pouch containing the
milk was double-bagged before it was placed in the HPP treatment chamber filled with distilled
water. The pressure and temperature changes in the chamber were recorded using a software
(RSView runtime 1500 Ver. 06.02.20.00).
Inoculation
Following HPP, the surface of the sample pouch was disinfected with 70% v/v ethanol.
The inoculation procedure followed that for the traditional heat treatment as described in
Section 2.3.2).
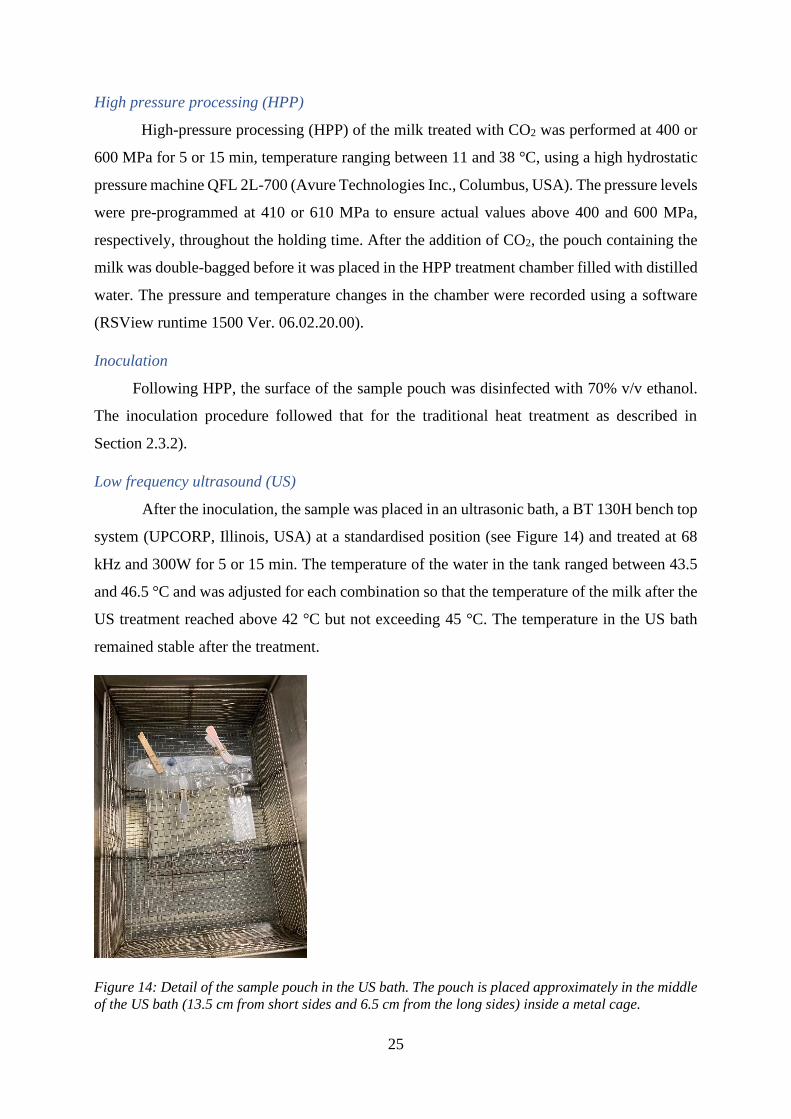
Low frequency ultrasound (US)
After the inoculation, the sample was placed in an ultrasonic bath, a BT 130H bench top
system (UPCORP, Illinois, USA) at a standardised position (see Figure 14) and treated at 68
kHz and 300W for 5 or 15 min. The temperature of the water in the tank ranged between 43.5
and 46.5 °C and was adjusted for each combination so that the temperature of the milk after the
US treatment reached above 42 °C but not exceeding 45 °C. The temperature in the US bath
remained stable after the treatment.
Figure 14: Detail of the sample pouch in the US bath. The pouch is placed approximately in the middle
of the US bath (13.5 cm from short sides and 6.5 cm from the long sides) inside a metal cage.

26
2.4 Fermentation
The milk, either heat treated or using combination technology, was distributed into either
100 mL sterile cups (Sarstedt, Germany), approximately 60 mL in each, or 15 mL Falcon tubes,
approximately 10 mL in each, while maintaining the temperature of the milk above 42 °C using
a water bath at 43 °C. The milk in the cups and tubes was fermented at 42 °C in an incubator
(B9000, Termaks, Bergen, Norway) with aluminium foil loosely over the top, as well as a
Scotch bottle with water and lid off inside the incubator, to minimise evaporation. During the
fermentation, a Falcon tube was sampled every 30 min and afterwards discarded, in order to
monitor the evolution of pH and thus determine the total fermentation time, (Section 2.6.1).
Total fermentation time was calculated by applying linear regression on the measured values
from three hours of fermentation on, so that the time at which the pH reached 4.6 was
interpolated. Small strain rheological measurements were performed during the fermentation to
monitor the development of the viscoelastic properties of the sample (Section 2.6.6). Viable
plate counts for both bacterial species in the starter culture were determined every 30 min during
fermentation (Section 2.6.4), for the traditional treatment and the optimal combination
technology. The cups with the yoghurt were transferred to an ice bath at the end of the
fermentation i.e. when the pH in the Falcon tubes reached 4.6 and cooled down to 4 °C by using
a water bath with ice.
2.5 Storage
The samples in the cups were stored overnight at 4 °C with lids on and afterwards
subjected to texture measurements (Section 2.6.7).
2.5.1 42 days storage trial
Milk samples processed via traditional heat treatment and the optimal combination
technology (HPP: 400 MPa for 15 min; US: 68 kHz, 300 W for 15 min), based on the results
from the full factorial experimental design, were subjected to a storage trial of up to 42 days
(Section 3.4). The milk treated accordingly was distributed into either 15 mL Falcon tubes or
25 mL conical flasks and fermented at 42 °C as described in Section 2.4. Besides microbial
dynamics during fermentation, viable plate counts LB and ST (Section 2.6.4), titratable acidity
(Section 2.6.8) and pH (Section 2.6.1) were analysed after 1, 7, 14, 21, 28 and 42 days of storage
at 4 °C. The whey separation (Section 2.6.9) was measured after 1, 7 and 42 days.

27
2.6 Process and product characterisation
All processing steps, including fermentation, as well as the final yoghurt product were
characterised, as shown in Figure 15. Analytical measurements to characterise milk processing
included pH and temperature, gas volume and composition, and native- and SDS-PAGE. pH,
fermentation time and microbial dynamics were used to characterise the fermentation process.
Texture analysis and rheological measurements were conducted on the final yoghurt product,
and viable plate counts for both LB and ST, titratable acidity and whey separation were analysed
during 42 days of storage at 4 °C.
Figure 15: Overview of different analytical methods for product and process characterisation during
yoghurt production.
2.6.1 pH and temperature measurement
A benchtop pH meter (EasyFive FP20, Mettler Toledo, Oslo, Norway) with an
integrated temperature sensor (LE438) was used to measure the pH of the milk/set gel. The
sample was mixed well with a disposal pipet before the measurement to minimise possible pH
gradients along the z axis (sample depth), attributed to varying oxygen availability and thus,
bacterial predominance and microbial metabolism. Temperature was measured using a
handheld thermometer (104-IR, Testo SE & Co. KGaA, Titisee-Neustadt, Germany)
throughout the experiments.
Process characterisation
• pH
• temperature
• gas volume and composition
• native- and SDS-PAGE
Product characterisation
• Viscoelastic properties of the yoghurt gel at 42 °C and 4 °C
• Yield strain (%) and yield stress (Pa)
• Penetration
• Stress-relaxation
Fermentation characterisation
• pH development
• Total fermentation time
Storage stability
• Viable plate count of starter culture
• Titratable acidity and pH
• Whey separation

28
2.6.2 Gas composition
The gas composition in the headspace of the pouch was measured using a
Checkmate9900 analyser (PBI-Dansensor, Ringsted, Denmark). The gas was collected from
the headspace of the pouch by inserting a syringe through a foam rubber septum (Nordic
Supply, Skodje, Norway). The foam rubber septum was used to avoid diffusion of false
atmosphere into the gas analyser. The measurement was repeated for five pouches (N=5).
2.6.3 Gas volume
The gas volume in the headspace of the pouch was measured according to Rotabakk,
Lekang, and Sivertsvik (2007) with modifications, using a TA.XT Plus Texture Analyser
(Stable Micro Systems, Godalming, UK) equipped with a self-built probe (Figure 16). The gas
volume was measured in a pouch containing only CO2, or CO2 with 500 mL reconstituted milk
or 540 g distilled water, the latter based on the density of 60 g milk powder dissolved in 500
mL distilled water. The pouch was placed under the probe and submerged in a basin filled with
water at 2 mm/s for 15 s before it was held for 30 s. The selected speed and holding time were
chosen to minimise water movement in the beaker and to let the water stabilize before the
measurements. The Buoyance force was measured after 26 s, 28 s and 30 s. The volume of the
probe, measured at the start of the experiment using the same method as the gas volume
measurement, was subtracted from the average of these three measurements to obtain the
average volume of the headspace in the pouch. The measurement was repeated for five pouches
for each set of analysis (N=5).
Figure 16: The homemade probe attached to the texture analyser used to measure the gas volume in the
headspace of the vacuum pouch containing milk and CO2.

29
2.6.4 Microbial dynamics during fermentation and storage
During fermentation (every 30 min) and storage at 4 °C (1, 7, 14, 21, 28 and 42 days),
1 mL aliquots of samples subjected to either traditional heat treatment or the optimal
combination technology were transferred to 9 mL peptone water 0.1 % (w/v) and vortexed
thoroughly until a homogeneous suspension was achieved. Serial decimal dilutions were
prepared in peptone water and 100 µL of appropriate dilutions spread onto M17 and MRS agar
plates for determination of ST and LB, respectively. Prior to enumeration of viable plate counts,
M17 plates were incubated at 37 °C for 48 h under aerobic conditions. Anaerobic conditions
were generated for LB by pouring three extra layers of MRS agar tempered at 45-48 °C over
the dried, inoculated agar surface, followed by incubation at 37 °C for 72 h. Two technical and
two biological replicates were analysed during fermentation, while three independent triplicates
were sampled during the storage trial.
2.6.5 Native- and sodium dodecyl sulphate polyacrylamide gel electrophoresis (SDS-PAGE)
Native- and SDS-PAGE of the milk was performed as described by Anema and
McKenna (1996) and Anema and Klostermeyer (1997) with modifications. The milk subjected
to Native- and SDS-PAGE analyses were (1) untreated reconstituted milk, (2) milk heat-treated
at 85 °C for 20 min, (3) milk treated with HPP 400 MPa for 15 min, (4) milk treated with HPP
400 MPa for 15 min and US for 15 min, (5) milk with CO2 treated with HPP 400 MPa for 15
min, and (6) milk with CO2 treated with 400 MPa for 15 min and US for 15 min. The analyses
were repeated twice using milk from two independent sample preparation (N=2).
Approximately 10 g of the sample was ultra-centrifuged at 100 000 g for 1 h at 20 °C
(Optima XPN-100 Ultracentrifuge, Beckman Coulter, USA) in a centrifuge tube (Centrifuge
Tubes Polycarbonate Thick Wall, Beckman Coulter, USA) and the associated Beckman Ti-70
rotor (Beckman Coulter, Ireland). Soluble caseins and whey proteins were defined as those that
did not sediment from the milk during the ultracentrifugation. 400 mL of the resulting
supernatant was transferred to a 1.5 mL Eppendorf tube and the pellets were discarded. Two
replicates were made for each supernatant. The semi quantitative measurement of protein
concentration of the supernatant was performed using a NanoPhotometer (Implen GmbH,
Germany) based on the Warburg-Christian method (A280/ A260 method) (Warburg &
Christian, 1941). 4 µL of sample was used for measurements with background corrections, and
distilled water was used as blank. The protein concentration of the sample was adjusted to 3.0
mg/mL with distilled water.

30
The samples were run on SDS-PAGE and native-PAGE under reducing and non-
reducing conditions, respectively. Dissociating and reducing conditions were obtained by
mixing 20 µL sample with 20 µL SDS-sample buffer containing19 µL 2x Laemmli sample
buffer (65.8 mM Tris-HCl, 26.3% (w/v) SDS and 0.01% Bromophenol Blue) and 1 µL β-
mercaptoethanol and heated at 100 °C for 5 min. Non-denaturing conditions was obtained by
mixing 20 µL sample with 20 µL Native Sample Buffer containing 62.5 mM Tris-HCl, 40%
glycerol and 0.01% Bromophenol Blue (Bio-Rad, California, US). 10 µL sample (final protein
concentration 1.5 mg/mL) was loaded in each well of a 12-well Mini-PROTEAN TGX Stain-
Free Precast Gel (Bio-Rad) with 10 µL standard (Precision Plus Protein Unstained Standards,
Bio-Rad). The gels were placed in a Mini-Protean Tetra Vertical Electrophorese Cell (Bio-Rad)
with a 1:10 diluted running buffer (10x Tris/Glycerine/SDS buffer, Bio-Rad) and run at 300 V
for 15 min. The gels were activated and imaged using ChemiDoc XRS+ (Bio-Rad) and analysed
using Image Lab software (version 6.0.1).
The content of serum phase proteins was determined by comparing the band intensities
of the treated reconstituted milk samples against those of the untreated reconstituted milk
samples on native- and SDS-PAGE gels.
2.6.6 Rheological measurements
Rheological measurements of the gelifying milk during fermentation and on the final
set gels were performed using a hybrid rheometer (Discovery HR-2,TA Instruments,
Newcastle, UK) and a cone (40 mm, 2°) and plate geometry as described by Anema (2008a),
with modifications. The geometry and the surface of the Peltier plate were disinfected with 70%
v/v ethanol before 750 µL of the treated milk was added to the rheometer. The cone geometry
was lowered into position and a solvent trap was placed around the sample to minimize
evaporation. Time course measurements of storage modulus (G’) and loss modulus (G’’) were
conducted at a frequency of 0.1 Hz and at a strain of 1.0% at 42 °C during the fermentation
(Section 2.4). The frequency and strain chosen were within the linear viscoelastic range of acid
milk gels (Marle & Zoon, 1995). Measurements were taken every 5 min. When the pH of the
samples in the incubator reached 4.6, the temperature of the sample was reduced to 4 °C and
stabilised for 15 min before the final G’ and G’’ values of the set gel at 4 °C were determined.
The set gel was then subjected to a strain sweep (see Figure 17 for typical strain sweep curve)
where the strain was increased from 0.5 to 300% at a constant frequency of 0.1 Hz. The yield
strain and the yield stress of the set gel were determined by using the package “Segmented”
(Muggeo, 2008) in the R program (The R Foundation for Statistical Computing, Vienna).

31
Figure 17: Typical strain sweep curve.
2.6.7 Texture analysis of set gel
Penetration
The penetration test was performed according to Vercet, Oria, Marquina, Crelier, and
Lopez-Buesa (2002) with modifications. The measurement was performed using a TA.XT plus
texture analyser with a 1/2’’ Dia Cylinder Delrin Radiused probe (Stable Micro Systems Ltd,
Godalming, UK). The sample temperature was 4 °C and only one measurement was performed
in the middle of each cup containing approximately 60 mL set gel. The probe was placed less
than 7 mm from the surface of the samples to ensure 15 mm of penetration depth. The test speed
was set to 0.5 mm/s over a length of 22 mm. A typical penetration test curve is shown in Figure
18. Breaking force (g), force 15 mm (g), and area (g*s) were calculated. Breaking force shows
how much force is required to break down the gel and force at 15 mm gives an indication about
the firmness of the sample. The area under the penetration start from the start point until 15 mm
down into the sample demonstrate how much work is required to get 15 mm down in the sample
(N=3-6).

32
Figure 18: Typical curve from penetration test, with breaking point and force 15 mm (g), as well as area
under the curve (marked in red).
Stress-relaxation
The stress-relaxation test was performed as described by Vercet et al. (2002) with
modifications using a TA.XT plus texture analyser with a 1/2’’ Dia Cylinder Delrin Radiused
probe (Stable Micro Systems Ltd, Godalming, UK). The stress-relaxation test was performed
on three replicates immediately after they were taken out of cold storage (4 °C). Stress-
relaxation test was performed by maintaining a 2.5 mm deformation into the sample (at 1.0
mm/sec) for 120 s. A typical stress-relaxation test curve is shown in Figure 19. The following
data were obtained from the stress-relaxation test: max force (g), minimum residual force (g),
relaxation force (g), and% residual force. Max force is the maximum force at the surface of the
set gel, while minimum residual force is the force that has not recovered at the end of the test
(2 min). Relaxation force is the force that has recovered at the end of the test. Relaxation force
and minimum residual force added together is the max force. Residual force (%) is the% of max
force that is left after two mins holding time (N=3-7).

33
Figure 19: Typical curve from the stress-relaxation test, with max force (g) and min residual force (g).
Residual force (%) is the quotient of min residual force over max force.
2.6.8 Titratable acidity
The content of lactic acid in yoghurt (% v/v) was determined by titration as described
by Ghasempour, Moghaddas Kia, Golbandi, and Ehsani (2019), with modifications.
Approximately 5 g yoghurt was mixed with 5 g distilled water and titrated with 0.1 M NaOH
until the pH reached 8.30 ± 0.01 and stabilised at this pH for at least 30 s. Stable pH for 30 s
was chosen since the yoghurt reacted, making the pH drop slowly, but continuously. Lactic acid
has a molecular weight of 90.08 g/mol. Assuming that lactic acid is the predominant acid in the
yoghurt sample, the percentage of lactic acid was determined using Equation 2.
Equation 2
𝐿𝑎𝑐𝑡𝑖𝑐 𝑎𝑐𝑖𝑑 (%) =𝑉 ∗ 0.009
𝑚∗ 100%
V (mL) = volume of 0.1 M NaOH
m (g) = mass of yoghurt
0.009 = titration acid expressed in units of lactic acid

34
2.6.9 Whey separation
Whey separation was determined using the volumetric flask method described by
Lucey, Munro, and Singh (1998) and Peng et al. (2009) with modifications, after 1, 7 and 42
days of storage at 4 °C. Prior to conducting the experiment, the volumetric flasks were weighed
and marked. Immediately after milk treatment, approximately 20 mL was transferred into 25
mL volumetric flasks and fermented at 42 °C in the incubator until the pH reached 4.6, cooled
down to 4 °C in an ice bath and stored at 4 °C. Any liquid (whey) on the surface of a milk gel
was gently poured out and the volumetric flasks were weighed again. The measurements were
done in triplicate. The degree of whey separation was expressed as a percentage of the total
weight of the set gel.
2.7 Replicates and statistical analysis
All experiments were conducted at least in duplicates. Error bars on graphs represent
standard deviation (SD) of replicates. Data was analysed using SPSS (26.0, IBM, New York,
US) where relevant using General linear model Univariate procedure and one-way ANOVA
with Tukey as post hoc analysis. Results with p≤0.05 were reported as significant.

35
3 Results and discussion
3.1 Process characterisation
3.1.1 pH change during milk processing
The pH was measured at different stages of milk processing prior to the fermentation.
The initial pH (Figure 20) of the milk was 6.6 ± 0.04 and decreased to 6.2 ± 0.03 after the
addition of CO2. This decrease in pH was similar to Martin (2002) findings where the pH of
milk decreased from 6.8 to 6.1 after CO2 were bubbled into the milk. The average pH of the
HPP-treated milk was 6.4 ± 0.04 and 6.8 ± 0.007 with and without the addition of CO2
respectively. After the inoculation and the following US treatment (68 kHz, 300 W, 5 min or
15 min), the pH of the treated milk decreased to pH 6.2 ± 0.05 in the presence of CO2. The pH
of the milk increased by approximately 0.2 (from 6.6 ± 0.04 to 6.8 ± 0.007 without CO2 and
from 6.2 ± 0.03 to 6.4 ± 0.04 with CO2) as a result of the HPP treatment. After US treatment,
the pH of the milk decreased to a similar value of that prior to the HPP treatment, indicating
that HPP affected the casein micelle. At pressures above 400 MPa, α-LA and β-LG denature,
and the casein micelle dissociates along with the dissociation of CCP from the casein micelle.
The release of CCP during pressure treatment could be a possible explanation for the temporary
increase in pH. As the pressure is released, the casein micelle will reassociate, although changes
in the size of the casein micelle gave been observed (Olsen & Orlien, 2016). The pH of the milk
decreases again after US treatment, suggesting that US treatment might also alter the
physiochemical properties of milk proteins. However, a study done by Chandrapala, Martin,
Zisu, Kentish, and Ashokkumar (2012) on the effect of ultrasound (20 kHz, 450 W, 50%
amplitude, within 10 °C of room temperature, up to 60 min) on the casein micelle integrity in
skimmed milk did not find any significant changes on the concentration of soluble caseins no
measurable changes in the concertation of soluble calcium. They did however find a small
decrease in pH, probably as a result of formation of nitric acid through reaction between oxygen
and nitrogen (Supeno & Kruus, 2000). The pH of the heat treated sample (85 °C, 20 min) was
6.5 ± 0.03 prior to the fermentation.

36
Figure 20: pH measured at the different steps of milk processing. In untreated milk, after CO2 addition,
after HPP with and without CO2, and at the start of fermentation for the sample subjected to the
traditional heat treatment (85 °C, 20 min) and to the combination technology (CO2, HPP and US). The
pH is reported as mean ± SD.
3.1.2 Supercritical CO2 and temperature during HPP
CO2 is in a supercritical state when the pressure is above 7.4 MPa (Tp) and the
temperature is above 31.1 °C (Tc) (Cheung, 1999). Figure 21 shows the time that the
temperature and pressure is above the critical temperature and pressure for CO2. The
temperature indicate the temperature in the chamber, but it is estimated that the temperature in
the chamber and the milk are similar due to the milk being liquid and in good contact with the
water inside the chamber and the volume of the milk (500 mL) is relative small compared to
the volume of the chamber (2000 mL). The time CO2 is in critical state indicated here is just
an estimate. The pressure for the combination technologies were 400 or 600 MPa, well above
7.4 MPa. The temperature of the untreated milk was standardised to 27 °C using a water bath.
The temperature during HPP did not exceed 31.1 °C for the whole duration of the pressure
treatment. Both 400 MPa, 5 min and 400 MPa, 15 min had approximately 1 min and 40 s in
sCO2 state. 600 MPa, 5 min had approximately 4 min and 35 s, while 600 MPa, 15 min had
approximately 5 min and 15 s. After HPP treatment the temperature of the sample ranged
between 11.4 ± 0.5 °C and 17.9 ± 0.5 °C (Table 2), depending on the pressure and the duration
of the treatment. This is due to adiabatic pressure release.
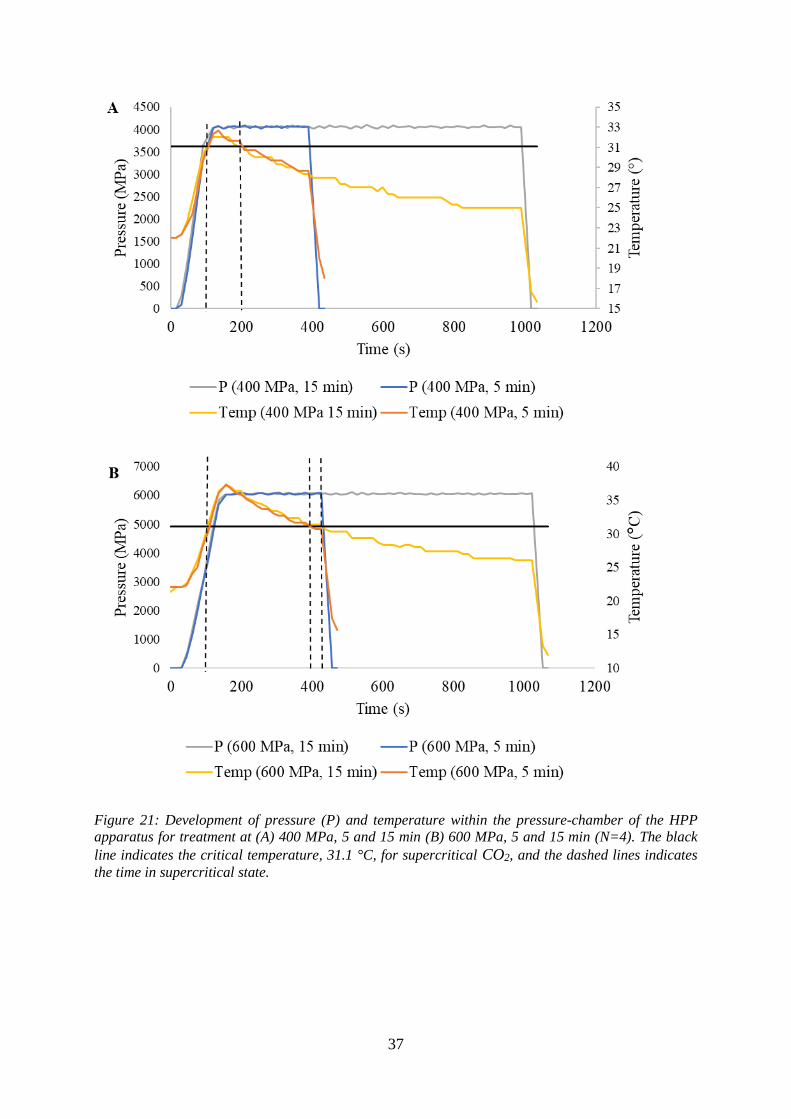
37
Figure 21: Development of pressure (P) and temperature within the pressure-chamber of the HPP
apparatus for treatment at (A) 400 MPa, 5 and 15 min (B) 600 MPa, 5 and 15 min (N=4). The black
line indicates the critical temperature, 31.1 °C, for supercritical CO2, and the dashed lines indicates
the time in supercritical state.

38
Table 2: Temperature in the milk after HPP treatment at either 400 MPa or 600 MPa for a duration of
either 5 min or 15 min (mean ± SD, N=2-3).
HPP treatment Temperature (°C)
400 MPa, 5 min 17.9 ± 0.5
400 MPa, 15 min 15.2 ± 0.3
600 MPa, 5 min 15.3 ± 0.2
600 MPa, 15 min 11.4 ± 0.5
3.1.3 Gas volume and composition
The gas volume and composition were measured as described in Section 2.6.2 and 2.6.3.
The gas volume in 500 mL reconstituted milk with CO2 was 266.2 ± 23.5 mL. The CO2 and O2
content were 89.8 ± 3.3% and 1.9 ± 0.8%, respectively. There was some variability in the gas
volume (8.8%) and gas composition (3.7% for CO2 and 42.1% for O2). This could be explained
by the fast evaporation of dry ice as it came in contact with the milk at the time of the vacuum
packing.
3.2 Fermentation
3.2.1 pH development
The pH of the sample was monitored every hour during the fermentation until the pH
reached 4.6, as presented in Figure 22. pH at the start of the fermentation was higher for the
heat treated milk (pH 6.5) compared to the samples subjected to the combination technologies
(pH 6.2) (Figure 20). It was found that the pH at fermentation start was independent of the
processing time (see Section 6.1).
The pH of the heat treated sample decreased continuously throughout the fermentation.
For the sample subjected to the combination technology, there was a shoulder phase in the pH
reduction during the first hour of fermentation, even with a slight increase in pH. Since no lag
phase was apparently observed in the growth curves for both microbial species (Section 3.6), it
is unlikely that the starter culture was negatively affected by the higher CO2 concentration.
Another explanation could be the evaporation of CO2 during the first stage of fermentation as
the sealed pouch with the sample was cut open after the processing. The CO2 evaporation
causing a slight pH increase may have concealed the decrease in pH by the starter culture.
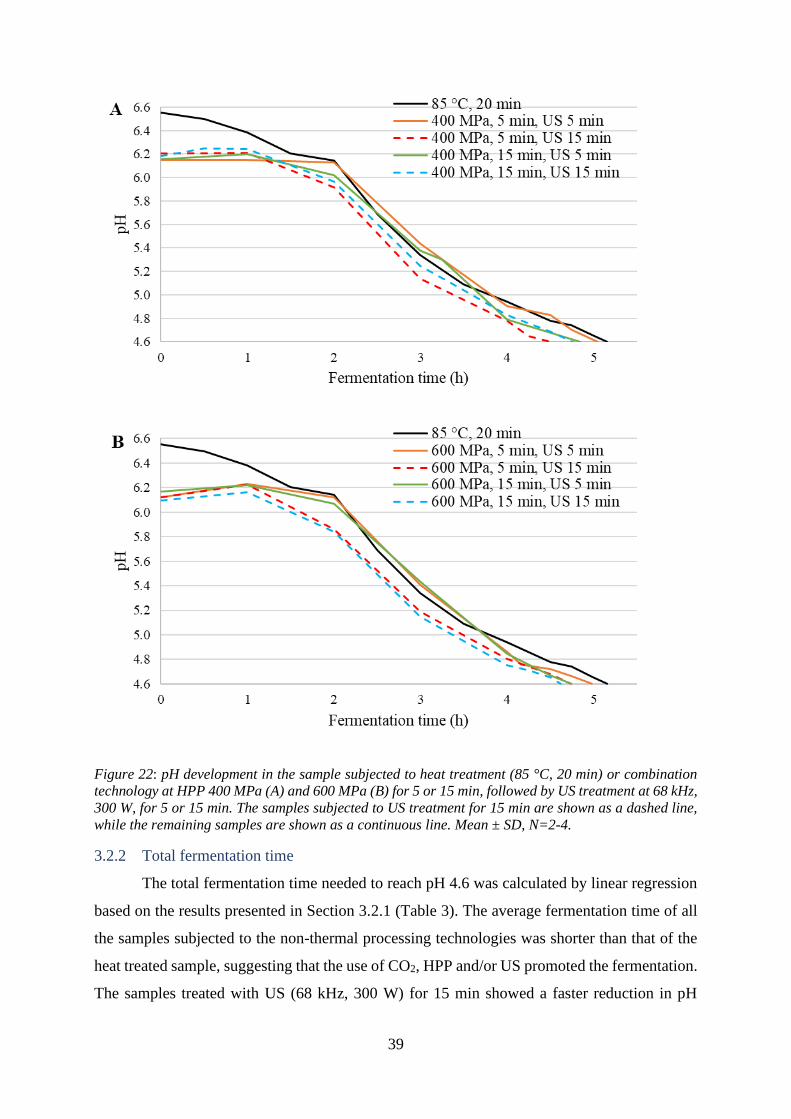
39
Figure 22: pH development in the sample subjected to heat treatment (85 °C, 20 min) or combination
technology at HPP 400 MPa (A) and 600 MPa (B) for 5 or 15 min, followed by US treatment at 68 kHz,
300 W, for 5 or 15 min. The samples subjected to US treatment for 15 min are shown as a dashed line,
while the remaining samples are shown as a continuous line. Mean ± SD, N=2-4.
3.2.2 Total fermentation time
The total fermentation time needed to reach pH 4.6 was calculated by linear regression
based on the results presented in Section 3.2.1 (Table 3). The average fermentation time of all
the samples subjected to the non-thermal processing technologies was shorter than that of the
heat treated sample, suggesting that the use of CO2, HPP and/or US promoted the fermentation.
The samples treated with US (68 kHz, 300 W) for 15 min showed a faster reduction in pH

40
compared to the sample treated with US for 5 min, especially in combination with HPP
treatment at 600 MPa for 5 or 15 min (Figure 22). The results are consistent with the previous
findings. Wu et al. (2000) found that US treatment resulted in reduction of up to 30 min in the
fermentation time mostly due to accelerated acidification in the last part of the process, while
Vinderola et al. (2000) reported a reduced fermentation time by 57.5 min in fermented milk
with the addition of CO2. Vercet et al. (2002) found the exact opposite, with longer fermentation
time due to retardation acidification in the last part of the process, after combined US and
pressure treatment (20 kHz, 2 kg/cm3 pressure, 40 °C, 12 s) compared to control. Ozcan, Horne,
and Lucey (2015) found shorter fermentation time (approximately 25 min) in milk with initial
pH of 6.2 (pH lowered with 0.5 N HCl) compared to initial pH of 6.7, and suggested that this
could due to the lower initial pH reducing the acid-base buffering of the milk due to
solubilisation of CCP, and thus making it easier to decrease the pH. A trend is seen towards 15
min US treatment having a faster fermentation time compared to 5 min US treatment, indicating
that longer treatment time in the US is having a bigger promoting effect on the growth of the
starter culture. US treatment leads to selective permeabilization (sonoporation) of the cell
membrane of the starter culture, leading to increased transport of nutrients into and removal of
waste products from the bacteria cell, possibly indicating that the sonoporation effect is greater
after 15 min without being so large that the cells rupture.
The SD of the total fermentation times ranges between 4 and 25 min. A variability in
the fermentation time will be expected, influenced by the concentration of the starter culture,
balance and variation between the different strains in the culture, and fermentation temperature
("Tetra Pak Dairy processing handbook," 2015). Variation in fermentation times are also the
case in the industry.
Table 3: Total fermentation time (h) required to reach pH 4.60. The fermentation time (h) is presented
in ascending order from fastest to slowest (mean ± SD, N=2-4).
Yoghurt combination Fermentation time (h)
400 MPa, 5 min, US 15 min 4.50 ± 0.16
600 MPa, 15 min, US 15 min 4.62 ± 0.07
600 MPa, 5 min, US 15 min 4.74 ± 0.18
600 MPa, 15 min, US 5 min 4.75 ± 0.36
400 MPa, 15 min, US 15 min 4.76 ± 0.20
400 MPa, 15 min, US 5 min 4.85 ± 0.42
600 MPa, 5 min, US 5 min 4.98 ± 0.32

41
400 MPa, 5 min, US 5 min 5.05 ± 0.11
85 °C, 20 min 5.16 ± 0.17
3.3 Product characterisation
3.3.1 Viscoelastic properties of the yoghurt gel at 42 °C and 4 °C
Milk samples were treated according to the respective processing conditions and their
viscoelastic properties were followed during the fermentation at 42 °C and after 15 min of
cooling (4 °C). Those subjected to the traditional heat treatment (85 °C, 20 min) and the
combination technology with HPP 400 MPa (5 or 15 min, followed by US, 68 kHz, 300W, for
5 or 15 min) were repeated twice, while only one rheological measurement was performed for
the remaining samples with HPP 600 MPa (5 or 15 min, followed by US 5 or 15 min), due to
time constrains. The final elastic modulus (G’) and loss modulus (G’’) of the yoghurt gel at 42
°C at the end of fermentation (at pH 4.6) and at 4 °C are presented in Figure 23. G’ describes
the solid-state behaviour of a sample, while G’’ describes the viscoelastic behaviour ("Basics
of rheology,"). The SD in the final G’ and G’’ of the milk gel produced using 400 MPa for 5 or
15 min is large at both temperatures, indicating a large variability in the gelation process in the
samples as compared to the traditional heat treatment (Figure 24).
The treatment with HPP 400 MPa for 15 min resulted in a yoghurt gel with the higher
G’ and G’’ than with HPP 400 MPa for 5 min and which were comparable to those of the sample
subjected to the heat treatment, regardless of the US time (5 or 15 min). These findings are in
agreement with the findings by Harte et al. (2002) (although at different pressures), which found
that milk treated at 676 MPa for 30 min gave gels with similar rheological curves as heated
milk, while milk treated at 676 MPa for 5 min gave yoghurt with weaker gel structure. Our
findings at 600 MPa did not give results in agreement with that of Harte et al. (2002). 600 MPa
lead to weaker yoghurt gels for both 5 and 15 min holding time. Other studies agreed with our
findings for 400 MPa 5 min and 600 MPa 5 and 15 min, which gave weaker G’ profiles and
final G’ compared to milk with higher pH (which in our case is heat treated milk) (Anema,
2010; Ozcan et al., 2015).
Nguyen and Anema (2017) found that ultrasonification (22.5 kHz, 50 W) gave yoghurt
gels with similar final G’ as heat treated (80 °C, 30 min) milk (475 Pa), while longer treatment
time gave decreasingly lower final G’, with lowest G’ (175 Pa) after 30 min. Similar trends

42
were seen in this experiment, with lower final G’ for all treatments after US 15 min compared
to US 5 min, except for HPP 600 MPa, 15 min.
The G’ and G’’ of the gel is determined from the number of connections between the
constituents of the gel as well as the type of connections (Anema, 2008c). This indicates that
the traditional yoghurt has more bonds inside the gel network than yoghurt made from non-
thermal processing technologies, with exception of 400 MPa, 15 min. US treatment has a
homogenising effect on the fat globules in milk, reducing their size (Wu et al., 2000). It is
therefore expected that this will affect the number of bonds and their distribution in the yoghurt
gel network formed, along with the effect HPP has on milk proteins. There is need for repetition
of the rheological measurements, especially for HPP 600 MPa.
Figure 23: Final G’ (■) and G’’ (♦) for yoghurt gel formed from milk treated either traditionally or
using non-thermal processing technologies at the end of the gelation process (42 °C) and after cooling
(4 °C) (mean ± SD, N=1-5). Non-thermal processing conditions are CO2, HPP (either 400 or 600 MPa
for either 5 or 15 min), followed by US (68 kHz, 300 W for either 5 or 15 min). Traditionally is heat
treatment at 85 °C for 20 min. The dashed horizontal lines are as comparison against traditional heat
treatment.
43
Figure 24: G’ (Pa) during the gelation process of yoghurt produced using traditional heat treatment
(85 °C, 20 min) and combination technology (400 MPa, 15 min, US 15 min).
3.3.2 Yield strain (%) and yield stress (Pa)
Strain sweep were performed on the final yoghurt gel after 15 min of cooling at 4 °C.
Typical strain weep curves are shown in Figure 17. The onset point represented the point at
which the gel structure yielded. The corresponding strain (%) and stress (Pa) were determined
as the yield strain and stress of the yoghurt gel at 4 °C respectively. Figure 25 displays the yield
strain and stress of the samples prepared as described in Section 2.6.6. As in the final G’ and
G’’ values, the SD between the replicates was large, indicating the variability in the gel
properties of the samples. Nonetheless, the yoghurt produced from the heat treated milk showed
higher yield strain (%) and yield stress (Pa) than the samples subjected to the combination
technology. Needs et al. (2000) also found lower yield stress in pressure treated milk (600 MPa,
15 min) compared to heat treated milk (85 °C, 20 min), while Anema (2008c) found the exact
opposite. Yield strain depends on the strand curvature, meaning that a higher yield strain is
observed for higher strand curvature as the strand first have to be straighten before it is stretched
and yield (Anema, 2008c). Low yield strain indicates a brittle gel (Lucey, 2001). Yield stress
depends on the number and type of bonds in the gel network, with more and stronger bonds,
e.g. covalent bonds instead of non-covalent bonds, giving larger yield stress before yielding
(Anema, 2008c). The higher yield stress and strain obtained for the traditional sample suggested
that this gel contained more and/or stronger bonds and could resist more stress (rearrangements)
44
before the gel was yielded, compared to the gel made using the combination technology. 400
MPa for 15 min gave higher yield stress than 5 min, suggesting that 15 min lead to formation
of more and stronger bonds. Little effect was seen from US time. There was little variation in
the yield strain between the 400 MPa samples, indicating that 400 MPa affected the
interconnectivity within the gel network, thus the gel properties, while US time did not. 600
MPa showed different trends but need more repetition.
Figure 25: Yield stress (Pa) (orange) and yield strain (%) (blue) calculated based on G’ for yoghurt gel
formed from milk treated either traditionally or using non-thermal processing technologies (mean ± SD,
N=1-5). Non-thermal processing conditions are CO2, HPP (either 400 or 600 MPa for either 5 or 15
min), followed by US (68 kHz, 300 W for either 5 or 15 min). Traditionally is heat treatment at 85 °C
for 20 min. The dashed horizontal lines are as comparison against traditional heat treatment.
3.3.3 Penetration
Breaking force (g) is the force required to break down the gel surface and is shown in
Figure 26. There is no significant difference between the breaking point of the yoghurt made
using combination technology and traditional heat treatment. Force 15 mm down into the
sample gives an indication to the firmness, and area under the curve is the total work of
penetration required to penetrate 15 mm down in the sample. Both force at 15 mm (g) and area
(g·s) is shown in Figure 27. Area and force 15 mm seem to follow the same trend for all of the
nine samples. Most of the yoghurt made using combination technology are not significantly
different to yoghurt made using heat treatment, except for 400 MPa, 15 min, US 15 min, 600

45
MPa, 5 min, US 15 min and 600 MPa, 15 min, US 15 min which have higher values for force
15 mm (g) and area (g*s)., indicating that these three combinations have a firmer gel structure
after one day storage at 4 °C. These three samples have 15 min US treatment in common, and
US time showed a strong significant effect (p=0.001) on the area and force 15 mm, indicating
that 15 min US treatment affects the firmness of the yoghurt gel formed. Our findings agree
with Vercet et al. (2002) findings that samples submitted to a combination of heat (40 °C), US
(20 kHz) and pressure (0.2 MPa) had a firmer structure and increased consistency and viscosity
than heat treated samples. This was possibly due to denaturation of serum proteins by US. There
were no significant interactions effects of the variables.
600 MPa, 15 min, US 15 min showed both higher breaking force and higher area and force
15 mm compared to the remaining samples. From these results it may be concluded that this
combination has a higher gel firmness after one day storage at 4 °C compared to the others.
Figure 26: The force needed to break the surface of the gel is plotted for the different processing
conditions (mean ± SD, N=3-6). Non-thermal processing conditions are CO2, HPP (either 400 or 600
MPa for either 5 or 15 min), followed by US (68 kHz, 300 W for either 5 or 15 min). Traditionally is
heat treatment at 85 °C for 20 min. The penetration test was performed after one day storage at 4 °C.
The dashed horizontal lines are as comparison against traditional heat treatment.

46
Figure 27: Area (g*s) under the penetration curve and the force (g) after 15 mm compression plotted
for the different processing conditions (mean ± SD, n=3-6). Non-thermal processing conditions are
CO2, HPP (either 400 or 600 MPa for either 5 or 15 min), followed by US (68 kHz, 300 W for either 5
or 15 min). Traditionally is heat treatment at 85 °C for 20 min. The penetration test was performed after
one day storage at 4 °C. The dashed horizontal lines are as comparison against traditional heat
treatment.
3.3.4 Stress-relaxation
Maximum force (g) is the force required to break the surface of the gel and gives an
indication on the hardness of the gel. Residual force (%) is the% of max force that is left after
two mins holding time. Maximum force (g) and residual force (%) are presented in Figure 28.
All samples, except for 600 MPa, 15 min, US 15 min, showed a lower maximum force than
traditional and similar or higher residual force (%). Vercet et al. (2002) found that yoghurt made
form milk subjected to heat (40 °C), pressure (0.2 MPa) and ultrasound (20 kHz) had slightly
lower (18.2%) residual force than yoghurt made from traditionally heated milk (19.4%), which
does not correspond to our findings. 600 MPa, 15 min, US 15 min on the other hand has higher
maximum force (g) and lower residual force (%). This suggests that this gel structure is harder,
but more brittle, since less % of the maximum force was left after 2 min. These findings
correspond to the results from the penetration test, where HPP 600 MPa, 15 min, US 15 min
also had the highest breaking force (g).

47
Statistical analysis found a significant interaction effect (p=0.01) between US and HPP time
for residual force (%). Further post hoc analysis revealed that HPP 15 min, US 5 min had a
significant higher residual force (p=0.012) than HPP 15 min, US 15 min. This suggest that when
the sample was HPP-treated for 15 min, US 5 min produced a more brittle yoghurt gel than US
treatment for 15 min. An interaction effect (p=0.034) was found between HPP pressure, HPP
time and US time for maximum force (g). Post hoc analysis revealed that the maximum force
of the yoghurt gel was significantly higher (indicating a harder gel) when the sample was
subjected to the HPP treatment for 15 min than for 5 min at 600 MPa (p=0.023). The US
treatment for 15 min resulted in a significantly higher maximum force of the yoghurt gel than
for 5 min (p=0.012), and this significant effect of US time was not found when the HPP 600
MPa was limited to 5 min or the HPP pressure was at 400 MPa. The treatment with 600 MPa,
15 min, US 15 min resulted in a significantly higher maximum force of the gel than 400 MPa,
15 min, US 15 min (p=0.007). These finding indicate that 600 MPa, 15 min, US 15 min
produced a harder gel than HPP at 400 MPa, for 5 min followed by US treatment for 5 min.
Figure 28: The force needed to break the gel surface (max force (g)) and the force that did not recuperate
after two min (residual force (%)) are plotted for the different processing conditions (mean ± SD, N=3-
7). Non-thermal processing conditions are CO2, HPP (either 400 or 600 MPa for either 5 or 15 min),
followed by US (68 kHz, 300 W for either 5 or 15 min). Traditionally is heat treatment at 85 °C for 20
min. Relaxation tests were performed at yoghurt gels stored at 4 °C after one day storage. The dashed
horizontal lines are as comparison against traditional heat treatment.
48
3.4 Selection of processing conditions
For further characterisation (microbial analysis during fermentation, native- and SDS-
PAGE) and for the storage trial up to 42 days, the treatment 400 MPa, 15 min, US 15 min was
selected among the eight combinations of CO2, HPP and US (Table 1) based on the total
fermentation time (Section 3.2.2), the rheological properties (Section 3.3.1 and 3.3.2) and
texture analysis (Section 3.3.3 and 3.3.4). Based on the results on the total fermentation time,
US treatment for 15 min showed a larger stimulatory effect on the starter culture than the US
treatment for 5 min. 400 MPa, 15 min, US 15 min was chosen as it has similar results to heat
treated milk in the textural analysis. In addition, the sample subjected to the respective treatment
showed the Final G’ and G’’ at 42 °C and 4 °C comparable to those of the heat treated sample.
3.5 Native- and SDS-PAGE
The milk subjected to Native- and SDS-PAGE analyses were (1) untreated reconstituted
milk, (2) milk heat-treated at 85 °C for 20 min, (3) milk treated with HPP 400 MPa for 15 mins,
(4) milk treated with HPP 400 MPa for 15 min and US for 15 mins, (5) milk with CO2 treated
with HPP 400 MPa for 15 mins, and (6) milk with CO2 treated with 400 MPa for 15 mins and
US for 15 mins. Soluble caseins and whey proteins (serum phase proteins) were defined as
those that did not sediment from the milk during the ultracentrifugation. The relative content of
the serum phase proteins was determined by comparing the band intensities of the treated
reconstituted milk sample against those of the untreated samples on native- and SDS-PAGE
gels. See Figure 29 and Figure 30 for an example of native- and SDS-PAGE gels, respectively.

49
Figure 29: Native-PAGE of milk either untreated or subjected to different treatments; traditional (85
°C, 20 min), HPP (400 MPa, 15 min), HPP + US (400 MPa, 15 min and 68 kHz, 300 W, 15 min), CO2
+ HPP (1 g dry ice and 400 MPa, 15 min) and CO2 + HPP + US (1 g dry ice, 400 MPa, 15 min and 68
kHz, 300 W, 15 min). The milk samples were centrifuged at 100 000 g for 1 h at 20 °C, the supernatant
with a final concentration of 1.5 mg/mL was run on native-PAGE. Column 1 and 12 contains Precision
Plus Protein Unstained Protein Standard. The bands of α-LA (14.2 kDa) and β-LG (18.3 kDa) are
marked with arrows.

50
Figure 30: SDS-PAGE of (A) untreated milk with a final concentration of 1.5 mg/mL loaded on the gel.
(B) either untreated milk or milk subjected to different treatments; traditional (85 °C, 20 min), HPP
(400 MPa, 15 min), HPP + US (400 MPa, 15 min and 68 kHz, 300 W, 15 min), CO2 + HPP (1 g dry ice
and 400 MPa, 15 min) and CO2 + HPP + US (1 g dry ice, 400 MPa, 15 min and 68 kHz, 300 W, 15
min). The milk samples were centrifuged at 100 000 g for 1 h at 20 °C, the supernatant with a final
concentration of 1.5 mg/mL was run on the gel. Column 1 and 12 contains Precision Plus Protein
Unstained Protein Standard. The bands of α-LA, β-LG, α-CN, β-CN and κ-CN are marked with arrows.
The effect of heat and different processing conditions of CO2, HPP and/or US on the
level of the serum phase whey fractions is presented in Figure 31 A and B. The whey proteins
remaining serum phase of the milk in native-PAGE after ultracentrifugation is a mixture of
native whey proteins, denatured whey proteins which has not associated with casein micelles
and aggregates. Low levels of β-LG were observed in the serum phase of heat treated milk
(approximately 10 and 30% in native- and SDS-PAGE, respectively), compared to pressure
treated milks. Pressure treated milk without CO2 had approximately 30 and 65% in native- and
SDS-PAGE, respectively, thus indicating that a greater proportion of β-LG denatured during
heat treatment and associated with casein proteins (in casein micelles), therefor being
sedimented during ultracentrifugation. Pressure treated milk with CO2, thus having a lower pH,
had even higher levels of β-LG, approximately 70 and 80% for native- and SDS-PAGE,

51
respectively. These results indicate that more β-LG is denatured at milk native pH (6.6), than
at lower pH. US treatment had little effect on the β-LG denaturation. The same trends were seen
for the percentage of β-LG in the serum phase after different treatments for both native- and
SDS-PAGE, but at different levels. This could be due to SDS-PAGE being run under reducing
conditions, thus dissociating β-LG dimers into monomers and protein aggregates, giving higher
levels of β-LG compared to native-PAGE where whey proteins remain in their native state.
α-LA levels in serum phase of the milk were higher than β-LG, with approximately 75%
compared to untreated milk after heat treatment and approximately 100% after pressure treated.
US and lowering of pH by CO2 had little effect on the level of α-LA. Anema (2008c) observed
more denaturation of α-LA and β-LG during heat treatment (80 °C, 30 min), 70 and 80%
respectively, than during pressure treatment (400 MPa, 30 min), 0 and 70%, respectively. This
is in agreement with our findings, where we observed a higher level of both α-LA and β-LG in
the serum phase after pressure treatment compared to heat treatment. Anema (2008a) found 40
and 50% non-sedimentable whey proteins in heat treated milk (80 °C, 30 min) at pH 6.2 and
6.6, respectively, with the level increasing markedly with increasing pH, which is the exact
opposite of our findings, with decreasing level of non-sedimentable whey proteins with
increasing pH.

52
Figure 31: Effects of different processing conditions on the level of the serum phase whey proteins (α-
LA and β-LG) when compared to the untreated milk on (A) native-PAGE gel and (B) SDS-PAGE:
traditional heat treatment (85 °C, 20 min), HPP (400 MPa, 15 min), HPP (400 MPa, 15 min) + US (68
kHz, 300 W, 15 mins), CO2 + HPP (400 MPa, 15 min) and CO2 + HPP (400 MPa, 15 min) + US (68
kHz, 300 W, 15 min) (mean ± SD, N=2, a=2).
The effect of heat and different processing conditions of CO2, HPP and/or US on the
level of the serum phase casein fractions is presented in Figure 32. If the treatment of the milk
leads to dissociation of casein from the casein micelle, these proteins will not sediment with the
casein micelle during ultracentrifugation but be found in the serum phase. α-casein were only
observed in the serum phase after HPP treatment (with and without CO2), indicating that HPP
led to a greater dissociation of the casein micelle than the heat treatment, but that the casein
micelle reassociated after US treatment. β-casein was found in the serum phase for all the
53
samples at approximately 20% of the untreated milk, except for the sample after HPP treatment
where a higher proportion, although not statistically significant, of the β-casein (40%) was
observed when compared to the heat treatment, suggesting that HPP led to greater dissociation
of β-casein from the casein micelle. However, when HPP was applied at lower pH (pH 6.2, with
the addition of CO2), β-casein was found to be 20% of the untreated milk, indicating that the
dissociation of β-casein from the casein micelle is pH dependent. A higher proportion of the κ-
casein dissociated from the micelle than the remaining casein fractions after heat treatment (50
%) and HPP (more than 70%) regardless of US treatment. However, this was not the case for
the sample subjected to the HPP treatment (with or without US treatment) at lower pH, which
showed a lower amount (20%) of k-casein in the serum phase than when HPP was applied
without CO2. Anema (2010) found that the amount of κ-casein in the serum phase increased
with pH, from 35% at pH 6.4 to 60% at pH 6.8, supporting our findings. A decrease in β-casein
after US treatment for HPP treated milk without CO2 (from 40 to 20%) was observed. This
could possibly due to acoustic cavitation caused by US leading to increased interaction between
the β-casein molecules and reassociation of β-casein with the casein micelle (Shanmugam,
Chandrapala, & Ashokkumar, 2012).
Figure 32: Effects of different processing conditions on the level of the serum phase casein (CN) (α-CN,
β-CN and κ-CN) when compared to the untreated milk on SDS-PAGE: traditional heat treatment (85
°C, 20 min), HPP (400 MPa, 15 min), HPP (400 MPa, 15 min) + US (68 kHz, 300 W, 15 mins), CO2 +
HPP (400 MPa, 15 min) and CO2 + HPP (400 MPa, 15 min) + US (68 kHz, 300 W, 15 min) (mean ±
SD, N=2, a=2).
Combining the amount of whey proteins and casein in the serum phase after HPP
treatment with CO2, it could seem that at lower milk pH (6.2) there is less dissociation of the

54
casein micelle (especially less dissociation of κ-casein), thus leaving more β-LG in the serum
phase since there is less k-casein available to interact with.
Denatured β-LG binds to κ-casein through disulphide bonds. These complexes can exist
in the colloidal phase (casein micelle) or in the serum phase of milk. In the serum phase of milk,
they are believed to form strand which are able to interconnect between casein micelles. Higher
level of denatured β-LG/κ-casein complexes in the serum phase thus yoghurt gels with
increased G’ and higher yield stress. The pH affects the distribution of these complexes between
the colloidal phase and the serum phase, with the level in the serum phase increasing with
increasing pH upon heating (Anema, 2008a).
3.6 Microbial growth dynamics during fermentation
The growth curves of ST and LB during the fermentation of both types of yoghurt, i.e.
from heat treated (85 °C, 20 min) milk and non-thermally treated milk (400 MPa, 15 min, US
15 min, 68 kHz, 300 W), are shown in Figure 33. During yoghurt fermentation, longer lag phase
for LB as compared to ST, and double exponential phase for ST have typically been reported
(Sieuwerts, 2016). However, absence of lag phase for both microorganisms and only one
exponential phase for ST have been observed in the present work for both types of yoghurt,
which could be attributed to the particular type of starter culture (direct vat set) and inoculum
sizes (ratio) of both microorganisms.
No noticeable difference in the growth dynamics (i.e. slope of the exponential phase or
maximum specific growth rate (µmax), and maximum concentration at the stationary phase of
growth (Nmax)) was observed for ST, independently of the yoghurt type. However, the growth
curve of LB in heat treated milk presented a slightly less pronounced slope at least during the
first 2 h of the exponential phase (µmax), as compared to non-thermally treated milk. However,
the maximum concentration of LB at the stationary phase of growth was similar for both types
of yoghurt. This behaviour could be attributed to a positive effect of US treatment on the growth
of LB (Abesinghe et al., 2019). On the other hand, the initial concentration of both LB and ST
was the same for both types of milk, which confirms that the applied US conditions after the
inoculation of the milk with the starter culture, did not cause cell viability loss, as compared to
the non US treated milk (Abesinghe et al., 2019).
As above mentioned, the growth curves of both microorganisms in both heat treated and
non-thermally treated milk did not present an evident lag phase, so that the presence of CO2 in
the milk seemed not to affect negatively the bacterial growth, given that ST is a facultative

55
anaerobe and LB, an aerotolerant anaerobe (Baglio, 2014) . Despite the difference in the initial
concentration of ST and LB, the growth curves of both microorganisms in the non-thermally
treated milk followed a similar pattern with regards to the slope of the exponential phase (µmax).
Undugoda and Nilmini (2019) also found a similar growth pattern for yoghurt fermented with
a LB:ST ratio of 1:2. Although the total bacterial concentration in the yoghurt after fermentation
was much above that the limits set by the Codex Standard 243-2033 (107 CFU/g), the individual
concentrations of ST (109 CFU/mL) and LB (106 CFU/mL) were lower than the values reported
in literature (Mani-López, Palou, & López-Malo, 2014) specially for LB, which again could be
attributed to the type of starter culture and inoculum size/ratio.
Figure 33: Microbial growth dynamics during the fermentation process. Streptococcus thermophilus
(ST) (●) and Lactobacillus delbrueckii subsp. bulgaricus (LB) (■) (mean ± SD, N=2-3, a=2). Yoghurt
made from traditionally heat treated (85 °C, 20 min) milk is represented in blue colour, yoghurt made
from non-thermally treated (400 MPa, 15 min, US 15 min) milk is represented in orange colour.
3.7 Storage trial
Codex Standard 243-2003, an internationally recognised standard for fermented milk
products, require that titratable acidity of yoghurt, expressed as% lactic acid is minimum 0.6%.
The standard also states that the sum of starter culture microorganisms in the yoghurt needs to
be minimum 107 CFU/g in total, and that this has “to be verified through analytical testing of
the product through to “the date of minimum durability” after the product has been stored under
the storage conditions specified in the labelling” ("Codex standard for fermented milks ", 2003).

56
Thus, the storage trial was performed over a period of 42 days at 4 °C on the yoghurt produced
from the heat treated milk (85 °C, 20 min) and the milk subjected to the selected condition of
the combination technology (400 MPa, 15 min, US 15 min). Viable plate counts for ST and LB,
titratable acidity and whey separation of the corresponding yoghurt gels were studied to see that
it fullfilled Codex Standard 243-2003 and to compare the storage stability of the yoghurt
produced with thetraditional heat treatment and combination technology.
3.7.1 Microbial stability during storage
The concentration of ST and LB was monitored during 42 days of storage at 4 °C, as
presented in Figure 34. Both ST and LB levels remained stable throughout the full storage
period, as also reporter in other studies (Bozova, Kök Taş, & Guzel-Seydim, 2018), with
concentrations of about 109 CFU/mL and 106 CFU/mL, respectively, for yoghurt made using
both traditional heating and non-thermal processing. Thus, the total concentration of LAB in
the yoghurt was well above the minimum requirement of 107 CFU/g set by the Codex
Standard 243-2003.
Figure 34: Viable plate counts of ST and LB during storage. Streptococcus thermophilus (ST )(●) and
Lactobacillus delbrueckii subsp. bulgaricus (LB) (■) (mean ± SD, N=3). Yoghurt made from
traditionally heat treated (85 °C, 20 min) milk is represented in blue colour, yoghurt made from non-
thermally treated (400 MPa, 15 min, US 15 min) milk is represented in orange colour.

57
3.7.2 Titratable acidity and pH
Lactic acid (%) in the yoghurt was determined using the titratable acidity method
described in section 2.6.8 on the assumption that lactic acid is the predominant acid in yoghurt.
The lactic acid (%) over 42 days of storage is presented in Figure 35. There were not significant
differences between the lactic acid concentration of both types of yoghurt at any day of the
storage days. The lactic acid concentration was also above the Codex Standard 243-2003
requirement of at least 0.6% lactic acid. At day 1 of storage the concentration was well above
0.7% for both types of yoghurt, and the concentration increased during storage, ending at above
0.9% at storage day 42. Our findings are consistent with findings by others with an initial lactic
acid concentration of approximately 0.7% and increasing lactic acid concentration during
storage due to post acidification (Ghasempour et al., 2019; Mani-López et al., 2014). The pH
values over 42 days of storage are presented in Figure 36. A significant decrease in pH was
observed from day 1 to day 7 of storage (p<0.0005) and from day 7 to day 42 (p<0.0005) for
both yoghurt types. Other studies also observed a decrease in pH during storage due to
postacidification. Tomovska, Gjorgievski, and Makarijoski (2016) found that the pH decreased
from 4.4 to 4.2 from day 1 to 15.
Figure 35: Lactic acid (%) during storage. Measurements of lactic acid concentration was performed
weekly over a period of 42 days, with the data from day 35 missing due to lab closure as a consequence
of covid-19 (mean ± SD, N=2-3). TRAD is the yoghurt made from traditionally treated (85 °C, 20 min)
milk, SMART is the yoghurt made from non-thermally treated (400 MPa, 15 min, US 15 min) milk.

58
Figure 36: pH during storage. pH measurements were performed weekly over a period of 42 days, with
the data from day 35 missing due to lab closure as a consequence of covid-19 (mean ± SD, n=3). TRAD
is the yoghurt made from traditionally treated (85 °C, 20 min) milk, SMART is the yoghurt made from
non-thermally treated (400 MPa, 15 min, US 15 min) milk.
3.7.3 Whey separation
Whey separation (%) was determined as described in section 2.6.9, at day 1, 7 and 42
of storage. The results are presented in Figure 37. The whey separation of traditionally produced
yoghurt increased from 2.2 ± 0.6% to 14.8 ± 1.8% during, while the whey separation of yoghurt
produced using non-thermal technologies decreased from 5.8 ± 0.4% to 2.2 ± 0.7% during
storage. Lee and Lucey (2003) found that milk heated for 30 min at 82.5 °C had a whey
separation of 1.07 ± 0.07% if incubated at 40 °C and 2.85 ± 0.24% if incubated at 45.7 °C until
pH 4.6 was reached. Our samples were incubated at 42 °C, and for yoghurt made from heat
treated milk the whey separation at day 1 agrees with their findings. Wu et al. (2000) found that
ultrasound treatment lead to better WHC due to the reduced size of fat globules, and thus
increased available area for interactions with casein of the fat globule membrane. Riener et al.
(2009) also explains an observed 2-fold increase in WHC in yoghurt (incubated at 40 °C) made
from US treated milk (24 kHz, 400 W, 45 °C, 10 min) compared to yoghurt made from heat
treated milk (90 °C, 10 min), due to protein-protein and protein-lipid interactions enhancing the
water binding within the three-dimensional network of the gel and thus increasing the WHC.
This could possibly be the reasons why the whey separation of yoghurt produced from non-
thermal technologies decrease during storage.

59
Figure 37: Whey separation during storage. Measurements were done at day 1, 7 and 42, (mean ± SD;
N=2-3). TRAD is the yoghurt made from traditionally treated (85 °C, 20 min) milk, SMART is the
yoghurt made from non-thermally treated (400 MPa, 15 min, US 15 min) milk.

60
4 Conclusions and future work
In conclusion, the use of the combination technology 400 MPa, 15 min, US 15 min for
yoghurt production showed great potential as eco-friendly alternative to conventional heat
treatment for yoghurt manufacture. 400 MPa, 15 min, US 15 min was selected as the optimal
combination based on total fermentation time and viscoelastic properties of the yoghurt gel. It
has shorter total fermentation time, similar microbial dynamic of the starter culture during
fermentation, and similar storage stability as yoghurt made from heat treated milk. The gelation
process is more unstable, less whey protein is denatured, and it gives lower yield strain and
stress compared to heat treatment, indicating that the gel is more brittle with weaker
interconnectivity within the gel network. Therefore, further experiments have to be conducted
to optimise the combination technology further, but with shorter fermentation time and being
eco-friendly it has great potential.
Possible future work includes colour and particle size distribution measurement of the milk
sample treated with the combination technology in comparison to the heat treated milk. Particle
size distribution could give insight into the homogenisation effect of US treatment and how
HPP and US treatment in combination affects the casein micelle. It would be interesting to
perform a sensory evaluation on the yoghurt gel to see how the combination technology affects
the organoleptic properties compared to the heat treatment. Different HPP pressures, HPP time
and US times could also be of interest to investigate, to see if there are other parameters to be
optimised than the ones studied in this master thesis, e.g. in order to improve the yield stress
and strain which were lower in the yoghurt gels subjected to the combination technology than
the heat treatment. Investigating the use of combination technology on raw milk would also be
interesting, to investigate the potential of the non-thermal combination technology towards
microbial and enzymatic inactivation to improve the food safety. Further, it is relevant to assess
the homogenising effect of HPP and US in combination and how the different fat content will
affect the viscoelastic properties of the resulting yoghurt gel.

61
5 References
Abesinghe, A. M. N. L., Islam, N., Vidanarachchi, J. K., Prakash, S., Silva, K. F. S. T.,
& Karim, M. A. (2019). Effects of ultrasound on the fermentation profile of
fermented milk products incorporated with lactic acid bacteria. International
Dairy Journal, 90, 1-14. doi:10.1016/j.idairyj.2018.10.006
Abid, M., Jabbar, S., Hu, B., Hashim, M. M., Wu, T., Wu, Z., . . . Zeng, X. (2014).
Synergistic impact of sonication and high hydrostatic pressure on microbial and
enzymatic inactivation of apple juice. LWT - Food Science and Technology,
59(1), 70-76. doi:10.1016/j.lwt.2014.04.039
Amaral, G. V., Silva, E. K., Cavalcanti, R. N., Cappato, L. P., Guimaraes, J. T.,
Alvarenga, V. O., . . . Cruz, A. G. (2017). Dairy processing using supercritical
carbon dioxide technology: Theoretical fundamentals, quality and safety aspects.
Trends in Food Science & Technology, 64, 94-101.
doi:10.1016/j.tifs.2017.04.004
Anema, S. G. (2008a). Effect of milk solids concentration on the gels formed by the
acidification of heated pH-adjusted skim milk. Food Chemistry, 108(1), 110-118.
doi:10.1016/j.foodchem.2007.10.051
Anema, S. G. (2008b). Effect of temperature and rate of acidification on the rheological
properties of acid skim milk gels. Journal of Food Processing and Preservation,
32(6), 1016-1033. doi:10.1111/j.1745-4549.2008.00230.x
Anema, S. G. (2008c). Heat and/or high-pressure treatment of skim milk: changes to the
casein micelle size, whey proteins and the acid gelation properties of the milk.
International Journal of Dairy Technology, 61(3), 245-252. doi:10.1111/j.1471-
0307.2008.00418.x
Anema, S. G. (2010). Effect of pH at pressure treatment on the acid gelation of skim
milk. Innovative Food Science & Emerging Technologies, 11(2), 265-273.
doi:10.1016/j.ifset.2009.11.006
Anema, S. G. (2014). The Whey Proteins in Milk: Thermal Denaturation, Physical
Interactions, and Effects on the Functional Properties of Milk. In Milk Proteins
(Second Edition ed., pp. 269-318): Elsevier Inc.
Anema, S. G., & Klostermeyer, H. (1997). Heat-Induced, pH-Dependent Dissociation
of Casein Micelles on Heating Reconstituted Skim Milk at Temperatures below
100 °C. Journal of Agricultural and Food Chemistry, 45(4), 1108-1115.
doi:10.1021/jf960507m
Anema, S. G., & McKenna, A. B. (1996). Reaction Kinetics of Thermal Denaturation
of Whey Proteins in Heated Reconstituted Whole Milk. Journal of Agricultural
and Food Chemistry, 44(2), 422-428. doi:10.1021/jf950217q
Baglio, E. (2014). Chemistry and Technology of Yoghurt Fermentation(1st ed. 2014.
ed.).
Basics of rheology. Retrieved from https://wiki.anton-paar.com/en/basics-of-
rheology/#storage-modulus-g-and-loss-modulus-g
Bozova, B., Kök Taş, T., & Guzel-Seydim, Z. B. (2018). Effects of kefir powder
fortification on yogurt quality. Tarim Bilimleri Dergisi, 24, 238-244.
doi:10.15832/ankutbd.446446

62
Calvo, M. M., Montilla, A., & Cobos, A. (1999). Lactic acid production and rheological
properties of yogurt made from milk acidified with carbon dioxide. Journal of
the Science of Food and Agriculture, 79(9), 1208-1212. doi:10.1002/(SICI)1097-
0010(19990701)79:9<1208::AID-JSFA351>3.0.CO;2-L
Ceni, G., Fernandes Silva, M., Valério Jr, C., Cansian, R. L., Oliveira, J. V., Dalla Rosa,
C., & Mazutti, M. A. (2016). Continuous inactivation of alkaline phosphatase
and Escherichia coli in milk using compressed carbon dioxide as inactivating
agent. Journal of CO2 Utilization, 13, 24-28. doi:10.1016/j.jcou.2015.11.003
Chandan, R. C., & O'Rell, K. (2013). Principles of yogurt processing. In (pp. 239-261).
Oxford: Oxford: John Wiley & Sons.
Chandrapala, J., Martin, G. J., Zisu, B., Kentish, S. E., & Ashokkumar, M. (2012). The
effect of ultrasound on casein micelle integrity. J Dairy Sci, 95(12), 6882-6890.
doi:10.3168/jds.2012-5318
Cheung, P. C. K. (1999). Temperature and pressure effects on supercritical carbon
dioxide extraction of n-3 fatty acids from red seaweed. Food Chemistry, 65(3),
399-403. doi:10.1016/S0308-8146(98)00210-6
Cho, Y., Singh, H., & Creamer, L. K. (2003). Heat-induced interactions of -
lactoglobulin A and -casein B in a model system. Journal of Dairy Research,
70(1), 61-71. doi:10.1017/S0022029902005642
Codex standard for fermented milks (2003). In CODEX STAN 243-2003 (pp. 1-10):
Codex Alimentarius International food standards.
Considine, T., Patel, H. A., Anema, S. G., Singh, H., & Creamer, L. K. (2007).
Interactions of milk proteins during heat and high hydrostatic pressure treatments
— A Review. Innovative Food Science and Emerging Technologies, 8(1), 1-23.
doi:10.1016/j.ifset.2006.08.003
Dairy. Retrieved from https://www.hiperbaric.com/en/dairy
Dalgleish, D. G. (2011). On the structural models of bovine casein micelles—review
and possible improvements. Soft Matter, 7(6), 2265-2272.
doi:10.1039/C0SM00806K
Dalgleish, D. G., & Corredig, M. (2012). The Structure of the Casein Micelle of Milk
and Its Changes During Processing. Annual Review of Food Science and
Technology, 3(1), 449-467. doi:10.1146/annurev-food-022811-101214
De Man, J. C., Rogosa, M., & Sharpe, M. E. (1960). A MEDIUM FOR THE
CULTIVATION OF LACTOBACILLI. Journal of Applied Bacteriology, 23(1),
130-135. doi:10.1111/j.1365-2672.1960.tb00188.x
Development and Manufacture of Yoghurt and Other Functional Dairy Products.
(2010). Taylor & Francis Group.
Driessen, F. M., Kingma, F., & Stadhouders, J. (1982). Evidence that Lactobacillus
bulgaricus in yogurt is stimulated by carbon dioxide produced by Streptococcus
thermophilus. Netherlands Milk and Dairy Journal, 36(2), 135-144.
Everything you ever wanted to know about HPP concepts. (2020). Retrieved from
https://blog.hiperbaric.com/en/clarification-of-hpp-concepts
Ghasempour, Z., Moghaddas Kia, E., Golbandi, S., & Ehsani, A. (2019). Effects of
mixed starters on quality attributes of probiotic yogurt using statistical design
approach. Nutrition & Food Science, 49(1), 158-169. doi:10.1108/NFS-11-2017-
0255

63
Gregersen, S. B., Wiking, L., & Hammershøj, M. (2019). Acceleration of acid gel
formation by high intensity ultrasound is linked to whey protein denaturation and
formation of functional milk fat globule-protein complexes. Journal of Food
Engineering, 254, 17-24. doi:10.1016/j.jfoodeng.2019.03.004
Harte, F., Amonte, M., Luedecke, L., Swanson, B. G., & Barbosa-Cánovas, G. V.
(2002). Yield Stress and Microstructure of Set Yogurt Made from High
Hydrostatic Pressure-Treated Full Fat Milk. Journal of Food Science, 67(6),
2245-2250. doi:10.1111/j.1365-2621.2002.tb09535.x
Hogan, E., Kelly, A. L., & Sun, D.-W. (2005). High Pressure Processing of Foods: An
Overview. In D.-W. Sun (Ed.), Emerging Technologies for Food Processing (pp.
3-32). London: Academic Press.
Holt, C. (1992). Structure and stability of bovine casein micelles. Adv Protein Chem,
43, 63-151. doi:10.1016/s0065-3233(08)60554-9
Horne, D. S. (1998). Casein Interactions: Casting Light on the Black Boxes, the
Structure in Dairy Products. International Dairy Journal, 8(3), 171-177.
doi:10.1016/S0958-6946(98)00040-5
Hotchkiss, J. H., Werner, B. G., & Lee, E. Y. C. (2006). Addition of Carbon Dioxide to
Dairy Products to Improve Quality: A Comprehensive Review. Comprehensive
Reviews in Food Science and Food Safety, 5(4), 158-168. doi:10.1111/j.1541-
4337.2006.00008.x
Huppertz, T., Fox, P. F., & Kelly, A. L. (2004). High pressure treatment of bovine milk:
effects on casein micelles and whey proteins. Journal of Dairy Research, 71(1),
97-106. doi:10.1017/S002202990300640X
Johnson, M. E., & Steele, J. L. (2007). Fermented Dairy Products. In Food
Microbiology: Fundamentals and Frontiers, Third Edition (3 ed.): American
Society of Microbiology.
Karam, M. C., Gaiani, C., Hosri, C., Burgain, J., & Scher, J. (2013). Effect of dairy
powders fortification on yogurt textural and sensorial properties: a review. J
Dairy Res, 80(4), 400-409. doi:10.1017/s0022029913000514
Kelly, A. L., Kothari, K. I., Voigt, D. D., & Huppertz, T. (2009). Improving
technological and functional properties of milk by high-pressure processing. In
M. Corredig (Ed.), Dairy-Derived Ingredients (pp. 417-441): Woodhead
Publishing.
Kim, S.-H., & Oh, S. (2013). Fermented Milk and Yogurt. In Y. W. Park & G. F. W.
Haenlein (Eds.), Milk and Dairy Products in Human Nutrition (pp. 338-356).
Kourkoutas, Y., Chorianopoulos, N., Nisiotou, A., Valdramidis, V. P., & Karatzas, K.
A. (2016). Application of Innovative Technologies for Improved Food Quality
and Safety. Biomed Res Int, 2016, 9160375. doi:10.1155/2016/9160375
Langelaan, H. C., Pereira da Silva, F., Thoden van Velzen, U., Broeze, J., Matser, A.
M., & Vollebregt, M. (2013). Technology options for feeding 10 billion people
Options for sustainable food processing. Science and Technology Options Assessment.
doi:10.2861/43440
Lee, W.-J., & Lucey, J. A. (2003). Rheological properties, whey separation, and
microstructure in set-style yoghurt: effects of heating temperature and incubation
temperature. Journal of Texture Studies, 34(5‐6), 515-536. doi:10.1111/j.1745-
4603.2003.tb01079.x

64
Leistner, L. (2000). Basic aspects of food preservation by hurdle technology. Int J Food
Microbiol, 55(1-3), 181-186. doi:10.1016/s0168-1605(00)00161-6
López-Fandiño, R. (2006). High pressure-induced changes in milk proteins and possible
applications in dairy technology. International Dairy Journal, 16(10), 1119-
1131. doi:10.1016/j.idairyj.2005.11.007
Louaileche, H., Bracquart, P., Saulnier, F., Desmazeaud, M., & Linden, G. (1993).
Carbon Dioxide Effects on the Growth and Metabolites of Morphological
Variants of Streptococcus thermophilus. Journal of Dairy Science, 76(12), 3683-
3689. doi:10.3168/jds.s0022-0302(93)77710-3
Lucey, J. A. (2001). The relationship between rheological parameters and whey
separation in milk gels. Food Hydrocolloids, 15(4), 603-608.
doi:10.1016/S0268-005X(01)00043-1
Lucey, J. A. (2004). Cultured dairy products: an overview of their gelation and texture
properties. International Journal of Dairy Technology, 57(2‐3), 77-84.
doi:10.1111/j.1471-0307.2004.00142.x
Lucey, J. A. (2014). Milk Protein Gels. In Milk Proteins (Second Edition ed., pp. 493-
523): Elsevier Inc.
Lucey, J. A. (2017). Formation, Structural Properties, and Rheology of Acid-Coagulated
Milk Gels. In P. L. H. McSweeney, P. F. Fox, P. D. Cotter, & D. W. Everett
(Eds.), Cheese: Chemistry, Physics and Microbiology (pp. 179-197). San Diego:
Academic Press.
Lucey, J. A., Munro, P. A., & Singh, H. (1998). Whey separation in acid skim milk gels
made with glucono-δ-lactone: effects of heat treatment and gelation temperature.
Journal of Texture Studies, 29(4), 413-426. doi:10.1111/j.1745-
4603.1998.tb00813.x
Mani-López, E., Palou, E., & López-Malo, A. (2014). Probiotic viability and storage
stability of yogurts and fermented milks prepared with several mixtures of lactic
acid bacteria. Journal of Dairy Science, 97(5), 2578-2590. doi:10.3168/jds.2013-
7551
Marchesini, G., Balzan, S., Montemurro, F., Fasolato, L., Andrighetto, I., Segato, S., &
Novelli, E. (2012). Effect of ultrasound alone or ultrasound coupled with CO2
on the chemical composition, cheese-making properties and sensory traits of raw
milk. Innovative Food Science & Emerging Technologies, 16, 391-397.
doi:10.1016/j.ifset.2012.09.003
Marchesini, G., Fasolato, L., Novelli, E., Balzan, S., Contiero, B., Montemurro, F., . . .
Segato, S. (2015). Ultrasonic inactivation of microorganisms: A compromise
between lethal capacity and sensory quality of milk. Innovative Food Science &
Emerging Technologies, 29, 215-221. doi:10.1016/j.ifset.2015.03.015
Marle, M. E., & Zoon, P. (1995). Permeability and rheological properties of microbially
and chemically acidified skim-milk gels. Netherlands Milk and Dairy Journal,
49(1), 47-65.
Martin, J. D. (2002). Effects of carbon dioxide on common raw milk bacteria using
predictive modeling measured by conductivity. (MS thesis). Cornell University,
McKinley, M. C. (2005). The nutrition and health benefits of yoghurt. International
Journal of Dairy Technology, 58(1), 1-12. doi:10.1111/j.1471-
0307.2005.00180.x

65
McSweeney, P. L. H., & Fox, P. F. (2013). Advanced Dairy Chemistry : Volume 1A:
Proteins: Basic Aspects, 4th Edition(4th ed. ed.).
McSweeney, P. L. H., & O'Mahony, J. A. (2016). Advanced Dairy Chemistry: Volume
1B: Proteins: Applied Aspects (4th ed. 2016 ed.). New York, NY: New York,
NY: Springer New York.
Medeiros, A., Souza, D., & Hoskin, R. (2015). Effect of incubation temperature, heat
treatment and milk source on the yoghurt kinetic acidification. International
Food Research Journal, 22, 1030-1036.
Mende, S., Rohm, H., & Jaros, D. (2016). Influence of exopolysaccharides on the
structure, texture, stability and sensory properties of yoghurt and related
products. International Dairy Journal, 52, 57-71.
doi:10.1016/j.idairyj.2015.08.002
Muggeo, V. (2008). Segmented: An R Package to Fit Regression Models With Broken-
Line Relationships. R News, 8, 20-25.
Naturell yoghurt. Retrieved from
https://www.melk.no/Meierileksikon/Meieriprodukter/Yoghurt2/Naturell-
yoghurt
Needs, E. C., Capellas, M., Bland, A. P., Manoj, P., Macdougal, D., & Paul, G. (2000).
Comparison of heat and pressure treatments of skim milk, fortified with whey
protein concentrate, for set yogurt preparation: effects on milk proteins and gel
structure. Journal of Dairy Research, 67(3), 329-348.
doi:10.1017/S0022029900004301
Nguyen, N. H. A., & Anema, S. G. (2010). Effect of ultrasonication on the properties of
skim milk used in the formation of acid gels. Innovative Food Science &
Emerging Technologies, 11(4), 616-622. doi:10.1016/j.ifset.2010.05.006
Nguyen, N. H. A., & Anema, S. G. (2017). Ultrasonication of reconstituted whole milk
and its effect on acid gelation. Food Chemistry, 217, 593-601.
doi:10.1016/j.foodchem.2016.08.117
Ni, H., Song, W., Wang, R., & Shen, Z. (2016). Coupling model for carbon dioxide
wellbore flow and heat transfer in coiled tubing drilling. Journal of Natural Gas
Science and Engineering, 30, 414-420. doi:10.1016/j.jngse.2016.02.050
Ojha, K. S., Mason, T. J., O’donnell, C. P., Kerry, J. P., & Tiwari, B. K. (2017).
Ultrasound technology for food fermentation applications. Ultrasonics -
Sonochemistry, 34, 410-417. doi:10.1016/j.ultsonch.2016.06.001
Ojha, K. S., O’donnell, C. P., Kerry, J. P., & Tiwari, B. K. (2016). Ultrasound and Food
Fermentation. In K. S. Ojha & B. K. Tiwari (Eds.), Novel Food Fermentation
Technologies (1st ed. 2016. ed.). Cham: Springer International Publishing.
Olsen, K., & Orlien, V. (2016). High-Pressure Processing for Modification of Food
Biopolymers. In Innovative Food Processing Technologies (pp. 291-313):
Elsevier Ltd.
Ozcan, T., Horne, D. S., & Lucey, J. A. (2015). Yogurt made from milk heated at
different pH values. Journal of Dairy Science, 98(10), 6749-6758.
doi:10.3168/jds.2015-9643
Pardo, G., & Zufía, J. (2012). Life cycle assessment of food-preservation technologies.
Journal of Cleaner Production, 28, 198-207. doi:10.1016/j.jclepro.2011.10.016

66
Pedersen, O., Colmer, T. D., & Sand-Jensen, K. (2013). Underwater Photosynthesis of
Submerged Plants – Recent Advances and Methods. Frontiers in Plant Science,
4. doi:10.3389/fpls.2013.00140
Peng, Y., Horne, D. S., & Lucey, J. A. (2009). Impact of preacidification of milk and
fermentation time on the properties of yogurt. Journal of Dairy Science, 92(7),
2977-2990. doi:10.3168/jds.2008-1221
Riener, J., Noci, F., Cronin, D. A., Morgan, D. J., & Lyng, J. G. (2009). The effect of
thermosonication of milk on selected physicochemical and microstructural
properties of yoghurt gels during fermentation. Food Chemistry, 114(3), 905-
911. doi:10.1016/j.foodchem.2008.10.037
Rotabakk, B. T., Lekang, O. I., & Sivertsvik, M. (2007). Volumetric method to
determine carbon dioxide solubility and absorption rate in foods packaged in
flexible or semi rigid package. Journal of Food Engineering, 82(1), 43-50.
doi:10.1016/j.jfoodeng.2007.01.013
Sfakianakis, P., & Tzia, C. (2014). Conventional and Innovative Processing of Milk for
Yogurt Manufacture; Development of Texture and Flavor: A Review. Foods,
3(1), 176-193. doi:10.3390/foods3010176
Shanmugam, A., Chandrapala, J., & Ashokkumar, M. (2012). The effect of ultrasound
on the physical and functional properties of skim milk. Innovative Food Science
& Emerging Technologies, 16, 251-258. doi:10.1016/j.ifset.2012.06.005
Sieuwerts, S. (2016). Microbial Interactions in the Yoghurt Consortium: Current Status
and Product Implications. SOJ Microbiology & Infectious Diseases, 4(2), 01-05.
doi:10.15226/sojmid/4/2/00150
Singh, S., & Shalini, R. (2016). Effect of Hurdle Technology in Food Preservation: A
Review. Crit Rev Food Sci Nutr, 56(4), 641-649.
doi:10.1080/10408398.2012.761594
Supeno, & Kruus, P. (2000). Sonochemical formation of nitrate and nitrite in water.
Ultrasonics Sonochemistry, 7(3), 109-113. doi:10.1016/S1350-4177(99)00043-7
Tetra Pak Dairy processing handbook. (2015). Retrieved from
https://dairyprocessinghandbook.tetrapak.com/
Tomovska, J., Gjorgievski, N., & Makarijoski, B. (2016). Examination of pH, Titratable
Acidity and Antioxidant Activity in Fermented Milk. Journal of Materials
Science and Engineering A, 6, 326-333. doi:10.17265/2161-6213/2016.11-
12.006
Tsevdou, M. S., Eleftheriou, E. G., & Taoukis, P. S. (2013). Transglutaminase treatment
of thermally and high pressure processed milk: Effects on the properties and
storage stability of set yoghurt. Innovative Food Science & Emerging
Technologies, 17, 144-152. doi:10.1016/j.ifset.2012.11.004
Undugoda, L. J. S., & Nilmini, A. H. L. (2019). Effect of lactic acid microbial ratio of
yoghurt starter culture in yoghurt fermentation and reduction of post
acidification. Journal of Food & Industrial Microbiology, 5(1).
Upadhyay, N., Goyal, A., Kumar, A., Ghai, D. L., & Singh, R. (2014). Preservation of
Milk and Milk Products for Analytical Purposes. Food Reviews International,
30(3), 203-224. doi:10.1080/87559129.2014.913292
Utviklingen i norsk kosthold. (2018). Retrieved from helsedirektoratet.no:
https://www.helsedirektoratet.no/rapporter/utviklingen-i-norsk-
67
kosthold/Utviklingen%20i%20norsk%20kosthold%202018%20%E2%80%93%
20Kortversjon.pdf/_/attachment/inline/1da1278e-71d5-4308-8bad-
171412b9cf8a:3a5db55f8a49be688ba9259e29d62ce857df188c/Utviklingen%20
i%20norsk%20kosthold%202018%20%E2%80%93%20Kortversjon.pdf
Vercet, A., Oria, R., Marquina, P., Crelier, S., & Lopez-Buesa, P. (2002). Rheological
Properties of Yoghurt Made with Milk Submitted to Manothermosonication.
Journal of Agricultural and Food Chemistry, 50(21), 6165-6171.
doi:10.1021/jf0204654
Vinderola, C. G., Gueimonde, M., Delgado, T., Reinheimer, J. A., & Reyes-Gavilán, C.
G. d. L. (2000). Characteristics of carbonated fermented milk and survival of
probiotic bacteria. International Dairy Journal, 10(3), 213-220.
doi:10.1016/S0958-6946(00)00031-5
Walstra, P. (1999). Casein sub-micelles : do they exist? International Dairy Journal, 10,
189-192. doi:10.1016/S0958-6946(99)00059-X
Walstra, P., Wouters, J. T. M., & Geurts, T. J. (2006). Dairy Science and
Technology(2nd ed.).
Wimalaratne, S., & Farid, M. (2008). Pressure assisted thermal sterilization. Food and
Bioproducts Processing - FOOD BIOPROD PROCESS, 86, 312-316.
doi:10.1016/j.fbp.2007.08.001
The World Yoghurt Market Report 2000-2025. (2016). In P. f. d. consulting (Ed.).
Wu, H., Hulbert, G. J., & Mount, J. R. (2000). Effects of ultrasound on milk
homogenization and fermentation with yogurt starter. Innovative Food Science
and Emerging Technologies, 1(3), 211-218. doi:10.1016/S1466-8564(00)00020-
5
Zhang, Z.-H., Wang, L.-H., Zeng, X.-A., Han, Z., & Brennan, C. S. (2019). Non-thermal
technologies and its current and future application in the food industry: a review.
International Journal of Food Science & Technology, 54(1), 1-13.
doi:10.1111/ijfs.13903

68
6 Appendix
6.1 pH vs process time
The pH at the start of fermentation was plotted against the processing time used with
non-thermal processing technologies (Figure 38). Processing time was the time from the milk
treatment started until the milk samples was placed in the incubator. Milk processing using non-
thermal processing technologies had different length due to different holding time in HPP and
US (5 or 15 min). This plot shows that the pH at the start of the fermentation is not influenced
by the length of the milk processing.
Figure 38: pH at fermentation start vs process time (h) for non-thermal processing of milk.

69
6.2 pH vs texture analysis
Since the texture analysation were performed on set style yoghurt, nothing could be inserted
into the gel prior to analysation as this could affect the gel structure. Therefore, an assumption
that the fermentation process was equal in each cup, was made so that the pH could be measured
in other containers than the ones used for texture analysation. Unfortunately, a variation in the
final pH of the different cups were observed, see Figure 39, which affected the result of the
texture analysis. Due to this, the pH of each cup was measured after performing the texture
analysis, and if the pH was ≥ 4.7, the result was discarded. The texture analysis was performed
on three different cups each time and repeated on at least twice. Due to the great variability in
pH and having to discard results with pH ≥ 4.7, this did unfortunately not give us 6 parallels.
But the texture analysis was repeated so that at least three samples were obtained with a desired
pH value. A possible explanation to the variability in pH is use of an alive starter culture. Each
microorganism is independent and over a time period of up to five hours, which is the case for
the fermentation process, there could be differences in their growth and acid production. If each
cup does not contain the exact same number of bacteria this could also lead to a difference in
acid production and decrease in pH.
Figure 39: Results from penetration and stress-relaxation test vs. pH after one day storage.

70
6.3 Gelation process
The G’ during the gelation process of heat treated milk (Figure 40), milk treated with 400
MPa, 5 or 15 min, US 5 or 15 min (Figure 41) and milk treated with 600 MPa, 5 or 15 min, US
5 or 15 min (Figure 42) is shown below.
Figure 40: G’ (Pa) during the gelation process of yoghurt produced using traditional heat treatment
(85 °C, 20 min).
Figure 41: G’ (Pa) during the gelation process of yoghurt produced using combination technology (400
MPa, 5 and 15 min, US 5 and 15 min).

71
Figure 42: G’ (Pa) during the gelation process of yoghurt produced using combination technology
(600 MPa, 5 and 15 min, US 5 and 15 min).

72
6.4 Preliminary trials
The process for production of yoghurt using CO2, HPP and US had to be established as
this master thesis was the first time doing so. Preliminary trials were therefore performed to
find the optimal process conditions.
Packing the milk with CO2 was tested in different ways. One method tested was flushing
CO2 gas into the sous-vide pouch containing the milk simultaneous with vacuum packing.
However, this led to great variability in the gas volume in the head space of the pouch (379 ±
45 mL). Some pouches (not included in the gas volume measurement) collapsed during packing
with CO2, thus barely containing any CO2, while others were packed with so much CO2 that
they did not fit in the HPP chamber. Therefore, it was concluded that packing with CO2 gas was
too unreliable and decided to test packing the milk with dry ice. Although dry ice started to
evaporate once it came in contact with the milk during vacuum packaging, this method was
more reliable than packing with CO2. The pouch did not collapse during packing and was never
too big for the HPP chamber either.
After HPP, the temperature of the milk varied depending on the pressure and holding time
due to adiabatic pressure release as explained in Section 3.1.2. Test had to be performed to find
the optimal US bath temperature depending on the temperature of the milk after HPP treatment
and the length of the US treatment (5 or 15 min), see Table 4.
Table 4: Optimal temperature of the US bath for each HPP and US treatment
HPP treatment Temperature (°C) of milk
after HPP treatment
US time Temperature
(°C) of US bath
400 MPa, 5 min 17.9 5 min 46
400 MPa, 5 min 17.9 15 min 43.5
400 MPa, 15 min 15.2 5 min 46.5
400 MPa, 15 min 15.2 15 min 43.5
600 MPa, 5 min 15.3 5 min 46.5
600 MPa, 5 min 15.3 15 min 43.5
600 MPa, 15 min 11.4 5 min 46.5
600 MPa, 15 min 11.4 15 min 43.5
A small experiment was also performed with heat treatment followed by US treatment
(5 min) before and after inoculation to see if US treatment prior to inoculation proved more

73
beneficial for shorter fermentation time than our experiment setup with US treatment after
inoculation. However, the fermentation time of heat treated milk followed by US treatment
before inoculation had 30 minute longer fermentation time than heat treated milk followed by
US treatment after inoculation, and it was decided not to do more experiments with this and to
stick with inoculation followed by US treatment.
The milk was 42 °C after US treatment and had to be kept at this temperature until
placed in the incubator at 42 °C, to ensure optimal growth conditions for the starter culture. The
US bath was in a different lab than the incubator, thus meaning that the temperature of the milk
would drop in the time it took to move from one lab to another. The solution to this problem
was to use a water bath set at 43 °C on a trolley, and to have the samples in a home-made rack
inside the water bath.
Different fermentation temperatures (40 and 42 °C), different containers to incubate the
milk in, and open or closed incubation was tested. The different containers tested was stand-up
pouches, glass jars, 50 mL Eppendorf tubes and plastic cups. The stand-up pouch and 50 mL
Eppendorf tube was not suitable for texture analysis, due to the plastic pouch moving during
the texture analysis and the Eppendorf tube having too small diameter too avoid wall-interaction
effects. The glass jars were recyclable, and it was too much work cleaning and sterilising them
between each experiment. The plastic cups were found to be the most suitable as they were
sterile and had large enough diameter to avoid wall-interaction effects. Closed incubation gave
yellow bubbles inside the yoghurt gel, probably due to CO2, and it was therefor decided to have
open incubation (with alu foil loosely over the top to minimise evaporation).
Testing was done to find the best way to measure pH during the fermentation process.
Manual pH measurements, where a sample was taken from the incubator every hour during
fermentation and mixed well with a disposal pipet before measurement, was found to be the
best alternative, to minimise possible pH gradients along the z axis (sample depth), attributed
to varying oxygen availability and thus, bacterial predominance and microbial metabolism.
With continuous pH measurement inside the incubator the measurement was in the same sample
throughout the fermentation without any mixing. Different pH probes were also tested, with a
probe that adjusted the temperature automatically being found to be the best option.

NTN
UN
orw
egia
n U
nive
rsity
of S
cien
ce a
nd T
echn
olog
yFa
culty
of N
atur
al S
cien
ces
Dep
artm
ent o
f Bio
tech
nolo
gy a
nd F
ood
Scie
nce
Mas
ter’s
thes
is
Mari Varhaug
“Smart Yoghurt” – Combining innovativetechnologies towards more efficientyoghurt manufacturing
The potential of non-thermal combinationtechnology with CO2, high-pressure processing andultrasound to improve the efficiency andsustainability of yoghurt manufacturing whilemaintaining product quality and storage stability ofyoghurt produced with heat treatment
Master’s thesis in Biotechnology
Supervisor: Kari Helgetun Langfoss