SMAP validation experiment 2015 (SMAPVEX15)
12
Validation and scaling of soil moisture in a semi-arid environment: SMAP validation experiment 2015 (SMAPVEX15) Andreas Colliander a, ⁎, Michael H. Cosh b , Sidharth Misra a , Thomas J. Jackson b , Wade T. Crow b , Steven Chan a , Rajat Bindlish c , Chunsik Chae a , Chandra Holifield Collins d , Simon H. Yueh a a Jet Propulsion Laboratory, California Institute of Technology, Pasadena, CA, USA b USDA Agricultural Research Service, Hydrology and Remote Sensing Lab, Beltsville, MD, USA c NASA Goddard Space Flight Center, Greenbelt, MD, USA d USDA Agricultural Research Service, Southwest Watershed Research Center, Tucson, AZ, USA abstract article info Article history: Received 9 November 2016 Received in revised form 8 April 2017 Accepted 23 April 2017 Available online xxxx The NASA SMAP (Soil Moisture Active Passive) mission conducted the SMAP Validation Experiment 2015 (SMAPVEX15) in order to support the calibration and validation activities of SMAP soil moisture data products. The main goals of the experiment were to address issues regarding the spatial disaggregation methodologies for improvement of soil moisture products and validation of the in situ measurement upscaling techniques. To support these objectives high-resolution soil moisture maps were acquired with the airborne PALS (Passive Ac- tive L-band Sensor) instrument over an area in southeast Arizona that includes the Walnut Gulch Experimental Watershed (WGEW), and intensive ground sampling was carried out to augment the permanent in situ instru- mentation. The objective of the paper was to establish the correspondence and relationship between the highly heterogeneous spatial distribution of soil moisture on the ground and the coarse resolution radiometer-based soil moisture retrievals of SMAP. The high-resolution mapping conducted with PALS provided the required connec- tion between the in situ measurements and SMAP retrievals. The in situ measurements were used to validate the PALS soil moisture acquired at 1-km resolution. Based on the information from a dense network of rain gauges in the study area, the in situ soil moisture measurements did not capture all the precipitation events accurately. That is, the PALS and SMAP soil moisture estimates responded to precipitation events detected by rain gauges, which were in some cases not detected by the in situ soil moisture sensors. It was also concluded that the spatial distri- bution of the soil moisture resulted from the relatively small spatial extents of the typical convective storms in this region was not completely captured with the in situ stations. After removing those cases (approximately 10% of the observations) the following metrics were obtained: RMSD (root mean square difference) of 0.016 m 3 /m 3 and correlation of 0.83. The PALS soil moisture was also compared to SMAP and in situ soil moisture at the 36-km scale, which is the SMAP grid size for the standard product. PALS and SMAP soil moistures were found to be very similar owing to the close match of the brightness temperature measurements and the use of a common soil moisture retrieval algorithm. Spatial heterogeneity, which was identified using the high-resolu- tion PALS soil moisture and the intensive ground sampling, also contributed to differences between the soil mois- ture estimates. In general, discrepancies found between the L-band soil moisture estimates and the 5-cm depth in situ measurements require methodologies to mitigate the impact on their interpretations in soil moisture valida- tion and algorithm development. Specifically, the metrics computed for the SMAP radiometer-based soil mois- ture product over WGEW will include errors resulting from rainfall, particularly during the monsoon season when the spatial distribution of soil moisture is especially heterogeneous. © 2017 Elsevier Inc. All rights reserved. Keywords: SMAPVEX15 PALS SMAP Soil moisture 1. Introduction The SMAP post-launch Calibration/Validation (Cal/Val) plan is intended to assess the quality of the mission products and to support analyses that lead to their improvement. A suite of complementary methodologies employed together will result in a robust global assess- ment (Jackson et al., 2013). These methodologies include the utilization of core validation sites (Colliander et al., 2017), sparse networks (Chen et al., 2017), other satellite data products (Burgin et al., 2017), model- based data products (Pan et al., 2016), and field campaigns. Field cam- paigns, in particular those using aircraft-based higher-resolution satel- lite sensor simulators, play an important role in satellite product Cal/ Val by providing detailed ground truth; however, they are limited in Remote Sensing of Environment 196 (2017) 101–112 ⁎ Corresponding author. E-mail address: [email protected] (A. Colliander). http://dx.doi.org/10.1016/j.rse.2017.04.022 0034-4257/© 2017 Elsevier Inc. All rights reserved. Contents lists available at ScienceDirect Remote Sensing of Environment journal homepage: www.elsevier.com/locate/rse
-
Upload
khangminh22 -
Category
Documents
-
view
0 -
download
0
Transcript of SMAP validation experiment 2015 (SMAPVEX15)

Remote Sensing of Environment 196 (2017) 101–112
Contents lists available at ScienceDirect
Remote Sensing of Environment
j ourna l homepage: www.e lsev ie r .com/ locate / rse
Validation and scaling of soil moisture in a semi-arid environment: SMAPvalidation experiment 2015 (SMAPVEX15)
Andreas Colliander a,⁎, Michael H. Cosh b, Sidharth Misra a, Thomas J. Jackson b, Wade T. Crow b, Steven Chan a,Rajat Bindlish c, Chunsik Chae a, Chandra Holifield Collins d, Simon H. Yueh a
a Jet Propulsion Laboratory, California Institute of Technology, Pasadena, CA, USAb USDA Agricultural Research Service, Hydrology and Remote Sensing Lab, Beltsville, MD, USAc NASA Goddard Space Flight Center, Greenbelt, MD, USAd USDA Agricultural Research Service, Southwest Watershed Research Center, Tucson, AZ, USA
⁎ Corresponding author.E-mail address: [email protected] (A. Co
http://dx.doi.org/10.1016/j.rse.2017.04.0220034-4257/© 2017 Elsevier Inc. All rights reserved.
a b s t r a c t
a r t i c l e i n f oArticle history:Received 9 November 2016Received in revised form 8 April 2017Accepted 23 April 2017Available online xxxx
The NASA SMAP (Soil Moisture Active Passive) mission conducted the SMAP Validation Experiment 2015(SMAPVEX15) in order to support the calibration and validation activities of SMAP soil moisture data products.The main goals of the experiment were to address issues regarding the spatial disaggregation methodologiesfor improvement of soil moisture products and validation of the in situ measurement upscaling techniques. Tosupport these objectives high-resolution soil moisture maps were acquired with the airborne PALS (Passive Ac-tive L-band Sensor) instrument over an area in southeast Arizona that includes the Walnut Gulch ExperimentalWatershed (WGEW), and intensive ground sampling was carried out to augment the permanent in situ instru-mentation. The objective of the paper was to establish the correspondence and relationship between the highlyheterogeneous spatial distribution of soilmoisture on the ground and the coarse resolution radiometer-based soilmoisture retrievals of SMAP. The high-resolution mapping conducted with PALS provided the required connec-tion between the in situmeasurements and SMAP retrievals. The in situmeasurements were used to validate thePALS soil moisture acquired at 1-km resolution. Based on the information from a dense network of rain gauges inthe study area, the in situ soilmoisturemeasurements did not capture all the precipitation events accurately. Thatis, the PALS and SMAP soil moisture estimates responded to precipitation events detected by rain gauges, whichwere in some cases not detected by the in situ soil moisture sensors. It was also concluded that the spatial distri-bution of the soil moisture resulted from the relatively small spatial extents of the typical convective storms inthis region was not completely captured with the in situ stations. After removing those cases (approximately10% of the observations) the following metrics were obtained: RMSD (root mean square difference) of0.016m3/m3 and correlation of 0.83. The PALS soil moisturewas also compared to SMAP and in situ soil moistureat the 36-km scale, which is the SMAP grid size for the standard product. PALS and SMAP soil moistures werefound to be very similar owing to the close match of the brightness temperature measurements and the use ofa common soil moisture retrieval algorithm. Spatial heterogeneity, which was identified using the high-resolu-tion PALS soilmoisture and the intensive ground sampling, also contributed to differences between the soilmois-ture estimates. In general, discrepancies found between the L-band soilmoisture estimates and the 5-cmdepth insitumeasurements requiremethodologies tomitigate the impact on their interpretations in soil moisture valida-tion and algorithm development. Specifically, the metrics computed for the SMAP radiometer-based soil mois-ture product over WGEW will include errors resulting from rainfall, particularly during the monsoon seasonwhen the spatial distribution of soil moisture is especially heterogeneous.
© 2017 Elsevier Inc. All rights reserved.
Keywords:SMAPVEX15PALSSMAPSoil moisture
1. Introduction
The SMAP post-launch Calibration/Validation (Cal/Val) plan isintended to assess the quality of the mission products and to supportanalyses that lead to their improvement. A suite of complementary
lliander).
methodologies employed together will result in a robust global assess-ment (Jackson et al., 2013). Thesemethodologies include the utilizationof core validation sites (Colliander et al., 2017), sparse networks (Chenet al., 2017), other satellite data products (Burgin et al., 2017), model-based data products (Pan et al., 2016), and field campaigns. Field cam-paigns, in particular those using aircraft-based higher-resolution satel-lite sensor simulators, play an important role in satellite product Cal/Val by providing detailed ground truth; however, they are limited in

102 A. Colliander et al. / Remote Sensing of Environment 196 (2017) 101–112
their spatial extent and duration by logistics and costs. Specific SMAPscience activities that can be addressed using an aircraft-basedcampaign include: validating spatial disaggregation of satellite soilmoisture or brightness temperatures, investigating and resolvinganomalous observations and products (such as large deviations fromin situ estimated soil moistures), defining site specific upscaling, under-standing the effects and contribution of heterogeneity on coarserresolution retrievals, and providing correlative analysis of L1 dataproduct calibration.
SMAPVEX15was the first SMAP post-launch field campaign andwasdesigned to address the issues noted above. Post-launch field experi-ments were also carried out in Australia (Ye et al., 2016) in 2015. TheSMAP post-launch field campaigns follow a series of pre-launch fieldcampaigns carried out in USA, Canada and Australia (Colliander et al.,2012; Panciera et al., 2014; Magagi et al., 2013; McNairn et al., 2015).The timing and location of the SMAPVEX15 campaign was based onthe needs to capture a range of soilmoisture conditions in a short periodof time and to observe well-defined and highly heterogeneous soilmoisture spatial patterns that would provide a clear validation of disag-gregation approaches. This led to the selection of a core validation site insoutheast Arizona during the summer monsoon season. The campaignwas conducted between August 1 and 18, 2015. This was shortly afterthe loss of the SMAP radar; therefore, the campaign objectives shiftedfrom the validation of the SMAP disaggregation techniques and theother goals were reprioritized. However, the data set will be of valuefor the validation of future disaggregation approaches.
This paper focuses on the investigation of the sub-pixel soil moistureheterogeneity as measured with the PALS (Passive Active L-band Sys-tem) airborne radiometer as it scales to the SMAPdata products. The ob-jective of the paper is to establish the correspondence and relationshipbetween the highly heterogeneous spatial distribution of soil moistureon the ground and the coarse resolution radiometer-based soil moistureretrievals of SMAP. The high-resolution mapping conducted with PALSprovided the required connection between the in situ measurementsand SMAP retrievals. SMAPVEX15 was the first major campaign to uti-lize the conical scanning mode of the PALS instrument installed on aDC-3 aircraft (Misra et al., 2017). Data collected with PALS radar areavailable as well, but because of the failure of the SMAP radar thisstudy is solely focused on the radiometer data. The data collected by
Fig. 1. SMAPVEX15 campaign domain and the PALS flight lines (black). The underlying
PALS onmultiple days were used to produce high-resolution brightnesstemperature data sets. The PALS radiometer observations were thentranslated into high-resolution soil moisture retrievals that were vali-dated using ground-based observations. The PALS brightness tempera-ture and validated soil moisture were aggregated to the spatialresolution of the SMAP L2 radiometer-based soil moisture product(36 km). These soil moisture estimates were compared to each otherand to up-scaled in situ soil moistures. The comparison of the in situsoil moistures at 5-cm depth and the radiometer-based soil moisture,which is sensitive to moisture starting from the top surface, also givesa perspective on the vertical distribution of soil moisture in additionto the horizontal distribution captured by the PALS measurements.The study focuses on the area of the WGEW validation pixel, which isused for SMAP data product validation (Keefer et al., 2008; Collianderet al., 2017).
2. Site description
The SMAPVEX15 campaign took place in southeastern Arizona,encompassing several experimental sites and ranges operated by theUnited States Department of Agriculture (USDA) Agricultural ResearchService (ARS) Southwest Watershed Research Center in Tucson, AZ,and the University of Arizona. Fig. 1 shows the domain along with thespecific watersheds and experimental ranges included in the study.The Walnut Gulch Experimental Watershed (Moran et al., 2008), locat-ed in the eastern portion of the domain has been the location of numer-ous soil moisture field experiments in the past, includingMONSOON ‘90(Kustas et al., 1994) and SMEX04 (Soil Moisture Experiment in 2004)(Bindlish et al., 2008). It is a semi-arid region with an annual averageprecipitation of 312 mm, approximately 60% of it coming during thesummer monsoon season, July to September (Goodrich et al., 2008).The majority of this monsoon rainfall occurs within highly localizedconvective storms – leading to large amounts of spatial variability inrainfall accumulations. During August of 2015, the average air tempera-ture was 25 °C and the average relative humidity was 53%. The SantaRita Experimental Range (SRER) in thewestern portion of the study do-main is a more traditional desert landscape dominated by cactus andlarge shrubs. In the center of the SMAPVEX15 domain is a grassland
image is a false color image of Landsat 8 from 8/3/15 (West) and 8/12/15 (East).

103A. Colliander et al. / Remote Sensing of Environment 196 (2017) 101–112
area called Empire Ranch. This is an active cattle ranch (administratedby the U.S. Bureau of Land Management) with rolling topography.
3. In situ data collection and processing
There were three primary methods of soil moisture data collec-tion during the SMAPVEX15 field campaign: the permanent in situnetwork, a temporary in situ network, and concurrent manual phys-ical sampling. The WGEW has a long-term permanent soil moistureand soil temperature network that is collocated with a more denselyinstrumented precipitation gauge network. There are 19 soil mois-ture stations within the WGEW. Throughout the entire SMAPVEX15study domain, USDA ARS operates a total of 52 soil moisture stations.These stations record precipitation and soil moisture and soil tem-perature every 20 min at a depth of 5 cm with a Stevens WaterHydra Probe (mention of this commercial product does not consti-tute an endorsement), installed horizontally. This provides an inte-grated estimate for soil moisture from approximately 3 to 7 cm andis commonly used as an estimate of the surface layer soil moisture.Precipitation gauges are a weighing type designed especially forthe high intensity rainfall that is received during the monsoon sea-son. From July to October of 2015, a temporary in situ network of66 soil moisture and soil temperature stations was deployed in theregion. This network consisted of a single soil moisture probeinstalled at 5-cm depth horizontally, which is identical to the perma-nent network configuration. The final element of the ground-basedsoil moisture data collection was concurrent physical sampling, con-ducted by field sampling teams during the intensive observation pe-riod (IOP) from August 1 to 18. Seven teams of two samplers, visiteda total of 80 network sites on every aircraft flight day and collecteddielectric-based probe measurements of soil moisture. To do this,the probe was inserted vertically into the top of the soil at three loca-tions, randomly selected near each network site. In addition, a gravi-metric sample of the soil was collected and combined with sitespecific bulk density estimates to produce site specific calibrationequations. The samples were collected at locations around the per-manent and temporary stations, within several meters, but not with-in 1 m, so as not to interfere with the installation. When combinedwith a bulk density estimate for each domain (and data availablefrom the SMEX04 dataset), this produced a concurrent soil moistureestimate for the seven days of flights. An overall RMSE of 0.02 m3/m3
volumetric soil moisture was achieved following the protocolsestablished in Cosh et al. (2005) and Rowlandson et al. (2013). Thisdata serves as the ground truth for both the temporary network op-erations and scaling efforts.
Rain radar coverage from the Tucson NEXRAD station is availablewithin the center part of the of SMAPVEX15 domain. However, topo-graphic beam blockage is significant along the western and easternedges of the domain (particularly to the east of the Whetstone moun-tain range in the vicinity of Tombstone). Such blockage severely limitsthe ability of the Tucson NEXRAD to characterize rainfall accumulations.These gaps are partially compensated for by a large permanent raingauge networkwithin both the SRER andWGEWsites (due to extensiveground monitoring activities conducted by BLM and USDA ARS, respec-tively). However, significant gaps still exist in the outlying areassurrounding both sites. In order to (partially) fill these gaps, 18 tippingbucket rain gauges (Texas Electronics Model TE525-USW) weredeployed during the last two weeks of July 2015 around the SRERandWGEW sites. During August 2015, these gaugeswere serviced peri-odically for data retrieval, cleaning of screens and tipping buckets,spot calibration and re-leveling. All gauges were removed in earlySeptember 2015.
The cumulative error of the network is calculated by accounting forthe uncertainty in both the sensor calibration and the error inrepresenting the spatial distribution of soil moisture. For the former,the upper limit of the sensor calibration for the permanent and
temporary stations is used (σsensor =0.03m3/m3 based onmanufactur-er; not to be confused with the manual probe calibration mentionedabove) and for the latter the analysis presented in Famiglietti et al.(2008) is applied. The error is computed as the squared sum of thesetwo components:
ϵ ¼ffiffiffiffiffiffiffiffiffiffiffiffiffiffiffiffiffiffiffiffiffiffiffiffiffiffiffiffiffiffiffiffiffiffiffiffiffiffiffiffiffiffiffiffiffiffiffiffiffiffiffiffiffiffiffiffiffiffiffiffiffiffiffiffiffiffiffiffiσ sensorffiffiffiffi
Np
� �2
þσ spatial t0:975;Nffiffiffiffi
Np
� �2s
ð1Þ
where N is the number of stations within a pixel, σspatial is thestandard deviation of the soil moisture within each pixel oneach day derived from the PALS measurements, and t0.975,N isthe inverse of Student's t-distribution for 0.975 probability (95%confidence interval) with N degrees of freedom. It should benoted that for the original configuration of the soil moisture ob-servation network the error was found to be 0.01 m3/m3 (Coshet al., 2008).
4. Airborne measurements
4.1. PALS brightness temperature calibration
The PALS instrument collects coincident (in time and place) radarand radiometer measurements (Wilson et al., 2001; Misra et al.,2017). Both measurements are obtained through the same antenna ina fast-switching sequence. PALS has been used in several soil moisturestudies in the past (e.g., Njoku et al., 2002; Narayan et al., 2004;Bindlish et al., 2009; Colliander et al., 2012, 2015, 2016a; Barber et al.,2016). During SMAPVEX15, PALS was installed on a DC-3 aircraft. Inits 2015 configuration PALS employed a lightweight antenna with a21° beamwidth (Yueh et al., 2008),which had been upgraded to includea scanning mechanism. The PALS antenna was attached to a scan headunder the fuselage of the aircraft allowing a full 360° conical scan at40° incidence angle, which matches the observing angle of SMAP. Thisdesign results in a footprint of 1100m (along scan) by 1500m (radially)on the groundwith an effective resolution of about 1200m (square rootof the area of the footprint ellipse) for the flights at 2300 m altitudeabove ground.
The operation of the PALS radiometer is based on a two-refer-ence switching scheme (Wilson et al., 2001); this design wasadopted for the radiometers deployed by the SMAP (Piepmeier etal., 2017) and Aquarius missions (Le Vine et al., 2007). One of thereferences is a matched load and the other one is a noise diode.These two loads allow the removal of internal gain and offset fluctu-ation of the radiometer chain during operation. The brightness tem-perature at the input of the antenna is computed using theprinciples presented by Tanner et al. (2003). In general, water bod-ies are reliable and widely used calibration targets for airborne low-frequency radiometers. However, for SMAPVEX15 suitable waterbodies were not available in the vicinity of the flight path (longtransit times limited the flight range available for water body cali-brations) for tracking co-incident relative calibration with scienceflights. In order to test the repeatability of the calibration an exter-nal absorber load at ambient temperature and a sky reflection weremeasured before and after each flight. These external calibrationmeasurements were suitable for tracking major relative calibrationchanges in the radiometer. A separate lake overflight was conduct-ed to tie the relative target measurements to absolute values. Fig. 2shows the vertically polarized brightness temperature for eachPALS flight during SMAPVEX15.
4.2. PALS derived soil moisture
The soil moisture is retrieved following the standard τ-ω-h for-mulation, e.g., (Njoku and Entekhabi, 1996) where the top of the

Fig. 2.Vertically polarized PALS brightness temperature for each flight in SMAPVEX15. The black box denotes theWGEW validation pixel, and the crosses mark the center of eachSMAP 36-km pixel (labeled P1 through P3 going from west to east) within the domain.
104 A. Colliander et al. / Remote Sensing of Environment 196 (2017) 101–112
vegetation brightness temperature is modeled using roughnesscorrected reflectivity (rsoil), vegetation opacity (τ) and vegetationscattering parameter (ω):
TTOVB;p ¼ 1−rsoil;p
� �Tsoile
−τp þ Tveg 1−ωp� �
1−e−τpð Þ þ Tveg 1−ωp� �
� 1−e−τpð Þrsoil;pe−τp ð2Þ
where the first term corresponds to the ground emission through thevegetation, the second term to the vegetation emission, and the thirdterm to the vegetation emission dwelling downward and thenreflected from the ground and propagated through the vegetation.For roughness correction, the classical model adopted fromChoudhury et al. (1979) is used:
rsoil;p ¼ r0;pe−h0;pcos2 θð Þ;h0;p ¼ 2σkð Þ2; ð3Þ
where r0,p is the flat surface reflectivity; θ is the incidence angle; σ isthe root mean square deviation of the surface height, and k is thewave number in free space (29.62 1/m at 1.4135 GHz). The smoothsurface reflectivity is related to soil dielectric constant through theFresnel reflection coefficient. The soil dielectric constant is relatedto soil moisture using the Mironov model (Mironov et al., 2009),which has been found to perform somewhat better than alternativesin radiometer-based soil moisture retrieval applications (Bircher etal., 2012; Srivastava et al., 2015).
In order to precisely translate measured brightness temperature toemissivity the physical temperature distribution in this layer is required(Njoku and Kong, 1977). However, because a precise, concurrent andcomplete vertical and spatial distribution of temperatures is very diffi-cult tomeasure, we used the temperaturemeasurements thatwere col-lected in the experiment to develop estimates for the soil temperature,represented by Tsoil in Eq. (2). Specifically, we applied the 5-cm depth
soil temperature measurements from the permanent soil moisture ob-servation network to estimate the soil temperature. The soil tempera-ture measurements were averaged and this value, at the time of thePALS flights, was used as Tsoil. It is acknowledged that the deviationfrom the actual temperature profile introduces an error into themodeled brightness temperature. We also used the model forecast sur-face temperature provided as part of the SMAP product in the PALS soilmoisture retrieval to facilitate additional comparisons between SMAPand PALS soil moistures at the 36-km scale. This value is computedusing a combination of GMAO GEOS-5 layer 1 and layer 2 soil tempera-tures (O'Neill et al., 2016).
The vegetation opacitywas derived by using a linear relationship de-fined by the vegetation water content (VWC) and an empirical param-eter bp (Kirdiashev et al., 1979; Jackson and Schmugge, 1991):
τp ¼ bpWcos θð Þ ð4Þ
where W is the vegetation water content. For consistency in the com-parisons with respect to the SMAP soil moisture retrievals we appliedthe same VWC as SMAP does in its radiometer-based algorithm (Chanet al., 2013). The parameter bp was given a value of 0.1 based on previ-ous studies (Chan et al., 2016). The physical temperature of the vegeta-tionwas estimated from the thermal infraredmeasurements conductedalong with the PALS measurements. The vegetation scattering parame-ter was assumed to be small (ωp = 0.05) as per Chan et al. (2016).
The soil moisture was retrieved on a 500-m grid, which is based onthe 1-km SMAP grid. The SMAP products use Equal-Area ScalableEarth grid ver. 2 (EASE-2) (Brodzik et al., 2012). The 500-mgridwill sat-isfy theNyquist sampling criterion (e.g., Chapter 3 in Smith, 1997) in thespatial domain for the 1200-m footprint PALS brightness temperaturemeasurements. The resolution of the soil moisture is driven by that of

Table 1Uncertainty of the parameters used in the simulation to estimate thesoil moisture retrieval error.
Parameter Uncertainty
TBp 1 KTsoil 3 °CTveg 5 °CVWC 10%hp, bp, ωp 10%Sand and clay fraction 10%
105A. Colliander et al. / Remote Sensing of Environment 196 (2017) 101–112
the PALS brightness temperature and is, therefore, also about 1200 m.We also used the same ancillary data as the SMAP L2SMP for landcover and soil texture (clay and sand fraction), as well as NDVI (normal-ized difference vegetation index) for vegetation water content (VWC)determination. The data were re-gridded onto the 500-m grid for pro-cessing. The PALS soil moisture retrieval algorithmminimizes the differ-ence between modeled and measured brightness temperature in orderto estimate the soil moisture for each pixel.
Fig. 3 shows the PALS-derived soil moisture for the entire domain oneach flight day. The retrieved soil moisture maps are heavily influencedby the precipitation patterns resulting from the North American Mon-soon (Adams and Comrie, 1997). The soil moisture pattern was highlyvariable from day to day, whichwas one of the goals of the experiment:to collect datawith highly heterogeneous soilmoisture conditionswith-in SMAP footprints for testing disaggregation algorithms (see Section 1).
The uncertainty of the PALS soil moisture retrievals was estimatedusing the forward model described above. The parameter uncertaintiesapplied in Monte Carlo simulations are listed in Table 1. The simulationwas carried out for each retrieved soil moisture value.
5. SMAP observations
In this investigationwe examined both the SMAP radiometer bright-ness temperature measurements (Level 1) (Piepmeier et al., 2016) andthe radiometer-based soil moisture retrievals, Level 2 Soil Moisture Pas-sive (L2SMP) product (O'Neill et al., 2016). Details of the SMAP L2SMPalgorithm are presented in Chan et al. (2016). The baseline algorithmuses vertically polarized brightness temperature and a single channelalgorithm (Jackson, 1993) based on the τ-ω-h model presented in (1).This means the PALS algorithms described in Section 4.2 is very similar
Fig. 3. Soil moisture maps derived from PALS brightness temperature for each flight in SMAPVEmountains.
to the L2SMP baseline algorithm. The input brightness temperature iscorrected for atmospheric effects, the antenna pattern andwater bodies(which are not present in the experiment domain). The soilmoisture re-trieval takes place on the SMAP 36-km EASE-2 grid. Because the gridsamples the ground in large intervals of 36-km, SMAP developed an ad-ditional process for retrieving the 36-km soil moisture also in offset in-tervals of 3-km. This so-called “validation grid” processing allowsplacing the 36-km retrieval pixels optimally with respect to in situ sta-tions to reduce uncertainties arising frommisalignment of the retrievaland the ground-based reference. A centered validation grid pixel wasdefined over the WGEW and these SMAP data will be compared to thePALS observations and in situmeasurements. The analysis here focuseson the morning overpasses, which is the nominal observation time forSMAP (equatorial overpass at 6 AM local solar time). The expectationis that early in the morning the surface and vegetative thermal condi-tions are more consistent with isothermal assumptions made in the re-trieval algorithm (O'Neill et al., 2016).
X15. The black box denotes theWGEW validation pixel. The blanked areas are due to the

106 A. Colliander et al. / Remote Sensing of Environment 196 (2017) 101–112
6. Results
6.1. Brightness temperature observations
In addition to actual discrepancies in the calibration of the radiome-ters, there are several other factors that can cause both systematic andtime-dependent differences in the comparison of airborne andspaceborne brightness temperature measurements. An obvious one isthe timing of the observations: the dielectric constant of soil (soil mois-ture) and surface temperature can vary strongly over time, especially ina near desert environment likeWalnut Gulch. Another important factoris differences in the area contributing to the observations. The SMAP an-tenna, like any real aperture radiometer antenna, has a main beam thatis larger than the typically applied 3-dB footprint (in the SMAP L1 radi-ometer processing the effect of side lobes is compensated for, seePiepmeier et al., 2016). Hence, if the airborne measurements do notcover the entire area captured by the main beam, it is expected thattherewill be someadditional uncertainty in the comparison. This uncer-tainty is a function of the brightness temperature heterogeneity withinthe actual footprint. Furthermore, the shape of antenna pattern affectshowdifferent parts of the areawithin the footprint areweighted. There-fore, brightness temperature heterogeneity – both inside and outside –of the 3-dB footprintmay cause the spaceborne and airborne brightnesstemperature to differ.
In order to compare PALS and SMAP brightness temperatures, theSMAP brightness temperature over the experiment domainwas obtain-ed from the validation grid processing (see Section 5) for three pixels,whose centers are displayed in Fig. 2. The PALSmeasurements were av-eraged for each pixel using Gaussian weighting so that the weight de-creases with distance from the pixel center and reduces to about halfat a distance of 20 km. This approximates the effective antenna pattern,which is the result of the brightness temperature averaging in theL1C_TB processing (Chan et al., 2014). In addition, the arithmetic aver-age of the PALS brightness temperature was computed within theboundaries of the 36-km pixels. There was b1.5 h difference betweenthe PALS mean acquisition times over the pixel areas and the SMAPoverpass time on each day; in most cases the PALS mean acquisitiontime was earlier than the SMAP overpass time. This translates to soiltemperature differences that are in most cases b1 °C based on soil tem-perature averages obtained from the permanent in situ stations. Fig. 4shows the PALS brightness temperature averages compared to theSMAP brightness temperatures over each pixel. The PALS brightnesstemperature computed with weighted average corresponded to SMAPsomewhat better than the arithmetic average over the pixel areas.In particular the difference was notable in the cases when there is het-erogeneity around the pixel edges. This was expected because theweighted average extends over the pixel boundaries. Overall, the com-parison showed very similar trends in the PALS and SMAP brightness
Fig. 4.Comparison of SMAPand PALS brightness temperatures over each of the 36-kmpixels (P1mean difference between PALS (computed using theweighting scheme) and SMAP in eachpixerefers to arithmetic average of PALS brightness temperature within the SMAP pixel and “Weig
temperature records. Fig. 5 shows the scatterplot of the PALS brightnesstemperature obtained through Gaussian weighting and the SMAPbrightness temperature. The error bars in the figure show the standardof brightness temperature in the pixel as determined from the PALS 1-km measurements. The overall mean difference between SMAP andGaussian-weighted PALS brightness temperatures was very small foreach pixel at the vertical polarization (ranging from −0.3 K to 1.3 Kfrom pixel to pixel). For the horizontal polarization a larger overallmean difference was observed (ranging from −6.0 K to −11.0 K).These comparisons will be revisited once all calibration informationfrom the lake flights and ground measurements are accounted for (seeSection 4.1). For the purposes of this paper, the vertically polarizedbrightness temperature was used directly without compensating forthe difference. The strong correlation between PALS and SMAP bright-ness temperatures supports the utilization of PALS brightness tempera-ture for retrieving high-resolution soil moisture within the SMAPVEX15domain to investigate effects of spatial soil moisture dynamics at sub-footprint scales of SMAP.
6.2. PALS vs. in situ soil moisture
In this section the PALS derived soil moisture is compared to in situsoil moisture measurements. In order to avoid comparing point mea-surements to PALS soil moisture values estimated over larger grids, aset of five 3-km validation pixels containing four or more in situ sensorswas defined. Fig. 6(f) shows the layout of the stations (both permanentand temporary stations, see Section 3) and the five pixel boundarieswith the day three and day six PALS soil moisture as the background.The 3-km grid is based on the SMAP EASE-2 grid. Fig. 6(a) through Fig.6(e) show the PALS retrievals with the in situmeasurement time-series.The plots show the averaged in situ soil moisture, the soil moisture ofeach individual station, an average of manual samples collected ateach station, and the average precipitation. Fig. 7 shows the scatterplotof PALS soil moisture retrievals versus the in situ estimates for the pixels,and Table 2 shows themetrics for the PALS retrievals with respect to thein situ station soil moisture. Overall, the PALS retrievals correspondedwell to the in situ average, and the manually sampled soil moisturecorresponded well to the permanent and temporary station values; inparticular, the trends of the soil moisture evolution were captured.The most notable exceptions occurred on day three in pixels 1 and 4at stations P04 and P09, respectively. In the first case, the manual sam-ple remained dry while the station responded to the rain event. In thesecond case, themanual sample responded to a rain eventwhile the sta-tion remained dry. For pixels 1 through 4 there was one outlier for eachpixel where PALS overestimated the soil moisture with respect to thestationmeasurements. In each case, however, therewas at least one sta-tion, which showed an increase in soil moisture and/or a precipitationevent prior to the observed overestimation.
through P3) in the experiment domain for (a) vertical and (b) horizontal polarization. Thel is removed from the plots and showed in the legend inparenthesis next to “SMAP”. “Pixel”hted” refers to Gaussian-weighted average.

Fig. 5.Comparison of SMAPand PALS brightness temperatures over each of the 36-kmpixels (P1 through P3) in the experiment domain for (a) vertical and (b) horizontal polarization. ThePALS brightness temperature is computed using the Gaussian weighted average. Themean difference for each pixel is removed from the plots and displayed in the legend. The error barsshow the standard deviation of the brightness temperature within the pixel as determined from the PALS 1-km measurements.
107A. Colliander et al. / Remote Sensing of Environment 196 (2017) 101–112
Pixels 1 and 4 had outliers on the third flight day. In pixel 1, stationP04 responded to the precipitation event but the rest of the stationsdid not exhibit this increase in soil moisture; for example, the gauge atP03 detected b1 mm rain whereas P04 logged about 6 mm of rain(the precipitation of the individual stations is not shown in the plots).
Fig. 6. (a)–(e) In situmeasurement based soil moisture for the 3-km validation pixels and the PAgaugeswithin pixel collocatedwith the soil moisture sensors. The soil moisture reading of eachmanually sampled soilmoisture at each station is shownwith thick plus signs (P stands for permthere are at least four soil moisture sensors within pixels with the PALS soil moisture from thesensors and thick black lines mark the validation pixels (thin black lines indicate the SMAP 3-referred to the web version of this article.)
As mentioned above, the manual sample at P04 did not show an in-crease in the soil moisture. In pixel 4, neither the soil moisture sensoror rain gauge at P09 responded to the precipitation event detected byP06, which was almost 9 mm of rain, but the manual sample at P09was clearly elevated. P09 is located at the edge of the pixel and even if
LS derived soil moisture over the pixels. The hourly precipitation is the average of the rainstation contributing to the validation pixel is plottedwith dashed lines and the averages ofanent station; T stands for temporary station). (f)Map of the 3-kmvalidation pixelswherethird and the sixth flight days as the background. The red dots indicate the soil moisturekm grid). (For interpretation of the references to color in this figure legend, the reader is
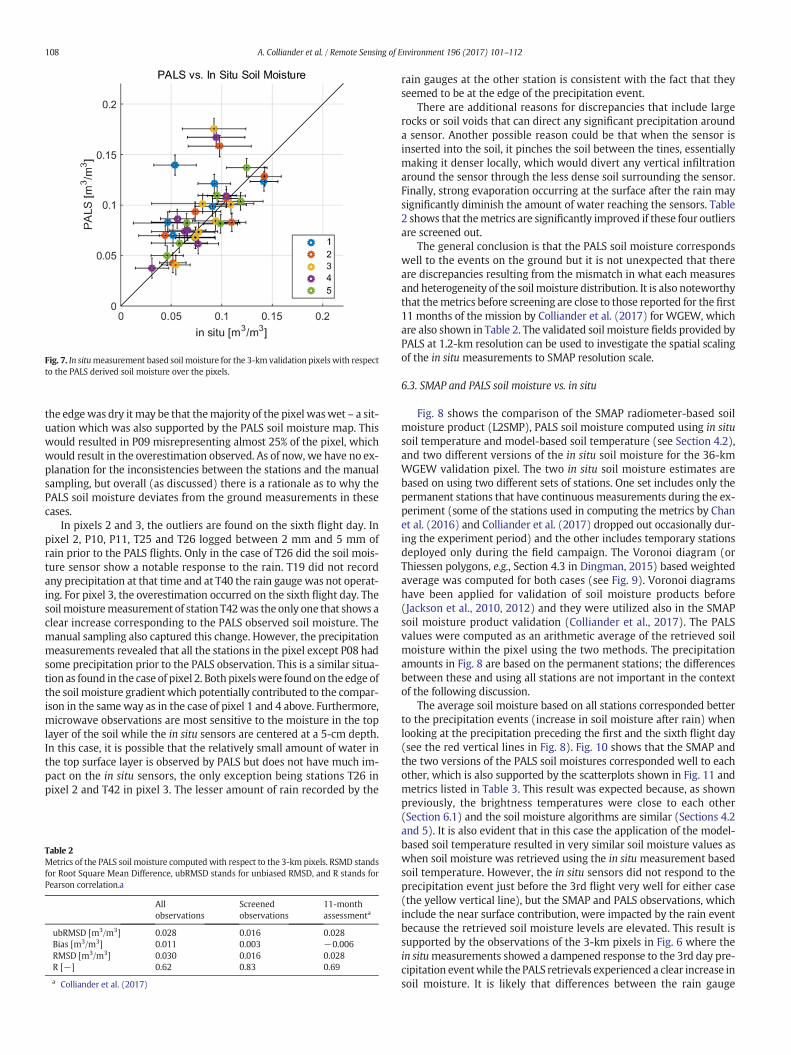
Fig. 7. In situmeasurement based soil moisture for the 3-km validation pixelswith respectto the PALS derived soil moisture over the pixels.
108 A. Colliander et al. / Remote Sensing of Environment 196 (2017) 101–112
the edgewas dry it may be that themajority of the pixel waswet – a sit-uation which was also supported by the PALS soil moisture map. Thiswould resulted in P09 misrepresenting almost 25% of the pixel, whichwould result in the overestimation observed. As of now, we have no ex-planation for the inconsistencies between the stations and the manualsampling, but overall (as discussed) there is a rationale as to why thePALS soil moisture deviates from the ground measurements in thesecases.
In pixels 2 and 3, the outliers are found on the sixth flight day. Inpixel 2, P10, P11, T25 and T26 logged between 2 mm and 5 mm ofrain prior to the PALS flights. Only in the case of T26 did the soil mois-ture sensor show a notable response to the rain. T19 did not recordany precipitation at that time and at T40 the rain gauge was not operat-ing. For pixel 3, the overestimation occurred on the sixth flight day. Thesoilmoisturemeasurement of station T42was the only one that shows aclear increase corresponding to the PALS observed soil moisture. Themanual sampling also captured this change. However, the precipitationmeasurements revealed that all the stations in the pixel except P08 hadsome precipitation prior to the PALS observation. This is a similar situa-tion as found in the case of pixel 2. Both pixelswere foundon the edge ofthe soil moisture gradientwhich potentially contributed to the compar-ison in the sameway as in the case of pixel 1 and 4 above. Furthermore,microwave observations are most sensitive to the moisture in the toplayer of the soil while the in situ sensors are centered at a 5-cm depth.In this case, it is possible that the relatively small amount of water inthe top surface layer is observed by PALS but does not have much im-pact on the in situ sensors, the only exception being stations T26 inpixel 2 and T42 in pixel 3. The lesser amount of rain recorded by the
Table 2Metrics of the PALS soil moisture computed with respect to the 3-km pixels. RSMD standsfor Root Square Mean Difference, ubRMSD stands for unbiased RMSD, and R stands forPearson correlation.a
Allobservations
Screenedobservations
11-monthassessmenta
ubRMSD [m3/m3] 0.028 0.016 0.028Bias [m3/m3] 0.011 0.003 −0.006RMSD [m3/m3] 0.030 0.016 0.028R [−] 0.62 0.83 0.69
a Colliander et al. (2017)
rain gauges at the other station is consistent with the fact that theyseemed to be at the edge of the precipitation event.
There are additional reasons for discrepancies that include largerocks or soil voids that can direct any significant precipitation arounda sensor. Another possible reason could be that when the sensor isinserted into the soil, it pinches the soil between the tines, essentiallymaking it denser locally, which would divert any vertical infiltrationaround the sensor through the less dense soil surrounding the sensor.Finally, strong evaporation occurring at the surface after the rain maysignificantly diminish the amount of water reaching the sensors. Table2 shows that themetrics are significantly improved if these four outliersare screened out.
The general conclusion is that the PALS soil moisture correspondswell to the events on the ground but it is not unexpected that thereare discrepancies resulting from the mismatch in what each measuresand heterogeneity of the soil moisture distribution. It is also noteworthythat themetrics before screening are close to those reported for the first11 months of the mission by Colliander et al. (2017) for WGEW, whichare also shown in Table 2. The validated soil moisture fields provided byPALS at 1.2-km resolution can be used to investigate the spatial scalingof the in situ measurements to SMAP resolution scale.
6.3. SMAP and PALS soil moisture vs. in situ
Fig. 8 shows the comparison of the SMAP radiometer-based soilmoisture product (L2SMP), PALS soil moisture computed using in situsoil temperature and model-based soil temperature (see Section 4.2),and two different versions of the in situ soil moisture for the 36-kmWGEW validation pixel. The two in situ soil moisture estimates arebased on using two different sets of stations. One set includes only thepermanent stations that have continuous measurements during the ex-periment (some of the stations used in computing the metrics by Chanet al. (2016) and Colliander et al. (2017) dropped out occasionally dur-ing the experiment period) and the other includes temporary stationsdeployed only during the field campaign. The Voronoi diagram (orThiessen polygons, e.g., Section 4.3 in Dingman, 2015) based weightedaverage was computed for both cases (see Fig. 9). Voronoi diagramshave been applied for validation of soil moisture products before(Jackson et al., 2010, 2012) and they were utilized also in the SMAPsoil moisture product validation (Colliander et al., 2017). The PALSvalues were computed as an arithmetic average of the retrieved soilmoisture within the pixel using the two methods. The precipitationamounts in Fig. 8 are based on the permanent stations; the differencesbetween these and using all stations are not important in the contextof the following discussion.
The average soil moisture based on all stations corresponded betterto the precipitation events (increase in soil moisture after rain) whenlooking at the precipitation preceding the first and the sixth flight day(see the red vertical lines in Fig. 8). Fig. 10 shows that the SMAP andthe two versions of the PALS soil moistures corresponded well to eachother, which is also supported by the scatterplots shown in Fig. 11 andmetrics listed in Table 3. This result was expected because, as shownpreviously, the brightness temperatures were close to each other(Section 6.1) and the soil moisture algorithms are similar (Sections 4.2and 5). It is also evident that in this case the application of the model-based soil temperature resulted in very similar soil moisture values aswhen soil moisture was retrieved using the in situ measurement basedsoil temperature. However, the in situ sensors did not respond to theprecipitation event just before the 3rd flight very well for either case(the yellow vertical line), but the SMAP and PALS observations, whichinclude the near surface contribution, were impacted by the rain eventbecause the retrieved soil moisture levels are elevated. This result issupported by the observations of the 3-km pixels in Fig. 6 where thein situmeasurements showed a dampened response to the 3rd day pre-cipitation eventwhile the PALS retrievals experienced a clear increase insoil moisture. It is likely that differences between the rain gauge

Fig. 8. Comparison of PALS and SMAP soil moistures at 36-km scalewith respect to the in situ soil moisture. Black line is based on the average of the selected stations only; the green line isbased on all stations, including temporary ones. The dashed red and yellow lines are used to highlight precipitation events that are discussed in the text. (For interpretation of thereferences to color in this figure legend, the reader is referred to the web version of this article.)
109A. Colliander et al. / Remote Sensing of Environment 196 (2017) 101–112
estimates versus the in situ soilmoisture estimates (see Section 6.2) con-tributed to this lack of correspondence.
On the fourth flight day (see Fig. 12), there was only one station inthe bottom portion of the domain that was predominantly wetterthan the top half (based on the PALS soil moisture), which correspondsto where the most stations are. The one station was weighted more ac-cording to the Voronoi diagrams but geographically did not account forthe entire half (see Fig. 9). This may contribute to the PALS and SMAPsoil moisture averages being higher than the in situ averages. At thesame time, the average based on using all stations seemed to capturethewet spots in the top half better (based on the distribution of the sta-tions and the location of the wet spots), which seemed to explain whyusing all stations has a higher average value during this time.
Overall the metrics were relatively good except for the correlation,which suffers from the small range of soil moisture (Table 3). Thescatterplot shows the outliers on the third and fourth day for bothSMAP and PALS soil moisture estimates. The PALS-derived high-resolu-tion soil moisture provided the crucial information to explain these dis-crepancies between SMAP and in situ soil moisture, which yielded theconclusion that SMAP L2SMP provided valid soil moisture estimatesduring the experiment period.
Fig. 9. Voronoi diagrams for the two sets of in situ sensors used f
7. Discussion
Spatial upscaling of in situ measurements is a critical aspect in vali-dating remote sensing data products. In the case of the SMAP L2SMPdata product the task is to estimate the average soil moisture over 36-km pixels with the point-wise in situ sensors. In the previous sections,the PALS measurements resolved the soil moisture distribution withinthe WGEW validation pixel at 1-km resolution during SMAPVEX15.The analysis showed that these measurements together with the aug-mented in situ observations exhibited some discrepancies between theSMAP L2SMP product and the average estimated by the permanent insitu sensors within the pixel. It was concluded that these discrepanciesare due to the fact that the in situ sensors do not capture the verticaland horizontal dynamics of the soil moisture within the pixel in thesame way as the radiometer measurements.
In terms of the vertical component, it is well-known that soil mois-ture determines the thickness of the soil layer that contributes to the ob-served brightness temperature (Njoku and Kong, 1977; Wilheit, 1978).The increased water content in the soil determines the permittivitywhich then increases for increasing water content. The assumption ofthe general correspondence between 5-cm in situ soil moisture
or computing the average soil moisture for the 36-km pixel.
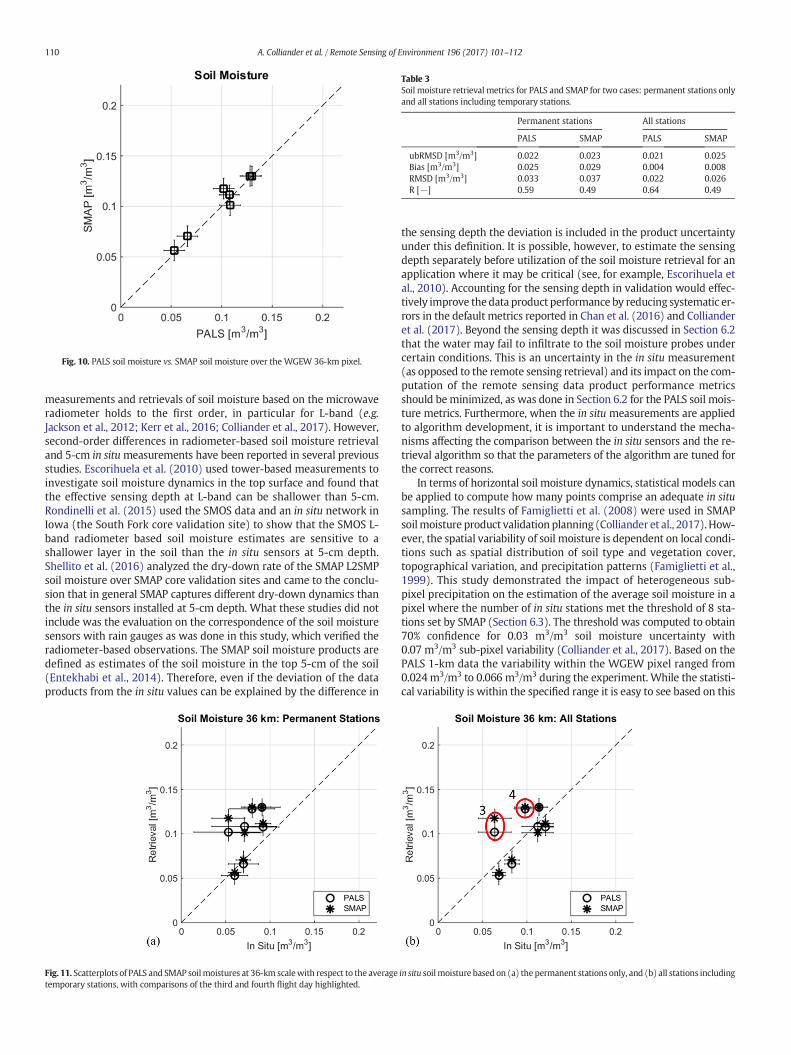
Fig. 10. PALS soil moisture vs. SMAP soil moisture over the WGEW 36-km pixel.
Table 3Soil moisture retrieval metrics for PALS and SMAP for two cases: permanent stations onlyand all stations including temporary stations.
Permanent stations All stations
PALS SMAP PALS SMAP
ubRMSD [m3/m3] 0.022 0.023 0.021 0.025Bias [m3/m3] 0.025 0.029 0.004 0.008RMSD [m3/m3] 0.033 0.037 0.022 0.026R [−] 0.59 0.49 0.64 0.49
110 A. Colliander et al. / Remote Sensing of Environment 196 (2017) 101–112
measurements and retrievals of soil moisture based on the microwaveradiometer holds to the first order, in particular for L-band (e.g.Jackson et al., 2012; Kerr et al., 2016; Colliander et al., 2017). However,second-order differences in radiometer-based soil moisture retrievaland 5-cm in situmeasurements have been reported in several previousstudies. Escorihuela et al. (2010) used tower-based measurements toinvestigate soil moisture dynamics in the top surface and found thatthe effective sensing depth at L-band can be shallower than 5-cm.Rondinelli et al. (2015) used the SMOS data and an in situ network inIowa (the South Fork core validation site) to show that the SMOS L-band radiometer based soil moisture estimates are sensitive to ashallower layer in the soil than the in situ sensors at 5-cm depth.Shellito et al. (2016) analyzed the dry-down rate of the SMAP L2SMPsoil moisture over SMAP core validation sites and came to the conclu-sion that in general SMAP captures different dry-down dynamics thanthe in situ sensors installed at 5-cm depth. What these studies did notinclude was the evaluation on the correspondence of the soil moisturesensors with rain gauges as was done in this study, which verified theradiometer-based observations. The SMAP soil moisture products aredefined as estimates of the soil moisture in the top 5-cm of the soil(Entekhabi et al., 2014). Therefore, even if the deviation of the dataproducts from the in situ values can be explained by the difference in
Fig. 11. Scatterplots of PALS and SMAP soilmoistures at 36-km scalewith respect to the averagetemporary stations, with comparisons of the third and fourth flight day highlighted.
the sensing depth the deviation is included in the product uncertaintyunder this definition. It is possible, however, to estimate the sensingdepth separately before utilization of the soil moisture retrieval for anapplication where it may be critical (see, for example, Escorihuela etal., 2010). Accounting for the sensing depth in validation would effec-tively improve thedata product performance by reducing systematic er-rors in the default metrics reported in Chan et al. (2016) and Collianderet al. (2017). Beyond the sensing depth it was discussed in Section 6.2that the water may fail to infiltrate to the soil moisture probes undercertain conditions. This is an uncertainty in the in situ measurement(as opposed to the remote sensing retrieval) and its impact on the com-putation of the remote sensing data product performance metricsshould beminimized, as was done in Section 6.2 for the PALS soil mois-ture metrics. Furthermore, when the in situ measurements are appliedto algorithm development, it is important to understand the mecha-nisms affecting the comparison between the in situ sensors and the re-trieval algorithm so that the parameters of the algorithm are tuned forthe correct reasons.
In terms of horizontal soil moisture dynamics, statistical models canbe applied to compute how many points comprise an adequate in situsampling. The results of Famiglietti et al. (2008) were used in SMAPsoilmoisture product validation planning (Colliander et al., 2017). How-ever, the spatial variability of soil moisture is dependent on local condi-tions such as spatial distribution of soil type and vegetation cover,topographical variation, and precipitation patterns (Famiglietti et al.,1999). This study demonstrated the impact of heterogeneous sub-pixel precipitation on the estimation of the average soil moisture in apixel where the number of in situ stations met the threshold of 8 sta-tions set by SMAP (Section 6.3). The threshold was computed to obtain70% confidence for 0.03 m3/m3 soil moisture uncertainty with0.07 m3/m3 sub-pixel variability (Colliander et al., 2017). Based on thePALS 1-km data the variability within the WGEW pixel ranged from0.024 m3/m3 to 0.066 m3/m3 during the experiment. While the statisti-cal variability is within the specified range it is easy to see based on this
in situ soilmoisture based on (a) the permanent stations only, and (b) all stations including
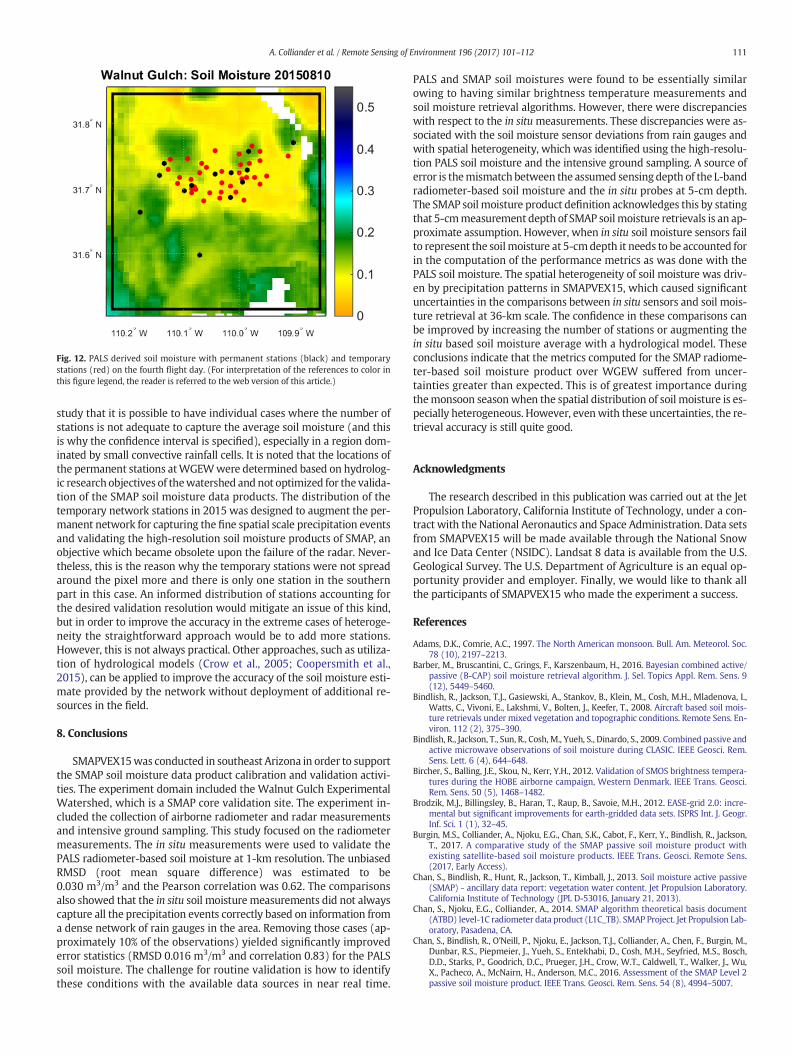
Fig. 12. PALS derived soil moisture with permanent stations (black) and temporarystations (red) on the fourth flight day. (For interpretation of the references to color inthis figure legend, the reader is referred to the web version of this article.)
111A. Colliander et al. / Remote Sensing of Environment 196 (2017) 101–112
study that it is possible to have individual cases where the number ofstations is not adequate to capture the average soil moisture (and thisis why the confidence interval is specified), especially in a region dom-inated by small convective rainfall cells. It is noted that the locations ofthe permanent stations atWGEWwere determined based on hydrolog-ic research objectives of thewatershed and not optimized for the valida-tion of the SMAP soil moisture data products. The distribution of thetemporary network stations in 2015 was designed to augment the per-manent network for capturing the fine spatial scale precipitation eventsand validating the high-resolution soil moisture products of SMAP, anobjective which became obsolete upon the failure of the radar. Never-theless, this is the reason why the temporary stations were not spreadaround the pixel more and there is only one station in the southernpart in this case. An informed distribution of stations accounting forthe desired validation resolution would mitigate an issue of this kind,but in order to improve the accuracy in the extreme cases of heteroge-neity the straightforward approach would be to add more stations.However, this is not always practical. Other approaches, such as utiliza-tion of hydrological models (Crow et al., 2005; Coopersmith et al.,2015), can be applied to improve the accuracy of the soil moisture esti-mate provided by the network without deployment of additional re-sources in the field.
8. Conclusions
SMAPVEX15was conducted in southeast Arizona in order to supportthe SMAP soil moisture data product calibration and validation activi-ties. The experiment domain included the Walnut Gulch ExperimentalWatershed, which is a SMAP core validation site. The experiment in-cluded the collection of airborne radiometer and radar measurementsand intensive ground sampling. This study focused on the radiometermeasurements. The in situ measurements were used to validate thePALS radiometer-based soil moisture at 1-km resolution. The unbiasedRMSD (root mean square difference) was estimated to be0.030 m3/m3 and the Pearson correlation was 0.62. The comparisonsalso showed that the in situ soil moisture measurements did not alwayscapture all the precipitation events correctly based on information froma dense network of rain gauges in the area. Removing those cases (ap-proximately 10% of the observations) yielded significantly improvederror statistics (RMSD 0.016 m3/m3 and correlation 0.83) for the PALSsoil moisture. The challenge for routine validation is how to identifythese conditions with the available data sources in near real time.
PALS and SMAP soil moistures were found to be essentially similarowing to having similar brightness temperature measurements andsoil moisture retrieval algorithms. However, there were discrepancieswith respect to the in situmeasurements. These discrepancies were as-sociated with the soil moisture sensor deviations from rain gauges andwith spatial heterogeneity, which was identified using the high-resolu-tion PALS soil moisture and the intensive ground sampling. A source oferror is themismatch between the assumed sensing depth of the L-bandradiometer-based soil moisture and the in situ probes at 5-cm depth.The SMAP soil moisture product definition acknowledges this by statingthat 5-cmmeasurement depth of SMAP soil moisture retrievals is an ap-proximate assumption. However, when in situ soil moisture sensors failto represent the soilmoisture at 5-cmdepth it needs to be accounted forin the computation of the performance metrics as was done with thePALS soil moisture. The spatial heterogeneity of soil moisture was driv-en by precipitation patterns in SMAPVEX15, which caused significantuncertainties in the comparisons between in situ sensors and soil mois-ture retrieval at 36-km scale. The confidence in these comparisons canbe improved by increasing the number of stations or augmenting thein situ based soil moisture average with a hydrological model. Theseconclusions indicate that the metrics computed for the SMAP radiome-ter-based soil moisture product over WGEW suffered from uncer-tainties greater than expected. This is of greatest importance duringthemonsoon seasonwhen the spatial distribution of soil moisture is es-pecially heterogeneous. However, evenwith these uncertainties, the re-trieval accuracy is still quite good.
Acknowledgments
The research described in this publication was carried out at the JetPropulsion Laboratory, California Institute of Technology, under a con-tract with the National Aeronautics and Space Administration. Data setsfrom SMAPVEX15 will be made available through the National Snowand Ice Data Center (NSIDC). Landsat 8 data is available from the U.S.Geological Survey. The U.S. Department of Agriculture is an equal op-portunity provider and employer. Finally, we would like to thank allthe participants of SMAPVEX15 who made the experiment a success.
References
Adams, D.K., Comrie, A.C., 1997. The North American monsoon. Bull. Am. Meteorol. Soc.78 (10), 2197–2213.
Barber, M., Bruscantini, C., Grings, F., Karszenbaum, H., 2016. Bayesian combined active/passive (B-CAP) soil moisture retrieval algorithm. J. Sel. Topics Appl. Rem. Sens. 9(12), 5449–5460.
Bindlish, R., Jackson, T.J., Gasiewski, A., Stankov, B., Klein, M., Cosh, M.H., Mladenova, I.,Watts, C., Vivoni, E., Lakshmi, V., Bolten, J., Keefer, T., 2008. Aircraft based soil mois-ture retrievals under mixed vegetation and topographic conditions. Remote Sens. En-viron. 112 (2), 375–390.
Bindlish, R., Jackson, T., Sun, R., Cosh, M., Yueh, S., Dinardo, S., 2009. Combined passive andactive microwave observations of soil moisture during CLASIC. IEEE Geosci. Rem.Sens. Lett. 6 (4), 644–648.
Bircher, S., Balling, J.E., Skou, N., Kerr, Y.H., 2012. Validation of SMOS brightness tempera-tures during the HOBE airborne campaign, Western Denmark. IEEE Trans. Geosci.Rem. Sens. 50 (5), 1468–1482.
Brodzik, M.J., Billingsley, B., Haran, T., Raup, B., Savoie, M.H., 2012. EASE-grid 2.0: incre-mental but significant improvements for earth-gridded data sets. ISPRS Int. J. Geogr.Inf. Sci. 1 (1), 32–45.
Burgin, M.S., Colliander, A., Njoku, E.G., Chan, S.K., Cabot, F., Kerr, Y., Bindlish, R., Jackson,T., 2017. A comparative study of the SMAP passive soil moisture product withexisting satellite-based soil moisture products. IEEE Trans. Geosci. Remote Sens.(2017, Early Access).
Chan, S., Bindlish, R., Hunt, R., Jackson, T., Kimball, J., 2013. Soil moisture active passive(SMAP) - ancillary data report: vegetation water content. Jet Propulsion Laboratory.California Institute of Technology (JPL D-53016, January 21, 2013).
Chan, S., Njoku, E.G., Colliander, A., 2014. SMAP algorithm theoretical basis document(ATBD) level-1C radiometer data product (L1C_TB). SMAP Project. Jet Propulsion Lab-oratory, Pasadena, CA.
Chan, S., Bindlish, R., O'Neill, P., Njoku, E., Jackson, T.J., Colliander, A., Chen, F., Burgin, M.,Dunbar, R.S., Piepmeier, J., Yueh, S., Entekhabi, D., Cosh, M.H., Seyfried, M.S., Bosch,D.D., Starks, P., Goodrich, D.C., Prueger, J.H., Crow, W.T., Caldwell, T., Walker, J., Wu,X., Pacheco, A., McNairn, H., Anderson, M.C., 2016. Assessment of the SMAP Level 2passive soil moisture product. IEEE Trans. Geosci. Rem. Sens. 54 (8), 4994–5007.

112 A. Colliander et al. / Remote Sensing of Environment 196 (2017) 101–112
Chen, F., Crow,W.T., Colliander, A., Cosh, M.H., Jackson, T.J., Bindlish, R., Reichle, R.H., Chan,S.K., Bosch, D.D., Starks, P.J., Goodrich, D.C., Seyfried, M.S., 2017. Application of triplecollocation in ground-based validation of soil moisture active/passive (SMAP) level2 data products. IEEE J. Sel. Topics Appl. Earth Obs. Remote Sens. 10 (2), 489–502.
Choudhury, B.J., Schmugge, T.J., Chang, A., Newton, R.W., 1979. Effects of surface rough-ness on the microwave emission from Soils. J. Geophys. Res. 84 (C9), 5699–5706.
Colliander, A., Chan, S., Kim, S.-B., Das, N., Yueh, S., Cosh, M., Bindlish, R., Jackson, T., Njoku,E., 2012. Long term analysis of PALS soil moisture campaign measurements for globalsoil moisture algorithm development. Rem. Sens. Env. 121, 309–322.
Colliander, A., Jackson, T.J., McNairn, H., Chazanoff, S., Dinardo, S., Latham, B., O'Dwyer, I.,Chun, W., Yueh, S., Njoku, E., 2015. Comparison of airborne passive and active L-bandSystem (PALS) brightness temperature measurements to SMOS observations duringthe SMAP validation experiment 2012 (SMAPVEX12). IEEE Geosci. Rem. Sens. Lett.12 (4), 801–805.
Colliander, A., Njoku, E.G., Jackson, T.J., Chazanoff, S., McNairn, H., Powers, J., Cosh, M.H.,M.H., 2016a. Retrieving soil moisture for non-forested areas using PALS radiometermeasurements in SMAPVEX12 field campaign. Rem. Sens. Env. 184, 86–100.
Colliander, A., Jackson, T.J., Bindlish, R., Chan, S., et al., 2017. Validation of SMAP surfacesoil moisture products with core validation sites. Rem. Sens. Env. 191, 215–231.
Coopersmith, E.J., Cosh, M.H., Petersen, W.A., Prueger, J., Niemeier, J., 2015. Soil moisturemodel calibration and validation: an ARS watershed on the South Fork Iowa River.J. Hydrometeorol. 16, 1087–1101.
Cosh, M.H., Jackson, T.J., Bindlish, B., Famiglietti, J.S., Ryu, D., 2005. Calibration of an im-pedance probe for estimation of surface soil water content over large regions.J. Hydrol. 311 (1–4), 49–58.
Cosh, M.H., Jackson, T.J., Moran, S., Bindlish, R., 2008. Temporal persistence and stability ofsurface soil moisture in a semi-arid watershed. Remote Sens. Environ. 112, 304–313.
Crow, W.T., Ryu, D., Famiglietti, J.S., 2005. Upscaling of field scale soil moisture measure-ments using distributed land surface modeling. Adv. Water Resour. 28, 1–14.
Dingman, S.L., 2015. Physical fHydrology. Waveland Press, Inc., Illinois, USA.Entekhabi, D., Yueh, S., O'Neill, P., Kellogg, K., 2014. SMAP handbook – soil moisture active
passive: mapping soil moisture and freeze/thaw from space. SMAP Project. Jet Pro-pulsion Laboratory, Pasadena, CA.
Escorihuela, M.J., Chanzy, A., Wigneron, J.P., Kerr, Y.H., 2010. Effective soil moisture sam-pling depth of L-band radiometry: a case study. Remote Sens. Environ. 114,995–1001.
Famiglietti, J.S., Devereaux, J.A., Laymon, C.A., Tsegaye, T., Houser, P.R., Jackson, T.J.,Graham, S.T., Rodell, M., van Oevelen, P.J., 1999. Ground-based investigation of soilmoisture variability within remote sensing footprints during the Southern GreatPlains 1997 (SGP97) Hydrology Experiment. Water Resour. Res. 35 (6), 1839–1851.
Famiglietti, J.S., Ryu, D., Berg, A.A., Rodell, M., Jackson, T.J., 2008. Field observations of soilmoisture variability across scales. Water Resour. Res. 44, W01423.
Goodrich, D.C., Keefer, T.O., Unkrich, C.L., Nichols, M.H., Osborn, H.B., Stone, J.J., Smith, J.R.,2008. Long-term precipitation database, Walnut Gulch Experimental Watershed, Ar-izona, United States. Water Resour. Res. 44, W05S04.
Jackson, T.J., 1993. Measuring surface soil moisture using passivemicrowave remote sens-ing. Hydrol. Process. 7, 139–152.
Jackson, T.J., Schmugge, T.J., 1991. Vegetation effects on the microwave emission of soils.Rem. Sens. Env. 36, 203–212.
Jackson, T.J., Cosh, M.H., Bindlish, R., Starks, P.J., Bosch, D.D., Seyfried, M., Goodrich, D.C.,Moran, M.S., Du, J., 2010. Validation of advanced microwave scanning radiometersoil moisture products. IEEE Trans. Geosci. Rem. Sens. 48 (12).
Jackson, T.J., Bindlish, R., Cosh, M.H., Zhao, T., Starks, P.J., Bosch, D.D., Seyfried, M., Moran,M.S., Goodrich, D.C., Kerr, Y.H., Leroux, D., 2012. Validation of Soil Moisture and OceanSalinity (SOMS) Soil Moisture Over Watershed Networks in the U.S. IEEE Trans.Geosci. Rem. Sens. 50 (5).
Jackson, T.J., Colliander, A., Kimball, J., Reichle, R., Crow, W., Entekhabi, D., O'Neill, P.,Njoku, E., 2013. SMAP science data calibration and validation plan. SMAP Mission.D-52544 JPL (April 2, 2013).
Keefer, T.O., Moran, M.S., Paige, G.B., 2008. Long-term meteorological and soil Hydrologydatabase, Walnut Gulch Experimental Watershed, Arizona, United States. WaterResour. Res. 44.
Kerr, Y.H., Al-Yaari, A., Rodriguez-Fernandez, N., Parrens, M., et al., 2016. Overview ofSMOS performance in terms of global soil moisture monitoring after six years in op-eration. Remote Sens. Environ. 40–63.
Kustas, W.P., Moran, M.S., Humes, K.S., Stannard, D.I., Pinter Jr., P.J., Hipps, L.E., Swiatek, E.,Goodrich, D.C., 1994. Surface energy balance estimates at local and regional scalesusing optical remote sensing from an aircraft platform and atmospheric data collect-ed over semiarid rangelands. Water Resour. Res. 30 (5), 1241–1259.
Kirdiashev, K.P., Chukhlantsev, A.A., Shutko, A.M., 1979. Microwave radiation of theEarth's surface in the presence of vegetation. Radio Eng. Electron. USSR 24, 256–264.
Le Vine, D., Lagerloef, G., Colomb, F., Yueh, S., Pellerano, F., 2007. Aquarius: An instrumentto Monitor Sea surface salinity from space. IEEE Trans. Geosci. Rem. Sens. 45 (7),2040–2050.
Magagi, R., et al., 2013. Canadian experiment for soil moisture in 2010 (CanEx-SM10):overview and preliminary results. IEEE Trans. Geosci. Rem. Sens. 51 (1).
McNairn, H., Jackson, T., Wiseman, G., Belair, S., Berg, A., Bullock, P., Colliander, A., Cosh,M., Kim, S., Magagi, R., et al., 2015. The soil moisture active passive validation exper-iment 2012 (SMAPVEX12): pre-launch calibration and validation of the SMAP satel-lite. IEEE Trans. Geosci. Rem. Sens. 53 (5).
Mironov, V.L., Kosolapova, L.G., Fomin, S.V., 2009. Physically and Mineralogically basedspectroscopic dielectric model for moisture Soils. IEEE Trans. Geosci. Rem. Sens. 47(7), 2059–2070.
Misra, S., et al., 2017. Radiometric calibration of the airborne rotating passive and active L-band system (PALS). IEEE Geosci. Remote Sens. Lett. (Submission).
Moran, M.S., Emmerich, W.E., Goodrich, D.C., Heilman, P., Holifield Collins, C., Keefer, T.O.,Nearing, M.A., Nichols, M.H., Renard, K.G., Scott, R.L., Smith, J.R., Stone, J.J., Unkrich,C.L.,Wong, J.K., 2008. Preface to special section on Fifty years of research and data col-lection: U.S. Department of Agriculture Walnut Gulch Experimental Watershed.Water Resour. Res. 44, W05S01. http://dx.doi.org/10.1029/2007WR006083.
Narayan, U., Lakshmi, V., Njoku, E., 2004. Retrieval of soil moisture from passive and activeL/S band sensor (PALS) observations during the soil moisture experiment in 2002(SMEX02). Rem. Sens. Env. 92, 483–496.
Njoku, E.G., Kong, J.-A., 1977. Theory for passive microwave remote sensing of near-sur-face soil moisture. J. Geophys. Res. 82 (20), 3108–3118.
Njoku, E.G., Entekhabi, D., 1996. Passive microwave remote sensing of soil moisture.J. Hydrol. 184, 101–129.
Njoku, E.G., Wilson, W.J., Yueh, S.H., Dinardo, S.J., Li, F.K., Jackson, T.J., Lakshmi, V., Bolten,J., 2002. Observations of soil moisture using a passive and active low frequency mi-crowave airborne sensor during SGP99. IEEE Trans. Geosci. Rem. Sens. 40 (12),2659–2673.
O'Neill, P., Chan, S., Njoku, E.G., Jackson, T.J., Bindlish, R., 2016. Algorithm Theoretical BasisDocument Level 2 & 3 Soil Moisture (Passive) Data Products, Rev. C. SMAP Project, JPLD-66480, December 15, 2016. Jet Propulsion Laboratory, Pasadena, CA.
Pan, M., Cai, X., Chaney, N.W., Entekhabi, D., E. F., 2016. Wood. An initial assessment ofSMAP soil moisture retrievals using high-resolution model simulations and in situobservations. Geophys. Res. Lett. 43, 9662–9668.
Panciera, R., Walker, J.P., Jackson, T.J., Gray, D.A., Tanase, M.A., Ruy, D., Monerris, A.,Yardley, H., Rudiger, C., Wu, X., et al., 2014. The soil moisture active passive experi-ments (SMAPEx): Toward soil moisture retrieval from the SMAP mission. IEEETrans. Geosci. Rem. Sens. 52, 490–507.
Piepmeier, J.R., Focardi, P., Horgan, K.A., Knuble, J., Ehsan, N., Lucey, J., Brambora, C.,Brown, P.R., et al., 2017. SMAP L-band microwave radiometer: Instrument designand first year on orbit. IEEE Trans. Geosci. Rem. Sens. 55 (4), 1954–1966.
Piepmeier, J., Mohammed, P., De Amici, G., Kim, E., Peng, J., Ruf, C., 2016. SMAP AlgorithmTheoretical Basis Document (ATBD) L1B Radiometer Brightness Temperature DataProduct: L1B_TB. SMAP Project, Goddard Space Flight Center, Greenbelt, MD.
Rondinelli, W.J., Hornbuckle, B.K., Patton, J.C., Walker, V.A., Carr, B.D., Logsdon, S.D., 2015.Different rates of soil drying after rainfall are observed by the SMOS satellite and theSouth Fork in situ soil moisture network. J. Hydrometeorol. 16, 889–903.
Rowlandson, T.L., Berg, A.A., Bullock, P.R., Ojo, E.R., McNairn, H., Wiseman, G., Cosh, M.H.,2013. Evaluation of several calibration procedures for a portable soil moisture sensor.J. Hydrol. 498, 335–344.
Shellito, P.J., Small, E.E., Colliander, A., Bindlish, R., Cosh, M.H., Berg, A., Bosch, D.D.,Caldwell, T.G., Goodrich, D.C., McNairn, H., Prueger, J., Starks, P.J., van der Velde, R.,Walker, J., 2016. SMAP soil moisture drying more rapid than observed in situ follow-ing rainfall events. Geophys. Res. Lett. (Under Review).
Smith, S.W., 1997. The Scientist and Engineer's Guide to Digital Signal Processing. 1997.California Technical Publishing, San Diego, California, USA.
Srivastava, P.K., O'Neill, P., Cosh, M., Kurum, M., Lang, R., Joseph, A., 2015. Evaluation of di-electric mixing models for passive microwave soil moisture retrieval using data fromComRAD ground-based SMAP simulator. IEEE J. Sel. Top. App. Earth. Obs. RemoteSens. 8 (9), 4345–4354.
Tanner, A., Wilson,W., Pellerano, F., 2003. Development of a high stability L-band radiom-eter for ocean salinity measurements. Proc. IEEE Geosci. Rem. Symp. 1238–1240.
Ye, N., Walker, J., Wu, X., Jackson, T., Renzullo, L., Merlin, O., Rudiger, C., Entekhabi, D.,DeJeu, R., Kim, E., 2016. Towards Validation of SMAP: SMAPEx-4 & -5. Proc. IEEEInt. Geosci. Rem. Sens. Symp., Beijing, China, July 10–15, 2016.
Yueh, S., Dinardo, S., Chan, S., Njoku, E., Jackson, T., Bindlish, R., 2008. Passive and Active L-Band System and Observations during the 2007 CLASIC Campaign. Proc. IEEE Int.Geosci. Rem. Sens. Symposium 2008. 2, pp. 7–11 (pp. II-241 - II-244).
Wilheit, T., 1978. Radiative transfer in a plane stratified dielectric. IEEE Trans. Geosci. Elec-tron. GE-16, 138–143.
Wilson,W., Yueh, S., Dinardo, S., Chazanoff, S., Kitiyakara, A., Li, F., Rahmat-Samii, Y., 2001.Passive active L- and S-band (PALS) microwave sensor for ocean salinity and soilmoisture measurements. IEEE Trans. Geosci. Rem. Sens. 39 (5), 1039–1048.