Small-scale concrete slab tests at ambient and elevated temperatures
17
Engineering Structures 29 (2007) 2775–2791 www.elsevier.com/locate/engstruct Small-scale concrete slab tests at ambient and elevated temperatures Colin G. Bailey * , Wee Siang Toh School of Mechanical, Aerospace and Civil Engineering, University of Manchester, PO Box 88, Pariser Building, Sackville Street, Manchester M60 1QD, United Kingdom Received 24 October 2006; received in revised form 16 January 2007; accepted 18 January 2007 Available online 8 March 2007 Abstract This paper presents test results of forty-eight horizontally unrestrained two-way spanning reinforced concrete slabs at ambient and elevated temperatures. The tests allowed a direct comparison between the modes of failure observed at ambient and elevated temperatures. Both mild steel and stainless-steel welded smooth wire meshes, with varying bar diameters and spacing, were used as reinforcement. The tests at ambient temperature showed that slabs with low reinforcement ratio failed by fracture of reinforcement at the centre of the slab either across the shorter span for the rectangular slabs or across one of the spans for the square slabs. It was found that increasing the reinforcement ratio led to the compressive failure of concrete at the corners of the slabs. Repeating the tests at elevated temperatures showed that all the slabs failed by fracture of reinforcement, with displacements ranging from span/12 to span/6. The results showed clearly that membrane action occurred at both ambient and elevated temperatures, and provides a wealth of data which can be used to further develop simple design methods or validate existing finite- element models. c 2007 Elsevier Ltd. All rights reserved. Keywords: Large displacements; Concrete slabs; Fire tests; Membrane action; Fracture of reinforcement 1. Introduction Interest in the tensile membrane behaviour of concrete or steel–concrete composite slabs has increased in the last decade following observations from full-scale fire tests carried out at Cardington [1–3]. It was shown from these tests that the main load-carrying mechanism during the fire was tensile membrane action of the composite floor slab comprising steel deck, mesh reinforcement and concrete. Numerous researchers [2,4–6] have carried out finite element modelling of the full-scale fire tests highlighting the importance of tensile membrane action at large displacements, and showing that typical fire engineering design based on flexural behaviour is too conservative. Tensile membrane action in concrete slabs is not a new subject, and significant experimental and theoretical research work [7–17] was carried out in the 1960s. However, due to the large displacements required to mobilise tensile membrane action, its practical application was considered to be limited. Since a fire is classed as an accidental action, * Corresponding author. Tel.: +44 0 161 306 5795. E-mail address: [email protected] (C.G. Bailey). large displacements are acceptable provided overall structural collapse or failure of fire compartmentation does not occur, which revitalised the research into tensile membrane action of floor plates. As well as the use and development of finite element models to predict tensile membrane action of floor plates in fire, simple analytical methods [3,18] have also been developed. Two basic analytical methods have been presented by Bailey [3,19–21] and Cameron and Usmani [18]. The main difference between these methods is that Bailey assumes that the slabs have no horizontal restraint and Cameron and Usmani assume that the slabs have full restraint. If the slab has no horizontal restraint then membrane action comprises tensile membrane action in the central plan area of the slab surrounded by a balancing ring of compressive membrane action. If full horizontal restraint is assumed then the whole slab can go into tensile membrane action resulting in a greater load-carrying capacity compared to an equivalent unrestrained slab. The method developed by Bailey was based on the results from Cardington [3], small-scale slab ambient tests carried out in the 1960’s [19], and a full-scale ambient test [22] carried out at the Building Research Establishment in 2000. Additional 0141-0296/$ - see front matter c 2007 Elsevier Ltd. All rights reserved. doi:10.1016/j.engstruct.2007.01.023
Transcript of Small-scale concrete slab tests at ambient and elevated temperatures
Engineering Structures 29 (2007) 2775–2791www.elsevier.com/locate/engstruct
Small-scale concrete slab tests at ambient and elevated temperatures
Colin G. Bailey∗, Wee Siang Toh
School of Mechanical, Aerospace and Civil Engineering, University of Manchester, PO Box 88, Pariser Building, Sackville Street,Manchester M60 1QD, United Kingdom
Received 24 October 2006; received in revised form 16 January 2007; accepted 18 January 2007Available online 8 March 2007
Abstract
This paper presents test results of forty-eight horizontally unrestrained two-way spanning reinforced concrete slabs at ambient and elevatedtemperatures. The tests allowed a direct comparison between the modes of failure observed at ambient and elevated temperatures. Both mildsteel and stainless-steel welded smooth wire meshes, with varying bar diameters and spacing, were used as reinforcement. The tests at ambienttemperature showed that slabs with low reinforcement ratio failed by fracture of reinforcement at the centre of the slab either across the shorterspan for the rectangular slabs or across one of the spans for the square slabs. It was found that increasing the reinforcement ratio led to thecompressive failure of concrete at the corners of the slabs. Repeating the tests at elevated temperatures showed that all the slabs failed by fractureof reinforcement, with displacements ranging from span/12 to span/6. The results showed clearly that membrane action occurred at both ambientand elevated temperatures, and provides a wealth of data which can be used to further develop simple design methods or validate existing finite-element models.c© 2007 Elsevier Ltd. All rights reserved.
Keywords: Large displacements; Concrete slabs; Fire tests; Membrane action; Fracture of reinforcement
1. Introduction
Interest in the tensile membrane behaviour of concrete orsteel–concrete composite slabs has increased in the last decadefollowing observations from full-scale fire tests carried out atCardington [1–3]. It was shown from these tests that the mainload-carrying mechanism during the fire was tensile membraneaction of the composite floor slab comprising steel deck, meshreinforcement and concrete. Numerous researchers [2,4–6]have carried out finite element modelling of the full-scale firetests highlighting the importance of tensile membrane action atlarge displacements, and showing that typical fire engineeringdesign based on flexural behaviour is too conservative.
Tensile membrane action in concrete slabs is not anew subject, and significant experimental and theoreticalresearch work [7–17] was carried out in the 1960s. However,due to the large displacements required to mobilise tensilemembrane action, its practical application was considered tobe limited. Since a fire is classed as an accidental action,
∗ Corresponding author. Tel.: +44 0 161 306 5795.E-mail address: [email protected] (C.G. Bailey).
0141-0296/$ - see front matter c© 2007 Elsevier Ltd. All rights reserved.doi:10.1016/j.engstruct.2007.01.023
large displacements are acceptable provided overall structuralcollapse or failure of fire compartmentation does not occur,which revitalised the research into tensile membrane action offloor plates.
As well as the use and development of finite element modelsto predict tensile membrane action of floor plates in fire, simpleanalytical methods [3,18] have also been developed. Two basicanalytical methods have been presented by Bailey [3,19–21]and Cameron and Usmani [18]. The main difference betweenthese methods is that Bailey assumes that the slabs have nohorizontal restraint and Cameron and Usmani assume that theslabs have full restraint. If the slab has no horizontal restraintthen membrane action comprises tensile membrane action inthe central plan area of the slab surrounded by a balancing ringof compressive membrane action. If full horizontal restraintis assumed then the whole slab can go into tensile membraneaction resulting in a greater load-carrying capacity compared toan equivalent unrestrained slab.
The method developed by Bailey was based on the resultsfrom Cardington [3], small-scale slab ambient tests carried outin the 1960’s [19], and a full-scale ambient test [22] carriedout at the Building Research Establishment in 2000. Additional
2776 C.G. Bailey, W.S. Toh / Engineering Structures 29 (2007) 2775–2791
Notation
A reinforcement area;a aspect ratio (L/ l);d average effective depth of reinforcement;e enhancement above the yield-line load due to
membrane action;f0.2p 0.2% proof strength of stainless steel reinforce-
ment;fcu compressive cube strength of concrete;fy yield strength of reinforcement;fu ultimate strength of reinforcement;H measured depth of slab;L longer span of rectangular slab;LR load ratio;l shorter span of rectangular slab;M moment capacity of slab in the longer span;P theoretical yield-line load;Ptest maximum test load;PT c theoretical yield-line load based on recorded
temperature distribution at failure;TBot temperature on bottom surface of slab at failure;TMesh average temperature of mesh at failure;TTop temperature on top surface of slab at failure;∆Fire maximum vertical displacement at failure for
elevated temperature tests;∆max vertical displacement at maximum sustained load
for ambient temperature tests;w central vertical deflection;ρ reinforcement ratio;Ø diameter of bar;µ coefficient of orthotropy.
small-scale tests were carried out recently by Foster et al. [23,24], both at ambient and elevated temperatures. The elevatedtemperature tests [24] conducted by Foster et al. were loadedsignificantly above the yield-line load, with one slab havingan applied static load of 2.8 times the yield capacity, beforethe slabs were subjected to heating. Applying such a highload to the slabs forces them into membrane action beforethe slabs were heated which resulted in unrealistic behaviourand low reinforcement failure temperatures. Foster et al. alsoconcluded that the failure mode witnessed from their tests didnot conform to that assumed in the simplified design method [3]comprising of fracture across the shorter span of a rectangularslab or one of the spans of a square slab. This conclusion wassomewhat surprising, contradicting the basic understanding ofmembrane action in unrestrained slabs and could have been dueto the fact that the slabs were over-loaded before they wereheated. To investigate the failure modes further, and to extendthe experimental database to provide benchmark data for boththe analytical method and finite element models, further testswere carried out on unrestrained slabs at ambient and elevatedtemperatures. The small-scale tests reported in this paper havea greater span/depth ratio (target value of 55 compared to amaximum of 40 used in previous tests) and used welded mesh
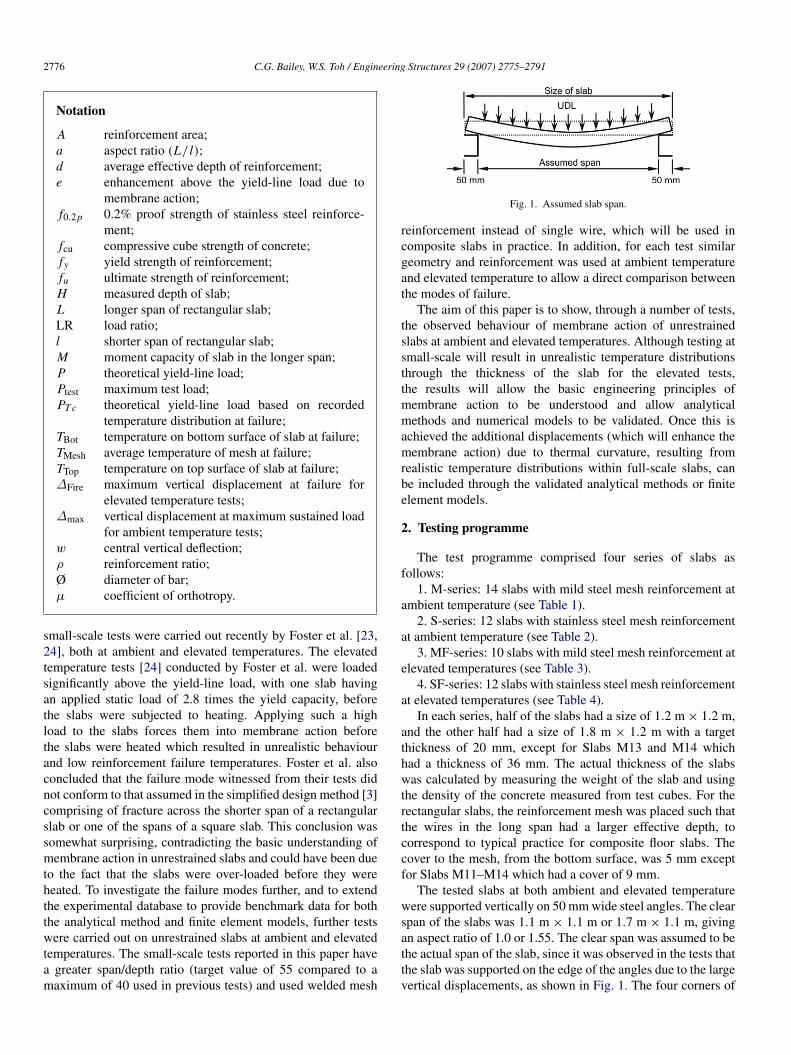
Fig. 1. Assumed slab span.
reinforcement instead of single wire, which will be used incomposite slabs in practice. In addition, for each test similargeometry and reinforcement was used at ambient temperatureand elevated temperature to allow a direct comparison betweenthe modes of failure.
The aim of this paper is to show, through a number of tests,the observed behaviour of membrane action of unrestrainedslabs at ambient and elevated temperatures. Although testing atsmall-scale will result in unrealistic temperature distributionsthrough the thickness of the slab for the elevated tests,the results will allow the basic engineering principles ofmembrane action to be understood and allow analyticalmethods and numerical models to be validated. Once this isachieved the additional displacements (which will enhance themembrane action) due to thermal curvature, resulting fromrealistic temperature distributions within full-scale slabs, canbe included through the validated analytical methods or finiteelement models.
2. Testing programme
The test programme comprised four series of slabs asfollows:
1. M-series: 14 slabs with mild steel mesh reinforcement atambient temperature (see Table 1).
2. S-series: 12 slabs with stainless steel mesh reinforcementat ambient temperature (see Table 2).
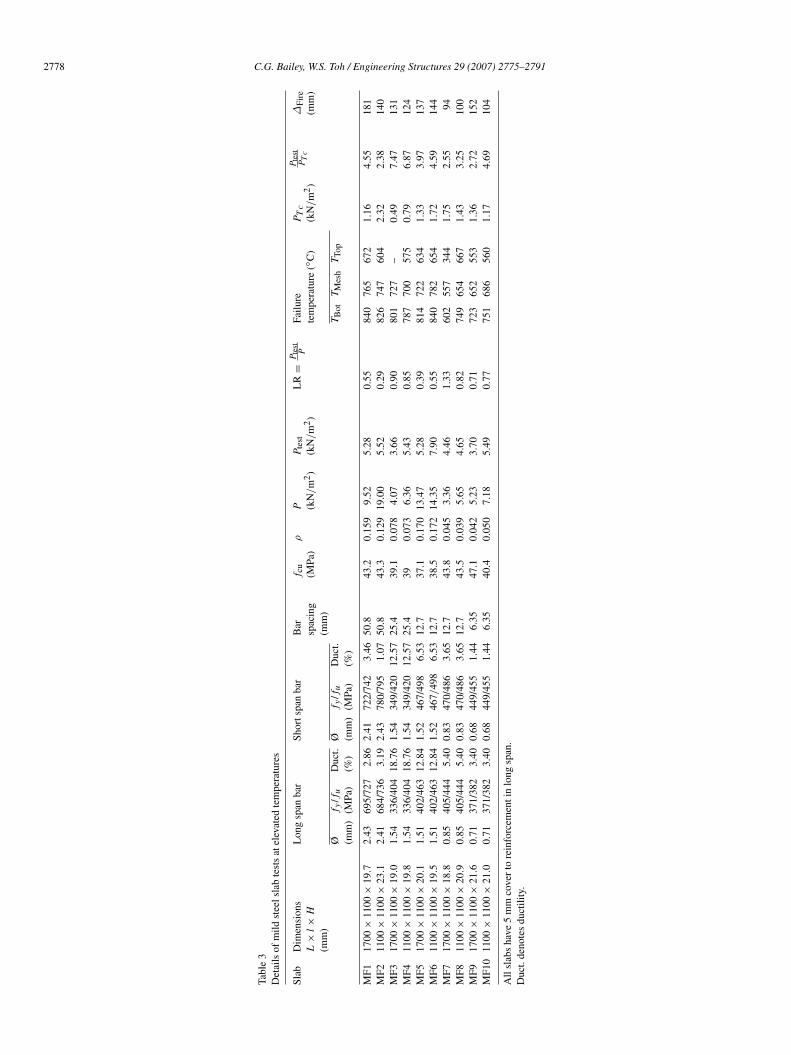
3. MF-series: 10 slabs with mild steel mesh reinforcement atelevated temperatures (see Table 3).
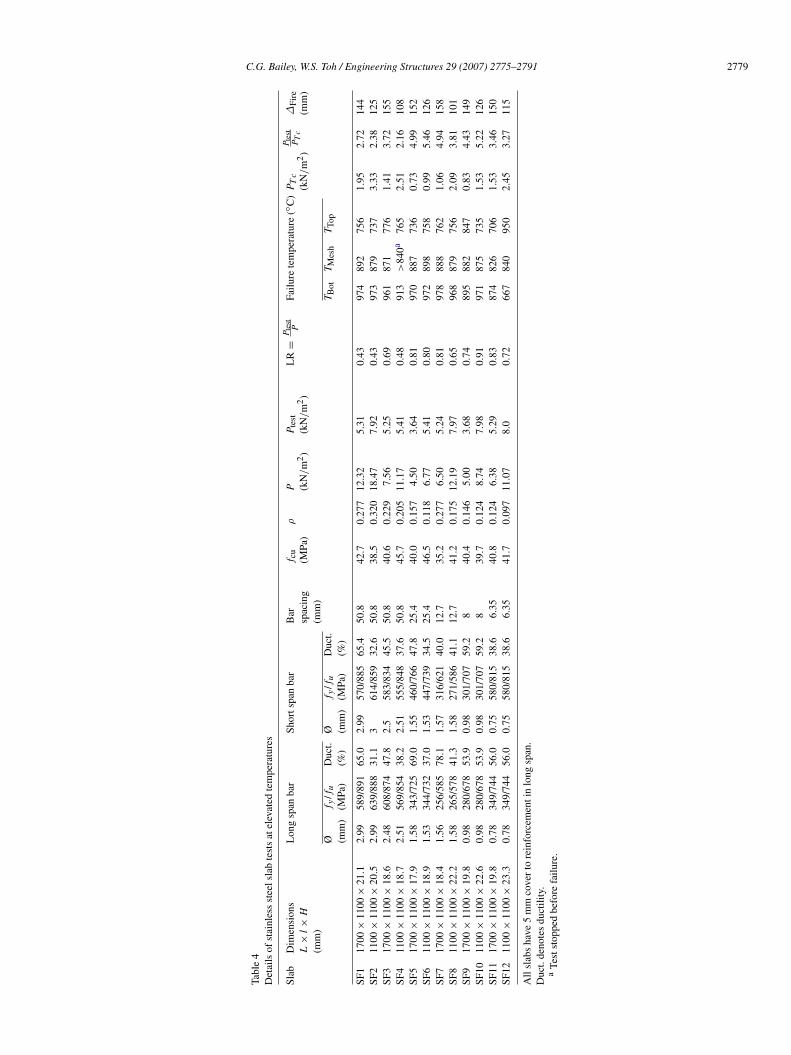
4. SF-series: 12 slabs with stainless steel mesh reinforcementat elevated temperatures (see Table 4).
In each series, half of the slabs had a size of 1.2 m × 1.2 m,and the other half had a size of 1.8 m × 1.2 m with a targetthickness of 20 mm, except for Slabs M13 and M14 whichhad a thickness of 36 mm. The actual thickness of the slabswas calculated by measuring the weight of the slab and usingthe density of the concrete measured from test cubes. For therectangular slabs, the reinforcement mesh was placed such thatthe wires in the long span had a larger effective depth, tocorrespond to typical practice for composite floor slabs. Thecover to the mesh, from the bottom surface, was 5 mm exceptfor Slabs M11–M14 which had a cover of 9 mm.
The tested slabs at both ambient and elevated temperaturewere supported vertically on 50 mm wide steel angles. The clearspan of the slabs was 1.1 m × 1.1 m or 1.7 m × 1.1 m, givingan aspect ratio of 1.0 or 1.55. The clear span was assumed to bethe actual span of the slab, since it was observed in the tests thatthe slab was supported on the edge of the angles due to the largevertical displacements, as shown in Fig. 1. The four corners of
C.G. Bailey, W.S. Toh / Engineering Structures 29 (2007) 2775–2791 2777
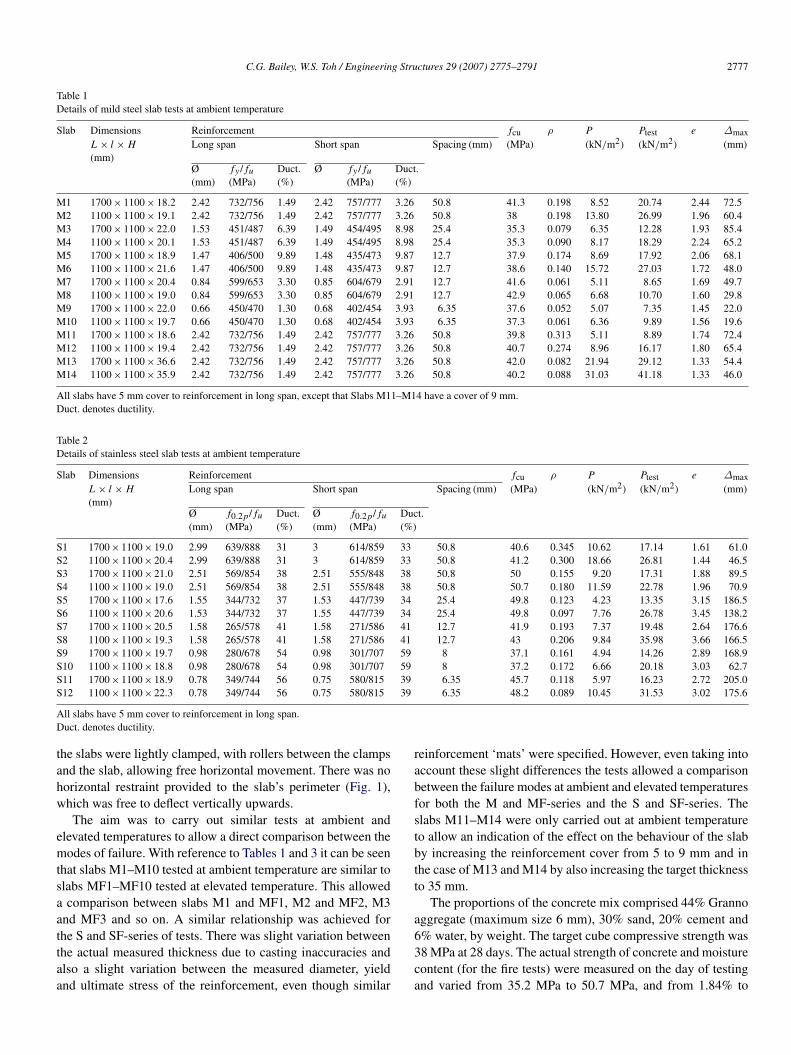
Table 1Details of mild steel slab tests at ambient temperature
Slab Dimensions Reinforcement fcu ρ P Ptest e ∆maxL × l × H(mm)
Long span Short span Spacing (mm) (MPa) (kN/m2) (kN/m2) (mm)
Ø fy / fu Duct. Ø fy / fu Duct.(mm) (MPa) (%) (MPa) (%)
M1 1700 × 1100 × 18.2 2.42 732/756 1.49 2.42 757/777 3.26 50.8 41.3 0.198 8.52 20.74 2.44 72.5M2 1100 × 1100 × 19.1 2.42 732/756 1.49 2.42 757/777 3.26 50.8 38 0.198 13.80 26.99 1.96 60.4M3 1700 × 1100 × 22.0 1.53 451/487 6.39 1.49 454/495 8.98 25.4 35.3 0.079 6.35 12.28 1.93 85.4M4 1100 × 1100 × 20.1 1.53 451/487 6.39 1.49 454/495 8.98 25.4 35.3 0.090 8.17 18.29 2.24 65.2M5 1700 × 1100 × 18.9 1.47 406/500 9.89 1.48 435/473 9.87 12.7 37.9 0.174 8.69 17.92 2.06 68.1M6 1100 × 1100 × 21.6 1.47 406/500 9.89 1.48 435/473 9.87 12.7 38.6 0.140 15.72 27.03 1.72 48.0M7 1700 × 1100 × 20.4 0.84 599/653 3.30 0.85 604/679 2.91 12.7 41.6 0.061 5.11 8.65 1.69 49.7M8 1100 × 1100 × 19.0 0.84 599/653 3.30 0.85 604/679 2.91 12.7 42.9 0.065 6.68 10.70 1.60 29.8M9 1700 × 1100 × 22.0 0.66 450/470 1.30 0.68 402/454 3.93 6.35 37.6 0.052 5.07 7.35 1.45 22.0M10 1100 × 1100 × 19.7 0.66 450/470 1.30 0.68 402/454 3.93 6.35 37.3 0.061 6.36 9.89 1.56 19.6M11 1700 × 1100 × 18.6 2.42 732/756 1.49 2.42 757/777 3.26 50.8 39.8 0.313 5.11 8.89 1.74 72.4M12 1100 × 1100 × 19.4 2.42 732/756 1.49 2.42 757/777 3.26 50.8 40.7 0.274 8.96 16.17 1.80 65.4M13 1700 × 1100 × 36.6 2.42 732/756 1.49 2.42 757/777 3.26 50.8 42.0 0.082 21.94 29.12 1.33 54.4M14 1100 × 1100 × 35.9 2.42 732/756 1.49 2.42 757/777 3.26 50.8 40.2 0.088 31.03 41.18 1.33 46.0
All slabs have 5 mm cover to reinforcement in long span, except that Slabs M11–M14 have a cover of 9 mm.Duct. denotes ductility.
Table 2Details of stainless steel slab tests at ambient temperature
Slab Dimensions Reinforcement fcu ρ P Ptest e ∆maxL × l × H(mm)
Long span Short span Spacing (mm) (MPa) (kN/m2) (kN/m2) (mm)
Ø f0.2p / fu Duct. Ø f0.2p / fu Duct.(mm) (MPa) (%) (mm) (MPa) (%)
S1 1700 × 1100 × 19.0 2.99 639/888 31 3 614/859 33 50.8 40.6 0.345 10.62 17.14 1.61 61.0S2 1100 × 1100 × 20.4 2.99 639/888 31 3 614/859 33 50.8 41.2 0.300 18.66 26.81 1.44 46.5S3 1700 × 1100 × 21.0 2.51 569/854 38 2.51 555/848 38 50.8 50 0.155 9.20 17.31 1.88 89.5S4 1100 × 1100 × 19.0 2.51 569/854 38 2.51 555/848 38 50.8 50.7 0.180 11.59 22.78 1.96 70.9S5 1700 × 1100 × 17.6 1.55 344/732 37 1.53 447/739 34 25.4 49.8 0.123 4.23 13.35 3.15 186.5S6 1100 × 1100 × 20.6 1.53 344/732 37 1.55 447/739 34 25.4 49.8 0.097 7.76 26.78 3.45 138.2S7 1700 × 1100 × 20.5 1.58 265/578 41 1.58 271/586 41 12.7 41.9 0.193 7.37 19.48 2.64 176.6S8 1100 × 1100 × 19.3 1.58 265/578 41 1.58 271/586 41 12.7 43 0.206 9.84 35.98 3.66 166.5S9 1700 × 1100 × 19.7 0.98 280/678 54 0.98 301/707 59 8 37.1 0.161 4.94 14.26 2.89 168.9S10 1100 × 1100 × 18.8 0.98 280/678 54 0.98 301/707 59 8 37.2 0.172 6.66 20.18 3.03 62.7S11 1700 × 1100 × 18.9 0.78 349/744 56 0.75 580/815 39 6.35 45.7 0.118 5.97 16.23 2.72 205.0S12 1100 × 1100 × 22.3 0.78 349/744 56 0.75 580/815 39 6.35 48.2 0.089 10.45 31.53 3.02 175.6
All slabs have 5 mm cover to reinforcement in long span.Duct. denotes ductility.
the slabs were lightly clamped, with rollers between the clampsand the slab, allowing free horizontal movement. There was nohorizontal restraint provided to the slab’s perimeter (Fig. 1),which was free to deflect vertically upwards.
The aim was to carry out similar tests at ambient andelevated temperatures to allow a direct comparison between themodes of failure. With reference to Tables 1 and 3 it can be seenthat slabs M1–M10 tested at ambient temperature are similar toslabs MF1–MF10 tested at elevated temperature. This alloweda comparison between slabs M1 and MF1, M2 and MF2, M3and MF3 and so on. A similar relationship was achieved forthe S and SF-series of tests. There was slight variation betweenthe actual measured thickness due to casting inaccuracies andalso a slight variation between the measured diameter, yieldand ultimate stress of the reinforcement, even though similar
reinforcement ‘mats’ were specified. However, even taking intoaccount these slight differences the tests allowed a comparisonbetween the failure modes at ambient and elevated temperaturesfor both the M and MF-series and the S and SF-series. Theslabs M11–M14 were only carried out at ambient temperatureto allow an indication of the effect on the behaviour of the slabby increasing the reinforcement cover from 5 to 9 mm and inthe case of M13 and M14 by also increasing the target thicknessto 35 mm.
The proportions of the concrete mix comprised 44% Grannoaggregate (maximum size 6 mm), 30% sand, 20% cement and6% water, by weight. The target cube compressive strength was38 MPa at 28 days. The actual strength of concrete and moisturecontent (for the fire tests) were measured on the day of testingand varied from 35.2 MPa to 50.7 MPa, and from 1.84% to
2778 C.G. Bailey, W.S. Toh / Engineering Structures 29 (2007) 2775–2791
Tabl
e3
Det
ails
ofm
ildst
eels
lab
test
sat
elev
ated
tem
pera
ture
s
Slab
Dim
ensi
ons
L×
l×H
(mm
)
Lon
gsp
anba
rSh
orts
pan
bar
Bar
spac
ing
(mm
)
f cu
(MPa
)
ρP (k
N/m
2 )P t
est
(kN
/m
2 )L
R=
P tes
tP
Failu
rete
mpe
ratu
re(◦
C)
P Tc
(kN
/m
2 )
P tes
tP T
c∆
Fire
(mm
)
Øf y
/fu
Duc
t.Ø
f y/f
uD
uct.
T Bot
T Mes
hT T
op(m
m)
(MPa
)(%
)(m
m)
(MPa
)(%
)
MF1
1700
×11
00×
19.7
2.43
695/
727
2.86
2.41
722/
742
3.46
50.8
43.2
0.15
99.
525.
280.
5584
076
567
21.
164.
5518
1M
F211
00×
1100
×23
.12.
4168
4/73
63.
192.
4378
0/79
51.
0750
.843
.30.
129
19.0
05.
520.
2982
674
760
42.
322.
3814
0M
F317
00×
1100
×19
.01.
5433
6/40
418
.76
1.54
349/
420
12.5
725
.439
.10.
078
4.07
3.66
0.90
801
727
–0.
497.
4713
1M
F411
00×
1100
×19
.81.
5433
6/40
418
.76
1.54
349/
420
12.5
725
.439
0.07
36.
365.
430.
8578
770
057
50.
796.
8712
4M
F517
00×
1100
×20
.11.
5140
2/46
312
.84
1.52
467/
498
6.53
12.7
37.1
0.17
013
.47
5.28
0.39
814
722
634
1.33
3.97
137
MF6
1100
×11
00×
19.5
1.51
402/
463
12.8
41.
5246
7/49
86.
5312
.738
.50.
172
14.3
57.
900.
5584
078
265
41.
724.
5914
4M
F717
00×
1100
×18
.80.
8540
5/44
45.
400.
8347
0/48
63.
6512
.743
.80.
045
3.36
4.46
1.33
602
557
344
1.75
2.55
94M
F811
00×
1100
×20
.90.
8540
5/44
45.
400.
8347
0/48
63.
6512
.743
.50.
039
5.65
4.65
0.82
749
654
667
1.43
3.25
100
MF9
1700
×11
00×
21.6
0.71
371/
382
3.40
0.68
449/
455
1.44
6.35
47.1
0.04
25.
233.
700.
7172
365
255
31.
362.
7215
2M
F10
1100
×11
00×
21.0
0.71
371/
382
3.40
0.68
449/
455
1.44
6.35
40.4
0.05
07.
185.
490.
7775
168
656
01.
174.
6910
4
All
slab
sha
ve5
mm
cove
rto
rein
forc
emen
tin
long
span
.D
uct.
deno
tes
duct
ility
.
C.G. Bailey, W.S. Toh / Engineering Structures 29 (2007) 2775–2791 2779
Tabl
e4
Det
ails
ofst
ainl
ess
stee
lsla
bte
sts
atel
evat
edte
mpe
ratu
res
Slab
Dim
ensi
ons
L×
l×H
(mm
)
Lon
gsp
anba
rSh
orts
pan
bar
Bar
spac
ing
(mm
)
f cu
(MPa
)
ρP (k
N/m
2 )P t
est
(kN
/m
2 )L
R=
P tes
tP
Failu
rete
mpe
ratu
re(◦
C)
P Tc
(kN
/m
2 )
P tes
tP T
c∆
Fire
(mm
)
Øf y
/fu
Duc
t.Ø
f y/f
uD
uct.
T Bot
T Mes
hT T
op(m
m)
(MPa
)(%
)(m
m)
(MPa
)(%
)
SF1
1700
×11
00×
21.1
2.99
589/
891
65.0
2.99
570/
885
65.4
50.8
42.7
0.27
712
.32
5.31
0.43
974
892
756
1.95
2.72
144
SF2
1100
×11
00×
20.5
2.99
639/
888
31.1
361
4/85
932
.650
.838
.50.
320
18.4
77.
920.
4397
387
973
73.
332.
3812
5SF
317
00×
1100
×18
.62.
4860
8/87
447
.82.
558
3/83
445
.550
.840
.60.
229
7.56
5.25
0.69
961
871
776
1.41
3.72
155
SF4
1100
×11
00×
18.7
2.51
569/
854
38.2
2.51
555/
848
37.6
50.8
45.7
0.20
511
.17
5.41
0.48
913
>84
0a76
52.
512.
1610
8SF
517
00×
1100
×17
.91.
5834
3/72
569
.01.
5546
0/76
647
.825
.440
.00.
157
4.50
3.64
0.81
970
887
736
0.73
4.99
152
SF6
1100
×11
00×
18.9
1.53
344/
732
37.0
1.53
447/
739
34.5
25.4
46.5
0.11
86.
775.
410.
8097
289
875
80.
995.
4612
6SF
717
00×
1100
×18
.41.
5625
6/58
578
.11.
5731
6/62
140
.012
.735
.20.
277
6.50
5.24
0.81
978
888
762
1.06
4.94
158
SF8
1100
×11
00×
22.2
1.58
265/
578
41.3
1.58
271/
586
41.1
12.7
41.2
0.17
512
.19
7.97
0.65
968
879
756
2.09
3.81
101
SF9
1700
×11
00×
19.8
0.98
280/
678
53.9
0.98
301/
707
59.2
840
.40.
146
5.00
3.68
0.74
895
882
847
0.83
4.43
149
SF10
1100
×11
00×
22.6
0.98
280/
678
53.9
0.98
301/
707
59.2
839
.70.
124
8.74
7.98
0.91
971
875
735
1.53
5.22
126
SF11
1700
×11
00×
19.8
0.78
349/
744
56.0
0.75
580/
815
38.6
6.35
40.8
0.12
46.
385.
290.
8387
482
670
61.
533.
4615
0SF
1211
00×
1100
×23
.30.
7834
9/74
456
.00.
7558
0/81
538
.66.
3541
.70.
097
11.0
78.
00.
7266
784
095
02.
453.
2711
5
All
slab
sha
ve5
mm
cove
rto
rein
forc
emen
tin
long
span
.D
uct.
deno
tes
duct
ility
.a
Test
stop
ped
befo
refa
ilure
.
2780 C.G. Bailey, W.S. Toh / Engineering Structures 29 (2007) 2775–2791
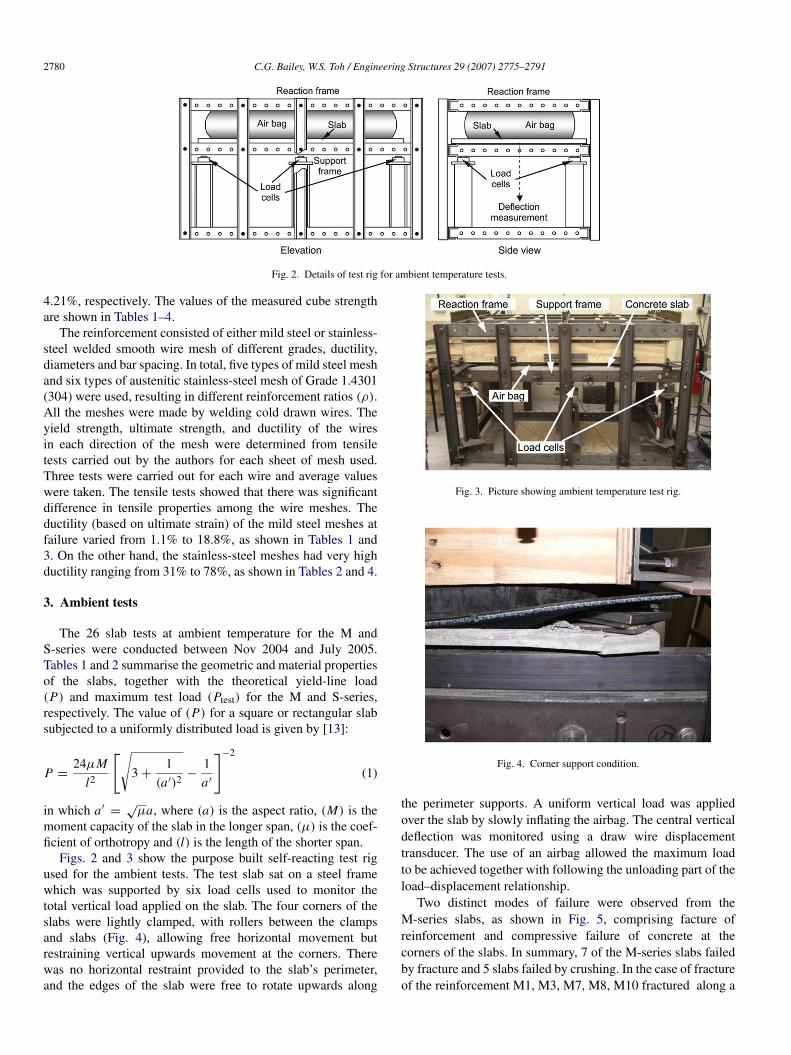
Fig. 2. Details of test rig for ambient temperature tests.
4.21%, respectively. The values of the measured cube strengthare shown in Tables 1–4.
The reinforcement consisted of either mild steel or stainless-steel welded smooth wire mesh of different grades, ductility,diameters and bar spacing. In total, five types of mild steel meshand six types of austenitic stainless-steel mesh of Grade 1.4301(304) were used, resulting in different reinforcement ratios (ρ).All the meshes were made by welding cold drawn wires. Theyield strength, ultimate strength, and ductility of the wiresin each direction of the mesh were determined from tensiletests carried out by the authors for each sheet of mesh used.Three tests were carried out for each wire and average valueswere taken. The tensile tests showed that there was significantdifference in tensile properties among the wire meshes. Theductility (based on ultimate strain) of the mild steel meshes atfailure varied from 1.1% to 18.8%, as shown in Tables 1 and3. On the other hand, the stainless-steel meshes had very highductility ranging from 31% to 78%, as shown in Tables 2 and 4.
3. Ambient tests
The 26 slab tests at ambient temperature for the M andS-series were conducted between Nov 2004 and July 2005.Tables 1 and 2 summarise the geometric and material propertiesof the slabs, together with the theoretical yield-line load(P) and maximum test load (Ptest) for the M and S-series,respectively. The value of (P) for a square or rectangular slabsubjected to a uniformly distributed load is given by [13]:
P =24µM
l2
[√3 +
1(a′)2 −
1a′
]−2
(1)
in which a′=
õa, where (a) is the aspect ratio, (M) is the
moment capacity of the slab in the longer span, (µ) is the coef-ficient of orthotropy and (l) is the length of the shorter span.
Figs. 2 and 3 show the purpose built self-reacting test rigused for the ambient tests. The test slab sat on a steel framewhich was supported by six load cells used to monitor thetotal vertical load applied on the slab. The four corners of theslabs were lightly clamped, with rollers between the clampsand slabs (Fig. 4), allowing free horizontal movement butrestraining vertical upwards movement at the corners. Therewas no horizontal restraint provided to the slab’s perimeter,and the edges of the slab were free to rotate upwards along
Fig. 3. Picture showing ambient temperature test rig.
Fig. 4. Corner support condition.
the perimeter supports. A uniform vertical load was appliedover the slab by slowly inflating the airbag. The central verticaldeflection was monitored using a draw wire displacementtransducer. The use of an airbag allowed the maximum loadto be achieved together with following the unloading part of theload–displacement relationship.
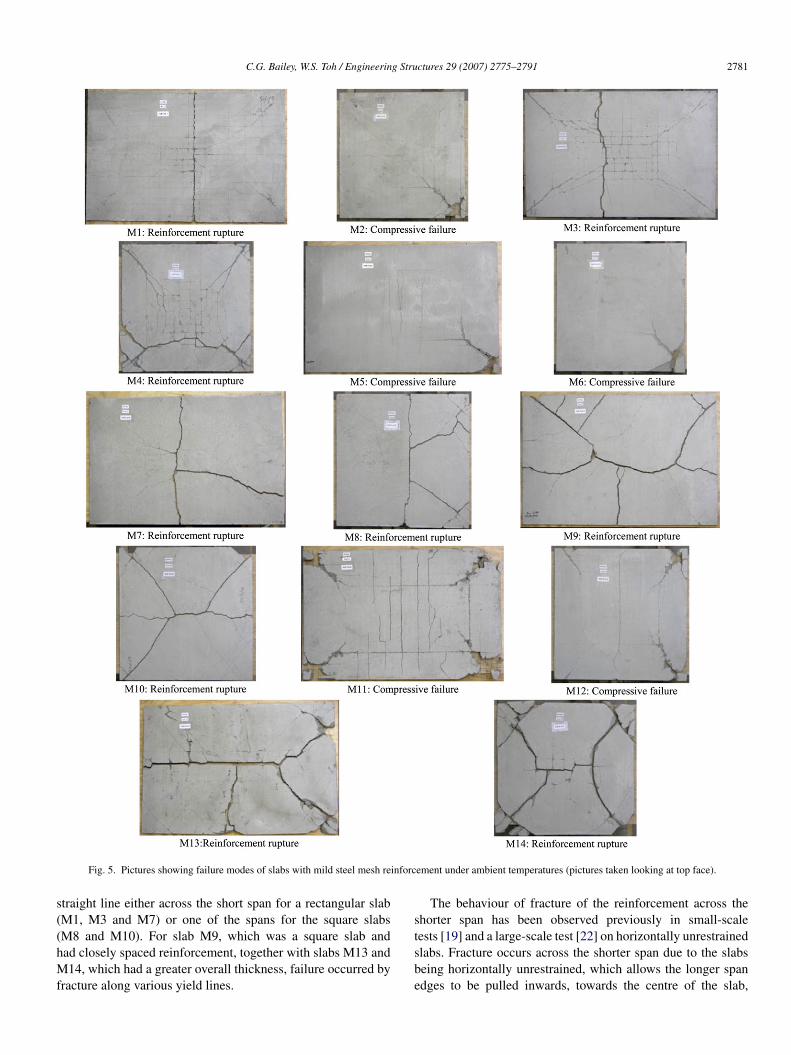
Two distinct modes of failure were observed from theM-series slabs, as shown in Fig. 5, comprising facture ofreinforcement and compressive failure of concrete at thecorners of the slabs. In summary, 7 of the M-series slabs failedby fracture and 5 slabs failed by crushing. In the case of fractureof the reinforcement M1, M3, M7, M8, M10 fractured along a
C.G. Bailey, W.S. Toh / Engineering Structures 29 (2007) 2775–2791 2781
Fig. 5. Pictures showing failure modes of slabs with mild steel mesh reinforcement under ambient temperatures (pictures taken looking at top face).
straight line either across the short span for a rectangular slab(M1, M3 and M7) or one of the spans for the square slabs(M8 and M10). For slab M9, which was a square slab andhad closely spaced reinforcement, together with slabs M13 andM14, which had a greater overall thickness, failure occurred byfracture along various yield lines.
The behaviour of fracture of the reinforcement across theshorter span has been observed previously in small-scaletests [19] and a large-scale test [22] on horizontally unrestrainedslabs. Fracture occurs across the shorter span due to the slabsbeing horizontally unrestrained, which allows the longer spanedges to be pulled inwards, towards the centre of the slab,
2782 C.G. Bailey, W.S. Toh / Engineering Structures 29 (2007) 2775–2791
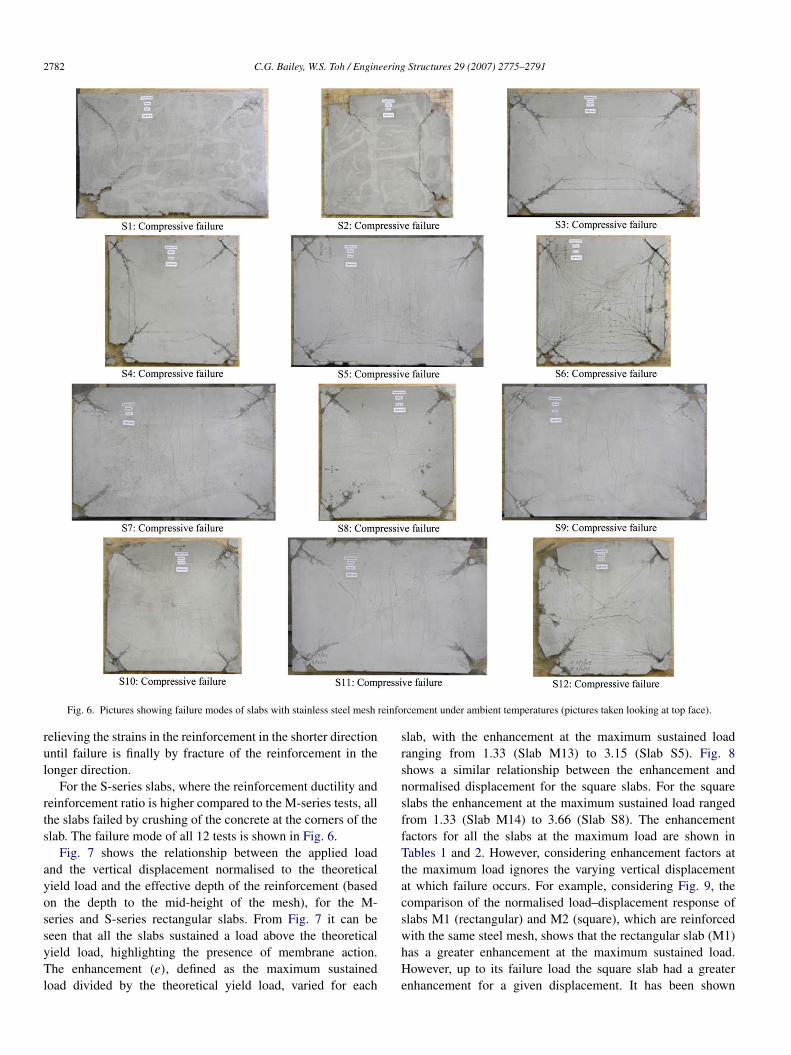
Fig. 6. Pictures showing failure modes of slabs with stainless steel mesh reinforcement under ambient temperatures (pictures taken looking at top face).
relieving the strains in the reinforcement in the shorter directionuntil failure is finally by fracture of the reinforcement in thelonger direction.
For the S-series slabs, where the reinforcement ductility andreinforcement ratio is higher compared to the M-series tests, allthe slabs failed by crushing of the concrete at the corners of theslab. The failure mode of all 12 tests is shown in Fig. 6.
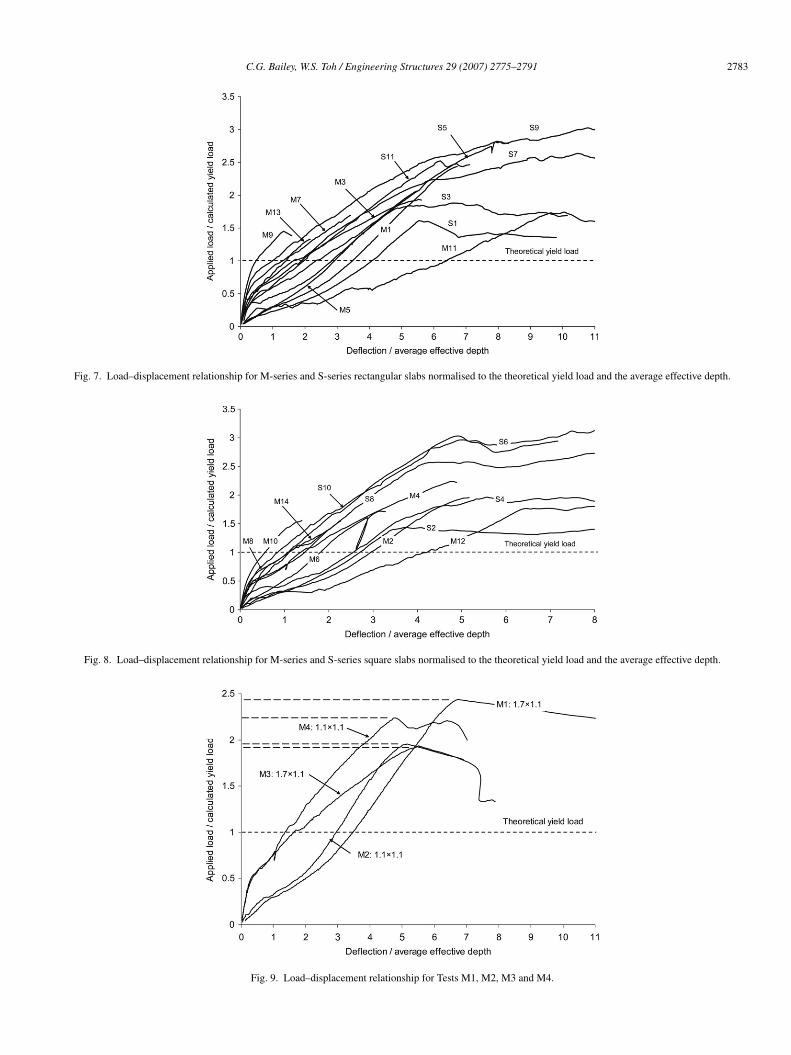
Fig. 7 shows the relationship between the applied loadand the vertical displacement normalised to the theoreticalyield load and the effective depth of the reinforcement (basedon the depth to the mid-height of the mesh), for the M-series and S-series rectangular slabs. From Fig. 7 it can beseen that all the slabs sustained a load above the theoreticalyield load, highlighting the presence of membrane action.The enhancement (e), defined as the maximum sustainedload divided by the theoretical yield load, varied for each
slab, with the enhancement at the maximum sustained loadranging from 1.33 (Slab M13) to 3.15 (Slab S5). Fig. 8shows a similar relationship between the enhancement andnormalised displacement for the square slabs. For the squareslabs the enhancement at the maximum sustained load rangedfrom 1.33 (Slab M14) to 3.66 (Slab S8). The enhancementfactors for all the slabs at the maximum load are shown inTables 1 and 2. However, considering enhancement factors atthe maximum load ignores the varying vertical displacementat which failure occurs. For example, considering Fig. 9, thecomparison of the normalised load–displacement response ofslabs M1 (rectangular) and M2 (square), which are reinforcedwith the same steel mesh, shows that the rectangular slab (M1)has a greater enhancement at the maximum sustained load.However, up to its failure load the square slab had a greaterenhancement for a given displacement. It has been shown
C.G. Bailey, W.S. Toh / Engineering Structures 29 (2007) 2775–2791 2783
Fig. 7. Load–displacement relationship for M-series and S-series rectangular slabs normalised to the theoretical yield load and the average effective depth.
Fig. 8. Load–displacement relationship for M-series and S-series square slabs normalised to the theoretical yield load and the average effective depth.
Fig. 9. Load–displacement relationship for Tests M1, M2, M3 and M4.
2784 C.G. Bailey, W.S. Toh / Engineering Structures 29 (2007) 2775–2791
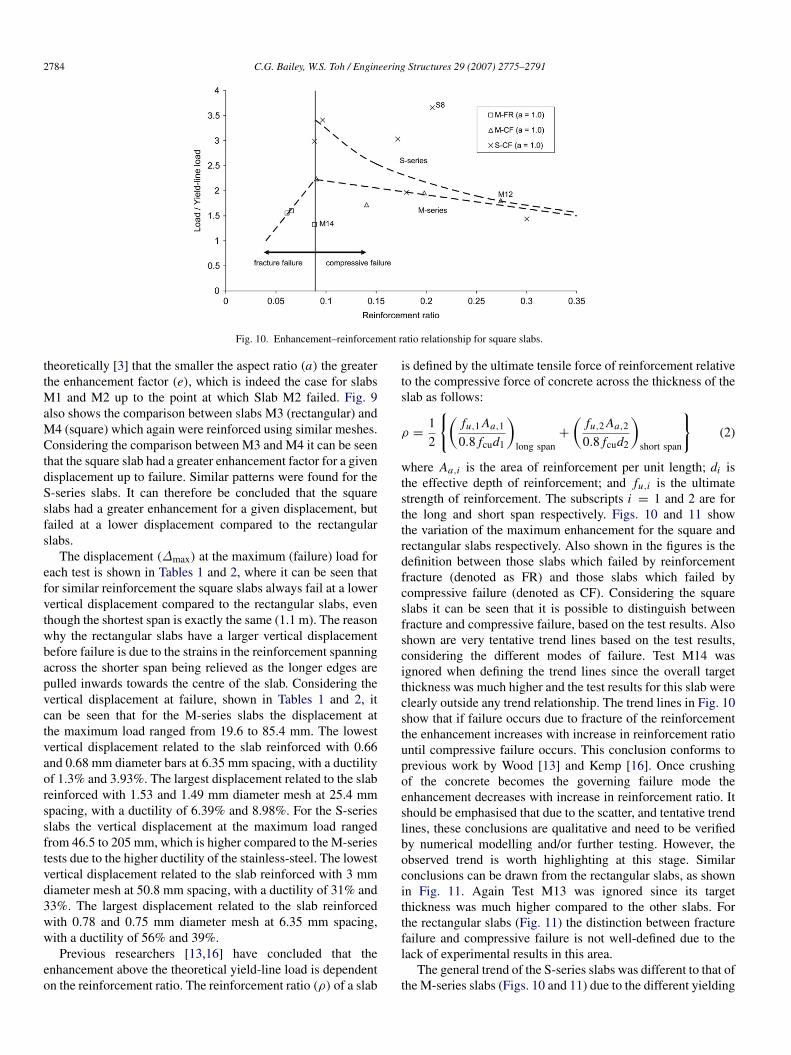
Fig. 10. Enhancement–reinforcement ratio relationship for square slabs.
theoretically [3] that the smaller the aspect ratio (a) the greaterthe enhancement factor (e), which is indeed the case for slabsM1 and M2 up to the point at which Slab M2 failed. Fig. 9also shows the comparison between slabs M3 (rectangular) andM4 (square) which again were reinforced using similar meshes.Considering the comparison between M3 and M4 it can be seenthat the square slab had a greater enhancement factor for a givendisplacement up to failure. Similar patterns were found for theS-series slabs. It can therefore be concluded that the squareslabs had a greater enhancement for a given displacement, butfailed at a lower displacement compared to the rectangularslabs.
The displacement (∆max) at the maximum (failure) load foreach test is shown in Tables 1 and 2, where it can be seen thatfor similar reinforcement the square slabs always fail at a lowervertical displacement compared to the rectangular slabs, eventhough the shortest span is exactly the same (1.1 m). The reasonwhy the rectangular slabs have a larger vertical displacementbefore failure is due to the strains in the reinforcement spanningacross the shorter span being relieved as the longer edges arepulled inwards towards the centre of the slab. Considering thevertical displacement at failure, shown in Tables 1 and 2, itcan be seen that for the M-series slabs the displacement atthe maximum load ranged from 19.6 to 85.4 mm. The lowestvertical displacement related to the slab reinforced with 0.66and 0.68 mm diameter bars at 6.35 mm spacing, with a ductilityof 1.3% and 3.93%. The largest displacement related to the slabreinforced with 1.53 and 1.49 mm diameter mesh at 25.4 mmspacing, with a ductility of 6.39% and 8.98%. For the S-seriesslabs the vertical displacement at the maximum load rangedfrom 46.5 to 205 mm, which is higher compared to the M-seriestests due to the higher ductility of the stainless-steel. The lowestvertical displacement related to the slab reinforced with 3 mmdiameter mesh at 50.8 mm spacing, with a ductility of 31% and33%. The largest displacement related to the slab reinforcedwith 0.78 and 0.75 mm diameter mesh at 6.35 mm spacing,with a ductility of 56% and 39%.
Previous researchers [13,16] have concluded that theenhancement above the theoretical yield-line load is dependenton the reinforcement ratio. The reinforcement ratio (ρ) of a slab
is defined by the ultimate tensile force of reinforcement relativeto the compressive force of concrete across the thickness of theslab as follows:
ρ =12
{(fu,1 Aa,1
0.8 fcud1
)long span
+
(fu,2 Aa,2
0.8 fcud2
)short span
}(2)
where Aa,i is the area of reinforcement per unit length; di isthe effective depth of reinforcement; and fu,i is the ultimatestrength of reinforcement. The subscripts i = 1 and 2 are forthe long and short span respectively. Figs. 10 and 11 showthe variation of the maximum enhancement for the square andrectangular slabs respectively. Also shown in the figures is thedefinition between those slabs which failed by reinforcementfracture (denoted as FR) and those slabs which failed bycompressive failure (denoted as CF). Considering the squareslabs it can be seen that it is possible to distinguish betweenfracture and compressive failure, based on the test results. Alsoshown are very tentative trend lines based on the test results,considering the different modes of failure. Test M14 wasignored when defining the trend lines since the overall targetthickness was much higher and the test results for this slab wereclearly outside any trend relationship. The trend lines in Fig. 10show that if failure occurs due to fracture of the reinforcementthe enhancement increases with increase in reinforcement ratiountil compressive failure occurs. This conclusion conforms toprevious work by Wood [13] and Kemp [16]. Once crushingof the concrete becomes the governing failure mode theenhancement decreases with increase in reinforcement ratio. Itshould be emphasised that due to the scatter, and tentative trendlines, these conclusions are qualitative and need to be verifiedby numerical modelling and/or further testing. However, theobserved trend is worth highlighting at this stage. Similarconclusions can be drawn from the rectangular slabs, as shownin Fig. 11. Again Test M13 was ignored since its targetthickness was much higher compared to the other slabs. Forthe rectangular slabs (Fig. 11) the distinction between fracturefailure and compressive failure is not well-defined due to thelack of experimental results in this area.
The general trend of the S-series slabs was different to that ofthe M-series slabs (Figs. 10 and 11) due to the different yielding

C.G. Bailey, W.S. Toh / Engineering Structures 29 (2007) 2775–2791 2785
Fig. 11. Enhancement–reinforcement ratio relationship for rectangular slabs.
Fig. 12. Details of elevated temperature tests.
characteristics of stainless-steel compared to the mild steel.The stainless-steel had a non-linear stress–strain relationshipwith no well-defined yield stress. In this study, the 0.2% proofstrength was taken as the yield strength of the stainless-steelmeshes in the calculation of the yield-line load of the slabs.As given in Table 2, the ratios of ultimate strength fu to f0.2pof the stainless-steel meshes range from 1.39 to 2.42, whereasthe ratios of fu to fy of the mild steel meshes range from 1.03to 1.23 as shown in Table 1. Extensive numerical modelling iscurrently underway to support the observed trends in Figs. 10and 11.
Tests M1, M2, M11, M12, M13 and M14 were reinforcedwith the same mesh (Table 1). Tests M11 and M12 had anincreased cover from 5 to 9 mm and Tests M13 and M14 had anincreased thickness with a cover of 9 mm. By comparing TestM1 with M11 and M2 with M13 (Table 1) increasing the coverdecreases the enhancement (e) of membrane action above thetheoretical yield-line load. In addition, by comparing M11 withM13 and M12 with M14 shows that increasing the thickness ofthe slab also reduces the enhancement (e).
4. Elevated temperature tests
The 22 slab tests at elevated temperatures for the MF andSF-series, consisting of the same slab geometry adopted in the
Fig. 13. Picture showing loading arrangement for elevated temperature tests.
ambient tests and adopting the similar support conditions, werecarried out between Sep 2005 and Jun 2006. The aim of the firetests was to compare the modes of failure with those observedfor similar slabs tested at ambient temperature under increasingload. All the fire tests were carried out under a transient heatingstate, with a predefined uniform working load (Ptest) applied onthe top surface of the slab by using dead weights (each weighing56 lbs, 0.25 kN) as shown in Figs. 12 and 13. The applied loadremained constant and failure was due to heating.
2786 C.G. Bailey, W.S. Toh / Engineering Structures 29 (2007) 2775–2791
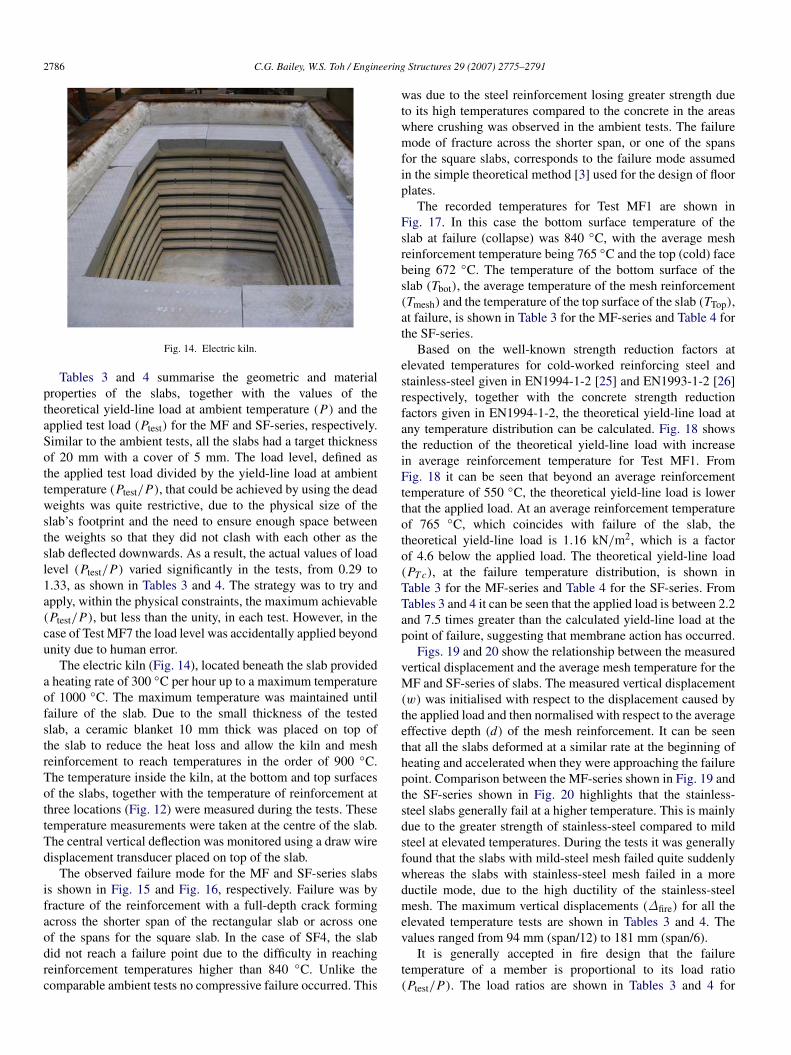
Fig. 14. Electric kiln.
Tables 3 and 4 summarise the geometric and materialproperties of the slabs, together with the values of thetheoretical yield-line load at ambient temperature (P) and theapplied test load (Ptest) for the MF and SF-series, respectively.Similar to the ambient tests, all the slabs had a target thicknessof 20 mm with a cover of 5 mm. The load level, defined asthe applied test load divided by the yield-line load at ambienttemperature (Ptest/P), that could be achieved by using the deadweights was quite restrictive, due to the physical size of theslab’s footprint and the need to ensure enough space betweenthe weights so that they did not clash with each other as theslab deflected downwards. As a result, the actual values of loadlevel (Ptest/P) varied significantly in the tests, from 0.29 to1.33, as shown in Tables 3 and 4. The strategy was to try andapply, within the physical constraints, the maximum achievable(Ptest/P), but less than the unity, in each test. However, in thecase of Test MF7 the load level was accidentally applied beyondunity due to human error.
The electric kiln (Fig. 14), located beneath the slab provideda heating rate of 300 ◦C per hour up to a maximum temperatureof 1000 ◦C. The maximum temperature was maintained untilfailure of the slab. Due to the small thickness of the testedslab, a ceramic blanket 10 mm thick was placed on top ofthe slab to reduce the heat loss and allow the kiln and meshreinforcement to reach temperatures in the order of 900 ◦C.The temperature inside the kiln, at the bottom and top surfacesof the slabs, together with the temperature of reinforcement atthree locations (Fig. 12) were measured during the tests. Thesetemperature measurements were taken at the centre of the slab.The central vertical deflection was monitored using a draw wiredisplacement transducer placed on top of the slab.
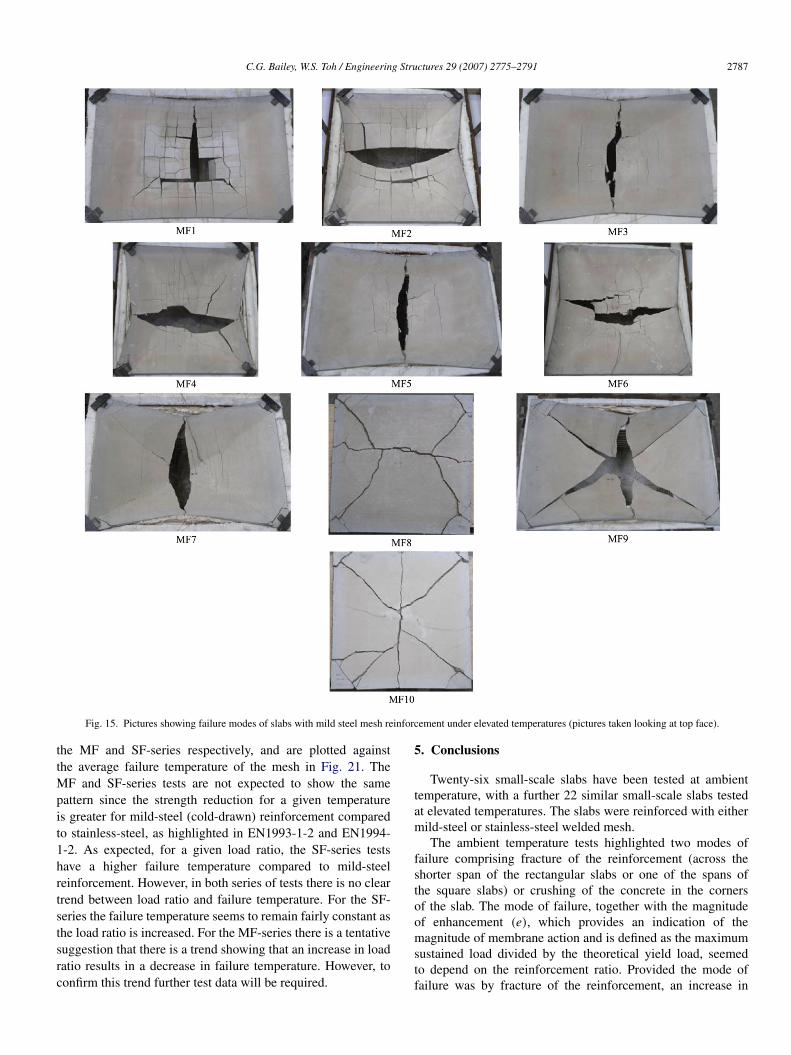
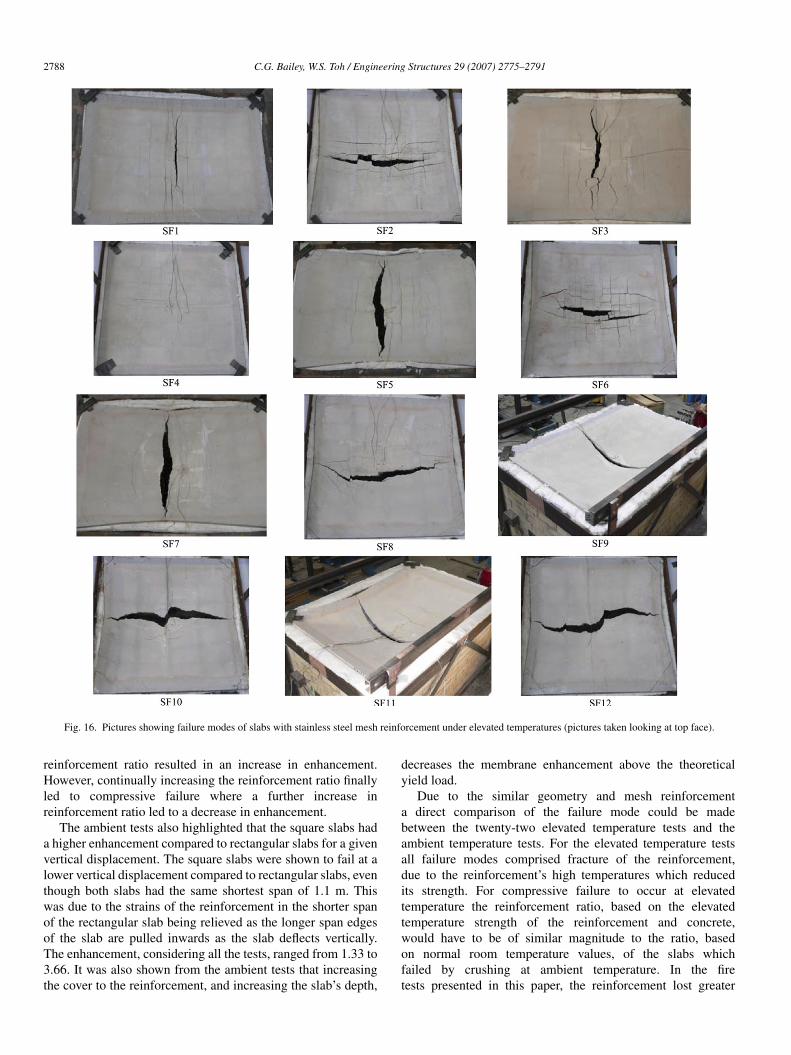
The observed failure mode for the MF and SF-series slabsis shown in Fig. 15 and Fig. 16, respectively. Failure was byfracture of the reinforcement with a full-depth crack formingacross the shorter span of the rectangular slab or across oneof the spans for the square slab. In the case of SF4, the slabdid not reach a failure point due to the difficulty in reachingreinforcement temperatures higher than 840 ◦C. Unlike thecomparable ambient tests no compressive failure occurred. This
was due to the steel reinforcement losing greater strength dueto its high temperatures compared to the concrete in the areaswhere crushing was observed in the ambient tests. The failuremode of fracture across the shorter span, or one of the spansfor the square slabs, corresponds to the failure mode assumedin the simple theoretical method [3] used for the design of floorplates.
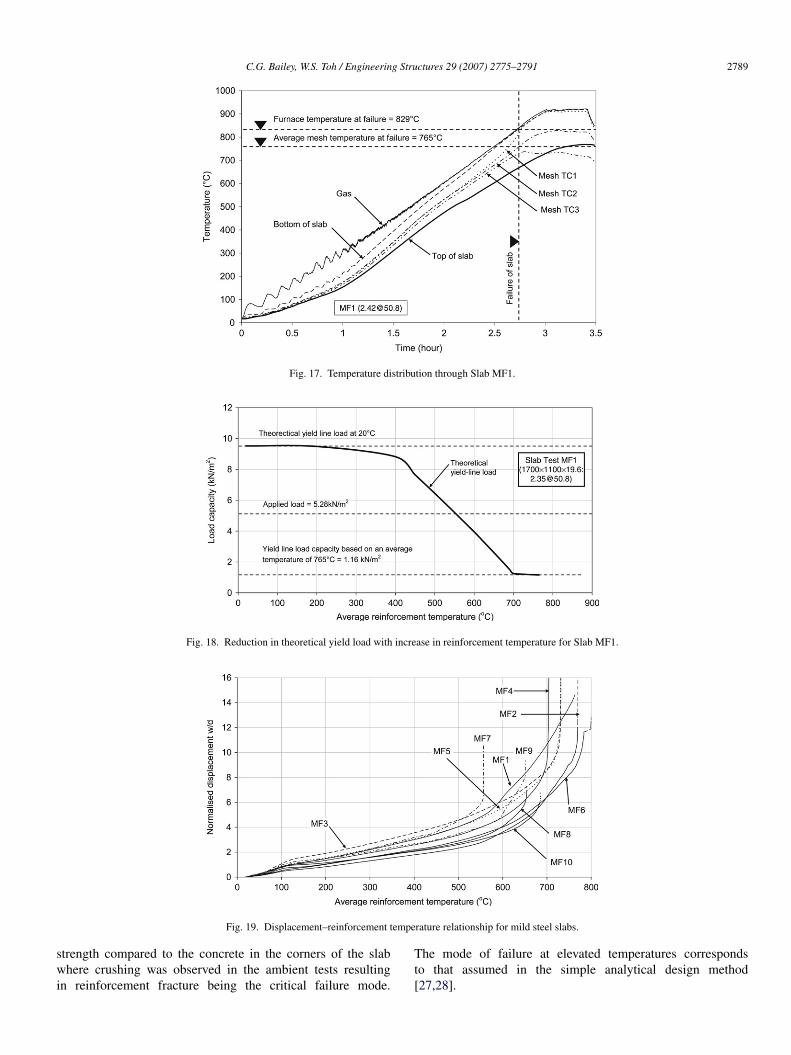
The recorded temperatures for Test MF1 are shown inFig. 17. In this case the bottom surface temperature of theslab at failure (collapse) was 840 ◦C, with the average meshreinforcement temperature being 765 ◦C and the top (cold) facebeing 672 ◦C. The temperature of the bottom surface of theslab (Tbot), the average temperature of the mesh reinforcement(Tmesh) and the temperature of the top surface of the slab (TTop),at failure, is shown in Table 3 for the MF-series and Table 4 forthe SF-series.
Based on the well-known strength reduction factors atelevated temperatures for cold-worked reinforcing steel andstainless-steel given in EN1994-1-2 [25] and EN1993-1-2 [26]respectively, together with the concrete strength reductionfactors given in EN1994-1-2, the theoretical yield-line load atany temperature distribution can be calculated. Fig. 18 showsthe reduction of the theoretical yield-line load with increasein average reinforcement temperature for Test MF1. FromFig. 18 it can be seen that beyond an average reinforcementtemperature of 550 ◦C, the theoretical yield-line load is lowerthat the applied load. At an average reinforcement temperatureof 765 ◦C, which coincides with failure of the slab, thetheoretical yield-line load is 1.16 kN/m2, which is a factorof 4.6 below the applied load. The theoretical yield-line load(PT c), at the failure temperature distribution, is shown inTable 3 for the MF-series and Table 4 for the SF-series. FromTables 3 and 4 it can be seen that the applied load is between 2.2and 7.5 times greater than the calculated yield-line load at thepoint of failure, suggesting that membrane action has occurred.
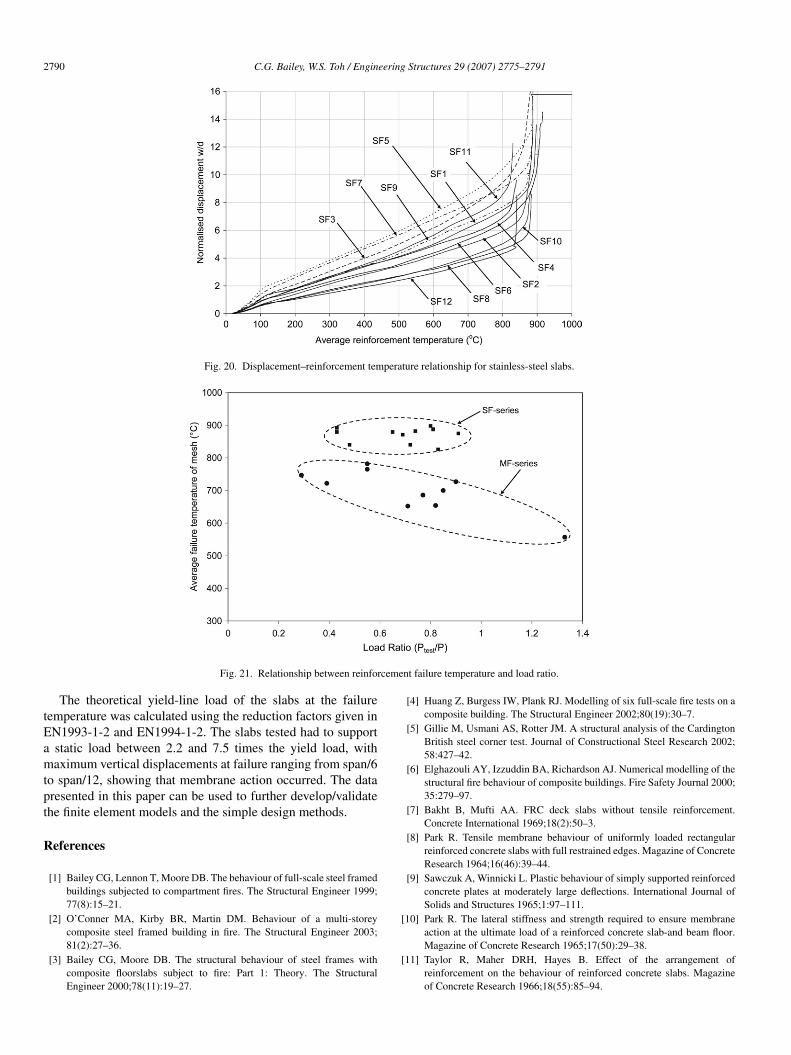
Figs. 19 and 20 show the relationship between the measuredvertical displacement and the average mesh temperature for theMF and SF-series of slabs. The measured vertical displacement(w) was initialised with respect to the displacement caused bythe applied load and then normalised with respect to the averageeffective depth (d) of the mesh reinforcement. It can be seenthat all the slabs deformed at a similar rate at the beginning ofheating and accelerated when they were approaching the failurepoint. Comparison between the MF-series shown in Fig. 19 andthe SF-series shown in Fig. 20 highlights that the stainless-steel slabs generally fail at a higher temperature. This is mainlydue to the greater strength of stainless-steel compared to mildsteel at elevated temperatures. During the tests it was generallyfound that the slabs with mild-steel mesh failed quite suddenlywhereas the slabs with stainless-steel mesh failed in a moreductile mode, due to the high ductility of the stainless-steelmesh. The maximum vertical displacements (∆fire) for all theelevated temperature tests are shown in Tables 3 and 4. Thevalues ranged from 94 mm (span/12) to 181 mm (span/6).
It is generally accepted in fire design that the failuretemperature of a member is proportional to its load ratio(Ptest/P). The load ratios are shown in Tables 3 and 4 for
C.G. Bailey, W.S. Toh / Engineering Structures 29 (2007) 2775–2791 2787
Fig. 15. Pictures showing failure modes of slabs with mild steel mesh reinforcement under elevated temperatures (pictures taken looking at top face).
the MF and SF-series respectively, and are plotted againstthe average failure temperature of the mesh in Fig. 21. TheMF and SF-series tests are not expected to show the samepattern since the strength reduction for a given temperatureis greater for mild-steel (cold-drawn) reinforcement comparedto stainless-steel, as highlighted in EN1993-1-2 and EN1994-1-2. As expected, for a given load ratio, the SF-series testshave a higher failure temperature compared to mild-steelreinforcement. However, in both series of tests there is no cleartrend between load ratio and failure temperature. For the SF-series the failure temperature seems to remain fairly constant asthe load ratio is increased. For the MF-series there is a tentativesuggestion that there is a trend showing that an increase in loadratio results in a decrease in failure temperature. However, toconfirm this trend further test data will be required.
5. Conclusions
Twenty-six small-scale slabs have been tested at ambienttemperature, with a further 22 similar small-scale slabs testedat elevated temperatures. The slabs were reinforced with eithermild-steel or stainless-steel welded mesh.
The ambient temperature tests highlighted two modes offailure comprising fracture of the reinforcement (across theshorter span of the rectangular slabs or one of the spans ofthe square slabs) or crushing of the concrete in the cornersof the slab. The mode of failure, together with the magnitudeof enhancement (e), which provides an indication of themagnitude of membrane action and is defined as the maximumsustained load divided by the theoretical yield load, seemedto depend on the reinforcement ratio. Provided the mode offailure was by fracture of the reinforcement, an increase in
2788 C.G. Bailey, W.S. Toh / Engineering Structures 29 (2007) 2775–2791
Fig. 16. Pictures showing failure modes of slabs with stainless steel mesh reinforcement under elevated temperatures (pictures taken looking at top face).
reinforcement ratio resulted in an increase in enhancement.However, continually increasing the reinforcement ratio finallyled to compressive failure where a further increase inreinforcement ratio led to a decrease in enhancement.
The ambient tests also highlighted that the square slabs hada higher enhancement compared to rectangular slabs for a givenvertical displacement. The square slabs were shown to fail at alower vertical displacement compared to rectangular slabs, eventhough both slabs had the same shortest span of 1.1 m. Thiswas due to the strains of the reinforcement in the shorter spanof the rectangular slab being relieved as the longer span edgesof the slab are pulled inwards as the slab deflects vertically.The enhancement, considering all the tests, ranged from 1.33 to3.66. It was also shown from the ambient tests that increasingthe cover to the reinforcement, and increasing the slab’s depth,
decreases the membrane enhancement above the theoreticalyield load.
Due to the similar geometry and mesh reinforcementa direct comparison of the failure mode could be madebetween the twenty-two elevated temperature tests and theambient temperature tests. For the elevated temperature testsall failure modes comprised fracture of the reinforcement,due to the reinforcement’s high temperatures which reducedits strength. For compressive failure to occur at elevatedtemperature the reinforcement ratio, based on the elevatedtemperature strength of the reinforcement and concrete,would have to be of similar magnitude to the ratio, basedon normal room temperature values, of the slabs whichfailed by crushing at ambient temperature. In the firetests presented in this paper, the reinforcement lost greater
C.G. Bailey, W.S. Toh / Engineering Structures 29 (2007) 2775–2791 2789
Fig. 17. Temperature distribution through Slab MF1.
Fig. 18. Reduction in theoretical yield load with increase in reinforcement temperature for Slab MF1.
Fig. 19. Displacement–reinforcement temperature relationship for mild steel slabs.
strength compared to the concrete in the corners of the slabwhere crushing was observed in the ambient tests resultingin reinforcement fracture being the critical failure mode.
The mode of failure at elevated temperatures correspondsto that assumed in the simple analytical design method[27,28].
2790 C.G. Bailey, W.S. Toh / Engineering Structures 29 (2007) 2775–2791
Fig. 20. Displacement–reinforcement temperature relationship for stainless-steel slabs.
Fig. 21. Relationship between reinforcement failure temperature and load ratio.
The theoretical yield-line load of the slabs at the failuretemperature was calculated using the reduction factors given inEN1993-1-2 and EN1994-1-2. The slabs tested had to supporta static load between 2.2 and 7.5 times the yield load, withmaximum vertical displacements at failure ranging from span/6to span/12, showing that membrane action occurred. The datapresented in this paper can be used to further develop/validatethe finite element models and the simple design methods.
References
[1] Bailey CG, Lennon T, Moore DB. The behaviour of full-scale steel framedbuildings subjected to compartment fires. The Structural Engineer 1999;77(8):15–21.
[2] O’Conner MA, Kirby BR, Martin DM. Behaviour of a multi-storeycomposite steel framed building in fire. The Structural Engineer 2003;81(2):27–36.
[3] Bailey CG, Moore DB. The structural behaviour of steel frames withcomposite floorslabs subject to fire: Part 1: Theory. The StructuralEngineer 2000;78(11):19–27.
[4] Huang Z, Burgess IW, Plank RJ. Modelling of six full-scale fire tests on acomposite building. The Structural Engineer 2002;80(19):30–7.
[5] Gillie M, Usmani AS, Rotter JM. A structural analysis of the CardingtonBritish steel corner test. Journal of Constructional Steel Research 2002;58:427–42.
[6] Elghazouli AY, Izzuddin BA, Richardson AJ. Numerical modelling of thestructural fire behaviour of composite buildings. Fire Safety Journal 2000;35:279–97.
[7] Bakht B, Mufti AA. FRC deck slabs without tensile reinforcement.Concrete International 1969;18(2):50–3.
[8] Park R. Tensile membrane behaviour of uniformly loaded rectangularreinforced concrete slabs with full restrained edges. Magazine of ConcreteResearch 1964;16(46):39–44.
[9] Sawczuk A, Winnicki L. Plastic behaviour of simply supported reinforcedconcrete plates at moderately large deflections. International Journal ofSolids and Structures 1965;1:97–111.
[10] Park R. The lateral stiffness and strength required to ensure membraneaction at the ultimate load of a reinforced concrete slab-and beam floor.Magazine of Concrete Research 1965;17(50):29–38.
[11] Taylor R, Maher DRH, Hayes B. Effect of the arrangement ofreinforcement on the behaviour of reinforced concrete slabs. Magazineof Concrete Research 1966;18(55):85–94.
C.G. Bailey, W.S. Toh / Engineering Structures 29 (2007) 2775–2791 2791
[12] Hayes B, Taylor R. Load-testing RC slabs. The Consulting Engineer 1969;46–7.
[13] Wood RH. Plastic and elastic design of slabs and plates, with particularreference to reinforced concrete floor slabs. London: Thames and Hudson;1961.
[14] Hayes B. Allowing for membrane action in the plastic analysis ofrectangular reinforced concrete slabs. Magazine of Concrete Research1968;20(65):205–12.
[15] Taylor R. A note on a possible basis for a new method of ultimate loaddesign of reinforced concrete slabs. Magazine of Concrete Research 1965;17(53):183–6.
[16] Kemp KO. Yield of a square reinforced concrete slab on simple supportsallowing for membrane forces. The Structural Engineer 1967;45(7):235–40.
[17] Izzuddin BA, Elghazouli M. Failure of lightly reinforced concretemembers under fire. I: Analytical modeling. Journal of StructuralEngineering 2004;130:3–18.
[18] Cameron NJK, Usmani AS. New design method to determine themembrane capacity of laterally restrained composite floor slabs infire. Part 1: Theory and method. The Structural Engineer 2005;83(19):28–33.
[19] Bailey CG. Membrane action of unrestrained lightly reinforcedconcrete slabs at large displacements. Engineering Structures 2001;23:470–83.
[20] Bailey CG. Efficient arrangement of reinforcement for membrane
behaviour of composite floor slabs in fire conditions. Journal ofConstructional Steel Research 2003;59(7):931–49.
[21] Bailey CG. Membrane action of slab/beam composite floor systems infire. Engineering Structures 2004;26:1691–703.
[22] Bailey CG, White DS, Moore DB. The tensile membrane action ofunrestrained composite slabs simulated under fire conditions. EngineeringStructures 2000;22(12):1583–95.
[23] Foster SJ, Bailey CG, Burgess IW, Plank RJ. Experimental behaviour ofconcrete floor slabs at large displacements. Engineering Structures 2004;26:1231–47.
[24] Foster SJ, Burgess IW, Plank RJ. Experimental behaviour of model-scaleconcrete floor slabs at large displacement and high temperatures. In: Proc.second international conference on steel and composite structures. 2004.p. 1268–82.
[25] BSEN1993-1-2: Eurocode 3. Design of steel structures Part 1.2. Generalrules. Structural fire design. London: British Standards Institution; 2005.
[26] BSEN1994-1-2 Eurocode 4. Design of composite steel and concretestructures. Part 1.2. General rules. Structural fire design. London: BritishStandards Institution; 2006.
[27] Bailey CG. Steel structures supporting composite floor slabs: Design forfire. BRE Digest 462. Watford: The Building Research Establishment;2001.
[28] Newman GM, Robinson JT, Bailey CG. Fire safe design: A newapproach to multi-storey steel-framed buildings. 2nd ed. Ascot: The SteelConstruction Institute; 2006. SCI Publication P288.